Livestock’s Long Shadow - globalmethane.org · Livestock’s Long Shadow Environmental Issues and...
28
Livestock’s Long Shadow Environmental Issues and Options Henning Steinfeld Pierre Gerber Tom Wassenaar Vincent Castel Mauricio Rosales Cees de Haan Pierre Gerber Methane to Markets Partnership Expo Beijing - 30 October 2007
Transcript of Livestock’s Long Shadow - globalmethane.org · Livestock’s Long Shadow Environmental Issues and...
Livestock’s Long Shadow Environmental Issues and Options
Henning SteinfeldPierre GerberTom WassenaarVincent Castel Mauricio RosalesCees de Haan
Pierre GerberMethane to Markets Partnership ExpoBeijing - 30 October 2007
Drivers of the Livestock Sector
• Demand Drivers– Population growth: + 50 % by 2050 globally; slowing down in
East Asia, still strong elsewhere in developing countries– Income growth: strong in E and S Asia, NENA and SS Africa
picking up– Urbanization: more than 80 % of population growth occurs in
cities of developing countries
• Supply Drivers– Cheap grain: decreasing prices over the past four decades– Technological change: genetics, feeding, transport– Cheap energy: substantial externalities– Policy environment: incentive frameworks, market and credit
regulation, sanitary standards, labour and environmental policies
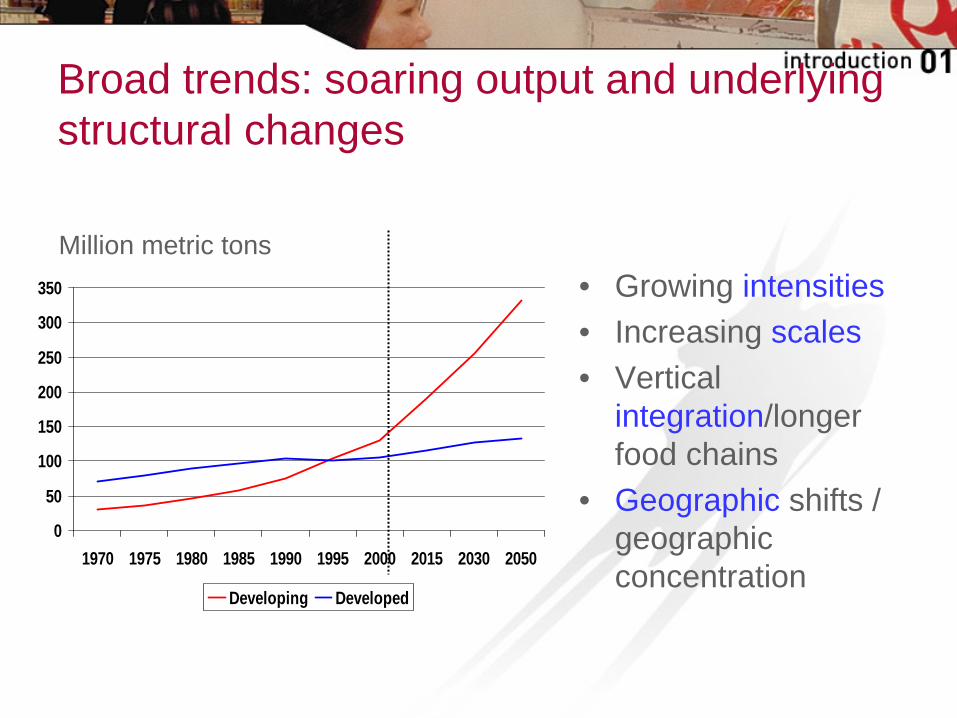
Broad trends: soaring output and underlying structural changes
0
50
100
150
200
250
300
350
1970 1975 1980 1985 1990 1995 2000 2015 2030 2050
Developing Developed
Million metric tons
• Growing intensities
• Increasing scales
• Vertical integration/longer food chains
• Geographic shifts / geographic concentration
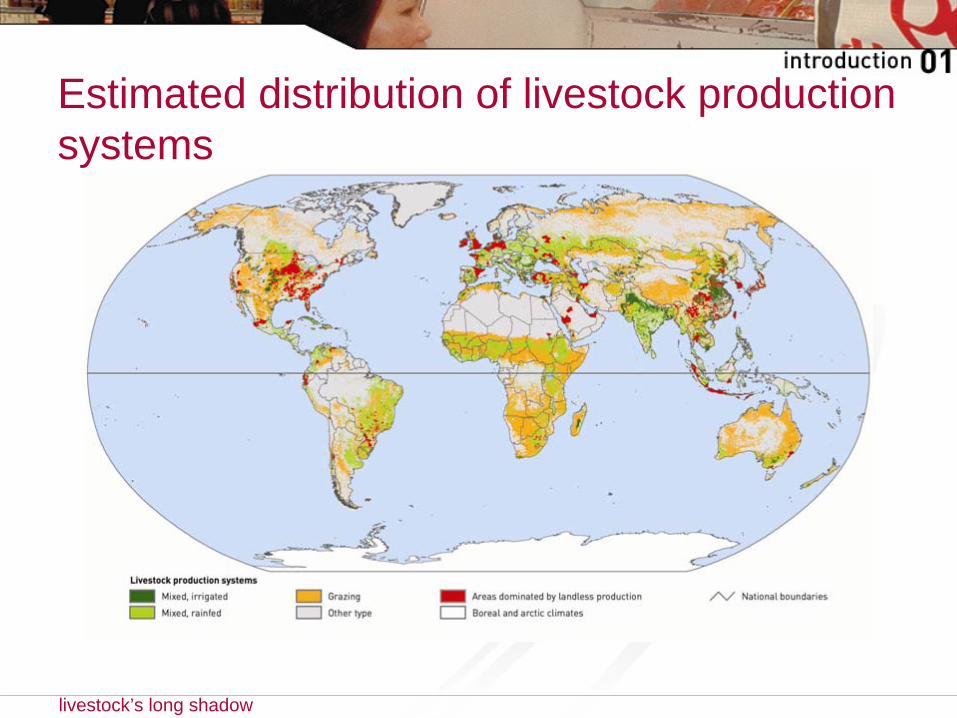
Estimated distribution of livestock production systems
livestock’s long shadow
Quantification of environmental impacts: approach
• Global issues:– land use– climate change– water resources– biodiversity
• Analysis of impacts using a food chain approach (from feed production to product)
• Identification of technical and policy mitigation options
livestock’s long shadow
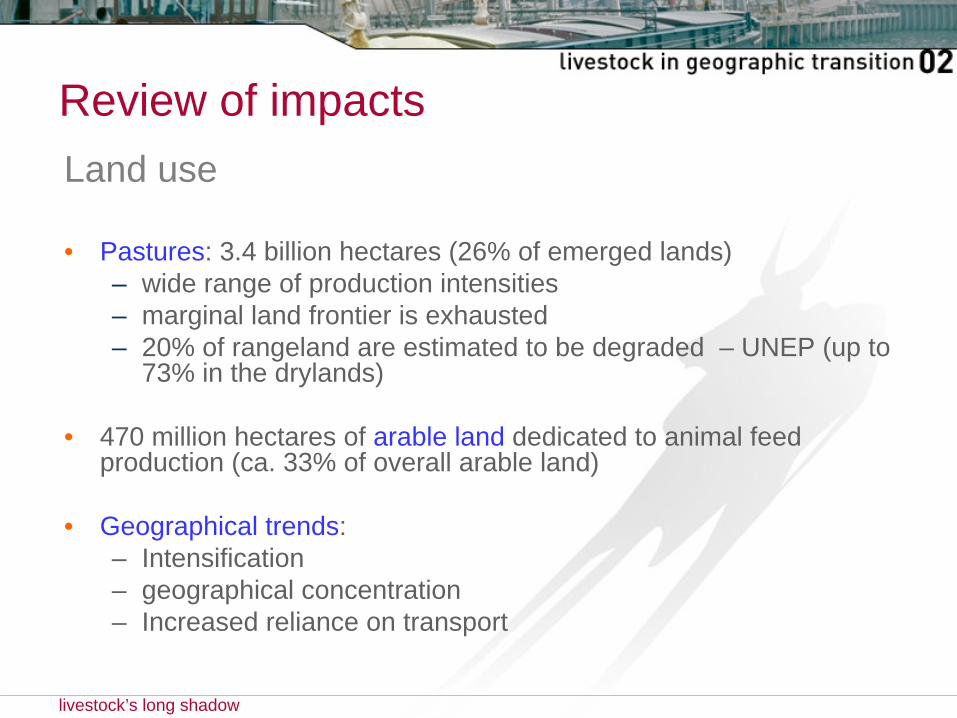
Review of impacts
Land use
• Pastures: 3.4 billion hectares (26% of emerged lands)– wide range of production intensities – marginal land frontier is exhausted – 20% of rangeland are estimated to be degraded – UNEP (up to
73% in the drylands)
• 470 million hectares of arable land dedicated to animal feed production (ca. 33% of overall arable land)
• Geographical trends:– Intensification– geographical concentration– Increased reliance on transport
livestock’s long shadow
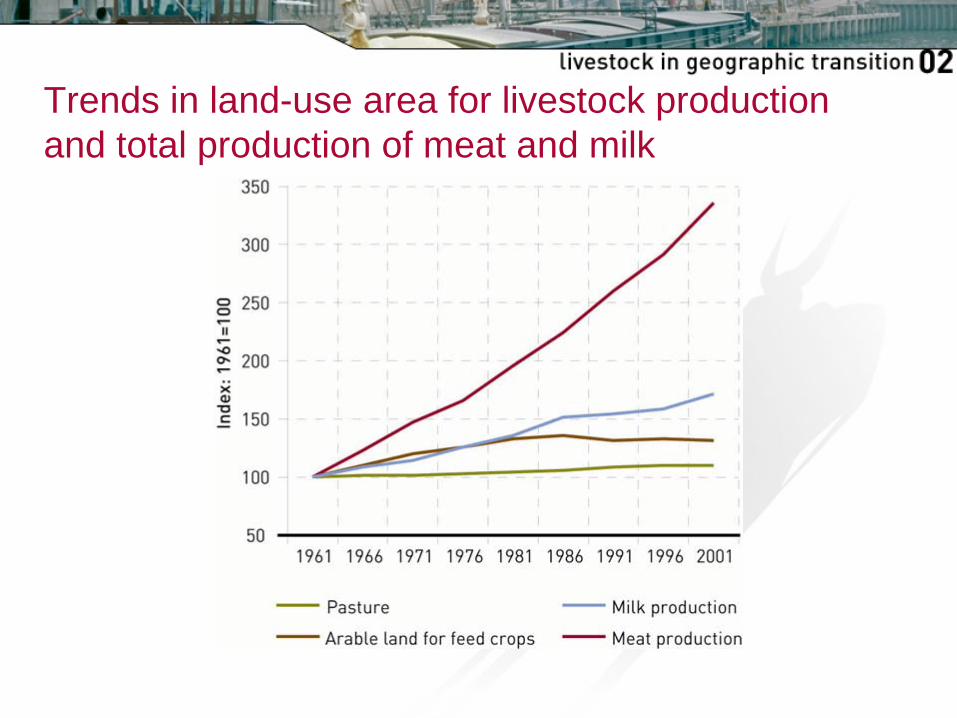
Trends in land-use area for livestock production and total production of meat and milk
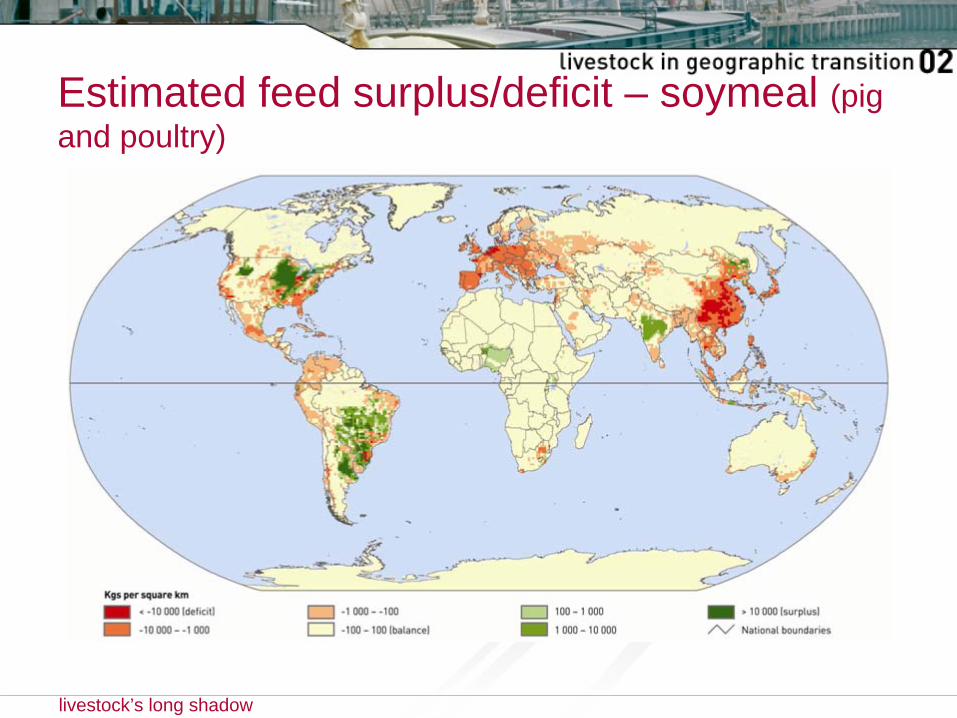
Estimated feed surplus/deficit – soymeal (pig and poultry)
livestock’s long shadow
Review of impacts
Green House Gas Emissions
• How large is the livestock sector’s contribution?
• What are the options to mitigate GHG emissions?
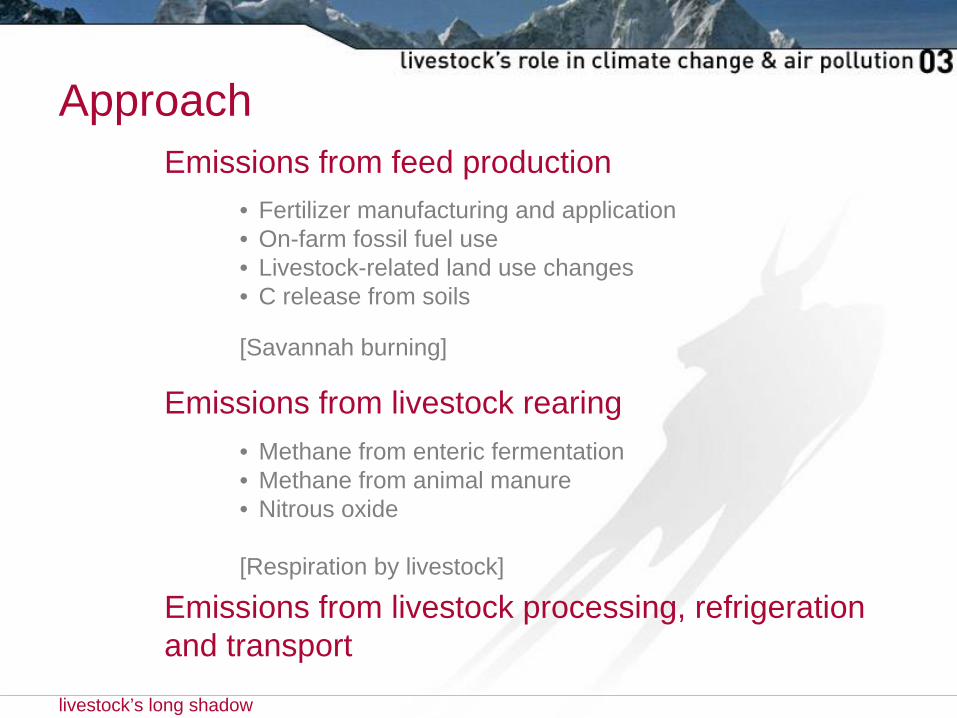
Emissions from feed production
• Fertilizer manufacturing and application• On-farm fossil fuel use• Livestock-related land use changes• C release from soils
[Savannah burning]
Emissions from livestock rearing
• Methane from enteric fermentation• Methane from animal manure• Nitrous oxide
[Respiration by livestock]
Emissions from livestock processing, refrigeration and transport
livestock’s long shadow
Approach
livestock’s long shadow
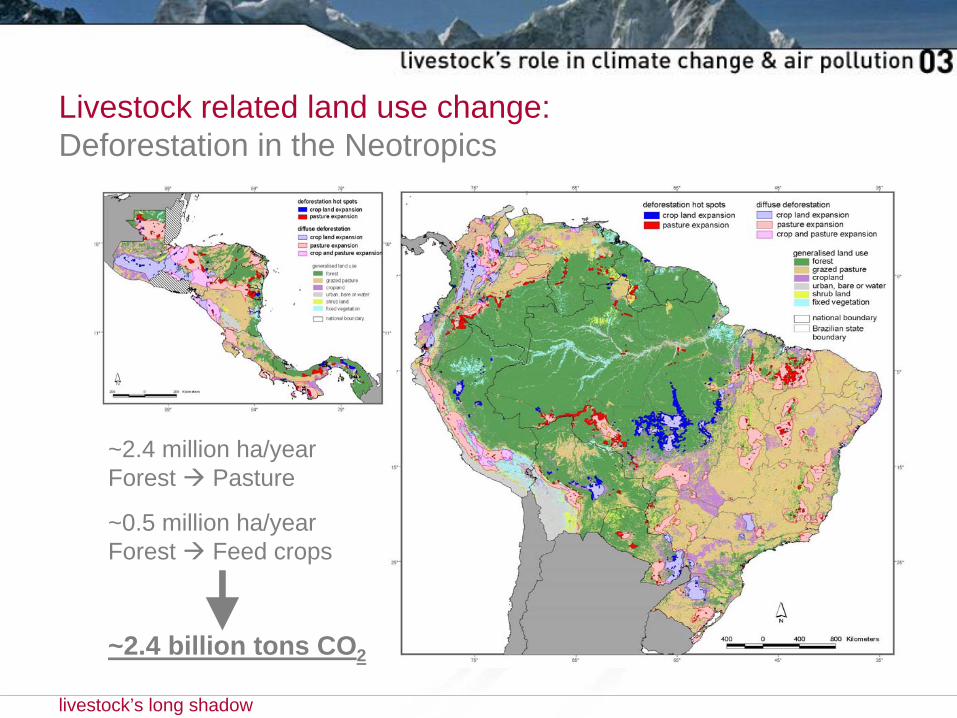
Livestock related land use change: Deforestation in the Neotropics
~2.4 million ha/yearForest Pasture
~0.5 million ha/yearForest Feed crops
~2.4 billion tons CO2
Carbon release from soils
• Conventional tillage of land for intensive feed cropping ~18 million tons CO2
• Soil liming in tropical areas ~10 million tons CO2
• Pasture desertification in drylands ~100 million tons CO2
CO2 emissions from processing and refrigerated transport
• Emissions from processing are in the order of several tens of million tons CO2
• Emissions from meat transport estimated at 0.8 – 1 million ton CO2
Resulting Overall Contribution
About 2.7 billion tons CO2 : 9% of total anthropogenic CO2 emissions
livestock’s long shadow
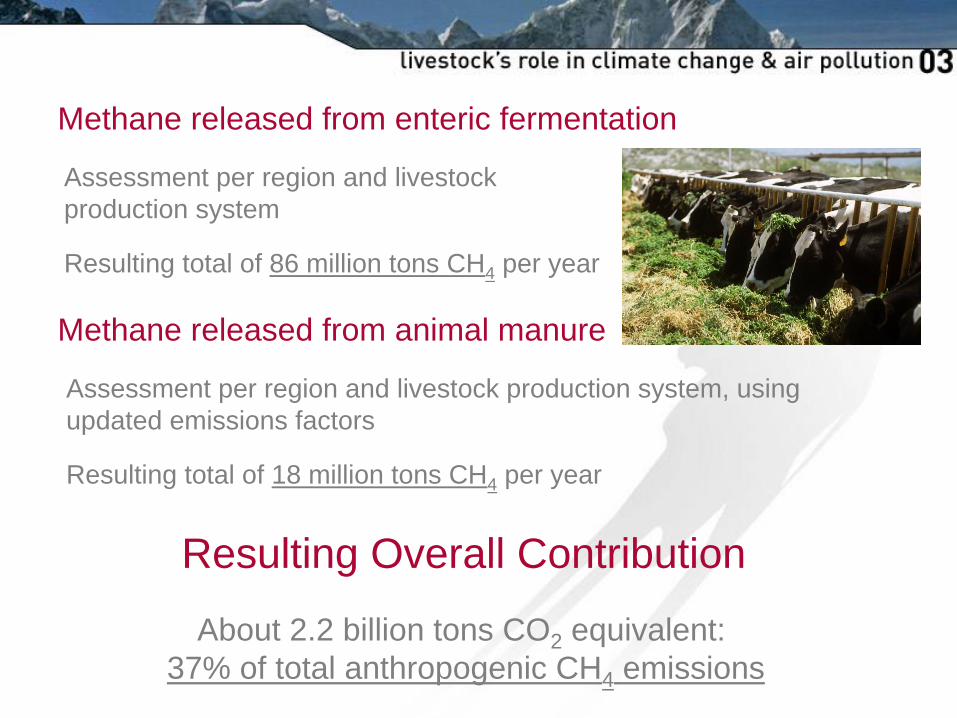
Methane released from enteric fermentation
Assessment per region and livestock production system
Resulting total of 86 million tons CH4 per year
Methane released from animal manure
Assessment per region and livestock production system, using updated emissions factors
Resulting total of 18 million tons CH4 per year
Resulting Overall Contribution
About 2.2 billion tons CO2 equivalent: 37% of total anthropogenic CH4 emissions
livestock’s long shadow
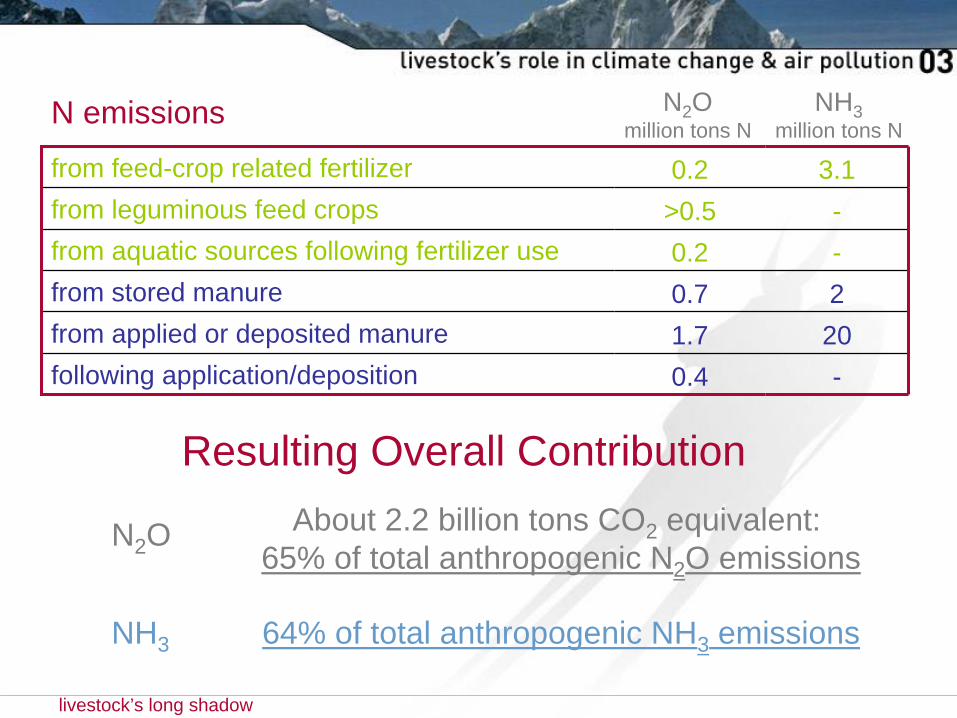
from feed-crop related fertilizer
from leguminous feed crops
from aquatic sources following fertilizer use
from stored manure
from applied or deposited manure
following application/deposition
N emissions N2 Omillion tons N
NH3million tons N
Resulting Overall Contribution
About 2.2 billion tons CO2 equivalent: 65% of total anthropogenic N2 O emissions
64% of total anthropogenic NH3 emissions
N2 O
NH3
0.2 3.1
>0.5 -
0.2 -
0.7 2
1.7 20
0.4 -
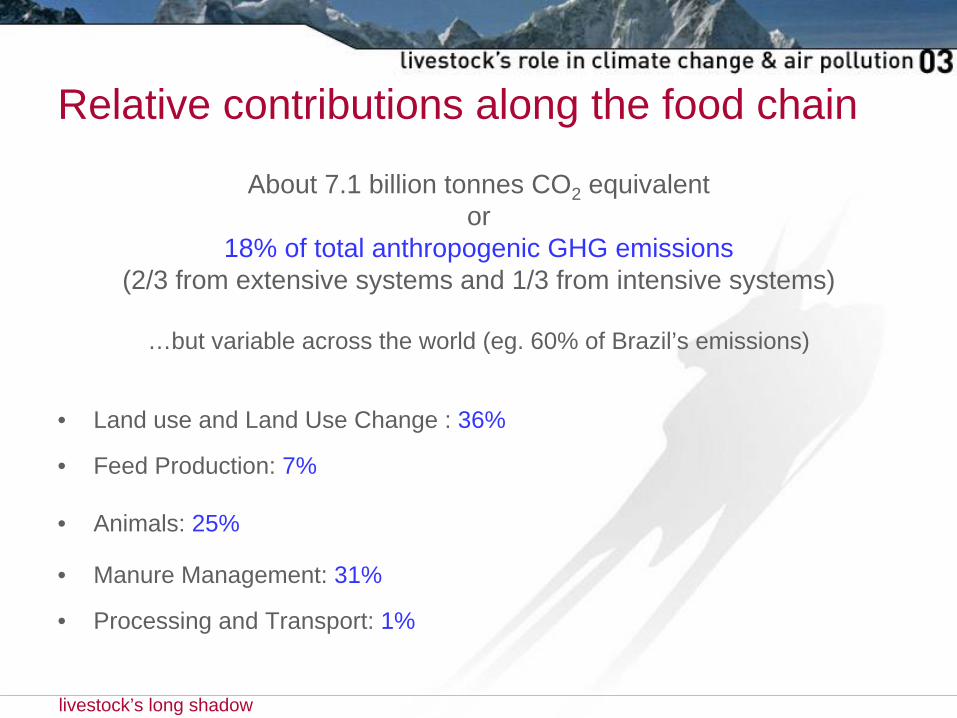
Relative contributions along the food chain
About 7.1 billion tonnes CO2 equivalentor
18% of total anthropogenic GHG emissions(2/3 from extensive systems and 1/3 from intensive systems)
…but variable across the world (eg. 60% of Brazil’s emissions)
• Land use and Land Use Change : 36%
• Feed Production: 7%
• Animals: 25%
• Manure Management: 31%
• Processing and Transport: 1%
livestock’s long shadow
livestock’s long shadow
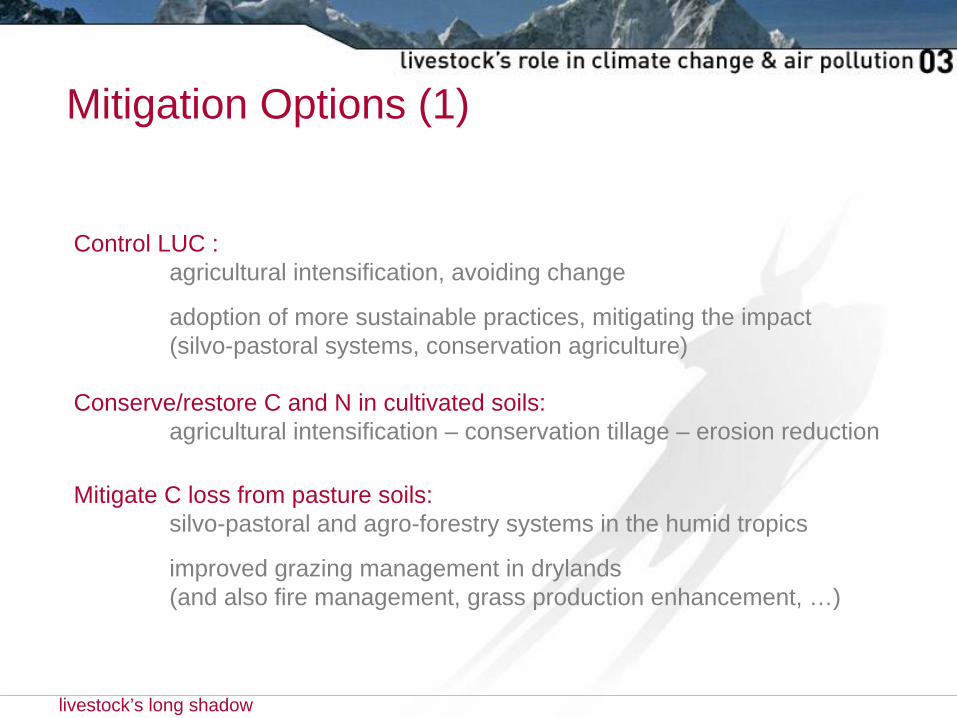
Mitigation Options (1)
Control LUC :agricultural intensification, avoiding change
adoption of more sustainable practices, mitigating the impact(silvo-pastoral systems, conservation agriculture)
Conserve/restore C and N in cultivated soils:agricultural intensification – conservation tillage – erosion reduction
Mitigate C loss from pasture soils:silvo-pastoral and agro-forestry systems in the humid tropics
improved grazing management in drylands(and also fire management, grass production enhancement, …)
livestock’s long shadow
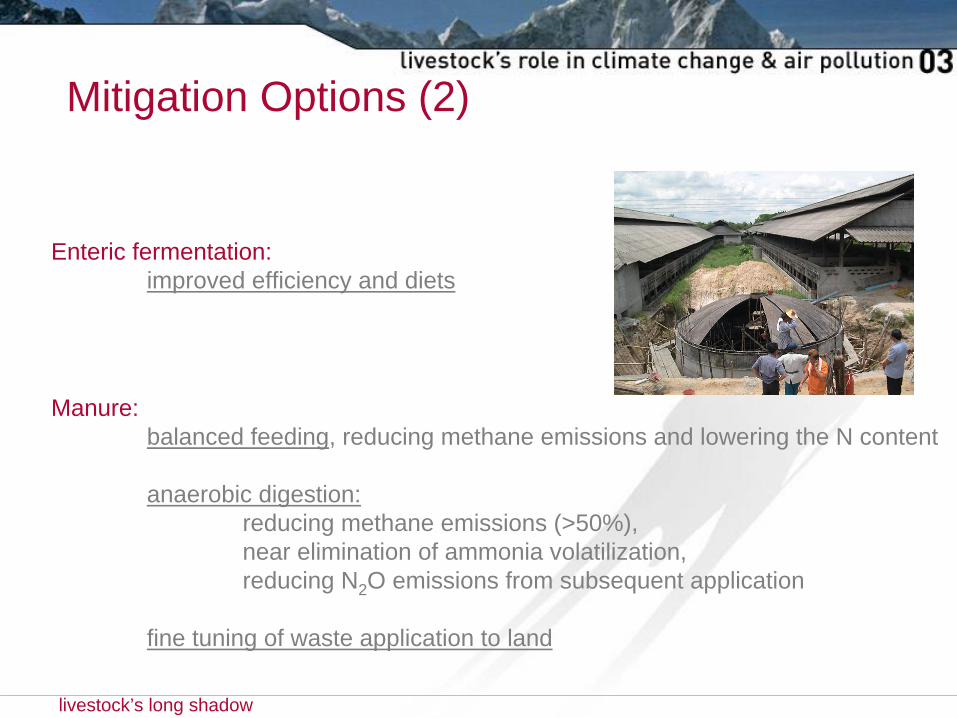
Mitigation Options (2)
Enteric fermentation:improved efficiency and diets
Manure:balanced feeding, reducing methane emissions and lowering the N content
anaerobic digestion:reducing methane emissions (>50%),near elimination of ammonia volatilization,reducing N2 O emissions from subsequent application
fine tuning of waste application to land
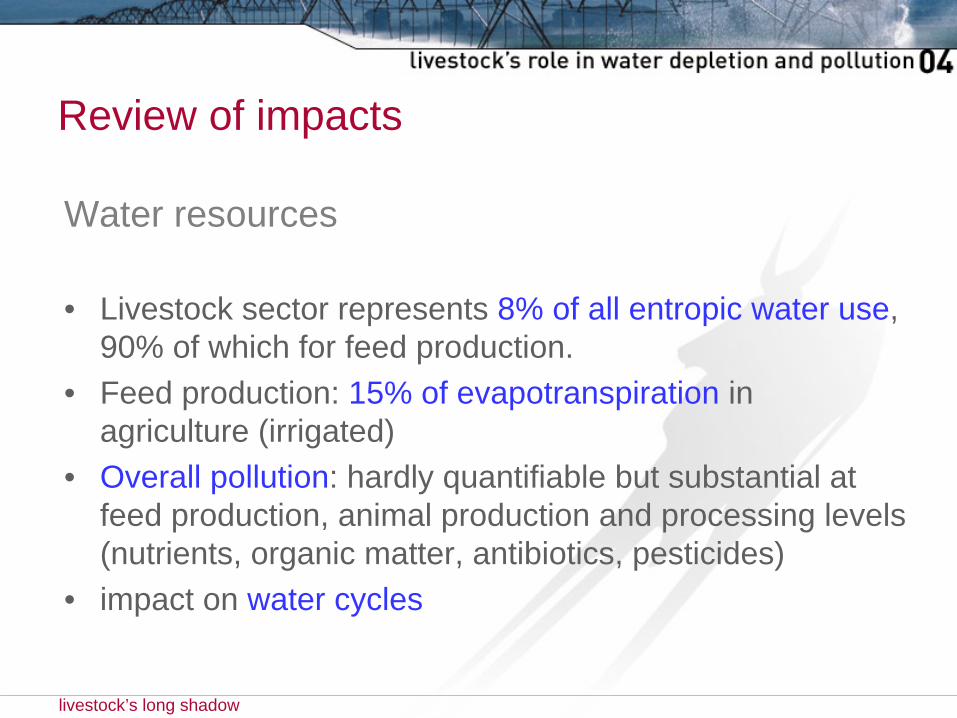
Review of impacts
Water resources
• Livestock sector represents 8% of all entropic water use, 90% of which for feed production.
• Feed production: 15% of evapotranspiration in agriculture (irrigated)
• Overall pollution: hardly quantifiable but substantial at feed production, animal production and processing levels (nutrients, organic matter, antibiotics, pesticides)
• impact on water cycles
livestock’s long shadow
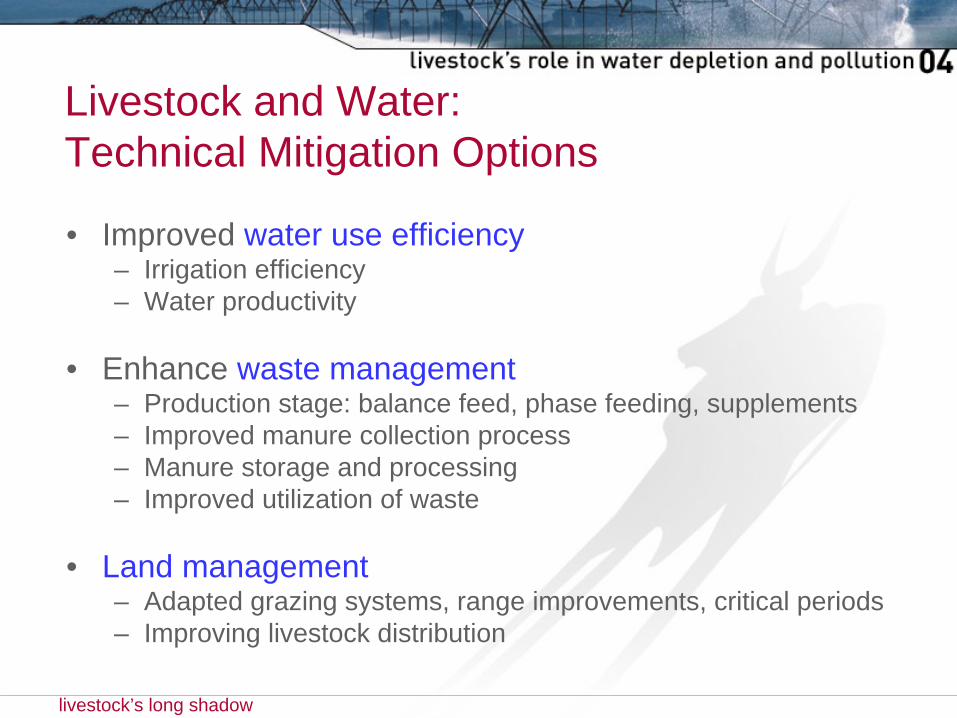
Livestock and Water: Technical Mitigation Options
livestock’s long shadow
• Improved water use efficiency– Irrigation efficiency – Water productivity
• Enhance waste management– Production stage: balance feed, phase feeding, supplements– Improved manure collection process– Manure storage and processing– Improved utilization of waste
• Land management– Adapted grazing systems, range improvements, critical periods– Improving livestock distribution
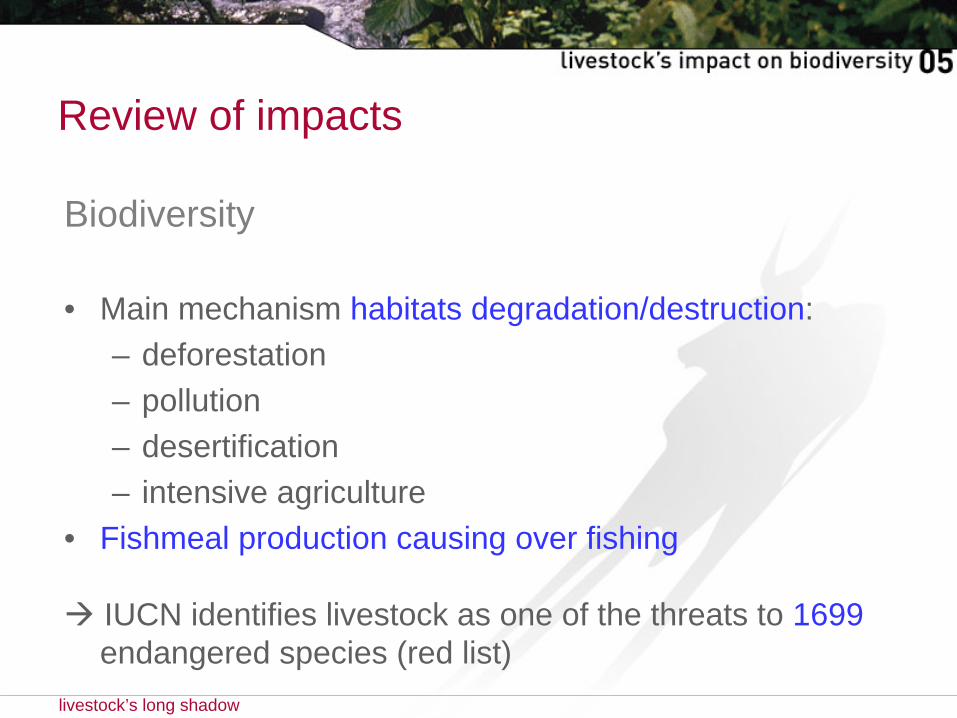
Review of impacts
Biodiversity
• Main mechanism habitats degradation/destruction:
– deforestation
– pollution
– desertification
– intensive agriculture
• Fishmeal production causing over fishing
IUCN identifies livestock as one of the threats to 1699endangered species (red list)
livestock’s long shadow
livestock’s long shadow
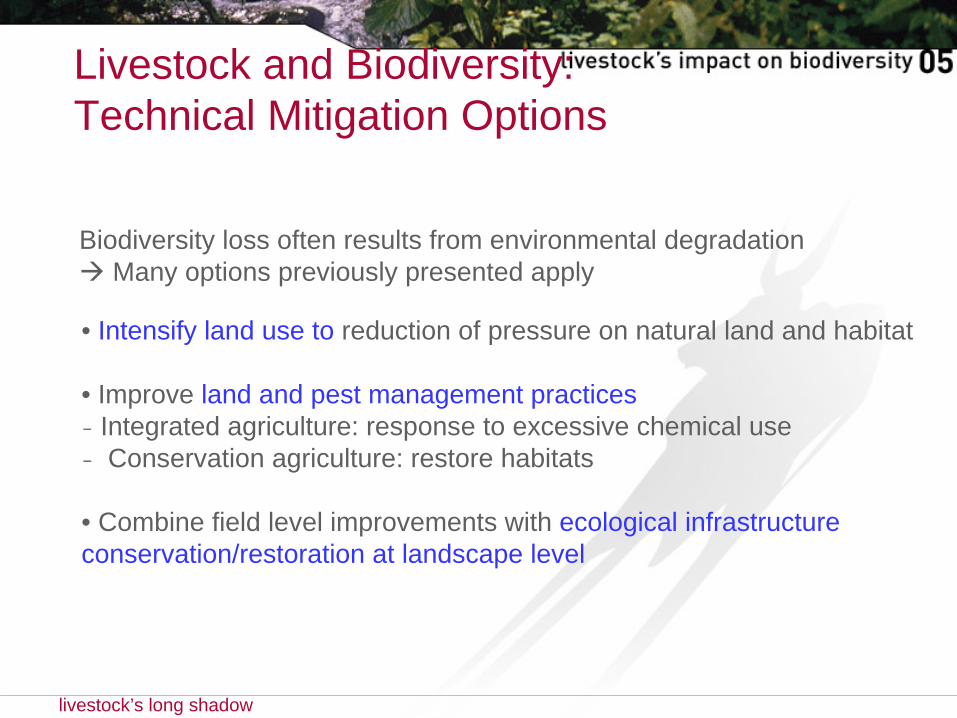
Livestock and Biodiversity: Technical Mitigation Options
Biodiversity loss often results from environmental degradationMany options previously presented apply
• Intensify land use to reduction of pressure on natural land and habitat
• Improve land and pest management practices- Integrated agriculture: response to excessive chemical use- Conservation agriculture: restore habitats
• Combine field level improvements with ecological infrastructure conservation/restoration at landscape level
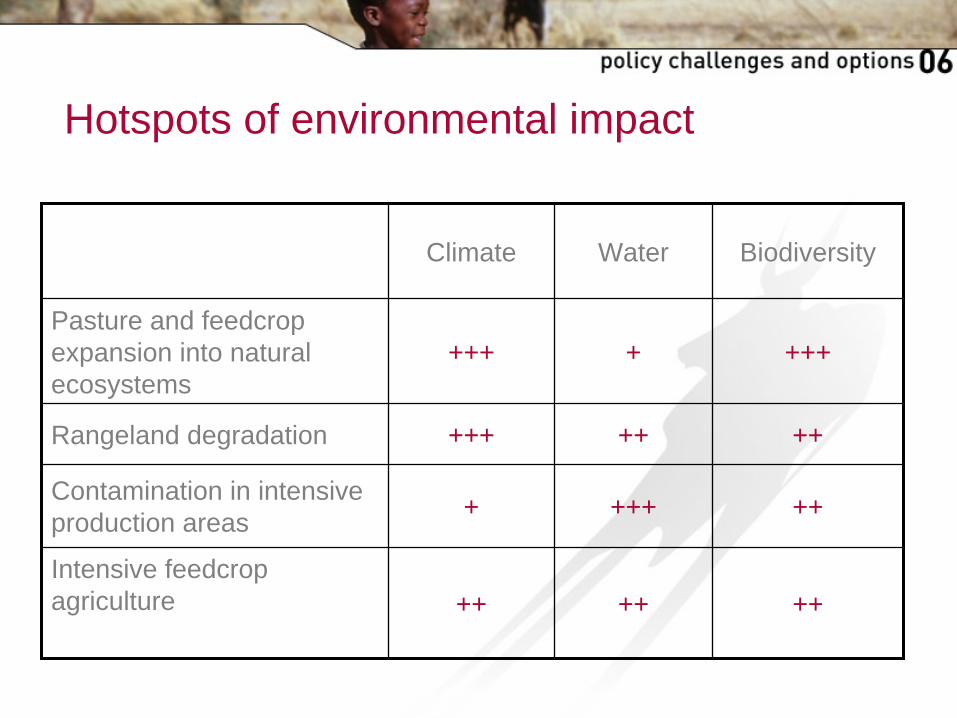
Hotspots of environmental impact
Climate Water Biodiversity
Pasture and feedcrop expansion into natural ecosystems
+++ + +++
Rangeland degradation +++ ++ ++
Contamination in intensive production areas
+ +++ ++
Intensive feedcrop agriculture ++ ++ ++
Underlying causes (i)
• Neglect of externalities
– negative externalities, e.g. water and soil pollution, climate change, biodiversity losses, etc.
– positive externalities, e.g. carbon sequestration, ecosystem diversitybiodiversity gains
• Inadequate pricing
– At input level, e.g. land water
– At output level, e.g. subsidies
Underlying causes (ii)
• Livestock production concentrates
– The clustering of livestock close to feed outlets, consumption centres leads to nutrient overloads
– Disruption of nutrient cycling
• Mismanaged grazing
– lack of stewardship in marginal and remote areas
• The multiple objectives pursued with livestock
• Get prices right: Inefficiencies in resource use, often increasing use and leads to misallocation of resources among competing uses (within and outside agriculture)
• Apply “Polluter pays, provider gets” principlesPayment for environmental services could be a major tools to shift
to “ service-oriented” grazing (making carbon sequestration, water and biodiversity protection a major purpose of extensive systems)
Principles for policy intervention (i)
Principles for policy intervention (ii)
• Seek livestock/ecosystem balances: Bring livestock in balance with surrounding land. The need for intensification of production (without concentration)
• Develop institutions for environmental stewardship
• The importance of liability
• The need to educate and inform
The social and health dimensions
Environmental policies should be designed and implemented in the context of social and health objectives:
• 1.3 billion people depend (partially or entirely) on livestock for their livelihoods
• The cultural dimension of livestock
• Livestock provide protein and micro-nutrients to many of the 830 million food insecure people
• Livestock contributes to health problems of the affluent (obesity, cancers, cardio-vascular diseases
Livestock’s Long Shadow
Henning SteinfeldPierre GerberTom WassenaarVincent Castel Mauricio RosalesCees de Haan
Download from: www.virtualcentre.org
Order a hard copy from FAO’s Animal Production and Health Division website