Liver Biopsy - Indications Procedures Results
300
LIVER BIOPSY - INDICATIONS, PROCEDURES, RESULTS Edited by Nobumi Tagaya
-
Upload
indera-vyas -
Category
Documents
-
view
117 -
download
2
description
stu
Transcript of Liver Biopsy - Indications Procedures Results

LIVER BIOPSY -INDICATIONS,
PROCEDURES, RESULTS
Edited by Nobumi Tagaya

Liver Biopsy - Indications, Procedures, Resultshttp://dx.doi.org/10.5772/46113Edited by Nobumi Tagaya
ContributorsFirpi, Alpna Limaye, Lisa Dixon, Ludmila Viksna, Ilze Strumfa, Janis Vilmanis, Andrejs Vanags, Zane Simtniece, DzeinaSulte, Arnis Abolins, Janis Gardovskis, Ervins Vasko, Javier Crespo, Joaquín Cabezas, Marta Mayorga, HiroyasuMorikawa, Jean-François Cadranel, Jean-Baptiste Nousbaum, Ivan Tokin, Anna Mania, Pawel Kemnitz, MagdalenaFiglerowicz, Wojciech Sluzewski, Aldona Woźniak, Nobumi Tagaya, Nana Makino, Masatoshi Oya, YoshitakeSugamata, Claudia Randazzo, Anna Licata, Piero Luigi Almasio, Teresa Casanovas, Costin Teodor Teodor Streba, LetitiaAdela Maria Streba, Daniela Dumitrescu, Eugen Florin Georgescu, Monica Lupsor, Horia Stefanescu, Diana Feier, RaduIon Badea
Published by InTechJaneza Trdine 9, 51000 Rijeka, Croatia
Copyright © 2012 InTechAll chapters are Open Access distributed under the Creative Commons Attribution 3.0 license, which allows users todownload, copy and build upon published articles even for commercial purposes, as long as the author and publisherare properly credited, which ensures maximum dissemination and a wider impact of our publications. After this workhas been published by InTech, authors have the right to republish it, in whole or part, in any publication of which theyare the author, and to make other personal use of the work. Any republication, referencing or personal use of thework must explicitly identify the original source.
NoticeStatements and opinions expressed in the chapters are these of the individual contributors and not necessarily thoseof the editors or publisher. No responsibility is accepted for the accuracy of information contained in the publishedchapters. The publisher assumes no responsibility for any damage or injury to persons or property arising out of theuse of any materials, instructions, methods or ideas contained in the book.
Publishing Process Manager Viktorija ZgelaTechnical Editor InTech DTP teamCover InTech Design team
First published November, 2012Printed in Croatia
A free online edition of this book is available at www.intechopen.comAdditional hard copies can be obtained from [email protected]
Liver Biopsy - Indications, Procedures, Results, Edited by Nobumi Tagayap. cm.ISBN 978-953-51-0853-5

free online editions of InTechBooks and Journals can be found atwww.intechopen.com


Contents
Preface VII
Section 1 An Overview and Future Aspects of Liver Biopsy 1
Chapter 1 Liver Biopsy - Indications, Procedures, Results 3Claudia Randazzo, Anna Licata and Piero Luigi Almasio
Chapter 2 Types of Liver Biopsy 23Nobumi Tagaya, Nana Makino, Kazuyuki Saito, Takashi Okuyama,Yoshitake Sugamata and Masatoshi Oya
Chapter 3 Rethinking the Role of Liver Biopsy in the Eraof Personalized Medicine 33Teresa Casanovas Taltavull
Section 2 Clinical Practice of Liver Biopsy 73
Chapter 4 Safety and Reliability Percutaneous Liver Biopsy Procedure inChildren with Chronic Liver Diseases 75Anna Mania, Paweł Kemnitz, Magdalena Figlerowicz, AldonaWoźniak and Wojciech Służewski
Chapter 5 Risks and Benefits of Liver Biopsy in Focal Liver Disease 85Letiția Adela Maria Streba, Eugen Florin Georgescu and CostinTeodor Streba
Chapter 6 Current Trends in Liver Biopsy Indications forChronic Liver Diseases 103Jean-François Cadranel and Jean-Baptiste Nousbaum

Chapter 7 Primary and Metastatic Tumours of the Liver: Expanding Scopeof Morphological and Immunohistochemical Detailsin the Biopsy 115Ilze Strumfa, Janis Vilmanis, Andrejs Vanags, Ervins Vasko, DzeinaSulte, Zane Simtniece, Arnis Abolins and Janis Gardovskis
Chapter 8 Nonalcoholic Fatty Liver Disease: A Pathological View 161Joaquín Cabezas, Marta Mayorga and Javier Crespo
Chapter 9 Liver Biopsy After Liver Transplantation 189Alpna R. Limaye, Lisa R. Dixon and Roberto J. Firpi
Section 3 Non-Invasive Alternatives of Liver Biopsy 207
Chapter 10 Non-Invasive Evaluation of Liver Steatosis, Fibrosis andCirrhosis in Hepatitis C Virus Infected Patients UsingUnidimensional Transient Elastography (Fibroscan®) 209Monica Lupsor, Horia Stefanescu, Diana Feier and Radu Badea
Chapter 11 Computer Image Analysis of Liver Biopsy Specimens in Patientswith Heroin Abuse andCoinfection (Tuberculosis, HCV, HIV) 235Ivan B. Tokin, Ivan I. Tokin and Galina F. Filimonova
Chapter 12 Future Aspects of Liver Biopsy: From Reality to MathematicalBasis of Virtual Microscopy 257Ludmila Viksna, Ilze Strumfa, Boriss Strumfs, Valda Zalcmane,Andrejs Ivanovs and Valentina Sondore
Chapter 13 Real-Time Tissue Elastography and Transient Elastography forEvaluation of Hepatic Fibrosis 281Hiroyasu Morikawa
ContentsVI

Preface
Liver biopsy is a procedure that involves obtaining a small piece of liver tissue, which isthen analyzed in the laboratory. Liver biopsy may be used to evaluate a mass seen onultrasound, CT or MRI images, diagnose unexplained liver diseases or abnormal liverfunction tests, determine the severity of the liver diseases including non-alcoholic liverdisease, certain liver disease such as chronic hepatitis B or C, primary biliary cirrhosis,primary sclerosing cholangitis, autoimmune hepatitis, hemochromatosis or Wilson’sdisease, and monitor the liver after a liver transplantation. Liver biopsy is a safe procedurewhen performed by an experienced doctor. However, it is an invasive procedure, and thecommon problems include mild pain and a decrease in blood pressure. Although moreserious complications such as bleeding, infection, and injury of nearby organs are rare butpotentially lethal, the monitoring within 24 hours after the liver biopsy is important. Thisbook describes the role, indication, contraindication, technique and evaluation of outcome ofliver biopsy. I believe that it will be greatly useful to the readers. Furthermore, this bookintroduces transgastric liver biopsy using NOTES technique and non-invasive alternativesincluding elastography and computer analysis of liver fibrosis as new tools for theevaluation of liver diseases.
Nobumi Tagaya, M.D., Ph.D.Department of Surgery,
Dokkyo Medical University Koshigaya Hospital,Koshigaya, Saitama,
Japan


Section 1
An Overview and Future Aspects of Liver Biopsy


Chapter 1
Liver Biopsy -Indications, Procedures, Results
Claudia Randazzo, Anna Licata andPiero Luigi Almasio
Additional information is available at the end of the chapter
http://dx.doi.org/10.5772/52616
1. Introduction
Liver biopsy (LB) is the most common procedure performed in clinical hepatology. His‐tological assessment of the liver, and thus, LB is traditionally the “reference standard”in the diagnosis and management of parenchymal liver diseases. Definitive diagnosis of‐ten depends on LB, and much of understanding of the characteristic features and natu‐ral history of liver diseases is based on information obtained by serial liver biopsies.During the last 60 years as the result of a better understanding of liver disorders, ap‐pearance of newer entities and advent of novel hepatic imaging techniques, the indica‐tions for LB have evolved. Whereas in the past LB was often performed as the initialinvestigation in the workup of liver disease of unknown aetiology, today the most com‐mon indication for LB includes staging of chronic hepatitis. A variety of methods existfor getting a liver tissue specimen. These take account of a percutaneous method, atransvenous (transjugular or transfemoral) approach, and intra-abdominal biopsy (laparo‐scopic or laparotomic). All LB techniques require specific training so as to ensure appro‐priate-sized specimen retrieval and the lowest rate of complications. However, becauseLB is an invasive procedure that carries a definite, albeit small, risk of complications,controversy persists with regard to its precise indications in various clinical situations,its clear contraindications, the optimal technique for its performance (and whether cer‐tain modifications improve its safety), and training requirements for clinicians. The aimof this chapter will be summarize the existing clinical practice of LB with an emphasison the technique, indications, contraindications, quality of LB specimens and risk ofcomplications.
© 2012 Randazzo et al.; licensee InTech. This is an open access article distributed under the terms of theCreative Commons Attribution License (http://creativecommons.org/licenses/by/3.0), which permitsunrestricted use, distribution, and reproduction in any medium, provided the original work is properly cited.

2. Indications
Historically, LB was applied almost exclusively as a diagnostic tool [1]. Nevertheless, as theresult of natural history data and the introduction of many new therapies for patients withliver disease, histological assessment of the liver has now got on an important role in clinicalmanagement. Therefore, LB currently has three major indications: for diagnosis, for assess‐ment of prognosis and/or to assist in the management of patient with known liver disease.
Diagnosis
•Identification and staging of parenchymalandcholestatic liver diseases
-alcoholic liver disease
-non-alcoholic steatohepatitis
-autoimmune hepatitis
-primary biliary cirrhosis
-primary sclerosing cholangitis
-metabolic and mitochondrial storage liver diseases such as Wilson’s disease, hemochromatosis, Gaucher’s disease
•Evaluation of persistent abnormal liver biochemical tests after negative or inconclusive serologic workup
•Evaluation of the type and extent of drug-induced liver injury
•Evaluation of fever of unknown origin or immunocompromised patients with hepatomegaly or elevated liver
enzymes levels
•Diagnosis of multisystem infiltrative disorders
- Identification and determination of the nature of focal/ diffuse intrahepatic abnormalities on imaging studies
Prognosis - Staging of known liver disease
•Evaluation of pre-transplant living-related donor
•Evaluation of post-transplant patient with abnormal liver tests (rejection vs. infectious aetiology)
Management – Developing treatment plans based on histologic analysis
•Pre-treatment evaluation and staging of chronic hepatitis
•Evaluation of effectiveness of therapies for liver diseases (eg, autoimmune hepatitis)
Table 1. Indications for liver biopsy
LB is performed to evaluate diffuse parenchymal or focal liver disease (see table 1). LB ismainly helpful in patients with diagnostic uncertainty(eg, in patients with atypical features).Available data show that liver histology will, in a proportion of patients, point to a specificdiagnosis [2] and lead to a change in patient management [3,4]. LB has long been consideredas an important diagnostic adjunct in the evaluation of otherwise unexplained abnormalitiesof liver biochemical tests. For example, LB may exclude serious liver disease or detect un‐suspected non-alcoholic fatty liver disease (NAFLD) or intrahepatic sclerosing cholangitisafter an otherwise negative biochemical, serologic and radiologic evaluation [3]. Needle LBfor diagnosis remains important in cases of coexisting disorders such as steatosis and HCV[5] or an “overlap” syndrome of primary biliary cirrhosis (PBC) with autoimmune hepatitis(AIH) [6].
Liver Biopsy - Indications, Procedures, Results4

Other indications for LB include documentation of alcoholic liver disease and assessment ofits severity; evaluation of otherwise unexplained fever, particularly in patients with Ac‐quired Immune Deficiency Syndrome (AIDS); detection of underlying granulomatous liverdisease. LB also provides important diagnostic information regarding drug-induced liver in‐jury. Liver histology is appropriately considered in conjunction with clinical and laboratorydata in case of hereditary disorders, eg hemochromatosis (quantitation of the level of iron),Wilson’s disease (quantitation of the level of copper), and alpha-1 antitrypsin deficiency.
Liver histology may also be useful in detection of infiltrative processes such as amyloidosis[7]. Moreover, liver histology is often helpful in the setting of acute liver failure (ALF) [8].
An additional main use of LB is in assessing disease severity, particularly fibrosis, which, asa precursor to cirrhosis, may predict the emergence of complications of portal hypertensionand also liver-related morbidity and mortality.
Owing to the wide use and superior resolution of cross-sectional imaging such as ultraso‐nography (US), computed tomography, and magnetic resonance imaging, focal lesions arebeing detected more often. Fortunately, the same technologic advances allow us to confi‐dently establish a diagnosis without biopsy in most cases. Nevertheless, sometimes a biopsyof a suspected neoplasm will help change management. In this case, careful consideration ofbiopsy technique is important, as neoplasms have a higher bleeding risk and the potential toseed other sites along the biopsy tract or in the abdominal cavity [9]. At present, most biop‐sies currently performed for parenchymal disease are not to make a specific diagnosis but toassess liver damage, particularly in situations where (prognostic) information about fibrosismay guide consequent treatment. For example, histological analysis of the liver in patientswith chronic HCV-induced liver disease gives information about the grading (inflammatoryactivity) and the staging (degree of fibrosis) that predict the course of disease; the treatmentis often advocated for those with at least moderate to severe staging, but may be withheldwhen fibrosis is minimal or absent [10]. Liver histology is also generally used in diseasemonitoring of patients with AIH [11]. Monitoring the plasma cell score on LB may help pre‐dict relapse when a physician is considering reducing or discontinuing immunosuppressivetherapy [12]. For further information on the role of histological analysis in the managementof individual liver diseases, is possible to see guidelines for HCV [10], HBV [13], hemochro‐matosis [14], cholestatic liver diseases [15], AIH [11], and Wilson’s disease [16].
Assessment of liver histology after orthotopic liver transplantation (OLT) is highly valuableto assess for allograft rejection and the presence and intensity of disease recurrence. Contro‐versy persists regarding the precise indications for LB. Among these controversies are thefollowing:
• The precise cut-off of serum aminotransferase levels that should prompt a LB: any persis‐tent elevation, 1.5 times the upper normal limit, or 2 standard deviations above the mean[17,18]. Even the definition of the upper limit of normal is controversial [19-21].
• The need for LB in patients presumed to have NAFLD. Whereas imaging studies are sen‐sitive for detecting steatosis, they are relatively not sensitive and nonspecific for detectinginflammation and fibrosis. Only on liver histology can distinguish fatty liver from steato‐
Liver Biopsy: An Overviewhttp://dx.doi.org/10.5772/52616
5

hepatitis, which can lead to fibrosis and cirrhosis. LB is often considered if serum alanineaminotransferase (ALT) levels remain elevated after a modification of lifestyle and riskfactors [22].
• The need for LB in all patients with PBC and primary sclerosing cholangitis (PSC). Inmost cases the diagnosis can be established on the basis of a cholestatic pattern of liverchemistries and either anti-mitochondrial antibodies in PBC [6] or endoscopic retrogradecholangiopancreatography (ERCP) in PSC [23]; scoring systems based on quickly estab‐lished clinical variables could be used to assess prognosis and response to therapy.
• The need for protocol liver biopsies in all liver transplant recipients. A high rate of histo‐logic abnormalities in the absence of liver biochemical test abnormalities has been descri‐bed as late as 10 years after transplantation [24].
Overall, in patients without a definitive pre-biopsy diagnosis, LB has been shown to changethe clinical diagnosis in 8% to 10% and to change the management in 12% of patients [25].However, changes in management are often of minor importance [3].
3. Biopsy technique
Performance of LB requires an adequate sized and dedicated space suitable for focusedphysician effort as well as safe patient recovery. There are different approaches for ob‐taining liver tissue: percutaneous, transjugular, laparoscopic, and intraoperative, eachhaving advantages and disadvantages. The biopsy technique is chosen on the basis ofthe indication, risks, and benefits in the individual patient. The most common approachfor collecting a liver sample is percutaneous LB, either blinded or under US guidance. Itis quick and safe procedures commonly performed by gastroenterologists or hepatolo‐gists in out-patient settings.
A variety of needles are available for percutaneous LB; they are broadly classified into suc‐tion needles (Menghini, Klatskin, Jamshidi), cutting needles (Vim-Silverman, Tru-cut), andspring-loaded cutting needles that have a triggering mechanism. The choice of a specifictype of needle depends in part on local preference. Cutting needles usually produce a largersample and are less likely to yield inadequate specimens than are suction needles, but theyprobably result in more complications [26], probably because the needle remains in the liverlonger. Cutting needles can be useful in patients with cirrhosis. Suction needles are quicker(in the liver for a briefer time), easier to use, and less expensive, but tend to produce morefragmented samples. Disposable biopsy needles and biopsy guns are often used. A typicalbiopsy gun uses a modified 18-, 16-, or 14-gauge Tru-cut needle that is fired by a fast andpowerful spring mechanism.
If the patient is not relaxed, a mild sedative should be administered just before the biopsy[27]. The current data on the use of prophylactic antibiotics is inconclusive. Prophylactic an‐tibiotics have been recommended for patients at increased risk of endocarditis or with bili‐ary sepsis [28]. However, recent results suggest that prophylactic administration of
Liver Biopsy - Indications, Procedures, Results6

antibiotics following apercutaneous liver biopsy does not have a significant impact on thepost-procedure results or incidence of infection [29]. During the procedure, patients placedin the supine position with the right hand resting behind the head [30]. For the blind ap‐proach (also referred to as the percussion-palpation approach), caudal percussion is helpfulin selecting the site for the biopsy over the hemithorax between the anterior and mid-axil‐lary lines, until an intercostal space is reached where dullness is maximal at the end of expi‐ration. The intercostal space below this point (usually in the 7th-8th intercostal space) is used.A local anesthetic, typically lidocaine (without adrenaline), is administered with a 25-gaugeneedle first subcutaneously and into the intercostal muscle and finally down to the dia‐phragm and the capsule of the liver to reduce pain. The biopsy is performed while the pa‐tient holds a breath in full expiration [31]. With a suction needle, aspiration is applied, andthe needle is rapidly introduced perpendicularly to the skin into the liver and withdrawnquickly (within 1 second). This is the critical step in performing the biopsy to minimize therisk of lacerating the liver and inducing bleeding. If insufficient tissue is obtained on the firstpass [32], a second pass is performed at a different angle. After the biopsy, the patients isusually kept on the right lateral decubitus position for up to 2 hours to reduce the risk ofbleeding and the pulse and blood pressure are monitored. Post-procedure monitoring hasevolved over time. Most complications manifest within the first few hours [26], and undercertain circumstances more and more patients are being discharged just 1 or 2 hours afterimaging-guided biopsy. Rightly, the recommended observation time after biopsy is between2 to 4 hours. To direct the needle away from other organs and large vascular structures,physicians often use US guidance. The US has been used either throughout the entire proce‐dure (real-time) or immediately before (site marking) through a technique in which the pa‐tient subsequently has LB performed at the marked site. US guidance is the mostcontroversial issue associated with LB [33-35]. Potential LB sites marked by percussion werechanged in between 3 and 15% of patients after US was performed [36,37]. In an uncontrol‐led Italian study, routine identification of the puncture site by US led to a diagnostic tissuesample in 99% of patients [35]. In diffuse liver disease, US marking or guidance has beenassociated with lower rates of pain, hypotension, and bleeding [31]. In a survey of 2084 liverbiopsies in France, US guidance is used in 56% of cases (in 34% to determine the puncturesite and in 22% to guide the biopsy) and is thought to reduce the frequency of severe com‐plications [38]. Cost-effectiveness analyses have suggested that routine US guidance in clini‐cal practice increases the cost of LB but may be cost-effective, with an incremental cost of$2731 to avoid one major complication [39,40]. In addition, a large, randomized, prospectivetrial found that US use lowered the rate of post-biopsy hospitalization (most common rea‐son for hospital admission was pain). Indeed there is a long track record of safety for per‐forming percutaneous LB without imaging guidance. Thus, the role of US to guidepercutaneous LB remains controversial. Use of ultrasound is not mandatory. A transjugularbiopsy route offers a reasonable alternative to standard biopsy in high-risk patients (eg pres‐ence of massive ascites, severe coagulopathy, morbid obesity with a difficult to identifyflank site or fulminant hepatic failure) [41]. With transjugular LB, the liver tissue is obtainedfrom within the vascular system, which minimizes the risk of bleeding [42,43]. The proce‐dure is performed by interventional radiologists or hepatologists under X-ray videofluoro‐
Liver Biopsy: An Overviewhttp://dx.doi.org/10.5772/52616
7

scopy. Electrocardiographic monitoring is required to detect arrhythmias induced bypassage of the catheter through the heart [41,44]. The patient is positioned supinely, with thehead rotated opposite to that of the right internal jugular vein to be punctured, under localanesthesia using the Seldinger technique; then, a catheter is introduced into the hepatic veinunder fluoroscopic control, and a needle biopsy of the liver performed through the catheter.Samples are retrieved from a Menghini or Tru-cut needle passed through the catheter intothe liver. The transjugular approach permits concomitantly measurement of hepatic venouspressure gradient or opacification and imaging of the hepatic veins and inferior vena cava[45] helping in the diagnosis and management of select group of patients, particularly thosewith cirrhosis. In the past, a drawback of transjugular biopsy was the small and fragmentedsamples obtained. Better needles and more experience have led to improved quality ofspecimens. However, a transjugular LB is available only at a limited number of tertiary carefacilities. Mortality is low (0.09%) [41], but perforation of the liver capsule can be fatal [46].With laparoscopic approach, specific lesions can be identified and targeted precisely; thus itis especially useful in the diagnosis of peritoneal disease, the evaluation of ascites of un‐known origin and abdominal mass, the staging of abdominal cancer. Laparoscopic LB is asafe procedure that can be performed under local anesthesia with conscious sedation, al‐though it requires expertise that is not readily available. Absolute contraindications includesevere cardiopulmonary failure, intestinal obstruction, bacterial peritonitis; relative contra‐indications are severe coagulopathy, morbid obesity, and a large ventral hernia [33]. Formost parenchymal liver diseases, the extra time and cost required for laparoscopy are notjustified by the increased yield. Liver biopsies (needle or wedge) can also be obtained dur‐ing abdominal surgery whenever liver disease is suspected. In many instances, an abnormalappearance of the liver during surgery for an unrelated procedure (most often cholecystec‐tomy) is the first indication of an underlying liver disease. It is generally performed eitherwith typical needle devices or by wedge resection by those with special expertise. While in‐traoperatively obtained liver biopsies have the added advantage of obtaining adequate tis‐sue sampling under direct vision from grossly visible/suspicious lesions, they aresuboptimal for assessment of liver fibrosis and inflammation, due to preponderance of Glis‐sen’s capsule, wider portal tracts in the subcapsular area, and frequent but inconsequentialsurgically induced hepatitis. Other advantages are the ability to evaluate for potential extra‐hepatic spread of malignancy and to look for a cause of unexplained ascites (peritoneal bi‐opsy). The major disadvantages are cost and the added risk of anesthesia. Therefore, needlebiopsy should be the technique of choice at laparotomy.
4. Contraindications
Although LB is often essential in the management of patients with liver disease, physiciansand patients may find it to be a difficult undertaking because of the associated risks.
The consensus guidelines of contraindications for percutaneous LB are listed in Table 2.
Liver Biopsy - Indications, Procedures, Results8

Absolute
•Uncooperative patient
•History of unexplained bleeding
•Tendency to bleed
-Prothrombin time "/> 3-4 sec over control
-Platelet counts < 50.000/mm3
-Prolonged bleeding time (≥10 min)
•Unavailability of blood transfusion support
•Recent use of aspirin or other nonsteroidal anti-inflammatory drugs (within last 7-10 days)
Relative
•Ascites
•Morbid obesity
•Infection in the right pleural cavity or below the right hemidiphragm
•Suspected hemangioma or other vascular tumor
•Hydatid disease (Echinococcal cysts)
Table 2. Contraindications to percutaneous LB
Percutaneous LB with or without image guidance is appropriate only in cooperative pa‐tients. As for any procedure, the patient that undergoes a LB should be able to understandand cooperate with the physician’s instructions. An academic concern is that if the patientaccidentally moves when the biopsy needle is in the liver, then a tear or laceration may oc‐cur (which would in turn greatly increase the risk of bleeding). Thus uncooperative patientswho require LB should undergo the procedure under general anesthesia or via the transve‐nous route.
Coagulopathy is generally considered a contraindication to percutaneous LB, but the preciseparameters that preclude LB are unsettled [47]. Generally, LB should be withdrawn whenthe prothrombin time (PT) is more than 3-4 seconds above the control value (InternationalNormalized Ratio, INR>1.5) or when the platelet count is less than 60.000/mm3 [48]. Never‐theless, it is important to emphasize that the relationship of abnormal indices of peripheralcoagulation to the occurrence of bleeding after LB in patients with acute as well as chronicliver disease is uncertain, as limited data are available [47,49]. In patients with mild to mod‐erate prolongation of PT, administration of fresh frozen plasma or appropriate clotting fac‐tor concentrates may allow safe performance of a LB, as in hemophiliacs [50]. A low plateletcount is probably less likely to result in bleeding in a cirrhotic patient with hypersplenismthan in a leukemic patient with a comparable platelet count but platelet dysfunction. Proba‐bly, platelet dysfunction due to aspirin use is a major risk factor as well. Whether patientswith renal insufficiency are at increased risk of bleeding complications after LB is also un‐certain [28]. In summary, the decision to perform LB in the setting of abnormal hemostasisparameters should continue to be reached as the result of local practice because there is nospecific INR and/or platelet count cut-off at or above which potentially adverse bleeding canbe reliably predicted.
Liver Biopsy: An Overviewhttp://dx.doi.org/10.5772/52616
9

A LB is precluded by tense ascites, because the liver will bounce away from the needle,thereby preventing adequate sampling of tissue, and the ascites will provide insufficienttamponade in case of bleeding. In patients with tense ascites requiring a LB, a transvenousapproach is commonly recommended. Acceptable options include total paracentesis per‐formed immediately prior to percutaneous biopsy or transvenous or laparoscopic biopsy.
Relative contraindication is morbid obesity; in this case, transjugular biopsy is a logical al‐ternative.
A standard LB is probably contraindicated by extrahepatic biliary obstruction, bacterialcholangitis, and the risk of bleeding after LB appears to be increased in patients with aknown hematologic malignancy involving the liver [28].
Although LB in patients with mass lesions is usually safe, biopsy of known vascular lesions(ie hepatic hemangioma) should generally be avoided [51]. Patients who require LB andwho have a large vascular lesion identified on imaging should undergo the procedure usingreal-time image guidance. Biopsy of potentially malignant lesions should be undertakenwith care because it is believed that tumour vessels are more likely to bleed [51] and it canbe also associated with a risk of tumour spread [52,53].
Biopsy of infectious lesions is generally safe. In the past, the presence of an echinococcal cystwas considered a contraindication to LB, because of the possibility of disseminating cyststhroughout the abdomen and the risk of anaphylaxis. However, with recent advances intreatment, echinococcal cysts can be aspirated safely under ultrasound guidance [54].
5. Complications
When performing a LB, should be aware of multiple potential complications that may occurafter biopsy.At the time that informed consent is obtained, it is reasonable to outline thesecomplications clearly, warn the patient of the potential pain, and mention in a general state‐ment that other complications, albeit rare, can occur.
Although the percutaneous biopsy is invasive, associated complications are rare, occurringin up to 6%, and 0.04% to 0.11% can be life threatening [33].
The different complication rates were attributed to variation in technique and to differencesin the needles used, as well as differences in the severity of the liver disease and selectioncriteria in different centers.
The most common complication after percutaneous LB is pain [55]. Approximately 25% ofpatients have pain in the right upper quadrant or right shoulder; the pain is usually dull,mild and brief. Right upper-quadrant pain does not seems to be related to approach (i.e.subcostal vs. intercostal) [56]. The mechanism of pain following percutaneous biopsy is mostlikely a result of bleeding or possibly bile extravasation from the liver puncture wound,with subsequent capsular swelling, although the exact mechanism remains uncertain [57].When present, pain can generally be managed with small amounts of narcotics. A decision
Liver Biopsy - Indications, Procedures, Results10

about when to investigate with imaging and/or to hospitalize the patient for observationdue to pain should be made on a case-by-case basis.
MAJOR
•Dearth
•Haemorrhage (intraperitoneal, intrahepatic, haemothorax)
•Perforation of the gallbladder or of the bowel
•Pneumothorax, haemothorax
•Biopsy of the right kidney or the pancreas
•Intrahepatic arteriovenous fistula
•Bile peritonitis
MINOR
•Pain (biopsy site, right upper quadrant and right shoulder pain)
•Transient hypotension (vasovagal response)
•Pneumoperitoneum
•Hemobilia
•Infection (bacterial sepsis, local abscess)
•Intrahepatic and subcapsular hematoma
Table 3. Complications of percutaneous liver biopsy
Transient hypotension, due to vasovagal reaction, can occur, particularly in patients who arefrightened or emotional.
Major complications were defined as life threatening or those that required hospitalization,prolonged hospitalization or those that resulted in persistent or significant disability. Mostserious complications occur within 24 hours of the procedure, and 60% happen within 2hours; between 1% and 3% of patients require hospitalization [33].
The most common serious complication is bleeding because of transection of a vascularstructure [26]; bleeding may occur in the absence of pain. Mild bleeding, defined as that suf‐ficient to cause pain or reduced blood pressure or tachycardia, but not requiring interven‐tion, occurs in about 1/500 biopsies [58]. Severe bleeding is defined clinically by a change invital signs with imaging evidence of intraperitoneal bleeding. Such bleeding has been esti‐mated to occur in between 1 in 2.500 to 1 in 10.000 biopsies after a percutaneous approachfor diffuse liver disease [59]. Although very rare, clinically significant intraperitonealhemor‐rhage is the most serious bleeding complication of percutaneous LB; it usually becomes ap‐parent within the first 2-3 hours after the procedure [26]. Free intraperitoneal blood mayresult from laceration of the liver capsule caused by deep inspiration during the biopsy ormay be related to a penetrating injury of a branch of the hepatic artery or portal vein. Thelikelihood of hemorrhage increased with older age, presence of cirrhosis or liver cancer, andnumber of passes (≥ 3) with the needle during biopsy. The relationship between LB compli‐cations and the number of needle passes is well documented [51]. The frequency of compli‐cations increased with the number of passes performed at a rate of 26.4%, with one pass vs.
Liver Biopsy: An Overviewhttp://dx.doi.org/10.5772/52616
11

68% with two or more passes (P< 0.001) [38]. An additional factor in determining the risk ofhemorrhage may be the type of needle used; cutting needles are more likely to result inhemorrhage than suction needles [26]. Severe bleeding requires hospitalization and is mostoften managed expectantly with placement of intravenous catheters, volume resuscitationby the administration of intravenous fluids and blood transfusion as necessary. If hemody‐namic instability persists for a few hours despite the use of aggressive resuscitative meas‐ures, angiography with selective embolization of the bleeding artery or surgery (to ligate theright hepatic artery or resect a section) is required.
Subclinical bleeding leading to intrahepatic or subcapsular hematomas may be noted afterLB even in asymptomatic patients. It is occurs in up to 23% of patients [60] and can be de‐tectable by US. Large hematomas may cause pain associated with tachycardia, hypotension,and a delayed decrease in the hematocrit [33]. Conservative treatment of hematomas is gen‐erally sufficient.
After tranvenous biopsy bleeding is extremely rare because of the Glisson capsule is notbreached except as a procedural complication from within the liver [61].
The least common of the hemorrhagic complications is hemobilia, which usually presentswith the classic triad of gastrointestinal bleeding, biliary pain, and jaundice [26] approxi‐mately 5 days after the biopsy [62].
Transient bacteremia has been reported in 5.8 to 13.5 percent of patients after LB [63], andalthough such bacteremia is generally inconsequential, septicaemia and shock can rarely oc‐cur in patients with biliary obstruction and cholangitis.
Biliary peritonitis caused by puncture of the gallbladder is rare (0.00001% frequency) butcan be fatal [64].
Pneumothorax, hemothorax, subcutaneous emphysema, perforation of any of several organs(lung, colon, and kidney), subphrenic abscess are other complications reported with LB.Pneumothorax may be self-limited but may require more aggressive intervention dependingon the severity of symptoms. Visceral perforation is usually managed expectantly. In mostsituations, observation is all that is required, although surgical intervention may be neededin the case of gallbladder puncture and persistent bile leak, or in the case of secondary peri‐tonitis.
Differences in complication rates, either minor or major, have been reported between theblind and US-guided LB. The use of US guidance can prevent inadvertent puncture of otherorgans or large intrahepatic vessels. US may also reduce the incidence of major complica‐tions such as haemorrhage, bile peritonitis, pneumothorax, etc.
With respect to the impact of the experience of the operator to the rate of complications, theevidences are controversial. A survey performed in Switzerland showed that the complica‐tion rate of percutaneous LB was mainly related to the experience and training of the opera‐tor, in particular a lower complication rate was reported for physicians who performedmore than 50 biopsies a year [65]. Another study showed that the rate of complications inpercutaneous LB was 3.2% if the operator had performed <20 biopsies, and only 1.1% if the
Liver Biopsy - Indications, Procedures, Results12

operator had performed more than 100 biopsies [64] In contrast, Chevallier et al. showedthat the operator’s experience did not influence either the final histological diagnosis or thedegree of pain suffered by patients [66].
In adult series, the rate of major complications associated with transjugular LB is low (0.5%;liver puncture-related, 0.2%; non-liver puncturerelated,0.3%), considering that it is currentlyperformed in patients with coagulopathy [41]. Minor complications were significantly morefrequent with Menghini needle, possibly related with the difficulty in controlling the depthof puncture increasing the risk of capsular penetration [46].
MINOR
Pyrexia
Neck hematoma, bleeding
Neck pain
Carotide puncture
Transient Horner’s syndrome
Transient dysphonia
Arm numbness/palsy
Supraventricular arrhythmia
Hypotension
Abdominal pain
Subclinical capsular perforation
Small hepatic hematoma
Hepatic-portal vein fistula
Hepatic artery aneurysm
Biliary fistula
Haemobilia
MAJOR
Large hepatic hematoma
Intraperitoneal haemorrhage
Inferior vena cava or renal vein perforation
Ventricular arrythmia
Pneumothorax
Respiratory arrest
Table 4. Complications of transjugular liver biopsy
Factors associated with liver and non-liver puncture related complication rates includednumber of passes (liver puncture-related), young age, and number of transjugular biopsies.
The complications after laparoscopic LB include perforation of a viscus, bleeding, hemobilia,laceration of the spleen, leakage of ascitic fluid, hematoma in the abdominal wall, vasovagalreaction, prolonged abdominal pain, and seizures [67].
The most quoted mortality rate after percutaneous LB is less than or equal to 1/10.000 biop‐sies. Mortality is typically related to bleeding. Mortality is highest among patients who un‐dergo biopsies of malignant lesions. Cirrhosis is another risk factor for fatal bleeding afterLB. Mortality after transvenous biopsy was 0.09% [41] in adult series, but may reflect the se‐lection of higher risk patients for this intervention. Indeed, mortality is significantly higherin children; smaller livers and horizontal hepatic veins may increase the technical difficultyand risk of capsular perforation, which might be minimized by combined fluoroscopic andUS guidance [68].
Liver Biopsy: An Overviewhttp://dx.doi.org/10.5772/52616
13

6. Pathological considerations
Even though LB gives significant diagnostic and prognostic information and helps definetreatment plans, it must be recognized that sampling variability and intra observer variabili‐ty may restrain the diagnostic value of LB. The quality of LB is usually determined bylength, width, fragmentation and complete portal tracts (CPTs) [33].
Sample size can affect the diagnostic accuracy of LB specimens [33]. s almost always meansthat size of the needle biopsy specimen should be of large enough size to accurately assessthe degree of liver injury. Considering that a biopsy sample taken from an adult corre‐sponds to a fraction of just 1/50,000th of the whole liver, a biopsy specimen would seem tobe inadequate in the case of diffuse diseases, such as a chronic viral hepatitis, in which theliver changes may be unevenly distributed.
Several studies demonstrated that cirrhosis can be missed on a single blind percutaneous LBin 10%-30% of cases [69-71]. In a detailed study, Colloredo et al. [72] carefully evaluated theimpact of sample size on correct stadiation of liver fibrosis in patients with chronic hepatitisC. By reducing progressively the dimensions of the same LB, they reported that the smallerthe sample analyzed, the milder the diagnosis made by the pathologist with respect to thestage of fibrosis. The reduction in length (<2 cm) led to a significant decrease in number ofcomplete portal tracts and underestimation of grading and staging. The study by Colloredoet al also introduced the concept of a ‘‘minimum number of CPTs.’’ Since the number of por‐tal tracts is proportional to biopsy size [73], there was evidence that with fewer than 11 to 15CPTs grade and stage are significantly underestimated [72]. The lower number of completeportal tracts may explain the lower diagnostic accuracy obtained with smaller samples[73,74]. Guido and Rugge have suggested that a biopsy sample ≥20 mm containing at least11 CPTs should be considered reliable for adequate staging [75]. Other authors have recom‐mended even bigger samples, up to 25 mm in length [76]. Scheuer suggested that ‘‘bigger isbetter’’ [77]. Very recently, the American Association for the Study of Liver Diseases(AASLD) has recommended a biopsy sample of at least 20–30 mm in length, and containingat least 11 CPTs [48].
In summary, an adequate (although probably still imperfect) sample needs to be at least 2cm long (1.4 mm width, 16G) and to contain no fewer than 11 CPTs. These criteria have beenadopted rapidly as optimal standards.
Of equal importance to adequate specimen size is the necessity that a pathologist experi‐enced in liver disease interprets the biopsy, ideally in partnership with the clinician whoperformed the biopsy and/or whom is caring for the patient. Rousselet et al. reportedthat the degree of experience of the pathologist (specialization, duration, and location ofpractice) may have a significant impact on the diagnostic interpretation of LB, even high‐er than that related to characteristics of the specimen (length, fibrosis class number, mis‐cellaneous factors) [78].
Assessment of disease severity with liver histology is supported by a wide body of liter‐ature [79]. Complex scoring systems, such as the Knodell scoring system [80] and its re‐
Liver Biopsy - Indications, Procedures, Results14

vised form, the Ishak scoring system [81] have been developed for grading and stagingof chronic viral hepatitis, and there is now a similar score for steatohepatitis [82]. Never‐theless, these are not highly reproducible and are only appropriate for statistical analysisof (large) cohorts of patients in clinical trials. In clinical practice, it was recommended touse the simple systems with three to four categories such as METAVIR [83] rather thancomplex (Ishak) scoring system [48].
7. Further research
Until a few years ago, LB was the only tool for the diagnosis of liver disease. However, theindications for performing a LB have undergone changes in the last decade. Given the inva‐sive nature of LB, several simple and non-invasive methods (radiologic, immunologic, bio‐chemical, genetic markers) have been studied and proposed as surrogates of liver histology.The main advantages of serum biomarkers vs. LB include being less invasive and the possi‐bility to be easily repeated to monitor the status of liver disease. However, at this time, theyare primarily useful for detecting advanced fibrosis or for excluding minimal or no fibrosis.They are not sufficiently accurate for assessing disease progression or the effect of therapy.Due to inadequate diagnostic accuracy or to lack of sufficient validation, current guidelinesdo not recommend serum biomarkers a substitute for LB that is still considered the refer‐ence standard. Notably, non-invasive serum biomarkers, when combined, may reduce by50%-80% the number of liver biopsies needed for correctly classifying hepatic fibrosis. Se‐rum biomarkers for liver fibrosis are particularly useful for the initial assessment as well asfor long-term monitoring of particular subsets of patients (ie, chronic hepatitis C). In thisview, combination algorithms of the most validated non-invasive methods for liver fibrosisand LB represent a rational approach to the diagnosis of liver fibrosis in chronic liver diseas‐es. Novel imaging techniques, such as measuring the elasticity of the liver using transientelastography (Fibroscan) [84], may assess fibrosis more directly. However, the use of suchtechniques in routine clinical practice has not been well defined and require further investi‐gation. LB cannot be avoided completely, but should be used in those cases in which non-invasive methods show poor accuracy. Nevertheless, large scale, prospective, independentstudies are needed in other aetiologies of CLDs. Many questions about LB remain and theyrequire much more research. For instance, it is not clear which biopsy devices or techniquesare best. In addition, few if any studies have assessed the biopsy's long-term effects. Becausethe liver is cut and bleeds during procedure, there will be some subsequent scarring.
8. Conclusions
LB continues to play a central role in the evaluation of patients with suspected liver disease,but many aspects of the procedure remain controversial. For example, the precise degree ofserum ALT elevations that should prompt a LB is debated, as is the need for LB in all pa‐tients with suspected NAFLD and chronic hepatitis C. The importance of LB in arriving at a
Liver Biopsy: An Overviewhttp://dx.doi.org/10.5772/52616
15

diagnosis of diffuse parenchymal liver disease is being diminished by accurate blood testingstrategies for chronic viral hepatitis, autoimmune hepatitis, and primary biliary cirrhosis.Further, imaging tests are superior to LB in the diagnosis of primary sclerosing cholangitis.However, many cases remain in which diagnostic confusion exists even after suitable labo‐ratory testing and imaging studies. Diagnosing infiltrative disease (eg, amyloidosis, sarcoi‐dosis), separating benign fatty liver disease from steatohepatitis, and evaluating liverparenchyma after liver transplantation are best accomplished by LB.
Percutaneous LB is contraindicated in patients with severe coagulopathy and ascites, butthe degree of coagulopathy that contraindicates a LB is controversial. Also controversialare the technical aspects of LB, particularly the choice of needle (cutting vs. suction) andthe use of US to mark or guide the biopsy site. Bleeding is the major complication ofLB, with a risk of 0.3%; cutting needles are more likely to cause hemorrhage than aresuction needles. While needle biopsy is still the mainstay in diagnosing hepatic fibrosis,its days of dominance seem limited as technology improves. When physical examinationor standard laboratory tests reveal clear-cut signs of portal hypertension, LB will seldomadd useful information. Similarly, when imaging studies provide compelling evidence ofcirrhosis and portal hypertension, needle biopsy is not warranted. The combination algo‐rithms warrant further evaluation in all chronic liver diseases, as they may help decreasethe number of liver biopsies required. Moreover, transient elastography is playing an ev‐er-increasing role in the assessment of hepatic fibrosis and will significantly reduce theneed for biopsy in patients with liver disease.
Clearly, as our knowledge of various liver disorders advances and new especially non-inva‐sive diagnostic tests are developed, the role of LB in medical practice will continue toevolve. Emergence of better imaging techniques, surrogate serological markers of liver fibro‐sis are among the many new and exciting developments that hold promise for the future.
Author details
Claudia Randazzo, Anna Licata and Piero Luigi Almasio
Department of Gastroenterology, University of Palermo, Italy
References
[1] Sherlock S. Aspiration liver biopsy: technique and diagnostic application. Lancet1945;246:397-401.
[2] Hay JE, Czaja AJ, Rakela J, Ludwig J. The nature of unexplained chronic aminotrans‐ferase elevations of a mild to moderate degree in asymptomatic patients. Hepatology1989;9:193-197.
Liver Biopsy - Indications, Procedures, Results16

[3] Sorbi D, McGill DB, Thistle JL, et al. An assessment of the role of liver biopsies inasymptomatic patients with chronic liver test abnormalities. Am J Gastroenterol2000;95:3206-3210.
[4] Skelly MM, James PD, Ryder SD. Findings on liver biopsy to investigate abnormalliver function tests in the absence of diagnostic serology. J Hepatol 2001;35:195-199.
[5] Powell EE, Jonsson JR, Clouston AD. Steatosis: co-factor in other liver diseases. Hep‐atology 2005;42:5-13.
[6] Zein CO, Angulo P, Lindor KD. When is liver biopsy needed in the diagnosis of pri‐mary biliary cirrhosis? ClinGastroenterolHepatol 2003;1:89-95.
[7] Dahlin DC, Stauffer MH, Mann FD. Laboratory and biopsy diagnosis of amyloidosis.Med Clin North Am 1950;34:1171-1176.
[8] Polson J, LeeWM. AASLD position paper: the management of acute liver failure.Hepatology 2005;41:1179-1197.
[9] Takamori R, Wong LL, Dang C, et al. Needle-tract implantation from hepatocellularcancer: is needle biopsy of the liver always necessary? Liver Transplant 2000;6:67–72.
[10] European Association for the Study of the Liver. EASL Clinical Practice Guidelines:Management of hepatitis C virus infection. J Hepatol. 2011;55(2):245-64.
[11] Gleeson D, Heneghan MA; British Society of Gastroenterology. British Society ofGastroenterology (BSG) guidelines for management of autoimmune hepatitis. Gut2011;60(12):1611-29.
[12] Verma S, Gunuwan B, Mendler M, et al. Factors predicting relapse and poor outcomein type I autoimmune hepatitis: role of cirrhosis development, patterns of transami‐nases during remission and plasma cell activity in the LB. Am J Gastroenterol2004;99:1510-1516.
[13] European Association for the Study ofThe Liver. EASL Clinical Practice Guidelines:Management of chronic hepatitis B virus infection. J Hepatol 2012;57(1):167-85.
[14] European Association for the Study of the Liver. EASL Clinical Practice Guidelinesfor HFE hemochromatosis. J Hepatol 2010;53(1):3-22.
[15] European Association for the Study of the Liver. EASL Clinical Practice Guidelines:management of cholestatic liver diseases. J Hepatol 2009;51(2):237-67.
[16] European Association for Study of Liver. EASL Clinical Practice Guidelines: Wilson’sdisease. J Hepatol 2012;56(3):671-85.
[17] Pratt DS, Kaplan MM. Evaluation of abnormal liver-enzyme results in asymptomaticpatients. N Engl J Med 2000;342:1266-71.
[18] Bianchi L: Liver biopsy in elevated liver function tests? An old question revisited. JHepatol2001;35:290-294.
Liver Biopsy: An Overviewhttp://dx.doi.org/10.5772/52616
17

[19] Prati D, Taioli E, Zanella S, et al.Updated definitions of healthy ranges for serum ala‐nine aminotransferase levels. Ann Intern Med 2002;137:1-9.
[20] Kaplan MM. Alanine aminotransferase levels: What’s normal? Ann Intern Med2002;137:49-51.
[21] Ruhl C, Everhart JE: Determinants of the association of overweight with elevated se‐rum alanine aminotransferase activity in the United States. Gastroenterology2003;124:71-79.
[22] Green RM, Flamm S: AGA technical review on the evaluation of liver chemistry tests.Gastroenterology 2002; 123:1367-1384.
[23] Chandok N, Hirschfield GM. Management of primary sclerosing cholangitis: conven‐tions and controversies. Can J Gastroenterol 2012;26(5):261-8.
[24] Sebagh M, Rifai K, Féray C, et al.: All liver recipients benefit from the protocol 10-year liver biopsies. Hepatology2003;37:1293-1301.
[25] Spycher C, Zimmermann A, Relchen J: The diagnostic value of liver biopsy. BMCGastroenterol2001;1:12.
[26] Piccinino F, Sagnelli E, Pasquale G, Giusti G. Complications following percutaneousliver biopsy. A multicentre retrospective study on 68,276 biopsies. J Hepatol1986;2:165-173.
[27] Alexander JA, Smith BJ: Midazolam sedation for percutaneous liver biopsy. Dig DisSci1993;38:2209-2211.
[28] Grant A, Neuberger J: Guidelines on the use of liver biopsy in clinical practice. Gut1999;45(Suppl IV):IV1-IV11.
[29] Sato S, Mishiro T, Miyake T, et al. Prophylactic administration of antibiotics unneces‐sary following ultrasound-guided biopsy and ablation therapy for liver tumors:Open-labeled randomized prospective study. Hepatol Res 2009;39(1):40-6.
[30] Hegarty JE, Williams R. Liver biopsy: techniques, clinical applications, and complica‐tions. Br Med J (Clin Res Ed) 1984;288:1254-6.
[31] Sherlock S, Dooley J. Diseases of the Liver and Biliary System. Oxford: Blackwell Sci‐ence; 2002
[32] Crawford AR, Lin X-Z, Crawford JM: The normal adult human liver biopsy: a quan‐titative reference standard. Hepatology1998;28:323-331.
[33] Bravo AA, Sheth SG, Chopra S. Liver biopsy. N Engl J Med 2001;344:495-500.
[34] Vautier G, Scott B, Jenkins D. Liver biopsy: blind or guided? BMJ 1994;309:1455-1456.
[35] Caturelli E, Giacobbe A, Facciorusio D, et al.Percutaneous biopsy in diffuse liver dis‐ease: increasing diagnostic yield and decreasing complication rate by routine ultra‐sound assessment of puncture site. Am J Gastroenterol1996;91:1318-1321.
Liver Biopsy - Indications, Procedures, Results18

[36] Smith CI, Grau JE. The effect of ultrasonography on the performance of routine liverbiopsy. Hepatology 1995; 22:384A.
[37] Riley TR. How often does ultrasound marking change the liver biopsy site? Am JGastroenterol 1996;91:1292-1296.
[38] Cadranel JF, Rufat P, Degos F. Practices of liver biopsy in France: results of a pro‐spective nationwide survey. For the group of Epidemiology of the French Associa‐tion for the Study of the Liver (AFEF). Hepatology 2000; 32:477-481.
[39] Younossi ZM, Teran JC, Ganiats TG, Carey WD. Ultrasound-guided liver biopsy forparenchymal liver disease: an economic analysis. Dig Dis Sci 1998;43:46-50.
[40] Pasha T, Gabriel S, Therneau T, et al. Cost-effectiveness of ultrasound-guided liverbiopsy. Hepatology 1998;27:1220-1226.
[41] Kalambokis G, Manousou P, Vibhakorn S, et al. Transjugular liver biopsy - indica‐tions, adequacy, quality of specimens, and complications - a systematic review. JHepatol 2007;47(2):284-294.
[42] Lebrec D, Goldfarb G, Degott C, et al. Transvenous liver biopsy: an experience basedon 1000 hepatic tissue samplings with this procedure. Gastroenterology1982;83:338-340.
[43] Bull HJ, Gilmore IT, Bradley RD, et al. Experience with transjugular liver biopsy. Gut1983;24:1057-1060.
[44] McAfee JH, Keeffe EB, Lee RG, Rosch J. Transjugular liver biopsy. Hepatology1992;15:726-732.
[45] Lebrec D. Various approaches to obtaining liver tissue: choosing the biopsy techni‐que. J Hepatol1996;25(suppl 1):20-24.
[46] Papatheodoridis DV, Patch D, Watkinson A, et al.Transjugularliver biopsy in the1990s: a 2-year audit. Aliment PharmacolTher1999;13:603-608.
[47] Ewe K. Bleeding after liver biopsy does not correlate with indices of peripheral coag‐ulation. Dig Dis Sci 1981; 26:388-393.
[48] Rockey DC, Caldwell SH, Goodman ZD, et al. Liver biopsy. Hepatology2009;49:1017-44.
[49] Dillon JF, Simpson KJ, Hayes PC: Liver biopsy bleeding time: an unpredictable event.J GastroenterolHepatol1994;9:269-271.
[50] Venkataramani A, Behling C, Rond DR, et al.Liver biopsies in adult hemophiliacswith hepatitis C: a United States center's experience. Am J Gastroenterol2000;95:2374-2376.
[51] McGill DB, Rakela J, Zinsmeister AR, Ott BJ. A 21-year experience with major hemor‐rhage after percutaneous liver biopsy. Gastroenterology 1990;99:1396-1400.
Liver Biopsy: An Overviewhttp://dx.doi.org/10.5772/52616
19

[52] Chang S, Kim SH, Lim HK, et al. Needle tract implantation after sonographicallyguided percutaneous biopsy of hepatocellular carcinoma: evaluation of doublingtime, frequency, and features on CT. AJR Am J Roentgenol 2005;185:400-405.
[53] Liu YW, Chen CL, Chen YS, et al. Needle tract implantation of hepatocellular carci‐noma after fine needle biopsy. Dig Dis Sci 2007;52:228-231.
[54] Schipper HG, Lameris JS, van Delden OM, et al.: Percutaneous evacuation (PEVAC)of multivesicularechinococcal cysts with or without cystobiliary fistulas which con‐tain non-drainable material: first results of a modified PAIR method. Gut2002;50:718-723.
[55] Eisenberg E, Konopniki M, Veitsman E, et al. Prevalence and characteristics of paininduced by percutaneous liver biopsy. AnesthAnalg 2003;96:1392-1396.
[56] Tan KT, Rajan DK, Kachura JR, et al. Pain after percutaneous liver biopsy for diffusehepatic disease: a randomized trial comparing subcostal and intercostal approaches. JVascIntervRadiol 2005;16:1215-1219.
[57] Caldwell SH. Controlling pain in LB, or “we will probably need to repeat the biopsyin a year or two to assess the response”. Am J Gastroenterol 2001;96:1327-1329.
[58] Myers RP, Fong A, Shaheen AA. Utilization rates, complications and costs of percu‐taneous liver biopsy: a population-based study including 4275 biopsies. Liver Int2008;28:705-712.
[59] Firpi RJ, Soldevila-Pico C, Abdelmalek MF, et al. Short recovery time after percutane‐ous liver biopsy: should we change our current practices? ClinGastroenterolHepatol2005;3:926-929.
[60] Minuk GY, Sutherland LR, Wiseman D, et al.Prospective study of the incidence of ul‐trasound-detected intrahepatic and subcapsular haematomas in patients randomizedto 6 or 24 hours of bed rest after percutaneous liver biopsy. Gastroenterology1987;92:290-293.
[61] Tobkes AI, Nord HJ. LB: review of methodology and complications. Dig Dis1995;13:267-274.
[62] Lichtenstein DR, Kim D, Chopra S. Delayed massive hemobilia following percutane‐ous liver biopsy: treatment by embolotherapy. Am J Gastroenterol 1992;87:1833-1838.
[63] Reddy KR, Schiff ER. Complications of liver biopsy. In: Taylor MB (ed.) Gastrointes‐tinal emergencies. 2nd ed. Baltimore: Williams & Wilkins;1997. p959-968.
[64] Gilmore IT, Burroughs A, Murray-Lyon IM, et al.Indications, methods, and outcomesof percutaneous liver biopsy in England and Wales: an audit by the British Society ofGastroenterology and the Royal College of Physicians of London. Gut1995;36:437-441.
[65] Froehlich F, Lamy O, Fried M, Gonvers JJ. Practice and complications of liver biopsy.Results of a nationwide survey in Switzerland. Dig Dis Sci 1993;38(8):1480-1484.
Liver Biopsy - Indications, Procedures, Results20

[66] Chevallier P, Ruitort F, Denys A, et al. Influence of operator experience on perform‐ance of ultrasound-guided percutaneous liver biopsy. EurRadiol 2004;14:2086-2091.
[67] Vargas C, Jeffers LJ, Bernstein D, et al. Diagnostic laparoscopy: a 5-year experience ina hepatology training program. Am J Gastroenterol 1995;90:1258-1262.
[68] Hadbank K, Resterpo R, Ng V, et al. Combined sonographic and fluoroscopic guid‐ance during transjugular hepatic biopsies performed in children: a retrospectivestudy of 74 biopsies. Am J Roentgenol2003;180:1393-1398.
[69] Maharaj B, Maharaj RJ, Leary WP, et al. Sampling variability and its influence on thediagnostic yield of percutaneous needle biopsy of the liver. Lancet 1986;1:523-525.
[70] Pagliaro L, Rinaldi F, Craxi A, et al. Percutaneous blind biopsy versus laparoscopywith guided biopsy in diagnosis of cirrhosis. A prospective, randomized trial. DigDis Sci 1983;28:39-43.
[71] Poniachik J, Bernstein DE, Reddy KR, et al. The role of laparoscopy in the diagnosisof cirrhosis. GastrointestEndosc 1996;43:568-71.
[72] Colloredo G, Guido M, Sonzogni A, et al. Impact of liver biopsy size on histologicalevaluation of chronic viral hepatitis: the smaller the sample, the milder the disease. JHepatol.2003;39:239-244.
[73] Rocken C, Meier H, Klauck S, et al. Large-needle biopsy versus thin-needle biopsy indiagnostic pathology of liver diseases. Liver 2001;21:391-397.
[74] Siddique I, El-Naga HA, Madda JP, et al. Sampling variability on percutaneous liverbiopsy in patients with chronic hepatitis C virus infection. Scand J Gastroenterol2003;38:427-432.
[75] Guido M, Rugge M. Liver biopsy sampling in chronic viral hepatitis. Semin Liver Dis2004;24:89-97.
[76] Bedossa P, Dargere D, Paradis V. Sampling variability of liver fibrosis in chronic hep‐atitis C. Hepatology 2003;38:1449-1457.
[77] Scheuer PJ. LB size matters in chronic hepatitis: bigger is better. Hepatology2003;38:1356-1358.
[78] Rousselet MC, Michalak S, Dupre F, et al. Sources of variability in histological scor‐ing of chronic viral hepatitis. Hepatology 2005;41:257-264.
[79] Crawford JM. Evidence-based interpretation of liver biopsies. Lab Invest2006;86:326-334.
[80] Knodell RG, Ishak KG, Black WC, et al. Formulation and application of a numericalscoring system for assessing histological activity in asymptomatic chronic active hep‐atitis. Hepatology 1981;1:431-435.
[81] Ishak K, Baptista A, Bianchi L, et al. Histological grading and staging of chronic hep‐atitis. J Hepatol 1995;22:696-699.
Liver Biopsy: An Overviewhttp://dx.doi.org/10.5772/52616
21

[82] Kleiner DE, Brunt EM, Van Natta M, et al. Design and validation of a histologicalscoring system for nonalcoholic fatty liver disease. Hepatology 2005;41:1313-1321.
[83] Bedossa P, Poynard T. An algorithm for the grading of activity in chronic hepatitis C.The METAVIR Cooperative Study Group. Hepatology 1996;24:289-293.
[84] Sandrin L, Fourquet B, Hasquenoph JM, et al. Transient elastography: a new nonin‐vasive method for assessment of hepatic fibrosis. Ultrasound Med Biol2003;29(12):1705-1713.
Liver Biopsy - Indications, Procedures, Results22

Chapter 2
Types of Liver Biopsy
Nobumi Tagaya, Nana Makino, Kazuyuki Saito,Takashi Okuyama, Yoshitake Sugamata andMasatoshi Oya
Additional information is available at the end of the chapter
http://dx.doi.org/10.5772/52914
1. Introduction
Liver biopsy (LB) is an important procedure in the diagnosis and treatment of liver diseases.However, procedures for performing LB vary amongst institutions, and no universal guide‐lines exist. LB is performed for two main reasons: diagnosis of a liver condition itself, and asan adjunct to an existing surgical procedure. Recently, it has become possible to employboth approaches with minimal invasiveness using the transjugular route or under the guid‐ance of ultrasound, computed tomography, or laparoscopic and endoscopic ultrasound.Techniques for liver tissue sampling include percutaneous liver biopsy [1-6], transjugularliver biopsy [7-14], laparoscopic liver biopsy [15], and transgastric liver biopsy [16-20]. Thischapter introduces these techniques and evaluates their outcomes.
2. Percutaneous Liver Biopsy (PLB)
PLB is performed either blind or under imaging guidance. In the latter context, ultrasound(US) or computed tomographic (CT) guidance is used. Although these results of US-guidedPLB depend greatly on the skills of the gastroenterologist, hepatologist or radiologist andthe technical capabilities and quality of the US instrument, the available data indicate that ithas a lower complication rate, requires a lower number of passes, is associated with lesspain and pain-related morbidity, has a lower likelihood of the need for a repeat procedure,affords better-quality tissue specimens, and has only a marginally increased cost in compari‐son with blind PLB [21].
© 2012 Tagaya et al.; licensee InTech. This is an open access article distributed under the terms of the CreativeCommons Attribution License (http://creativecommons.org/licenses/by/3.0), which permits unrestricted use,distribution, and reproduction in any medium, provided the original work is properly cited.

PLB under image guidance essentially eliminates the risk of pneumothorax, or injury to thegallbladder or other viscera because the needle track is directly visualize of organ. Pain isthe commonest complication, and up to 75% of patients suffer some discomfort after LB [21].However, complications after PLB require careful observation. Piccinino et al. [22] reportedthat 61% of such complications appeared in the first 2 hours after the biopsy, 82% in the first10 hours, and 96% in the first 24 hours. Strict observation is therefore required for the first 24hours after PLB. Several large studies have shown rates of major complication after PLBranging from 0.09% to 2.3%, severe complications in 0.57%, and mortality ranging from0.03% to 0.11% [23-25]. Hardman et al. [4] reported one patient with graft vs. host diseaseand hypertension who died after PLB. This patient had multi-organ system failure at thetime of biopsy and died within 24 hours of the biopsy. Furthermore, the complications ofPLB seem to be related to the type of technique employed. In fact, the complications associ‐ated with US-guided PLB are significantly lower than those associated with blind PLB: 0.5%vs. 2.2% for severe complications [26], 2% vs. 4% [27] and 1.8% vs. 7.7% [28] for total compli‐cations. PLB under US guidance is recommended as a reasonable and cost-efficient proce‐dure [1, 26, 28]. However, EI-Shabrawi et al. [5] have reported that blind PLB performed bythe Menghini aspiration technique is safe even in infants and small children without mortal‐ity or major complications such as bile leakage, pneumothorax, and bleeding requiringblood transfusion. Szymczak et al. [6] also reported the safety and effectiveness of blind PLBbased on an analysis of 1412 procedures, and showed that the rates of complications andfailure were dependent on the experience of the operator. Moreover, the needle used wasthe Menghini-type suction needle, which carries a smaller risk of bleeding than cutting nee‐dles such as the widely employed Tru-cut needle. They concluded that the risk of complica‐tions and failure rate are low if the indications and contraindications are consideredcarefully and the biopsy is performed by a skilled and experienced operator.
Furthermore, with regard to bleeding after PLB, Alotaibi et al. [3] have reported that a posi‐tive color Doppler sign in US indicates bleeding along the biopsy tract, and that US-guidedcompression is effective for achieving appropriate hemostasis. Also, tract-plugging of the bi‐opsy tract with Gelfoam or other thrombotic agents, is an important procedure for reducingthe risk of bleeding and subcapsular hematoma in PLB [2]. Nevertheless, in patients with as‐cites or abnormal coagulation profiles, another procedure should be considered because ofthe high risk of possible bleeding complications.
3. Transjugular Liver Biopsy (TJLB)
TJLB was initially introduced in dogs as an experimental application by Dotter [29]. Rosch[7, 8] then reported its clinical application for transjugular cholangiography in 1973 and1975. TJLB eliminates the need to traverse the peritoneal cavity and puncture the liver cap‐sule. Furthermore, this technique is a safer biopsy option for patients with massive ascites,coagulopathy (prothrombin time greater than 3 seconds over the control value), thrombocy‐topenia (less then 60,000/cm3), or those undergoing ancillary procedures such as measure‐ment of pressures or opacification of the hepatic vein and inferior vena cava. It can also be
Liver Biopsy – Indications, Procedures, Results24

applied for patients in whom PLB has failed, or those with morbid obesity, a small cirrhoticliver, suspected vascular tumor or peliosis hepatitis, or medical conditions associated withbleeding disorders such as hemophilia for whom PLB is contraindicated [11, 30, 31], as anybleeding is returned to the venous system rather than leaking into the abdomen.
However, there are several particular complications associated with TJLB, including hemor‐rhage, subcapsular or neck hematoma and ventricular arrhythmia. The rate of such compli‐cations ranges from 0% to 20% [11]. Hardman et al. [4] reported a large subcapsularhematoma caused by TJLB requiring embolization and prolonged admission. Lebrec et al.[9] also reported a fatal case of intraperitoneal hemorrhage due to perforation of the livercapsule caused by excessive of the needle. Therefore, such forward rotation must be avoidedor carefully limited. Furthermore, there have been several direct instances of perforation ofthe liver capsule that resulted in aspiration of ascitic fluid, bile from the gallbladder, or renaltissue in patients with a small cirrhotic liver. In such patients, TJLB should be avoided oremployed only with caution by advancing the needle into the liver parenchyma by only 1cm instead of the usual 2 cm, or contrast medium should be injected after the biopsy to eval‐uate the integrity of liver capsule. The major drawback of TJLB is the size of the biopsyspecimens obtained; they are generally smaller (p <0.001) and more fragmented (p <0.01)than those obtained by PLB [12]. Pathologically, in terms of the number of portal tracts (p<0.0001) and the utility of specimens for histological evaluation (p <0.05), the quality of TJLBsamples appears to be significantly lower compared than those of PLB and LLB specimens[14]. With regard to technical success rate, that of TJLB (82%: 84/102) is significantly lower(P=0.005) than PLB (100%: 100/100) or LLB (99%: 111/112) [14]. However, Bull et al. [10] re‐ported a success rate of 97% (188/197) in 1983, and a recent meta-analysis including morethan 7500 cases revealed a technical success rate of 96.8% [13]. These reports suggest thatthere is no significant difference between TJLB and others techniques in terms of successrate. The most common reason for failure was inability to catheterize the right hepatic vein.In actual practice, TJLB requires a longer procedure time (40 min) than PLB. A few deathsafter TJLB have been reported, with a mortality rate of 0-0.5% [10, 32, 33]; mortality was dueto hemorrhage from the liver or ventricular arrhythmia.
Therefore, TJLB should be attempted only by a skilled interventional radiologist or physi‐cian experienced in catheterization and cannulation of the internal jugular vein due to itsmore time-consuming nature, use of intravenous contrast, and the need for a dedicated fluo‐roscopy suite. In fact, TJLB can be valuable in cases for which PLB is hazardous, or whenpressure measurement or venography is also required [34]. Despite the smaller biopsy sam‐ples obtained, the impact of TJLB on clinical decision-making appears to be comparable tothat of PLB and LLB. In particular, it may help to determine the need for liver transplanta‐tion in patients with acute liver failure.
4. Laparoscopic Liver Biopsy (LLB)
There are several approaches for LLB, including PLB under laparoscopic observation, LBthrough an additional port under laparoscopic observation, or LB combined with another
Types of Liver Biopsyhttp://dx.doi.org/10.5772/52914
25
laparoscopic procedure. LLB allows direct observation of the biopsy site and yields withmacroscopic information about the liver surface. This facilitates an adequate sample volumeto be obtained, including wedge resection, without sampling error, and also allows laparo‐scopic confirmation of hemostasis. These are the advantages of LLB in comparison withPLB. If bleeding from the biopsy site persists, compression or coagulation can easily be ap‐plied using several types of special forceps.
However, LLB requires general anesthesia and specialized equipment, including insuffla‐tion devices and laparoscopic instruments. On the other hand, PLB under laparoscopic ob‐servation can be done under local anesthesia using pneumoperitoneum under sedationusing midazolam and disoprivan, or under general anesthesia using an abdominal wall liftmethod [15]. For laparoscopy, pneumoperitoneum is created by N2O insufflation via a Ver‐ess needle, generally inserted to the left of the umbilicus. A second port is added on theright side by inserting a trocar. A 16-gauge True-cut needle is inserted and biopsy samplesof the liver can be taken from the left and right lobes under laparoscopic guidance. The bi‐opsy sites can be prophylactically coagulated. Beckmann et al. [14] reported that the compli‐cations observed after LLB were bleeding and bile leakage, and that the complication rate(2.7%) was roughly equal to that of PLB (3%) and TJLB (2.9%).
In general, LLB requires a long set-up time for starting the procedure, gas insufflation to cre‐ate an adequate operative field, preparation of several laparoscopic instruments, and an op‐erating theater. LLB is the most appropriate method for patients who need both apathological diagnosis of liver dysfunction or tumor and laparoscopic procedures for intra-abdominal diseases.
5. Transgastric Liver Biopsy (TGLB)
For TGLB, Hollerbach et al. [17] have reported an endoscopic ultrasound-guided fine-needleaspiration biopsy procedure for liver lesions. This method is one of several transgastric ap‐proaches and can be an alternative to PLB, particularly for patients with a risk of bleeding orsmall lesions in the liver, although targeting may be limited according to tumor location.
Recently, natural orifice translumenal endoscopic surgery (NOTES) has been introduced,creating no skin scars and involving only minimal invasiveness. NOTES has created a newaccess route (via the stomach) to the peritoneal cavity. TGLB using NOTES creates no dam‐age to the outside of the body and allows direct observation of the biopsy site inside thebody, unlike PLB or TJLB. In an experimental study, Mintz et al. [35, 36] reported successfulLB using a hybrid technique that included standard laparoscope vision and surgical endos‐copy. As outlined in a white paper from the American Society for Gastrointestinal Endos‐copy and Society of American Gastrointestinal and Endoscopic Surgeons [37, 38], for clinicalapplication of NOTES, it is necessary to establish safe access to the peritoneal cavity, com‐plete closure of the access route, prevention of infection, correct intra-abdominal orientation,development of a multitasking platform, methods for management of accidental complica‐tions, awareness of unanticipated physiologic events, and training in the technique. In par‐
Liver Biopsy – Indications, Procedures, Results26

ticular, infection or bacterial contamination in the abdomen due to opening of the digestivetract is a great concern in NOTES. However, no studies have quantified the bacteriologicalload to which the peritoneum is exposed during transgastric procedures [19]. Steele et al.[20] reported a pilot feasibility study of transgastric peritoneoscopy and liver biopsy duringlaparoscopic Roux-en-Y gastric bypass. LB was performed from segment II, III or IVb of theliver to obtain tissue samples adequate for histologic examination. None of patients exhibit‐ed any signs or symptoms of intra-abdominal or trocar wound infection after the procedure.
For TGLB [39], under general anesthesia a forward-viewing, double-channel endoscope isadvanced into the stomach. Puncture of the gastric wall is performed with a 3-mm cutting-wire needle knife. The puncture site is enlarged to 8mm with a balloon dilator and then theendoscope is advanced into the peritoneal cavity. The peritoneal cavity is then inflated withair through the endoscope. The liver is easily visualized by retroflexion of the endoscope. LBis performed using routine biopsy forceps from the edge of the liver (segment III) (Fig. 1),and hemostasis of the biopsy site is achieved by electrocautery with biopsy forceps (Fig. 2).The gastric artificial orifice is then closed using endoscopic clips.
Figure 1. Liver biopsy was performed using routine biopsy forceps from the edge of the liver.
Transgastric peritoneoscopy developed by Kalloo et al. [16, 18] showed no association withserious infection or other complications in the peritoneal cavity during long- term observa‐tion. Furthermore, Hazey et al. [40] reported that although contamination of the peritonealcavity was observed during laparoscopic Roux-en-Y gastric bypass, no clinically significantepisode, such as abscess formation or infectious complications, occurred. From these find‐
Types of Liver Biopsyhttp://dx.doi.org/10.5772/52914
27

ings, although peroral TGLB requires the creation of an artificial injury in a normal organ, itwill likely become a widely used alternative to other LB methods.
Figure 2. Hemostasis was confirmed at the site of liver biopsy.
6. Conclusion
In conclusion, TGLB is technically feasible and has the potential to become an alternative toroutine liver biopsy. The transgastric endoscopic approach has a wide range of diagnosticand therapeutic applications.
Author details
Nobumi Tagaya*, Nana Makino, Kazuyuki Saito, Takashi Okuyama,Yoshitake Sugamata and Masatoshi Oya
*Address all correspondence to: [email protected]
Department of Surgery, Dokkyo Medical University Koshigaya Hospital, Koshigaya, Saita‐ma, Japan
Liver Biopsy – Indications, Procedures, Results28

References
[1] Lindor KD et al. (1996). The role of ultrasonography and automatic-needle biopsy inoutpatient percutaneous liver biopsy. Hepatology 23: 1079-1983.
[2] Sporea I et al. (2008). Why, who and how should perform liver biopsy in chronic liv‐er disease. World J Gastroenterol 14: 3396-3402.
[3] Alotaibi M et al. (2010). The positive color Doppler sign post biopsy: effectiveness ofUS-directed compression in achieving hemostasis. Pediatr Radiol [DOI 10.1007/s00247-010-1848-7].
[4] Hardman RL et al. (2010). Single-institution results of image-guided nonplugged per‐cutaneous versus transjugular liver biopsy. Cardiovasc Intervent Radiol [DOI10.1007/s00270-010-9924-9].
[5] EI-Shabrawi et al. (2012). Outpatient blind percutaneous liver biopsy in infants andchildren: Is it safe? Saudi J Gastroenterol 18 (1): 26-33.
[6] Szymczak A et al. (2012). Safety and effectiveness of blind percutaneous liver biopsy:Analysis of 1412 procedures. Hepat Mon 2012: 32-37. [DOI: 10.5812/kowsar.1735143X.810].
[7] Rosch J et al. (1973). Transjugular approach to liver biopsy and transhepatic cholan‐giography. N Engl J Med 289: 227-231.
[8] Rosch J et al. (1975). Transjugular approach to the liver, biliary system, and portal cir‐culation. Am J Roentgenol Radium Ther Nucl Med 125 (3): 602-608.
[9] Lebrec D et al. (1987). Transvenous (transjugular) liver biopsy. An experience basedon 100 biopsies. Am J Dig Dis 23 (4): 302-304.
[10] Bull HJM, et al. (1983). Experience with transjugular liver biopsy. Gut 24: 1057-1060.
[11] McAfee JH et al. (1992). Transjugular liver biopsy. Hepatology 15 (4): 726-732.
[12] Meng HC et al. (1994). Transjugular liver biopsy: comparison with percutaneous liv‐er biopsy. J Gastroenterol Hepatol 9 (5): 457-461.
[13] Keshava SN, et al. (2008) Transjugular liver biopsy: What to do and what not to do.Ind J Radiol Imaging 18: 245-248.
[14] Beckmann MG, et al. (2009). Clinical relevance of transjugular liver biopsy in com‐parison with percutaneous and laparoscopic liver biopsy. Gastroenterol Res Pract[DOI: 10.1155/2009/947014].
[15] Chiesa OA, et al. (2009). Isobaric (gasless) laparoscopic liver and kidney biopsy instanding steers. Can J Vet Res 73 (1): 42-48.
Types of Liver Biopsyhttp://dx.doi.org/10.5772/52914
29

[16] Kalloo AN et al. (2000). Flexible transgastric peritoneoscopy: a novel approach to di‐agnostic and therapeutic interventions in the peritoneal cavity [abstract]. Gastroen‐terology, 118, pp.A1039.
[17] Hollerbach S, et al. (2003). Endoscopic ultrasound-guided fine–needle aspiration bi‐opsy of the liver: histological and cytological assessment. Endoscopy 35 (9): 743-749.
[18] Kalloo AN et al. (2004). Flexible transgastric peritoneoscopy: a novel approach to di‐agnostic and therapeutic interventions in the peritoneal cavity. Gastrointest Endosc60 (1): 114-117.
[19] Babatin MA et al. (2007). NOTES: Evolving trends in endoscopic surgery. Saudi JGastroenterol 13 (4): 207-210.
[20] Steele K et al. (2008). Flexible transgastric peritoneoscopy and liver biopsy: a feasibili‐ty study in human beings (with video). Gastrointest Endosc 68 (1): 61-66.
[21] Vijayaraghavan GR et al. (2011). Imaging-guided parenchymal liver biopsy: How wedo it. J Clin Imaging Sci [DOI: 10.4103/2156-7514.82082].
[22] Piccinino F et al. (1986). Complications following percutaneous liver biopsy. A multi‐centre retrospective study on 68,276 biopsies. J Hepatol 2: 165-173.
[23] Poynard T et al. (2000). Appropriateness of liver biopsy. Can J Gastroenterol 14: 543–548.
[24] McGill DB et al. (1990). A 21-year experience with major hemorrhage after percutane‐ous liver biopsy. Gastroenterology 99: 1396–1400.
[25] Cadranel JF et al. (2000). Practices of liver biopsy in France: results of a prospectivenationwide survey. For the Group of Epidemiology of the French Association for theStudy of the Liver (AFEF). Hepatology 32: 477-481.
[26] Pasha T et al. (1998). Cost-effectiveness of ultrasound-guided liver biopsy. Hepatolo‐gy 27: 1220-1226.
[27] Younossi ZM et al. (1998). Ultrasound-guided liver biopsy for parenchymal liver dis‐ease: an economic analysis. Dig Dis Sci 43: 46-50.
[28] Farrell RJ et al. (1999). Guided versus blind liver biopsy for chronic hepatitis C; clini‐cal benefits and costs. J Hepatol 30: 580-587.
[29] Dotter CT. (1964) Catheter biopsy: experimental technique for transvenous liver bi‐opsy. Radiology 82: 312-314.
[30] Bravo AA et al. (2001). Liver biopsy. N Engl J Med 344: 495-500.
[31] Rockey D et al. (2009). American Association for the Study of Liver Diseases. Liverbiopsy. Hepatology 49: 1017-1044.
[32] Colapinto RF. (1985). Transjugular biopsy of the liver. Clin Gastroenterol 14 (2):451-467.
Liver Biopsy – Indications, Procedures, Results30
[33] Kalambokis G et al. (2007). Transjugular liver biopsy-indications, adequacy, qualityof specimens, and complications: A systematic review. J Hepatol 47: 284-294.
[34] Gilmore IT, et al. (1977). Transjugular liver biopsy. Br Med J 9: 100-101.
[35] Mintz Y et al. (2007). NOTES: The hybrid technique. J Laparoendosc Adv Surg Tech17: 402-406.
[36] Mintz Y et al. (2008). NOTES: A review of the technical problems encountered andtheir solutions. J Laparoendosc Adv Surg Tech18: 583-587.
[37] ASGE & SAGES. (2006). ASGE/SAGES working group on natural orifice translume‐nal endoscopic surgery: White paper October 2005. Gastrointest Endosc 63: 199-203.
[38] Rattner D & Kalloo A: ASGE/SAGES Working Group. (2006). ASGE/SAGES workinggroup on natural orifice translumenal endoscopic surgery. October 2005. Surg En‐dosc 20: 329-33.
[39] Tagaya N, et al. (2010). Transgastric liver biopsy using the NOTES technique: an ani‐mal study. In Tech-Open Access Publisher, Inc., Liver Biopsy. Part 1, Chapter 11, pp171-178.
[40] Hazey JW et al. (2008). Natural-orifice transgastric endoscopic peritoneoscopy in hu‐mans: Initial clinical trial. Surg Endosc 22: 16-20.
Types of Liver Biopsyhttp://dx.doi.org/10.5772/52914
31


Chapter 3
Rethinking the Role ofLiver Biopsy in the Era of Personalized Medicine
Teresa Casanovas Taltavull
Additional information is available at the end of the chapter
http://dx.doi.org/10.5772/53120
1. Introduction
Indications and methods of liver biopsy have changed over the past few years [1]. However,an histological diagnosis may be needed for optimal management of a patient [2, 3].
Although modern biochemical, immunological, and radiographic techniques have facilitat‐ed the diagnosis and management of liver diseases they have not made liver biopsy obso‐lete. Clinicians rely on information derived from the liver biopsy to inform patients and tomake their therapeutic options [4].
There are, however, many controversies surrounding liver biopsy resulting potential limita‐tions, such as sampling errors and interobserver variations [5], which can lead to misclassifi‐cation therefore, P. Bedossa et al. consider that when it comes to liver biopsy the term ‘‘best”standard is more appropriate than ‘‘gold” standard [6].
It is essential, when analysing the indications, contraindications, complications and other as‐pects of the liver biopsy, to consider present hepatology and personalized medicine.
Practiced since the late 19th century, liver biopsy remains the criterion standard in theevaluation of the etiology and extent of disease of the liver. Paul Ehrlich performed a per‐cutaneous liver biopsy in Germany in 1883. [7]. Since then, this method has been im‐proved with the introduction of different needle types for cutting and aspiration. But,until the 1950s, when Menghini developed an aspiration technique which led to a wideruse of the procedure and broadened its applications, it was not common. While in the ear‐ly 1960 and 1970s the liver biopsy was used for making a diagnosis in cases of suspectedmedical liver disease, today it is more often performed to assess the prognosis or evaluatetherapeutic strategies [1].
© 2012 Casanovas Taltavull; licensee InTech. This is an open access article distributed under the terms of theCreative Commons Attribution License (http://creativecommons.org/licenses/by/3.0), which permitsunrestricted use, distribution, and reproduction in any medium, provided the original work is properly cited.

With regards to the technique used to carry out the liver biopsy there has also been a majorchange, it used to be performed blindly by clinicians, specialists in gastroenterology or hep‐atology at the patient’s bed whereas at present, percutaneous biopsies are performed pri‐marily by radiologists.
Currently, a liver biopsy can be obtained either transvenously or transcutaneously, or bycombining imaging modalities such as ultrasound, computed tomography, and laparosco‐py. The choice of one technique over another is based on availability, personal preference,and the clinical situation.
Liver biopsy techniques: Percutaneous, transjugular or laparoscopic
• Percutaneous liver biopsy can be transthoracic, with an intercostal liver access or subcos‐tal, when the patient has an enlarged liver extending below the costal margin. Clinicianshave now discarded blind liver biopsies in favour of ultrasound-guided biopsies.
• Transjugular or transvenous liver biopsy was first described in 1964. It is a technique usedin order to avoid percutaneous liver biopsy in patients who are at a higher risk of bleed‐ing. However, it has its limitations and is considered an inferior biopsy due to the frag‐mentation of the obtained specimen, which may reduce the accuracy of the diagnosis. It isperformed in a vascular catheterisation laboratory by a radiologist with special training ininterventional radiology. Videofluoroscopy equipment and cardiac monitoring are man‐datory due to the risk of cardiac arrhythmia as the catheter passes through the right at‐rium. With this method, hepatic venography, wedged hepatic venous pressure, cavalpressure and atrial pressure measurements can also be obtained during the procedure.The most frequent indications for the transjugular route are: severe coagulopathy, ascites,obesity, suspected vascular tumour or peliosis hepatis.
• Laparoscopic liver biopsy. This technique is well established and its use varies betweencenters. It is indicated in centers where access to transvenous liver biopsy is not available,and in patients with focal liver lesions and coagulopathy for whom obtaining histology isessential for their management.
The decision to use a particular technique is based on the risk profile of the patient. If he orshe has advanced liver failure with coagulopathy and ascites, liver biopsy is unnecessary,but the diagnosis of the underlying disease is crucial in specific circumstances in order todetermine a therapy, for example in cases of liver transplant. Before a liver biopsy it is nec‐essary to carry out an ultrasound to quantify vascular permeability and because it may ruleout anatomical abnormalities and can identify mass lesions that are clinically silent. Whencirrhosis is suspected on clinical grounds, or by non-invasive methods liver biopsy is usual‐ly avoided.
2. Contraindications to percutaneous liver biopsy
Absolute contraindications: the main contraindication to percutaneous liver biopsy issignificant coagulopathy, others are: uncooperative patient, history of unexplained bleed‐
Liver Biopsy – Indications, Procedures, Results34

ing, prothrombin time 3–5 seconds more than control, platelet count less than 50,000/mm3, the use of a non-steroidal anti-inflammatory drugs, (unless discontinued 7 to 10days previously), blood for transfusion unavailable, suspected hemangioma, another vas‐cular tumor or echinococcal cysts in the liver, and the inability to identify an appropriatesite for biopsy.
Relative contraindications: Morbid obesity, ascites, hemophilia, infection in the right pleu‐ral cavity or below the right hemidiaphragm.
Accepted indications: Given the new developments that have proved the efficacy of liverbiopsy, its role in the management of patients with chronic liver diseases has much evolvedin recent years and will continue to evolve as new non invasive technologies are developed.
• Diagnosis
1. Many parenchimal liver diseases
2. Abnormal liver tests
3. Fever of unknown origin
4. Focal or diffuse abnormalities on imaging studies
• Prognosis-Staging of known parenchimal disease
• Management –Developing treatment plans based on histologic analysis
Contraindications for percutaneous liver biopsy
• Absolute: uncooperative patient, severe coagulopathy, infection of the hepatic bed, extrahepatic biliary obstruction.
• Relative: ascites, morbid obesity, possible vascular lesions, amyloidosis, hydatid disease.
Table 1. Indications and contraindications for liver biopsy
Its importance in diagnosis, staging and prognosis largely depends on the indication and theclinical question relying on an answer from the histological result.
2.1. Is liver biopsy always necessary?
The utility of routine liver biopsy has been the subject of debate in recent years. Due to liverbiopsy being associated with a small but definite risk, a biopsy should only be performedwhen the findings contribute to a better management of the patient. It is argued that for thepurposes of management, liver biopsy is neither needed in cases with advanced fibrosis northose diagnosed with cirrhosis by other methods, nor in patients with mild disease, forwhom a therapeutic decision is not urgent. Until recently, liver biopsy played a key role inthe evaluation of chronic liver disease, but now in the presence of better diagnostic tests ondisease etiologies and treatments its role has to be re-evaluated. Recognition and confirma‐tion of the pattern of injury (chronic hepatitic, chronic cholestatic, steatohepatitic, etc.) is thepathologist's priority when evaluating the liver biopsy.
Rethinking the Role of Liver Biopsy in the Era of Personalized Medicinehttp://dx.doi.org/10.5772/53120
35

Moreover, liver biopsy provides information on the severity and distribution of lesions (co‐dified in the staging and grading of chronic liver disease), the presence of confounding pat‐terns of injury (such as steatohepatitis coexisting with chronic viral hepatitis), and thepresence of additional findings such as steatosis or iron accumulation that may have prog‐nostic or therapeutic relevance.
2.2. Who should be biopsied?
As a rule patients with standard clinical and radiological features are not biopsied. Howev‐er, in the presence of non concordant or atypical results, a biopsy may be recommended.The decision whether to perform a liver biopsy in some patients is clear, however in caseswith a suspected concomitant diagnosis or when results from other methods are non conclu‐sive confirmation is needed [8,9].
Type of Injury Causes
Fatty change Ethanol, fatty liver disease, obesity, diabetes, drugs
Councilman bodies Viral hepatitis, drugs, toxins, ischemia (acidophilic bodies)
Mallory bodies * (hyaline)
(see pages: 13, 15, 17 and 18)
Ethanol, obesity, diabetes, drugs, Wilson disease, biliary
tract disease, hepatocellular carcinoma
Hydropic change (ballooning degeneration) Viral hepatitis, drugs, cholestasis, fatty liver disease
Cholestasis Duct obstruction or injury, drugs, viral hepatitis
Interlobular duct injury Primary biliary cirrhosis, primary sclerosing cholangitis,
hepatitis C
Piecemeal necrosis Viral hepatitis, primary biliary cirrhosis, drugs, Wilson
disease
Increased iron stores Hemochromatosis, transfusions, hemolysis
Granulomas**
(see pages: 19, 20 and 21)
Sarcoid, infections (tuberculosis, fungi), drugs
Table 2. Patterns of liver cell injury found in liver biopsies and clinical differential diagnosis
3. The generally accepted indications of liver biopsy are the following
• Diagnosis for a better scoring of grading and staging of chronic viral hepatitis C or hepati‐tis B, alcoholic liver disease, non-alcoholic steato-hepatitis, or autoimmune hepatitis.
• In patients with raised ferritine for the diagnosis of hemochromatosis
• If there are suspected disorders of cupper metabolism for the diagnosis of Wilson’s dis‐ease, with quantitative estimation of copper in liver tissue.
• Evaluation of possible autoimmune hepatitis
Liver Biopsy – Indications, Procedures, Results36

• In cholestatic liver diseases: primary biliary cirrhosis, primary sclerosing cholangitis andoverlap syndromes.
• Evaluation of abnormal results of biochemical tests of the liver in association with a sero‐logic workup that is negative or inconclusive
• Evaluation of the efficacy or the adverse effects of treatment regimens (e.g.,methotrexatetherapy for psoriasis).
• Alcohol related disease. Non-alcoholic fatty liver disease (NAFLD) or Non-alcoholic stea‐tohepatitis (NASH).
• Diagnosis of a liver mass, in selected cases, when image tests are inconclusive.
• Evaluation of fever of unknown origin, with an eventual culture of liver tissue.
• Evaluation of the status of the liver post transplantation or of the donor liver pre trans‐plantation.
4. Methods: How to handle a liver biopsy
Liver samples should be fixed in 10% neutral buffered formalin because this enables all rou‐tine histochemical and immunohistochemical staining to be carried out. A small portion ofthe sample could be snap-frozen for adjunctive molecular studies for diagnostic or researchpurposes, particularly when multiple etiologies are clinically suspected.
As for stains, a good collagen stain to assess fibrosis is mandatory. Perls’ stain for iron is rec‐ommended and the Periodic Acid-Schiff (PAS) stain with and without diastase digestion isuseful for assessing hepatocyte cytoplasm glucogen content.
Special stains for special circumstances are ordered if indicated by the clinical situation. Forinstance, the Ziehl-Nielsen is ordered for mycobacteria, and Grocott’s silver methanaminestain is used when granulomas are observed or when fungi infection is suspected. The Con‐go Red stain is requested when amyloid is suspected to be present Rhodamine stain, Victo‐ria blue or orcein stain is used to detect copper deposition when there is clinical suspicion ofWilson’s disease. Immunohistochemistry is used to confirm the presence of Hepatitis B sur‐face antigen and Hepatitis B core antigen [10].
Cultures could be indicated in selected cases such as Mycobacterias [11].
5. Histologic diagnosis and clinical correlation
The pathological report that used to be too descriptive now has to include etiology, aspectsrelated to prognosis and possible therapy [12,13].
In order to promote the clinico-pathological diagnostic correlation with the intention of im‐proving communication and clarifying individual cases, regular meetings between clinicians
Rethinking the Role of Liver Biopsy in the Era of Personalized Medicinehttp://dx.doi.org/10.5772/53120
37

and pathologists are necessary. It is not only important to hold formal conferences but also toincrease daily exchanges. To facilitate the communication between pathologists, radiologists,surgeons and clinicians it is desirable, when feasible, for the same teams to work together.
6. Writing the histology report
In order to produce a clinically relevant liver histology report pathologists should follow theinternationally accepted guidelines.
1. The adequacy of the biopsy should be assessed by measuring the length of the speci‐men and counting the number of portal tracts. The data should be written up in the fi‐nal report to make clinicians aware of any potential sampling error in the grading andstaging. To reduce sampling error the amount of tissue required is usually 1 to 4 cmlong and needs to include at least four portal tracts.
2. The type and severity of necroinflammation and fibrosis should be described in words.By only using numbers to report the presence or not of bridging necrosis for example,some clinically useful information might be omitted. A validated scoring system shouldbe used for grade of activity and stage of fibrosis.
3. As well as being described, the existence of adjunt data should be scored subjectively,such as steatosis graded on a scale of 0-3 and siderosis graded on a scale of 0-4.
4. Other diagnostic criteria may be useful in differential diagnoses:
• Differentiating viral hepatitis from other chronic disorders, such as cell dysplasia andthus separately reporting the presence of cell changes.
• Using immunostaining when appropriate, for example Hepatitis B Virus antigens[14].
• Searching for any concomitant diseases.
5. Chronic viral hepatitis, primary biliary cirrhosis and autoimmune hepatitis have typicalhistological lesions and it is advisable to consider the characteristics of: portal tract in‐flammation, interface hepatitis, lobular necrosis and bile duct damage, separately [15].
6. Concomitant histological features in liver specimens of hepatitis C cases: auto-immuni‐ty, co-infections, steatosis, hemosiderosis, malignancy –related changes, hepatitis due todrugs and/or vascular problems. Furthermore, biopsy frequently detects associated le‐sions such as steatosis or steatohepatitis providing information related to managementand prognosis of patients with chronic hepatitis C.
7. Finally the conclusions should be written in order to make the histological diagnosis,stating whether the pathological findings are consistent with chronic hepatitis or not,whether a specific viral etiology may be suspected or whether there are changes relatedto concomitant diseases, specifying which.
Liver Biopsy – Indications, Procedures, Results38

Chronic viral hepatitis Primary Biliary Cirrhosis (PBC) Autoimmune Hepatitis
Portal tract
inflammation
Mononuclear cells Mononuclear cells; eosinophils Mononuclear cells;
plasma cells
Interface hepatitis Common Common;ductular reaction
(i.e. biliary piecemeal necrosis)
Present
Lobular necrosis Variable degree usually focal Variable; usually mild and focal Severe, may be confluent
Bile duct damage Common in hepatitis C
(usually mild)
Duct destruction present May be present
Table 3. Specific features in liver biopsy differential diagnosis and pathological findings
7. Use of liver biopsy in clinical practice
Here we will discuss some of the most prominent findings of liver biopsy in the followingclinical settings:
a. Viral Hepatitis : Hepatitis B, Hepatitis C.
b. Metabolic diseases: Hemochromatosis, Porphyria, Wilson disease, Alpha 1- anti-trypsindisease.
c. Autoimmune and cholestatic diseases: Auto-Immune Hepatitis, Primary Biliary Cirrho‐sis (PBC), Primary Sclerosing Cholangitis (PSC), Overlap Syndrome.
d. Alcoholic liver disease
e. Non-alcoholic Fatty Liver Diseases and Non-Alcoholic Steato-Hepatitis (NAFLD andNASH). Liver steatosis.
f. Drug-Induced Liver Injury (DILI).
g. Infections and pyrexia of unknown origin.
h. Cirrhosis. Fibrosis progression.
i. Hepatocellular Carcinoma (HCC) and other benign or malignant focal lesions. The roleof the fine neddle aspiration biopsy (FNAB) and other imaging diagnostic tools.
j. New evolving fields for liver biopsy: Liver transplantation and living donors. Bonemarrow transplantation. Morbid obesity
7.1. Chronic viral hepatitis C and B
In the past the majority of liver biopsies were performed in chronic hepatitis C patients.However, recently this has changed, due to a better understanding of the etiology, patho‐genesis, the natural history of the disease and available therapies.
Rethinking the Role of Liver Biopsy in the Era of Personalized Medicinehttp://dx.doi.org/10.5772/53120
39
As the ability to treat hepatitis C effectively improves, the value of information gained from aliver biopsy decreases. The most effective therapy currently available, a combination of pegy‐lated interferon α and ribavirin, can induce sustained viral clearance, implying a definitivecure and improved long term prognosis. This occurs, after anti-viral treatment in up to 80% ofpatients infected with genotypes 2 and 3. In patients with genotype 1 receiving recently ap‐proved telaprevir and boceprevir, triple therapy constituents, an average of 70-75% can ach‐ieve sustained viral clearance. Due to the high percentage of positive response in persons withgenotypes 2 and 3, the need for a liver biopsy in such cases has been questioned.
The terminology used to assess the appearance of liver biopsies with chronic viral hepatitishas also evolved.
The first classification of chronic hepatitis based on histological criteria was published in1968. At that time, only three diseases causing chronic hepatitis could be diagnosed, hepati‐tis B, non A-non B (hepatitis C, since 1989) and autoimmune hepatitis. This classificationwhich also had prognostic implications only had two categories, namely "chronic persistenthepatitis" and "chronic active hepatitis". Three years later, the term chronic lobular hepatitiswas added to represent findings similar to those observed in acute hepatitis.
During the 1990s, there were great changes in the understanding of chronic viral hepatitisby pathologists and hepatologists. The new concepts recognized that the traditional catego‐rization of pathologic changes (chronic persistent hepatitis, chronic lobular hepatitis, andchronic active hepatitis) was inadequate for assessing histological changes during clinicaltrials. Pathologic processes were separated rather than considered as part of a continuum ofpathologic changes that occur in chronic hepatitis C. Pathologists introduced the idea ofstaging for fibrosis and grading for the inflammatory component to the pathological evalua‐tion of chronic hepatitis C.
7.1.1. Grading and staging of chronic hepatitis C Scoring Systems (Table 4) [16-20]
Grading is the assessment of the activity of a disease, which may increase and decrease as adisease flares and subsides, or may remain static throughout the disease.
Grade and stage evaluation is a standard part of the pathologic assessment of liver biopsies inchronic hepatitis. Pathological staging has focused on the assessment of fibrosis as the bestsurrogate marker of the disease process. Staging divides the fibrotic continuum into discretecategories and all of the existing staging systems have cirrhosis as their highest stage. Severalsystems exist for grading and staging of chronic hepatitis and all have been used effectively toassess changes in pathology following therapeutic intervention. These systems include themethods of Scheuer, Desmet, Batts and Ludwig,and the METAVIR system used to score indi‐vidual features of inflammation and fibrosis semi-quantitatively in clinical studies [14-20].
Steatosis and Steatohepatitis in chronic hepatitis C Steatosis in hepatitis C is mainly macro‐vesicular and a common finding in genotype 3 [21] it is also related to a high body mass in‐dex and older age. More recently, steatosis has been recognized as a feature worthy ofstudy, from an etiologic standpoint and especially in terms of its clinical significance. Esti‐mation of the degree of steatosis has been hampered by the lack of standard definitions and
Liver Biopsy – Indications, Procedures, Results40

breakpoints between grades. Although the intrinsic mechanism and involved factors for ac‐celerated fibrosis are unclear, steatosis has been associated with increased inflammation,hepatocellular apoptosis and the presence of perisinusoidal fibrosis [22].
Utility of biopsy in hepatitis C. Nowadays, the majority of Hepatitis C patients can be man‐aged without having to undergo a liver biopsy since liver biopsy rarely identifies unsuspect‐ed etiology and hepatitis C diagnosis relies on blood antibody and HCV RNAdeterminations. However, a biopsy allows to identify patients most in need of therapy or tofind clinically unsuspected cirrhosis, which when found it is necessary to screen for varicesand hepatocellular carcinoma.
Moreover clinical and laboratory surrogates for biopsy may be useful in identifying cirrho‐sis and biopsy is not necessary if clinical, image and analytical data concur. Post-treatmentbiopsy is not needed, nevertheless a new liver biopsy, could be performed if new treatmentsor clinical trials arrive in order to stratify patients by prognosis.
Fibrosis stage Knodell et al.
1981 [16]
Scheuer, 1991
[17]
METAVIR, 1994
[18]
Batts and
Ludwig, 1995
[19]
Ishak et al. 1995 [20]
0 No Fibrosis No Fibrosis No Fibrosis No Fibrosis No Fibrosis
1 Fibrous portal
expansion
Enlarged fibrotic
portal tracts
Portal fibrosis Fibrous expansion of
some portal areas, with or
without short fibrous
septa
2 Periportal or
portal-portal
septa but intact
architecture
Enlargement of
portal tracts
Periportal
fibrosis
Fibrous expansion of
most portal areas, with or
without short septa
3 Bridging
Fibrosis (portal-
portal or portal-
central linkage
Fibrosis with
architectural
distortion but no
obvious cirrhosis
Septal fibrosis Fibrous expansion of
most portal areas with
occasional portal to
portal bridging
4 Cirrhosis Probable or
definite cirrhosis
Cirrhosis Fibrous expansion of
portal areas with marked
bridging (portal to portal
as well as portal to
central)
5 Marked bridging with
occasional nodules
(incomplete cirrhosis)
6 Cirrhosis probable or
definite
Table 4. Comparison of commonly used scoring systems for fibrosis staging in chronic Hepatitis C
Rethinking the Role of Liver Biopsy in the Era of Personalized Medicinehttp://dx.doi.org/10.5772/53120
41

7.1.2. Natural history
The degree of inflammation, fibrosis stage, and steatosis seen on liver biopsy are key histo‐logical predictors of progression to cirrhosis. (Table 5) (see page 28).
Based on retrospective data, it has been shown that most patients with moderate inflamma‐tion on initial liver biopsy developed cirrhosis after 20 years, and nearly all patients with se‐vere inflammation or bridging fibrosis developed cirrhosis in 10 years. Patients with mildinflammation and/or minimal fibrosis have a low risk of progression to cirrhosis. Hepaticsteatosis is also an emerging risk factor for fibrosis progression in hepatitis C [22]. Clinicalinformation may help to refine prognosis, but cannot substitute the valuable information ob‐tained from a liver biopsy. Poynard’s group showed three clinical factors which are inde‐pendently associated with faster progression of fibrosis: male, aged over 40 at the time ofinfection, and having a daily alcohol consumption of 50 grams or more [23]. Other factorspredicting progression to cirrhosis include immunosuppression and co-infection with hepa‐titis B or HIV [24].
Utility of biopsy in hepatitis B Liver biopsy is not mandatory but may show moderate orsevere inflammation which is why before starting antivirals, usually for a long period, ourprotocol is to perform a liver biopsy and to individualize the therapeutic decision [25]. It hasbeen proved that long-term therapy may improve histology but the role of serial liver biop‐sies has yet to be established outside of clinical trials. Fibroscan has yet to be validated forpatients with chronic hepatitis B but research on this is ongoing [26].
It is important to identify cirrhosis to indicate anti-hepatitis B therapy and hepatocellularcarcinoma screening is also recommended for all hepatitis B surface antigen-positive(HBsAg+) patients, cirrhotic or not. New guidelines on anti-HBV treatment say that it is ad‐visable to treat patients with elevated DNA-HBV and minimally elevated or fluctuating ala‐nine aminotransferase (ALT), [27, 28].
Features typical of chronic viral hepatitis inflammation, like fibrosis, is considered to be oneof the key characteristics of chronic viral hepatitis. It is a chronic necroinflammatory processin which hepatocytes are preferentially injured compared with bile ducts. The grade of in‐flammation is a stratification of the overall necroinflammatory changes into mild, moderate,and marked categories. Unlike the fibrosis systems, which are based on distinctive architec‐tural changes that can be highlighted with special stains, assessment of inflammation ismore subjective and hence shows more interobserver variations. Usually varying degrees ofportal and periportal inflammation(with lymphocytes, plasma cells, and macrophages), lo‐bulillar hepatitis, and fibrosis are to be individually considered and scored.
Interface hepatitis occurs when the inflammatory infiltrate crosses the limiting plate; it isusually associated with local hepatocyte damage, piecemeal necrosis, and inflammation.
Lobular inflammation is accompanied by some hepatocellular necrosis (acidophilic orCouncilman bodies). Chronic hepatitis leads to progressive fibrosis and, without treat‐ment, to cirrhosis. The fibrosis begins in portal areas, extends to periportal areas, bridg‐ing also other portal tracts and central veins. Histopathological findings in the liver
Liver Biopsy – Indications, Procedures, Results42

biopsy that help to predict etiology chronic hepatitis B may show some of the changesdescribed previously, as well as a ground-glass change to the cell cytoplasm. Thischange reflects accumulation of hepatitis B surface antigen within the endoplasmic retic‐ulum of the hepatocytes [29].
Chronic hepatitis C may be associated with prominent lymphoid aggregates within portaltracts, sometimes including germinal centers and, occasionally, bile duct damage, althoughnot to the degree seen in line primary biliary disorders. In addition, biopsies may show fo‐cal, nonzonal macrovesicular steatosis [30].
Patterns of liver cell injury found in liver biopsy and differential diagnosis. Chronic viralhepatitis have no unique histopathologic features, it is therefore necessary to consider vari‐ous causes. In addition to viral infection, chronic hepatitis may be autoimmune or drug re‐lated. Histological features of chronic cholestatic disease, including PBC, primary sclerosingcholangitis (PSC), autoimmune cholangitis, as well as metabolic diseases including Wilsondisease and α1-antitrypsin deficiency, may overlap with some of the findings with “socalled” chronic hepatitis.
7.2. Metabolic liver diseases
Many rare diseases originate in the liver, either affecting the liver directly or causing extra-hepatic disease [31]. For example, liver histology is usually normal in primary hyperoxaluriawhile the kidneys and other organs may be irreparably damaged; however, cure is only pos‐sible with a liver transplant. In other inherited disorders, the liver disease may remainasymptomatic until precipitous acute liver failure develops; the classic example is Wilsondisease. Here we present the diseases most frequently observed in adult patients.
7.2.1. Hematochromatosis: The role of liver biopsy in the diagnosis of hepatic iron overload in the eraof genetic testing [32]
Hemochromatosis is an autosomal recessive disorder that leads to massive deposits of ironin many organs, including liver, pancreas, heart, joints, and skin. The gene responsible forhereditary hemochromatosis, HFE, is located on chromosome 6. The two most common mu‐tations are C282Y (present in up to 80% of cases) and H63D. The defining characteristic ofthis disease is the failure to prevent unneeded iron from entering the circulatory pool as aresult of genetic changes compromising the synthesis or activity of hepcidin, the iron hor‐mone.Hemochromatosis results from the interaction between genetic and acquired factors.Depending on the underlying mutation, the coinheritance of modifier genes, the presence ofnongenetic hepcidin inhibitors, and other host-related factors, clinical manifestation mayvary from simple biochemical abnormalities to severe multiorgan disease [33]. The indica‐tion of a liver biopsy in the era of genetic testing is being questioned. But, in our opinion,liver biopsy continues to play an important role in the diagnosis, prognosis and manage‐ment of patients with elevated serum ferritin and abnormal liver function test results in gen‐eral hepatology practice. Genetic tests for HFE mutations (C282Y, H63D) and liver biopsiesare complementary in the workup of these patients.
Rethinking the Role of Liver Biopsy in the Era of Personalized Medicinehttp://dx.doi.org/10.5772/53120
43

Liver biopsy allows a quantitative iron concentration study and the identification of thegrade of hepatic iron overload, localization pattern and associated liver pathology for diag‐nosis and management of patients [34].
Liver biopsies may be relatively normal or show bridging fibrosis or even micronodular cir‐rhosis. Untreated, hemochromatosis leads to the development of micronodular cirrhosis.Prior to the availability of genetic testing, the diagnosis of hemochromatosis was always de‐termined with liver biopsy and quantitation of tissue iron. With the availability of genetictesting for the C282Y and/or H63D mutations, liver biopsy is more often reserved for evalu‐ation of clinical status or complications (i.e. degree of fibrosis, development of hepatocellu‐lar carcinoma) rather than for primary diagnosis [35]. A biopsy can also help determine ifother disease processes are present, such as hepatitis C or fatty liver disease [36].
We suggest that patients with suspected hemochromatosis undergo genetic testing for theC282Y and H63D mutations, especially if they have a family history of hemochromatosis,inorder to establish the genotype of the patient and permit genetic counseling. A liver biopsymay not be necessary in young C282Y homozygotes or in heterozygotes without evidence ofliver disease.
Disorders that have to be considered in the clinical differential diagnosis of hemochromatosis
The list of disorders associated with increased hepatic iron is long. The majority of patientswith hepatic iron accumulation from any cause do not have hepatic iron concentration (HIC)that is above the upper limit of normal (approximately 1100 mg/µg dry liver weight). Fur‐thermore the pattern of distribution of the iron in the liver may be of some help in establish‐ing the diagnosis [37]:
• predominantly hepatocellular distribution of iron leads to a diagnosis of genetic hemo‐chromatosis, alcoholic liver disease and/or porphyria cutanea tarda.
• predominant presence of iron in Kupffer cells, may be the result of multiple transfusionsand/or hemolytic anemias.
• a mixed distribution of iron may be a sign of megaloblastic anemia or anemia secondaryto chronic infection.
7.2.2. Porphyria Cutanea Tarda (PCT)
It is the most common form of porphyria across the world. PCT is usually an acquired liverdisease caused by exogenous factors, such as excess alcohol intake, iron overload, chronichepatitis C and oestrogen therapy.
The pathogenesis of PCT is varied; it may be hereditary or acquired, leading to hepatic ironloading and to an increase of oxidative stress. Iron loading is usually only mild or moderatein degree. However, in patients with excessive alcohol intake and/or chronic hepatitis C in‐fection, hepcidin production by hepatocytes decreases. This decrease is responsible for in‐creased iron absorption from the gut. The important role that PCT often plays in thehepatitis C virus setting has recently been emphasized [38].
Liver Biopsy – Indications, Procedures, Results44

7.2.3. The role of liver biopsy in determining the diagnosis of Wilson disease
Wilson disease is an autosomal recessive disorder of copper metabolism, characterized byexcessive accumulation of copper in the liver and other organs. Genetic evaluation is diffi‐cult because most patients are compound heterozygotes. For patients with Wilson diseasethe norm is to perform a liver biopsy with a quantitative copper testing of the liver; levelsare typically greater than 250 mg/g dry weight liver (normal level, 38 mg/g) [39].When thediagnosis of Wilson disease is considered prior to liver biopsy other tests are undertaken. -Serum ceruloplasmin (less than 20 mg/dL in patients with Wilson disease; normal levels, 23to 50 mg/dL). - 24-hour urinary copper (greater than 100 mg/dL; normal, less than 30 mg/dL). -Kayser-Flescher ring has to be studied by ophthalmologic testing. The liver biopsy inthis disease can present differently, depending on the patient’s age. In children and youngadolescents, the most common finding may be fatty change. In older adolescents and youngadults, a liver biopsy may show chronic hepatitis with piecemeal necrosis. Adults tend toshow cirrhosis, and Mallory bodies*. In adolescents or adults, confluent necrosis may lead toa severe hepatic failure that may require an urgent liver transplant [40].
7.2.4. Alfa1 -antitrypsin (A1-AT) deficiency on liver biopsy
A1-AT is the major circulating inhibitor of serine proteases (Pi). Its primary target is the po‐tent elastase found in polymorphonuclear cells (PMNs). It is a glycoprotein synthesized inthe liver. Many of the Pi variants are associated with fairly normal serum concentrations andfunction and thus are of little clinical significance. However, a few, result in low circulatinglevels of α1-AT (i.e., PiZZ) and are of pathologic significance. Liver biopsies from affectedpatients demonstrate classic PAS-positive, diastase-resistant globules within periportal hep‐atocytes. Portal fibrosis and chronic hepatitis may also be present. Liver cell dysplasia maybe seen, and patients older than 50, especially men, are at risk of developing hepatocellularcarcinoma. The presence of PAS-positive, diastase-resistant globules is not always diagnos‐tic for A1-AT deficiency because various inflammatory conditions may be associated withoverproduction of the enzyme, as is the case in cardiac congestion or hypoxia. For this rea‐son clinical correlation is required [41].
7.3. Autoimmune Hepatitis (AIH)
Autoimmune hepatitis (AIH) is an inflammatory condition of the liver that can affect pa‐tients of all ages, sexes, and races [42].
Timely diagnosis and immunosuppressive therapy may control disease activity in almost allaffected patients and various case series have reported near normal or normal life expectan‐cy in patients diagnosed and treated adequately [43]. Untreated AIH, however, has 5-yearmortality above 50%.
It was first described as a form of chronic hepatitis in young women, showing jaundice, ele‐vated gammaglobulins and amenorrhea, which eventually leads to cirrhosis. There is not asingle test to diagnose AIH but a set of diagnostic criteria has been suggested in order toclassify patients as having probable or definite AIH depending on a score.
Rethinking the Role of Liver Biopsy in the Era of Personalized Medicinehttp://dx.doi.org/10.5772/53120
45

Clinical appearance ranges from an absence of symptoms to a severe fulminant presenta‐tion. It is usually clinically associated with other autoimmune diseases such as rheumatoidarthritis, ulcerative colitis, autoimmune thyroiditis, or diabetes mellitus. A family historyhas been reported [44].
A liver biopsy should be obtained at first diagnosis before therapy for grading, staging andconfirmation of the diagnosis. Histological appearance is not characteristic, although typicalfeatures such as periportal hepatitis with lymphocytic infiltrates, plasma cells and piecemealnecrosis, with more advanced disease bridging necrosis, are frequent. Variable degrees ofportal fibrosis are present [45]. In non treated patients or in non-responsive to corticosteroidtherapy cirrhosis eventually occurs.
Differential diagnosis which has been revisited recently by the International AutoimmuneHepatitis Group comprises: chronic hepatitis not caused by other etiologies (viral, drug-in‐duced), acute hepatitis alone or acute hepatitis superimposed on underlying chronic liverdisease and autoimmune diseases with associated duct damage and duct loss [47].
Early diagnosis may be difficult because the clinical picture is heterogeneous and the liverhistology sometimes shows atypical features.
A simple and accurate diagnostic scoring system for AIH has been established but nottotally validated yet. In 1993, the International Autoimmune Hepatitis Group (IAIHG)proposed specific diagnostic criteria, which were revised in 1999. These criteria weremade by expert consensus and introduced to allow comparison of studies from differentcenters [46]. Some of the items were of questionable value which is why in 2008 theIAIHG published a new simplified scoring system for wider applicability in routine clini‐cal practice, based on the data of patients with well-established diagnoses and validatedin another group of patients [47].The new score includes autoantibodies, immunoglobu‐lin G, histology, and exclusion of viral hepatitis, allowing a reliable diagnosis of AIH ap‐plying simple scores.
7.3.1. Primary Biliary Cirrhosis (PBC)
PBC is a chronic progressive cholestatic liver disease that occurs in middle-aged patients,usually women, and is often associated with other autoimmune diseases. Patients maypresent with jaundice and pruritus in advanced cases. Laboratory testing reveals serum an‐ti–mitochondrial antibody (AMA) as well as increased alkaline phosphatase, bilirubin, andγ-glutamyl transpeptidase [48]. The histological staging of PBC considers the degree of bileduct damage and fibrosis [49].
- Stage 1 early disease is characterized by damage to septal and larger interlobular bileducts, reflected by biliary epithelial damage with infiltration of the duct by lymphocytes,plasma cells, eosinophils, and rare polymorphs. The inflammatory infiltrate confined withinthe portal tract, may include granulomas and lymphoid follicles (florid duct lesion).
- Stage 2 the inflammatory process extends beyond the portal tract, and changes of interfacehepatitis (piecemeal necrosis) may be seen. Bile ducts begin to disappear and proliferation of
Liver Biopsy – Indications, Procedures, Results46
bile ductules (cholangioles) may also be present along the edges of the portal tracts. Thesechanges are associated with features of chronic cholestasis, including feathery degenerationwithin the cytoplasm of hepatocytes, accumulation of bile pigment, periportal accumulationof copper (not generalized as in Wilson disease), and, occasionally, Mallory bodies*.
- Stage 3 is associated with increasing fibrosis and bridging between portal areas, with de‐creased amounts of inflammation.
- Stage 4 represents biliary cirrhosis, usually micronodular. In the past the diagnosis wasdone in very advanced disease, biliary cirrhosis, hence its name.
7.3.2. Primary Sclerosing Cholangitis (PSC)
Primary sclerosing cholangitis (PSC) is a disease with a variable clinical course, with obliter‐ation of the biliary tree that leads to biliary cirrhosis and its complications such as portal hy‐pertension and liver failure. The term “primary” is used to distinguish this condition fromthe bile duct strictures that are secondary to bile duct injury, cholelithiasis or ischaemia [50].
Patients may present with increased alkaline phosphatase and positive perinuclear anti‐neutrophil cytoplasmic antibodies (pANCAs). In this disease, liver biopsy does not havea crucial role in the diagnosis. Ultrasound is used for the initial investigation and mayshow bile duct dilatation and liver and splenic changes; however, it is unspecific forPSC. [51,52]. The classic lesion of PSC in the histological study is onionskin or concentricperiductular fibrosis, with damage to the ductal epithelium, but it is rarely seen on per‐cutaneous biopsy. The most common findings on a biopsy in early-stage disease are non‐specific [46], fibrosis with inflammation of portal tracts and paucity of normal bile ducts.In addition, in patients with extrahepatic obstruction, proliferation and dilatation of inter‐lobular ducts and an increased number of periportal PMNs can be observed. Endoscopicretrograde cholangiopancreatography (ERCP) is the next choice test for diagnosis, but itis invasive, for this reason its role is under debate [53]. Transhepatic cholangiographycan be used if ERCP is unsuccessful, but again is invasive. Non-invasive alternatives toERCP are: magnetic resonance cholangiopancreatography (MRCP), which is increasinglyused and is useful for excluding other disease and evaluating the biliary system [54].Transient elastography (FibroScan®) has potential as a non-invasive method for detectionof cirrhosis in patients with more advanced liver disease [55].
PSC shares many clinical biochemical and pathologic features with primary biliary cirrhosis,although PSC, can affect both intrahepatic and extrahepatic ducts. PSC is strongly associatedwith inflammatory bowel disease, particularly ulcerative colitis. Due to its major morbidityand mortality the diagnosis has to be confirmed. At the time of diagnosis, PSC typically in‐volves both intra and extrahepatic bile ducts in the majority of cases. The most dismal se‐quel of PSC is the development of colangio carcinoma (CC) in 14% of patients (which maynot be demonstrable radiographically with the usual diagnostic methods) [56].
A wide spectrum of disease severity exists, ranging from patients who present with ad‐vanced liver disease requiring liver transplantation within a short time to those who remain
Rethinking the Role of Liver Biopsy in the Era of Personalized Medicinehttp://dx.doi.org/10.5772/53120
47

asymptomatic for decades. The natural course of PSC is determined by interindividual vari‐ability, the rate of progression and the development of CC, which can occur at any time.
The differential diagnosis has to be established among : autoimmune hepatitis, overlap syn‐dromes, infectious hepatitis, other bile duct diseases presenting as acute or chronic cholangi‐tis, and biliary strictures, cholangiocarcinoma, gallstones, hepatomegaly and primary biliarycirrhosis.
Liver biopsy in PSC is only needed to diagnose small-duct PSC or to exclude other diseasesthat may be associated with PSC or with similar features and confounding aspects. Liver bi‐opsy also may be useful for staging the disease. However, serial liver biopsy in monitoringthe disease is not indicated [57].
Recently some authors have developed the Mayo clinic risk score, a multivariate statisticalsurvival model, on the basis of the long-term course of the disease in 486 PSC patients seenat three centers in United States. In this score, the need for liver biopsy has been eliminated.This scoring system has its advantages; it is non-invasive and was found to be well correlat‐ed to actual survival. It also performs better than the Child-Pugh classification for cirrhosis,which does not predict survival with PSC [58].
7.3.3. Autoimmune Hepatitis (AIH) with overlap variants
Overlap syndromes of AIH are not uncommon but are not well defined. Histology, clinicaland serological indicators imply more than one liver disease at the same time.
The diagnosis of an overlap syndrome relies on the biochemical profile, either cholestatic orhepatitic in addition to the auto-antibodies pattern and elevated gamma globulins. The his‐topathology can show portal inflammation with or without involvement of bile ducts [59].
In adult patients with an overlap of PBC and AIH, which is the the most common, antinu‐clear as well as antimitochondrial antibodies are present. Chronic hepatitis C may triggerautoimmune activation, with concomitant positive autoimmune antibodies. AIH may be as‐sociated with Ig G4 autoimmune cholangitis (IAC). In contrast to PSC, IAC-IgG4, has no as‐sociated intestinal bowel disease and pancreatitis [60].
The value of a biopsy in liver diseases such as PSC or suspected metastatic disease, which ischaracterized by a zonal affection of the liver has to be dealt with individually and complet‐ed with other imaging techniques.
Liver biopsy is advisable if diagnostic tests show abnormal liver function results which maybe indicative of many etiologies e.g. nonalcoholic steatohepatitis with strongly elevated anti‐nuclear antibodies and abnormal iron studies, or co-infection with HIV and hepatitis C in apatient with abnormal liver function tests taking hepatotoxic drugs etc.
7.4. Alcohol: Fibrous progression related to alcohol injury
Many patients with ethanol injury show initial scarring around central veins with deli‐cate fibrosis along the sinusoids [61]. Eventually, bridging fibrosis connects central veins
Liver Biopsy – Indications, Procedures, Results48

and portal tracts. When cirrhosis is fully developed, most of the native central veinshave been obliterated. Alcoholic cirrhosis is micronodular and the scarring is relativelyuniform throughout the liver. With complete alcohol abstinence, the nodules can regener‐ate to a larger size, but the central veins are decreased in number and the nodules maylack some portal tracts [62].
7.5. Non-Alcoholic Fatty Liver Disease, (NAFLD) and Non-Alcoholic Steatohepatitis,(NASH)
The histological appearance in these disorders may be very similar to the injury related toalcohol. In non-alcoholic steatohepatitis, the liver exhibits fat and perivenular sinusoidal col‐lagen deposition and may be indistinguishable from alcoholic perivenular fibrosis on histo‐logical grounds alone. Clinical correlations are basic for its diagnosis [63].
Sometimes a biopsy shows a pattern which looks like alcoholic hepatitis, but the patient de‐nies alcohol use. A differential diagnosis for alcoholic hepatitis has to be done, and non-alco‐holic fatty liver disease, (NALDF) and non-alcoholic steatohepatitis, (NASH) should beconsidered [63].
For many decades, typical “alcoholic hepatitis” was often diagnosed with liver biopsy, andin some patients’ medical records were completed with somewhat judgmental commentsabout their persistent denial of alcohol intake. Now, there are other known causes for Mallo‐ry bodies (*) and steatosis found in liver biopsies which, in the past, were classified as alco‐hol related liver injury. In retrospect, we now know that many patients with “alcoholichepatitis” were treated unfairly [64].
It is clear that similar patterns of injury can be seen in non-alcoholics, especially in the set‐ting of diabetes and obesity, referred to as nonalcoholic steatohepatitis (NASH) or nonal‐coholic fatty liver disease (NAFLD). This represents a significant form of chronic liverdisease in both adults and children, with a spectrum ranging from indolent to end-stageliver disease. It may be an underlying cause of cryptogenic cirrhosis and has been report‐ed to recur after a liver transplant. Other conditions associated with NASH include acutestarvation, accelerated weight loss, intestinal bypass, disorders of lipid metabolism, andvarious drugs. Careful clinicopathologic correlation is required to determine the cause.Liver biopsy evaluation allows us to establish the degree of steatosis, inflammation, andfibrosis stage [65].
Liver steatosis
The diagnosis of liver steatosis has several implications in chronic liver diseases.
• Liver steatosis is associated with liver fibrosis progression and a decreased rate of sus‐tained viral response in chronic hepatitis C.
• Donor liver macrovesicular steatosis is independently associated with graft failure at oneyear after liver transplantation.
• After major hepatic resection, liver steatosis induces an increased risk of post-operativecomplications and elevated risk of death.
Rethinking the Role of Liver Biopsy in the Era of Personalized Medicinehttp://dx.doi.org/10.5772/53120
49

• Finally, liver steatosis is the main lesion observed in non-alcoholic fatty liver disease(NAFLD) which, as a consequence of the worldwide burden of visceral obesity, is now animportant cause of chronic liver disease in western countries.
At present, the histological examination of a liver biopsy continues to be the reference forevaluating liver steatosis despite its limitations. The procedure is invasive and impairedby sampling bias, which results in imperfect reproducibility and only allows for a semi-quantitative grading of steatosis [66]. The non-invasive diagnosis of liver steatosis is doneby imaging techniques and blood tests, but diagnostic accuracy remains to be validatedand their use in clinical practice has yet to be recommended. Ultrasonography is consid‐ered the imaging technique of choice for steatosis screening, but its sensitivity in detectingfatty liver is only 60–94% and is operator dependent. Other techniques, such as computedtomography, proton magnetic resonance spectroscopy and magnetic resonance imagingoffer high accuracy for quantification of liver fat but have low availability, high cost andlack standardization [67].
The diagnosis of hepatic steatosis and steatohepatitis or non-alcoholic steatohepatitis(NASH) is not yet possible without liver biopsy. Therapeutic targets of drug developmentare in early stages. As regards the study of factors most likely associated with disease pro‐gression, the National Institute of Diabetes and Digestive and Kidney Diseases (NIDDK) hassponsored the NASH Clinical Research Network (CRN) who has developed a histologicalscoring system, which is used for clinical trials for NASH [68].
The histological lesions for the diagnosis of NASH are: zone 3 macrosteatosis, hepatocyteballooning and mixed lobular inflammation. Other findings that are common include mild-moderate portal inflammation, acidophil bodies, glycogenated nuclei, lipogranulomas andperisinusoidal fibrosis. In addition, the following may be present: Mallory’s hyaline (*) inhepatocytes, megamitochondria and mild siderosis.
(*) Mallory bodies or Mallory’s hyaline are irregular, rope-like eosinophilic intracytoplasmicstrings that represent aggregates of cytokeratin filaments. The cytokeratins form a filamen‐tous support network within the hepatocytes. Cellular damage is due, for example, to etanolproducing hepatocyte ballooning degeneration, which can cause the keratins to misfold andaggregate. Mallory bodies may be found in alcoholic, nonalcoholic steatohepatitis, and Wil‐son disease, cholestatic conditions such as primary biliary cirrhosis (PBC) and with certaindrugs, such as amiodarone. Although the fat and neutrophils can resolve relatively quicklyafter alcohol abstinence, hyaline can take up to 6 weeks to disappear [69].
The histological severity of NAFLD is determined by the Non-alcoholic fatty liver diseaseActivity Score (NAS) and the Fibrosis Score, developed and validated by the CRN [68]. Thisscoring system is very useful for assessing change in clinical trials but it is not meant to re‐place a full interpretation of histological findings by a pathologist [70].
Some investigators have observed that there is significant sampling variability and thatthe histological lesions of NASH are unevenly distributed throughout the liver parenchy‐ma and can lead to substantial misdiagnosis and staging inaccuracies. For example, Rat‐ziu et al. reported that on 51 patients with NAFLD who underwent paired biopsies, the
Liver Biopsy – Indications, Procedures, Results50

discordance rate for steatosis would have been missed in 24% of cases if only one biopsyhad been done and a difference of one stage of fibrosis or more was seen in 41% ofpaired biopsies [71].
7.6. Liver injury caused by drugs
Drug and toxin induced liver injury is a common cause for abnormal liver tests in humans[72]. Liver injury related to drugs can be subdivided into intrinsic and idiosyncratic injury.Intrinsic injury is produced through direct or indirect mechanisms and idiosyncratic injurymay be mediated by hypersensitivity or by metabolic toxic metabolites [73].
Drug induced liver cell injuries have different morphological patterns such as, hepatocellu‐lar injury, cholestatic injury, bile duct injury, vascular injury, portal fibrosis, neoplasia ormiscellaneous (pigments and inclusions).
The list of implicated products is very long and in some cases mixed lesions can befound. Drug “signature” is a well-known concept which implies that the drugs responsi‐ble for the injury can be identified from the different lesions it causes to the liver. Forexample, diclofenac and minocyline produce a chronic hepatitis pattern, steatohepatitiscan be induced by amiodarone and tamoxifen, vascular toxicity may be associated withazathioprine etc. [74].
Histological changes that suggest drug- or toxin-related liver injury are atypical therefore, insome cases, depending on the findings, it is worth the pathologist asking the clinician specif‐ic questions in order to do a differential diagnosis and to identify the drug [75]:
Is the patient’s blood analysis compatible with hepatitis? Has viral injury been excluded?
• What are the patient’s toxic exposures at work, home, or play?
• Has every drug been sought and disclosed?
• Granulomas (**) may also be part of the inflammatory reaction in drug injury [76].
If granulomas have been found, have other causes of granulomas been excluded? (seebelow) [77]
If significant fatty change is found is there any possibility that it could be related to toxicethanol injury?
If an abundance of eosinophils is observed in a liver biopsy, a hypersensitivity reaction issuspected which may resemble viral hepatitis. Eosinophils may also be present nonspecifi‐cally in viral hepatitis, in connective tissue disorders, and in some neoplasms (usually inHodgkin’s disease infiltrates). However, when eosinophils are a striking feature, it is advisa‐ble that the clinician search for a drug, a toxin, or even a nutritional supplement (“naturalmedicines”).
If numerous liver cell mitotic figures show up in the liver biopsy, this may suggest that ashort episode of drug exposure is to blame.
Rethinking the Role of Liver Biopsy in the Era of Personalized Medicinehttp://dx.doi.org/10.5772/53120
51

7.6.1. Drug Induced Liver Injury (DILI) examples
The American Association of Reumatology has provided guidelines for monitoring pa‐tients receiving Methotrexate therapy as there is a known relation between this treatmentand hepatotoxicity [78].
A few years ago methotrexate was used for treating reumathoid arthritis. Now patients withpsoriasis are also treated with this drug, albeit at a lower dose. Many potentially hepatotoxicmedications, used in such cases are worth investigating [78].
Amoxi-clavulanic acid is one of the examples of a broadly used antibiotic which hasbeen implicated in liver toxicity. Typically the patient with this toxicity presents withjaundice. After excluding other causes, such as viral hepatitis, autoimmunity, or otheretiologies, and in presence of a normal biliary tree, a liver biopsy is recommended,which may show a cholestatic hepatitis pattern. After discontinuation of the drug theevolution is usually favourable [79].
7.6.2. Granulomas in liver biopsies
Granuloma is defined as an aggregate of histiocytes and can only be diagnosed through his‐topathological examination.
Causes of granulomas in the liver: most systemic granulomatous diseases involve the liverto some extent; tuberculosis and sarcoidosis are the most common causes [80]. Other infec‐tious agents include bacteria (brucellosis, nocardiosis, tularemia, Q fever [Coxiella burnetii],spirochetes), various fungi, protozoa, and viruses (cytomegalovirus, Epstein-Barr virus).Noninfectious causes in addition to sarcoidosis include PBC, drug reaction, extrahepatic in‐flammatory disease, such as chronic inflammatory bowel disease, rheumatoid arthritis), neo‐plasms (Hodgkin disease) and foreign substances (talc, mineral oil) .
7.6.3. Can negative stains for fungi and acid-fast bacilli exclude infection in patients with fever ofunknown origin?
Definitely not. Cultures for these organisms are more sensitive than special histologicalstains. If infection is a possibility, a core of liver should be submitted with sterile precautionsand without fixative to the microbiology laboratory. In addition, tissue in formalin shouldbe sent to the pathology laboratory for microscopic sections. A tissue sample may also besent for molecular analysis to determine whether an infectious agent is present, dependingon the possibilities [82, 83].
7.6.4. Different types of granulomas useful in determining specific diagnosis
• Epithelioid granulomas are nodular aggregates of plump macrophages, often associatedwith multinucleated giant cells, lymphocytes, and plasma cells. They are typically seen insarcoidosis. The presence of central caseating necrosis suggests tuberculosis.
• Fibrin-ring granulomas are formed by a fibrin band encircling a lipid droplet, with associ‐ated inflammation. They were first described with Q fever but may also be seen after in‐
Liver Biopsy – Indications, Procedures, Results52

fection with cytomegalovirus or Epstein-Barr virus as well as with drug (allopurinol)toxicity and in association with systemic lupus erythematosus.
• Lipogranulomas are composed of lipid deposits and vacuolated macrophages. They areformed in the presence of exogenous or endogenous fat accumulation.
• Microgranulomas may be a nonspecific finding, they are usually subtle and composed ofsmall, round clusters of plump Kupffer cells.
There are many causes of hepatic granulomas, including local irritants, infections, infesta‐tions and hypersensitivity to drugs. The constituents of these lesions, depending on the eti‐ology and inflammatory cytokines produced include large epithelioid cells, multinucleatedgiant cells, varied numbers of mononuclear cells and eosinophils. The causes vary in fre‐quency from one country to another. Although the etiology may be determined from thehistological features, from special stains for micro-organisms, from culture of part of the bi‐opsy specimen or polymerase chain reaction of the paraffin-embedded specimen, or fromclinical and serological data, the cause of hepatic granulomas remains unknown in one thirdof cases. It is likely that approximately one third of granulomatous liver reactions are causedby drugs, including allopurinol, carbamazepine, procainamide, diphenylhydantoin, quini‐dine, isoniazid, and sulphanilamide.
7.7. The role of liver biopsy in infections and pyrexia of unknown origin
Although the usefulness of liver biopsy in the diagnosis of fever of unknown origin is stillcontroversial, a review of the literature shows that liver biopsy can be effective in confirm‐ing histopathological diagnosis and microbiological analysis [83].
Based on the findings of a liver biopsy evaluating Fever of Unknown Origin (FUO), we canconclude that abnormal liver biopsy is helpful in determining the cause of the FUO. Themost common cause of fever was of an infectious origin. Other causes were neoplastic disor‐ders or inflammatory [87].
Liver biopsy was performed after routine studies were negative. Therefore results such ashistoplasmosis and tuberculosis indicate that, despite advances in diagnostic technology,liver biopsy continues to be useful in the diagnosis of FUO. In endemic areas, histoplasmosisand tuberculosis should be considered in the differential diagnosis of FUO [85].
7.8. Cirrhosis
Cirrhosis is pathologically defined as a diffuse process in which the normal anatomical lo‐bules are replaced by architecturally abnormal nodules separated by fibrous tissue. There‐fore, focal scarring, even if significant and associated with nodules, is not cirrhosis becausethe process is not diffuse [86]. In the past the description of a liver as “cirrhotic” implied anominous prognosis in a patient with liver disease. In chronic hepatitis, the most importantgoal is to delay or to stop the development of cirrhosis. Nowadays, treatments to prevent itsprogression are available. At present there are many known stages as opposed to before
Rethinking the Role of Liver Biopsy in the Era of Personalized Medicinehttp://dx.doi.org/10.5772/53120
53
when there only one was considered, G Garcia-Tsao in the article “In search of a pathophy‐siological classification of cirrhosis.” [86].
7.8.1. Fibrosis progression
One of the most crucial developments is the reformulation of the concept of cirrhosis from astatic to a dynamic process. This concept is likely to be even better defined in the future.
As fibrotic scars advance and extend the normal architecture changes and nodules areformed [88]. Moreover, the angiogenic process that naturally accompanies scar formationpermits the creation of abnormal channels between central hepatic veins and portal ves‐sels, resulting in the shunting of blood around the regenerating parenchyma. Normalvascular structures, along with sinusoidal channels, may be obliterated, leading to portalhypertension. Some authors describe cirrhosis as a vascular disease [89]. Clinical conse‐quences of cirrhosis result from the decreased ability of the parenchyma to synthesizeclotting factors and other substances combined with the complications related to portalhypertension [90].
Knowledge on the level of fibrotic progression between normal histology to cirrhosis hasconsiderable prognostic weight. Patients with bridging fibrosis on biopsy are much closer toend-stage liver disease than those with minimal or no fibrosis. Fibrosis is not an autono‐mous feature, but rather a tissue progressive lesion resulting from other pathologic mecha‐nisms such as inflammatory, degenerative or dystrophic processes [91].
The first transition in this process occurs between the normal, non-fibrotic state and the ex‐pansion of the portal area by fibrosis, to the extension of short, incomplete septationsaround the portal area, change that gives to the portal areas an irregular stellate shape.
In the next transition, development of bridges between vascular structures, portal-portalbridging fibrosis and portal-central bridging, occur. Gradually, more and more bridges areformed, accompanied by distortion of the architecture due to hepatocellular regenerationand contraction of fibrotic scars. When these changes diffusely involve the biopsy, it is clas‐sified as cirrhosis [92].
Progressive fibrosis leads to cirrhosis and it is now known that cirrhosis can be reversible.There was a lot of controversy surrounding this issue a few years ago [93]. For patients in aprecirrhotic stage of fibrosis, liver biopsy remains the gold standard of assessment. Prior to1995, there was no published system which subdivided advanced stages of cirrhosis. Onlythe Ishak modification of the Histologic Activity Index (HAI) subdivided cirrhosis into threecategories [94].
Nowadays, since Garcia-Tsao et al.reported compensated and decompensated phases in theclinical evolution of liver cirrhosis, many prophylactic measures and controls have been im‐plemented in order to improve survival and quality of life [87]. Cirrhosis is usually clinicallyevident. Once the pathologic stage of cirrhosis has been reached, clinical scales such as theChild-Pugh score have to be used because they represent the prognosis and the staging of
Liver Biopsy – Indications, Procedures, Results54

the liver disease better [95]. The present debate questioning the need for liver biopsy versusnon invasive tests will be discussed below.
7.8.2. A needle biopsy specimen does not always permit the diagnosis of cirrhosis
Micronodular cirrhosis (nodules of 3 mm or less), which may develop as a result of ethanolinjury, biliary tract disease, or hemochromatosis, is usually uniform throughout the liver,and nodules may be identified on a needle specimen. However, macronodular cirrhosis(nodules greater than 3 mm), due most commonly to chronic viral hepatitis, constitutes aless uniform pattern [96].
7.9. Hepatocellular Carcinoma (HCC) and other benign or malignant focal lesions: Therole of Fine Needle Aspiration Biopsy (FNAB) [97]
Indications of liver biopsy with regards to diffused or local lesions
Liver biopsy is useful for diagnosis of a diffused disease and guided liver biopsy remainsessential for the diagnosis of localized lesions.
7.9.1. Fine needle aspiration biopsy (FNAB)
This technique has a crucial role in the evaluation of focal liver lesions or localized lesions.Liver tumors appear as nodular or localized lesions which can be malignant or non-malig‐nant and can be either primary from the liver or metastasic. If clinical, biochemical and radi‐ologic findings are inconclusive, some phases of the diagnostic process may require a liverbiopsy in order to establish the diagnosis and their staging and management [99].
Malignant lesions. Hepatocellular carcinoma (HCC), the most frequent malignant livercancer, is usually discovered during screening programs in cirrhotic patients. Regardingtreatment, the only curative option is surgery, both limited hepatectomy of the tumor or liv‐er transplant in very select cases [100].
In liver lesions with typically recognized features of HCC, defined by using advanced radio‐logical methods, liver biopsy has no place. However, a liver biopsy will be performed in pa‐tients with atypical liver tumors suggestive of a possible colangiocarcinoma. These casesrequire another form of therapy and the prognosis is worse [99].
Besides, when surgery is indicated in a patient with suspected liver cirrhosis, a liver biopsyhas to be performed in the non-neoplasic liver. Pathological diagnosis may help to asses thefunctional capacity, specific prognosis and whether surgery could be performed.
Metastasis of the liver with an unknown primary tumor should be biopsied to obtain infor‐mation of the primary tumor in order to determine therapy.
Concern has been expressed about the risk of spreading malignant cells via the needle tract,but this rarely occurs when using needles with a diameter of less than 1.3 mm, which alsominimizes the risk of bleeding. The procedure is simple, safe and painless [101].
Rethinking the Role of Liver Biopsy in the Era of Personalized Medicinehttp://dx.doi.org/10.5772/53120
55

7.9.2. Non-malignant lesions
In cases of Hemangioma or Focal Nodular Hyperplasia (FNH), diagnosed and confirmed byradiology, biopsy is usually not necessary.
FNH and hepatic adenoma are benign tumors and are less frequently observed than HCC.Their diagnosis is done using imaging techniques (ultrasound or helicoidal scanner). How‐ever, differential diagnosis is necessary because, although FNH only requires radiologicalfollow-up, in some cases, higher risk circumstances have been recognized and surgery isrecommended [102].
7.9.3. Most prevalent mass lesions [102, 103]
• Benign: cysts, hemangioma, adenoma, liver abscess (amebic or pyogenic), focal nodularhyperplasia, fatty infiltration, rare primary liver neoplasms.
• Malignant: hepatocellular carcinoma, cholangiocarcinoma, metastatic, rare primary liverneoplasms, rare primary bile duct neoplasms.
7.10. New evolving fields for liver biopsy: Liver transplantation, Bone marrowtransplantation, Living donors and Morbid obesity
7.10.1. Liver transplantation
With regards to liver transplantation, liver biopsy remains very useful in the management oftransplanted patients. In this clinical situation, if a rejection is suspected and other complica‐tions have been ruled out, a guided biopsy will be performed. This procedure can be ofgreat value in order to confirm the specific diagnosis and to indicate treatment [104].
In the first few weeks and months after transplantation, the major causes of abnormal livertests include preservation injury, acute rejection, opportunistic infections (e.g., cytomegalo‐virus, hepatitis), vascular compromise, and/or biliary stricture. Of these, acute allograft re‐jection is the most common and results from direct alloantigenic stimulation of recipient Tcells by donor dendritic cells (antigen-presenting cells). The effector T cells can then prefer‐entially injure biliary epithelial cells of both interlobular and septal bile ducts as well as en‐dothelial cells of intrahepatic arteries and veins.
The main histological features of acute rejection Acute rejection is characterized by an infiltrationof mixed, predominantly mononuclear cells within portal tracts. The inflammatory infil‐trates include lymphocytes, macrophages, plasma cells, polymorphonuclear neutrophils andeosinophils. The inflammatory cells typically infiltrate the bile duct epithelium and are asso‐ciated with bile duct damage. Subendothelial inflammation (endothelialitis), which may in‐volve both portal and central veins, is also a typical feature. The most common gradingsystem is the Banff schema, a consensus document proposed by an international panel ofpathologists and liver transplant physicians [105]. Criteria helping to distinguish recurrenthepatitis C after transplantation from allograft rejection; Hepatitis C (HCV) recurs in virtual‐ly all patients transplanted for that disease.
Liver Biopsy – Indications, Procedures, Results56

Distinguishing recurrent hepatitis from acute allograft rejection, which can overlap, is diffi‐cult. There are usually three main phases to recurrent HCV:
• Graft reinfection (from 0 to 3 months post-transplant). HCV-related inflammation is rare‐ly seen at this time. Liver biopsies may show mild lobular disarray, few necrotic hepato‐cytes (acidophil bodies), and fatty change.
• Established graft infection (from 3 to 6 months), acute hepatitis including ballooning de‐generation of hepatocytes, acidophil bodes, and Kupffer cell prominence can be observed.Varying degrees of portal tract inflammation may also be present.
• Progressive liver damage (after 6 months), features related to chronic HCV infection suchas, mononuclear portal infiltrates and interface hepatitis are observed. Bile duct damage,although mild, may occur, and granulomas may be detected. Up to half of patients willhave histological evidence after 1 year.
The role of liver biopsy in the evaluation of abnormal liver tests after the first year post transplanta‐tion Common causes after the first year include acute rejection, opportunistic infection, re‐current viral hepatitis, chronic rejection, steatohepatitis, or recurrent diseases. Chronicrejection occurs as a consequence of repeated episodes of acute rejection that are unrespon‐sive to immunosuppression. The main histological abnormalities are loss of small bile ducts(ductopenic rejection) and/or obliterative vasculopathy (affecting large and medium-sizedarteries). Unlike acute allograft rejection, the degree of bile duct damage is typically out ofproportion to the degree of inflammation.
Complications of liver transplantation are not limited to acute and chronic rejection and re‐currence of original disease, but include surgical complications, most commonly hepatic ar‐tery occlusion, infections, and development of de novo malignancies. In the early posttransplantation period preservation injury, damage to the graft during harvesting and im‐plantation, may lead to significant graft dysfunction. In post-perfusion biopsies, heavy neu‐trophilic infiltrate and hepatocyte necrosis may be predictive of initial poor graft function.
Ischemic complications, such as hepatic artery thrombosis, are one of the most serious com‐plications and may lead to early graft loss or biliary stricture. In these patients liver biopsy isusually not performed.
Infectious complications that generally occur after transplantation, cytomegalovirus(CMV)for example, remains common and is frequently associated with parenchymal microabscess‐es which are found in the liver biopsy of CMV patients.
7.10.2. Bone marrow transplantation
A liver biopsy is effective in the evaluation of a bone marrow transplant recipient with ele‐vated liver tests [106]. Known complications of bone marrow transplantation include veno-occlusive disease (VOD) and graft-versus-host disease (GVHD). A biopsy is necessary todiagnose VOD. It develops within 1 to 4 weeks after transplantation and is characterized byocclusion of central veins, sinusoidal fibrosis, and pericentral hepatocyte necrosis. AcuteGVHD develops within 6 weeks after transplantation and affects the skin, gastrointestinal
Rethinking the Role of Liver Biopsy in the Era of Personalized Medicinehttp://dx.doi.org/10.5772/53120
57

tract, and liver. It is characterized by degenerative bile duct lesions with some degree ofmononuclear inflammation. Cholestasis may be present. Chronic GVHD is a multiorganprocess that develops 80 to 400 days after transplantation and is often preceded by acuteGVHD. The changes in the liver are similar to those in acute disease, but the ducts showmore prominent changes and are likely to be reduced in number or destroyed. A prominentperiportal mononuclear infiltrate, or even piecemeal necrosis, may be seen.
7.10.3. Liver transplant living donor
Liver biopsies detect silent donor disease in potential living liver donors, especially patientssuffering subclinical non-alcoholic fatty liver disease (NAFLD). The contribution of liver bi‐opsy or even the need to perform this, when a potential donor is being evaluated is a contro‐versial issue [107]. In the University of Pittsburgh Medical Center a retrospective study of thehistopathologic examination and diagnoses of 284 patients, who were evaluated as living do‐nors from 2001 to 2005 was carried out. Hepatic histology was correlated with liver injurytests and with demographic characteristics in an otherwise normal healthy population. A mi‐nority (n=119; 42%) of biopsies from this population of 143 males/141 females (averageage=36.8years; mean BMI=26.6) were completely normal. The remainder showed steatosis(n=107; 37%), steatohepatitis (n=44; 15%), or unexplained low-grade/early stage chronic hepa‐titis, primary biliary cirrhosis, or nodular regenerative hyperplasia (n=16; 6%). Biopsy find‐ings disqualified 29/56 donors, negative factors were: obesity, age and liver iron content,contributing to NAFLD pathogenesis. The conclusion was that liver biopsy provides valuableinformation about otherwise undetectable liver disease in potential liver donors.
7.10.4. Morbid obesity
About 90 per cent of morbidly obese patients show histological abnormalities of the liver.Morbid obesity may lead to severe disease showing steatosis, ballooning degeneration,lobular inflammation and fibrosis in the study of liver biopsy. These features are similarto the lesions observed in alcoholic hepatitis and may end in cirrhosis and liver failure.Many factors such as, alcohol, drugs, diabetes, viruses, can contribute to progressive liverdamage. The development of severe fatty liver disease may be asymptomatic showing apoor correlation with liver function tests. It has been reported that after bypass surgery,weight loss is accompanied by improvement in fatty change and the liver function testsare normal.
Histopathologic findings in the liver of 160 patients who were undergoing laparoscopic gas‐tric bypass or gastric banding for morbid obesity, were recorded, also clinical data (gender,age, BMI and associated diseases) and laboratory evaluation were obtained [108].The diag‐nosis obtained were : 63 non-nonalcoholic steatohepatitis (non-NASH), 54 NASH, 26 chronichepatitis B (CHB), 15 alcoholic steatohepatitis and NASH, and 2 chronic hepatitis C(CHC).The coexistence of clinical and histological features of steatohepatitis with anotherchronic liver disease may reflect the biological significance of the chronic inflammatory con‐dition in the obese population, which requires further investigation.
Liver Biopsy – Indications, Procedures, Results58

8. Non-invasive tests for liver disease and assessment of fibrosis andcirrhosis
Limitations of biopsy have led clinical investigators to study alternative methods to in‐vestigate liver disease especially for the assessment of liver fibrosis. Since fibrosis is ofsufficient importance in chronic liver disease and because it progresses to cirrhosis it isfrequently used as the outcome and prognostic variable in clinical studies. Hepatic fib‐rosis is currently viewed as a dynamic process that may regress after successful treat‐ment of chronic liver diseases. Serum markers, such as non-invasive markers, offer anattractive alternative. They are objective, allowing a dynamic calibration of fibrosis, canbe performed repeatedly, are more cost effective and many of them are performed as aroutine analysis [109].
Indirect markers of liver fibrosis: among them, the AST to Platelet Ratio Index (APRI),combines aspartate amiotransferase (AST) with platelet count. It was used in severalstudies conducted in cohorts of patients with hepatitis C and showed a rather good di‐agnostic performance and reproducibility, [110] particularly for cirrhosis. Forns and col‐leagues reported a fibrosis index (Forns’ index) based on platelet count, γ-glutamyltransferase (GGT), and cholesterol levels [111]. It is rather good for excluding significantfibrosis, but only average for diagnosing significant fibrosis. However, one importantlimit of both APRI and Forns’ indexes are that they leave almost half of the patientsunclassified.
Another widely investigated combination set of noninvasive markers of liver fibrosis is theFibrotest; a combination of five blood tests based on a mathematical formula: GGT, biliru‐bin, haptoglobin, apolipoprotein A1, alfa2 macroglobulin adjusted for gender and age. Ac‐cording to the investigators, it could exclude cases with significant fibrosis (METAVIR > F2),having 100% of negative predictive value, and more than 90% positive predictive value, us‐ing liver biopsy as a reference [112].
8.1. Elastography (FibroScan)
Another noninvasive method for the assessment of liver fibrosis is elastography (Fibro‐Scan) [113].
FibroScan device (EchoSens, Paris, France) uses a mild-amplitude, low frequency vibrationtransmitted through the liver. It induces an elastic shear wave that is detected by pulse-echoultrasonography as the wave propagates through the organ. The velocity of the wave corre‐lates with tissue stiffness which correlates well with the degree of fibrosis.
This device is in widespread use in many parts of the world, but is not yet approved in theUnited States.
Most of the studies have been conducted on patients with chronic hepatitis C but a fewstudies have also covered fibrosis and cirrhosis due to other etiologies.
Rethinking the Role of Liver Biopsy in the Era of Personalized Medicinehttp://dx.doi.org/10.5772/53120
59

This technique, however, has its limitations: it uses expensive equipment, and has decreasedaccuracy in obese patients and in patients with ascites. Elastography results are not valid inpresence of hepatic steatosis, cholestasis, necroinflammation, or portal hypertension. Thepatient’s age and levels of aminotransferases need to be taken into account when interpret‐ing results of liver stiffness [114].
IN FAVOUR of LIVER BIOPSY AGAINST OF LIVER BIOPSY
Chronic HCV hepatitis In selected indications for grading and
staging
Not necessary for diagnosis. Possible
use of non-invasive methods in follow-
up controls
Chronic HBV hepatitis Grading and staging advisable before
starting treatment
Not necessary for diagnosis. Possible
use of non-invasive methods in follow-
up controls
Non-alcoholic steatohepatitis (NASH) NASH is a always an histopathological
diagnosis
Assessment of fibrosis possible with
non-invasive methods
Alcoholic steatohepatitis (ASH) ASH is a histopathological diagnosis.
But in alcoholic acute hepatitis liver
biopsy usually is not performed
Assessment of fibrosis possible with
non-invasive methods,( in abstinent
patients)
Autoimmune Hepatitis For diagnosis and staging liver biopsy is
needed
Non validated methods yet for non-
invasive assessment of fibrosis
Primary Biliary Cirrhosis (PBC) Not needed in typical mild cases
without biliary duct damage
Possible non-invasive assessment of
fibrosis
Hemochromatosis In general, liver biopsy performed for
diagnosis and staging, and iron
content in the liver
Non validated methods for non-
invasive assessment of fibrosis
Wilson disease For diagnosis and staging and copper
content in the liver
Non other options
Table 5. Indication for liver biopsy in different chronic liver diseases in the era of non-invasive methods
In spite of that, elastography is complementary as the combination of noninvasive markersand elastography improves the overall accuracy. In one of the metanalysis, for significantfibrosis, the area under the ROC for Fibrotest and FibroScan were 0.81 (95% CI 0.78-84) and0.83 (0.03-1.00), respectively [115].
Liver Biopsy – Indications, Procedures, Results60

Fibrotest, and elastography (Fibroscan) as first line estimates of fibrosis in patients withchronic hepatitis C are recommended and liver biopsy will probably be indicated only as asecond line diagnosis and reserved for cases of discordance or non-interpretability [112].
Some authors conclude that elastography appears reliable to detect significant fibrosisand cirrhosis in patients with chronic hepatitis C, besides it may turn out to be a valua‐ble diagnostic procedure and follow-up of patients with chronic liver diseases of differ‐ent causes [115].
8.2. Liver biopsy: Consensus among pathologists?
It is crucial that biopsy interpretation be done by experienced liver pathologists. Pathol‐ogists have tried to define the features (including length and number of complete por‐tal tracts) of an adequate liver biopsy sample able to correctly assess the classificationof liver fibrosis. Some authors have recommended big samples of 1 to 4 cm in lengthcontaining at least 11 complete portal tracts, which could be more reliable for adequategrading and staging [116, 117]
Feature Effect on response to therapy Effect on natural history
Fibrosis Reduces response Presence implies progression
Inflammation No effect Related to increased amount of current
fibrosis and increased rate of
progression
Steatosis Reduces response Related to increased amount of current
fibrosis, unclear effect on progression
Iron accumulation Unclear effect Related to increased amount of current
fibrosis, unclear effect on prospective
rate
(adapt from Semin Liver Dis 2005)
Table 6. Relevance of histological features of chronic hepatitis C to disease progression and therapeutic response
Many intraobserver and interobserver variations have been estimated in the assessmentof features, classification, and scoring of liver biopsy assessment. One study reported dif‐ferences in the evaluation of liver biopsies in chronic viral hepatitis C among 10 patholo‐gists specializing in liver diseases. These pathologists independently reviewed 30 liverbiopsy specimens of viral hepatitis C and completed a histological form for each of thespecimens. Five pairs of pathologists were then randomly designated and they inde‐pendently reviewed the biopsy specimens and filled out a new coding form. The inter‐observer variation was calculated for each item among the 10 individuals and then
Rethinking the Role of Liver Biopsy in the Era of Personalized Medicinehttp://dx.doi.org/10.5772/53120
61

among the five pairs. Five features showed an almost perfect or a substantial degree ofconcordance among the 10 observers (cirrhosis, fibrosis, fibrosis grading by Knodell in‐dex, steatosis and portal lymphoid aggregates). The 17 other indicators showed a weak‐er concordance. Five items had a higher concordance when viewed by a pair ofpathologists than when studied by only one pathologist (steatosis, periportal necrosisgrading by Knodell index, lobular necrosis grading by Knodell index, centrilobular fibro‐sis, and ductular proliferation). This study reveals that certain features of major impor‐tance in assessing disease activity show significant observer variation. The acceptabledegree of concordance was related mainly to the fibrosis score, whereas other numericalitems displayed substantial observer variations. Simultaneous observation by two pathol‐ogists increased the reproducibility of numerical scoring and of certain viral hepatitis Clesions. A classification of chronic hepatitis C based on dissociated semiquantitative as‐sessment of necroinflammatory lesions and fibrosis offers more reproducibility than theuse of a global numerical index [107].
As a single percutaneous liver biopsy yields only a minute percentage (1 ⁄ 50 000 or 0.002%)of the total hepatic tissue, paired biopsies have been evaluated in several published studies,especially for assessing steatosis and NASH. For quantification, better references are re‐quired, such as imaging techniques or morphometry, which determines the area of steatosison liver biopsy.
In fact, as liver steatosis is not homogeneous, classical optical examination of a liver biopsyby a pathologist for measuring liver steatosis by the determination of the percentage of hep‐atocytes containing lipid vesicles is highly subjective, and steatosis grading corresponds on‐ly to a semiquantitative scale [68].
The role of the liver biopsy in disease management is evolving nowadays and has to be re‐considered given the modern pathologic assessment of liver biopsy. Pathologists have madeprogress in the interpretation of liver biopsies and in processing the information in a conciseand scientific way available to clinicians. After evaluating the disease state and interpretingthe tests results, the clinician in charge of the patient should consider the individual patientwhen making recommendations with regards to treatment.
Role of the liver biopsy in personalized medicine
The liver biopsy specimen aims to obtain a valuable material for the assessment of fibrosisand cirrhosis. Despite limitations related to sampling and interpretation, histological exami‐nation remains the best standard for staging and diagnosing chronic liver diseases. Its indi‐cations are decreasing because new therapeutical options for chronic viral hepatitis haveimproved [118]. Moreover, new non-invasive tests have been developed and their use mayincrease in the future, especially for long term management [119] (Table 7).
All invasive procedures involve risks, consequently the benefits of obtaining liver for histol‐ogy should always be weighed against the possible morbidity of the procedure. The deci‐sion to indicate a liver biopsy has to be taken depending on the center’s facilities and theavailability of experienced liver pathologists to interpret the biopsy.
Liver Biopsy – Indications, Procedures, Results62

Ethics related to liver biopsy mainly include issues on the indications, information on poten‐tial risks and benefits and validity of available alternative options. Patients should be ade‐quately informed and participate in the decisions for liver biopsy and treatment [120].
Liver biopsy Transient elastography
Advantages - Direct measure of liver fibrosis
- Well established staging system
- Assessment of architectural
disturbances related to liver fibrosis
- Evaluation of associated lesions
(inflammation, steatosis, iron, alcohol)
- Non-invasive
- Easy to repeat
- No risk to patient
- Performed in the outpatient clinic
- Results available immediately
- Reproducible
- Highly performance for detecting
cirrhosis
Disadvantages - Invasive and painful
- Difficult to repeat
- Potentially severe complications
- Contraindicated if ascites,
coagulopathy etc.
- Sampling and interobserver variability
- Unable to discriminate between
intermediate stages of fibrosis
- False positive in case of acute
hepatitis, extrahepatic cholestasis and
congestive heart failure
(adapt L Castera & M Pinzani, Gut 2010)
Table 7. Use of liver biopsy in clinical practice. Respective advantages and disadvantages of liver biopsy and transientelastography for assessing fibrosis in chronic liver disease
12. Conclusions
What will be the real impact of Liver Biopsy now and in the near future in the era of person‐alized medicine?
1. The practice of liver biopsy will remain as an important component in the evaluation ofliver disease. However, the value of liver biopsy should be contemplated as a comple‐mentary tool in modern medicine because of the presence of new non-invasive diagnos‐tic measures, better prognostication methods and more advances in imagingtechniques.
2. Non invasive tests such as Fibroscan, or similar, adding serum markers will be increas‐ingly used to identify the amount of fibrosis, and will spare, in most patients, the per‐formance of a liver biopsy.
3. Liver biopsy provides information that is used in conjunction with other data to informand to guide therapy. The team that joins pathologists, clinicians, radiologists and otherspecialists meets in order to make clinico-pathological correlations. New classificationsincorporating clinical data in the histological dictamen will be implemented.
Rethinking the Role of Liver Biopsy in the Era of Personalized Medicinehttp://dx.doi.org/10.5772/53120
63

4. Therapies, etiology, pathogenesis, cellular and molecular mechanisms, changes in tissuearchitecture and invasive (HVPG) and noninvasive diagnostic approaches, should beadded to the liver biopsy information.
5. In the liver transplant field, liver biopsy has allowed many scientific advances and inmost of these patients liver biopsy will continue to be mandatory for their management.
6. Patients seeking a second opinion or who are referred to a tertiary care center, will re‐quire a deep review of previous obtained specimens in order to confirm and to plantheir management.
7. Since chronic viral hepatitis is a prevalent disease in the general population, the numberof liver biopsies will be limited in the next years because it is costly and aggressive sovalidated non-invasive methods will be favoured.
8. Nevertheless, some questions surrounding non-invasive markers will remain. Non-in‐vasive markers have been validated against the biopsy, and the overall accuracy of bi‐opsy is only 80%, it is probably statistically impossible for a marker to perform anybetter than a biopsy.
9. Increasing research on hepatic fibrosis, diagnoses and therapy, is ongoing so valuableresults of predicting changes in fibrosis content over time have to be followed by histo‐logical liver assessment. Moreover, considering the possible regression of cirrhosis, nowclinicians and pathologists have become more interested in studying histological fea‐tures of tissue repair and fibrosis regression in the liver.
10. The number of liver biopsy will be sparing in common patients but it will play a crucialrole in research; for example studying rare diseases, stem cells and genetic disorders.Moreover, its role is evolving in many research fields such as obesity, bone marrowtransplant, and oncology.
Acknowledgements
I would like to thank Aisling Dowd, for her help while preparing the manuscript
Author details
Teresa Casanovas Taltavull
Chronic Hepatitis Coordinator Program, Liver Transplant Unit, Hospital Universitari deBellvitge, L’Hospitalet de Llobregat, Barcelona, Spain
Liver Biopsy – Indications, Procedures, Results64

References
[1] Rockey DC, Caldwell SH, Goodman ZD et al.; American Association for the Study ofLiver Diseases. Liver biopsy. Hepatology. 2009; 49(3):1017-1044.
[2] Colloredo G, Guido M, Sonzogni A, Leandro G. Impact of liver biopsy size on histo‐logical evaluation of chronic viral hepatitis: the smaller the sample, the milder thedisease. J Hepatol 2003; 39(2):239–244.
[3] Udell JA, Wang CS, Tinmouth J, et al. Does this patient with liver disease have cir‐rhosis? JAMA. 2012; 307(8):832-842.
[4] Bedossa P, Dargère D, Paradis V. Sampling variability of liver fibrosis in chronic hep‐atitis C. Hepatology 2003; 38(6): 1449–1457.
[5] Scheuer PJ. Liver biopsy size matters in chronic hepatitis: bigger is better. Hepatolo‐gy 2003; 38(6):1356–1358.
[6] Bateman AC. Patterns of histological change in liver disease: my approach to 'medi‐cal' liver biopsy reporting. Histopathology. 2007; 51(5):585-596.
[7] Pinzani M. Exploring beyond cirrhosis.Hepatology. 2012; 56(2):778-780.
[8] Poynard T, Ratziu V, Bedossa P. Appropriateness of liver biopsy. Can J Gastroenterol2000; 14:543-548.
[9] Czaja AJ, Carpenter HA.Optimizing diagnosis from the medical liver biopsy.ClinGastroenterol Hepatol 2007; 5(8):898-907.
[10] Crawford JM. Evidence-based interpretation of liver biopsies. Lab Invest 2006; 86(4):326–334.
[11] Campbell MS, Reddy KR. Review article: the evolving role of liver biopsy. AlimentPharmacol Ther 2004; 20(3):249-59.
[12] Schiano TD, Azeem S, Bodian CA, et al. Importance of specimen size in accurate nee‐dle liver biopsy evaluation of patients with chronic hepatitis C. Clin GastroenterolHepatol 2005; 3(9):930–935.
[13] Bravo AA, Sheth SG, Chopra S. Liver biopsy. N Engl J Med 2001; 344 (7): 495–500.
[14] Lefkowitch JH.Special stains in diagnostic liver pathology.Semin Diagn Pathol. 2006;23(3-4):190-8. Review.
[15] Batts KP, Ludwig J. Chronic hepatitis. An update on terminology and reporting. AmJ Surg Pathol 1995; 19: 1409-1417.
[16] Knodell RG, Ishak KG, Black WC, et al. Formulation and application of a numericalscoring system for assessing histological activity in asymptomatic chronic active hep‐atitis. Hepatology 1981; 1(5):431–435.
Rethinking the Role of Liver Biopsy in the Era of Personalized Medicinehttp://dx.doi.org/10.5772/53120
65

[17] Scheuer PJ. Classification of chronic viral hepatitis: a need for reassessment. J Hepa‐tol 1991; 13(3):372–374
[18] Bedossa P, Poynard T. An algorithm for the grading of activity in chronic hepatitis C.The METAVIR Cooperative Study Group. Hepatology 1996; 24:289–293.
[19] Ishak K, Baptista A, Bianchi L, et al. Histological grading and staging of chronic hep‐atitis.J Hepatol 1995; 22(6):696–699.
[20] Desmet VJ, Gerber M, Hoofnagle JH, Manns M, Scheuer PJ. Classification of chronichepatitis: diagnosis, grading and staging. Hepatology 1994; 19(6):1513–1520.
[21] Kumar D, Farrell GC, Fung C, et al. Hepatitis C virus genotype 3 is cytopathic to hep‐atocytes: Reversal of hepatic steatosis after sustained therapeutic response. Hepatolo‐gy 2002; 36:1266-1272.
[22] Bressler BL, Guindi M, Tomlinson G, et al. High body mass index is an independentrisk factor for nonresponse to antiviral treatment in chronic hepatitis C. Hepatology2003; 38:639-644.
[23] Poynard T, Bedossa P,& Opolon P Natural history of liver fibrosis progression in pa‐tients with chronic hepatitis C. The OBSVIRC, METAVIR, CLINIVIR, and DOSVIRCgroups. Lancet1997; 349(9055):825-832.
[24] Mohsen AH, Easterbrook PJ, Taylor C, et al. Impact of human immunodeficiency vi‐rus (HIV) infection on the progression of liver fibrosis in hepatitis C virus infectedpatients.Gut 2003;; 52(7):1035-1040.
[25] Papatheodoridis GV, Manolakopoulos S, Liaw YF, & Lok A. Follow-up and indica‐tions for liver biopsy in HBeAg-negative chronic hepatitis B virus infection with per‐sistently normal ALT: A systematic review. J Hepatol 2012; 57(1):196-202.
[26] Castera L. Noninvasive methods to assess liver disease in patients with hepatitis B orC. Gastroenterology 2012; 142(6):1293-1302.
[27] European Association For The Study Of The Liver. Clinical Practice Guidelines: Man‐agement of chronic hepatitis B virus infection.J Hepatol 2012; 57(1):167-185.
[28] Grattagliano I, Ubaldi E, Bonfrate L, & Portincasa P. Management of liver cirrhosisbetween primary care and specialists.World J Gastroenterol 2011; 17(18):2273-2282.
[29] Shao J, Wei L, Wang H, Sun Y et al. Relationship between hepatitis B virus DNA lev‐els and liver histology in patients with chronic hepatitis B. World J Gastroenterol2007; 13(14):2104-7.
[30] Gebo KA, Herlong HF, Torbenson MS, et al. Role of liver biopsy in management ofchronic hepatitis C: a systematic review. Hepatology 2002; 36:S161-S172.
[31] Arroyo M, & Crawford JM. Hepatitic inherited metabolic disorders.Semin DiagnPathol. 2006; 23(3-4):182-189.
Liver Biopsy – Indications, Procedures, Results66

[32] Nash S, Marconi S, Sikorska K, et al. Role of liver biopsy in the diagnosis of hepaticiron overload in the era of genetic testing. Am J Clin Pathol 2002; 118(1):73-81.
[33] Ioannou GN, Tung BY, & Kowdley KV. Iron in hepatitis C: villain or innocent by‐stander? Semin Gastrointest Dis. 2002; 13(2):95-108.
[34] Falize L, Guillygomarc'h A, Perrin M, et al. Reversibility of hepatic fibrosis in treatedgenetic hemochromatosis: a study of 36 cases. Hepatology 2006; 44(2):472–477
[35] Bonkovsky HL, Poh-Fitzpatrick M, Pimstone N, et al. Porphyria cutanea tarda, hepa‐titis C, and HFE gene mutations in North America. Hepatology 1998; 27(6):1661-1669.
[36] Ryan Caballes F, Sendi H, & Bonkovsky HL. Hepatitis C, porphyria cutanea tardaand liver iron: an update.Liver Int 2012; 32(6):880-93.
[37] Brunt EM, Olynyk JK, Britton RS, et al. Histological evaluation of iron in liver biop‐sies: relationship to HFE mutations. Am J Gastroenterol 2000; 95(7):1788-93.
[38] Cribier B, Chiaverini C, Dali-Youcef N, et al. Porphyria cutanea tarda, hepatitis C, ur‐oporphyrinogen decarboxylase and mutations of HFE gene. A case-control study.Dermatology 2009; 218(1):15-21.
[39] Merle U, Schaefer M, Ferenci P, Stremmel W. Clinical presentation, diagnosis andlong-term outcome of Wilson's disease: a cohort study. Gut 2007; 56(1):115-20.
[40] Ferenci P, Steindl-Munda P, Vogel W, et al. Diagnostic value of quantitative hepaticcopper determination in patients with Wilson's Disease. Clin Gastroenterol Hepatol.2005; 3(8):811-818.
[41] Clark VC, Dhanasekaran R, Brantly M, et al. Liver Test Results Do Not Identify LiverDisease in Adults with α-1 Antitrypsin Deficiency. Clin Gastroenterol Hepatol 2012Jul 23. [Epub ahead of print]
[42] Yeoman AD, Westbrook RH, Al-Chalabi T, et al. Diagnostic value and utility of thesimplified International Autoimmune Hepatitis Group (IAIHG) criteria in acute andchronic liver disease. Hepatology 2009; 50(2):538-545.
[43] Czaja AJ, Carpenter HA. Decreased fibrosis during cortico-steroid therapy of autoim‐mune hepatitis. J Hepatol 2004; 40(4):646–652
[44] Chandok N, Silveira MG,& Lindor KD.Comparing the simplified and internationalautoimmune hepatitis group criteria in primary sclerosing cholangitis. GastroenterolHepatol (N Y) 2010; 6(2):108-112.
[45] Sherlock S.Primary biliary cirrhosis, primary sclerosing cholangitis, and autoimmunecholangitis. Clin Liver Dis 2000; 4(1):97-113.
[46] Neuhauser M, Bjornsson E, Treeprasertsuk S, et al. Autoimmune hepatitis-PBC over‐lap syndrome: a simplified scoring system may assist in the diagnosis. Am J Gastro‐enterol 2010; 105(2):345-353.
Rethinking the Role of Liver Biopsy in the Era of Personalized Medicinehttp://dx.doi.org/10.5772/53120
67

[47] Hennes E M, Zeniya M, Czaja AJ et al. and The International Autoimmune HepatitisGroup. Simplified Criteria for the Diagnosis of Autoimmune Hepatitis. Hepatology2008; 48:169-176.
[48] Boberg KM, Chapman RW, Hirschfield GM, et al.; International Autoimmune Hepa‐titis Group.Overlap syndromes: The International Autoimmune Hepatitis Group(IAIHG) position statement on a controversial issue. J Hepatol 2011; 54(2):374-385.
[49] Nakanuma Y, Zen Y, Harada K, et al. Application of a new histological staging andgrading system for primary biliary cirrhosis to liver biopsy specimens: Interobserveragreement. Pathol Int 2010; 60(3):167-174.
[50] Levy C & Lindor KD. Primary sclerosing cholangitis: epidemiology, natural history,and prognosis. Semin Liver Dis 2006; 26(1):22-30.
[51] Burak KW, Angulo P, & Lindor KD. Is there a role for liver biopsy in primary scleros‐ing cholangitis? Am J Gastroenterol 2003; 98(5):1155-1158.
[52] Olsson R, Hägerstrand I, Broomé U, et al. Sampling variability of percutaneous liverbiopsy in primary sclerosing cholangitis. J Clin Pathol 1995; 48(10):933-935.
[53] Dave M, Elmunzer BJ, Dwamena BA, & Higgins PD. Primary sclerosing cholangitis:meta-analysis of diagnostic performance of MR cholangiopancreatography..Radiolo‐gy 2010; 256(2):387-396.
[54] Tischendorf JJW, Andreas Geier A, & Trautwein C. Current Diagnosis and Manage‐ment of Primary Sclerosing Cholangitis. Liver Transplantation 2008; 14:735-746.
[55] Klibansky DA, Mehta SH, Curry M, et al. Transient elastography for predicting clini‐cal outcomes in patients with chronic liver disease.J Viral Hepat 2012; 19(2):e184-193.
[56] Burak K, Angulo P, Pasha TM, et al; Incidence and risk factors for cholangiocarcino‐ma in primary sclerosing cholangitis. Am J Gastroenterol 2004; 99(3):523-526.
[57] Bjornsson E, Olsson R, Bergquist A, et al. The natural history of small-duct primarysclerosing cholangitis. Gastroenterology 2008; 134(4):975-980.
[58] Wiesner RH, Porayko MK, Hay JE, et al. Liver transplantation for primary sclerosingcholangitis: impact of risk factors on outcome.Liver Transpl Surg 1996; 2(5 Suppl 1):99-108.
[59] Poupon R. Autoimmune overlapping syndromes. Clin Liver Dis 2003; 7:865–878.
[60] Deshpande V, Sainani NI, Chung RT, et al.IgG4-associated cholangitis: a compara‐tive histological and immunophenotypic study with primary sclerosing cholangitison liver biopsy material. Mod Pathol 2009; 22(10):1287-1295.
[61] Tiniakos DG Liver biopsy in alcoholic and non-alcoholic steatohepatitis patients.Gastroenterol Clin Biol 2009; 33(10-11):930-939.
[62] Talley NJ, Roth A, Woods J,& Hench V. Diagnostic value of liver biopsy in alcoholicliver disease. J Clin Gastroenterol 1988; 10(6):647-650.
Liver Biopsy – Indications, Procedures, Results68

[63] Hezode C, Lonjon I, Roudot-Thoraval F, et al. Impact of moderate alcohol consump‐tion on histological activity and fibrosis in patients with chronic hepatitis C, and spe‐cific influence of steatosis: a prospective study. Aliment Pharmacol Ther 2003;17:1031-1037.
[64] Yoshioka Y, Hashimoto E, Yatsuji S, et al. Nonalcoholic steatohepatitis: cirrhosis,hepatocellular carcinoma, and burnt-out NASH. J Gastroenterol 2004; 39(12):1215-1218.
[65] Brunt EM, Ramrakhiani S, Cordes BG, et al. Concurrence of histologic features ofsteatohepatitis with other forms of chronic liver disease. Mod Pathol 2003; 16:49-56.
[66] Brunt EM. Nonalcoholic steatohepatitis: definition and pathology. Semin Liver Dis2001; 21(1):3-16. Review.
[67] Yoneda M, Yoneda M, Mawatari H, et al. Noninvasive assessment of liver fibrosis bymeasurement of stiffness in patients with nonalcoholic fatty liver disease (NAFLD).Dig Liver Dis 2008; 40(5):371-378.
[68] Brunt EM, Janney CG, Di Bisceglie AM, Neuschwander-Tetri BA, Bacon BR. Nonal‐coholic steatohepatitis: a proposal for grading and staging the histological lesions.Am J Gastroenterol 1999; 94(9):2467–2474.
[69] Kanel GC. Hepatic lesions resembling alcoholic liver disease. Pathology (Phila) 1994;3(1):77-104.70.
[70] Strnad P, Paschke S, Jang KH,& Ku NO. Keratins: markers and modulators of liverdisease. Curr Opin Gastroenterol 2012; 28(3):209-16. Review.
[71] Ratziu V, Giral P, Charlotte F, et al. Liver fibrosis in overweight patients. Gastroen‐terology 2000; 118: 1117–1123.
[72] Navarro VJ, Senior JR. Drug-related hepatotoxicity. N Eng J Med 2006; 354: 731–739.
[73] Ghabril M, Chalasani N, & Björnsson E. Drug-induced liver injury: a clinical update.Curr Opin Gastroenterol 2010; 26(3):222-226.
[74] Rockey DC, Seeff LB, Rochon J, et al. US Drug-Induced Liver Injury Network. Cau‐sality assessment in drug-induced liver injury using a structured expert opinionprocess: comparison to the Roussel-Uclaf causality assessment method. Hepatology2010; 51(6):2117-26.
[75] Goodman ZD. Drug hepatotoxicity. Clin Liver Dis 2002; 6:381–397.
[76] Lagana SM, Moreira RK, & Lefkowitch JH. Hepatic granulomas: pathogenesis anddifferential diagnosis. Clin Liver Dis 2010; 14(4):605-617.
[77] Ishak KG, Zimmerman HJ. Drug-induced and toxic granulomatous hepatitis. Bail‐lieres Clin Gastroenterol 1988; 2(2):463-480.
Rethinking the Role of Liver Biopsy in the Era of Personalized Medicinehttp://dx.doi.org/10.5772/53120
69

[78] Nohlgård C, Rubio CA, Kock Y, Hammar H. Liver fibrosis quantified by image anal‐ysis in methotrexate-treated patients with psoriasis. J Am Acad Dermatol 1993; 28(1):40–45.
[79] Chang CY,& Schiano TD. Review article: drug hepatotoxicity. Aliment PharmacolTher 2007 15; 25(10):1135-1151.
[80] Valla DC, Benhamou HP. Hepatic granulomas and hepatic sarcoidosis. Clin LiverDis 2000; 4:269–285.
[81] Snyder N, Martinez JG, & Xiao SY..Chronic hepatitis C is a common associated withhepatic granulomas.World J Gastroenterol 2008 7; 14(41):6366-6369.
[82] Scheuer PJ. Classification of chronic viral hepatitis: a need for reassessment. J Hepa‐tol 1991; 13:372-374.
[83] Holtz T, Moseley RH, Scheiman JM. Liver biopsy in fever of unknown origin: a reap‐praisal. J Clin Gastroenterol 1993; 17:29–32.
[84] Knockaert DC, Vanneste LJ, Vannester SB, et al. Fever of unknown origin in the1980s: an update of the diagnostic spectrum. Arch Intern Med 1992; 152:51–55.
[85] Lamps LW. Hepatic granulomas, with an emphasis on infectious causes. Adv AnatPathol 2008; 15(6):309-18. Review.
[86] Schuppan D, & Afdhal NH.Liver cirrhosis. Lancet 2008 Mar 8; 371(9615):838-851.
[87] Garcia-Tsao G, Friedman S, Iredale J, Pinzani M. Now there are many (stages) wherebefore there was one: In search of a pathophysiological classification of cirrhosis.Hepatology 2010; 51(4):1445–1449.
[88] Germani G, Dhillon A, Andreana L, et al. Histological subclassification of cirrhosis.Hepatology 2010; 52(2): 804–805.
[89] Kumar M, Sakhuja P, Kumar A, et al. Histological subclassification of cirrhosis basedon histological-haemodynamic correlation. Aliment Pharmacol Ther 2008; 27(9): 771–779.
[90] Sethasine S, Jain D, Groszmann RJ, & Garcia-Tsao G. Quantitative histological-hemo‐dynamic correlations in cirrhosis. Hepatology 2012; 55(4):1146-53.
[91] Standish RA, Cholongitas E, Dhillon A, Burroughs AK, Dhillon AP. An appraisal ofthe histopathological assessment of liver fibrosis. Gut 2006; 55(4):569–578.
[92] Germani G, Dhillon A, Andreana L, et al. Histological subclassification of cirrhosis.Hepatology 2010; 52(2): 804–805.
[93] Serpaggi J, Carnot F, Nalpas B, et al. Direct and indirect evidence for the reversibilityof cirrhosis. Hum Pathol 2006; 37(12):1519–1526.
[94] Goodman ZD, & Ishak KG. Histopathology of hepatitis C virus infection. Semin Liv‐er Dis 1995; 15(1):70-81.
Liver Biopsy – Indications, Procedures, Results70
[95] Cholongitas E, Papatheodoridis GV, Vangeli M, et al. Systematic review: The modelfor end-stage liver disease--should it replace Child-Pugh's classification for assessingprognosis in cirrhosis? Aliment Pharmacol Ther 2005; 22(11-12):1079-1089. Review.
[96] Hytiroglou P, Snover DC, Alves V, et al. Beyond "cirrhosis": a proposal from the In‐ternational Liver Pathology Study Group. Am J Clin Pathol 2012; 137(1):5-9.
[97] Varadarajulu S, Fockens P, & Hawes RH. Best practices in endoscopic ultrasoundg‐uided fine-needle aspiration. Clin Gastroenterol Hepatol 2012; 10(7):697-703.
[98] Laurent V, Corby S, Antunes L, et al. Liver and focal liver contrast: radiologic-patho‐logic correlation. J Radiol 2007; 88(7-8 Pt 2):1036-47.
[99] Adam R, Azoulay D, Castaing D,et al. Liver resection as a bridge to transplantationfor hepatocellular carcinoma on cirrhosis: a reasonable strategy? Ann Surg 2003; 238(4): 508-18; discussion 518-519.
[100] Kitao A, Zen Y, Matsui O, et al. Hepatocellular carcinoma: signal intensity at gadox‐etic acid-enhanced MR Imaging--correlation with molecular transporters and histo‐pathologic features. Radiology 2010; 256(3):817-826.
[101] Robertson EG, & Baxter G. Tumour seeding following percutaneous needle biopsy:the real story! Clin Radiol 2011; 66(11):1007-1014.
[102] Closset J, Veys I, Peny MO, et al. Retrospective analysis of 29 patients surgicallytreated for hepatocellular adenoma or focal nodular hyperplasia. Hepatogastroenter‐ology. 2000; 47(35):1382-1384.
[103] Shortell CK,& Schwartz SI.Hepatic adenoma and focal nodular hyperplasia.Surg Gy‐necol Obstet 1991; 173(5):426-431.
[104] Longerich T, & Schirmacher P.General aspects and pitfalls in liver transplant pathol‐ogy. Clin Transplant 2006; 20 Suppl 17:60-68.
[105] Demetris AJ, Adams D, Bellamy C, et al. Update of the International Banff Schemafor Liver Allograft Rejection: Working recommendations for the histopathologic stag‐ing and reporting of chronic rejection. An international panel. Hepatology 2000;31:792–799.
[106] Chahal P, Levy C, Litzow MR, et al. Utility of liver biopsy in bone marrow transplantpatient. J Gastroenterol Hepatol 2008; l23:222–225.
[107] Sugawara Y & Makuuchi M. Living donor liver transplantation: present status andrecent advances.Br Med Bull 2006; 10; 75-76:15-28.
[108] Liew PL, Lee WJ, Lee YC, et al. Hepatic histopathology of morbid obesity: concur‐rence of other forms of chronic liver disease.Obes Surg 2006; 16(12):1584-1593.
[109] Imbert-Bismut F, Ratziu V, Pieroni L, et al. Biochemical markers of liver fibrosis inpatients with hepatitis C virus infection: a prospective study. Lancet 2001;357:1069-1075.
Rethinking the Role of Liver Biopsy in the Era of Personalized Medicinehttp://dx.doi.org/10.5772/53120
71

[110] Jin W, Lin Z, Xin Y, et al. Diagnostic accuracy of the aspartate amino transferase-top‐latelet ratio index for the prediction of hepatitis B-related fibrosis: a leading metaa‐nalysis. BMC Gastroenterol 2012; 14; 12:14. Review.
[111] Forns X, Ampurdanès S, Llovet JM, et al. Identification of chronic hepatitis C patientswithout hepatic fibrosis by a simple predictive model. Hepatology. 2002; 36(4 Pt 1):986-992.
[112] Poynard T, de Ledinghen V, Zarski JP, et al. Fibrosis-TAGS group. Relative perform‐ances of FibroTest, Fibroscan, and biopsy for the assessment of the stage of liver fib‐rosis in patients with chronic hepatitis C: a step toward the truth in the absence of agold standard. J Hepatol 2012; 56(3):541-548.
[113] Castera L, Forns X, Alberti A. Non-invasive evaluation of liver fibrosis using transi‐ent elastography. J Hepatol 2008; 48(5):835–847.
[114] Cardoso AC, Carvalho-Filho RJ, Stern C, et al. Direct comparison of diagnostic per‐formance of transient elastography in patients with chronic hepatitis B and chronichepatitis C. Liver Int 2012; 32(4):612-621.
[115] Cross TJ, Calvaruso V, Maimone S, et al. Prospective comparison of Fibroscan, King'sscore and liver biopsy for the assessment of cirrhosis in chronic hepatitis C infection.J Viral Hepat 2010; 17(8):546-54.
[116] Guido M, Rugge M. Liver biopsy sampling in chronic viral hepatitis. Semin Liver Dis2004; 24:89-97.
[117] Intraobserver and interobserver variations in liver biopsy interpretation in patientswith chronic hepatitis C. The French METAVIR Cooperative Study Group. Hepatolo‐gy 1994 Jul; 20(1 Pt 1):15-20.
[118] Sebastiani G, & Alberti A. How far is noninvasive assessment of liver fibrosis fromreplacing liver biopsy in hepatitis C? J Viral Hepat 2012; 19 Suppl 1:18-32.
[119] Carey E, Carey WD. Noninvasive tests for liver disease, fibrosis, and cirrhosis: Is liv‐er biopsy obsolete? Cleve Clin J Med 2010; 77(8):519-527.
[120] Papatheodoridis GV. Ethics related to liver biopsies and antiviral therapies in chronicviral hepatitis. Dig Dis Sci 2008; 26(1):59-65.
Liver Biopsy – Indications, Procedures, Results72

Section 2
Clinical Practice of Liver Biopsy


Chapter 4
Safety and Reliability Percutaneous Liver BiopsyProcedure in Children with Chronic Liver Diseases
Anna Mania, Paweł Kemnitz,Magdalena Figlerowicz, Aldona Woźniak andWojciech Służewski
Additional information is available at the end of the chapter
http://dx.doi.org/10.5772/52619
1. Introduction
Liver biopsy remains a golden standard in the evaluation of various liver diseases. It is oneof the most specific test allowing to assess the severity of various liver diseases. Clinicalevaluation may be inadequate as chronic liver diseases could be asymptomatic for a long pe‐riod of time. The routinely used laboratory test may be irrelevant, as diffuse changes maypossibly be present in the liver in spite of liver function test being within reference values.Percutaneous biopsy allows to obtain a tissue specimen suitable for pathological assessment.Liver biopsy is an important procedure in diagnosing liver diseases in infants and childrenas it often provides diagnostic information not possible to obtain by other methods. There‐fore, liver biopsy is considered to be a golden standard in the diagnostics and follow-up ofthe patients with chronic diffuse hepatopathies. The role of the liver biopsy is to confirm thediagnosis of chronic hepatitis, assess the necroinflamatory activity (grading) and the severi‐ty of fibrosis (staging), confirm the presence of cirrhosis. Other hepatopathies may be ex‐cluded as well as associated diseases using this method [1].
The size of liver sample varies from 1 to 4 cm in length and 1.2 to 1.8 mm in diameter. Biop‐sy specimen represents 1/50,000 of the total mass of the liver, therefore the procedure carriesthe risk of sampling error. The specimen should be sufficient in length (2-2.5 cm) and num‐ber of portal spaces (at least 11). The fragmentation of the specimen should be avoided [2].Liver assessment is also affected by an interpretative error and intraobserver variability ofhistological interpretation. Moreover, liver biopsy is an invasive procedure carrying the risk
© 2012 Mania et al.; licensee InTech. This is an open access article distributed under the terms of the CreativeCommons Attribution License (http://creativecommons.org/licenses/by/3.0), which permits unrestricted use,distribution, and reproduction in any medium, provided the original work is properly cited.

of certain complications including pain, bleeding, pneumothorax, puncture of bile ducts orthe gall bladder.
Repeating samples in different time intervals are useful in monitoring the efficacy of treat‐ments. Many patients are, however, reluctant to experience repeated biopsies, which limitsthe ability to monitor disease progression and treatment effects. [3].
Due to the limitations of the procedure many non-invasive techniques were developed suchas single serological markers, panels of different markers, imaging techniques and elastogra‐phy [4]. None of the non-invasive methods is suitable and reliable enough to entirely substi‐tute the liver biopsy. Non-invasive techniques are very helpful in the detection of severelesions. However, results obtained from patients with intermediate lesions very often over‐lap between different categories of staging. Nevertheless non-invasive methods are useful insituations where contraindications to liver biopsy do not allow to perform the procedure.
Liver biopsy can be percutaneous, transjugular or laparoscopic. Percutaneous liver biopsycan be blind, ultrasound- guided or ultrasound assisted. Various approaches differ in thenumber of potential complications and require various equipment. Ultrasound guidance al‐lows safer intercostal approach and may be useful in the evaluation of relative position ofthe liver, gall bladder, kidneys and lungs. The technique reduces the risk of hemothorax andpneumothorax and puncture of the gall bladder.
The aim of this study was to evaluate safety and reliability of the liver biopsy in children inrelation to obtained results and potential complications.
2. Material and methods
Seventy five cases of percutaneous liver biopsies carried between 2005-2012 were analyzed.The biopsies were performed in children aged 4-17 years (mean 15.30±2.35 years). Studygroup included 26 girls, 49 boys. Procedures were done due to chronic hepatitis C (CHC) –44 cases, chronic hepatitis B (CHB) – 16 cases, autoimmune hepatitis (AIH) – 3 cases, hepati‐tis/hepatomegaly of unknown origin (HUO)– 12 cases, non-alcoholic fatty liver disease(NAFLD) – 2 cases. Number of the procedures performed in the following years has beenpresented in Figure 1.
Written informed consent was obtained from the parents and patients aged 16 years andover according to Polish law regulations. Before the procedure children were clinically eval‐uated and blood samples were taken for standard hematological and clinical chemistry anal‐ysis. Children with coagulopathies and thrombocytopenia below 80,000/mm3 were excludedfrom the procedure. All children underwent abdominal ultrasound performed the day be‐fore the procedure to exclude potential hemangiomas and malposition of the organs. Allchildren were managed by Menghini procedure in sedation. Children aged less than 5 yearsreceived general anesthesia. 36 biopsies were ultrasound guided directly prior to the proce‐dure (performed by the operator), 39 biopsies were blind. The ultrasound prior to the biopsywas performed to identify the intercostal space and to avoid accidental puncture of the gall
Liver Biopsy – Indications, Procedures, Results76

bladder, the lung, right kidney and large vessels. Immediately after the procedure ultra‐sound examination was performed searching for potential complications such as accidentalpuncture or bleeding. In the case of blind biopsied ultrasound examination was performedby radiologists in situations where complications were suspected basing on clinical symp‐toms. All patients were monitored 24 hours after the procedure in the department for vitalsigns, pain and other consequences.
Histological evaluation was performed using Ishak scoring system for grading and staging.
Categorical variables were compared using Fisher’s exact test or chi-square test were appro‐priate. Result with p value <0.05 were considered statistically significant.
Figure 1. Number of liver biopsy performed in the Department of Infectious Diseases and Child Neurology due to vari‐ous reasons in years 2005-2012 (until July) CHC- chronic hepatitis C, CHB – chronic hepatitis B, NAFLD – non-alcoholicfatty liver disease, HUO – hepatitis/hepatomegaly of unknown origin, AIH – autoimmune hepatitis
3. Results
Liver samples were obtained in all children. Adequate sample size was not obtained in thecase of 5 children - 2 samples were to short and did not contain the adequate number of por‐tal spaces, one sample was fragmented. Four inadequate samples resulted from the blindliver biopsy and 1 was obtained by the ultrasound guided procedure (p=0.21). No significantadverse events were observed. No clinical signs of hemorrhage, no cases of pneumothorax,puncture of the gallbladder nor severe infections were observed. Larger bile ducts werepunctured in 4 cases – all undergoing blind procedure (p=0.07). 12 patient were complainingon pain in the right upper quadrant of the abdomen following the procedure that requiredmore intensive analgesics – 3 undergoing ultrasound guided procedure, 9 having blind liver
Safety and Reliability Percutaneous Liver Biopsy Procedure in Children with Chronic Liver Diseaseshttp://dx.doi.org/10.5772/52619
77

biopsy done (p=0.07). Pain was mild to moderate and resolved after analgesics. There wereno deaths following the procedure in both groups of children.
Results from pathological assessment were presented in Table 1. The majority of childrenunderwent liver biopsy due to CHC. Remaining indications were CHB, AIH, NAFLD, HUO.In patients with viral hepatitis grading and staging assessed according to Ishak scoring sys‐tem was usually mild to moderate. Nevertheless, severe lesions were also present in somepatients. Figure 2 and Figure 3.show examples of inflammatory changes and portal fibrosisin various patients with CHC. In patients with AIH and NAFLD diagnosis was confirmedby pathological assessment. Ten of HUO patients gained diagnosis either of metabolic disor‐ders or NAFLD thanks to pathological evaluation. Normal liver histology was described in 2patients.
Figure 2. Liver biopsy specimen of the patient with CHC where inflammatory infiltrates cross lamina basalis of the lo‐buli (thin arrows) and intralobular focus of inflammatory infiltrate (thick arrow).Staining: hematoxylin+eosine. Magni‐fication 40x
Fifteen children with viral hepatitis underwent repeated procedures allowing to assess theprogression of lesions in time. In 9 of them the progression of lesions was described, 6 hadsimilar results in both biopsies.
Liver Biopsy – Indications, Procedures, Results78
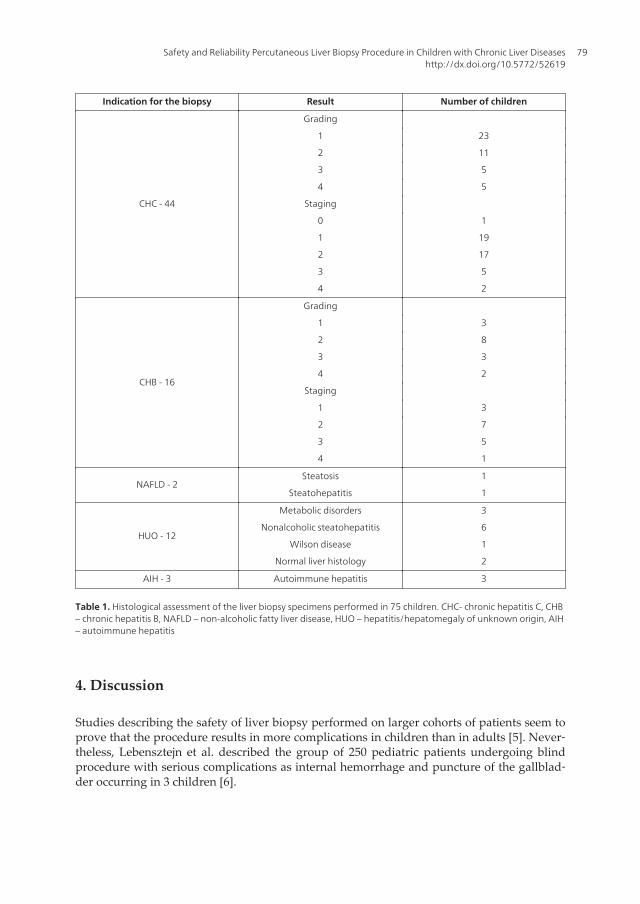
Indication for the biopsy Result Number of children
CHC - 44
Grading
1 23
2 11
3 5
4 5
Staging
0 1
1 19
2 17
3 5
4 2
CHB - 16
Grading
1 3
2 8
3 3
4 2
Staging
1 3
2 7
3 5
4 1
NAFLD - 2Steatosis 1
Steatohepatitis 1
HUO - 12
Metabolic disorders 3
Nonalcoholic steatohepatitis 6
Wilson disease 1
Normal liver histology 2
AIH - 3 Autoimmune hepatitis 3
Table 1. Histological assessment of the liver biopsy specimens performed in 75 children. CHC- chronic hepatitis C, CHB– chronic hepatitis B, NAFLD – non-alcoholic fatty liver disease, HUO – hepatitis/hepatomegaly of unknown origin, AIH– autoimmune hepatitis
4. Discussion
Studies describing the safety of liver biopsy performed on larger cohorts of patients seem toprove that the procedure results in more complications in children than in adults [5]. Never‐theless, Lebensztejn et al. described the group of 250 pediatric patients undergoing blindprocedure with serious complications as internal hemorrhage and puncture of the gallblad‐der occurring in 3 children [6].
Safety and Reliability Percutaneous Liver Biopsy Procedure in Children with Chronic Liver Diseaseshttp://dx.doi.org/10.5772/52619
79
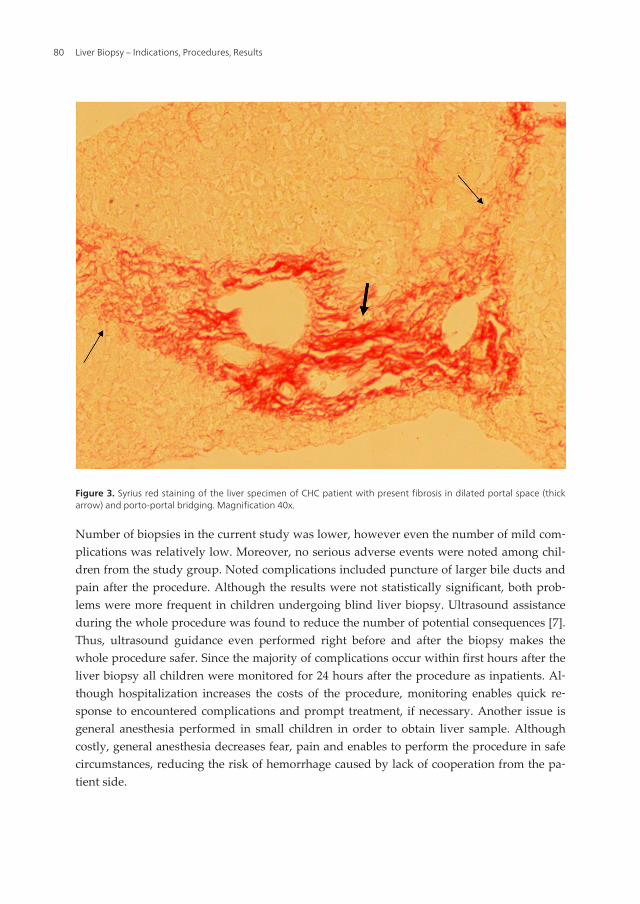
Figure 3. Syrius red staining of the liver specimen of CHC patient with present fibrosis in dilated portal space (thickarrow) and porto-portal bridging. Magnification 40x.
Number of biopsies in the current study was lower, however even the number of mild com‐plications was relatively low. Moreover, no serious adverse events were noted among chil‐dren from the study group. Noted complications included puncture of larger bile ducts andpain after the procedure. Although the results were not statistically significant, both prob‐lems were more frequent in children undergoing blind liver biopsy. Ultrasound assistanceduring the whole procedure was found to reduce the number of potential consequences [7].Thus, ultrasound guidance even performed right before and after the biopsy makes thewhole procedure safer. Since the majority of complications occur within first hours after theliver biopsy all children were monitored for 24 hours after the procedure as inpatients. Al‐though hospitalization increases the costs of the procedure, monitoring enables quick re‐sponse to encountered complications and prompt treatment, if necessary. Another issue isgeneral anesthesia performed in small children in order to obtain liver sample. Althoughcostly, general anesthesia decreases fear, pain and enables to perform the procedure in safecircumstances, reducing the risk of hemorrhage caused by lack of cooperation from the pa‐tient side.
Liver Biopsy – Indications, Procedures, Results80

The majority of children underwent the liver biopsy due to chronic viral hepatitis – mostlyCHC. Histological assessment was not necessary to establish diagnosis since it is usuallybased on blood tests. However, information regarding grading and staging was essential fortreatment decisions since the length of treatment may vary depending on the severity of le‐sions. In patients with CHB decisions regarding the initiation of the treatment may dependon the presence of lesions in the liver tissue [8]. In both types of chronic viral hepatitis pa‐tient with liver cirrhosis requires different approach than the child with mild lesions in theliver. In children with AIH the diagnosis was confirmed by the detection of specific inflam‐matory cells in the liver tissue. Although the number of NAFLD was small, the proceduredistinguished between simple steatosis and steatohepatitis. Patients who underwent theprocedure due to HUO benefited from diagnosis in 10/12 children. Metabolic disorders weredetected in 3 patients and steatosis was detected in 6 children, 1 child was found to haveWilson’s disease. Normal liver histology found in the specimens from the following 2 chil‐dren with HOU raises questions regarding indications to the liver biopsy. The decision con‐cerning the procedure was always carefully made basing on clinical and laboratory findings.Obtained results may be a consequence of the limitations of the procedure regarding samplesize and sample error related to the site of the biopsy. Diffuse liver diseases are hardly everevenly distributed in the organ.
Another problem with pathological assessment is an intraobserver variety. Except for skill‐ful operator, an experienced pathologist is essential for proper evaluation of the samples.However, differences in the assessment between to various pathologists are difficult toavoid even with the use of validated scoring systems.
In recent years many non-invasive methods of liver assessment were developed. Imagingtechniques allow to describesteatosis, focal changes, malformations, inflammatory processesof bile ducts and advanced fibrosis. Mild changes are, however, still difficult to detect. Elas‐tography has been developed to evaluate liver stiffness being a useful tool to assess liver fib‐rosis [9]. Fibrosis is also evaluated by different serological markers and panels of direct andindirect markers or combination of both. Various cut-offs of the markers to detect advancedfibrosis and cirrhosis were validated in numerous studies [4]. Nevertheless, problem withintermediate stages of fibrosis still exist, since in such cases serological markers overlap.
Attempts to completely replace the biopsy with other non-invasive methods are not effec‐tive as the collection of adequate liver sample and proper histological evaluation allows todetermine the extent ofthe liver damage and helps to establish the diagnosis.
5. Conclusions
Percutaneous liver biopsy is safe even in small children. Although severe complications arerare, patients require frequent monitoring. Ultrasound guidance seem to reduce the numberof complications. Remaining a golden standard, the liver biopsy has certain limitations anddrawbacks that influence the results.
Safety and Reliability Percutaneous Liver Biopsy Procedure in Children with Chronic Liver Diseaseshttp://dx.doi.org/10.5772/52619
81

Acknowledgements
This paper was supported by a grant from The Ministry of Science and Higher EducationNo –NN407 012036 to A. Mania
Abbreviations
AIH – autoimmune hepatitis, CHB – chronic hepatitis B,CHC – chronic hepatitis C, NAFLD– non-alcoholic fatty liver disease, HUO – hepatitis/hepatomegaly of unknown origin,
Author details
Anna Mania1, Paweł Kemnitz1, Magdalena Figlerowicz1, Aldona Woźniak2 andWojciech Służewski1
1 Department of Infectious Diseases and Child Neurology, Faculty of Medicine, Universityof Medical Sciences in Poznan, Poland
2 Chair of Clinical Pathology, Faculty of Medicine, University of Medical Sciences in Pozn‐an, Poland
References
[1] Sporea I, Popescu A, Sirli R. Why, who and how should perform liver biopsy inchronic liver diseases. World J Gastroenterol2008; 14(21): 3396-3402
[2] Cholongitas E, Senzolo M, Standish RA, Marelli L, Quaglia A, Patch D, Dhillon AP &Burroughs AK. A systemic review of the quality of liver biopsy specimens. Am JClinPathol 2006; 125: 710–21
[3] El-ShabrawiMH El-Karaksy HM, Okahsa SH, Kamal NM, El-Batran G, Badr KA.Outpatient blind percutaneous liver biopsy in infants and children: is it safe? Saudi JGastroenterol. 2012;18:26-33.
[4] Mania A, Kemnitz P, Mazur-Melewska K, Figlerowicz M, Służewski W. Non-inva‐sive assessment of liver – serum markers and imaging techniques. In: Takanashi H.(ed.)Liver biopsy. Rijeka: InTech; 2011. p265-282.
[5] Potter C, Hogan MJ, Henry-Kendjorsky K, Balint J, Barnard JA. Safety of pediatricpercutaneous liver biopsy performed by interventional radiologists.J PediatrGas‐troenterolNutr. 2011;53:202-6.
Liver Biopsy – Indications, Procedures, Results82

[6] Lebensztejn DM, Kaczmarski M, Sobaniec-Lotowska M, et al (2000). Blind liver biop‐sy in children—diagnostic significance and complications in authors’ own material.Med SciMonit 6:1155–1158.
[7] Nobili V, Comparcola D, Sartonelli MR, Natali G, Monti F, Falappa P, Marcelini M.Blind and ultrasound-guided percutaneous liver biopsy in children. PediatrRadiol2003; 33:772-775.
[8] Kemnitz P, Mozer-LisewskaI,Mania A, Michalak M, Wozniak A, Kowala-PiaskowskaA, Figlerowicz M, Pohland J, Służewski W. Clinical importance of transcutaneousneedle biopsy of the liver in children with chronic hepatitis B. Exp. ClinHepatol 2009;5;38-43.
[9] Castera L, Vergniol J, Foucher J, Le Bail B, Chanteloup E, Haaser M, Darriet M, Cou‐zigou P & De Ledinghen V. Prospective comparison of transient elastography, Fi‐brotest, APRI, and liver biopsy for the assessment of fibrosis in chronic hepatitis C.Gastroenterology 2005; 128: 343-350.
Safety and Reliability Percutaneous Liver Biopsy Procedure in Children with Chronic Liver Diseaseshttp://dx.doi.org/10.5772/52619
83


Chapter 5
Risks and Benefits of Liver Biopsy in Focal Liver Disease
Letiția Adela Maria Streba,Eugen Florin Georgescu and Costin Teodor Streba
Additional information is available at the end of the chapter
http://dx.doi.org/10.5772/52620
1. Introduction
Even with the recent evolution of imaging techniques, and with the ever-increasing role ofserum markers, direct analysis of tissue samples maintains its role in modern medicine. Thisis especially true for the diagnosis and assessment of the prognosis and evolution of a seriesof viral, tumoral and inflammatory liver diseases. Thus, liver biopsy and histological assess‐ment of the liver parenchyma can still be called by many the “gold standard” in diagnosisand staging of associated disease. However, liver biopsy in itself implies a series of risks andinherent discomfort for the patient. With the increasing availability of other non-invasivemethods routinely used in diagnosis and staging of liver-related diseases, many debate thenecessity and ethical implications of tissue sampling.
In the following pages, we will try and synthetize the historical evolution of liver biopsy,describe the techniques used over the years and present its current recommendations andtheir alternatives, with focus on the so-called “virtual liver biopsy” techniques currentlyemployed.
2. Historical landmarks and recent developments in liver biopsy
The first written documented report of a successful liver biopsy was made by Paul Ehr‐lich in the book “On diabetes” published in 1884. He published an account of the proce‐dure performed in 1880 in Berlin, along with graphical illustrations of the instrumentsand the liver samples collected. This came detailed account was based on previous theo‐retical advantages of this technique discussed by the French physician AGM Vernois in1844, who in turn based his assumption on successful procedures performed for punctur‐
© 2012 Streba et al.; licensee InTech. This is an open access article distributed under the terms of the CreativeCommons Attribution License (http://creativecommons.org/licenses/by/3.0), which permits unrestricted use,distribution, and reproduction in any medium, provided the original work is properly cited.
ing purulent echinococcus, as early as 1825 (Récamier) and 1833 (Stanley). Cytology wasreported as a diagnosis method for liver disease by L. Lucatello (in Rome) in 1895, whileF. Schupfer performed liver and spleen biopsies with a thicker needle twelve years later,in 1907. This new approach provided cylindrical-shaped tissue samples which could behistologically prepared and analyzed [1].
Other scarce accounts of successful procedures followed in the next couple of decades (Oli‐vet, 1926; Huard 1935; Silverman, 1938; Baron, 1939; Kofler, 1940; Dible, 1943), using differ‐ent aspiration techniques performed with different modified biopsy needles [1].
A new stage in modern liver biopsy techniques was reached when, in 1957 and repeated inthe following year, Menghini performed and reported on the first “one-second needle biop‐sy” performed with a special small caliber needle with no trocar and a sharp bevel. This wasthe first time needle liver biopsy was introduced worldwide as a praised diagnostic techni‐que capable of providing enough histological material for an accurate interpretation of thepathological changes present in the parenchyma [1].
Following this radical advancement, liver biopsy became more spread and the techniqueevolved once modern imagistic methods allowed for better and safer puncturing of theliver parenchyma. Thus, the technique entered the image-guided age of investigation per‐formed under computed tomography (CT) or ultrasound (US) real-time screening. Re‐ports from Denmark, China, the United Kingdom, France or the United States ofAmerica populated the 1960–1980 literature, once the technique became widespread andfully acknowledged by the academic community. Its utility in diagnosing liver diseasesand later on in staging hepatitis or malignancies was undisputed for entire decades ofthe 20th century [1].
Recent advancements, based on the advent of new imagistic high-accuracy techniques basedon both US and CT/RM approaches, highly diminished the role played by this invasive in‐vestigation. The term “virtual biopsy” became more and more present in recent literature,once both doctors and patients alike became more confident and were introduced to thesehigh-yield methods, such as Transient or Acoustic Radiation Force Elastography. Moreover,advanced serum markers (such as, for example, the Fibrotest-Actitest battery of tests) allowfor an accurate non-invasive staging in hepatitis. The introduction of arterial uptake con‐trast-enhanced US and CT/RM techniques substantially decreased the role of biopsy in diag‐nosing liver biopsy [2–4].
However, histology remains one of the most accurate methods for evaluating liver paren‐chymal changes, and is always used in malignancies when the diagnosis is uncertain orwhen other non-invasive methods fail to provide an accurate staging for hepatitis. Alongwith these non-invasive techniques came a revolution in in-situ biopsy methods. Such isprobe-based confocal laser endoscopy (pCLE), which uses miniaturized probes connected toa laser source through fiber optics, small enough to fit inside a biopsy needle, thus provid‐ing rapid live assessment of liver architecture [5].
Liver Biopsy – Indications, Procedures, Results86

3. Modern liver biopsy techniques and sampling adequacy
3.1. Percutaneous biopsy
All modern percutaneous liver biopsy techniques have rapidity as a common denominator.Either cutting or suction needles can be used for transthoracic or subcostal biopsy, either af‐ter palpation or imaging assessment of the puncturing zone, or, preferably, under continu‐ous image guidance. The transthoracic approach is the preferred method used, under real-time US or (more rarely) CT guidance and after a thorough imaging investigation of theliver and puncture route. All percutaneous methods imply two phases, one extra-hepaticcorresponding to the needle puncturing the skin and reaching the needle, and a hepaticstage in which the needle passes the liver capsule, collects the parenchyma material, and isswiftly extracted. It is considered a relatively safe procedure, complication rates varying be‐tween studies, from 0.75% up to 13.6% [6].
Trucut needles and their modified versions driven by spring-loaded biopsy guns are in‐creasingly used and are the instruments of choice in many centers worldwide, especially inEurope [7]. Needle diameters vary between 1.20 mm to 1.60 mm, smaller calibers being usedwhen a high risk of complications is suspected.
Suction needles are less expensive and their operation allows for rapid intra-hepatic han‐dling, thus being easier to use and possibly imply less bleeding-related complications. Themost widespread types are the Menghini, Jamshidi and Klatskin needles, which remainedvirtually unchanged since their introduction in the second half of the last century. The maxi‐mum required time for a complete syringe suction of the cytological material and the con‐secutive needle retraction is 0.5 seconds. The intrahepatic phase is reduced to as low as 0.1seconds when the needle is operated by an expert practitioner [8].
Image guidance has become mandatory in centers where the gastroenterologist can performhis or her own US exam. Real-time surveillance of the procedure greatly decreases the riskof complications (such as bleeding) and minimizes post-procedural complaints such as painor hypotension. Hepatologists in the United States usually prefer to have a radiologist per‐forming the procedure under CT or US guidance [8].
3.2. Transjugular (transvenous) biopsy
The transjugular route is preferred when the risk for complications is high and therefore apercutaneous approach is not considered safe enough for the patient. Patients with clinicalascites, known hemostatic defect, cirrhotic liver with clinical signs of organ deficiency(smaller size and increased palpatory stiffness) or morbid obesity are usually prime candi‐dates for this approach. Another situation when the transvenous approach is preferred iswhen additional pressure measurements in the hepatic vein are required [8].
The resources needed for this procedure are higher than percutaneous approaches; howev‐er, complication rates are lower (2.5% up to 6.5%) according to some authors [9], with mor‐tality rates of approximately 0.09% in high-risk patient groups [10]. The expertise of the
Risks and Benefits of Liver Biopsy in Focal Liver Diseasehttp://dx.doi.org/10.5772/52620
87

performing physician also plays a crucial role in the success rate of this procedure, andshould be considered along with the higher resource costs when choosing this access routefor a lower-risk patient [1].
Another very important aspect is the lower quality of the tissue specimens collected throughthe transjugular approach. The tissue cylinders are thinner and more fragmented than thoseobtained through percutaneous biopsy, and usually represent only 1-2 cm of the liver paren‐chyma, containing fewer portal fields [11].
3.3. Surgical or laparoscopic biopsy: Novel approaches for liver biopsy
This approach is preferred in patients with peritoneal involvement when an abdominalcancer is present, with associated ascites or peritoneal disease with ascites of suspectedhepatic origin. Also, focal hepatic lesions can be targeted for biopsy through the laparo‐scopic channel.
Biopsy can thus be performed with either normal needle systems, or by wedge resection.However, the later approach may overestimate the level of fibrosis, as the resection is per‐formed too close to the fibrotic capsule that envelops the liver. The procedure is always con‐ducted under general anesthesia and requires controlled pneumoperitoneum by infusion ofnitrous oxide, always performed by trained physicians, allowing for a good control of bleed‐ing and a minimum set of complications due to the large working area created. In directcomparison with percutaneous biopsy, the laparoscopic approach provides a higher level ofaccuracy as it allows the evaluation of the surrounding peritoneum [12]. The main complica‐tions are related to the general anesthesia used for the procedure, the local abdominal andintra-peritoneal traumas associated, as well as the risk of bleeding, which is also present inthe other types of biopsy.
Advancements to surgical techniques led to the development of the natural orifice translu‐minal endoscopic surgery (NOTES), a new surgically-derived endoscopic technique thatuses a transgastric or transanal route to facilitate the access to the abdominal cavity. One re‐cent study presented a liver biopsy performed through a transgastric flexible endoscopic de‐vice which permitted the inspection of the liver and surrounding intraperitoneal space. Thetechnique can be applied to morbidly obese patients or to patients at high risk of complica‐tions [13]. This approach remains however limited at the present time to a few highly select‐ed patients, and is performed only by trained surgeons and gastroenterologists, at moderateto high costs and in selected centers.
Recent studies also focused on evaluating the liver capsule in cirrhotic patients throughpCLE inserted through a laparoscopic channel, this being a promising field in the advance‐ment of minimally invasive biopsy techniques [14]. Another study describes the use of pCLEin a routine minilaparoscopy setting, performed under conscious sedation. The authorscould describe subsurface serial images in real time, allowing for an in vivo analysis of theliver parenchyma [5]. This approach may lead the way to targeted biopsy through live as‐sessment of the liver parenchyma, as well as immediate morphological and dynamic evalua‐tion of intrahepatic structures.
Liver Biopsy – Indications, Procedures, Results88

3.4. Adequacy of liver biopsy samples
Analysis of the biopsy material under ultraviolet fluorescent light may be required in orderto identify porphyria. Liver tissue obtained through biopsy is then quickly transferred into abuffer solution, usually 4% or 10% neutral formalin, to avoid the alterations it may sustaindue to hepatic enzymes autolysis. It can then be subjected to various preparation techniques,in accordance to what diagnostic tests will follow with that specific sample (frozen section,RNA detection etc.) [1].
An adequate biopsy fragment is between 1 and 4 cm long, weighting between 10 to 50 mg,with a minimal diameter of 1 mm. Fragmented samples from Menghini needles are accepta‐ble, as their added size is somewhere in the vicinity of 2 cm (usually range from 1 to 2.5 cmin length). In order to properly represent the parenchymal architecture, at least 10–11 portaltracts should be completely present, six being a minimally acceptable number. Specimens ofinadequate lengths usually lead to understaging of fibrosis and underestimate the grade ofinflammation. Cirrhotic parenchyma usually comes fragmented through biopsy, thus lead‐ing to approximately 20% sampling errors [15, 16].
As it is appreciated that a liver biopsy specimen represents 1/50 000 of the total organ mass,discussions regarding how representative it can be for diffuse lesions always existed in theliterature [8, 17]. It is however appreciated that most diffuse (steatosis or inflammation etc.)or focal lesions (both malignant and benign), as well as structural lesions such as fibrosis canbe visualized with a fairly high degree of accuracy, if the minimum amount of liver paren‐chyma and the required number of portal spaces are present. It was however demonstratedthat the size of the sample is directly correlated to an underestimation of inflammatorychanges [18], this paradigm being extended to fibrotic changes and has a direct effect on thesubsequent grading and staging [1, 19, 20].
Another issue highly debated in literature is the inter-observer variability; even with thewide usage of quantification scores for both inflammation and fibrosis such as the Knodell[21] scoring system and the revised Ishak version [22] or the METAVIR score [23]. All inter‐pretations are subjected to the experience and training of the pathologist, which is an inde‐pendent variable in itself, separated from the inherent sampling and procedural errors. Asecond opinion is always recommended, and two pathologists are usually present in mostlarge referral centers. Collaboration between the pathologist and the clinician performingthe liver biopsy is also preferred, as some studies indicated [24–26].
The most important quantification parameters refer to its geometry and relationship be‐tween the principal compartments – portal tracts and the elements of the arterial vascularsystem; the configuration adopted by hepatocyte plates; the sinusoids and the perisinusoi‐dal compartment; the amount of connective tissue, fat and the number of ducts present, aswell as other normal cellular infiltrates of lymphoid origin [8]. Regenerative nodular hyper‐plasia or macronodular cirrhosis can be sometimes classified as normal parenchyma, andthe inherent variations of normal inflammatory cellular infiltrate can be misleading for aninexperienced pathologist when observing low grade inflammatory lesions [8, 27].
Risks and Benefits of Liver Biopsy in Focal Liver Diseasehttp://dx.doi.org/10.5772/52620
89

4. Risks, complications and post-procedural complaints of liver biopsies
The main risks for a patient subjected to liver biopsy were already briefly discussed in theprevious paragraphs. Their frequency and predisposition in certain patient groups are de‐terminant factors for choosing one biopsy technique in favor of another. The risk of bleedingcannot be excluded with any instrument, and liver biopsy is not recommended in most casesof suspected primary liver cancers because of a needle track seeding of tumor cells. Thesehowever do not exclude liver biopsy as a last resort diagnostic tool, when imagistic or serumtests proved constantly inconclusive or do not converge to an outcome.
The most commonly occurring complication of percutaneous liver biopsy is pain, present inup to 84% of procedures and ranging from mild discomfort to severe pain [28]. It is usuallylocated in the right upper quadrant and it is referred to the right shoulder, with various in‐tensities and time of installment. Moderate to severe pain is present in fewer than 5% of allpatients, and may be the sign of a more severe complication such as bleeding or the punc‐turing of the gallbladder [16, 29]. Mechanisms that lead to pain after the biopsy maneuverare not fully understood, however it is likely to be caused by bile or blood extravasationwith subsequent capsule swelling (the only liver component with sensitive nervous termina‐tions) [30]. Another cause of upper abdominal pain is the traction of the falciform ligamentafter the puncture. Cervical pain, as well as pain in the right shoulder, may also be causedby the irritation of the phrenic nerve. Subcapsular hematoma may lead to respiratory painand irritation of the pleura or peritoneum may lead to vagal stimulation and consecutive va‐gal shock, manifested through bradycardia, severe hypotension, weak pulse and intensepain in the upper abdomen [1]. In some cases of extreme pain, hospitalization and furtherimaging tests are required to determine the correct course of action for these patients.
However, the most important complication of liver biopsy is bleeding. The most severebleedings occur intraperitoneally, when they determine a drop in vital signs and can be vi‐sualized through imaging [16, 31]. Urgent hospitalization and blood transfusion, even fol‐lowed by surgery or radiological intervention may be required. Nevertheless, these cases arescarce, with 1 in 2 500 up to 10 000 biopsies incidence, while less severe cases which do notrequire blood transfusions or surgical maneuvers are more frequent, approximately 1 in 500biopsies [16]. Serious bleeding-related complications usually occur within 2 hours of theprocedure, and over 90% of all bleedings become evident within 24 hours of the procedure.Clinical symptoms are revelatory, as patients experience hypotension and shock. Age andthe underlying conditions also are predictive factors, as older patients and liver masses aremore frequently associated with post-puncture bleeding. A correlation between the needletype and the risk for bleeding was also cited in literature, as cutting needle seem to pose anincreased risk compared to their suction counterparts [15]. Other factors are related to oper‐ator experience, the diameter of the needles and their diameter [16].
A correlation between conventional coagulation tests and the risk of bleeding has not beensufficiently demonstrated until now; therefore no certain recommendations in this regardare currently in place [16]. The option to insert coagulation agents on the needle tract is con‐sidered, especially in the US, with no definite data on its ability to prevent possible bleed‐
Liver Biopsy – Indications, Procedures, Results90

ings. As already mentioned, the transvenous approach is preferred in certain categories ofpatients as it is considered safer, even though several pooled analyses showed similar riskswith standard percutaneous methods [10,16].
The singular major complication of liver biopsy, caused in turn by consecutive severe bleed‐ing is patient death. No consistent data regarding post-procedural mortality exists in the lit‐erature, the most commonly quoted rate being less or equal to 1 in 10 000 biopsies [16], andseems to be greater after biopsies of malignant liver masses compared to diffuse parenchy‐mal disease [6].
Other complications of liver biopsies include the perforation of other viscous organs, bileperitonitis (major complication which can result in death), infections (especially in post-transplant patients due to immunosuppressive medication), hemobilia, pneumothorax (in‐stantly recognized on radiographs, essentially to diagnose quickly due to high risk of death)or hemothorax. Correct usage of imaging methods both when choosing the biopsy site andfor surveillance of the procedure minimizes many of these risks, especially those related topuncturing adjacent structures [16]. The risk of needle track seeding when puncturing livermalignancies exists in 1 to 3% of all cases [32], as will be detailed below.
5. Current recommendations regarding conditions that require liverbiopsy
The indications for liver biopsy were greatly reduced since the recent introduction of accu‐rate non-invasive tests which can evaluate liver parenchyma with minimal or no patienttrauma. The concept of liver biopsy may evolve even further, if in vivo direct histologicalmethods such as pCLE will provide important additional data. It is most likely that the rec‐ommendations for liver biopsy will suffer further changes in following years. A series ofthese advancements will be discussed separately within this chapter. Below, we will de‐scribe some of the main indications for liver biopsy, either for diagnostic purposes or forevaluating and staging liver disease.
5.1. Grading and staging of chronic viral hepatitis
The recent outburst of viral hepatitis cases (especially as a result of the increasing number ofnewly diagnosed virus C infections) represents a major health burden worldwide. With al‐most four million people being infected in the United States alone, and between 130 and 170million worldwide, chronic hepatitis C virus (HCV) infections and more than double thosefigures for hepatitis B virus (HBV) infections, this ensemble of viral diseases currently repre‐sent the main cause of liver-related morbidity [33, 34].
Nowadays, the role of liver histology in the positive diagnosis of chronic viral hepatitis hasgreatly diminished. However, it still plays a central role when assessing both activity andprogression of the disease [8, 35]. Sampling issues arise when evaluating liver parenchymaaffected by chronic hepatitis, as the quality of the obtained specimens can greatly influence
Risks and Benefits of Liver Biopsy in Focal Liver Diseasehttp://dx.doi.org/10.5772/52620
91

the semi-quantitative scores developed in the last four decades to quantify disease progres‐sion. There are a number of changes present within the liver and their heterogeneity makesthe “10-complete portal spaces” paradigm essential when evaluating disease severity. Allscoring systems are bound to yield significantly different results, primarily because of sam‐ple variability, but also as a result of the different levels of expertise from the pathologistinvolved in their evaluation. All modifications of the liver parenchyma – inflammation, ne‐crosis or fibrosis – exhibit particularities and can be subjectively interpreted even in a scor‐ing system [8].
The first approach to liver biopsy scoring for chronic hepatitis dates from the early 1980swhen the histological activity index (HAI) was introduced by Knodell and Ishak [21]. Thismodel did not clearly delimited between disease grades (that is, the importance of any in‐flammatory activity present) and stage, which refers to the degree of fibrosis and parenchy‐mal remodeling. The later modification performed by Ishak resolves most of these issuesand is currently used worldwide, partially replacing or at least complementing the earlieralternative Knodell classification. The preferred approach is a parallel evaluation using sev‐eral scoring methods, such as the modified HAI, the Scheuer or the Ludwig systems and theKnodell classification, or the METAVIR algorithm devised in France [23].
5.2. Abnormal hepatic biochemical tests, alcoholic and non-alcoholic liver disease
Chronically elevated hepatic biochemical parameters are a common concern for many pa‐tients during routine screenings or general consults. Gastroenterologists facing abnormal as‐partate aminotransferase/alanine aminotransferase, gamma-glutamyltransferase or alkalinephosphatase levels have to conduct a thorough anamnesis to determine the underlying con‐dition. Many such patients either acknowledge high alcohol consumption or are diagnosedwith non-alcoholic liver disease (NAFLD) associated with their lifestyle, while few remainundiagnosed until they begin to display signs of liver cirrhosis (cryptogenic cirrhosis or cir‐rhosis of unknown etiology). The latter two classes are usually diagnosed through liver bi‐opsy, as no other condition can be found from either their background or non-invasiveinvestigations and blood tests [8, 16].
The most common aspect revealed by liver biopsy in these patients is macrovesicularsteato‐sis, intracellular lipid accumulation exceeding 5% of the total cellular population. This mac‐rosteatosis is generally coined as fatty liver disease (FLD) and can either be identified aseither alcoholic liver disease (ALD), when regular alcohol consumption above establishedthresholds is established, or NAFLD when obesity, type 2 diabetes mellitus and/or hyperli‐pidemia are associated. Steatohepatitis, either of alcoholic origin (alcoholic steatohepatitis –ASH) or metabolic (non-alcoholic steatohepatitis – NASH) share histological similarities.NASH is recognized as a form of NAFLD with ballooning hepatocytes and necroinflamma‐tory changes, as well as fibrosis and parenchymal remodeling. The NAFLD activity score(NAS) was developed in an attempt to objectively quantify the extension of this disease.This score sums the three pathologic features – steatosis, lobular inflammation and hepato‐cellular ballooning on a 0 to 8 scale, 5 being the cut-off point for a certain diagnose of NASHand 3–4 being labeled as borderline steatohepatitis [36, 37].
Liver Biopsy – Indications, Procedures, Results92

Currently, even though liver biopsy is still regarded as the “gold standard” when diagnos‐ing these conditions, no consensus has been reached. Liver biopsy remains therefore a con‐troversial decision which ultimately has to be performed only when a clear diagnosis cannotbe extracted from serum values, imagistic findings and clinical features [38].
5.3. Metabolic liver disease
Diseases that determine intrahepatic iron accumulation are the main indications for liver bi‐opsy when a metabolic condition is suspected, besides NAFLD or ALD. Hereditary hemo‐chromatosis, in its various forms identified today, is routinely diagnosed and stagedthrough liver biopsy [8, 39]. The metabolic syndrome (syndrome X) represents the increasedaccumulation of iron within hepatocytes, in the context of NAFLD. These deposits are notdistributed equally among various regions of the liver, therefore deeper biopsies are neededin order to collect more tissue for analysis [8, 40]. For this purpose, at least two scores arecurrently used – the Deugnier and the Brissot scores [41, 42]. The hepatic iron index is calcu‐lated through a mathematical formula which takes into account the hepatic iron concentra‐tion (evaluated by liver biopsy), its atomic weight as well as the age of the patients. Anindex above 1.9 is an indicator of hemochromatosis; however its sensitivity is low as it is de‐pendent on the timing of the liver biopsy [8].
5.4. Focal liver lesions
Discovery of a focal liver lesions (FLL) can occur after imaging tests used routinely for eitherscreening or diagnosis. The practitioner may encounter lesions of various sizes, number andlocation, some of them being associated with pre-existing conditions. This is especially thecase of primary liver malignant tumors, either hepatocellular carcinoma (HCC) or cholan‐gyocarcinoma (CC). Early discovery of a FLL is possible in up to 60% of all cases, especiallyin developed countries where surveillance programs are well established and health serv‐ices are available to the majority of the population, irrespective of their location and eco‐nomic status [43, 44].
Imaging alone is currently the main diagnostic procedure for HCC, as modern contrast-en‐hanced techniques, either by CT or MRI, are sufficient to highlight the hallmark pattern oftumor vascularization. Diagnostic criteria in the United States of America, Europe and Asiastipulate that imaging techniques are sufficient to diagnose the majority of HCC lesions, bi‐opsy being reserved for the few situations where imaging is unclear, discordance betweentwo methods exists, or tumor size does not allow a precise imaging diagnosis [43–45]. A de‐fining criteria for evaluating FLLs is the presence of an underlying hepatic condition such ashepatitis or cirrhosis.
When HCC is suspected in cirrhotic patients, criteria for liver biopsy are set by the size ofthe tumor. In nodules between 1 and 2 centimeters, diagnosis should ideally be based onnon-invasive criteria; however, confirmation through biopsy should be sought wheneverpossible. The evaluation should be performed ideally by a pathologist with extensive experi‐ence in evaluating liver biopsies. In case of inconclusive findings after the initial biopsy, a
Risks and Benefits of Liver Biopsy in Focal Liver Diseasehttp://dx.doi.org/10.5772/52620
93

second one should be performed if no other imaging criteria are present during the evalua‐tion period. Nodules larger than 2 centimeters discovered through routine US should be ide‐ally diagnosed through non-invasive procedures; however, when radiological findings areatypical, a liver biopsy should be obtained as confirmation [43–45]. A panel of immunohisto‐chemical markers was proposed as diagnostic when evaluating liver biopsies for HCC. Acombination of glypican 3, heat shock protein 70 and glutamine synthetase are recommend‐ed for the differential diagnosis between early HCC and high grade dysplastic nodules [46](Di Tomaso et al, 2009). A final recommendation of the EASL-EORTC guidelines is that liverbiopsy should be performed within controlled settings of scientific research, for identifyingnew markers for HCC and for tissue bio-banking[44].
The current tendency in diagnostic medicine is to avoid liver biopsy when evaluating HCC[44]. The main reasons against performing liver biopsy are the high rate of sampling errorswhich would diminish the sensitivity of the investigation; a higher rate of recurrence post-transplant in patients who underwent liver biopsy and finally the small but well-establishedrisk of needle track seeding. In transplant referral centers, liver biopsy is performed morefrequently, as there is an increased need for a correct final diagnosis; however, these proce‐dures are subject to wide variation depending on country-specific regulations [43, 44]. An‐other argument for liver biopsy in HCC cases that benefit from chemotherapy would be theimportance of histological grading. Response to local or systemic anti-angiogenic or anti-proliferative agents might be dictated by the microscopic configuration of the tumor and theamount of angiogenesis markers present on histological samples [16].
The second most important primary liver malignancy is CC. It can also develop in the pres‐ence of an underlying liver condition, such as chronic biliary tract diseases. Imaging diagno‐sis is sometimes difficult, as it may present similar contrast-enhancing patterns to those ofHCC – the majority of CCs are solitary masses present in the hilum, while a minority candevelop in other regions [43, 44]. Mixed forms of CC/HCC may also be present, their non-invasive diagnosis being even more difficult. All these forms of either atypical CCs or mixedpresentations are usually subjected (with various degrees of variability, depending on set‐ting and context) to liver biopsy. Surgical intervention, either by resection or liver trans‐plant, are the approaches that yield the best survival chances for the patient. Therefore, liverbiopsy may be indicated, as well as concomitant biopsy of lymph nodes in the upper ab‐dominal area [16].
Metastases have the overall highest incidence amongst malignant liver lesions [47]. When asecondary malignant liver lesion is suspected and the physician cannot identify the primarypoint, liver biopsy is usually diagnostic, even when imaging fails to provide enough detail.If an underlying parenchymal disease is also suspected, biopsy should be performed outsidethe lesion site as well, for an extended and more precise diagnosis. A vast panel of markersmay be employed in an immunohistochemistry study; however, the histologic architectureidentified through normal techniques may be sufficient for an expert pathologist to deter‐mine the primary site of origin [1, 16].
Other rare primary liver parenchyma or bile duct malignant or benign neoplasms can ulti‐mately be identified through histological analysis, after careful imaging-guided liver biop‐
Liver Biopsy – Indications, Procedures, Results94

sy is performed. This diagnosis is often not possible on cross-sectional imaging studies aswell as tumor serum markers, as their specificity for such lesions is inadequate. An experthepatologist should closely collaborate with an experimented pathologist, as the diagnosisis difficult most of the times. These lesions may develop in the presence of an underlyingliver condition, which would aid the clinical diagnosis or suspicion on the part of theclinician [1, 16].
The majority of lesions discovered through imaging techniques in patients without pre-ex‐isting liver conditions are benign in origin, mostly solitary or occasionally multiple. They ex‐hibit particular vascular patterns in contrast-enhanced imaging techniques and are thuseasily diagnosed without the use of invasive techniques. Such is the case of liver hemangio‐mas, mostly solitary benign tumors with characteristic contrast enhancement throughout allphases of an imaging investigation. Other lesions such as focal nodular hyperplasia are alsousually solitary and may display distinct features such as “central scarring” or particular en‐hancement patterns (spiked wheel enhancement etc.). All these particularities have a mor‐phological substrate: central hypoechoic areas which do not show vascularhyperenhancement usually correspond to areas of necrosis; intense signal enhancementzones are indicators of high microvessel density and neo-angiogenesis vessels; the US or CTperipheral rim translate in certain particularities of fibrous capsules [1, 16, 44].
Overall, lesions may present as cystic, solid or vascular; all these particularities usually be‐ing identified through non-invasive procedures prior to liver biopsy. In the USA for in‐stance, liver biopsy is performed by imagists as they can perform the pre-biopsy or real-timeassessment of the procedure, while in Europe most gastroenterologists or hepatologists per‐form the procedure themselves, under US surveillance [43, 44]. A core biopsy is usually pre‐ferred to fine-needle aspiration, as histology is considered superior from a diagnosticperspective compared to cytology; another reason being that experts in evaluating histologyare more numerous compared to cytologists. The risk of puncturing blood vessels, eithermajor arteries in the normal parenchyma, or intra-tumoral vessels is considerably diminish‐ed by real-time imaging guidance, for instance US with color Doppler. The risk of trackseeding exists, even if extremely low (one study estimates a risk of 0.13%, while in otherstudies no such incidents were reported) [48, 49]. A certain dependency on the techniqueand size of the needle was also proven [50]. Infectious lesions may be biopsied; even if echi‐nococcal cysts were considered an absolute contraindication as puncturing can be associatedwith anaphylactic shock and death, it was proven that these lesions can be aspirated with 19or 22-gauge needles, taking all preparations for possible anaphylaxis [51].
6. Novel techniques in liver biopsy; modern non-invasive alternatives
6.1. Probe-based confocal laser endomicroscopy
The latest development in histological evaluation of gastrointestinal structures is confocal la‐ser endomicroscopy. It allows for the in vivo evaluation of dysplasia and malignancies ofthe gastrointestinal tract, or in order to obtain directed biopsies that would allow rapid and
Risks and Benefits of Liver Biopsy in Focal Liver Diseasehttp://dx.doi.org/10.5772/52620
95

more precise diagnoses [52, 53]. The first embodiments of this technique required dedicatedendoscopes to be used for evaluating cavitary structures accessible from both ends of the di‐gestive tracts.
Recent advancements however were able to miniaturize the technology so the imaging mi‐croprobe can be connected to 30,000 fiber-optic threads that enable point-to-point real-timedetection at 12 frames/sec. The imaging device by itself measures less than 1.5 millimeters indiameter, thus allowing its use through 19G or tru-cut biopsy needles, or insertion by lapa‐roscopy or NOTES [53]. This technology will allow in vivo, real-time imaging of liver histol‐ogy, technically enhancing the capabilities of liver biopsy [54]. A few studies on animalmodels exist in the literature, detailing pCLE use for liver histological imaging [14, 55, 56].The technique can be used for assessing the state of hepatocytes and the morphology of theliver tissue, or can be limited to the study of the exterior liver capsule, yielding interestingpreliminary results in the setting of cirrhosis. Mennone et al reported interesting results re‐garding a fibrotic pattern and collagen deposits in animal models with cirrhosis induced bybile duct ligation [14]. The technology shows promise and may someday allow for safer his‐tological assessment of patients with chronic liver disease irrespective of its advancement,either cirrhotic or having any extreme complications, such as HCC.
6.2. Non-invasive imaging and serum tests for the assessment of fibrosis
Transient elastography (TE, Fibroscan® developed by Echosens, Paris, France) and Acousticradiation force impulse (ARFI) are two ultrasound-based methods for quantifying liver fib‐rosis without the need for histological assessment. Another approach is through serummarkers of fibrosis quantification, processed in complex mathematical formulas which givea quantitative result for liver stiffness, such as the Fibrotest, Biopredictive and the aspartatetransaminase to platelets ratio index (ARPI) approaches.
TE is a novel and rapid non-invasive examination which involves minimal patient discom‐fort over a relatively low time period (one examination may take up to 5-10 minutes de‐pending on the skeletal and adipose conformations of the patient). The device consists of ahand-held vibrating unit with an ultrasound transducer probe mounted on its axis, whichgenerates medium amplitude vibrations at a low frequency, thus inducing an elastic shearwave in the underlying tissue. The hand-held probe is connected to a modified tower USmachine which registers the result and through the on-screen software interface presents theuser with an elastogram as a function of depth in time. The patient lies on his/her side andthe probe is placed against the skin on the median clavicle line, directed towards the ana‐tomical location of the liver, at a 90 degrees angle with the skin surface. Its results are pre‐sented as kilo Pascals (kPa), units of applied force. A series of 10 measurements aremediated to present a final value of the liver stiffness, which is equivalent to an F-stage fib‐rosis measurement obtained through biopsy [2].
ARFI is another technology that uses short-duration, high-intensity acoustic pulses which inturn exert mechanical excitation upon the tissues, generating local displacement resulting inshear waves. Their velocity can be assessed in a selected cylindrical area of interest of 0.5 cm
Liver Biopsy – Indications, Procedures, Results96

(length) x 0.4 cm (diameter), up to 5.5 cm below skin level. Its results are expressed as veloci‐ties, in m/s [4].
Fibrotest-Actitest (Biopredictive, France) is a serologic marker-based algorithm which repre‐sents an alternative to invasive biopsy techniques. It received clinical validation in patientswith chronic hepatitis B and C, ALD and NAFLD. Fibrotest consists of a panel of markersdesigned for appreciating liver fibrosis: Gamma-glutamyltranspeptidase (GGT), Total biliru‐bin Alpha-2-macroglobulin, Haptoglobin, and Apolipoprotein A1. Necroinflammatory ac‐tivity is appreciated through the Actitest component, which adds Alanine transaminase(ALT) to the above mentioned serum markers [3, 57]. All these tests are performed in vali‐dated laboratories due to their complexity and variability of their different components andtheir results are inserted in a complex mathematical formula through a web-based interface,the end-result being correlated with other quantitative score systems such as METAVIR,Knodell or Ishak [58].
The best results are provided by a combination of two or more non-invasive methods, onestudy in particular finding that Fibrotest and Fibroscan offers the best diagnosis perform‐ance compared to liber biopsy as a gold standard, at least for advanced fibrosis (F valuesbeyond 2) or cirrhosis (F3 or F4) [2]. This conclusion was reached by another, more recentstudy performed by Boursier and his collaborators [59]. They diminish the number of pa‐tients who require liver biopsy, however, this procedure is not excluded in all cases. Somestudies have shown a high variability between Fibroscan results, dependent of the body-mass index and population factors [60, 61]. A discordance between liver biopsy staging andthe estimation provided by non-invasive methods has also been identified [34]. It was ap‐proximated that 30–40% of all patients investigated by a combination of non-invasive imag‐istic and marker-based methods still require liver biopsy, during either sequential orsimultaneous protocols [60, 61].
7. Conclusion
Despite all its limitations and the advances in modern lesser invasive techniques, liver biop‐sy remains the gold standard for evaluating a wide array of liver diseases.
The main concern when turning to tissue sampling through biopsy is the risk/benefit ra‐tio, the decision ultimately belonging to the clinician involved. The risks may at times behigher than the implied diagnostic outcome, in which case other methods are preferredfor the diagnosis.
Currently, it is recommended that all interpretations should be based on proper tissueblocks, with the correct technique applied. It is preferred that more than one pathologistwith extensive experience in liver pathology should formulate the final histological diagno‐sis. This is especially true for FLLs and liver malignancies, as benign features may at timesoverlap, making the diagnosis uncertain.
Risks and Benefits of Liver Biopsy in Focal Liver Diseasehttp://dx.doi.org/10.5772/52620
97

Modern imagistic techniques allow for precise non-invasive evaluation of liver fibrosis inthe context of hepatitis; however, the correct methodology for interpreting these tests is yetto be established. Novel imagistic approaches may in time open new perspectives for liverbiopsy, by providing in vivo, real time data on liver parenchymal features which wouldprove useful for accurate diagnosing of otherwise difficult to interpret pathologies.
Author details
Letiția Adela Maria Streba, Eugen Florin Georgescu and Costin Teodor Streba
University of Medicine and Pharmacy of Craiova, Romania
References
[1] Kuntz E, Kuntz H–D. Liver biopsy and laparoscopy. In: Hepatology: Textbook andAtlas. 3rd Edition (2008); pp 149–176. Springer, USA. 3540768386.
[2] Castéra L, Vergniol J, Foucher J et al. Prospective comparison of transient elastogra‐phy, Fibrotest, APRI, and liver biopsy for the assessment of fibrosis in chronic hepati‐tis C.Gastroenterology. 2005;128:343-50.
[3] Halfon P, Munteanu M, Poynard T. FibroTest-ActiTest as a non-invasive marker ofliver fibrosis". GastroenterolClin Biol. 2008; 32: 22–39
[4] Crespo G, Fernández-Varo G, Mariño Z, et al. ARFI, FibroScan®, ELF, and their com‐binations in the assessment of liver fibrosis: A prospective study. J Hepatol.2012;57:281-7.
[5] Goetz M, Kiesslich R, Dienes HP et al. In vivo confocal laser endomicroscopy of thehuman liver: a novel method for assessing liver microarchitecture in real time. En‐doscopy. 2008;40:554-62.
[6] Myers RP, Fong A, Shaheen AA. Utilization rates, complications and costs of percu‐taneous liver biopsy: a population-based study including 4275 biopsies. Liver Int2008, 28:705-12.
[7] Bravo AA, Sheth SG, Chopra S. Liver biopsy. N Engl J Med. 2001;344:495-500.
[8] Zimmermann A. Biopsy and laparoscopy. In: Textbook of hepatology: From BasicScience to Clinical Practice, 3rd Edition. Rodes J (Ed.). (2007); pp 489–99. Wiley-Black‐well. Massachusetts, USA. 978-1-4051-2741-7.
[9] Mammen T, Keshava SN, Eapen CE, Raghuram L, Moses V, Gopi K, Babu NS, Rama‐chandran J, Kurien G. Transjugular liver biopsy: a retrospective analysis of 601 cases.J VascIntervRadiol 2008, 19:351-8.
Liver Biopsy – Indications, Procedures, Results98

[10] Kalambokis G, Manousou P, Vibhakorn S, et al. Transjugular liver biopsy - Indica‐tions, adequacy, quality of specimens, and complications - A systematic review. JHepatol 2007;47:284-294.
[11] Cholongitas E, Senzolo M, Standish R, Marelli L, Quaglia A, Patch D, Dhillon AP,Burroughs AK. A systematic review of the quality of liver biopsy specimens. Am JClinPathol 2006, 125:710-21.
[12] Denzer U, Arnoldy A, Kanzler S, et al. Prospective randomized comparison of mini‐laparoscopy and percutaneous liver biopsy: diagnosis of cirrhosis and complications.J ClinGastroenterol 2007;41:103-110.
[13] Steele K, Schweitzer MA, Lyn-Sue J, Kantsevoy SV. Flexible transgastricperitoneosco‐py and liver biopsy: a feasibility study in human beings (with videos). Gastrointes‐tEndosc 2008;68:61-66.
[14] Mennone A, Nathanson MH. Needle-based confocal laser endomicroscopy to assessliver histology in vivo. GastrointestEndosc. 2011;73:338-44.
[15] Goessling W, Friedman FS (2006). Evaluation of the Liver Patient. In: The clinician’sguide to liver disease, K. Rajender Reddy (Ed.),. SLACK Inc. USA: 1–31.
[16] Rockey DC, Caldwell SH, Goodman ZD et al. Liver biopsy. Hepatology.2009;49:1017-44.
[17] Guido M, Rugge M. Liver biopsy sampling in chronic viral hepatitis. Semin LiverDis. 2004;24: 89–97.
[18] Colloredo G, Guido M, Sonzogni A et al. Impact of liver biopsy size on histologicalevaluation of chronic viral hepatitis: the smaller the sample, the milder the disease. JHepatol, 2003; 39, 239–244.
[19] Regev A, Berho M, Jeffers LJ et al. Sampling error and intra-observer variation in liv‐er biopsy in patients with chronic HCV infection. Am J Gastroenterol. 2002; 97, 2614–2618.
[20] Siddique I, El-Naga HA, Madda JP et al. Sampling variability on percutaneous liverbiopsy in patients with chronic hepatitis C virus infection. Scand J Gastroenterol.2003; 38, 427–432.
[21] Knodell RG, Ishak KG, Black WC, et al. Formulation and application of a numericalscoring system for assessing histological activity in asymptomatic chronic active hep‐atitis. Hepatology 1981;1:431-435.
[22] Ishak K, Baptista A, Bianchi L, et al. Histological grading and staging of chronic hep‐atitis. J Hepatol 1995;22:696-699.
[23] METAVIR Cooperative Study Group. Intraobserver and interobserver variations inliver biopsy interpretation in patients with chronic hepatitis C. Hepatology. 1994; 20,15–20.
Risks and Benefits of Liver Biopsy in Focal Liver Diseasehttp://dx.doi.org/10.5772/52620
99

[24] Bejarano PA, Koehler A, Sherman KE. Second opinion pathology in liver biopsy in‐terpretation. Am J Gastroenterol 2001;96:3158-3164.
[25] Tomaszewski JE, Bear HD, Connally JA, et al. Consensus conference on second opin‐ions in diagnostic anatomic pathology. Who, what, and when. Am J ClinPathol2000;114:329-335.
[26] Hahm GK, Niemann TH, Lucas JG, Frankel WL. The value of second opinion in gas‐trointestinal and liver pathology. Arch Pathol Lab Med 2001;125:736-739.
[27] Kay EW, O’Dowd J, Thomas R et al. Mild abnormalities in liver histology associatedwith chronic hepatitis: distinction from normal liver histology. J ClinPathol. 1997; 50,929–931.
[28] Eisenberg E, Konopniki M, Veitsman E, Kramskay R, Gaitini D, Baruch Y. Prevalenceand characteristics of pain induced by percutaneous liver biopsy. AnesthAnalg2003;96:1392-1396.
[29] Janes CH, Lindor KD. Outcome of patients hospitalized for complications after out‐patient liver biopsy. Ann Intern Med 1993;118:96-98.
[30] Caldwell SH. Controlling pain in liver biopsy, or “we will probably need to repeatthe biopsy in a year or two to assess the response”. Am J Gastroenterol2001;96:1327-1329.
[31] Huang JF, Hsieh MY, Dai CY, Hou NJ, Lee LP, Lin ZY, et al. The incidence and risksof liver biopsy in non-cirrhotic patients: An evaluation of 3806 biopsies. Gut2007;56:736-737.
[32] Yu SC, Lo DY, Ip CB, et al. Does percutaneous liver biopsy of hepatocellular carcino‐ma cause hematogenous dissemination? An in vivo study with quantitative assay ofcirculating tumor DNA using methylation-specific real-time polymerase chain reac‐tion.AJR Am J Roentgenol. 2004;183(2):383-5.
[33] Lavanchy D. The global burden of hepatitis C. Liver Int. 2009;29 Suppl 1:74-81
[34] Kim SU, Kim JK, Park YN, Han K-H. Discordance between Liver Biopsy and Fibro‐Scan® in Assessing Liver Fibrosis in Chronic Hepatitis B: Risk Factors and Influenceof Necroinflammation. PLoS ONE. 2012; 7(2): e32233.
[35] Gebo KA, Herlong HF, Torbenson MS et al. Role of liver biopsy in management ofchronic hepatitis C – a systematic review. Hepatology, 2002; 36:S161–S172.
[36] Zafrani ES. Non-alcoholic fatty liver disease: an emerging pathological spectrum.Virchows Arch, 2004;444:3–12.
[37] Mendler MH, Kanel G, Govindarajan S. Proposal for a histological scoring and grad‐ing system for non-alcoholic fatty liver disease. Liver International. 2005; 25:294–304.
Liver Biopsy – Indications, Procedures, Results100

[38] Streba LAM, Cârstea D, Mitruţ P, Vere CC, Dragomir N, Streba CT. Nonalcoholic fat‐ty liver disease and metabolic syndrome: a concise review. Rom J MorpholEmbryol2008;49:13-20.
[39] Franchini M, Veneri D. Recent advances in hereditary hemochromatosis. Ann Hema‐tol. 2005;84:347–352.
[40] Moirand R, Mendler MH, Guillygomarc’hA et al. Nonalcoholic steatohepatitis withiron: part of insulin resistance-associated hepatic iron overload? J Hepatol.2000;33:1024–26.
[41] Deugnier YM, Turlin B, Powell LW et al. Differentiation between heterozygotes andhomozygotes in genetic hemochromatosis by means of a histological hepatic iron in‐dex: a study of 192 cases. Hepatology. 1993;17:30–34.
[42] Brissot P, Bourel M, Herry D et al. Assessment of liver iron content in 271 patients:areevaluation of direct and indirect methods. Gastroenterology. 1981; 80:557–565.
[43] Bruix J, Sherman M. Management of Hepatocellular Carcinoma: An Update. Hepa‐tology. 2011 53(3):1020-2.
[44] EASL-EORTC Clinical Practice Guidelines: Management of hepatocellular carcino‐ma. Journal of Hepatology 2012;56: 908-943.
[45] Omata M, Lesmana LA, Tateishi R, et al. Asian Pacific Association for the Study ofthe Liver consensus recommendations on hepatocellular carcinoma. Hepatol Int.2010; 4:439-474.
[46] Di Tommaso L, Destro A, Seok JY, et al. The application of markers (HSP70 GPC3and GS) in liver biopsies is useful for detection of hepatocellular carcinoma. J Hepa‐tol. 2009;50:746-54.
[47] Kasper HU, Drebber U, Dries V, Dienes HP. [Liver metastases: incidence and histo‐genesis].Z Gastroenterol. 2005;43(10):1149-57.
[48] Tung WC, Huang YJ, Leung SW, Kuo FY, Tung HD, Wang JH, et al. Incidence of nee‐dle tract seeding and responses of soft tissue metastasis by hepatocellular carcinomapostradiotherapy. Liver Int 2007;27:192-200.
[49] Bialecki ES, Ezenekwe AM, Brunt EM, Collins BT, Ponder TB, Bieneman BK, et al.Comparison of liver biopsy and noninvasive methods for diagnosis of hepatocellularcarcinoma. ClinGastroenterolHepatol 2006; 4:361-368.
[50] Maturen KE, Nghiem HV, Marrero JA, Hussain HK, Higgins EG, Fox GA, et al. Lackof tumor seeding of hepatocellular carcinoma after percutaneous needle biopsy usingcoaxial cutting needle technique. AJR Am J Roentgenol 2006;187:1184-1187.
[51] Khuroo MS, Wani NA, Javid G, Khan BA, Yattoo GN, Shah AH, et al. Percutaneousdrainage compared with surgery for hepatic hydatid cysts. N Engl J Med1997;337:881-887.
Risks and Benefits of Liver Biopsy in Focal Liver Diseasehttp://dx.doi.org/10.5772/52620
101

[52] Hsiung PL, Hardy J, Friedland S, et al. Detection of colonic dysplasia in vivo using atargeted heptapeptide and confocal microendoscopy. Nat Med. 2008;14:454–458.
[53] Hoffman A, Goetz M, Vieth M, et al. Confocal laser endomicroscopy: technical statusand current indications. Endoscopy. 2006;38:1275–1283.
[54] Ray K. Imaging: confocal endomicroscopy enables deeper in vivo imagingof humanliver. Nat Rev GastroenterolHepatol 7: 417, 2010.
[55] Becker V, Wallace MB, Fockens P, et al. Needle-based confocal endomicroscopyfor invivo histology of intra-abdominal organs: first results ina porcine model (with vid‐eos). GastrointestEndosc. 2010;71: 1260–1266.
[56] Goetz M, Deris I, Vieth M et al. Near-infrared confocal imaging during minilaparo‐scopy:a novel rigid endomicroscope with increased imaging planedepth. J Hepatol.2010; 53: 84–90.
[57] Ngo Y, Munteanu M, Messous D, et al. A prospective analysis of the prognostic val‐ue of biomarkers (FibroTest) in patients with chronic hepatitis C. Clin Chem. 2006;52: 1887–96.
[58] Imbert-Bismut F, Messous D, Thibault V, et al. Intra-laboratory analytical variabilityof biochemical markers of fibrosis (Fibrotest) and activity (Actitest) and referencesranges in healthy blood donors. ClinChem Lab Med. 2004;42: 323–333.
[59] Boursier J, Vergniol J, Sawadogo A, et al. Thecombination of a blood test and Fibro‐Scan improves the non-invasivediagnosis of liver fibrosis. Liver Int 2009;29:1507–1515.
[60] Kim SU, Choi GH, Han WK, et al.What are ‘true normal’ liver stiffness values usingFibroScan?: a prospectivestudy in healthy living liver and kidney donors in SouthKorea.Liver Int 2010;30:268-274.
[61] Das K, Sarkar R, Ahmed SM, Mridha AR et al.‘‘Normal’’ liver stiffness measure(LSM) values are higher in both leanand obese individuals: a population-based studyfrom a developing country.Hepatology. 2012;55:584-593.
Liver Biopsy – Indications, Procedures, Results102

Chapter 6
Current Trends in Liver BiopsyIndications for Chronic Liver Diseases
Jean-François Cadranel andJean-Baptiste Nousbaum
Additional information is available at the end of the chapter
http://dx.doi.org/10.5772/52618
1. Introduction
At the present time, pathological examination of a liver fragment obtained by liver biopsyremains an essential diagnostic tool of numerous chronic liver diseases [1] Indications forliver biopsy (LB) have changed considerably over recent years due to the development ofsensitive and specific tests for diagnosis of several chronic liver diseases (i.e., serology forhepatitis C, antimitochondrial M2 in primary biliary cirrhosis, genetic screening for he‐reditary hemochromatosis), but also because of intensive development during the last dec‐ade of non-invasive assessment of fibrosis using serum tests (FibroTest®, FibroMeter®,APRI score) and/or by physical methods such as pulsed elastography (FibroScan®), inparticular, for chronic hepatitis C. Ultrasound-guided liver biopsy is often necessary to ob‐tain a tumor fragment in cases of suspected primary or secondary liver malignancy andwill not be discussed here [1]. In the present article, we will limit ourselves to indicationsof liver biopsy in diffuse parenchymal disease of the liver and its relative and absolutecontraindications. Modalities for performing liver biopsy and complications will not bediscussed here. Liver biopsy is an invasive procedure with possible complications; thus,individual benefits for the patient must be weighed against possible risks. Liver biopsy isindicated when the expected amount of information obtained exceeds the risks related tothe procedure, when the diagnosis required for establishing a prognosis cannot be ob‐tained without pathological examination of the liver, and finally, when the treatment deci‐sion depends on pathological results [1].
© 2012 Cadranel and Nousbaum; licensee InTech. This is an open access article distributed under the terms ofthe Creative Commons Attribution License (http://creativecommons.org/licenses/by/3.0), which permitsunrestricted use, distribution, and reproduction in any medium, provided the original work is properly cited.

2. Indications for LB
Indications for liver biopsy in chronic liver disease have evolved (Tables 1,2). The main ad‐vantages of LB with respect to the etiology of liver disease are shown in Table 2 and will bedetailed later. The indication for liver biopsy is appropriate when the treatment or prognosiswill be modified by results of histopathological examination of the liver. However, liver bi‐opsy is not appropriate when the therapeutic decision and/or establishment of a diagnosisdoes not depend on histological findings [1].
Indications
For diagnostic purposes - Combination of several parenchymal liver diseases - Abnormal liver tests of unknown origin *.
- Fever of unknown origin.
- Focal or diffuse abnormalities on imaging studies.
For prognostic purposes - Assessment of known parenchymal liver diseases.
For research purposes - Development of treatments related to results of histological analysis
* After complete check-up, according to (2)
Table 1. Indications for liver biopsy
Cause of liver disease Diagnosis Evaluation of
fibrosis
Prognosis Management
Hepatitis B - +++ + (+) +++
Hepatitis C - +++
(Non-invasive markers
of fibrosis)
+ (+) ++++
Hemochromatosis +/- +++ + (+) +
Wilson's disease ++ +++ + -
α-1 Antitrypsin deficiency + +++ Depends on lung status +
Autoimmune hepatitis
In particular,
seronegative
+++ +++ + ++++
Primary biliary cirrhosis / overlap
syndrome
++ +++ +++ ++
Primary sclerosing cholangitis ++ +/0 0 +
Alcoholic liver disease +/- ++ ++ +
Severe acute alcoholic hepatitis +++ NA NA +
Steatosis / steatohepatitis +++ +++ + +
Infiltrative lesions of the liver ++++ NA NA +
Medicinal cause ++ NA NA +
Follow-up after liver transplantation ++++ +++ + +
NA: not applicable
Table 2. Utility of liver biopsy in clinical practice for diffuse parenchymal damage
Liver Biopsy - Indications, Procedures, Results104

Etiology 1997 Study [31]
of 2,084 biopsies
(%)
2009 Study [13]
of 8,580 biopsies
(%)
Hepatitis C 54.1 33.6
Delta hepatitis B 5.8 14.4
Hereditary hemochromatosis 4.3 1
Cholestatic disease of the
liver (primary biliary cirrhosis. primary
sclerosing cholangitis. chronic
cholestasis)
4.3 3.7
Autoimmune hepatitis 1 3.5
Liver transplantation 3 12.
Miscellaneous 17.6 12.2
Metabolic steatopathy unlisted 8.9
Table 3. Indications for liver biopsy. Evolutionary trend in France.
2.1. Chronic hepatitis C
Liver biopsy has long been the only reference for assessing necroinflammatory lesions andfibrosis in hepatitis C. Liver biopsy is most useful for evaluating the existence of co-morbidi‐ties: alcoholic liver disease, non alcoholic fatty liver disease and iron overload, which are es‐pecially common in patients with chronic hepatitis C. In 2002, the French consensusconference no longer recommended systematic liver biopsy in patients with consistentlynormal transaminases [2]. At that time, for patients recently contaminated with genotype 2or 3 infection, without co-morbidity and/or when the indication was viral eradication inde‐pendently of fibrosis data, then antiviral treatment could be undertaken without requiringLB [2]. Furthermore, liver biopsy is not useful when diagnosis of cirrhosis is obvious [2].While abdominal ultrasonography is satisfactory for assessing the existence of steatosis, liv‐er biopsy is needed in order to evaluate the existence of steatohepatitis, iron overload or al‐coholic liver disease associated with hepatitis C. Such lesions are associated with more rapidfibrosis progression and a less favorable response to treatment. The major development overthe last ten years, spurred by French teams, of non-invasive assessment of fibrosis duringthe course of hepatitis C has significantly reduced indications for liver biopsy in patientswith chronic hepatitis C. Several serum tests (FibroTest®, FibroMeter®, Hepascore®) arecurrently being validated by the French High Authority of Health for establishing extent offibrosis in patients with untreated chronic hepatitis C and no co-morbidity [3-5]. The FibroT‐est has been validated by numerous studies and several independent teams [6]. The FibroM‐eter ® virus [9] has also been the subject of independent validations by different teams.FibroScan ® is useful for confirming or ruling out the presence of cirrhosis [7, 8], and forpatients with HIV-HCV co-infection. In a recent survey, the use of liver biopsy was reducedby 50 % for chronic hepatitis C patients [9]. Most hepatologists in France no longer recom‐
Current Trends in Liver Biopsy Indications for Chronic Liver Diseaseshttp://dx.doi.org/10.5772/52618
105

mend first-line liver biopsy for chronic hepatitis C (Table 4). Discrepancy between results ofserum fibrosis markers and FibroScan®, when performed simultaneously, is an indicationfor liver biopsy.
Transparietal liver biopsy Transjugular liver biopsy
Absolute contraindications:
Absence of patient cooperation
Clotting abnormalities (see text)
Need to maintain anticoagulants or antiplatelets
Vascular lesion along the puncture route
Non-percussive or non-identifiable liver
Hydatid cyst
Suspicion of amyloidosis
Hydatid cyst
Cholangitis
Bile duct dilatation
Uncorrected hemostasis deficits
Relative contraindications
Morbid obesity
Ascites
Infection of the right pleural cavity
Table 4. Contraindications to transjugular and transparietal liver biopsy
2.2. Hepatitis B and hepatitis B-delta
Serum markers of non-invasive necroinflammatory lesions and fibrosis in hepatitis B and B-delta have not been fully validated, nor has the FibroScan [10, 11]. Scientific institutions rec‐ommend that liver biopsy be performed prior to any treatment decision in the context ofchronic hepatitis B or B-delta. Liver biopsy is the best means of assessing necroinflammatorylesions and fibrosis in chronic hepatitis B [12]. The evolutionary trend in indications for liverbiopsy for hepatitis C and B has been inverted over the last twelve years: the number of liverbiopsies for hepatitis C in 2009 represented 33.6%, compared to 54.1% in 1997, this trend be‐ing related to development of non-invasive measures for assessing fibrosis; however, thenumber of liver biopsies for hepatitis B and delta-B has tripled in France [13] (Table 4). Thisis probably related to the increased number of patients with hepatitis B in France and theemergence of more effective treatment, along with insufficient validation of non-invasivefibrosis assessment methods.
2.3. Alcoholic liver disease
Liver biopsy remains essential in case of severe acute alcoholic hepatitis with Maddrey func‐tion above 32. In this situation, lesions of acute alcoholic hepatitis are absent in 20% of cases[14], while the benefit of corticosteroids in the absence of alcoholic hepatitis lesions has notbeen demonstrated with an increased risk of bacterial infection. However, this point hasbeen debated by some authors [15]. When there are no signs of severe acute alcoholic hepati‐
Liver Biopsy - Indications, Procedures, Results106

tis and if extensive fibrosis or cirrhosis is suspected, then the Fibrotest® [16]and FibroScan®[17] give satisfactory diagnostic performances.
2.4. Non alcoholic fatty liver disease
In patients with hepatic steatosis as part of the metabolic syndrome, liver biopsy is usefulfor differentiating fatty lesions from steatohepatitis (NASH), the evolutionary potential ofwhich is much more severe (risk of cirrhosis and hepatocellular carcinoma ). The presence ofbody mass index > 30 kg/m², AST/ALT ratio > 1, hypertriglyceridemia > 1.7 mmol/L, age > 50years and a syndrome of insulin resistance are predictors of steatohepatitis and fibrotic le‐sions. When elements of metabolic syndrome exist with or without steatosis visualized onultrasonography, then LB performed for what is referred to as “unexplained" cytolysis leadsto a diagnosis of steatosis and steatohepatitis lesions in 60% of the cases [18]. Liver biopsyenables accurate diagnosis of lesions and evaluation of the degree of fibrosis [1]. It should benoted, however, that in this setting, steatosis FibroMeter ® [19] and Fibromax® [20] can pro‐vide evidence of the existence of fibrosis and can predict the existence of NASH.
2.5. Cholestatic liver diseases, and autoimmune diseases of the liver
Diagnosis of primary biliary cirrhosis is based on identification of cholestasis associatedwith antimitochondrial M2 antibodies. Liver biopsy is not useful for diagnosis of primarybiliary cirrhosis [21], but is very useful for assessing the activity and extent of fibrotic le‐sions. FibroScan® in this indication can assess the presence or absence of cirrhosis [22]. Liverbiopsy is useful in case of a poor response to ursodeoxycholic acid and/or in case of a drasticincrease of transaminases. Liver biopsy is able to reveal moderate to severe lymphocyticpiecemeal necrosis that may fit into the context of overlap syndrome, requiring a change intherapy and the addition of corticosteroids. During the course of autoimmune hepatitis [1,23] , liver biopsy is necessary to assess piecemeal necrotic lesions and fibrosis stage. It is es‐pecially helpful in the absence of antibodies. In autoimmune hepatitis, no method of non-invasive evaluation of fibrosis has been developed. Liver biopsy is also necessary prior todiscontinuation of immunosuppressive therapy, since the presence of histological piecemealnecrotic lesions is associated with almost constant recurrence of outbreaks of cytolysis dele‐terious to the liver [24]. When confronted with possible chronic cholestasis, the diagnosis ofprimary sclerosing cholangitis is based on data from the magnetic resonance cholangiopan‐creatography (MRCP)[21]. Liver biopsy often confirms the diagnosis, but can appear normalin 25% of the cases. When MRCP is normal, liver biopsy enables diagnosis of cholangitis ofsmall bile ducts and, in all cases, helps to clarify lesions due to hepatic fibrosis [1, 21].
2.6. Genetic hemochromatosis
Diagnosis of hereditary HFE-gene-related hemochromatosis is based on the association ofhyperferritinemia with elevated saturation of transferrin and presence of the C282Y muta‐tion in the homozygous state. Thus, liver biopsy is not mandatory for diagnosis. It is stillindicated, however, when serum ferritin is higher than 1,000 µg/L, and/or when the ASTare increased and/or if hepatomegaly is present [25]. Simple markers (platelet count and
Current Trends in Liver Biopsy Indications for Chronic Liver Diseaseshttp://dx.doi.org/10.5772/52618
107
transaminases, possibly combined with the dosage of hyaluronic acid and/or use of Fibro‐Scan) can indicate the existence or absence of extensive fibrosis and help to guide indica‐tions for liver biopsy.
2.7. Unexplained abnormal liver tests
Liver biopsy is often proposed in case of unexplained abnormal liver tests, when physicalexamination, biochemical and serological tests, imaging investigation could not establish adiagnosis. In one study including 354 patients, non alcoholic fatty liver disease was the defi‐nite diagnosis in 64 % of the cases. Other lesions included drug induced liver injury, alcohol-related liver disease, auto-immune hepatitis, primary sclerosing cholangitis,primary andsecondary biliary cirrhosis, hemochromatosis, amyloid and glycogen storage disease, andcryptogenic hepatitis [26]. In another study including 272 patients, NAFLD represented 59.5% of the cases [18].
2.8. Other indications (Table 3)
Liver biopsy is essential for the diagnosis of rare diseases of the liver such as Wilson's dis‐ease, wherein the hepatic copper concentration has to be measured, a deficiency in al‐pha-1 antitrypsin with evidence of PAS-positive cells, overload diseases such as Gaucher’sdisease, and amyloidosis, when there exists no other alternative [2]. In case of amyloido‐sis, liver biopsy should be performed via the transjugular route, since there is a major riskof bleeding in case of LBP performed via the transparietal route. Liver biopsy also helpsin diagnosing rare diseases (nodular regenerative hyperplasia, congenital hepatic fibrosis)in case of prolonged abnormal liver function tests [1]. In case of severe acute hepatitis,emergency liver biopsy performed via the transjugular route may be particularly usefulfor diagnosing seronegative autoimmune hepatitis, infiltrative lesions of the liver, hepati‐tis or herpes [1]. Liver biopsy is essential for diagnosis of abnormalities in liver functiontests when monitoring patients after liver transplantation in order to give a positive differ‐ential diagnosis of the following anomalies: rejection, infection, drug-induced liver injury,bile duct injury and viral reinfection. In case of hepatitis C virus recurrence in the livertransplant, liver biopsy is indicated; however, the FibroScan® is currently being assessedfor evaluating damage from hepatic fibrosis. In case of suspected drug-induced hepatitis,liver biopsy may be useful if biochemical abnormalities persist beyond 3 months after ces‐sation of treatment or if there is evidence suggesting injury to the bile ducts, such as aprolonged cholestatic syndrome.
It is essential that the pathologist be provided with relevant and complete clinical and bio‐logical information. Such information should be available before performing liver biopsy insuspected cases of rare diseases of the liver, or when bacteriological seeding or special stain‐ing has to be performed [1], so that the fresh liver fragment is immediately transmitted tothe pathology or microbiology laboratory.
Liver Biopsy - Indications, Procedures, Results108

3. Limitations
Liver biopsy has remained the “gold standard” for years. However, it is imperfect since a largebiopsy is required to make an accurate assessment of fibrotic stage and inflammatory grade.Pathologists estimated that a 25 mm-long fragment obtained with a 16-G needle was necessaryto accurately determine the grade of chronic liver disease [27]. Colloredo et al. showed thateleven to fifteen complete portal tracts was the minimal number below which disease stagewas significantly underestimated [28]. In a large review of the literature including 10,027 LB,Cholongitas et al. showed that the mean ± SD length was 17.7±5.8 mm and the mean ± SD num‐ber of portal tract was 7.5±5.8 [29]. This implies that at least two passes would be necessary toobtain a 2.5 cm long specimen, thus potentially increasing the risk of complications.
4. Optimal methods for carrying out lb in 2012
Methods for performing LB will not be detailed here, but are available in practical guide‐lines [30]. Several issues will be addressed:
When all conditions are met, then "ambulatory" liver biopsy may be performed [30]. In thestudy published in 2000 (completed in 1997) [31], 27% of liver biopsies were performed onan outpatient basis, most often for chronic hepatitis C; this figure is currently at 45% [13].Several French teams have shown that outpatient liver biopsy is a safe and effective proce‐dure and that liver biopsy performed on an outpatient basis reduces discomfort and increas‐es the acceptability of subsequent examination conducted under the same conditions. If allconditions are not met and/or if organizational arrangements do not permit it, then liver bi‐opsy should be performed via traditional hospitalization.
LB is carried out by hepatogastroenterologists, radiologists and occasionally by surgeons.Currently, liver biopsy is performed in France by a hepatogastroenterologist in 63.5% of cas‐es, by a radiologist in 34.8% of cases and by a surgeon in 1.7% of cases [13]. The increasingnumber of liver biopsies performed by radiologists in France is linked to an increased num‐ber of biopsies performed using ultrasound guidance or guided real-time ultrasonography[30] and by the development of the transvenous route as compared to the transparietalroute. Indeed, in 1997, 9% of liver biopsies were performed via the transvenous route com‐pared to 22.4% in 2009 [13]. In the US, 50% of biopsies are performed by radiologists. In thatcountry, it is felt that the number of LB performed in order to gain sufficient expertise is atleast 40, carried out in the presence of an experienced radiologist [1].
5. Absolute and relative contraindications for LB
Absolute and relative contraindications for LB depend on the surgical approach recom‐mended. Contraindications for liver biopsy using the transjugular or transparietal route [1,30] are summarized in Table 4.
Current Trends in Liver Biopsy Indications for Chronic Liver Diseaseshttp://dx.doi.org/10.5772/52618
109

5.1. Lack of patient cooperation
Absence of patient cooperation is an absolute contraindication for transparietal LB. Indeed, incase of uncontrolled respiratory movements or agitation of the patient, the biopsy needle maycause a tear in the liver capsule, bleeding or a pneumothorax. If the patient is unable to main‐tain breath holding, or in the absence of expected cooperation, the question of the appropriate‐ness of the indication for liver biopsy must be raised. If this indication is maintained, then liverbiopsy under general anesthesia might be necessary, eventually via the transvenous route.
5.2. Hemostasis disorders, history of unexplained bleeding, hemostatic disease
It is recommended that transparietal liver biopsy should not be performed if the prothrombinrate is less than 50%, the platelet count is below 50 Giga/L or 60 Giga/L, if activated partialthromboplastine time is greater than 1.5-fold that of the control or when bleeding time islengthened. The need for maintaining an anticoagulant or an antiplatelet is also a contraindica‐tion to transparietal LB. Likewise, the existence along the puncture route of a hemangioma or avascular tumor is a contraindication for liver biopsy without real-time guidance. In this case,ultrasound-guided liver biopsy may eventually be used [1]. For patients with hemophilia,transvenous liver biopsy can be performed safely after correction of anomalies. In this indica‐tion, non-invasive blood markers of fibrosis and FibroScan® are particularly useful.
5.3. Impossibility of carrying out liver detection
The incapacity to detect the liver by percussion or ultrasound is an absolute contraindicationto performing transparietal liver biopsy, as is suspicion of hydatid cyst.
5.4. Dilatation of extrahepatic or cholangitic bile ducts
Dilatation of the extrahepatic bile ducts and cholangitis are contraindications to transparie‐tal liver biopsy [1].
5.5. Relative contraindications
Morbid obesity, severe ascites persisting after evacuation and infection of the right pleuralcavity are contraindications for transparietal liver biopsy [1]. The transvenous route can beused in all these settings, and especially in case of significant ascites, morbid obesity, vascu‐lar liver, anticoagulant or antiplatelet treatment that cannot be stopped, hemodialysis,chronic renal failure or suspicion of amyloidosis when liver biopsy is necessary. Contraindi‐cations for the transvenous route include bacterial cholangitis, hydatic cyst and uncorrecteddeficits in hemostasis [1, 30].
6. Reducing the risk of complications
Compliance with absolute and relative contraindications for liver biopsy should lead to adecrease in serious accidents due to LB, the presentation of which is beyond the scope of this
Liver Biopsy - Indications, Procedures, Results110

paper. Liver biopsy is an invasive procedure with the possible risk of severe complications,approximately 0.5/1,000 [1, 30]. Liver biopsy is a procedure for which there exists residualmortality [32]. Although serious complications have decreased over time, mortality afterperforming transparietal liver biopsy remains at 0.2% and deaths related to liver biopsy fordiffuse parenchymal liver amount to 1 out of 10,000 LB [32].This risk, however, has de‐creased dramatically over time because of improvement in indications for liver biopsy andcompliance with contraindications [32].
7. Conclusion
Liver biopsy remains useful for making an etiological diagnosis and a prognostic evaluationof many non-viral liver diseases, particularly in the context of autoimmune liver diseases, aswell as for monitoring liver transplant patients. Liver biopsy is of great value in cases of sev‐eral associated parenchymal diseases, so as to determine the extent of each, especially inhepatitis C. However, within the setting of isolated hepatitis C without co-morbidity, wefeel that first-line LB is no longer appropriate.
The authors declare that they have no conflicts of interest.
Author details
Jean-François Cadranel1 and Jean-Baptiste Nousbaum2
1 Service d’Hépato-Gastroentérologie et de Nutrition,Centre Hospitalier Laënnec, France
2 Service d’Hépato-Gastroentérologie, Hôpital de la Cavale Blanche, Brest, France
References
[1] Rockey DC, Caldwell SH, Goodman ZD, Nelson RC, Smith AD. Liver biopsy. Hepa‐tology. 2009; 49(3):1017-44..
[2] Dhumeaux D, Marcellin P, Lerebours E. Treatment of hepatitis C. The 2002 Frenchconsensus. Gut. 2003; 52(12):1784-7.
[3] Imbert-Bismut F, Ratziu V, Pieroni L, Charlotte F, Benhamou Y, Poynard T. Biochem‐ical markers of liver fibrosis in patients with hepatitis C virus infection: a prospectivestudy. Lancet. 2001; 357(9262):1069-75.
[4] Leroy V, Hilleret MN, Sturm N, Trocme C, Renversez JC, Faure P, et al. Prospectivecomparison of six non-invasive scores for the diagnosis of liver fibrosis in chronichepatitis C. Journal of hepatology. 2007; 46(5):775-82.
Current Trends in Liver Biopsy Indications for Chronic Liver Diseaseshttp://dx.doi.org/10.5772/52618
111

[5] Cales P, Oberti F, Michalak S, Hubert-Fouchard I, Rousselet MC, Konate A, et al. Anovel panel of blood markers to assess the degree of liver fibrosis. Hepatology. 2005;42(6):1373-81.
[6] Halfon P, Bourliere M, Deydier R, Botta-Fridlund D, Renou C, Tran A, et al. Inde‐pendent prospective multicenter validation of biochemical markers (fibrotest-actit‐est) for the prediction of liver fibrosis and activity in patients with chronic hepatitisC: the fibropaca study. The American journal of gastroenterology. 2006; 101(3):547-55.
[7] Castera L, Vergniol J, Foucher J, Le Bail B, Chanteloup E, Haaser M, et al. Prospectivecomparison of transient elastography, Fibrotest, APRI, and liver biopsy for the as‐sessment of fibrosis in chronic hepatitis C. Gastroenterology. 2005; 128(2):343-50.
[8] Ziol M, Handra-Luca A, Kettaneh A, Christidis C, Mal F, Kazemi F, et al. Noninva‐sive assessment of liver fibrosis by measurement of stiffness in patients with chronichepatitis C. Hepatology. 2005; 41(1):48-54.
[9] Castera L, Denis J, Babany G, Roudot-Thoraval F. Evolving practices of non-invasivemarkers of liver fibrosis in patients with chronic hepatitis C in France: time for newguidelines? Journal of hepatology. 2007; 46(3):528-9; author reply 9-30.
[10] Myers RP, Tainturier MH, Ratziu V, Piton A, Thibault V, Imbert-Bismut F, et al. Pre‐diction of liver histological lesions with biochemical markers in patients with chronichepatitis B. Journal of hepatology. 2003; 39(2):222-30.
[11] Marcellin P, Ziol M, Bedossa P, Douvin C, Poupon R, de Ledinghen V, et al. Non-invasive assessment of liver fibrosis by stiffness measurement in patients with chron‐ic hepatitis B. Liver International (2009); 29(2):242-7.
[12] EASL Clinical Practice Guidelines: management of chronic hepatitis B. Journal ofhepatology. 2009; 50(2):227-42.
[13] Cadranel JF, Nousbaum, Hanslik B. Major trends in liver biopsy practices in France:Results of an national multicenter survey in 2009 and comparison with 1997. Journalof hepatology. 2011; 54:S137.
[14] O'Shea RS, Dasarathy S, McCullough AJ. Alcoholic liver disease. Hepatology. 2010;51(1):307-28..
[15] Forrest EH, Gleeson D. Is a liver biopsy necessary in alcoholic hepatitis? Journal ofhepatology. 2012; 56(6):1427-8.
[16] Naveau S, Gaude G, Asnacios A, Agostini H, Abella A, Barri-Ova N, et al. Diagnosticand prognostic values of noninvasive biomarkers of fibrosis in patients with alcohol‐ic liver disease. Hepatology. 2009; 49(1):97-105.
[17] Nguyen-Khac E, Chatelain D, Tramier B, Decrombecque C, Robert B, Joly JP, et al.Assessment of asymptomatic liver fibrosis in alcoholic patients using fibroscan: pro‐
Liver Biopsy - Indications, Procedures, Results112

spective comparison with seven non-invasive laboratory tests. Alimentary pharma‐cology & therapeutics. 2008; 28(10):1188-98.
[18] de Ledinghen V, Ratziu V, Causse X, Le Bail B, Capron D, Renou C, et al. Diagnosticand predictive factors of significant liver fibrosis and minimal lesions in patientswith persistent unexplained elevated transaminases. A prospective multicenterstudy. Journal of hepatology. 2006; 45(4):592-9.
[19] Cales P, Laine F, Boursier J, Deugnier Y, Moal V, Oberti F, et al. Comparison of bloodtests for liver fibrosis specific or not to NAFLD. Journal of hepatology. 2009; 50(1):165-73.
[20] Poynard T, Ratziu V, Charlotte F, Messous D, Munteanu M, Imbert-Bismut F, et al.Diagnostic value of biochemical markers (NashTest) for the prediction of non alco‐holosteato hepatitis in patients with non-alcoholic fatty liver disease. BMC gastroen‐terology. 2006; 6,34.
[21] EASL Clinical Practice Guidelines: management of cholestatic liver diseases. Journalof hepatology. 2009; 51(2):237-67.
[22] Corpechot C, El Naggar A, Poujol-Robert A, Ziol M, Wendum D, Chazouilleres O, etal. Assessment of biliary fibrosis by transient elastography in patients with PBC andPSC. Hepatology. 2006; 43(5):1118-24.
[23] Manns MP, Czaja AJ, Gorham JD, Krawitt EL, Mieli-Vergani G, Vergani, D., et al. Di‐agnosis and management of autoimmune hepatitis. Hepatology, 2010; 51(6):2193-213.
[24] Verma S, Gunuwan B, Mendler M, Govindarajan S, Redeker A. Factors predicting re‐lapse and poor outcome in type I autoimmune hepatitis: role of cirrhosis develop‐ment, patterns of transaminases during remission and plasma cell activity in the liverbiopsy. The American journal of gastroenterology. 2004; 99(8):1510-6.
[25] Guyader D, Jacquelinet C, Moirand R, Turlin B, Mendler MH, Chaperon, J., et al.Noninvasive prediction of fibrosis in C282Y homozygous hemochromatosis. Gastro‐enterology. 1998; 115(4):929-36.
[26] Skelly MM, James PD, Ryder SD. Findings on liver biopsy to investigate abnormalliver function tests in the absence of diagnostic serology. Journal of hepatology. 2001;35(2):195-9.
[27] Bedossa P, Dargere D, Paradis V. Sampling variability of liver fibrosis in chronic hep‐atitis C. Hepatology. 2003; 38(6):1449-57.
[28] Colloredo G, Guido M, Sonzogni A, Leandro G. Impact of liver biopsy size on histo‐logical evaluation of chronic viral hepatitis: the smaller the sample, the milder thedisease. Journal of hepatology, 2003; 39(2):239-44.
[29] Cholongitas E, Senzolo M, Standish R, Marelli L, Quaglia A, Patch D, et al. A system‐atic review of the quality of liver biopsy specimens. American journal of clinicalpathology. 2006; 125(5):710-21.
Current Trends in Liver Biopsy Indications for Chronic Liver Diseaseshttp://dx.doi.org/10.5772/52618
113

[30] Nousbaum JB, Cadranel JF, Bonnemaison G, Bourliere M, Chiche L, Chor H, et al.[Clinical practice guidelines on the use of liver biopsy]. Gastroenterologie clinique etbiologique. 2002; 26(10):848-78.
[31] Cadranel JF, Rufat P, Degos F. Practices of liver biopsy in France: results of a pro‐spective nationwide survey. For the Group of Epidemiology of the French Associa‐tion for the Study of the Liver (AFEF). Hepatology. 2000; 32(3):477-81.
[32] West J, Card TR. Reduced mortality rates following elective percutaneous liver biop‐sies. Gastroenterology. 2010; 139(4):1230-7.
Liver Biopsy - Indications, Procedures, Results114

Chapter 7
Primary and Metastatic Tumours of the Liver:Expanding Scope of Morphological andImmunohistochemical Details in the Biopsy
Ilze Strumfa, Janis Vilmanis, Andrejs Vanags,Ervins Vasko, Dzeina Sulte, Zane Simtniece,Arnis Abolins and Janis Gardovskis
Additional information is available at the end of the chapter
http://dx.doi.org/10.5772/52838
1. IntroductionEvaluation of liver biopsy for tumour diagnostics is a highly practical task with major clini‐cal influence. The liver is frequently affected by wide spectrum of neoplasms including be‐nign tumours as well as primary malignancies [1-3]. In addition, due to the rich dual bloodflow to liver, secondary malignant tumours also often develop here. In order to ensure theoptimal management of the patient, a correct diagnosis is necessary. At present, biopsy isthe gold standard in oncology [4-5].
The scope of liver neoplasms can be following. The benign tumours include hepatic adeno‐ma, bile duct adenoma, cavernous haemangioma and angiomyolipoma, among others. Theprimary liver malignancies embrace hepatocellular carcinoma [6,7], cholangiocarcinoma [3]and hepatoblastoma [8]. The diagnostics of hepatocellular carcinoma (HCC) is especially ur‐gent topic due to high incidence in Asia and rising – in Europe and USA, possibly becauseof high prevalence of chronic hepatitis C [4,9]. Also, prognostic data should be reported in‐cluding the features of early vs. progressed HCC, presence of stem cell immunophenotype,multicentric growth or metastatic spread [7]. Among mesenchymal malignant tumours, epi‐thelioid haemangioendothelioma and angiosarcoma [10,11] are notable. Metastatic tumoursrepresent the bulk of malignancies in Western countries [2]. Cystic liver tumours includebiliary cystadenoma and biliary cystadenocarcinoma [12-14].
Most of the above mentioned neoplastic processes can be diagnosed in core biopsy. The keyaspects include the following. First, the biopsy must be representative regarding the biologi‐
© 2012 Strumfa et al.; licensee InTech. This is an open access article distributed under the terms of theCreative Commons Attribution License (http://creativecommons.org/licenses/by/3.0), which permitsunrestricted use, distribution, and reproduction in any medium, provided the original work is properly cited.

cal process and radiologically detected changes [15]. Further, the obtained tissue must besubjected to adequate technological process. Innovations here allow shortening the turnovertime significantly. Next, the evaluation of morphology must be done searching for the char‐acteristic traits of the above noticed tumours. However, due to the limited tissue amount inthe biopsy, the tumour architecture sometimes is difficult to identify embarrassing the dis‐tinction between nodular hyperplastic process, benign tumour or low-grade malignancy. Incontrast, high-grade malignancies can show significant cytological atypia by few signs ofdifferentiation embarrassing the detection of histogenesis [6] and the distinction betweenprimary and metastatic tumour.
Immunohistochemical markers as glypican-3 [1], Hep Par 1 [3,6], CD10 [3], alpha-fetopro‐tein [6] and TTF-1 [16] are useful in the HCC diagnostics. Alterations of CD31 and CD34-positive endothelial cell network reflect vascular remodelling during hepatic carcinogenesis[7]. Cytokeratin (CK) 19 and 7 are characteristic for cholangiocellular carcinoma [3]. In meta‐stases, organospecific markers including CDX2, mammaglobin, nuclear expression of TTF-1or presence of neuroendocrine markers can confirm extra-hepatic origin [17]. As colorectal,breast, lung and neuroendocrine cancers are frequent cause of metastatic liver damage [2] highdiagnostic value of immunohistochemistry (IHC) can be expected. However, the exact detec‐tion of histogenesis can be difficult with metastatic pancreatic or gastric tumours and high-grade malignancies. IHC is mandatory for the diagnostics of haematological neoplasms andepithelioid haemangioendothelioma. Assessment of tumour biological potential can be doneby IHC, evaluating Ki-67, Cyclin D1, FOXJ1, stem cell markers, matrix metalloproteinases andother markers [7-8,18-22]. Novel markers appear continuously as heat-shock protein 70 [23].
Nowadays, pathology is not any more purely descriptive but it is becoming more functionaland clinically relevant. The classic morphologic characteristics must be combined with inte‐grated evaluation of neoplastic process in the liver, including histogenesis, grading, clonalchanges, type and extent of vascularisation, immunophenotype, heterogeneity, prediction oftreatment sensitivity and the clinical behaviour [7]. New technologies as proteomic profilingand genomic marker analysis should be applied in the evaluation of liver tumours [4]. Mi‐croRNA studies can lead to new findings in cancer pathogenesis and prediction of treatmentefficacy [24,25].
The aim of the following chapter is to describe morphological and immunohistochemicalcharacteristics of primary and secondary liver tumours in order to develop logistic basis fordifferential diagnosis of these processes in biopsy materials. Short discussion about the gen‐esis and clinical course of each tumour will be included as well.
2. Benign epithelial liver tumours
Liver cell adenoma and bile duct adenoma will be discussed here. The regenerative process‐es with the emphasis on focal nodular hyperplasia are described considering the differentialdiagnosis.
Liver Biopsy - Indications, Procedures, Results116

2.1. Liver cell adenoma and its differential diagnosis with focal nodular hyperplasia
Liver cell adenoma or hepatic adenoma is defined as benign tumour arising from hepato‐cytes. The epidemiology is characterised by female predominance (90%) and strong associa‐tion with oral contraceptive use [26-27] as 85% of affected persons have such history. Livercell adenoma was rare before the era of oral contraceptives [27]. At present, the incidencehas increased but is still low: 3-4 /100 000 per year in long-term users of oral contraception[27-29]. The patients mostly are 20-39 years old. The other risk factors of hepatic adenomainclude androgen burden. The tumours can also arise spontaneously or occasionally can berelated toglycogen storage diseases or diabetes mellitus. Clinically, the patients mostly aresymptomatic. Abdominal fullness can be attributed to the presence of mass lesion; pain canbe caused by necrosis [27]. Rupture and bleeding (40%) represent dangerous complications[27,29-31]; the risk of these events is increased in pregnant ladies affected by liver cell adeno‐ma due to prior use of hormonal contraceptives. Risk of malignant transformation also isrecognised [29,32]. By literature analysis, Farges and Dokmak concluded that 5% of resectedhepatic adenomas bear HCC foci [32]. The risk of malignant transformation is higher in ade‐nomas exceeding the size of 5 cm irrespectively of the number of adenomas as well as inmales. Grossly, liver cell adenomas are mostly unifocal (80%) and subcapsular. The tumourscan be quite large (5-20 cm). In most cases (75%) adenomas are encapsulated [27]. However,the capsule can be thin or absent [10]. In contrast to HCC, adenomas usually are not associ‐ated with cirrhosis [31]. Otherwise, radiological similarities exist between adenoma andHCC as both can be large, have rich vascularity and can undergo necrosis [31]. Microscopi‐cally, the tumour is composed by hepatocytes lacking anaplasia and arranged in thin (1-2cells) trabeculae [27,29]. Cellular atypia and macrotrabeculae must be absent. Single arterio‐les, a pair of arteriole and venule or isolated biliary ducts are scattered throughout the le‐sion. However, well-formed triads enveloped in connective tissue are absent within thelesion. The tumour can be distinguished from normal liver by larger size of neoplastic cells,presence of capsule and lack of triad-containing portal tracts. Steatosis, hydropic degenera‐tion or Mallory hyaline can be observed. Fibrous tissue, haemosiderin and calcifications candevelop in the consequence of haemorrhage. The immunophenotype is characterised by ex‐pression of Hep Par 1 and other antigens that confirms the hepatic origin and by lower pro‐liferation than in HCC. Molecular typing is emerging for liver cell adenoma as well. Atpresent, up to 4 molecular types are identified:
1. hepatic adenoma with TCF1 gene inactivation;
2. inflammatory hepatic adenoma;
3. beta-catenin-mutated non-inflammatory hepatic adenoma;
4. hepatic adenoma not displaying any before described feature or unsuitable for analysis [29].
The hepatic adenomas with TCF1 gene mutation comprise 35-40% of liver cell adenomas.The patients are female. The tumour loses the expression and functions of hepatocyte nu‐clear factor 1 (HNF1) encoded by TCF1 gene. Inactivation of the gene can be caused bymutation in both alleles or by combination of a mutation and 12q deletion leading to lossof heterozygosity in the corresponding region [33]. Germ-line mutation of HNF1 gene man‐
Primary and Metastatic Tumours of the Liver: Expanding Scope of Morphological and Immunohistochemical Details...http://dx.doi.org/10.5772/52838
117

ifests as maturity-onset diabetes of the young (MODY), type 3, in association with liveradenomatosis [34]. However, the spectrum of HNF1A somatic mutations in liver cell adeno‐ma differs from that in patients with MODY3 and suggests genotoxic damage [35]. By IHC,loss of liver fatty acid binding protein can be observed. Not surprisingly, the adenomasshow steatosis [29].
Inflammatory hepatic adenomas constitute 50% of liver cell adenomas and can be associatedwith obesity, smoking and alcohol use. Pathogenetically, inflammatory hepatic adenoma ischaracterised by IL-6 pathway activation centred on gp130 protein in IL-6 receptor. The recep‐tor can be subjected to ligand-independent activation due to mutation in IL6ST gene, or thelevels of gp130 can be elevated. The IL-6 receptor activation leads to recruitment of inflamma‐tory cells through gp130-mediated production of chemokine CCL20. The mutation was foundin 60% of inflammatory adenomas [36]. However, the IL-6 pathway activation is universal inthe inflammatory hepatic adenoma. Microscopically, inflammatory infiltrates are observed inaddition to the architecture and cytologic details of adenoma. Occasional bile ductules, dilat‐ed sinusoids and arterioles can be present. Haemorrhage is frequent. By IHC, expression ofacute phase reactants serum amyloid A and C-reactive protein is marked [29].
A group of hepatic adenomas is associated with beta-catenin mutation [37-38].The beta-cate‐nin pathway is not affected in TCF1 inactivated group [29,38]. Beta-catenin activation can beassayed by immunohistochemical over-expression of glutamine synthetase or by aberrantnuclear localisation of beta-catenin. However, the tumours can show dysplastic changesmore characteristic for HCC thus possibly this group will be reclassified into well-differenti‐ated HCC [29,36].
The last group of hepatic adenomas (5%) lacking TCF1 inactivation, inflammatory signatureand beta-catenin mutation [29] could represent distinct group with peculiar pathway of mo‐lecular pathogenesis or result of technological shortcomings.
The differential diagnosis of hepatic adenoma in biopsy includes low-grade HCC and hy‐perplastic lesions like focal nodular hyperplasia, nodular regenerative hyperplasia and par‐tial nodular transformation [27].
Focal nodular hyperplasia (FNH) is a comparatively frequent differential diagnosis of hepat‐ic adenoma. The FNH incidence is estimated as 3% [29-30,39]. FNH is characterised by pres‐ence of hypervascular stellate scar in liver parenchymal nodule. The blood vessels arelocated in the middle of star-like fibrous tissue while the periphery is occupied by proliferat‐ing bile ductules. The morphologically remarkable abundant vascularity is in accordancewith the hypothesis of the FNH origin due to microscopic arterial malformation [40-42]. Thecrucial difference between FNH and adenoma is pathogenetic as the former is thought to behyperplastic lesion, while adenoma is a neoplasm. The presence of stellate scar and lack ofperipheral capsule in FNH contrasts with presence of peripheral capsule and almost com‐plete lack of connective tissue or portal triads within adenoma. If the architecture is incom‐pletely represented in the biopsy, molecular characteristics should be able to discriminatebetween the two inherently different processes, the hyperplasia and tumour. The immuno‐histochemical markers of biliary differentiation have been employed in the differential diag‐
Liver Biopsy - Indications, Procedures, Results118

nostics between FNH and hepatic adenoma. As described by Walther and Jain, CK19 andCD56 detect rich network of proliferating biliary ducts in the fibrous septa of FNH but re‐veal only few isolated ducts within the parenchyma of hepatic adenoma. Expression of CK7is remarkable for the focal presence in parenchyma of liver cell adenoma in contrast to FNHwhile both lesions show expression of CK7 in biliary ducts. Thus, panel of CK19, CD56 andCK7 can be advised to solve the differential diagnosis in core biopsy [29]. Immunohisto‐chemical expression pattern of glutamine synthetase differs between normal liver tissue,FNH and liver cell tumours as well. In healthy tissue, glutamine synthetase is present in per‐ivenular hepatocytes. These positive areas are expanded in FNH [39]. In hepatic adenomas,glutamine synthetase expression is either diffuse of negative. In the last situation, the nega‐tivity in the tumour can be incomplete, with focally preserved expression in the tumour pe‐riphery [29] and thus difficult to interpret, especially in small biopsies where the preservedpositive focus seems to be dominant.
In nodular regenerative hyperplasia, the liver contains many small regenerative nodules.Partial nodular transformation affects hilar area and is characterised by group of regenera‐tive nodules surrounded by fibrous tissue [27].
Considering the differential diagnosis with HCC, thick trabecular cords, cytologic anaplasiaand invasive growth reveal the malignant biological potential. The thickening of trabeculaeis defined as presence of more than 2 cell layers in the trabeculae. The anaplasia is recog‐nised by nuclear hyperchromasia, prominent nucleoli and increase in the nucleo: cytoplas‐mic ratio. Presence of mitoses practically excludes the diagnosis of hepatic adenoma.Atypical mitoses are absolute evidence of malignancy. The invasive growth can manifest asinvasion through the capsule, infiltration into liver parenchyma and true invasion intoblood vessels [27].
2.2. Bile duct adenoma
Bile duct adenoma is defined as a benign neoplasm of portal bile ducts. The epidemiologicdata suggest rare occurrence. However, as the tumours mostly are small and asymptomatic[27], the true incidence and prevalence is unknown. Grossly, bile duct adenomas are mostlysolitary (83%), subcapsular (95%) and small (below 1 cm). By light microscopy, the lesion ischaracterised by demarcated proliferation of bile ducts lacking atypia. The immunopheno‐type repeats the staining characteristics of biliary ducts exhibiting expression of cytokeratins7 and 19 [27]. The differential diagnosis can include small foci of low-grade cholangiocarci‐noma or metastatic low-grade adenocarcinoma, but the benign cytological appearance ishelpful. Von Meyenburg hamartoma differs from bile duct adenoma, as the hamartomaswould be multiple and show traits of cholestasis. However, the exact separation might notbe of crucial importance due to benign course of biliary adenoma and pathogenetic sugges‐tion that biliary adenoma represent a reactive process rather than true neoplasm.
Primary and Metastatic Tumours of the Liver: Expanding Scope of Morphological and Immunohistochemical Details...http://dx.doi.org/10.5772/52838
119

3. Malignant epithelial primary liver tumours
Three primary liver tumours are of utmost importance. Hepatocellular carcinoma is themost frequent primary epithelial liver tumour with grave prognosis. Cholangiocarcinomaranks second by the incidence except for endemic regions. Hepatoblastoma is notable for theoccurrence in the infancy.
3.1. Hepatocellular carcinoma
Hepatocellular carcinoma is defined as malignant tumour developing from hepatocytesand/or showing hepatocellular differentiation. It is the most common primary malignant tu‐mour of the liver constituting 80-85% of primary epithelial liver malignancies [29,43]. Con‐sidering the epidemiology, the worldwide burden of hepatocellular carcinoma can reach 1million of new cases per year. The incidence shows major geographic differences. HCC isthe 2nd most common cancer in Asia, and the 4th – in Africa [10]. The annual age-standar‐dised incidence is the highest in East Asia, including China and Japan. Low-risk areas com‐prise Europe, esp. northern and western parts; North and South America, Australia andNew Zealand [10].The age-adjusted incidence rates in Mozambique are as high as 112.9 and30.8/100 000 in males and females, respectively. In China these values reach 34.4 and 11.6. Incontrast, the age-adjusted incidence rates in British males and females are 1.6 and 0.8, re‐spectively [31]. The HCC risk factors include liver cirrhosis independently of cause, chronichepatitis B or C, ethanol consumption and non-alcoholic liver steatosis as well as mycotox‐ins. The aflatoxin B1 or other mycotoxins produced by Aspergillus fungi could be responsiblefor part of HCC in areas where grains, rice and peanuts are stored in hot and humid condi‐tions [31]. Most of HCC cases develop from dysplastic cirrhotic nodule [29], thus the differ‐ential diagnostics between dysplastic nodule and cancer represent evaluation of one point ina complex road of pathogenesis. Clinically, most of the patients approach doctor due tosymptoms attributable to mass lesion in the liver (abdominal pain, sensation of fullness), tu‐mour-related intoxication (weight loss, weakness, lack of appetite) and loss of liver func‐tions (jaundice). Alternatively, the symptoms can be related to pre-existing cirrhosis and thetumour could be identified during routine control of cirrhotic patient or during workup forunspecific or unrelated symptoms [31]. Radiologically, the number and size of tumourmasses can be evaluated. Ultrasonography can be used for screening. Typical findings re‐garding vascularity include hypervascularity and thrombosis of portal vein, frequently dueto invasion. If it is necessary to confirm invasion into portal vein, biopsy can be obtainedfrom it [31].
By microscopy, the typical patterns include trabecular, acinar and ductular structure. Theneoplastic cells in low-grade cases resemble liver cells by possessing wide eosinophilic cyto‐plasm and distinct cell borders. Nuclear atypia is present and nucleo: cytoplasmic ratio isincreased, although to different degree. Mitoses can be present; atypical mitoses can be ob‐served (Figure 1). The architecture shows unequivocal deviations from normal structuresuch as thick trabeculae with more than 2 cell layers (in contrast to adenoma), solid areas,duct-like or gland-like structures. However, careful evaluation of the architecture under
Liver Biopsy - Indications, Procedures, Results120

high power magnification must be carried out. There are many secondary phenomena rais‐ing the similarity between HCC and liver tissue: presence of macrovesicular or microvesicu‐lar fat, Mallory hyaline and bile. The capillaries can be dilated [27]. Among thehistochemical staining methods, absent reticulin staining [44] is characteristic. PAS stain canreveal glycogen and intracytoplasmic globules; the latter structure remains positive after di‐astase digestion [27,44]. With some experience, morphology is helpful to distinguish finelygranular glycogen or rounded globules in HCC from mucus droplets in metastatic adeno‐carcinoma or cholangiocarcinoma.
Figure 1. Hepatocellular carcinoma displaying marked cytologic atypia. Note the presence of atypical mitosis. Haematox‐ylin-eosin (HE), original magnification (OM) 100x.
Fibrolamellar hepatocellular carcinoma (FLHC) has distinctive aetiology, epidemiology andcourse. The general HCC risk factors are not associated with this subtype [31]. FLHC is rare,constituting only 1-4% of HCC [27]. It is less common in high-risk areas than in NorthAmerica and Europe. The patients are young adults or even children [10]. FLHC is diag‐nosed at the mean age of 25 years in contrast to mean age of 52 years in typical HCC patientgroup [27]. Controversial data are reported about the sex predilection: some but not all au‐thors have noted that females are mostly affected [10,31]. Clinically, symptoms attributableto liver enlargement, parenchymal damage (elevated liver enzyme level) or tumour-relatedintoxication (weight loss or fever) can be present. Cirrhosis is absent. The tumour can bemultifocal, and metastases can affect lungs and regional lymph nodes [31]. The histologicalstructure is remarkable for the lamellar fibrosis. The stroma is composed of thick, parallelstrands of hyalinised collagen [27]. The cells are large, polygonal, with wide eosinophilic cy‐toplasm. The vesicular nuclei possess large nucleoli. Cytoplasmic pale bodies are more fre‐quent (up to 50% of cases) and more abundant than in other types [10,27]. The pale bodies
Primary and Metastatic Tumours of the Liver: Expanding Scope of Morphological and Immunohistochemical Details...http://dx.doi.org/10.5772/52838
121

are rounded and very lightly eosinophilic thus staining paler than the surrounding cyto‐plasm. These structures represent cystically dilated endoplasmic reticulum. Pale bodies canbe positive for fibrinogen by IHC. The immunophenotype is remarkable for diffuse expres‐sion of CK7. The hepatocellular differentiation can be confirmed by Hep Par 1; alpha-feto‐protein is present in approximately 20% of cases. The FLHC prognosis is better than in thegeneral group. The mean survival is 32 months in contrast to 5.9 months in trabecular HCC[27]. However, it is found that the beneficial prognosis of FLHC is different from cancer incirrhotic liver but not from HCC in the absence of liver cirrhosis [10].
IHC has an important role in the diagnostics of HCC. Frequently tested antigens includeglypican-3, Hep Par 1, alpha-fetoprotein, CD10, carcinoembryonic antigen CEA, TTF-1, argi‐nase-1, evaluation of cytokeratins and endothelial network as well as MOC-31 and markersof extra-hepatic tumours.
Glypican-3 is a cell surface protein [1] that is involved in the control of cell proliferation andsurvival. Glypican-3-knockout mice exhibit alterations in Wnt signalling [45]. Glypican-3 al‐so interacts with Hedgehog signalling pathway [46]. In the practical surgical pathology, thevalue of glypican-3 is associated with the cancer diagnostics as it is expressed in 70-75%HCC but not in benign liver tissue [48-49] or cholangiocellular carcinoma [1]. Hepatoblasto‐ma can be positive as well. However, glypican-3 can be expressed in metastatic melanoma[50], ovarian clear-cell carcinoma [51], choriocarcinoma, yolk sac tumour [52-53] as well as inblastomas including neuroblastoma and Wilms’ tumour [54]. In addition, 10% of gastric can‐cer cases are positive for glypican-3 [55]. In melanoma, 80% of tumours contain detectablelevel of glypican-3 protein and mRNA [1]. Regarding ovarian cancer, the rate of glypican ex‐pression could be as high as 18% of all ovarian cancer cases and 60% of clear cell carcinomacases [51]. However, negative reports regarding clear cell carcinoma of ovary are publishedas well [53]. Glypican-3 is silenced in breast cancer, lung adenocarcinoma and mesothelioma[56-58]. Another problem has been highlighted by Abdul-Al et al., who have described fre‐quent granular cytoplasmic expression of glypican-3 in chronic active hepatitis C [59]. Re‐generative changes were suggested as the explanation. Authors emphasized thatmembranous staining was not observed in hepatitis [59]. Glypican-3 has prognostic signifi‐cance in HCC as it is associated with poor prognosis [60] and shorter recurrence-free periodafter liver transplantation [49]. The applications of glypican-3 could extend beyond liver bi‐opsy – and return to it. It could possible to use glypican-3 plasma levels for diagnostics andmonitoring of HCC [61-63]. Immunotherapy could be guided towards glypican-3; thepresent research is exploring both antibody and cell-based immunological mechanisms[64-65]. Cancer vaccine could be generated against this molecule [1]. Glypican-3 is amonggenes that are distinctly expressed in liver cancer stem cells; it is suggested that glypicancould be promising candidate for gene therapy without inducing damage to normal liverstem cells [66].
Hep Par 1 is positive in normal liver, liver adenomas and HCC. The antibody was devel‐oped in 1993 using an immunogen from failed liver allograft. The target antigen has beenidentified as carbamoyl phosphate synthetase. This enzyme catalyses the rate-limiting stepin the urea cycle and is located in the mitochondria [67]. The specifity and sensitivity of this
Liver Biopsy - Indications, Procedures, Results122

marker in HCC diagnostics exceeds 80% and has reached 90% in several studies [6,67]. Un‐fortunately, sensitivity is lower in high-grade HCC. The expression in non-hepatocellular tu‐mours including colorectal, pancreatic, breast, urothelial, prostate cancer, neuroendocrinetumours, renal cell carcinoma, melanoma and angiomyolipoma is either negative or focal.However, few gastric, colorectal and lung adenocarcinomas can be positive [6,67]. In the bi‐opsy material, heterogeneity in the HCC can cause diagnostic problems [6].
Arginase-1 is an enzyme involved in the urea cycle as well. It is found in benign hepatocytesand hepatocellular neoplasms. The antibody has received high sensitivity estimates of 96%and favourable performance characteristics [68,69].
Alpha-fetoprotein is an oncofetal protein produced by the liver and yolk sac endoderm. Theantigen is remarkable for expression in malignant hepatocellular tumours (Figure 2) in con‐trast to benign liver tissue, and for the high specifity. However, sensitivity is low (30-50%)and heterogeneity adds further problems in biopsy evaluation [6]. Nevertheless, positive ex‐pression is valuable.
Figure 2. Heterogeneous intense cytoplasmic expression of alpha-fetoprotein in hepatocellular carcinoma. Immuno‐peroxidase (IP), anti-alpha-fetoprotein, OM 100x.
Polyclonal antibodies against carcinoembryonic antigen (CEA) yield positive reaction morethan in 70% of HCC cases, while monoclonal anti-CEA only rarely stains HCC. Reactivi‐ty with polyclonal CEA antibodies mostly is observed in canaliculi; this pattern can beobserved in benign or malignant liver tissues and is attributable to cross-reaction withbiliary glycoprotein on the canalicular surface [67]. The canalicular pattern is specific forHCC and can be used to exclude cholangiocarcinoma and metastatic adenocarcinoma. Itis not useful in the differential diagnosis between HCC and benign hepatocellular mass
Primary and Metastatic Tumours of the Liver: Expanding Scope of Morphological and Immunohistochemical Details...http://dx.doi.org/10.5772/52838
123

lesions. Although good general sensitivity has been reported, it is higher in well or mod‐erately differentiated HCC that present less problems regarding the differential diagno‐sis with cholangiocellular carcinoma or metastasis [67]. Cytoplasmic stain is not observedin healthy liver or benign neoplasms; it is characteristic of malignancy but seen mostly incholangiocellular carcinoma and metastatic neoplasms. The rate of cytokeratin fractionexpression is 15% for CK7, 20% for CK20 and 10% for CK19. Diffuse strong expressionof endothelial markers CD31 and CD34 is not characteristic for normal liver tissue incontrast to HCC [27]. The visualisation of endothelial layer is valuable also in estimat‐ing the thickness of trabeculae. However, pattern of diffuse, strong endothelial markerexpression has low sensitivity of 20-40%. The patchy expression is also difficult to evalu‐ate in liver biopsies. The visualisation of endothelium thus is not recommended for thedistinction between adenoma and carcinoma [6].
The transcription factor TTF-1 is expressed as intense granular cytoplasmic staining in nor‐mal liver parenchyma [16] and hepatocellular tumours (Figure 3). The reaction is ensured bycross-reactivity with hepatocyte mitochondrial antigen and is seen with the clone 8G7G3/1[69]. The reported sensitivity is 60-70%. However, it parallels the expression of Hep Par 1decreasing the practical value [6]. Its expression can be retained even in metastatic HCC [16].
Figure 3. Granular cytoplasmic expression of TTF-1 in hepatocellular carcinoma. IP, Anti-TTF-1, OM 400x.
MOC-31 is an epithelial cell surface glycoprotein of unknown function. Evaluating liver bi‐opsies, it is valuable as non-hepatocellular marker. MOC-31 is negative in HCC but positivein most metastatic adenocarcinomas and cholangiocellular cancer [67]. However, mesothe‐lioma is MOC-31 negative as well; calretinin should be used in the panel to exclude this pos‐sibility [17].
Liver Biopsy - Indications, Procedures, Results124

Molecular subtyping is emerging for HCC. The subtypes are distinguished by high prolifer‐ation and chromosomal instability; by activation of Wnt signalling pathway and by interfer‐on signalling due to tumour-infiltrating cells [70-77].
The requests for clinically relevant classification have resulted in the separation of HCC intoearly and progressed entities. The early HCC is recognized as small (not exceeding the diam‐eter of 2 cm), well differentiated and lacking vascular invasion. The invasion into portal tractscan be present and is highlighted by lack of proliferating ductules. Macrovesicular steatosisis present in 40% of early HCC but appears mostly in Eastern cohorts. It can be attributable toincomplete neoarterialisation – the process of portal tract replacement by unpaired arteriesoutside the portal tracts. In early HCC, there is still comparatively large venous flow. Thetumours in general may be radiologically hypovascular. The early HCC is more likely tobecome the biopsy target due to equivocal findings at imaging. Progressed HCC includes HCCof higher grade (moderate or poor differentiation degree, G2 or G3), possessing vascularinvasion, larger size or stem/progenitor cell immunophenotype and mixed hepatobiliarydifferentiation. The stem cell immunophenotype can be detected by IHC for CK19, EpCAM,CD133, and mixed hepatobiliary immunophenotype – by expression of CK7 and CK19 [7]. The5-year survival is 89% in the early HCC group in contrast to 48% in the progressed group. Theintrahepatic metastatic spread must be distinguished from multifocal carcinoma that is prog‐nostically better disease. The multifocal disease is characterised by “nodule in nodule” struc‐ture or by presence of at least one G1 nodule [7].
The differential diagnosis includes benign hepatic lesions, metastatic malignancies and chol‐angiocarcinoma. IHC is of major importance. Markers, that are expressed both in benignand malignant liver cells (CEA by polyclonal antibody, CD10, Hep Par 1, TTF-1 and (occa‐sionally) cytokeratins [27]) identify the hepatocellular origin of tumour but cannot be usedto prove the malignant biological potential of suspicious biopsied tissue. If these are foundin high-grade tumour, diagnosis of HCC is preferable in contrast to metastasis. The expres‐sion of alpha-fetoprotein and glypican-3 is typical for malignant tumour of hepatocellularorigin [27]. These findings are important in differential diagnosis with non-hepatocellularand/or metastatic tumour in line with other markers specific for particular histogenesis. Re‐garding the differential diagnosis of HCC and dysplastic cirrhotic nodule, a panel of immu‐nohistochemical stains is recommended employing glypican-3, glutamine synthetase andheat-shock protein 70 [48,78-80]. In biopsy, the panel has lower sensitivity although goodspecifity: accuracy 60.8% for 3 markers and 78.4% for 2 markers with 100% specifity. Thefindings were acceptable even in the group of low-grade HCC: the accuracy still was 57%for 3 markers and 72.9% for 2 markers with 100% specifity [23].
HCC (except fibrolamellar type) mostly is associated either with cirrhosis or chronic activehepatitis with fibrosis that has not reached the degree of cirrhosis. To facilitate the differen‐tial diagnosis between HCC and liver adenoma or FNH it is wise to take separate biopsies‐from the lesion and from distant liver tissues if possible.
The future pathways for molecular diagnostics of HCC include mRNA analysis of GPC3,survivin and LYVE1 genes [78]. Glypican-3, encoded by GPC3, and survivin is up-regulated
Primary and Metastatic Tumours of the Liver: Expanding Scope of Morphological and Immunohistochemical Details...http://dx.doi.org/10.5772/52838
125

in parenchymal HCC cells while LYVE1 protein is down regulated in endothelial cells incase of malignancy. MYC pathway studies could also bring new information [29].
In addition, molecular studies can predict the HCC prognosis. Down-regulation of p57accelerates the growth and invasion of HCC cells [18]. The reduced p57 expression corre‐lates with larger tumour size, higher TNM stage, presence of extrahepatic metastases anddecreased survival. In cell lines, the down-regulation of p57 increases the expression of cyclinD1 and CDK2, enhancing the cellular proliferation. The matrix metalloproteinase-1 (MMP-1)and protease activated receptor-1 (PAR-1) are expressed in HCC but not in normal liver.The up-regulation of MMP-1/PAR-1 axis has prognostic value [20] and potentially could beused in the identification of malignancy. Co-expression of stem cell transcription factorsOct4 and Nanog indicates aggressive tumour behaviour and predicts recurrence after HCCresection [22]. FOXJ1 is over-expressed in HCC. It is associated with histological grade, poorprognosis and with tumour cell proliferation [19]. Hedgehog signalling pathway mediatesinvasion and metastasis of HCC via ERK pathway. Up-regulation of cell proliferation isassociated with down-regulation of p27 and p21 and up-regulation of cyclin D1 [81]. Osteo‐pontin plays role in the proliferation of HCC through interaction with the cell surface recep‐tor CD44 [82] and is considered the key mediator for vasculogenic mimicry [83]. Bax-interacting factor is over-expressed in HCC and correlates with shortened survival [84]. NY-ESO-1 protein is a potential marker for early recurrence after surgical treatment [85].Hepatocyte nuclear factor 4 suppresses the HCC development [86]. Sulfatase 2 protects HCCcells against apoptosis [87]. Interleukins as IL-17 and IL-6 have tumour-promoting role [88].Interaction with matrix metalloproteinases 2 and 9 is likely [89]. Up-regulation of sirtuinshas been identified [90]. Typing of immune cells in biopsy is mostly done for researchpurposes [91]. If any of those parameters will show prognostic and predictive value, therelevant IHC analysis should be included in the protocol of liver biopsy evaluation. Thetechnological future developments include virtual microscopy. Fractal analysis [92] andquantitative IHC can be applied [93].
Methylation studies have been carried out in HCC [94]. The expression of microRNAs is un‐dergoing active analysis in HCC [95-96]. MicroRNAs are non-coding, short RNA moleculesthat can bind to messenger RNA and to prevent their translation into protein, providing ad‐ditional regulation of gene expression. MicroRNAs act as large-scale molecular switch dueto ability simultaneously down-regulate many genes. MicroRNA-181 down-regulates thedifferentiation and maturation of hepatocytes [96]. Suppression of microRNA-181 expres‐sion leads to reduced motility and invasion of HCC stem cells [25]. MicroRNA-182 couldpromote metastasis [97]. MicroRNA-183 inhibits apoptosis [98]. MicroRNA expression canbe subjected to regulation with IL-6 [25]. Reduced expression of microRNA-26 in HCC is as‐sociated with poor prognosis. However, better response of interferon alpha postoperativeadjuvant therapy can be expected [95]. MicroRNA-21 induces resistance to the anti-tumoureffect of interferon and fluorouracil combination therapy [99]. Circulating microRNAs arevaluable in tumour diagnosis and monitoring the treatment [24].
Liver Biopsy - Indications, Procedures, Results126

3.2. Hepatoblastoma
Hepatoblastoma is defined as a primary malignant blastomatous liver tumour showingcomplex differentiation towards fetal and embryonal hepatocytes as well as mature tissuesincluding osteoid, connective tissue and striated muscle. Epidemiologically, hepatoblastomais a rare malignant liver tumour of childhood with the incidence of 1 case / 1 million [8,10].In children, hepatoblastoma is the most common primary liver tumour. Characteristically,the tumour develops within first five years of life: 4% of hepatoblastomas are present atbirth, 69% have developed by 2 years of age and 90% - by 5 years of age. Only 3% of patientsare older than 15 years [100]. The risk of hepatoblastoma is increased in APC-mutation-car‐rying children from familial adenomatous polyposis (FAP) kindreds. Clinically, enlargingabdomen can be the first sign. The other possible manifestations include weight loss, ano‐rexia, nausea, vomiting and abdominal pain. Jaundice is rarely observed [100]. Paraneoplas‐tic syndromes can occur. Among those, anaemia and thrombocytosis are frequent.Precocious puberty due to production of chorionic gonadotropin is rare. Grossly, the tu‐mours mostly occur as single lesions [10] measuring 5-22 cm [100]. Pseudocapsule can de‐velop due to compression of surrounding liver tissue. Microscopically, hepatoblastoma candisplay any of different histological patterns, or combination of these patterns. The fetal epi‐thelial differentiation is characterised by thin trabeculae of small cuboidal cells. The nucleiare small and round with fine chromatin and small nucleolus. The cytoplasm can be eitherclear or finely granular resulting in “light and dark” pattern under low magnification. Fociof extramedullary haemopoesis can be present. The combined fetal and embryonal patternis characterised by presence of small tumour cells in solid or acinar groups. The small cellshave scant cytoplasm, higher nucleo: cytoplasmic ratio and coarse chromatin. Hepatoblasto‐ma is called macrotrabecular if the cells compose 6-12 cell layers in the trabeculae in most ofthe tumour. Larger cells are present in the macrotrabeculae in addition to fetal and embry‐onal type. In teenagers, macrotrabecular hepatoblastoma must be differentiated from hepa‐tocellular carcinoma. Small cell undifferentiated hepatoblastoma morphologically resemblessmall cell cancer displaying solid small blue cell pattern with focal necrosis. Mixed epithelialand mesenchymal hepatoblastomas contain mesenchymal components including fibrous tis‐sue, osteoid, cartilage, striated muscle, bone or melanin [100]. Mixed epithelial and mesen‐chymal hepatoblastoma with teratoid features is recognised by the presence of endodermal,neuroectodermal and complex mesenchymal tissues. The neuroectodermal component cancomprise melanin, glial and neuronal cells [10].After treatment, connective tissue, necrosisand signs of haemorrhage develop in association with residual neoplastic tissue, and squa‐mous islands become more common. Immunohistochemically, expression of alpha-fetopro‐tein, beta-catenin and cell cycle markers is associated with the histological pattern. The fetalsubtype is characterised by low proliferation that parallels the scant mitotic activity; alpha-fetoprotein can be present and the expression of beta-catenin is retained in the membranouslocalisation. The combined fetal and embryonal subtype is characterised by shift of beta-cat‐enin expression towards the nuclei in higher grade embryonal component. An interestingcircular pattern can be observed. In the rounded cell groups, the middle is occupied by pro‐genitor-type pale, small cells displaying low proliferative activity and nuclear expression ofbeta-catenin. The progenitor-type cells are surrounded by intensively proliferating embry‐
Primary and Metastatic Tumours of the Liver: Expanding Scope of Morphological and Immunohistochemical Details...http://dx.doi.org/10.5772/52838
127

onal type cells characterised by mixed nuclear and cytoplasmic expression of beta-catenin.The outermost layer of these concentric structures is composed by fetal type cells with lowproliferative activity and retained membranous expression of beta-catenin. The small cellsubtype lacks alpha-fetoprotein but has high proliferative activity, usually reaching 80%; cy‐tokeratins are expressed as well. Even in the mixed epithelial and mesenchymal hepatoblas‐toma, cytokeratins and alpha-fetoprotein can be expressed even in the ostecyte-like andosteoblast-like cells embedded in or associated with the osteoid, correspondingly [10]. In thestudy of Purcell et al., cyclin D1 and Ki-67 were two markers (out of 5, including also beta-catenin, E-cadherin and alpha-fetoprotein) that were shown to have prognostic value re‐garding survival [8].
3.3. Cholangiocarcinoma
Cholangiocarcinoma (CC) is defined as malignant epithelial liver tumour with biliary histo‐genesis or biliary differentiation. Epidemiologically, CC is a rare tumour with male predilec‐tion. It composes 15% of primary liver cancer [100] but the relative incidence range ofcholangiocarcinoma is wide, from 5% in males and 12% in females in Osaka, Japan, to 90%in males and 94% of primary liver cancer cases in females in Thailand. The age-standardizedincidence per 100 000 males ranges from 84.6 in Thailand to 2.8 in Osaka, Japan; 1.0 inFrance or 0.9 in Italy. The known risk factors include association with ulcerative colitis andprimary sclerosing cholangitis [27]. The rate of cholangiocarcinoma in primary sclerosingcholangitis patients is estimated as 10-20%. The presence of parasites, especially Clonorchissinensis and Opisthorchis viverrini, also increases the risk of cholangiocarcinoma. The high-in‐cidence area in Laos and North and Northeast Thailand corresponds to the endemic area ofOpisthorchis viverrini. Korea has high rate of cholangiocellular cancer due to endemic spreadof Clonorchis sinensis. Clinically, the patients can present with painless jaundice [31], generalmalaise, mild abdominal pain and weight loss [100]. Grossly, several types exist. Peripheraltumours arise from portal bile ducts. Hilar lesions arise in large ducts. The diffuse intraduc‐tal papillomatosis involves ducts as widespread carcinoma in situ lacking dominant massbut leading to severe obstruction of bile flow. Histologically, cholangiocarcinoma has adeno‐carcinomatous structure characterised by tubular complexes and moderate amount of des‐moplastic stroma. The architectural variants include high-grade tumour lacking thecharacteristic architecture, signet-ring cell tumour with presence of signet-ring cells, muci‐nous type with extensive secretion of extracellular mucin, adenosquamous type with focalsquamous differentiation and spindle cell type with pseudosarcomatoid structure, presenceof malignant spindle cells and signs of epithelial differentiation. The tumour has no func‐tional connection with bile excretory system although morphological connection in the formof invasion or cancer in situ can exist. CC arises from ductal epithelium and not from hepa‐tocytes. Due to these two reasons, presence of bile in the lumina of malignant glands is notcharacteristic but eosinophilic or mucinous secretion can be present. Mucin stains as PAS ormucicarmine can be positive [44]. The immunophenotype is derived from the immunophe‐notype of bile duct epithelium, with expression of following cytokeratins: CK19 (100%), CK7(80-100%), CK20 (20%). Diffuse cytoplasmic expression of CEA is found by polyclonal anti‐body in almost all cases and is frequent by monoclonal antibody as well [27]. However, it is
Liver Biopsy - Indications, Procedures, Results128

suggested that morphology cannot reliably distinguish cholangiocarcinoma from metastaticpancreatic or colorectal cancer [31]. In case of pancreatic adenocarcinoma, the marked cellu‐lar atypia disproportionally to better preserved architecture can be a clue. Colorectal adeno‐carcinoma in typical cases is characterised by columnar morphology and diffuse intenseexpression of CK20, CDX2 and CEA and lack of CK7. Other authors have drawn attention tothe impossibility to distinguish cholangiocarcinoma from metastatic gastric cancer and can‐cer of gall bladder; metastatic pancreatic cancer also remains a problem [6]. The morphologi‐cal differential diagnosis includes benign proliferation of bile ducts, hepatocellularcarcinoma and metastatic adenocarcinoma [27]. In order to discriminate between biliary ad‐enoma and cholangiocarcinoma, invasion (including single invasive cells and perineural in‐vasion) and cellular atypia should be sought for. Radiologic findings are helpful as bile ductadenoma usually is smaller than 1 cm, but cholangiocarcinomas are large. The differentialdiagnosis with hepatocellular carcinoma can rely both on morphology and immunopheno‐type. Immunohistochemically, markers of biliary differentiation CK7 and CK19 are positivein cholangiocellular carcinoma. Hep Par 1 can be used to exclude hepatocellular differentia‐tion [6,29]. Proteomic analysis of differentially expressed proteins in peripheral cholangio‐carcinoma is under research [101].
4. Vascular tumours
Cavernous haemangioma, epithelioid haemangiendothelioma and angiosarcoma are endo‐thelial tumours representing the whole spectrum of biological potential. Haemangioma isentirely benign although can cause complications due to large size; epithelioid haeman‐gioendothelioma is notable for the peculiar structure leading to marked difficulties in the bi‐opsy diagnostics, and angiosarcoma is a frank malignancy with grave prognosis. Inaddition, angiomyolipoma will be discussed as well although it should be noted that this tu‐mour has complex structure including rich vascularity as one component.
4.1. Cavernous haemangioma
Haemangioma is defined as benign endothelial tumour [102]. Due to bleeding risk, it is onlyrarely seen in liver biopsy; in addition, the possibilities of radiological diagnostics are goodand the prognosis only rarely necessitates active treatment. However, epidemiologically thelesion is the most common benign tumour of the liver with incidence 0.4% [27]. Clinically,haemangioma usually are asymptomatic due to small size and slow expansive growth. Oc‐casionally, a giant haemangioma (10-30 cm) can cause pain due to mass effect. Thrombosisand bleeding can be dangerous complications. In neonates, blood shunting can lead to heartfailure. Grossly, haemangiomas are mostly solitary (90%), of small or moderate size (lessthan 5 cm) and subcapsular. Microscopic structure is similar to cavernous haemangiomaelsewhere in the body. Cavernous, lake-like blood spaces can be seen, separated by hypocel‐lular fibrous septa (Figure 4). Thrombosis can be present. The immunophenotype reflects
Primary and Metastatic Tumours of the Liver: Expanding Scope of Morphological and Immunohistochemical Details...http://dx.doi.org/10.5772/52838
129

the endothelial origin. In the rare situation, when biopsy is obtained from cavernous hae‐mangioma, the differential diagnosis can include hepatic tumours with rich vascularity asadenoma and cholangiocellular carcinoma. These are diagnosed by the presence and cyto‐logical properties of liver cells. Other vascular tumours could be considered, including in‐fantile haemangioendothelioma, angiomyolipoma, epithelioid haemangioendothelioma andangiosarcoma. The infantile haemangioendothelioma can be recognized by capillary struc‐ture and occurrence in infants [27]. Angiomyolipoma shows combination of fat, smoothmuscle and blood vessels with radiating immature smooth muscle cells. The higher cellular‐ity and presence of fat are features incompatible with cavernous haemangioma. Epithelioidhaemangioendothelioma is discussed separately; the occurrence of vascular lakes usually isnot observed. Angiosarcoma can have cavernous architecture but the hallmark of it is thecellular atypia.
Figure 4. Cavernous haemangioma in liver tissue. Note the large, cavernous spaces filled with red blood cells. HE,OM 50x.
4.2. Angiomyolipoma
Angiomyolipoma is defined as benign mesenchymal tumour with complex structure includ‐ing immature smooth muscle, blood vessels and fat. Epithelioid cells and perivascularHMB-45-positive cells can be present. Research of the tumour histogenesis has resulted inthe concept of PEComa, a tumour of perivascular epithelioid cells, showing myomatous, lip‐omatous and melaninogenic differentiation. Epidemiologically, liver angiomyolipoma israre. It has been diagnosed in wide age range (10-86 years). In tuberous sclerosis, the inci‐
Liver Biopsy - Indications, Procedures, Results130

dence of angiomyolipoma is increased. These patients may develop multiple angiomyolipo‐mas in liver as well as kidney angiomyolipoma. Awareness of this condition is necessary toescape over-diagnosis of metastatic malignant tumour. Clinically, the tumour can be asymp‐tomatic. However, large tumours can cause pain; rupture and bleeding is also possible. Byradiologic studies, the tumour is hypervascular again. Grossly, angiomyolipoma usually issolitary (except in tuberous sclerosis), measuring 0.8-36 cm. The microscopic picture (Figure5) is straightforward if all three components are present in liver biopsy and have typicalstructure. The smooth muscle cells can have epithelioid appearance leading to morphologi‐cal similarity to liver parenchymal cells; the rich vascularity could lead to diagnostic confu‐sion with hepatocellular tumour already earlier. The epithelioid cells sometimes can causesuspicion for malignancy due to large nuclei and nucleoli. However, the nucleo: cytoplasmicratio remains low due to increased cell size.
Figure 5. The microscopic structure of angiomyolipoma. Note the peculiar, thick-walled blood vessels, immaturesmooth muscle proliferation with high cellularity as well as the presence of fat. HE, OM 100x.
In difficult cases, IHC is helpful. The smooth muscle cells express actin (Figure 6) and fatcells – S-100 protein. HMB-45 expression can be observed in perivascular epithelioid cells(Figure 7). The differential diagnosis can include hepatocellular neoplasms or spindle cellsarcomas. Actin expression and complex histological structure helps to exclude hepatocellu‐lar origin of the tumour. Complex structure, combined immunophenotype and low prolifer‐ation help to exclude sarcoma [27].
Primary and Metastatic Tumours of the Liver: Expanding Scope of Morphological and Immunohistochemical Details...http://dx.doi.org/10.5772/52838
131

Figure 6. Actin-positive smooth muscle component in angiomyolipoma. IP, anti-actin, OM 100x.
Figure 7. Expression of melanosome protein HMB-45 in angiomyolipoma. IP, anti-HMB-45, OM 400x.
Liver Biopsy - Indications, Procedures, Results132
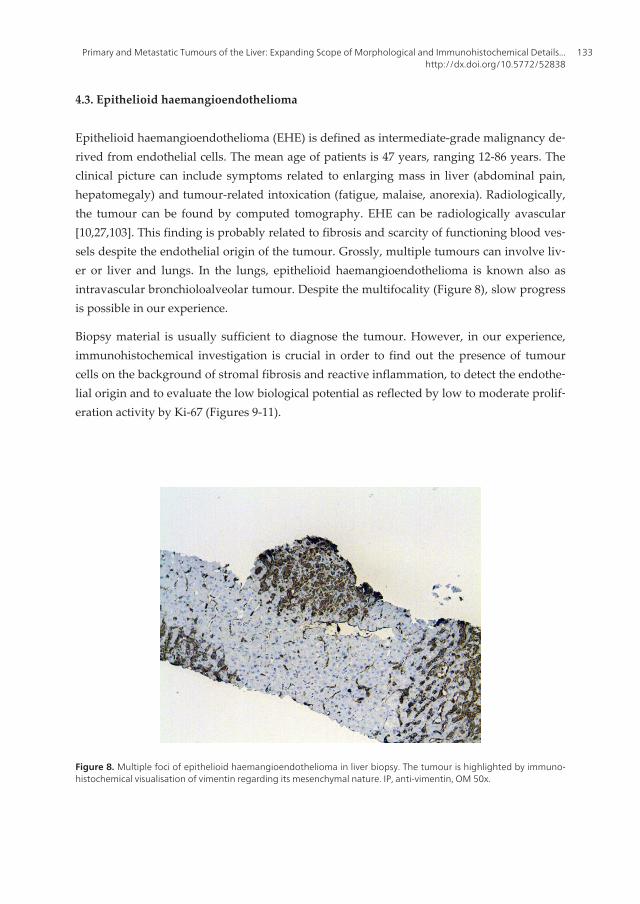
4.3. Epithelioid haemangioendothelioma
Epithelioid haemangioendothelioma (EHE) is defined as intermediate-grade malignancy de‐rived from endothelial cells. The mean age of patients is 47 years, ranging 12-86 years. Theclinical picture can include symptoms related to enlarging mass in liver (abdominal pain,hepatomegaly) and tumour-related intoxication (fatigue, malaise, anorexia). Radiologically,the tumour can be found by computed tomography. EHE can be radiologically avascular[10,27,103]. This finding is probably related to fibrosis and scarcity of functioning blood ves‐sels despite the endothelial origin of the tumour. Grossly, multiple tumours can involve liv‐er or liver and lungs. In the lungs, epithelioid haemangioendothelioma is known also asintravascular bronchioloalveolar tumour. Despite the multifocality (Figure 8), slow progressis possible in our experience.
Biopsy material is usually sufficient to diagnose the tumour. However, in our experience,immunohistochemical investigation is crucial in order to find out the presence of tumourcells on the background of stromal fibrosis and reactive inflammation, to detect the endothe‐lial origin and to evaluate the low biological potential as reflected by low to moderate prolif‐eration activity by Ki-67 (Figures 9-11).
Figure 8. Multiple foci of epithelioid haemangioendothelioma in liver biopsy. The tumour is highlighted by immuno‐histochemical visualisation of vimentin regarding its mesenchymal nature. IP, anti-vimentin, OM 50x.
Primary and Metastatic Tumours of the Liver: Expanding Scope of Morphological and Immunohistochemical Details...http://dx.doi.org/10.5772/52838
133

Figure 9. Epithelioid haemangioendothelioma presenting as a fibrotic focus in liver biopsy. HE, OM 100x.
Figure 10. Loss of liver parenchyma due to infiltration of epithelioid haemangioendothelioma. IP, anti-cytokeratinsAE1/AE3, OM 200x.
Liver Biopsy - Indications, Procedures, Results134

Figure 11. Expression of CD34 in epithelioid haemangioendothelioma. Note also the positive reaction in the lining ofa venule. IP,anti-CD34, OM 400x.
The tumour is growing within sinusoids and venules compressing the adjacent parenchyma.As was mentioned, the expression of endothelial markers is typical. Focal expression of cy‐tokeratin and/or actin is possible [103] and should not cause confusion if panel of immunos‐tains is performed. Stromal fibrosis follows than and can become marked so that neoplasticcells are obscured (Figure 9). Two cell types are described: epithelioid and dendritic. Themorphological differential diagnosis includes non-neoplastic fibrosis and/or inflammationand granulation tissue, angiosarcoma and metastatic cancers with marked stromal fibrosis.The non-neoplastic conditions can be ruled out by tumour architecture as revealed by im‐munohistochemistry. Epithelial tumours can be excluded by the predominance of endothe‐lial markers by IHC. Among the vascular malignancies, the diagnosis of epithelioidhaemangioendothelioma is preferred for lesions with low grade atypia, absence of franklymalignant spindle cells, low proliferation, limited destruction of surrounding liver tissueand absence of necrosis.
4.4. Angiosarcoma
Angiosarcoma is defined as malignant tumour of endothelial cells. Epidemiologically, it ischaracterised by rare occurrence in the liver constituting 2% of primary hepatic malignan‐cies [11]. Elderly (50-60-year-old) males represent the largest group of affected patients [27].The described risk factors include history of thorotrast use for arteriography, exposure to vi‐nyl chloride in the plastics industry where it has been used for polymerisation, arsenic com‐pounds (used as insecticides, possibly present in wine and used in the treatment ofpsoriasis), copper compounds, pesticides and other chemical carcinogens. In all cases, long
Primary and Metastatic Tumours of the Liver: Expanding Scope of Morphological and Immunohistochemical Details...http://dx.doi.org/10.5772/52838
135

latent period (6-35 years) embarrass the data collection. The clinical picture can show signsand symptoms of liver damage (hepatomegaly, local pain, jaundice), disorders of blood cellfunction (anaemia, thrombocytopenia, disseminated intravascular coagulation), and tu‐mour-related intoxication manifesting as weight loss. Ascites, bleeding into abdominal cavi‐ty and liver failure is possible [27]. Grossly, multiple masses with signs of haemorrhage arepresent. Morphologically, the cellular atypia as well as vascular differentiation can be ob‐served in variable extent. High-grade tumours exhibit solid growth with few vascularspaces. Immunohistochemically, endothelial markers CD31 and CD34 are expressed. How‐ever, the immunophenotype can be not straightforward. In our experience, it is important touse several endothelial markers. At first, the reactivity can be uneven [27]. Even more, CD34is technologically beneficial antibody characterised with high affinity. However, during theevaluation it is necessary to consider CD34 expression in non-endothelial tumours includinggastrointestinal stromal tumour and solitary fibrous tumour, among others.
5. Metastatic liver tumours
In Western countries, metastatic tumours represent the most common malignant liver le‐sion with the rate 94-98% among all malignant liver tumours [27]. Almost all malignanttumours, including carcinomas, sarcomas, melanomas and haematological malignancies, cansecondary involve the liver by haematogenous, lymphogeneous or transperitoneal spread.Theoretically, metastatic tumour retains the morphological characteristics of the primarysite. However, the balance between anaplasia and differentiation can shift towards anapla‐sia in such degree that signs of differentiation towards specific tissue or cell type are hard‐ly recognisable. Some tumours like squamous cell cancer and melanoma lack specifityregarding the organ of origin. Even adenocarcinomas retain few specific features. There‐fore the differential diagnostics between primary and secondary liver tumours represents acomplicated practical task. Clinical data can be absent if metastatic liver lesion presents ascancer of unknown origin. The diagnosis can be reached by logical analysis of morpholo‐gy, IHC and molecular data. If the establishment of exact histogenesis is unsuccessful, thebiopsy investigation should be directed towards the analysis of treatment possibilities. Path‐ologist should comment in detail morphological and immunophenotype data that couldeither prove or disregard any particular type of treatment.
In case of liver metastasis, the primary tumour most frequently is located in colon, pancreas,stomach, breast, oesophagus, genitourinary organs [100, 103]. Lung cancer can metastasizeto liver as well [6]. Neuroendocrine tumours, even small, can give rise to hepatic metastases.The clinical course in this case can be prolonged and occasionally characterised by carcinoidsyndrome including flushing, diarrhoea and palpitations.
The spectrum of metastatic tumours in liver biopsies depend on the frequency of differ‐ent tumours, the biological properties of different neoplasms predicting the possibility ofmetastatic spread to liver as well as by the medical paradigm considering the indications
Liver Biopsy - Indications, Procedures, Results136

for liver biopsies. In the files of single university hospital, metastatic tumours constituted45% of tumours or tumour-like liver lesions. Adenocarcinoma was the most frequent histo‐logical type of metastases (65.5%) comprising metastases of colorectal (48.2%), pancreatic(13.5%), breast (13%), gastric (6.2%), lung (4.5%) and oesophageal cancer (3.7%). Neuroen‐docrine carcinomas were seen frequently (16%). Lymphoma constituted 0.4% of all tu‐mours [2]. Metastases in cirrhotic liver were rare [2]. In another study, including 130 casesof metastatic liver disease, gastrointestinal tract was found to be the most common pri‐mary location (45.3%) of cancer metastasizing to liver followed by neuroendocrine tu‐mours (10.7%) [104]. In children, neuroblastoma, nephroblastoma and rhabdomyosarcomaare the most frequent source of metastases [103].
The spread to liver occurs in 5-10% of patients with Hodgkin’s lymphoma and 15-40% ofnon-Hodgkin’s lymphoma cases at the time of diagnosis. Leukemias can involve the liver aswell. Grossly, large cell lymphoma can form masses similarly to carcinoma. In case of Hodg‐kin’s disease, the size of nodules is variable. Leukemic infiltrate can be present without visi‐ble mass lesion. Myeloid leukemias preferentially infiltrate sinusoids, lymphoid – portaltracts, but hairy cell leukemia can involve both portal tracts and sinusoids forming smallblood containing cavities, surrounded by neoplastic cells [103].
Malignant melanoma (Figures 12-14) is one of the greatest challenges in diagnostic surgicalpathology [105] due to amelanotic, clear cell, sarcomatoid, small cell, haemangiopericytoid,signet-ring cell, myxoid, metaplastic and rhabdoid forms. The diagnosis largely depends onIHC. Evaluating the intermediate filaments, melanoma expresses vimentin. Despite the re‐ported concerns of cytokeratin expression in melanoma, this is rare event (3%) in formalin-fixed tissues. Similarly, the expression of glial fibrillar acidic protein and actin is observed in1% of melanomas [105]. Interspersed normal cells should be excluded from evaluation of cy‐tokeratin and actin reactivity. Melanoma is characterised by nuclear and cytoplasmic expres‐sion of S-100 protein in 97.4-98%. S-100 protein can be observed in carcinomas, histiocyticneoplasms and malignant peripheral nerve sheath tumour, therefore melanoma-specific an‐tibodies, e.g., HMB-45 and MART-1/Melan-A must be included in the panel. Melanoma canexpress bcl-2, CD10, CD68, CD56, CD57, CD99, CD117 antigens leading to diagnostic confu‐sion with lymphoma, renal cell cancer, hepatocellular cancer, GIST, seminoma and other ne‐oplasms. Expression of Melan-A is found also in metastatic adrenocortical carcinoma(50-60%) that can be recognised by inhibin expression in around 70% of cases [6]. S-100,HMB-45, Melan-A and inhibin are absent from HCC [6].
Primary and Metastatic Tumours of the Liver: Expanding Scope of Morphological and Immunohistochemical Details...http://dx.doi.org/10.5772/52838
137

Figure 12. Diffuse sinusoidal spread of undifferentiated malignant tumour. By immunohistochemistry, metastaticmelanoma was revealed (see also Figure 13). HE, OM 400 x.
Figure 13. Intense perinuclear expression of melanosome protein HMB-45 in metastatic melanoma. IP, anti-HMB-45,OM 400x.
Liver Biopsy - Indications, Procedures, Results138

Figure 14. Lack of cytokeratins AE1/AE3 in metastatic melanoma. Note the unusual sinusoidal spread. IP, anti-AE1/AE3, OM 400x.
Metastatic breast cancer expresses CK7 but not CK20. However, this immunophenotype isshared by many adenocarcinomas. To identify the tumour as metastasis from breast primarytumour, gross cystic disease fluid protein fraction-15 (GCDFP-15) and/or mammaglobin canbe detected. The specifity of GCDFP-15 is estimated as 99%, and the sensitivity ranges from50 to 74%. Breast cancers of luminal molecular type express oestrogen (ER) and progester‐one receptors (PR). Naturally, the expression of female steroid hormone receptors is sharedby ovarian and endometrial cancer. Nowadays the detection of ER and PR is routine inbreast cancer diagnostics but less experience is obtained with expression of hormone recep‐tors in extra-genital carcinomas. The scientific studies report expression of ER in carcinomaof lung, stomach and thyroid [105]. The cross-reactivity can be associated by certain anti‐body clones. Also, HER-2 positive and triple negative molecular types of breast cancer aremore prone to develop visceral metastases. Thus, negative ER/PR expression cannot excludemetastatic breast cancer, and positive findings should be interpreted with caution recognis‐ing the possibility of metastatic ovarian or endometrial cancer and cross-reactivity or trueexpression of hormone receptors in extra-genital tumour. ER/PR expression in lung or thy‐roid tumour can be controlled by TTF-1 protein expression and/or evaluation for neuroen‐docrine markers and calcitonin.
Primary and Metastatic Tumours of the Liver: Expanding Scope of Morphological and Immunohistochemical Details...http://dx.doi.org/10.5772/52838
139

Figure 15. Surfactant A in pulmonary adenocarcinoma. IP, anti-surfactant apoprotein A, OM 400x.
Adenocarcinoma, squamous cell cancer, small cell cancer and carcinoid are the most fre‐quent lung neoplasms. Lung adenocarcinoma is characterised by expression of CK7 (100%)and TTF-1 (60-75%). Expression of CK20 is rare. Cytokeratins 5/6 and 34betaE12 can bepresent but are not dominant in comparison with CK7. Vimentin can be found in lungadenocarcinomas. Nuclear expression of TTF-1 and/or cytoplasmic expression of surfac‐tant apoprotein A (Figure 15) is an evidence of pulmonary origin. Small cell cancer express‐es neuroendocrine markers and pan-cytokeratin. The expression of chromogranin A and CKAE1/AE3 can be limited to perinuclear dot reactivity. Simultaneous detection of leukocytecommon antigen can be suggested to perform differential diagnosis with haematologicalneoplasm. Nuclear expression of TTF-1 protein is frequently present (Figures 16-18). Thehigh proliferation fraction by Ki-67 is characteristic albeit unspecific. The immunopheno‐type of squamous cell cancer is unspecific and characterised by cytoplasmic expression ofCK5/6 and CK 34betaE12 in association with strong nuclear reactivity with p63 protein. CK7can be present but is not dominant. TTF-1 protein is absent. Carcinoid is characterised byneuroendocrine differentiation and low proliferative activity. The TTF-1 expression is notfrequent [17,105-107].
Liver Biopsy - Indications, Procedures, Results140

Figure 16. Small cell cancer. Note the “salt-and-pepper” chromatin and high mitotic activity. HE, OM 400x.
Figure 17. Granular cytoplasmic and perinuclear expression of chromogranin A in small cell cancer. IP, anti-chromog‐ranin A, OM 400x.
Primary and Metastatic Tumours of the Liver: Expanding Scope of Morphological and Immunohistochemical Details...http://dx.doi.org/10.5772/52838
141

Figure 18. Nuclear TTF-1 expression in small cell cancer. IP, anti-chromogranin A, OM 400x.
Mesothelioma is characterised by expression of CK7, CK5/6, vimentin and calretinin (Figure19). HBME-1 can be expressed as well but lacks specifity.
Figure 19. Nuclear and cytoplasmic expression of calretinin in epithelioid mesothelioma.IP, anti-calretinin, OM 400x.
Liver Biopsy - Indications, Procedures, Results142

Metastatic colorectal carcinoma can be recognised by diffuse intensive cytoplasmic expres‐sion of CK20 and nuclear expression of CDX2 [108]. Carcinoid of the midgut and hindgutalso are positive for CDX2 [109].
Neuroendocrine tumours are characterised by strong cytoplasmic expression of chromogra‐nin A and synaptophysin and negativity for Hep Par 1 [6]. CD56 is considered to be themost sensitive neuroendocrine marker. In our experience, it shows reliable performance insmall or compressed biopsies making it especially valuable tool for the evaluation of scanttissue material. Occasional CD56 expression in HCC is described [6].
Renal cell carcinoma is characterised by negativity for Hep Par 1 and CEA expression (bypolyclonal anti-CEA antibody). Unfortunately, the rate of RCC expression decreases from50-80% in primary clear cell renal carcinoma and 60-90% in papillary renal cell cancer to20% in metastatic renal cell carcinoma. CD10 can be present both in HCC and renal cellcarcinoma. Although the pattern of expression is different this can be difficult to evaluate,especially in core biopsy. PAX-2 is advised as marker of metastatic renal cell carcinoma withthe expression rate 70-80%. Expression of vimentin is more characteristic in clear cell re‐nal carcinoma (60-70%) than in hepatocellular carcinoma; chromophobe renal cell carcino‐ma also is negative [6].
As tumour heterogeneity remains a source of problems [69] and the immunophenotype canbe inherently complex and subjected to cross reactivity, we recommend wide IHC panels in‐cluding several markers for HCC and cholangiocarcinoma as well as markers for metastatictumour, including the organospecific antigens (see Tables 1-2).
Tumour Immunophenotype
Malignant melanoma Vim + CK AE1 / AE3 – S-100 + HMB-45 + MART-1 / Melan A +
Lung adenocarcinoma CK7+ CK20- CK34betaE12-/+ TTF-1+ Surfactant apoprotein A +
Small cell cancer CK AE1/AE3 + ChrA+ CD56 +TTF-1 +
Squamous cancer CK34betaE12+ CK7-/+ CK20 – p63+
NET CK AE1/AE3 + ChrA+ TTF-1 +/ - (lung) or CDX2 + (midgut, hindgut)
Breast cancer CK 7 + CK20 – MG +/– ER +/– PR +/–
Colorectal cancer CK20+ CK7- CDX2+ TTF-1-
Table 1. The immunophenotype of selected malignant tumours. Abbreviations in the Table: Vim, vimentin; CK,cytokeratin; TTF-1, thyroid transcription factor 1; ChrA, chromogranin A; NET, neuroendocrine tumour; MG,mammaglobin; ER, oestrogen receptor; PR, progesterone receptor
Antigen Valuable positive expression Notes
Glypican-3 Hepatocellular carcinoma Occasional positivity in non-hepatocellular tumour
Arginase-1 Hepatocellular carcinoma Sensitivity for hepatocellular carcinoma 96%
Normal liver tissue positive
Metastatic tumours rarely positive [69]
Primary and Metastatic Tumours of the Liver: Expanding Scope of Morphological and Immunohistochemical Details...http://dx.doi.org/10.5772/52838
143

Hep Par 1 Hepatocellular carcinoma Sensitivity for hepatocellular carcinoma around 50% [69]
Gastric carcinoma can be positive
AFP Hepatocellular carcinoma Sensitivity for hepatocellular carcinoma around 15% [69]
CD10 Renal cell carcinoma
Hepatocellular carcinoma
Negative in adrenal carcinoma
CK7 Cholangiocellular carcinoma
Metastatic cancers
Positivity does not exclude hepatocellular carcinoma
Valuable for primary evaluation of malignant tumour within
liver
CK17 Cholangiocellular carcinoma
Metastatic cancers
Positive tumours as pancreatic cancer (58%), squamous
carcinoma (75%), urothelial carcinoma (75%) and
cholangiocellular carcinoma (35%) can be distinguished
from negative ones (gastric, colorectal, prostate, breast
cancer, hepatocellular carcinoma)
CK19 Cholangiocellular carcinoma
Metastatic cancers
Positivity does not exclude hepatocellular carcinoma
CK20 Metastatic colorectal cancer Useful in conjuction with CK7 for initial grouping of cancers
showing adenocarcinomatous structure
CDX2 Metastatic colorectal cancer and NETs Heterogeneous focal expression in gastric and pancreatic
carcinomas
Mucinous ovarian cancers can be positive
Morules in endometrioid carcinoma are positive
Calretinin Mesothelioma
Adrenal cortical carcinoma
Sex cord-stromal tumours of the
genital tract
Squamous carcinoma frequently positive
Surfactant
apoprotein A
Lung adenocarcinoma. In our
experience possess high affinity and is
useful, if positive
Reactivity in thyroid cancer (43% in small group) has been
reported
Heterogeneous expression has been observed [69]
TTF-1, nuclear
expression
Metastatic pulmonary
adenocarcinoma (75% of non-
mucinous type and 10% of mucinous
type), small cell cancer (pulmonary,
50-90%; non-pulmonary, 44-80%) or
thyroid cancer including papillary,
follicular and medullary but not
anaplastic carcinoma [69]
Regarding pulmonary adenocarcinoma, less subjected to
heterogeneity-related evaluation problems than surfactant
apoprotein A
Endometrial (17%) or breast (2.4%) cancer occasionally
positive [69]
TTF-1, cytoplasmic
expression:
Hepatocellular carcinoma Expression in benign liver parenchyma is present
Gastric or prostatic cancer can show cytoplasmic positivity
Chromogranin A
and
synaptophysin
NET
Liver Biopsy - Indications, Procedures, Results144

CD56 NET, cholangiocarcinoma Other tumours can be positive
Oestrogen and
progesterone
receptors
Breast, ovarian or endometrial cancer,
endometrial stromal sarcoma
Non-gynaecologic cancers can be occasionally positive,
including lung cancer (4-15-67%)
CD117 GIST
Seminoma
CD34 is co-expressed in GISTs
PLAP is co-expressed in germ cell tumours
Mammaglobin Breast cancer High heterogeneity
Sensitivity for breast cancer 40-85%
Ovarian (17%), endometrial (40-70%) and endocervical
(30%) carcinoma can also be positive [69]
GCDFP-15 Breast cancer Sensitivity for breast cancer 50-60%
High heterogeneity
Not associated with mammaglobin thus simultaneous
evaluation can be recommended [69]
PSA Prostatic cancer Negative in 5% high-grade prostate cancers. Reactivity in
few breast carcinomas and rectal NETs have been observed
[69]
Pax8 Thyroid cancer
Female genital tract carcinomas
Renal cell cancer
Sensitivity for thyroid cancer 79-100% and for renal cancer
71-98%
Breast cancer is negative. Positivity is useful to discriminate
breast cancer from ovarian or endometrial cancer
NETs can be positive
P63 Squamous cell cancer
Urothelial carcinoma
Table 2. Panel of antibodies for liver biopsy evaluation. Abbreviations in the Table: AFP, alpha-fetoprotein; CK,cytokeratin; NET, neuroendocrine tumour; TTF-1, thyroid transcription factor 1; GIST, gastrointestinal stromal tumour;PLAP, placental alkaline phosphatase; GCDFP-15, gross cystic disease fluid protein-15; PSA, prostate specific antigen
6. Cystic biliary tumours
The cystic biliary tumours are defined by cystic structure and development of / differentia‐tion towards intrahepatic bile duct epithelium. The group includes malignant biliary cysta‐denocarcinoma and benign biliary cystadenoma. Epidemiologically, cystic biliary tumoursrepresent rare entities, with incidence of biliary cystadenocarcinoma approximately 1/10million (corresponding to 0.01/100 000) and of biliary cystadenoma 1/100 000 - 5/100 000[110]. Biliary cystadenocarcinoma is diagnosed mostly at the age 50-60 years [100]. Biliarycystadenoma is diagnosed in younger patients: mean age 40.6 (range 30-51) vs. 51.3 (range41-63) years in biliary cystadenocarcinoma group [14]. In other studies even larger age dif‐ference (17 years) is found between patients affected by benign and malignant cystic biliarytumours, respectively [111-112]. Cystic biliary tumours are more common in women:80-100% of biliary adenoma and 63-71.4% of biliary cystadenocarcinoma are described in fe‐
Primary and Metastatic Tumours of the Liver: Expanding Scope of Morphological and Immunohistochemical Details...http://dx.doi.org/10.5772/52838
145

male [14]. The clinical picture reflects the presence of mass lesion and is dominated by ab‐dominal pain [113]. The other manifestations and complications include jaundice,cholangitis, tumour rupture [114], haemorrhage [115], compression of the portal or cavalveins with possible subsequent ascites [113], hemobilia [12] and mucobilia [116]. Notably,the tumour can progress slowly [117] with the clinical history of biliary cystadenocarcinomaas long as 10-15 years [112,118]. The long course is is in accordance with the low grade ofmalignancy and gradual development of tumour through stages of increased epithelial pro‐liferation, dysplasia, in situ cancer and, finally, invasive cancer. Thus, long anamnesis ofcystic hepatic mass does not exclude the possibility of malignant tumour and the need forcareful follow-up if the cyst is not removed by operation. Although biopsy can be consid‐ered in cases with unclear differential diagnosis, it is not the first choice because of the fol‐lowing considerations. First, simple liver cyst is the main differential diagnosis of cysticbiliary tumours. Although biliary cystadenocarcinoma is rare, liver cysts have high preva‐lence being present in 2.5% of the population [119] and cannot be distinguished from cysticbiliary tumours on the basis of CA19-9 and CEA levels [14,114]. However, core biopsy is un‐likely to yield sufficient tissue in case of simple cyst or cystadenoma; it also is not suitablefor the diagnostics of focal malignancy and rarely can lead to peritoneal carcinomatosis [13].Therefore radiological diagnostics, especially computed tomography, is essential [117].Grossly, biliary cystadenocarcinoma is multicystic. Internal mural nodules are irregularlydistributed in the walls. The tumour most frequently is located within the liver (83%). Extra-hepatic bile ducts (13%) or the gall bladder (0.02%) has been affected by this tumour as well[14]. The size of cystic biliary tumours (1.5-30 cm) is not helpful in the differential diagnos‐tics between simple hepatic cyst and cystic biliary tumours; it also has no correlation withmalignant biological potential [120]. The metastatic spread of biliary cystadenocarcinomacan affect the liver, regional lymph nodes in the hepatoduodenal ligament, lungs, pleura orperitoneum [100]. Histologically, biliary cystadenocarcinoma is characterised by clear-cutsigns of malignancy: cellular atypia, particularly nuclear polymorphism, mitotic activity andinvasion into surrounding stroma. The tumour architecture is cystic and papillary. The be‐nign counterpart of biliary cystadenocarcinoma, the biliary cystadenoma lacks the malig‐nant features [100] and is composed by either mucinous or serous benign epithelium. Mostof cystic biliary tumours possess characteristic mesenchymal, ovarian–type stroma. Hypo‐thetically, these tumours arise from bile ducts proximal to the hilum of the liver and sharethe cystic structure and presence of peculiar ovarian-type mesenchymal stroma with muci‐nous cystic tumours of the pancreas and retroperitoneum, leading to the hypothesis that ec‐topic ovarian stroma during embryogenesis can become incorporated along the biliary tree,in the pancreas and retroperitoneal space and cause the proliferation of the adjacent epitheli‐um by production of the hormones and growth factors [121]. Origin from intrahepatic peri‐biliary glands [122] or from ectopic rests of primitive foregut sequestered in the liver [114]has been hypothesised. Development from pluripotential stem cells is suggested on the ba‐sis of the presence of albumin messenger RNA and biliary type cytokeratins in the tumourcells [123]. Biliary cystadenocarcinoma without mesenchymal stroma more frequently arisesin males and carries poorer prognosis in comparison with the tumour possessing mesenchy‐mal stroma [122]. By immunohistochemistry, increasing proliferative activity by Ki-67 ex‐
Liver Biopsy - Indications, Procedures, Results146

pression as well as increasing p53 protein expression from adenoma to carcinoma wasshown in biliary cystadenocarcinoma without ovarian-type stroma [124]. Expression of cyto‐keratin (CK) 7 and absence of CK20, CEA, alpha-fetoprotein, calretinin, CD31 and chromog‐ranin is described [125]. However, presence of CK20, although typical for colorectal cancer,is described in cholangiocarcinoma, especially non-peripheral [126]. It might be expected inbiliary cystadenocarcinoma with growing awareness about this entity.
There is evidence showing that at least some cases of biliary cystadenocarcinoma originatefrom pre-existing biliary cystadenoma. These data include the age difference between biliarycystadenocarcinoma and biliary adenoma patients [14] as well as morphologic findings ofmalignant transformation in a lesion with focally innocuous structure [127].
Radiologically, presence of internal septations allows excluding a simple cyst. Vascularity ofsepta is characteristic for cystic biliary tumours [14] and is considered by some specialists tobe more reliable in distinguishing biliary cystadenoma from cyst than the simple presence ofseptations [117]. Biliary cystadenoma is characterised by smooth and thin internal septa, butpresence of enhanced mural nodules in the outer wall or septa is the most important sign ofmalignancy. Calcification is not frequent but has been found specific for malignancy bysome [14] but not all [119] authors as far as cystic biliary tumours are concerned. Size, num‐ber of septations or location of the neoplasm does not help to differentiate between benignor malignant cystic biliary tumours [14]. Some authors have postulated that preoperativedifferentiation between biliary adenoma and cystadenocarcinoma by radiologic imaging isnot possible therefore liver resection should be performed for all cystic biliary tumours[120]. This assumption is based on the experience that internal papillae with arterial en‐hancement may be present in both tumours so that computed tomography and magneticresonance imaging yield overlapping data.
The clinical differential diagnosis of cystic liver lesions, entering the differential diagnosis ofbiliary cystadenocarcinoma, include developmental, neoplastic, inflammatory and traumaticlesions as simple bile duct cyst, polycystic liver disease, biliary hamartoma, cystically degen‐erated cases of other primary or metastatic liver tumours, abscesses, hydatid cyst, extrap‐ancreatic pseudocyst, hematoma and biloma [119,128].
7. Conclusions
In conclusion, wide variety of neoplastic processes can affect the liver. Most of non-cystictumours can be reliably diagnosed in liver biopsy. Several demographic and clinical datashould be submitted along with the liver biopsy. Patient’s age and presence or absence ofclinical symptoms must be known. If there is history of contraceptive use it should be report‐ed. Radiological data have high relevance: the size, localisation in respect to liver capsule andnumber of focal liver lesions should be known to the pathologist. The vascularity should bedescribed. Knowing these data, pathologist should evaluate the haematoxylin-eosin stainedspecimen. Wide panel of immunohistochemical stains can be recommended than.
Primary and Metastatic Tumours of the Liver: Expanding Scope of Morphological and Immunohistochemical Details...http://dx.doi.org/10.5772/52838
147

Author details
Ilze Strumfa1*, Janis Vilmanis2, Andrejs Vanags2*, Ervins Vasko3, Dzeina Sulte3,Zane Simtniece1, Arnis Abolins1 and Janis Gardovskis2
*Address all correspondence to: [email protected]
1 Department of Pathology, Riga Stradins University, Riga, Latvia
2 Department of Surgery, Riga Stradins University, Riga, Latvia
3 Faculty of Medicine, Riga Stradins University, Riga, Latvia
References
[1] Ho, M., & Kim, H. (2011). Glypican-3: a new target for cancer immunotherapy. Eur JCancer, 47(3), 333-338.
[2] Kasper, H. U., Drebber, U., Dries, V., & Dienes, H. P. (2005). Liver metastases: inci‐dence and histogenesis. Z Gastroenterol, 43(10), 1149-1157.
[3] Al-Muhannadi, N., Ansari, N., Brahmi, U., & Satir, A. A. (2011). Differential diagno‐sis of malignant epithelial tumours in the liver: an immunohistochemical study onliver biopsy material. Ann Hepatol, 10(4), 508-515.
[4] Marrero, J. A. (2009). Modern diagnosis of hepatocellular carcinoma: utilization ofliver biopsy and genomic markers. J Hepatol, 50(4), 659-661.
[5] Kayser, K. (2012). Introduction of virtual microscopy in routine surgical pathology –a hypothesis and personal view from Europe. Diagn Pathol, 7(1), 48, http://www.diag‐nosticpathology.org/content/pdf/1746-1596-7-48.pdf , (accessed 04 August 2012).
[6] Kakar, S., Gown, A. M., Goodman, Z. D., & Ferrell, L. D. (2007). Best practices in di‐agnostic immunohistochemistry: hepatocellular carcinoma versus metastatic neo‐plasms. Arch Pathol Lab Med, 131(11), 1648-1654.
[7] Roncalli, M., Park, Y. N., & Di Tommaso, L. (2010). Histopathological classification ofhepatocellular carcinoma. Dig Liver Dis, 42(3), S228-S234.
[8] Purcell, R., Childs, M., Maibach, R., Miles, C., Turner, C., Zimmermann, A., Czauder‐na, P., & Sullivan, M. (2011). Potential biomarkers for hepatoblastoma: Results fromthe SIOPEL-3 study. Eur J Cancer, 48(12), 1853-1859.
[9] Bosch, F. X., Ribes, J., Cleries, R., & Diaz, M. (2005). Epidemiology of hepatocellularcarcinoma. Clin Liver Dis, 9(2), 191-211.
Liver Biopsy - Indications, Procedures, Results148

[10] Bosman, F. T., Carneiro, F., Hruban, R. H., & Theise, N. D. (2010). WHO classificationof tumours of the digestive system, 4th edition. Lyon: International Agency for Researchon Cancer (IARC).
[11] Bhati, C. S., Bhatt, A. N., Starkey, G., Hubscher, S. G., & Bramhall, S. R. (2008). Acuteliver failure due to primary angiosarcoma: a case report and review of literature.World J Surg Oncol, 6, 104, doi:10.1186/1477-7819-6-104, http://www.wjso.com/content/6/1/104, (accessed 08 August 2012).
[12] Madariaga, J. R., Iwatsuki, S., Starzl, T. E., Todo, S., Selby, R., & Zetti, G. (1993). Hep‐atic resection for cystic lesions of the liver. Ann Surg, 218(5), 610-614.
[13] Manouras, A., Markogiannakis, H., Lagoudianakis, E., & Katergiannakis, V. (2006).Biliary cystadenoma with mesenchymal stroma: report of a case and review of the lit‐erature. World J Gastroenterol, 12(37), 6062-6069.
[14] Pojchamarnwiputh, S., Na, Chiangmai. W., Chotirosniramit, A., & Lertprasertsuke,N. (2008). Computed tomography of biliary cystadenoma and biliary cystadenocarci‐noma. Singapore Med J, 49(5), 392-396.
[15] Schullian, P., Widmann, G., Lang, T. B., Knoflach, M., & Bale, R. (2011). Accuracy anddiagnostic yield of CT-guided stereotactic liver biopsy of primary and secondary liv‐er tumours. Comput Aided Surg, 16(4), 181-187, doi: 10.3109/10929088.2011.578367.
[16] Mishra, M., Morgan, V., Hamati, A. K., & Al-Abbadi, M. (2012). Carcinoma of un‐known primary: check the liver... thanks to TTF-1. Tenn Med, 105(1), 35-36.
[17] Bahrami, A., Truong, L. D., & Ro, J. Y. (2008). Undifferentiated tumour: true identityby immunohistochemistry. Arch Pathol Lab Med, 132(3), 326-348.
[18] Guo, H., Lv, Y., Tian, T., Hu, T. H., Wang, W. J., Sui, X., Jiang, L., Ruan, Z. P., & Nan,K. J. (2011). Downregulation of p57 accelerates the growth and invasion of hepatocel‐lular carcinoma. Carcinogenesis, 32(12), 1897-1904.
[19] Chen, H. W., Huang, X. D., Li, H. C., He, S., Ni, R. Z., Chen, C. H., Peng, C., Wu, G.,Wang, Y. Y., Zhao, Y. H., Zhang, Y. X., Shen, A. G., & Wang, H. M. (2012). Expressionof FOXJ1 in hepatocellular carcinoma: correlation with patients’ prognosis and tumorcell proliferation. Mol Carcinog, Epub ahead of print,, doi: 10.1002/mc.21904, http://onlinelibrary.wiley.com/doi/10.1002/mc.21904/pdf, (accessed 4 July).
[20] Liao, M., Tong, P., Zhao, J., Zhang, Y., Li, Z., Wang, J., Feng, X., Hu, M., & Pan, Y.(2012). Prognostic value of matrix metalloproteinase-1/proteinase-activated recep‐tor-1 signaling axis in hepatocellular carcinoma. Pathol Oncol Res, 18(2), 397-403.
[21] Lu, J. T., Zhao, W. D., He, W., & Wei, W. (2012). Hedgehog signaling pathway medi‐ates invasion and metastasis of hepatocellular carcinoma via ERK pathway. ActaPharmacol Sin, 33(5), 691-700.
[22] Yin, X., Li, Y. W., Zhang, B. H., Ren, Z. G., Qiu, S. J., Yi, Y., & Fan, J. (2012). Coexpres‐sion of stemness factors Oct4 and Nanog predict liver resection. Ann Surg Oncol,
Primary and Metastatic Tumours of the Liver: Expanding Scope of Morphological and Immunohistochemical Details...http://dx.doi.org/10.5772/52838
149

Epub Mar 30 ahead of print., doi: 10.1245/s10434-012-2314-6, http://www.springer‐link.com/content/h31v0112827836r2/fulltext.pdf, (accessed 04 August).
[23] Di Tommaso, L., Destro, A., Seok, J. Y., Balladore, E., Terracciano, L., Sangiovanni,A., Iavarone, M., Colombo, M., Jang, J. J., Yu, E., Jin, S. Y., Morenghi, E., Park, Y. N.,& Roncalli, M. (2009). The application of markers (HSP70 GPC3 and GS) in liver bi‐opsies is useful for detection of hepatocellular carcinoma. J Hepatol, 50(4), 746-754.
[24] Albulescu, R., Neagu, M., Albulescu, L., & Tanase, C. (2011). Tissular and solublemiRNAs for diagnostic and therapy improvement in digestive tract cancers. ExpertRev Mol Diagn, 11(1), 101-120.
[25] Meng, F., Glaser, S. S., Francis, H., De Morrow, S., Han, Y., Passarini, Stokes. A.,Cleary, J. P., Liu, X., Venter, J., Kumar, P., Priester, S., Hubble, L., Staloch, D., Shar‐ma, J., Liu, C. G., & Alpini, G. (2012). Functional analysis of microRNAs in humanhepatocellular cancer stem cells. J Cell Mol Med, 16(1), 160-173.
[26] Barthelmes, L., & Tait, I. S. (2005). Liver cell adenoma and liver cell adenomatosis.HPB (Oxford), 7(3), 186-196.
[27] Kanel, G. C., & Korula, J. (2011). Atlas of liver pathology. 3rd edition. Philadelphia:Elsevier Saunders.
[28] Bioulac-Sage, P., Balabaud, C., & Zucman-Rossi, J. (2010). Subtype classification ofhepatocellular adenoma. Dig Surg, 27(1), 39-45.
[29] Walther, Z., & Jain, D. (2011). Molecular pathology of hepatic neoplasms: classifica‐tion and clinical significance. Pathology Research Int, 2011, 403929,10.4061/2011/403929, http://www.hindawi.com/journals/pri/2011/403929/, (accessed08 July 2012).
[30] Buell, J. F., Tranchart, H., Cannon, R., & Dagher, I. (2010). Management of benignhepatic tumours. Surg Clin North Am, 90(4), 719-735.
[31] Longo, D. L., Fauci, A., Kasper, D., Hauser, S., Jameson, J. L., & Loscalzo, J. (2012).Harrison’s principles of internal medicine. McGraw-Hill.
[32] Farges, O., & Dokmak, S. (2010). Malignant transformation of liver adenoma: an anal‐ysis of the literature. Dig Surg, 27(1), 32-38.
[33] Bluteau, O., Jeannot, E., Bioulac-Sage, P., Marques, J. M., Blanc, J. F., Bui, H., Beau‐doin, J. C., Franco, D., Balabaud, C., Laurent-Puig, P., & Zucman-Rossi, J. (2002). Bi-allelic inactivation of TCF1 in hepatic adenomas. Nat Genet, 32(2), 312-315.
[34] Reznik, V., Dao, T., Coutant, R., Chiche, L., Jeannot, E., Clauin, S., Rousselot, P., Fa‐bre, M., Oberti, F., Fatome, A., Zucman-Rossi, J., & Bellanne-Chantelot, C. (2004).Hepatocyte nuclear factor-1 alpha gene inactivation: cosegregation between liver ad‐enomatosis and diabetes phenotypes in two maturity-onset diabetes of the young(MODY) 3 families. J Clin Endocrinol Metab, 89(3), 1476-1480.
Liver Biopsy - Indications, Procedures, Results150
[35] Jeannot, E., Mellottee, L., Bioulac-Sage, P., Balabaud, C., Scoazec, J. Y., Tran Van,Nhieu. J., Bacq, Y., Michalak, S., Buob, D., Groupe d’etude Genetique des TumeursHepatiques (INSERM Network), Laurent-Puig, P., Rusyn, I., & Zucman-Rossi, J.(2010). Spectrum of HNF1A somatic mutations in hepatocellular adenoma differsfrom that in patients with MODY3 and suggests genotoxic damage. Diabetes, 59(7),1836-1844.
[36] Rebouissou, S., Amessou, M., Couchy, G., Poussin, K., Imbeaud, S., Pilati, C., Izard,T. B., Alabaud, C., Bioulac-Sage, P., & Zucman-Rossi, J. (2009). Frequent in-frame so‐matic deletions activate gp130 in inflammatory hepatocellular tumours. Nature,457(7226), 200-204.
[37] Chen, Y. W., Jeng, Y. M., Yeh, S. H., & Chen, P. J. (2002). P53 gene and Wnt signalingin benign neoplasms: beta-catenin mutations in hepatic adenoma but not in focalnodular hyperplasia. Hepatology, 36(4 Pt 1), 927-935.
[38] Zucman-Rossi, J., Jeannot, E., Nhieu, J. T., Scoazec, J. Y., Guettier, C., Rebouissou, S.,Bacq, Y., Leteurtre, E., Paradis, V., Michalak, S., Wendum, D., Chiche, L., Fabre, M.,Mellottee, L., Laurent, C., Partensky, C., Castaing, D., Zafrani, E. S., Laurent-Puig, P.,Balabaud, C., & Bioulac-Sage, P. (2006). Genotype-phenotype correlation in hepato‐cellular adenoma: new classification and relationship with HCC. Hepatology, 43(3),515-524.
[39] Bioulac-Sage, P., Laumonier, H., Rullier, A., Cubel, G., Laurent, C., Zucman-Rossi, J.,& Balabaud, C. (2009). Over-expression of glutamine synthetase in focal nodular hy‐perplasia: a novel easy diagnostic tool in surgical pathology. Liver Int, 29(3), 459-465.
[40] Wanless, I. R., Mawdsley, C., & Adams, R. (1985). On the pathogenesis of focal nodu‐lar hyperplasia of the liver. Hepatology, 5(6), 1194-1200.
[41] Bioulac-Sage, P., Laumonier, H., Cubel, G., Saric, J., & Balabaud, C. (2008). Over-ex‐pression of glytamine synthase in focal nodular hyperplasia (part 1): early stages inthe formation support the hypothesis of a focal hyper-arterialisation with venous(portal and hepatic) and biliary damage. Comp Hepatol, 7, 2.
[42] Rebouissou, S., Bioulac-Sage, P., & Zucman-Rossi, J. (2008). Molecular pathogenesisof focal nodular hyperplasia and hepatocellular adenoma. J Hepatol, 48(1), 163-170.
[43] Altekruse, S. F., Mc Glynn, K. A., & Reichman, M. E. (2009). Hepatocellular carcino‐ma incidence, mortality, and survival trends in the United States from 1975 to 2005. JClin Oncol, 27(9), 1485-1491.
[44] Bancroft, J. D., & Gamble, M. (2002). Theory and practice of histological techniques,5th ed. Edinburgh: Churchill Livingstone.
[45] Capurro, M. I., Xiang, Y. Y., Lobe, C., & Filmus, J. (2005). Glypican-3 promotes thegrowth of hepatocellular carcinoma by stimulating canonical Wnt signaling. CancerRes, 65(14), 6245-6254.
Primary and Metastatic Tumours of the Liver: Expanding Scope of Morphological and Immunohistochemical Details...http://dx.doi.org/10.5772/52838
151

[46] Capurro, M. I., Xu, P., Shi, W., Li, F., Jia, A., & Filmus, J. (2008). Glypican-3 inhibitsHedgehog signaling during development by competing with patched for Hedgehogbinding. Dev Cell, 14(5), 700-711.
[47] Nakatsura, T., Yoshitake, Y., Senju, S., Monji, M., Komori, H., Motomura, Y., Hosaka,S., Beppu, T., Ishiko, T., Kamohara, H., Ashikara, H., Katagiri, T., Furukawa, Y., Fu‐jiyama, S., Ogawa, M., Nakamura, Y., & Nishimura, Y. (2003). Glypican-3, overex‐pressed specifically in human hepatocellular carcinoma, is a novel tumor marker.Biochem Biophys Res Commun, 306(1), 16-25.
[48] Yamauchi, N., Watanabe, A., Hishinuma, M., Ohashi, K., Midorikawa, Y., Morishita,Y., Niki, T., Shibahara, J., Mori, M., Makuuchi, M., Hippo, Y., Kodama, T., Iwanari,H., Aburatani, H., & Fukayama, M. (2005). The glypican 3 oncofetal protein is apromising diagnostic marker for hepatocellular carcinoma. Mod Pathol, 18(12),1591-1598.
[49] Wang, Y. L., Zhu, Z. J., Teng, D. H., Yao, Z., Gao, W., & Shen, Z. Y. (2012). Glypican-3expression and its relationship with recurrence of HCC after liver transplantation.World J Gastroenterol, 18(19), 2408-2414.
[50] Nakatsura, T., Kageshita, T., Ito, S., Wakamatsu, K., Monji, M., Ikuta, Y., Senju, S.,Ono, T., & Nishimura, Y. (2004). Identification of glypican-3 as a novel tumor markerfor melanoma. Clin Cancer Res, 10(19), 6612-6621.
[51] Stadlmann, S., Gueth, U., Baumhoer, D., Moch, H., Terracciano, L., & Singer, G.(2007). Glypican-3 expression in primary and recurrent ovarian carcinomas. Int J Gy‐necol Pathol, 26(3), 341-344.
[52] Zynger, D. L., Dimov, N. D., Luan, C., Teh, B. T., & Yang, X. J. (2006). Glypican 3: anovel marker in testicular germ cell tumors. Am J Surg Pathol, 30(12), 1570-1575.
[53] Esheba, G. E., Pate, L. L., & Longacre, T. A. (2008). Oncofetal protein glypican-3 dis‐tinguishes yolk sac tumor from clear cell carcinoma of the ovary. Am J Surg Pathol,32(4), 600-607.
[54] Baumhoer, D., Tornillo, L., Stadlmann, S., Roncalli, M., Diamantis, E. K., & Terraccia‐no, L. M. (2008). Glypican 3 expression in human nonneoplastic, preneoplastic, andneoplastic tissues: a tissue microarray analysis of 4,387 tissue samples. Am J ClinPathol, 129(6), 899-906.
[55] Ushiku, T., Uozaki, H., Shinozaki, A., Ota, S., Matsuzaka, K., Nomura, S., Kaminishi,M., Aburatani, H., Kodama, T., & Fukuyama, M. (2009). Glypican 3-expressing gas‐tric carcinoma: distinct subgroup unifying hepatoid, clear-cell and alpha-fetoprotein-producing gastric carcinomas. Cancer Sci, 100(4), 626-632.
[56] Murthy, S. S., Shen, T., De Rienzo, A., Lee, W. C., Ferriola, P. C., Jhanwar, S. C.,Mossman, B. T., Filmus, J., & Testa, J. R. (2000). Expression of GPC3, an X-linked re‐cessive overgrowth gene, is silenced in malignant mesothelioma. Oncogene, 19(3),410-416.
Liver Biopsy - Indications, Procedures, Results152

[57] Xiang, Y. Y., Ladeda, V., & Filmus, J. (2001). Glypican-3 expression is silenced in hu‐man breast cancer. Oncogene, 20(50), 7408-7412.
[58] Kim, H., Xu, G. L., Borczuk, A. C., Busch, S., Filmus, J., Capurro, M., Brody, J. S.,Lange, J., D’Armiento, J. M., Rothman, P. B., & Powell, CA. (2003). The heparan sul‐phate proteoglycan GPC3 is a potential lung tumor suppressor. Am J Respir Cell MolBiol, 29(6), 694-701.
[59] Abdul-Al, H. M., Makhlouf, H. R., Wang, G., & Goodman, Z. D. (2008). Glypican-3expression in benign liver tissue with active hepatitis C: implications for the diagno‐sis of hepatocellular carcinoma. Hum Pathol, 39(2), 209-212.
[60] Shirakawa, H., Suzuki, H., Shimomura, M., Kojima, M., Gotohda, N., Takahashi, S.,Nakagohri, T., Konishi, M., Kobayashi, N., Kinoshita, T., & Nakatsura, T. (2009). Gly‐pican-3 expression is correlated with poor prognosis in hepatocellular carcinoma.Cancer Sci, 100(8), 1403-1407.
[61] Hippo, Y., Watanabe, K., Watanabe, A., Midorikawa, Y., Yamamoto, S., Ihara, S., To‐kita, S., Iwanari, H., Ito, Y., Nakano, K., Nezu, J., Tsunoda, H., Yoshino, T., Ohizumi,I., Tsuchiya, M., Ohnishi, S., Makuuchi, M., Hamakubo, T., Kodama, T., & Aburatani,H. (2004). Identification of soluble NH2-terminal fragment of glypican-3 as a serolog‐ical marker for early-stage hepatocellular carcinoma. Cancer Res, 64(7), 418-423.
[62] Yan, B. C., Gong, C., Song, J., Krausz, T., Tretiakova, M., Hyjek, E., Al-Ahmadie, H.,Alves, V., Xiao, S. Y., Anders, R. A., & Hart, J. A. (2010). Arginase-1: a new immuno‐histochemical marker of hepatocytes and hepatocellular neoplasms. Am J Surg Pathol,34(8), 1147-1154.
[63] Yao, M., Yao, D. F., Bian, Y. Z., Zhang, C. G., Qiu, L. W., Wu, W., Sai, W. L., Yang, J.L., & Zhang, H. J. (2011). Oncofetal antigen glypican-3 as a promising early diagnos‐tic marker for hepatocellular carcinoma. Hepatobiliary Pancreat Dis Int, 10(3), 289-294.
[64] Ishiguro, T., Sugimoto, M., Kinoshita, Y., Miyazaki, Y., Nakano, K., Tsunoda, H., Su‐go, I., Ohizumi, I., Aburatani, H., Hamakubo, T., Kodama, T., Tsuchiya, M., & Yama‐da-Okabe, H. (2008). Anti-glypican 3 antibody as a potential antitumor agent forhuman liver cancer. Cancer Res, 68(23), 9832-9838.
[65] Nakatsura, T., Komori, H., Kubo, T., Yoshitake, Y., Senju, S., Katagiri, T., Furukawa,Y., Ogawa, M., Nakamura, Y., & Nishimura, Yl. (2004). Mouse homologue of a novelhuman oncofetal antigen, glypican-3, evokes T-cell mediated tumor rejection withoutautoimmune reactions in mice. Clin Cancer Res, 10(24), 8630-8640.
[66] Ho, D. W., Yang, Z. F., Yi, K., Lam, C. T., Ng, M. N., Yu, W. C., Lau, J., Wan, T.,Wang, X., Yan, Z., Liu, H., Zhang, Y., & Fan, S. T. (2012). Gene expression profiling ofliver cancer stem cells by RNA-sequencing. PLoS One, 7(5), e37159, 10.1371/jour‐nal.pone.0037159.
[67] Chan, E. S., & Yeh, M. M. (2010). The use of immunohistochemistry in liver tumours.Clin Liver Dis, 14(4), 687-703.
Primary and Metastatic Tumours of the Liver: Expanding Scope of Morphological and Immunohistochemical Details...http://dx.doi.org/10.5772/52838
153

[68] Yan, B. C., Gong, C., Song, J., Krausz, T., Tretiakova, M., Hyjek, E., Al-Ahmadie, H.,Alves, V., Xiao, S. Y., Anders, R. A., & Hart, J. A. (2010). Arginase-1: a new immuno‐histochemical marker of hepatocytes and hepatocellular neoplasms. Am J Surg Pathol,34(8), 1147-1154.
[69] Miller, R. T. (2012, 30.04.2011). Immunohistochemistry in the diagnosis of metastaticcarcinoma of unknown primary origin. Paper presented at Proceedings of the Ameri‐can Academy of Oral and Maxillofacial Pathology Annual Meeting, San Juan, PuertoRico. Proceedings of the American Academy of Oral and Maxillofacial Pathology AnnualMeeting, 30.04.2011, San Juan, Puerto Rico., http://www.aaomp.org/annual-meeting/docs/2011_CE5_Miller--Met%20ca%20Final%20Handout.pdf, (accessed 04 August).
[70] Chiang, D. Y., Villanueva, A., Hoshida, Y., Peix, J., Newell, P., Minguez, B., Le Blanc,A. C., Donovan, D. J., Thung, S. N., Sole, M., Tovar, V., Alsinet, C., Ramos, A. H., Bar‐retina, J., Roayaie, S., Schwartz, M., Waxman, S., Bruix, J., Mazzaferro, V., Ligon, A.H., Najfeld, V., Friedman, S. L., Sellers, W. R., Meyerson, M., & Llovet, J. M. (2008).Focal gains of VEGFA and molecular classification of hepatocellular carcinoma. Can‐cer Res, 68(16), 6779-6788.
[71] Hoshida, Y., Nijman, S. M., Kobayashi, M., Chan, J. A., Brunet, J. P., Chiang, D. Y.,Villanueva, A., Newell, P., Ikeda, K., Hashimoto, M., Watanabe, G., Gabriel, S., Fried‐man, S. L., Kumada, H., Llovet, J. M., & Golub, T. R. (2009). Integrative transcriptomeanalysis reveals common molecular subclasses of human hepatocellular carcinoma.Cancer Res, 69(18), 7385-7392.
[72] Lee, J. S., Chu, I. S., Heo, J., Calvisi, D. F., Sun, Z., Roskams, T., Durnez, A., Demetris,A. J., & Thorgeirsson, S. S. (2004). Classification and prediction of survival in hepato‐cellular carcinoma by gene expression profiling. Hepatology, 40(3), 667-676.
[73] Lee, J. S., Heo, J., Libbrecht, L., Chu, I. S., Kaposi-Novak, P., Calvisi, D. F., Mikaelyan,A., Roberts, L. R., Demetris, A. J., Sun, Z., Nevens, F., Roskams, T., & Thorgeirsson, S.S. (2006). A novel prognostic subtype of human hepatocellular carcinoma derivedfrom hepatic progenitor cells. Nat Med, 12(4), 410-416.
[74] Boyault, S., Rickman, D. S., de Reynies, A., Balabaud, C., Rebouissou, S., Jeannot, E.,Herault, A., Saric, J., Belghiti, J., Franco, D., Bioulac-Sage, P., Laurent-Puig, P., & Zuc‐man-Rossi, J. (2007). Transcriptome classification of HCC is related to gene altera‐tions and to new therapeutic targets. Hepatology, 45(1), 42-52.
[75] Breuhahn, K., Vreden, S., Haddad, R., Beckebaum, S., Stippel, D., Flemming, P.,Nussbaum, T., Caselmann, W. H., Haab, B. B., & Schirmacher, P. (2004). Molecularprofiling of human hepatocellular carcinoma defines mutually exclusive interferonregulation and insulin-like growth factor II overexpression. Cancer Res, 64(17),6058-6064.
[76] Yamashita, T., Forgues, M., Wang, W., Kim, J. W., Ye, Q., Jia, H., Budhu, A., Zanetti,K. A., Chen, Y., Qin, L. X., Tang, Z. Y., & Wang, X. W. (2008). EpCAM and alpha-
Liver Biopsy - Indications, Procedures, Results154
fetoprotein expression defines novel prognostic subtypes of hepatocellular carcino‐ma. Cancer Res, 68(5), 1451-1461.
[77] Villanueva, A., Hoshida, Y., Toffanin, S., Lachenmayer, A., Alsinet, C., Savic, R., Cor‐nella, H., & Llovet, J. M. (2010). New strategies in hepatocellular carcinoma: genomicprognostic markers. Clin Cancer Res, 16(19), 4688-4694.
[78] Llovet, J. M., Chen, Y., Wurmbach, E., Roayaie, S., Fiel, M. I., Schwartz, M., Thung, S.N., Khitrov, G., Zhang, W., Villanueva, A., Battiston, C., Mazzaferro, V., Bruix, J.,Waxman, S., & Friedman, S. L. (2006). A molecular signature to discriminate dysplas‐tic nodules from early hepatocellular carcinoma in HCV cirrhosis. Gastroenterology,131(6), 1758-1767.
[79] Di Tommaso, L., Franchi, G., Park, Y. N., Fiamengo, B., Destro, A., Morenghi, E.,Montorsi, M., Torzilli, G., Tommasini, M., Terracciano, L., Tornillo, L., Vecchione, R.,& Roncalli, M. (2007). Diagnostic value of HSP70, glypican 3, and glutamine synthe‐tase in hepatocellular nodules in cirrhosis. Hepatology, 45(3), 725-734.
[80] Roskams, T., & Kojiro, M. (2010). Pathology of early hepatocellular carcinoma: con‐ventional and molecular diagnosis. Semin Liver Dis, 30(1), 17-25.
[81] Xie, C., Song, L. B., Wu, J. H., Li, J., Yun, J. P., Lai, J. M., Xie, D. Y., Lin, B. L., Yuan, Y.F., Li, M., & Gao, Z. L. (2012). Upregulator of cell proliferation predicts poor progno‐sis in hepatocellular carcinoma and contributes to hepatocarcinogenesis by downre‐gulating FOXO3a. PLoS One, 7(7), e40607, 10.1371/journal.pone.0040607, http://www.plosone.org/article/info%3Adoi%2F10.1371%2Fjournal.pone.0040607, (accessed09 August 2012).
[82] Phillips, R. J., Helbig, K. J., van der Hoek, K. H., Seth, D., & Beard, M. R. (2012). Os‐teopontin increases hepatocellular carcinoma cell growth in a CD44 dependant man‐ner. World J Gastroenterol, 18(26), 3389-3399.
[83] Liu, W., Xu, G., Jia, J., Ma, W., Li, J., Chen, K., Wang, W., Hao, C., Wang, Y., & Wang,X. (2011). Osteopontin as a key mediator for vasculogenic mimicry in hepatocellularcarcinoma. Tohoku J Exp Med, 224(1), 29-39.
[84] Fan, R., Miao, Y., Shan, X., Qian, H., Song, C., Wu, G., Chen, Y., & Zha, W. (2012).Bif-1 is overexpressed in hepatocellular carcinoma and correlates with shortened pa‐tient survival. Oncol Lett, 3(4), 851-854.
[85] Xu, H., Gu, N., Liu, Z. B., Zheng, M., Xiong, F., Wang, S. Y., Li, N., & Lu, J. (2012).NY-ESO-1 expression in hepatocellular carcinoma: a potential new marker for earlyrecurrence after surgery. Oncol Lett, 3(1), 39-44.
[86] Ning, B. F., Ding, J., Yin, C., Zhong, W., Wu, K., Zeng, X., Yang, W., Chen, Y. X.,Zhang, J. P., Zhang, X., Wang, H. Y., & Xie, W. F. (2010). Hepatocyte nuclear factor 4alpha suppresses the development of hepatocellular carcinoma. Cancer Res, 70(19),7640-7651.
Primary and Metastatic Tumours of the Liver: Expanding Scope of Morphological and Immunohistochemical Details...http://dx.doi.org/10.5772/52838
155

[87] Lai, J. P., Sandhu, D. S., Yu, C., Moser, C. D., Hu, C., Shire, A. M., Aderca, I., Murphy,L. M., Adjei, A. A., Sanderson, S., & Roberts, L. R. (2010). Sulfatase 2 protects hepato‐cellular carcinoma cells against apoptosis induced by the PI3K inhibitor LY294002and ERK and JNK kinase inhibitors. Liver Int, 30(10), 1522-1528.
[88] Gu, F. M., Li, Q. L., Gao, Q., Jiang, J. H., Zhu, K., Huang, X. Y., Pan, J. F., Yan, J., Hu,J. H., Wang, Z., Dai, Z., Fan, J., & Zhaou, J. (2011). IL-17 induces AKT-dependentIL-6/JAK2/STAT3 activation and tumor progression in hepatocellular carcinoma. MolCancer, 10, 150, http://www.molecular-cancer.com/content/pdf/1476-4598-10-150.pdf,(accessed 09 August 2012).
[89] Li, J., Lau, G. K., Chen, L., Dong, S. S., Lan, H. Y., Huang, X. R., Li, Y., Luk, J. M.,Yuan, Y. F., & Guan, X. Y. (2011). Interleukin 17A promotes hepatocellular carcinomametastasis via NF-kB induced matrix metalloproteinases 2 and 9 expression. PLoSOne, 6(7), e21816, http://www.plosone.org/article/info%3Adoi%2F10.1371%2Fjour‐nal.pone.0021816, (accessed 04 August 2012).
[90] Chen, J., Zhang, B., Wong, N., Lo, A. W., To, K. F., Chan, A. W., Ng, M. H., Ho, C. Y.,Cheng, S. H., Lai, P. B., Yu, J., Ng, H. K., Ling, M. T., Huang, A. L., Cai, X. F., & Ko, B.C. (2011). Sirtuin 1 is upregulated in a subset of hepatocellular carcinomas where it isessential for telomere maintenance and tumor cell growth. Cancer Res, 71(12),4138-4149.
[91] Cariani, E., Pilli, M., Zerbini, A., Rota, C., Olivani, A., Pelosi, G., Schianchi, C., Solia‐ni, P., Campanini, N., Silini, E. M., Trenti, T., Ferrari, C., & Missale, G. (2012). Immu‐nological and molecular correlates of disease recurrence after liver resection forhepatocellular carcinoma. PLoS One, 7(3), e32493, 10.1371/journal.pone.0032493.
[92] Streba, C. T., Pirici, D., Vere, C. C., Mogoanta, L., Comanescu, V., & Rogoveanu, I.(2011). Fractal analysis differentiation of nuclear and vascular patterns in hepatocel‐lular carcinomas and hepatic metastasis. Rom J Morphol Embryol, 52(3), 845-854.
[93] Szutowicz, E., & Dziadziuszko, R. (2010). Quantitative immunohistochemistry inlung cancer: clinical perspective. Folia Histochem Cytobiol, 48(1), 7-11.
[94] Zhang, Y., Yang, B., Du, Z., Bai, T., Gao, Y. T., Wang, Y. J., Lou, C., Wang, F. M., &Bai, Y. (2012). Aberrant methylation of SPARC in human hepatocellular carcinomaand its clinical implication. World J Gastroenterol, 18(17), 2043-2052.
[95] Ji, J., Shi, J., Budhu, A., Yu, Z., Forgues, M., Roessler, S., Ambs, S., Chen, Y., Meltzer,P. S., Croce, C. M., Qin, L. X., Man, K., Lo, C. M., Lee, J., Ng, I. O., Fan, J., Tang, Z. Y.,Sun, H. C., & Wang, X. W. (2009). MicroRNA expression, survival, and response tointerferon in liver cancer. N Engl J Med, 361(15), 1437-1447.
[96] Ji, J., Yamashita, T., Budhu, A., Forgues, M., Jia, H. L., Li, C., Deng, C., Wauthier, E.,Reid, L. M., Ye, Q. H., Qin, L. X., Yang, W., Wang, H. Y., Tang, Z. Y., Croce, C. M., &Wang, X. W. (2009). Identification of microRNA-181 by genome-wide screening as acritical player in EpCAM-positive hepatic cancer stem cells. Hepatology, 50(2),472-480.
Liver Biopsy - Indications, Procedures, Results156

[97] Wang, J., Li, J., Shen, J., Wang, C., Yang, L., & Zhang, X. (2012). MicroRNA-182downregulates metastasis suppressor 1 and contributes to metastasis of hepatocellu‐lar carcinoma. BMC Cancer, 12(1), 227, 10.1186/1471-2407-12-227, http://www.biomedcentral.com/1471-2407/12/227/abstract, (accessed 01 August 2012).
[98] Li, J., Fu, H., Xu, C., Tie, Y., Xing, R., Zhu, J., Qin, Y., Sun, Z., & Zheng, X. (2010).miR-183 inhibits TGF-beta1-induced apoptosis by downregulation of PDCD4 expres‐sion in human hepatocellular carcinoma cells. BMC Cancer, 10, 354,10.1186/1471-2407-10-354, http://www.biomedcentral.com/1471-2407/10/354accessed,(04 August 2012).
[99] Tomimaru, Y., Eguchi, H., Nagano, H., Wada, H., Tomokuni, A., Kobayashi, S., Mar‐ubashi, S., Takeda, Y., Tanemura, M., Umeshita, K., Doki, Y., & Mori, M. (2010). Mi‐croRNA-21 induces resistance to the anti-tumour effect of interferon-alpha/5-fluoruracil in hepatocellular carcinoma cells. Br J Cancer, 103(10), 1617-1626.
[100] Hamilton, S. R., & Aaltonen, L. A. (2000). Pathology and genetics. Tumours of the di‐gestive system. Lyon: IARC Press.
[101] Darby, I. A., Vuillier-Devillers, K., Pinault, E., Sarrazy, V., Lepreux, S., Balabaud, C.,Bioulac-Sage, P., & Desmouliere, A. (2010). Proteomic analysis of differentially ex‐pressed proteins in peripheral cholangiocarcinoma. Cancer Microenviron, 4(1), 73-91.
[102] Bioulac-Sage, P., Laumonier, H., Laurent, C., Blanc, J. F., & Balabaud, C. (2008). Be‐nign and malignant vascular tumors of the liver in adults. Semin Liver Dis, 28(3),302-314.
[103] Mills, S. E., Carter, D., Greenson, J. K., Reuter, V. E., & Stoler, M. H. (2009). Stern‐berg’s diagnostic surgical pathology, 5th ed. Wolter Kluver Health / Lippincott Williamsand Wilkins.
[104] Khadim, M. T., Jamal, S., Ali, Z., Akhtar, F., Atique, M., Sarfraz, T., & Ayaz, B. (2011).Diagnostic challenges and role of immunohistochemistry in metastatic liver disease.Asian Pac J Cancer Prev, 12(2), 373-376.
[105] Dabbs, D. J. (2002). Diagnostic immunohistochemistry. New York: Churchill Living‐stone.
[106] Boggaram, V. (2009). Thyroid transcription factor-I(TTF-I/Nkx2.1/TITFI) gene regula‐tion in the lung. Clin Sci (Lond), 116(1), 27-35.
[107] Capelozzi, VL. (2009). Role of immunohistochemistry in the diagnosis of lung cancer.J Bras Pneumol, 35(4), 375-382.
[108] Kaimaktchiev, V., Terracciano, L., Tornillo, L., Spichtin, H., Stoios, D., Bundi, M.,Korcheva, V., Mirlacher, M., Loda, M., Sauter, G., & Corless, C. L. (2004). The homeo‐box intestinal differentiation factor CDX2 is selectively expressed in gastrointestinaladenocarcinomas. Mod Pathol, 17(11), 1392-1399.
Primary and Metastatic Tumours of the Liver: Expanding Scope of Morphological and Immunohistochemical Details...http://dx.doi.org/10.5772/52838
157

[109] Moskaluk, C. A., Zhang, H., Powell, S. M., Cerilli, L. A., Hampton, G. M., & Frierson,H. F. Jr. (2003). Cdx2 protein expression in normal and malignant human tissues: animmunohistochemical survey using tissue microarrays. Mod Pathol, 16(9), 913-919.
[110] Koffron, A., Rao, S., Ferrario, M., & Abecassis, M. (2004). Intrahepatic biliary cystade‐noma: role of cyst fluid analysis and surgical management in the laparoscopic era.Surgery, 136(4), 926-936.
[111] Wheeler, D. A., & Edmondson, H. A. (1985). Cystadenoma with mesenchymal stro‐ma (CMS) in the liver and bile ducts. A clinicopathologic study of 17 cases, 4 withmalignant change. Cancer, 56(6), 1434-1435.
[112] Davies, W., Chow, M., & Nagorney, D. (1995). Extrahepatic biliary cystadenomas andcystadenocarcinoma. Report of seven cases and review of the literature. Ann Surg,222(5), 619-625.
[113] Zhang, M., Yu, J., Yan, S., & Zheng, S. S. (2005). Cystadenocarcinoma of the liver: acase report. Hepatobiliary Pancreat Dis Int, 4(3), 464-467.
[114] Zhou, J. P., Dong, M., Zhang, Y., Kong, F. M., Guo, K. J., & Tian, Y. L. (2007). Giantmucinous biliary cystadenoma: a case report. Hepatobiliary Pancreat Dis Int, 6(1),101-103.
[115] Kitajima, Y., Okayama, Y., Hirai, M., Hayashi, K., Imai, H., Okamoto, T., Aoki, S.,Akita, S., Gotoh, K., Ohara, H., Nomura, T., Joh, T., Yokoyama, Y., & Itoh, M. (2003).Intracystic hemorhage of a simple liver cyst mimicking a biliary cystadenocarcinoma.J Gastroenterol, 38(2), 190-193.
[116] Jan, Y. Y., Chen, M. F., & Chen, T. J. (1994). Cholangiocarcinoma with mucobilia. JFormos Med Assoc, 93(3), S149-155.
[117] Thomas, K. T., Welch, D., Trueblood, A., Sulur, P., Wise, P., Gorden, D. L., Chari, R.S., Wright, J. K., Jr Washington, K., & Pinson, C. W. (2005). Effective treatment of bili‐ary cystadenoma. Ann Surg, 241(5), 769-775.
[118] Kubota, E., Katsumi, K., Iida, M., Kishimoto, A., Ban, Y., Nakata, K., Takahashi, N.,Kobayashi, K., Andoh, K., Takamatsu, S., & Joh, T. (2003). Biliary cystadenocarcino‐ma, followed up as benign cystadenoma for 10 years. J Gastroenterol, 38(3), 278-282.
[119] Mortele, K. J., & Ros, P. R. (2001). Cystic focal liver lesions in the adult: differentialCT and MR imaging features. Radiographics, 21(4), 895-910.
[120] Poggio, P., & Buonocore, M. (2008). Cystic tumours of the liver: a practical approach.World J Gastroenterol, 14(23), 3616-3620.
[121] Zamboni, G., Scarpa, A., Bogina, G., Iacono, C., Bassi, C., Talamini, Sessa. F., Capella,C., Solcia, E., Rickaert, F., Mariuzzi, G. M., & Klopel, G. (1999). Mucinous cystic tu‐mors of the pancreas: clinicopathologic features, prognosis, and relationship to othermucinous cystic tumors. Am J Surg Pathol, 23(4), 410-422.
Liver Biopsy - Indications, Procedures, Results158

[122] Sudo, Y., Harada, K., Tsuneyama, K., Katayanagi, K., Zen, Y., & Nakanuma, Y.(2001). Oncocytic biliary cystadenocarcinoma is a form of intraductal oncocytic papil‐lary neoplasm of the liver. Mod Pathol, 14(12), 1304-1309.
[123] D’Errico, A., Deleonardi, G., Fiorentino, M., Scoazec, J. Y., & Grigioni, W. F. (1998).Diagnostic implications of albumin messenger RNA detection and cytokeratin pat‐tern in benign hepatic lesions and biliary cystadenocarcinoma. Diagn Mol Pathol, 7(6),289-294.
[124] Ishibashi, Y., Ojima, H., Hiraoka, N., Sano, T., Kosuge, T., & Kanai, Y. (2007). Inva‐sive biliary cystic tumour without ovarian-like stroma. Pathol Int, 57(12), 794-798.
[125] Bardin, R. L., Trupiano, J. K., Howerton, R. M., & Geisinger, K. R. (2004). Oncocyticbiliary cystadenocarcinoma: a case report and review of the literature. Arch Pathol LabMed, 128(2), e25-28.
[126] Rullier, A., Le Bail, B., Fawaz, R., Blanc, J. F., Saric, J., & Bioulac-Sage, P. (2000). Cyto‐keratin 7 and 20 expression in cholangiocarcinomas varies along the biliary tree butstill differs from that in colorectal carcinoma metastasis. Am J Surg Pathol, 24(6),870-876.
[127] Ishak, K. G., Willis, G. W., Cummins, S. D., & Bullock, A. A. (1977). Biliary cystadeno‐ma and cystadenocarcinoma: report of 14 cases and review of the literature. Cancer,39(1), 322-338.
[128] Karahan, O. I., Kahriman, G., Soyuer, I., & Ok, E. (2007). Hepatic von Meyenburgcomplex simulating biliary cystadenocarcinoma. Clin Imaging, 31(1), 50-53.
Primary and Metastatic Tumours of the Liver: Expanding Scope of Morphological and Immunohistochemical Details...http://dx.doi.org/10.5772/52838
159


Chapter 8
Nonalcoholic Fatty Liver Disease: A Pathological View
Joaquín Cabezas, Marta Mayorga and Javier Crespo
Additional information is available at the end of the chapter
http://dx.doi.org/10.5772/52622
1. Introduction
Nonalcoholic fatty liver disease (NAFLD) is the most common liver disorder of our times.The spectrum of this disease goes from steatosis to non-alcoholic steatohepatitis (NASH),cirrhosis and hepatocellular carcinoma. NAFLD can appear in the context of many condi‐tions. Probably, NAFLD could be a component of metabolic syndrome, with its completephenotypic expression: insulin resistance, obesity, type 2 diabetes, hypertension, hypercho‐lesterolemia, and hypertriglyceridemia.
The pathogenesis involves insulin resistance, hepatic fat deposition, increased oxidantstress, apoptosis, inflammation and fibrosis. At present day, a new hormone has been dis‐covered. Muscle cells products this new hormone, called irisin. Irisin can induce changes inadipose tissue.
Diagnosis of NAFLD cannot be performed with a single test and it should be one of exclu‐sion, as well.
Nowadays, there is not a single therapeutic intervention. The focus of management shouldbe treatment of the risk factors for NASH (insulin resistance, obesity…). Principal methodsused for weight management are dietary modifications and life style changes. Then, phar‐macotherapy may include insulin sensitizers, cholesterol-lowering agents, anti-obesity andanti-oxidant agents. Morbid obese patients may benefit from surgical weight loss, reducingthe progression of NASH.
2. Definition
NAFLD definition [1] requires that there is evidence of hepatic steatosis, either by imagingor by histology and there are no causes for secondary hepatic fat accumulation (Table 1).
© 2012 Cabezas et al.; licensee InTech. This is an open access article distributed under the terms of theCreative Commons Attribution License (http://creativecommons.org/licenses/by/3.0), which permitsunrestricted use, distribution, and reproduction in any medium, provided the original work is properly cited.

NAFLD is usually associated with metabolic risk factors such as metabolic syndrome, obesi‐ty, diabetes mellitus, and dyslipidaemia.
COMMON CAUSES OF SECONDARY HEPATIC STEATOSIS
Macrovesicularsteatosis
Excessive alcohol consumption.
Hepatitis C (genotype 3)
Wilson’s disease.
Lipodistrophy
Starvation
Parenteral nutrition.
Abetalipoproteinemia.
Medication (amiodarone, methotrexate, tamoxifen, corticosteroids)
Microvesicularstatosis
Reye’s syndrome.
Medications (valproate, anti-retroviral medicines)
Acutte fatty liver of pregnancy
HELLP syndrome
Inborn errors of metabolism (LCAT deficiency, cholesterol ester storage disease, Wolman disease)
Table 1. Causes of secondary fat accumulation.
NAFLD includes a constellation of histological findings that goes from steatosis, to necroin‐flammation, called NASH and progression to advanced fibrosis and cirrhosis.
3. Epidemiology
NAFLD is becoming the leading cause of liver disease. One of the causes is the increasing ofobesity[2].
The incidence of NAFLD has been evaluated in a few number of studies, it ranges from31-86 cases/1000 person-year in Japan to 29 cases per 100000 person-year in England [3, 4].
The prevalence of NAFLD is increasing. Recent studies presented in the Digestive DiseasesWeek 2012 summarizes this increased prevalence over the last 20 years [5, 6]. Investigatorsreport an increasing in obesity. This increase is followed by a rising in steatosis and NASH,the presence of steatosis among obese people has increased from 23% in the 80s, 43% in the
Liver Biopsy – Indications, Procedures, Results162

90s and finally to 60% nowadays [4]. Even in non-obese patients, the prevalence of steatosisincreased from 12%, to 27% and 36%, respectively [5].
In children/adolescents, over the last 20 years, obesity has increased from 11% to 21%, sus‐pected NAFLD from 4% to 10, and the prevalence of altered aminotransferases among obeseadolescents has increased from 17% to 37% [6].
4. NAFLD and liver biopsy
Liver biopsy remains the gold standard for characterizing liver histology in patients withNAFLD. However, it is expensive and carries some morbidity and very rare mortality risk.Thus, it should be performed in those who would benefit the most from diagnostic, thera‐peutic guidance, and prognostic perspectives.
The last guideline for NAFLD management recommends liver biopsy [1]: in patients whoare at risk to have steatohepatitis and advance fibrosis; theses patients could be identified bythe presence of metabolic syndrome and NAFLD fibrosis score; and a liver biopsy should beconsidered in patients in whom other etiologies are suspected and cannot be excluded with‐out a liver biopsy.
Liver biopsy allows confirming the diagnosis, evaluation and semiquantitation of necroin‐flammatory lesions and fibrosis.
On the other hand, liver biopsy suffers from challenges. An adequate biopsy represents only1/50000-1/65000 of the organ. Sampled area should be carefully chosen and sample lengthmust be enough, a least 15mm. This size can reduce sample error. Finally, experienced path‐ologist is important to haver a greater yield of findings.
5. Histology of NAFLD
NAFLD represents a histopathologic spectrum ranging from steatosis alone, to necroinflam‐mation, summarized as NASH; and progression to advanced fibrosis and cirrhosis.
The histologic characterization of NAFLD and NASH may include description of steatosisand cell injury in addition to inflammation and fibrosis. Kleiner and Brunt [7] propose cate‐gorizing the histologic changes when studying NAFLD as follows in table 2.
The main histological characteristic of NAFLD is the accumulation of fat in the form of tri‐glyicerides within hepatocytes, lesion termed steatosis (Figure 1 and 2); this term is definedby the guideline [1] as NAFL – non-alcoholic fatty liver, where the risk of progression to cir‐rhosis and liver failure is minimal. The presence of >5% steatoic hepatocytes in a liver biopsyis accepted as the minimum criterion for thehistological diagnosis of NAFLD [8].
Nonalcoholic Fatty Liver Disease: A Pathological Viewhttp://dx.doi.org/10.5772/52622
163

CATEGORY DEFINITION
No significant evidence of fatty liver disease. Insufficientsteatosis for diagnosis of steatosis, without
other changes (ballooning, fibrosis) that would suggest
steatohepatitis.
Steatosis:
Steatosis with inflammation.
Steatosis with nonspecific fibrosis
Steatosis without specific changes to suggest a form of
steatohepatitis. This category may include spotty lobular
inflammation and/or mild degrees of fibrosis of uncertain
significance.
Steatohepatitis:
- zone 3 borderline steatohepatitis
Form of steatoshepatitis most common in adults; defined
as a zone 3 centered injury pattern that includes steatosis,
inflammation, ballooning injury, (often with Mallory-Denk
bodies) with or without fibrosis. Borderline
steatohepatitsis has some, but not all ofthe features that
would allow a diagnosis of steatohepatitis.
Zone 1, borderline pattern Form of steatohepatitis that occurs mainly in young
children, characterized by zone 1-centered (portal
inflammation, portal-based fibrosis, zone 1 steatosis,
ballooning injury in zone 1 if present).
Cryptogenetic fibrosis/ cirrhosis Presence of fibrosis (usually advanced) or cirrhosis, with
little ton o steatosis and no changes (ballooning, Mallory-
Denk bodies) that would suggest borderline or definite
steatohepatitis. Other explanations for fibrosis (besides
steatohepatitis) should be considered.
Table 2. Histologic Categorization of NAFLD [7].
Figure 1. Steatosis. Hematoxylin-eosin stain.
Liver Biopsy – Indications, Procedures, Results164

Figure 2. Steatosis. Hematoxylin-eosin stain.
Steatosis in NAFLD is usually macrovesicular, which refers to hepatocytes with single largeintracytoplasmatic fat droplet or smaller well defined droplets displacing the nucleus to thecell periphery. This macrovesicularsteatosis is usually present in a zone 3 or panacinar dis‐tribution; it differs from zone 1 steatosis that is a common distribution in chronic hepatitis C.Azonal steatosis is most often seen in biopsies with advanced fibrosis [9].
The extent of steatosis can be evaluated and classified semi-quantitative. The most reprodu‐cible method follows the acinararchiqueture dividing the liver parenchyma in thirds and as‐sessing percentage involvement bay steatoic hepatocytes [8] – table 3.
STEATOSIS SEMI-QUANTIFICATION
Mild 0 – 33%
Moderate 33 – 66%
Severe > 66%.
Table 3. Steatosis semi-quantification according to acinar architecture [8].
NASH, under this concept is the histology pattern of NAFLD, which is at risk of developingadvance fibrosis. The minimal criteria for the histopathological diagnosis of adult NASH in‐clude steatosis, hepatocyte injury, usually in form of ballooning, and lobular inflammation,typically localized in acinar zone 3 [10, 11].
The key feature for the diagnosis of NASH is the ballooning injury (Figures 3 and 4), and itis considered a marker of apoptosis [12]. This type of cell injury is characterized by a cellthat becomes enlarged and the cytoplasm becomes irregularly clumped with optically clear,nonvesiculated areas. Ballooned cells are seen most frequently in zone 3 near the hepaticveins, and lose this localization, becoming portal inflammation more prominent when thedisease progresses and in severe cases. Immunostaining of hepatocyte keratins 8 and 18
Nonalcoholic Fatty Liver Disease: A Pathological Viewhttp://dx.doi.org/10.5772/52622
165

might help to identify ballooned hepatocytes [13]. Ballooned degeneration is difficult to di‐agnose even by trained pathologist, for that reason it can show significant inter-observervariation [14].
Figure 3. Hepatocyte ballooned. Hematoxylin-eosin stain.
Ballooning degeneration is associated with an increased liver-related mortality [15].
Figure 4. Ballooning hepatocyte. Hematoxylin-eosin stain.
Mallory-Denk Bodies (MDB), also known as Mallory bodies, are eosinophilic, ropey cyto‐plasmatic inclusion bodies in the hepatocyte of patients with chronic liver disease. This typeof lesion contains abnormal cytokeratin 8 and 18 filaments that have been ubiquinated.
Mallory bodies have an importance in disease progression and it is suggested a possibleprognostic role in steatohepatitis [16]. In a recent study, the presence of MBD was signifi‐cantly associated with liver-related mortality [15].
Both ballooning degeneration and MDB can trigger the development of apoptosis. Apoptot‐ic (acidophil) bodies are common in NASH. They can be identified as rounded, eosinophiliccytoplasmic fragments, which appear to be free within the sinusoids or surrounded by
Liver Biopsy – Indications, Procedures, Results166

Kupffer or other inflammatory cells. Apoptosis has been validated as an accurate marker fordiagnosis of NASH based on immunochemistry in liver tissue [17].
Inflammatory infiltrates (Figure 5) can be seen in the hepatic acini/lobules or the portal tract.Lobular inflammation is usually mild, consists of a mixed inflammatory cell infiltrate, com‐posed of lymphocytes, some eosinophils, and a few neutrophils. Polymorphs can be ob‐served around ballooned hepatocytes that are called “satellitosis” (Figure 6). Kuppfer cellsaggregates as lobular microgranulomas and lipogranulomas may appear [10]
Figure 5. Mononuclear inflammatory infiltration. Hematoxylin-eosin stain.
Figure 6. Polymorph around ballooned hepatocytes, “satelitosis”.
Hematoxylin-eosin stain.Portal chronic mononuclear cell inflammation in adult NASH iscommon and mild. When portal inflammation is greater than lobular other aetiologiesshould be ruled out, such as chronic hepatitis C [18]. On the other side, a greater portal in‐flammation than lobular inflammation can be seen in successfully treated patients [19]. In alarge database of liver biopsies from the NASH Clinical Research Network, including adults
Nonalcoholic Fatty Liver Disease: A Pathological Viewhttp://dx.doi.org/10.5772/52622
167

and children, portal chronic inflammation was associated with clinical and histologic fea‐tures of severity and advance disease [20].
Vascular alterations in NAFLD. Recent paper has focused the study of NASH in microves‐sels of the liver [21]. This work has found an intraacinar branch of the hepatic artery in theperivenular region in active steatohepatitis. This finding is important because it can lead toconfusion for a portal tract resulting in an equivocal diagnosis. Likewise, the presence of thisvessel correlates with higher stage of fibrosis.
Fibrosis in adult NASH usually starts in acinar zone 3 and has characteristic “chicken wire”pattern due to deposition of collagen an other extracellular matrix fibres along the sinusoidsof zone 3 and around the hepatocytes (Figure 7 and 8). Portal fibrosis has been reported incases of morbid obesity-related NASH and in pediatric NASH. Fibrosis predicts clinical out‐comes in NASH [22]. there was noter from this study that the progression of the fibrosis isaccompanied of steatosis reduction. Approximately 37% to 41% of patients with NAFLDhave fibrosis progression over 3 to 10 years [22, 23]. The higher rates of fibrosis progressionwere related to: body mass index, diabetes and low initial fibrosis [22]. When periportal fib‐rosis was not present, there was a 100% of negative predictive value in predicting liver-relat‐ed outcomes [23]. Steatosis, inflammation, ballooning and Mallory hyaline were notassociated with liver-related mortality after adjusting for the presence of fibrosis [15]. Theinclusion of fibrosis explains why the recent classifications for NASH used by Younossi [15]and Matteoni [16], independently correlated with liver-related mortality. This observationshows the importance of fibrosis in NAFLD, patients with NASH and fibrosis portends ahigher risk of death [24].
Figure 7. Fibrosis pattern: around hepatocytes. Masson trichrome stain.
Liver Biopsy – Indications, Procedures, Results168

Figure 8. Zone 3 fibrosis perivenular/pericellular. Masson trichrome stain.
Other histological lesions that may be seen in NASH include megamitochondria, glycogen‐ated nuclei and iron deposition.
Megamitochondria (giant mitochondria) are round or needle-shaped, eosinophilic, intracy‐toplasmatic inclusions more commonly observed in hepatocytes with microvesicularsteato‐sis. This abnormal mitochondria is a result of injury from lipid peroxidation or represent anadaptive change [25]. Glycogenated nuclei are vacuolated nuclei usually observed in peri‐portal hepatocytes. Their presence is more frequent in non-alcoholic etiology and it is rare inalcoholic injury [26].
Finally, hepatic siderosis might be seen in NAFLD. One study of 293 liver biopsies (34,5% ofpatients with NAFLD) investigates the relationship between iron deposition and NAFLD[27]. Stainable hepatic iron described three histological patterns: hepatocellular pattern, re‐ticuloendothelial system cell – RES - (mainly Kupffer cell) pattern and mixed. RES patternwas associated with advanced fibrosis and higher histological features of portal inflamma‐tion, ballooning and definite NASH [27].
6. Histologic scoring systems
NAFLD histologic criteria requires an accumulation of more than 5% of fat deposition,mainly in form of triglycerides. NAFLD was first described by Ludwig and colleagues [28],and since then several systems for grading and staging NAFLD have been proposed.
In 1999, Matteoni and colleagues characterized histologic subtypes that correlate with clini‐cal outcomes [16] – table 4. In 2005, NASH Clinical Research Network developed NAFLDactivity score (NAS) [8]. This score comprises four features evaluated semi-quantitatively:steatosis, lobular inflammation, hepatocellular ballooning and fibrosis. Fibrosis was classi‐fied separately – table 5. When NAS is >5 sensitivity and specificity for definite NASH were0,75 and 0,83, respectively. Finally, a recent classification for NAFLD has been proposed by
Nonalcoholic Fatty Liver Disease: A Pathological Viewhttp://dx.doi.org/10.5772/52622
169
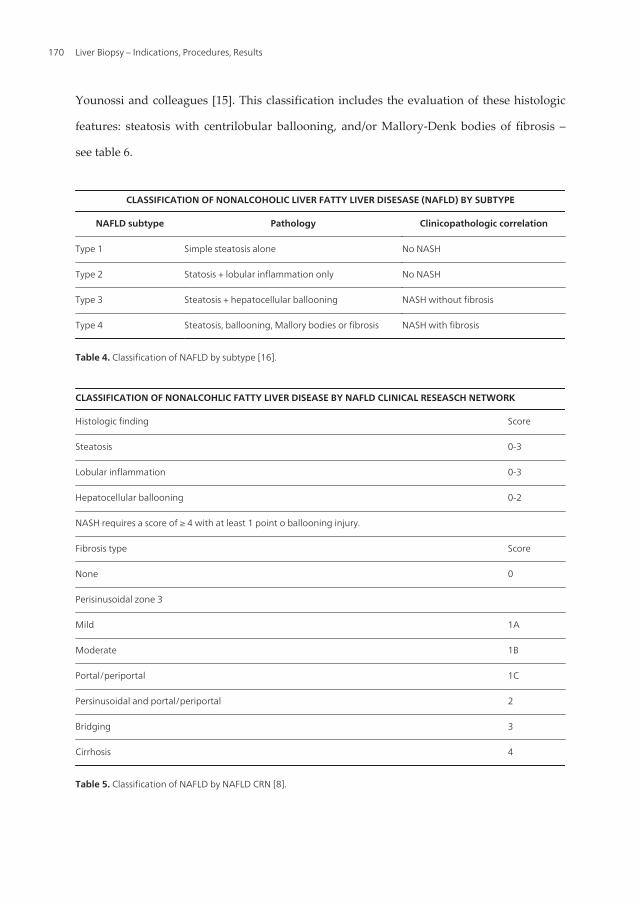
Younossi and colleagues [15]. This classification includes the evaluation of these histologic
features: steatosis with centrilobular ballooning, and/or Mallory-Denk bodies of fibrosis –
see table 6.
CLASSIFICATION OF NONALCOHOLIC LIVER FATTY LIVER DISESASE (NAFLD) BY SUBTYPE
NAFLD subtype Pathology Clinicopathologic correlation
Type 1 Simple steatosis alone No NASH
Type 2 Statosis + lobular inflammation only No NASH
Type 3 Steatosis + hepatocellular ballooning NASH without fibrosis
Type 4 Steatosis, ballooning, Mallory bodies or fibrosis NASH with fibrosis
Table 4. Classification of NAFLD by subtype [16].
CLASSIFICATION OF NONALCOHLIC FATTY LIVER DISEASE BY NAFLD CLINICAL RESEASCH NETWORK
Histologic finding Score
Steatosis 0-3
Lobular inflammation 0-3
Hepatocellular ballooning 0-2
NASH requires a score of ≥ 4 with at least 1 point o ballooning injury.
Fibrosis type Score
None 0
Perisinusoidal zone 3
Mild 1A
Moderate 1B
Portal/periportal 1C
Persinusoidal and portal/periportal 2
Bridging 3
Cirrhosis 4
Table 5. Classification of NAFLD by NAFLD CRN [8].
Liver Biopsy – Indications, Procedures, Results170

CLASSIFICATION OF NAFLD BY SUBTYPE
Pathology Clinicopathologic
correlation
Simple steatosis alone No NASH
Steatosis + lobular inflammation only No NASH
Steatosis with centrilobular ballooning and/or Mallory-Denk bodies NASH
Any steatosis with centrilobularpericellular/perisinusoidal or briding fibrosis NASH
Table 6. Classification of NAFLD proposed by Younossi and colleagues [15].
The most important difference between NAS and subtype classifications is that the lattersinclude fibrosis and this provides a better prediction of liver-related mortality in patientswith NAFLD [15].
7. NAFLD in special populations
Patients with insulin resistance. Insulin resistance can be estimated using the homeostasismodel for assessing of insulin resistance (HOMA-IR), calculated as the product of fasting in‐sulin level (mUI/ml) and plasma glucose level (mmol/ml), divides by 22,5 [29]. Portal fibro‐sis has been linked to the ductular reaction (ductularproliferation at the portal tract interfacearising from progenitor cells in the periportal area and accompanied by neutrophils andstromal changes). These findings correlate the insulin resistance with advanced stages of fib‐rosis and provide a pathway for fibrosis progression [30].
In some cases in a study with a few number of patients treated with an insulin sensitizer,histologic evaluation of post-treatment liver biopsy showed that increased portal inflamma‐tion is a feature related to resolution of NASH, and it is associated to a change in the qualityof zone 3 perisinusoidal fibrosis from dense to delicate [19].
NAFLD in bariatric surgery patients. Patients undergoing bariatric surgery for weightloss are at a risk of NAFLD. They often have comorbidities such as: severe obesity, diabe‐tes, hypertension, sleep apnea or coronary artery disease. And high percentage will havemetabolic syndrome [31] (see table 7). The prevalence of steatosis and steatohepatitis inthese patients undergoing liver biopsy when surgery is performed, is 91% and 37%, re‐spectively [32]. At least a third of morbidity obese patients have portal inflammation, andthis is related to the presence of fibrosis [20, 33]. In early stage, localization of fibrosis dif‐fers from those nonbariatric populations, in bariatric is portal and in nonbariatric is perisi‐nusoidal [19].
Nonalcoholic Fatty Liver Disease: A Pathological Viewhttp://dx.doi.org/10.5772/52622
171

The Adult Treatment Panel III clinical definition of the metabolic syndrome:
- Requires the presence of three or more of the following features:
Waist circumference greater than 102 cm in men or greater than 88 cm in women.
Triglyceride level 150mg/dl or greater.
High-density lipoprotein (HDL) cholesterol level less than 40 mg/dl in men and less than 50 mg/dl in women.
Systolic blood pressure 130 mmHg or greater or diastolic pressure 85 mmHg or greater.
Fasting plasma glucose level 110 mg/dl or greater.
Table 7. Definition of the metabolic syndrome [31].
NAFLD after bariatric surgery. Improvements of major histological features of disease ac‐tivity, grade of steatohepatitis and rarely fibrosis following therapy (dietary, medicines orsurgery) have been reported [34]. After surgical intervention liver histology improve inthese features: lobular steatosis, necroinflammatory changes and fibrosis, against no im‐prove in portal abnormalities [35]. Recent meta-analysis [36] shows that patients after bariat‐ric surgery have improvement or resolution in steatosis (91,6%), in steatohepatitis (81,3%), infibrosis (65,5%) and for complete resolution of NASH was 69,5%.
In the near future, we will have to get used to new types of treatment, for example, “meta‐bolic surgery”, which might be performed to non-morbid obese patients with diabetes, andto the new changes in hepatic parenchyma following endoscopic procedures performed totreat obesity.
NAFLD in children. Pediatric NAFLD can have a different histologic presentation thanadult NAFLD. In the first large biopsy series of pediatric NAFLD [37], two different histo‐logic patterns were described with differences in race and gender. Type 1 NASH: similar toadults, more common in Caucasian children. Histologic characteristics are: steatosis, bal‐looning degeneration and perisinusoidal fibrosis. On the other hand, Type 2 NASH wasmore common in Asian, Native American and Hispanics. Typical features in the liver biopsyare: steatosis with lymphocytic portal inflammation and portal fibrosis. Children with type 2were younger and had a greater severity of obesity, and advanced fibrosis. This kind of pat‐tern was described in adult morbid obese patients undergoing bariatric surgery, these pa‐tients mean age were slightly lower [33]. Overlap cases with characteristic of bothhistological types may also be observed in pediatric NASH. A multicentre retrospective co‐hort study reviewed 130 liver biopsies of children according to these criteria of pediatricNAFLD [38]. The majority of the biopsies presented an overlapping pattern (82%). Ad‐vanced fibrosis was associated with the presence of lobular and portal inflammation.
Portal fibrosis is common in pediatric NAFLD and may evolve to periportal fibrosis andbridging fibrosis in some patients, whereas progression to cirrhosis is observed in rarecases [39].
It is not clear, that Type 2 NASH, described as pediatric NASH, is an entity by itself or it isanother stage of the spectrum of NASH which could be a predictor of those who have a se‐vere disease [40].
Liver Biopsy – Indications, Procedures, Results172

8. Imaging tecnology in NAFLD
Ultrasonography (US), computed tomography (CT), and magnetic resonance (MR) can identi‐fy liver steatosis but not steatohepatitis, nevertheless they provide anatomical and morpholog‐ical information. The sensitivity of these imaging methods is optimal for steatosis over 33%.When advance liver disease, radiology techniques can provide indirect signs of cirrhosis, suchas portal hypertension, or may be useful for the screening and diagnosis of hepatocellular carci‐noma (HCC)[41]. Imaging technique may help to differentiate diffuse from focal form of steato‐sis. Hepatic fatty infiltration can present as focal steatosis (a focal area of steatosis in anotherwise normal liver) or as focal fatty sparing (fatty change with sparing of certain areas) [42].
Abdominal US is the most commonly used imaging technique to clinically evaluate the pres‐ence of liver steatosis. Advantages include low cost, lack of radiation exposure and wide availa‐bility. The brightness of the liver echo is compared with the kidney, the attenuation of thesound beam by the fat results in relatively hypoechoic kidney. For detailed description of sono‐graphic features for staging fatty liver see table 8. This US feature is not characteristic of NAFLDbecause it can be present in other diffuse parenchymal liver disease. The US can be accurate de‐tecting hepatic steatosis when there is a moderate to severe infiltration [43]. Overall sensitivityand specificity are 60-94% and 66-95%, respectively, however the sensitivity is lower when BMI(body mass index) is over 35 Kg/m2. Although this acceptable level of sensitivity it does not pro‐vide reproducible quantitative information. US scoring system for fatty liver is based on hyper‐echogenic liver tissue, the increased discrepancy of echo amplitude between liver and kidneyand the loss of echoes from the walls of the portal system [44]. US cannot differentiate betweensteatosis and fibrosis, but with advance degrees of fibrosis an increase in coarse echoes withoutposterior beam attenuation can be seen.
Features NORMAL MILD MODERATE SEVERE
Liver echotexture Liver parenchyma is homogeneous and
no difference in contrast between liver
and kidney
Slight increase in echo
pattern
Intermediate Gross discrepancy of the
increased hepatic to renal cortical
echogenicity
Echo penetration an
visibility of
diaphragm
Liver structure is clearly defined from the
surface to diaphragm. The outline of the
diaphragm is clearly visualized.
Mild attenuation of
sound beam through
the liver
Intermediate Marked attenuation of sound
beam through the liver, the
diaphragm is not visualized.
Clarity of liver blood
vessel structure
Vessel wall and lumen of vessel can
clearly visualized
Slight decrease
definition of portal
venule walls
Intermediate Only the main portal walls can be
visualized with absence of all
smaller portal venule walls
Table 8. Ultrasonographic grading system for diagnosis of fatty liver, adapted from [41].
Computer Tomography provides an accurate and a reliable visualization of whole liver, sothat not only diffuse but also focal fatty infiltration of the liver parenchyma can be accuratelydiagnosed. CT enables the evaluation of absolute measurement of attenuation values whichare given in Hounsfield units, the difference of attenuation between liver and spleen as well as
Nonalcoholic Fatty Liver Disease: A Pathological Viewhttp://dx.doi.org/10.5772/52622
173

the calculation of the liver-to-spleen attenuation ratio, those correlate with steatosis degree.Liver density as measured by CT attenuation units has been shown to have an inverse correla‐tion to the degree of fatty infiltration. Non-enhanced CT provides a high performance in quali‐tative diagnosis of hepatic steatosis when fatty infiltration is over 30%, obtaining 82% ofsensitivity and 100% specificity using histologic analysis of biopsies of liver donors as the refer‐ence standard [45], however is not sensitive in detecting mild-to-moderate amounts of steato‐sis between 5% and 30% [43]. New CT scanning techniques are developing, such as dual-source/dual energy scanners, but their evaluation needs further studies. A drawback of thistechnique is the liver iron overload because it increases the attenuation. This method is associ‐ated with radiation exposure which limits its use in children.
Magnetic Resonance can detect steatosis by exploiting the difference of resonance frequen‐cies between water and fat proton signals. The sensitivity and specificity of MRI in detectingas low as 5% of liver fat infiltration are 85% and 100%, respectively [46]. The detection of thefatty liver can be seen in “white/bright” when applying in-phase T1 images and “black”when applying out-of-phase images, compared to the signal intensity of the spleen and par‐aespinal muscles. Another technic of MR imaging with fat saturation may quantify more ac‐curately liver fat infiltration, especially in patients who have fibrosis.
MR spectroscopy can reliably quantify even minimal steatosis, as low as 0,5% [47]. In hasbeen based on the ubiquitous protons hydrogen and phosphorus [48], and more than 5% offat content on MR spectroscopy indicates presence of steatosis [49]. Its routine application islimited by cost and lack of availability, and it remains a research tool.
Methods (S/s) Advantages Disadvantage
Ultrasonography.
(60-95% / 84-100%)
Noninvasive, widely aviable, low cost, repetition,
Useful for screening
Operator dependent.
Qualitative assessment of steatosis.
Only accurate when moderate-to-severe fat
infiltration.
Computer tomography,
Contrast images.
(50-86% / 75-87%)
Noninvasive, semiquantitative assessment of fat
content.
Detects focal or diffuse infiltration.
Radiation exposure.
Iron overload, copper and fibrous tissue could be
confounding factors.
Not sensitive for mild-to-moderate amounts of
steatosis.
Magnetic resonance imaging
(85% / 100%)
Noninvasive, semiquantitative, and no radiation
exposure.
Detects focal or diffuse infiltration.
Limitation in patients with iron overload.
Not suitable for patients with claustrophobia or
implantable devices.
MR spectroscopy Noninvasive, reproducible, accurate quantification. High cost not widely available. Long time taking
images.
Table 9. Pro’s and con’s of radiologic modalities for the study of NAFLD. S: sensitivity; s: specificity. Adapted from [41].
US, CT and MR are insensitive in differentiating hepatic steatosis from NASH, and they can‐not be used to stage fibrosis [43, 48]. But in the near future, a novel method based on MRI
Liver Biopsy – Indications, Procedures, Results174

imaging and a new software will be able to stage fibrosis and to distinguish NASH from no-NASH. Professor Romero-Gomez conducts this study and it will be soon published.
Table 9 summarizes advantages and disadvantages of these radiologic methods.
9. Non-invasive assesment in NAFLD
Liver biopsy remains a useful tool to confirm the diagnosis and exclude other disease orhelps to discover concomitant chronic liver disease. It provides prognostic information bystaging and grading this disease. At present non-invasive diagnostic markers could providea new tool for differentiating fatty liver from NASH as well as for grading /staging NAFLD.
The investigation of these new diagnostic methods comes from the well known drawbacksof liver biopsy. These include sampling error, inadequate biopsy size, variability in patholo‐gist interpretation, cost and associated morbidity (complications 0,3%, mortality rate 0,01%).
An ideal non-invasive test should be simple, reproducible, readily available, less expensivethan liver biopsy, able to predict the full spectrum of liver fibrosis stages, and reflectchanges occurring with therapy [48].
Some reviews provide an overview of the role of non-invasive test in NAFLD [48, 50, 51].We will try to present many of these scores through a table (number 10) to summarize theircharacteristics. AUROC is a numerical data that assess the performance of a scoring system.AUROC value greater than 0,8 indicate good diagnostic performance. The closer the valueto 1, the better performing the scoring system.
SCORE [Reference] Variables Cutoff AUROC Sens. (%) Spec. (%) PPV (%) NPV (%)
NONINVASIVE DIAGNOSIS OF STEATOSIS
SteatoTest [52] 6 components of FibroTest-
ActiTest, BMI, cholesterol,
triglycerides, glucose
0,3
0,7
0,79-0,86 85 88 46
63
93
79
Fatty liver Index (FLI)
[53]
BMI, waist circumference,
triglycerides, GGT
<30
>70
0,85 87 86
NONINVASIVE ASSESSMENT IN NASH
Palekar [54] HA >55 mcg/l, age >50 years,
female gender, AST >45 UI/ml,
AAR >80.
≥3 0,763 73,7 65,7 68,2 71,4
CK-18 [17] CK-18 plasma (apoptosis
marker)
250 U/l 0,83 75 81
Nonalcoholic Fatty Liver Disease: A Pathological Viewhttp://dx.doi.org/10.5772/52622
175

SCORE [Reference] Variables Cutoff AUROC Sens. (%) Spec. (%) PPV (%) NPV (%)
oxNASH [55] Detection of lipid peroxidation
products by chromatography-
mass spectrometric
0,74-0,83 63-81 84-97
SHIMADA [56] Serum adiponectin, type 4
collagen 7s level, HOMA-IR
94 74 94 74
NASH Diagnostics
[57]*
CK-18, cleaved CK-18,
adiponectin, resistin
0,3825 0,73 71,4 72,7 83,3 57,1
NashTest [58] Age, gender, BMI, triglycerides,
cholesterol,
alfa-2macroglobulin, GGT,
haptoglobin, apolipoprotein-
A1, total bilirubin
0,79 29 98 91 71
NONINVASIVE MANAGEMENT OF FIBROSIS IN NAFLD
NAFLD fibrosis score
[59]
Age, BMI, IFG/diabetes, AAR,
platelet, albumin
≤1,455
≥0,676
0,88 56
90
93
85
Pediatric NAFLD
fibrosis index [60]
Age, waist circumference and
triglycerides.
≥9: rule in liver
fibrosis.
0,85 98,5 44,5
<3:rule out
fibrosis
75,4** 75**
**Pre-test probability:
69%
BARD score [61] BMI ≥28 =1, AAR ≥0,8 =2,
diabetes=1,
≥2: advanced
fibrosis
0,81 96
FIB-4 [62] Age, AST, platelet, ALT <1,3
>2,67
0,80 43
80
90
83
APRI [63] AST, platelet 0,98 Advanced fibrosis:
0,85
75 86 54 93
ELF [64] HA, TIMP1, P3NP. 0,3576 For severe fibrosis
0,90.
80 90 71 94
-0,1068 For moderate
fibrosis 0,82
70 80 70 80
ELF: -0,2070. No fibrosis 0,76 61 80 81 79
BAAT [65] Age ≥50years, BMI ≥28kg/m2
=1, triglycerides ≥7mmol/L=1,
ALT ≥2N
0-1, for septal
fibrosis
0,84 100 47 100
Fibrotest [66] 0,30 F0-1 VS F2-4:
075-085.
70 90
Liver Biopsy – Indications, Procedures, Results176

SCORE [Reference] Variables Cutoff AUROC Sens. (%) Spec. (%) PPV (%) NPV (%)
F0-2 VS F3-4:
0,81-0,92
0,70 98 73
Fibrometer [67] Glucose, AST, platelets, ferritin,
ALT, weight, age.
<0,611 F0-1 vs F2-4:
0,936-0,952
ULTRASOUND BASED TECHNIQUES IN FIBROSIS DETECTION IN NAFLD
Fibroscan [68] Transient elastography 9,9 kPa
16 kPa
F ≥3: 0,99
F4: 0,998
100
100
93
93
77
86
100
100
ARFI [69] 4,24 kPa F0-2 vsF3-4: 0,90 90 90
ARFI [68] 1,77 m/sec
1,90 m/sec
F ≥3: 0,973
F4: 0,976
100
100
91
96
71
75
100
100
MAGNETIC RESONANCE IMAGING BASED TECHNIQUES
MR elastography[70] Discriminating NASH from
simple steatosis (SS)
2,74 kPa SS vs NASH: 0,93 94 73 85 89
Means:
- 2,51kPa.
- 3,24kPa.
- 4,16kPa.
Simple steatosis.
NASH no fibrosis.
With fibrosis
Abbreviations: AUROC: area under receiver operator curve. Sens.: Sensitivity; Spec.: Specificity; PPV: positive predictivevalue; NPV: negative predictive value; BMI: body mass index; GGT: Gamma-glutamyl-transpeptidase; HA: hyaluronicacid; AST: aspartate transaminase; AAR: AST/alanine aminotransferase, TIMP-1: tissue inhibitor of matrix metallopro‐teinase 1; P3NP: aminoterminal peptide of pro-collagen III; ARFI: acoustic radiation force impulse; * Sample: bariatricsurgery patients. COMMENTS: BARD score can reliably exclude advance fibrosis, particularly among non-diabetics.FIB-4, as happened with BARD score, is useful in excluding advance fibrosis due its high NPV. Transient elastographyand ARFI are based on the variation of the speed wave through liver tissue (generated by vibrator/short-durationacoustic pulses, respectively), this can be measured and converted to a numerical value (in kPa and m/sec, respectively,but ARFI could also be expressed as kPa) which is the liver stiffness and it is proportional to liver fibrosis. An importantdifference between both systems is that ARFI consists in a probe which can be plugged to a common US machine soboth techniques can be performed at the same time.
Table 10. Non-invasive assessment of NAFLD.
APRI and FIB-4 have been evaluated in obese children and they might be useful in this specialpopulation [71]. Pediatric NAFLD scores is a noninvasive model evaluated in obese children,and it may help clinicians to predict liver fibrosis but external validation is needed [60].
In the future, new serologic markers, such as CD36, will help to differentiate more accurate‐ly between NAFLD stages, we would be able to distinguish simple steatosis from NASH.
Although clinical and laboratory models may be useful in identifying a group of patients ata low risk of advance fibrosis and liver biopsy might be avoided, they are not enough forstaging and prognostic purposes if patients are at risk of advance fibrosis [48]. NAFLD Prac‐tice Guideline of 2012 recommends NAFLD fibrosis score to identify patients with higherlikelihood of having bridging fibrosis and/or cirrhosis [1].
Nonalcoholic Fatty Liver Disease: A Pathological Viewhttp://dx.doi.org/10.5772/52622
177

10. New diagnostic platforms in nafld
NAFLD is a disease with wide spectrum: from steatosis through inflammation to fibrosisand finally cirrhosis and hepatocellular carcinoma, even in absence of cirrhosis [72]. Thestrongest predictor of fibrosis progression in NAFLD is steatohepatitis. The most importantfeatures are hepatocellular degeneration (ballooning) and inflammatory cell infiltration.
These new techniquesinclude genomics, metabolomics and proteomics.
Genomics. Gene expression studies provide an insight into possible mechanism of patho‐genesis as well as potential biomarkers of disease. One method for studying gene expressionis micro-arrays of DNA. A study using this test found 34 gens with different expression inNASH vs controls, these genes where implicated in lipid metabolism and extracellular ma‐trix remodelling [73]. Another study compared gene expression in NASH-related cirrhosiswith other causes of cirrhosis. In NASH cirrhosis group genes involved in anti-oxidantstress were underexpressed, along with genes involved in fatty and glucose metabolism[74]. In our centre we used micro-arrays to study gene expression in obese patients withNAFLD [75]. Obese patients with NASH without fibrosis show an overexpression of proin‐flammatory and proapoptotic genes; and those with fibrosis show an overexpression of fi‐brogenic genes, including the leptin receptor Ob-Rb.
Most recent genomic tests, such GWAS (Genome-wide association studies) provide a methodfor evaluating a large number of single nucleotide polymorphisms (SNP) with the same experi‐ment. A study performed with a GWAS study found a SNP in farnesyldiphosfatasefarnesyl‐transferase 1 (FDFT1) which was associated with different histological parameters (a SNP withportal inflammation and another different SNP with fibrosis stage) and the total NAFLD activ‐ity score [76]. In an earlier GWAS study [77], an SNP in PNPA3 (adiponutrin/patatin-like phos‐pholipase-3) was strongly associated with both hepatic fat content and hepatic inflammation.The prevalence of this mutation may explain the difference in susceptibility to NAFLD seen indifferent ethnicities [77]. A subsequent study [78], confirmed the relationship between thisSNP and histological score, the no association with metabolic syndrome.
These studies are incredibly interesting and they could help the development of new nonin‐vasive markers, nevertheless all of them share limitations, mainly concerning to sample size.It is easily understandable given the fact that they use expensive and complex tools [51].
Proteomics. Proteomic tools look specifically at protein expression patterns and profiles.There are several approaches to proteomic studies depending on the used tool. These toolsare complex; they are based on diverse types of mass-spectrometry. For more detailed infor‐mation refer to [79, 80]. The different proteomic platforms support the use of either liver tis‐sue or blood. This platform allows identifying, quantifying and comparing proteins in thestudy groups of interest. That novel approach has been applied for the study of NAFLD[81-84]. These studies have found several proteins related to disease progression: alfa andbeta-hemoglobin [84], lumican and FABP1 (fatty acid binding protein-1) [82]; and finally fi‐brinogen beta-chain, retinol binding protein-4, serum amiloyd p-component, lumican, trans‐grelin-2 and CD5-like antigen, in 6-panel model and complement component 7, transgrelin-2
Liver Biopsy – Indications, Procedures, Results178

and insulin grow factor acid labile subunit, in a 3-panel model. These panels performed inthe diagnosis of the diverse NAFLD stages get an area under the receiver operator curve(AUROC) ranging from 0,83 to 0,91 [83].
Metabolomics. In the natural history of NAFLD the progression to hepatic fibrosis occursonly in 10 to 25% of cases, leading to cirrhosis, end-stage liver disease or hepatocellular car‐cinoma. The strongest predictor of fibrotic progression, apart from pre-existing fibrosis, issteatohepatisis. A two-hit model has been proposed as an explanation for why some pa‐tients progress to NASH. In a first step, because of insulin resistance, adipose tissue has en‐hanced triglyceride lipolysis, which leads to increased serum free fatty acids, and impairedhepatic triglyceride export. In this model, hepaticsteatosis (hit 1) exposes the liver parenchy‐ma to environmental and extracellular hepatic insults (hit 2), leading to inflammation, stea‐tonecrosis and fibrosis. Impaired mitochondrial oxidation and lipid export may alsocontribute to hepatic fat deposition.
Leptin system is also implicated, and its receptor expression is related to fibrosis degree [85].
As it was explained in the introduction, irisin is a newly identified hormone. Irisin is pro‐duced in muscle cells induced in exercise [86-88]. Irisin activates changes in adipose tissue,and make its change from white adipose tissue to brown adipose tissue, and this causes asignificant increase in total body energy expenditure and resistance to obesity-linked insulinresistance. So this advance opens new pathogenic pathways in NAFLD.
Inflammation is considered to be the central clue for the progression of NAFLD, the originsand components are considered in this review [89]. Hepatocytes injured by toxic lipid mole‐cules play a central role in the recruitment of innate immunity involving Toll-like receptors(TLR), Kuppfer cells, lymphocytes and neutrophils and possibly inflammasome. On thisway, a study was carried to determine the lipidomic signature in NAFLD [90]. Using proteo‐mic tools (mass spectrometry) the investigators found metabolites from nonenzymatic oxi‐dation product of arachidonic acid and from impaired peroxisomal polyunsaturated fattyacid (PUFA). This study links to another, where investigators characterize metabolic profileto distinguish steatosis and NASH [91], they also found arachidonic acid, among other sub‐stances, relation to NASH and fibrosis. Metabolomics analysis was performed to NAFLDpatients showing a lower concentrations of glutathione, an antioxidant substance, in thisgroup [92].
The key pro-inflammatory signalling pathways in NASH are nuclear factor-kappa B (NF-kB) and c-Jun N-terminal kinase (JNK). It could be possible that inflammation in NASHcould originate outside the liver. Gut microbiota, the related Kupffer/TLR response, in‐flamed adipose tissue and circulating inflammatory cell can contribute or act as co-factorsthat triggers or maintain hepatic injury. In a study conducted in our centre to study the rela‐tionship between endotoxemia and NAFLD, we found higher levels of LBP (Lipopolysac‐charide-binding protein) in patients with NASH when compared to patients with simplesteatosis [93]. The LBP increase correlates with the level of tumor necrosis factor alfa (TNF-alfa) which is overexpressed in patient with NASH and significant fibrosis. [94] Detailed in‐
Nonalcoholic Fatty Liver Disease: A Pathological Viewhttp://dx.doi.org/10.5772/52622
179
formation in pathophysiology of NAFLD and NASH is not the aim of this paper, if you areinterested refer to this review [89].
11. Conclusion
NAFLD is an emerging problem. The study of pathology is ever evolving which is allowingthe development of new therapeutic targets, and the emergence of new diagnostic techni‐ques allow better identification of patients who will benefit from new treatments.
Author details
Joaquín Cabezas1, Marta Mayorga2 and Javier Crespo1
1 Gastroenterology and Hepatology Unit, University Hospital “Marqués de Valdecilla”,Santander, Spain
2 Pathology Department, University Hospital “Marqués de Valdecilla”, Santander, Spain
References
[1] Chalasani N, Younossi Z, Lavine JE, Diehl AM, Brunt EM, Cusi K, et al. The diagno‐sis and management of non-alcoholic fatty liver disease: practice Guideline by theAmerican Association for the Study of Liver Diseases, American College of Gastroen‐terology, and the American Gastroenterological Association. Hepatology. 2012;55(6):2005-23. Epub 2012/04/11.
[2] Younossi ZM, Stepanova M, Afendy M, Fang Y, Younossi Y, Mir H, et al. Changes inthe prevalence of the most common causes of chronic liver diseases in the UnitedStates from 1988 to 2008. Clin Gastroenterol Hepatol. 2011;9(6):524-30 e1; quiz e60.Epub 2011/03/29.
[3] Whalley S, Puvanachandra P, Desai A, Kennedy H. Hepatology outpatient serviceprovision in secondary care: a study of liver disease incidence and resource costs.Clin Med. 2007;7(2):119-24. Epub 2007/05/12.
[4] Suzuki A, Angulo P, Lymp J, St Sauver J, Muto A, Okada T, et al. Chronological de‐velopment of elevated aminotransferases in a nonalcoholic population. Hepatology.2005;41(1):64-71. Epub 2005/02/04.
[5] Lee FY, Evans A, Kim D. Prevalence of fatty liver disease: a community-based autop‐sy study. Program and abstracts of Digestive Disease Week 2012; May 19-22, 2012;San Diego, California; Abstract 1054.
Liver Biopsy – Indications, Procedures, Results180

[6] Vos MB, Welsh J. Prevalence of suspected NAFLD is increasing among U.S. adoles‐cents. Digestive Disease Week 2012; May 19-22, 2012; San Diego, California. Abstract705.
[7] Kleiner DE, Brunt EM. Nonalcoholic fatty liver disease: pathologic patterns and biop‐sy evaluation in clinical research. Semin Liver Dis. 2012;32(1):3-13. Epub 2012/03/16.
[8] Kleiner DE, Brunt EM, Van Natta M, Behling C, Contos MJ, Cummings OW, et al.Design and validation of a histological scoring system for nonalcoholic fatty liver dis‐ease. Hepatology. 2005;41(6):1313-21. Epub 2005/05/26.
[9] Chalasani N, Wilson L, Kleiner DE, Cummings OW, Brunt EM, Unalp A. Relation‐ship of steatosis grade and zonal location to histological features of steatohepatitis inadult patients with non-alcoholic fatty liver disease. J Hepatol. 2008;48(5):829-34.Epub 2008/03/07.
[10] Brunt EM, Tiniakos DG. Histopathology of nonalcoholic fatty liver disease. World JGastroenterol. 2010;16(42):5286-96. Epub 2010/11/13.
[11] Tiniakos DG. Nonalcoholic fatty liver disease/nonalcoholic steatohepatitis: histologi‐cal diagnostic criteria and scoring systems. Eur J Gastroenterol Hepatol. 2010;22(6):643-50. Epub 2009/05/30.
[12] Malhi H, Gores GJ, Lemasters JJ. Apoptosis and necrosis in the liver: a tale of twodeaths? Hepatology. 2006;43(2 Suppl 1):S31-44. Epub 2006/02/01.
[13] Lackner C, Gogg-Kamerer M, Zatloukal K, Stumptner C, Brunt EM, Denk H. Bal‐looned hepatocytes in steatohepatitis: the value of keratin immunohistochemistry fordiagnosis. J Hepatol. 2008;48(5):821-8. Epub 2008/03/11.
[14] Ratziu V, Charlotte F, Heurtier A, Gombert S, Giral P, Bruckert E, et al. Sampling var‐iability of liver biopsy in nonalcoholic fatty liver disease. Gastroenterology.2005;128(7):1898-906. Epub 2005/06/09.
[15] Younossi ZM, Stepanova M, Rafiq N, Makhlouf H, Younoszai Z, Agrawal R, et al.Pathologic criteria for nonalcoholic steatohepatitis: interprotocol agreement and abil‐ity to predict liver-related mortality. Hepatology. 2011;53(6):1874-82. Epub2011/03/02.
[16] Matteoni CA, Younossi ZM, Gramlich T, Boparai N, Liu YC, McCullough AJ. Nonal‐coholic fatty liver disease: a spectrum of clinical and pathological severity. Gastroen‐terology. 1999;116(6):1413-9. Epub 1999/05/29.
[17] Feldstein AE, Wieckowska A, Lopez AR, Liu YC, Zein NN, McCullough AJ. Cytoker‐atin-18 fragment levels as noninvasive biomarkers for nonalcoholic steatohepatitis: amulticenter validation study. Hepatology. 2009;50(4):1072-8. Epub 2009/07/09.
[18] Brunt EM. Nonalcoholic steatohepatitis: pathologic features and differential diagno‐sis. Semin Diagn Pathol. 2005;22(4):330-8. Epub 2006/08/31.
Nonalcoholic Fatty Liver Disease: A Pathological Viewhttp://dx.doi.org/10.5772/52622
181

[19] Neuschwander-Tetri BA, Brunt EM, Wehmeier KR, Oliver D, Bacon BR. Improvednonalcoholic steatohepatitis after 48 weeks of treatment with the PPAR-gamma li‐gand rosiglitazone. Hepatology. 2003;38(4):1008-17. Epub 2003/09/27.
[20] Brunt EM, Kleiner DE, Wilson LA, Unalp A, Behling CE, Lavine JE, et al. Portalchronic inflammation in nonalcoholic fatty liver disease (NAFLD): a histologic mark‐er of advanced NAFLD-Clinicopathologic correlations from the nonalcoholic steato‐hepatitis clinical research network. Hepatology. 2009;49(3):809-20. Epub 2009/01/15.
[21] Gill RM, Belt P, Wilson L, Bass NM, Ferrell LD. Centrizonal arteries and microvesselsin nonalcoholic steatohepatitis. Am J Surg Pathol. 2011;35(9):1400-4. Epub 2011/08/13.
[22] Adams LA, Sanderson S, Lindor KD, Angulo P. The histological course of nonalco‐holic fatty liver disease: a longitudinal study of 103 patients with sequential liver bi‐opsies. J Hepatol. 2005;42(1):132-8. Epub 2005/01/05.
[23] Ekstedt M, Franzen LE, Mathiesen UL, Thorelius L, Holmqvist M, Bodemar G, et al.Long-term follow-up of patients with NAFLD and elevated liver enzymes. Hepatolo‐gy. 2006;44(4):865-73. Epub 2006/09/29.
[24] Pagadala MR, McCullough AJ. The relevance of liver histology to predicting clinical‐ly meaningful outcomes in nonalcoholic steatohepatitis. Clin Liver Dis. 2012;16(3):487-504. Epub 2012/07/25.
[25] Caldwell SH, Chang CY, Nakamoto RK, Krugner-Higby L. Mitochondria in nonalco‐holic fatty liver disease. Clin Liver Dis. 2004;8(3):595-617, x. Epub 2004/08/28.
[26] Pinto HC, Baptista A, Camilo ME, Valente A, Saragoca A, de Moura MC. Nonalco‐holic steatohepatitis. Clinicopathological comparison with alcoholic hepatitis in am‐bulatory and hospitalized patients. Dig Dis Sci. 1996;41(1):172-9. Epub 1996/01/01.
[27] Nelson JE, Wilson L, Brunt EM, Yeh MM, Kleiner DE, Unalp-Arida A, et al. Relation‐ship between the pattern of hepatic iron deposition and histological severity in non‐alcoholic fatty liver disease. Hepatology. 2011;53(2):448-57. Epub 2011/01/29.
[28] Ludwig J, Viggiano TR, McGill DB, Oh BJ. Nonalcoholic steatohepatitis: Mayo Clinicexperiences with a hitherto unnamed disease. Mayo Clin Proc. 1980;55(7):434-8. Epub1980/07/01.
[29] Levy JC, Matthews DR, Hermans MP. Correct homeostasis model assessment (HO‐MA) evaluation uses the computer program. Diabetes Care. 1998;21(12):2191-2. Epub1998/12/05.
[30] Richardson MM, Jonsson JR, Powell EE, Brunt EM, Neuschwander-Tetri BA, BhathalPS, et al. Progressive fibrosis in nonalcoholic steatohepatitis: association with alteredregeneration and a ductular reaction. Gastroenterology. 2007;133(1):80-90. Epub2007/07/17.
[31] Grundy SM, Cleeman JI, Daniels SR, Donato KA, Eckel RH, Franklin BA, et al. Diag‐nosis and management of the metabolic syndrome: an American Heart Association/
Liver Biopsy – Indications, Procedures, Results182

National Heart, Lung, and Blood Institute Scientific Statement. Circulation.2005;112(17):2735-52. Epub 2005/09/15.
[32] Machado M, Marques-Vidal P, Cortez-Pinto H. Hepatic histology in obese patientsundergoing bariatric surgery. J Hepatol. 2006;45(4):600-6. Epub 2006/08/11.
[33] Abrams GA, Kunde SS, Lazenby AJ, Clements RH. Portal fibrosis and hepatic steato‐sis in morbidly obese subjects: A spectrum of nonalcoholic fatty liver disease. Hepa‐tology. 2004;40(2):475-83. Epub 2004/09/16.
[34] Vuppalanchi R, Chalasani N. Nonalcoholic fatty liver disease and nonalcoholic stea‐tohepatitis: Selected practical issues in their evaluation and management. Hepatolo‐gy. 2009;49(1):306-17. Epub 2008/12/10.
[35] Dixon JB, Bhathal PS, Hughes NR, O'Brien PE. Nonalcoholic fatty liver disease: Im‐provement in liver histological analysis with weight loss. Hepatology. 2004;39(6):1647-54. Epub 2004/06/09.
[36] Mummadi RR, Kasturi KS, Chennareddygari S, Sood GK. Effect of bariatric surgeryon nonalcoholic fatty liver disease: systematic review and meta-analysis. Clin Gastro‐enterol Hepatol. 2008;6(12):1396-402. Epub 2008/11/07.
[37] Schwimmer JB, Behling C, Newbury R, Deutsch R, Nievergelt C, Schork NJ, et al.Histopathology of pediatric nonalcoholic fatty liver disease. Hepatology. 2005;42(3):641-9. Epub 2005/08/24.
[38] Carter-Kent C, Yerian LM, Brunt EM, Angulo P, Kohli R, Ling SC, et al. Nonalcoholicsteatohepatitis in children: a multicenter clinicopathological study. Hepatology.2009;50(4):1113-20. Epub 2009/07/29.
[39] Roberts EA. Non-alcoholic steatohepatitis in children. Clin Liver Dis. 2007;11(1):155-72, x. Epub 2007/06/05.
[40] Hsu E, Murray K. Is nonalcoholic Fatty liver disease in children the same disease asin adults? Clin Liver Dis. 2012;16(3):587-98. Epub 2012/07/25.
[41] Cuadrado A, Orive A, Garcia-Suarez C, Dominguez A, Fernandez-Escalante JC,Crespo J, et al. Non-alcoholic steatohepatitis (NASH) and hepatocellular carcinoma.Obes Surg. 2005;15(3):442-6. Epub 2005/04/14.
[42] Charatcharoenwitthaya P, Lindor KD. Role of radiologic modalities in the manage‐ment of non-alcoholic steatohepatitis. Clin Liver Dis. 2007;11(1):37-54, viii. Epub2007/06/05.
[43] Saadeh S, Younossi ZM, Remer EM, Gramlich T, Ong JP, Hurley M, et al. The utilityof radiological imaging in nonalcoholic fatty liver disease. Gastroenterology.2002;123(3):745-50. Epub 2002/08/29.
[44] Hamaguchi M, Kojima T, Itoh Y, Harano Y, Fujii K, Nakajima T, et al. The severity ofultrasonographic findings in nonalcoholic fatty liver disease reflects the metabolic
Nonalcoholic Fatty Liver Disease: A Pathological Viewhttp://dx.doi.org/10.5772/52622
183

syndrome and visceral fat accumulation. Am J Gastroenterol. 2007;102(12):2708-15.Epub 2007/09/27.
[45] Park SH, Kim PN, Kim KW, Lee SW, Yoon SE, Park SW, et al. Macrovesicular hepaticsteatosis in living liver donors: use of CT for quantitative and qualitative assessment.Radiology. 2006;239(1):105-12. Epub 2006/02/18.
[46] Mazhar SM, Shiehmorteza M, Sirlin CB. Noninvasive assessment of hepatic steatosis.Clin Gastroenterol Hepatol. 2009;7(2):135-40. Epub 2009/01/03.
[47] Cassidy FH, Yokoo T, Aganovic L, Hanna RF, Bydder M, Middleton MS, et al. Fattyliver disease: MR imaging techniques for the detection and quantification of liversteatosis. Radiographics. 2009;29(1):231-60. Epub 2009/01/27.
[48] Grandison GA, Angulo P. Can nash be diagnosed, graded, and staged noninvasive‐ly? Clin Liver Dis. 2012;16(3):567-85. Epub 2012/07/25.
[49] Reeder SB, Cruite I, Hamilton G, Sirlin CB. Quantitative assessment of liver fat withmagnetic resonance imaging and spectroscopy. J Magn Reson Imaging. 2011;34(4):729-49. Epub 2011/09/20.
[50] Adams LA, Feldstein AE. Non-invasive diagnosis of nonalcoholic fatty liver andnonalcoholic steatohepatitis. J Dig Dis. 2011;12(1):10-6. Epub 2010/11/26.
[51] Miller MH, Ferguson MA, Dillon JF. Systematic review of performance of non-inva‐sive biomarkers in the evaluation of non-alcoholic fatty liver disease. Liver Int.2011;31(4):461-73. Epub 2011/03/09.
[52] Poynard T, Ratziu V, Naveau S, Thabut D, Charlotte F, Messous D, et al. The diag‐nostic value of biomarkers (SteatoTest) for the prediction of liver steatosis. CompHepatol. 2005;4:10. Epub 2005/12/27.
[53] Bedogni G, Bellentani S, Miglioli L, Masutti F, Passalacqua M, Castiglione A, et al.The Fatty Liver Index: a simple and accurate predictor of hepatic steatosis in the gen‐eral population. BMC Gastroenterol. 2006;6:33. Epub 2006/11/04.
[54] Palekar NA, Naus R, Larson SP, Ward J, Harrison SA. Clinical model for distinguish‐ing nonalcoholic steatohepatitis from simple steatosis in patients with nonalcoholicfatty liver disease. Liver Int. 2006;26(2):151-6. Epub 2006/02/02.
[55] Feldstein AE, Lopez R, Tamimi TA, Yerian L, Chung YM, Berk M, et al. Mass spec‐trometric profiling of oxidized lipid products in human nonalcoholic fatty liver dis‐ease and nonalcoholic steatohepatitis. J Lipid Res. 2010;51(10):3046-54. Epub2010/07/16.
[56] Shimada M, Kawahara H, Ozaki K, Fukura M, Yano H, Tsuchishima M, et al. Useful‐ness of a combined evaluation of the serum adiponectin level, HOMA-IR, and serumtype IV collagen 7S level to predict the early stage of nonalcoholic steatohepatitis.Am J Gastroenterol. 2007;102(9):1931-8. Epub 2007/05/22.
Liver Biopsy – Indications, Procedures, Results184

[57] Younossi ZM, Jarrar M, Nugent C, Randhawa M, Afendy M, Stepanova M, et al. Anovel diagnostic biomarker panel for obesity-related nonalcoholic steatohepatitis(NASH). Obes Surg. 2008;18(11):1430-7. Epub 2008/05/27.
[58] Poynard T, Ratziu V, Charlotte F, Messous D, Munteanu M, Imbert-Bismut F, et al.Diagnostic value of biochemical markers (NashTest) for the prediction of non alco‐holo steato hepatitis in patients with non-alcoholic fatty liver disease. BMC Gastroen‐terol. 2006;6:34. Epub 2006/11/14.
[59] Angulo P, Hui JM, Marchesini G, Bugianesi E, George J, Farrell GC, et al. TheNAFLD fibrosis score: a noninvasive system that identifies liver fibrosis in patientswith NAFLD. Hepatology. 2007;45(4):846-54. Epub 2007/03/30.
[60] Nobili V, Alisi A, Vania A, Tiribelli C, Pietrobattista A, Bedogni G. The pediatricNAFLD fibrosis index: a predictor of liver fibrosis in children with non-alcoholic fat‐ty liver disease. BMC Med. 2009;7:21. Epub 2009/05/05.
[61] Harrison SA, Oliver D, Arnold HL, Gogia S, Neuschwander-Tetri BA. Developmentand validation of a simple NAFLD clinical scoring system for identifying patientswithout advanced disease. Gut. 2008;57(10):1441-7. Epub 2008/04/09.
[62] Shah AG, Lydecker A, Murray K, Tetri BN, Contos MJ, Sanyal AJ. Comparison ofnoninvasive markers of fibrosis in patients with nonalcoholic fatty liver disease. ClinGastroenterol Hepatol. 2009;7(10):1104-12. Epub 2009/06/16.
[63] Kruger FC, Daniels CR, Kidd M, Swart G, Brundyn K, van Rensburg C, et al. APRI: asimple bedside marker for advanced fibrosis that can avoid liver biopsy in patientswith NAFLD/NASH. S Afr Med J. 2011;101(7):477-80. Epub 2011/09/17.
[64] Guha IN, Parkes J, Roderick P, Chattopadhyay D, Cross R, Harris S, et al. Noninva‐sive markers of fibrosis in nonalcoholic fatty liver disease: Validating the EuropeanLiver Fibrosis Panel and exploring simple markers. Hepatology. 2008;47(2):455-60.Epub 2007/11/27.
[65] Ratziu V, Giral P, Charlotte F, Bruckert E, Thibault V, Theodorou I, et al. Liver fibro‐sis in overweight patients. Gastroenterology. 2000;118(6):1117-23. Epub 2000/06/02.
[66] Ratziu V, Massard J, Charlotte F, Messous D, Imbert-Bismut F, Bonyhay L, et al. Di‐agnostic value of biochemical markers (FibroTest-FibroSURE) for the prediction ofliver fibrosis in patients with non-alcoholic fatty liver disease. BMC Gastroenterol.2006;6:6. Epub 2006/03/01.
[67] Cales P, Laine F, Boursier J, Deugnier Y, Moal V, Oberti F, et al. Comparison of bloodtests for liver fibrosis specific or not to NAFLD. J Hepatol. 2009;50(1):165-73. Epub2008/11/04.
[68] Yoneda M, Yoneda M, Mawatari H, Fujita K, Endo H, Iida H, et al. Noninvasive as‐sessment of liver fibrosis by measurement of stiffness in patients with nonalcoholicfatty liver disease (NAFLD). Dig Liver Dis. 2008;40(5):371-8. Epub 2007/12/18.
Nonalcoholic Fatty Liver Disease: A Pathological Viewhttp://dx.doi.org/10.5772/52622
185

[69] Palmeri ML, Wang MH, Rouze NC, Abdelmalek MF, Guy CD, Moser B, et al. Nonin‐vasive evaluation of hepatic fibrosis using acoustic radiation force-based shear stiff‐ness in patients with nonalcoholic fatty liver disease. J Hepatol. 2011;55(3):666-72.Epub 2011/01/25.
[70] Chen J, Talwalkar JA, Yin M, Glaser KJ, Sanderson SO, Ehman RL. Early detection ofnonalcoholic steatohepatitis in patients with nonalcoholic fatty liver disease by usingMR elastography. Radiology. 2011;259(3):749-56. Epub 2011/04/05.
[71] Yang HR, Kim HR, Kim MJ, Ko JS, Seo JK. Noninvasive parameters and hepatic fib‐rosis scores in children with nonalcoholic fatty liver disease. World J Gastroenterol.2012;18(13):1525-30. Epub 2012/04/18.
[72] Torres DM, Harrison SA. Nonalcoholic steatohepatitis and noncirrhotic hepatocellu‐lar carcinoma: fertile soil. Semin Liver Dis. 2012;32(1):30-8. Epub 2012/03/16.
[73] Younossi ZM, Gorreta F, Ong JP, Schlauch K, Del Giacco L, Elariny H, et al. Hepaticgene expression in patients with obesity-related non-alcoholic steatohepatitis. LiverInt. 2005;25(4):760-71. Epub 2005/07/07.
[74] Sreekumar R, Rosado B, Rasmussen D, Charlton M. Hepatic gene expression in histo‐logically progressive nonalcoholic steatohepatitis. Hepatology. 2003;38(1):244-51.Epub 2003/06/28.
[75] Cayon A, Crespo J, Guerra AR, Pons-Romero F. (Gene expression in obese patientswith non-alcoholic steatohepatitis). Rev Esp Enferm Dig. 2008;100(4):212-8. Epub2008/06/20. Expresion genica en pacientes obesos con enfermedad hepatica por de‐posito de grasa.
[76] Chalasani N, Guo X, Loomba R, Goodarzi MO, Haritunians T, Kwon S, et al. Ge‐nome-wide association study identifies variants associated with histologic features ofnonalcoholic Fatty liver disease. Gastroenterology. 2010;139(5):1567-76, 76 e1-6. Epub2010/08/17.
[77] Romeo S, Kozlitina J, Xing C, Pertsemlidis A, Cox D, Pennacchio LA, et al. Geneticvariation in PNPLA3 confers susceptibility to nonalcoholic fatty liver disease. NatGenet. 2008;40(12):1461-5. Epub 2008/09/30.
[78] Speliotes EK, Butler JL, Palmer CD, Voight BF, Hirschhorn JN. PNPLA3 variants spe‐cifically confer increased risk for histologic nonalcoholic fatty liver disease but notmetabolic disease. Hepatology. 2010;52(3):904-12. Epub 2010/07/22.
[79] Griffin TJ, Aebersold R. Advances in proteome analysis by mass spectrometry. J BiolChem. 2001;276(49):45497-500. Epub 2001/10/05.
[80] Kito K, Ito T. Mass spectrometry-based approaches toward absolute quantitative pro‐teomics. Curr Genomics. 2008;9(4):263-74. Epub 2009/05/20.
Liver Biopsy – Indications, Procedures, Results186

[81] Younossi ZM, Baranova A, Ziegler K, Del Giacco L, Schlauch K, Born TL, et al. A ge‐nomic and proteomic study of the spectrum of nonalcoholic fatty liver disease. Hepa‐tology. 2005;42(3):665-74. Epub 2005/08/24.
[82] Charlton M, Viker K, Krishnan A, Sanderson S, Veldt B, Kaalsbeek AJ, et al. Differen‐tial expression of lumican and fatty acid binding protein-1: new insights into the his‐tologic spectrum of nonalcoholic fatty liver disease. Hepatology. 2009;49(4):1375-84.Epub 2009/03/31.
[83] Bell LN, Theodorakis JL, Vuppalanchi R, Saxena R, Bemis KG, Wang M, et al. Serumproteomics and biomarker discovery across the spectrum of nonalcoholic fatty liverdisease. Hepatology. 2010;51(1):111-20. Epub 2009/11/04.
[84] Trak-Smayra V, Dargere D, Noun R, Albuquerque M, Yaghi C, Gannage-Yared MH,et al. Serum proteomic profiling of obese patients: correlation with liver pathologyand evolution after bariatric surgery. Gut. 2009;58(6):825-32. Epub 2008/04/12.
[85] Cayon A, Crespo J, Mayorga M, Guerra A, Pons-Romero F. Increased expression ofOb-Rb and its relationship with the overexpression of TGF-beta1 and the stage of fib‐rosis in patients with nonalcoholic steatohepatitis. Liver Int. 2006;26(9):1065-71. Epub2006/10/13.
[86] Kelly DP. Medicine. Irisin, light my fire. Science. 2012;336(6077):42-3. Epub2012/04/12.
[87] Pedersen BK. A muscular twist on the fate of fat. N Engl J Med. 2012;366(16):1544-5.Epub 2012/04/20.
[88] Bostrom P, Wu J, Jedrychowski MP, Korde A, Ye L, Lo JC, et al. A PGC1-alpha-de‐pendent myokine that drives brown-fat-like development of white fat and thermo‐genesis. Nature. 2012;481(7382):463-8. Epub 2012/01/13.
[89] Farrell GC, van Rooyen D, Gan L, Chitturi S. NASH is an Inflammatory Disorder:Pathogenic, Prognostic and Therapeutic Implications. Gut Liver. 2012;6(2):149-71.Epub 2012/05/10.
[90] Puri P, Wiest MM, Cheung O, Mirshahi F, Sargeant C, Min HK, et al. The plasma lipi‐domic signature of nonalcoholic steatohepatitis. Hepatology. 2009;50(6):1827-38.Epub 2009/11/26.
[91] Barr J, Vazquez-Chantada M, Alonso C, Perez-Cormenzana M, Mayo R, Galan A, etal. Liquid chromatography-mass spectrometry-based parallel metabolic profiling ofhuman and mouse model serum reveals putative biomarkers associated with theprogression of nonalcoholic fatty liver disease. J Proteome Res. 2010;9(9):4501-12.Epub 2010/08/06.
[92] Kalhan SC, Guo L, Edmison J, Dasarathy S, McCullough AJ, Hanson RW, et al. Plas‐ma metabolomic profile in nonalcoholic fatty liver disease. Metabolism. 2011;60(3):404-13. Epub 2010/04/29.
Nonalcoholic Fatty Liver Disease: A Pathological Viewhttp://dx.doi.org/10.5772/52622
187

[93] Ruiz AG, Casafont F, Crespo J, Cayon A, Mayorga M, Estebanez A, et al. Lipopoly‐saccharide-binding protein plasma levels and liver TNF-alpha gene expression inobese patients: evidence for the potential role of endotoxin in the pathogenesis ofnon-alcoholic steatohepatitis. Obes Surg. 2007;17(10):1374-80. Epub 2007/11/15.
[94] Crespo J, Cayon A, Fernandez-Gil P, Hernandez-Guerra M, Mayorga M, Dominguez-Diez A, et al. Gene expression of tumor necrosis factor alpha and TNF-receptors, p55and p75, in nonalcoholic steatohepatitis patients. Hepatology. 2001;34(6):1158-63.Epub 2001/12/04.
Liver Biopsy – Indications, Procedures, Results188

Chapter 9
Liver Biopsy After Liver Transplantation
Alpna R. Limaye, Lisa R. Dixon and Roberto J. Firpi
Additional information is available at the end of the chapter
http://dx.doi.org/10.5772/52617
1. Introduction
Histological evaluation of liver allograft biopsies is an integral part of the management ofliver transplant patients. From the time of donor hepatectomy onward, the allograft is sus‐ceptible to multiple insults, including warm and cold ischemia, complications related to sur‐gical anastomoses, acute cellular rejection, and recurrence of underlying liver disease. It isoften quite challenging to distinguish these various entities by their clinical presentationalone. In these situations, evaluation of a liver biopsy is frequently necessary to confirm thediagnosis, to stage recurrent fibrosis, or to monitor response to treatment.
2. Post-transplant liver biopsy techniques
Liver biopsies can be performed with various techniques, including a percutaneous ap‐proach (with marking by percussion/palpation, marking by ultrasound (US), or under real-time US or computed tomography (CT) guidance), a transjugular approach, or a surgical/laparoscopic approach. Although percutaneous liver biopsies on non-transplant patients canbe done without the use of imaging, it is recommended that patients who have undergoneany abdominal surgery (including liver transplantation) undergo biopsies aided by the useof US to avoid vascular or other structures [1]. While US marking followed by biopsy is suf‐ficient in most post-transplant patients, in certain situations (such as split-liver recipients),biopsy under real-time US or CT guidance is preferred to avoid encountering interveningbowel loops. While specimens at least 1.5cm in length and containing at least 6-8 portal tri‐ads are considered adequate for the diagnosis of chronic liver disease [2,3], some advocate aminimum length of 2.0 cm and at least 11 complete portal tracts for accurate grading andstaging of liver disease [4].
© 2012 Limaye et al.; licensee InTech. This is an open access article distributed under the terms of the CreativeCommons Attribution License (http://creativecommons.org/licenses/by/3.0), which permits unrestricted use,distribution, and reproduction in any medium, provided the original work is properly cited.

Percutaneous liver biopsy can be performed rapidly and safely in an outpatient setting withthe appropriate monitoring equipment and staff availability [5]. After discharge, patients aretypically instructed to avoid strenuous physical activity or driving for 24-48 hours, and areasked to contact the clinical provider in the event of concerning symptoms. In our institu‐tion, a review of over 3,000 liver biopsies (including liver transplant patients) demonstratedthat the majority of complications were discovered within the first hour after percutaneousliver biopsy, and that shortening the recovery time to 1-2 hours did not impact the frequen‐cy of complications [6].
Percutaneous liver biopsy can be performed with suction needles (such as Jamshidi needleor Menghini needle), cutting needles (such as the Tru-Cut needle), or spring-loaded needle“guns”. Specimens adequate for diagnosis, grading, and staging can usually be obtained byall of the biopsy needles used in current practice.
In patients with severe/uncorrectable coagulopathy, thrombocytopenia (typically plateletcount < 50,000/mm3), large ascites, morbid obesity, or an inability to cooperate, a transjugu‐lar liver biopsy (TJLB) is typically recommended [7]. In addition, TJLB is useful in patientsfor whom wedged hepatic venous pressure gradient (HVPG) measurement would be clini‐cally useful. Miraglia et al reported on the safety of TJLB in liver transplant patients, withonly one complication in 183 biopsies (0.5%) [8].
TJLB is typically performed with the use of automated needle systems, such as theQuick-Core needle and the Flexcore needle. It has been established that these automatedneedle systems often require multiple passes, and usually collect smaller core samplesthan those obtained by percutaneous liver biopsy [9]. Despite this fact, specimens ob‐tained via TJLB are adequate for diagnosis, staging, and grading liver disease in greaterthan 90% of cases [10,11].
Surgical liver biopsies (either open liver biopsy or laparoscopic liver biopsy) are typicallyperformed when patients require a surgical procedure for another indication. In liver trans‐plant patients, this often involves repair of postoperative hernias. Biopsies in this setting canbe performed with either automated needle systems or with a wedge resection, and the pro‐cedure provides the advantage of direct visualization of the liver and the ability to immedi‐ately diagnose and treat any bleeding which occurs.
3. Complications of liver biopsy
Although invasive, liver biopsy is a relative safe procedure, whether performed percutane‐ously or via the transvenous route. In a review of over 60,000 non-transplant patients, deathwithin seven days directly related to liver biopsy occurred in 1 out of every 10,000 proce‐dures, and all-cause mortality within seven days occurred in approximately 0.2% of patients[12]. Serious complications were similarly rare, with pain occurring in 2% of patients, hemo‐peritoneum occurring in 0.04%, and hemobilia occurring in 0.01% [12]. Similarly, studies ofallograft liver biopsies demonstrate a mortality rate of up to 0.2%, and a rate of major com‐
Liver Biopsy - Indications, Procedures, Results190
plications between 0.2% and 1.8% [13]. While early studies suggested an increased risk ofpost-biopsy sepsis in patients with Roux-en-Y choledochojejunostomy, subsequent studiesshow that the risk is similar to patients with a duct-to-duct anastomosis [14].
4. Post-transplant liver enzyme abnormalities
Abnormalities in liver enzyme levels are often encountered in liver transplant patients, andcan represent hepatocellular injury (reflected by the transaminases), biliary injury [reflectedby alkaline phosphatase or gamma-glutamyl transferase (GGT)], or hepatic synthetic dys‐function (reflected by the albumin or by coagulation abnormalities). While the use of serumblood tests (such as viral or autoimmune serologies) and imaging techniques (such as ultra‐sound with Doppler, angiography, and magnetic resonance cholangiography) can be usefulto determine the etiology of abnormal liver enzymes, liver biopsy is often necessary for adefinitive diagnosis.
5. Early post-transplant liver enzyme abnormalities
The differential diagnosis of liver enzyme abnormalities varies with the amount of timewhich has passed since liver transplant. In the normal post-transplant course, liver enzymestypically rise immediately following transplant and become normal or near-normal within3-5 days. If the enzymes fail to improve or normalize but soon rise again, it is likely that anearly complication has occurred (Table 1). In the very early post-transplant period (withinthe first week), liver enzyme abnormalities can be related to primary graft nonfunction(PNF) or dysfunction, hepatic arterial insufficiency, small for size syndrome (SFSS), or portalvenous thrombosis (PVT).
5.1. Primary graft dysfunction
PNF and primary graft dysfunction are associated with prolonged ischemia time [15], and itis likely that preservation and reperfusion injury play a role. PNF is heralded by a precipi‐tous rise in hepatic transaminases in the second or third postoperative day accompanied bysigns of hepatic failure (encephalopathy and coagulopathy). Once hepatic artery thrombosis(HAT) has been ruled out by imaging, a liver biopsy confirms the diagnosis. Biopsies in thissetting typically show centrilobular hepatocyte dropout due to hepatocellular necrosis, withcompensatory zone 2 hepatocyte proliferation and bile ductular proliferation [16].
5.2. Hepatic artery thrombosis
The clinical presentation of HAT is quite similar to that of PNF, with a dramatic increase inhepatic transaminases and bilirubin in the very early post-transplant period. A liver biopsyis typically not required, as the diagnosis can usually be confirmed with angiography. When
Liver Biopsy After Liver Transplantationhttp://dx.doi.org/10.5772/52617
191

performed, biopsies of patients with hepatic arterial insufficiency show hepatocyte foamy
degeneration or necrosis and features of ischemic cholangitis [17].
Disease/
Complication
Incidence Time of
presentation
Clinical presentation Risk Factors Histological
Characteristics
Preservation/
Reperfusion
Injury
Up to 30%
(2-7% severe)
[15]
Within 3 days Elevated transaminases,
bilirubin, INR.
Encephalopathy in
severe injury
Prolonged cold or warm
ischemia time, greater
than 30% donor steatosis
Centrilobular
hepatocyte
dropout, zone 2
hepatocyte
proliferation, bile
duct proliferation
[16]
Hepatic artery
thrombosis
3-10% in
adult
transplant (up
to 40% in
pediatric
transplant)
[17]
Day 2 to 7 post-
transplant
Severe elevation of
transaminases, bilirubin,
alkaline
phosphatase/GGT
Technical/anastomotic
complications
Foamy
hepatocyte
degeneration,
features of
ischemic
cholangitis
Acute Cellular
Rejection
24-80% by 6
months post-
transplant
[26]
Typically 2-3
weeks after
transplant, up to
3 months post-
transplant
Elevated transaminases,
bilirubin, alkaline
phosphatase. Possible
recent history of
inadequate
immunosuppression
Younger recipient, older
donor, history of
autoimmune disorder, ?
female recipient
[17]
Portal
inflammation,
biliary
inflammation,
endothelitis
Portal vein
thrombosis
Less than 1% Early: within first
week post-
transplant
Late: within first
year post-
transplant
Early: acute hepatic
failure
Late: ascites, variceal
bleeding
Hypercoagulable state,
prior history of PVT
Often normal,
may show
features of focal
nodular
hyperplasia [21,
22]
Small for size
syndrome
Not well
defined, but
greatest when
graft-to-
recipient body
weight ratio is
less than 0.6
[18]
Sequelae of
portal
hypertension: 6
to 12 months
post-transplant
Ascites, spontaneous
bacterial peritonitis,
variceal bleeding
Graft-to-recipient body
weight ratio less than 0.6
[18, 19]
Centrilobular
cholestasis and
steatosis,
interface bile duct
inflammation [20]
Table 1. Differential diagnosis of early post-transplant liver enzyme abnormalities
Liver Biopsy - Indications, Procedures, Results192

5.3. Portal vein thrombosis
Early acute PVT presents clinically as acute hepatic failure and demonstrates histologicalfeatures of hepatocyte necrosis. Occasionally, PVT presents later, in which case the featuresof portal hypertension dominate. In this situation, if a biopsy is performed, it can be normalor show features of nodular regenerative hyperplasia [18,19].
5.4. Small for size syndrome
Patients with SFSS present with dominant features of portal hypertension, such as ascitesand variceal bleeding. This syndrome is the result of relative portal hyperperfusion com‐pared to hepatic arterial blood flow, and often occurs when the transplanted liver (or liversegment) is less than 0.6- 0.8% of the recipient body weight [20,21]. The diagnosis is typicallymade clinically, with signs of portal hypertension such as ascites and variceal bleeding. If aliver biopsy is performed, the allograft typically shows centrilobular cholestasis, centrilobu‐lar steatosis, and interface ductular proliferation [22].
5.5. Acute cellular rejection
The most common cause of early allograft dysfunction is acute cellular rejection (ACR).Although most cases of ACR occur in the first three months post-transplant (most oftenin the second or third post-transplant week), late-onset ACR (occurring up to 10 yearspost-transplant) has been reported [23]. ACR typically presents as moderate to severe el‐evations in hepatic transaminases and alkaline phosphatase/GGT, with some degree ofbilirubin elevation, often in patients with a recent history of inadequate immunosuppres‐sion. The “gold standard” for the diagnosis of ACR remains the liver biopsy, which typi‐cally shows variable degrees of mixed portal inflammation (often with increasedeosinophils), bile duct inflammation, and endotheliitis (typically in the portal vein or cen‐tral vein branches) (Figure 1). The Banff criteria are the most widely used to describeACR, and give a score of 1-3 for each component. These scores are added to calculatethe Rejection Activity Index (RAI), which ranges from 3-4 (mild ACR) up to greater than7 (severe ACR) [24]. It should be noted that late-onset ACR often appears quite differenthistologically, with a greater likelihood of lobular inflammation, less prominent bile ductinflammation, and a tendency towards monotypic portal inflammation [25]. A follow-upliver biopsy after 3-7 days of increased immunosuppression is occasionally used to con‐firm response to treatment.
5.6. Late post-transplant liver enzyme abnormalities
Beyond three months post-transplant, the differential of liver enzyme abnormalitieschanges. Broadly, the diagnoses can be categorized as chronic rejection, native disease recur‐rence, de novo infectious complications, toxic complications, de novo hepatitis, or vascularcomplications (Table 2).
Liver Biopsy After Liver Transplantationhttp://dx.doi.org/10.5772/52617
193

Figure 1. Acute rejection, with endotheliitis (arrowhead), bile duct destruction (arrow), and mixed portal inflamma‐tion (40x, H&E)
Liver Biopsy - Indications, Procedures, Results194

Disease/
Complication
Incidence Time of
presentation
Clinical presentation Risk Factors Histological
Characteristics
Chronic rejection 3-5% 3-12 months after
transplant
Rising alkaline
phosphatase/GGT, late
elevation in bilirubin
Inadequate
immunosuppression, history
of multiple episodes of or
ongoing acute cellular
rejection [17]
Bile duct atrophy/loss,
foamy arteriopathy [26]
Recurrent HCV Near-universal Re-infection
within 72 hours;
histological
recurrence within
1-2 weeks;
clinically
significant
recurrence within
3 years (within 1
year for FCH) [27]
Elevated transaminases
in typical recurrent HCV
FCH: jaundice, marked
elevation of alkaline
phosphatase/GGT,
extremely high HCV viral
load
FCH: excessive
immunosuppression
Portal inflammation,
interface hepatitis, lobular
activity [28-30]
FCH: cholestasis, fibrosis
[35]
Recurrent HBV Less than 10%
with adequate
prophylaxis [36]
Typical recurrent
HBV: 6-12 months
post-transplant
FCH: within 1
month post-
transplant
Elevated transaminases,
elevated HBV viral load
Inadequate prophylaxis Lymphoplasmacytic portal
inflammation, Kupffer cell
hypertrophy, lobular
disarray; ground-glass
hepatocytes; positive
immunostaining for
hepatitis B surface antigen
and core antigen [37]
Recurrent AIH Up to 40% [38] Variable Slow progression of
transaminase elevation
Inadequate
immunosuppression, native
type II AIH
Lymphoplasmacytic portal
infiltrate, prominent
interface activity [29]
CMV infection 5-8% with
prophylaxis
1-12 months
post-transplant
CMV hepatitis: Elevated
transaminases
Extrahepatic CMV:
gastroenteritis, colitis,
pneumonitis
Graft from CMV-antibody-
positive donor into CMV-
antibody-negative recipient
Portal inflammation,
hepatocytes with CMV
inclusions, focal bile duct
damage [29]
EBV infection Up to 80% of
patients who are
EBV-antibody-
negative at time
of transplant
6-12 or more
months post-
transplant
EBV hepatitis: usually
asymptomatic
PTLD: lymphoma-like
presentation
Primary infection: EBV-
antibody-negative recipient
Progression to PTLD:
excessive
immunosuppression,
preceding CMV infection
[43]
EBV hepatitis: portal and
sinusoidal infiltrates with
atypical lymphocytes,
+EBER
PTLD: immunoblasts, with
varying degrees of
architectural distortion [45]
Table 2. Differential diagnosis of late post-transplant liver enzyme abnormalities
Liver Biopsy After Liver Transplantationhttp://dx.doi.org/10.5772/52617
195

5.7. Chronic rejection
Chronic rejection involves immune-mediated injury to the hepatic arterial endothelium andbile duct epithelium. It is most commonly seen in patients who have experienced repeatedbouts of significant ACR and/or have a recent history of inadequate immunosuppression.The typical clinical presentation is a slow rise in alkaline phosphatase/GGT, often followedby a rise in bilirubin. Procurement of an adequate biopsy sample (with at least ten completeportal triads) is crucial in the histologic diagnosis of chronic rejection [26]. The minimal cri‐teria for diagnosis of chronic rejection, as defined by the 2000 Banff recommendations, are(1) bile duct atrophy/pyknosis affecting a majority of bile ducts (with or without bile ductloss); (2) foam cell obliterative arteriopathy (Figure 2); or (3) bile duct loss in greater thanhalf of the portal tracts [26].
Figure 2. Foamy arteriopathy in the setting of chronic rejection (H&E 10x)
In the months and early years following liver transplant, recurrence of the underlying dis‐ease which led to transplant becomes a common problem. Disease recurrence can be viral(most commonly hepatitis B or C), immunological (such as autoimmune hepatitis, primarysclerosing cholangitis [PSC], or primary biliary cirrhosis [PBC]), metabolic (such as non-alco‐holic fatty liver disease [NAFLD]), malignant (hepatocellular carcinoma or cholangiocarci‐noma), or idiopathic. The diagnosis of recurrent PSC, PBC, NAFLD, and malignancy isrelatively straightforward and is therefore not discussed further. However, the degree ofclinical and histological overlap between entities such as rejection, recurrent viral hepatitis,and autoimmune hepatitis can create diagnostic conundrums without close clinicopatholog‐ical correlation.
Liver Biopsy - Indications, Procedures, Results196

5.8. Recurrent hepatitis C
Recurrent hepatitis C (HCV) infection is a universal phenomenon after liver transplantation,and exhibits an accelerated progression to advanced liver disease [27]. Particularly in theearly months after transplant, the differential diagnosis of abnormal liver enzymes in HCVpatients includes both ACR and recurrent HCV. These entities are usually distinguished his‐tologically. Histologically established recurrent HCV demonstrates portal inflammation, of‐ten with lymphoid aggregates, interface hepatitis, and lobular disarray [28-30] (Figure 3).There is often a component of ductular reaction, which is uncommon in HCV in native liv‐ers [30]. While endotheliitis was traditionally considered specific to rejection, recent datademonstrate portal branch endothelitis in biopsies of native HCV livers [31,32]. It does ap‐pear that moderate to severe central vein branch endotheliitis remains fairly specific for re‐jection. In a prospective analysis of biopsies from 48 HCV transplant patients, Demetris et aldescribed strict criteria to avoid overdiagnosis of ACR: (1) inflammatory bile duct injury inat least 50% of portal tracts, and/or (2) mononuclear perivenular inflammation with hepato‐cyte necrosis in at least 50% of terminal hepatic venules [33]. In cases where the differentia‐tion of ACR and recurrent HCV is not clear, the use of an immune function assay can be auseful adjunct [34]. Occasionally, recurrent HCV presents aggressively, in an entity knownas fibrosing cholestatic hepatitis (FCH). The risk of FCH increases with aggressive immuno‐suppression, such as that used to treat ACR. Histologically, FCH is distinguished by a prom‐inent component of cholestasis and fibrosis [35].
Figure 3. Recurrent HCV, with chronic portal inflammation (ellipse), and interface as well as lobular activity (H&E,10x)
Liver Biopsy After Liver Transplantationhttp://dx.doi.org/10.5772/52617
197
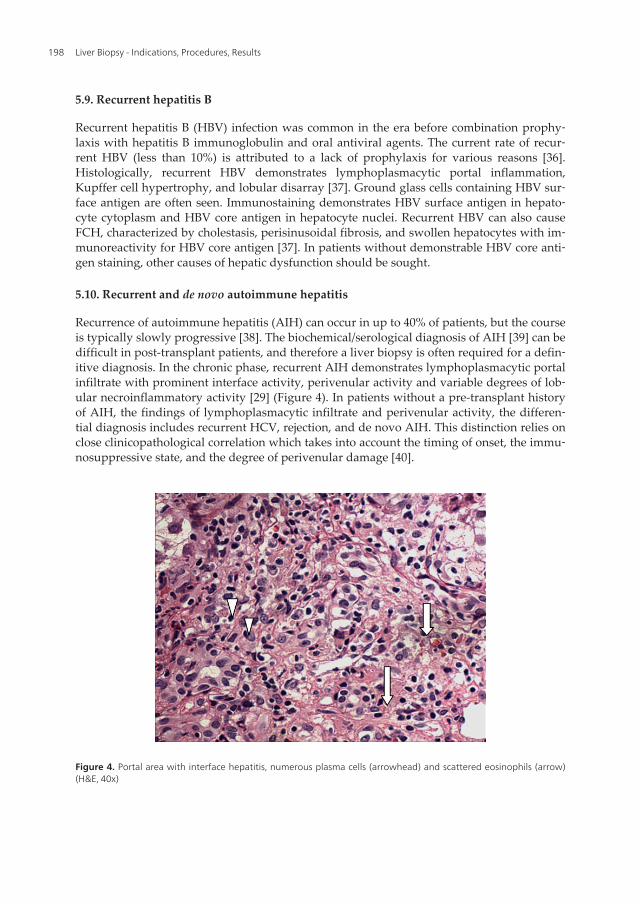
5.9. Recurrent hepatitis B
Recurrent hepatitis B (HBV) infection was common in the era before combination prophy‐laxis with hepatitis B immunoglobulin and oral antiviral agents. The current rate of recur‐rent HBV (less than 10%) is attributed to a lack of prophylaxis for various reasons [36].Histologically, recurrent HBV demonstrates lymphoplasmacytic portal inflammation,Kupffer cell hypertrophy, and lobular disarray [37]. Ground glass cells containing HBV sur‐face antigen are often seen. Immunostaining demonstrates HBV surface antigen in hepato‐cyte cytoplasm and HBV core antigen in hepatocyte nuclei. Recurrent HBV can also causeFCH, characterized by cholestasis, perisinusoidal fibrosis, and swollen hepatocytes with im‐munoreactivity for HBV core antigen [37]. In patients without demonstrable HBV core anti‐gen staining, other causes of hepatic dysfunction should be sought.
5.10. Recurrent and de novo autoimmune hepatitis
Recurrence of autoimmune hepatitis (AIH) can occur in up to 40% of patients, but the courseis typically slowly progressive [38]. The biochemical/serological diagnosis of AIH [39] can bedifficult in post-transplant patients, and therefore a liver biopsy is often required for a defin‐itive diagnosis. In the chronic phase, recurrent AIH demonstrates lymphoplasmacytic portalinfiltrate with prominent interface activity, perivenular activity and variable degrees of lob‐ular necroinflammatory activity [29] (Figure 4). In patients without a pre-transplant historyof AIH, the findings of lymphoplasmacytic infiltrate and perivenular activity, the differen‐tial diagnosis includes recurrent HCV, rejection, and de novo AIH. This distinction relies onclose clinicopathological correlation which takes into account the timing of onset, the immu‐nosuppressive state, and the degree of perivenular damage [40].
Figure 4. Portal area with interface hepatitis, numerous plasma cells (arrowhead) and scattered eosinophils (arrow)(H&E, 40x)
Liver Biopsy - Indications, Procedures, Results198

Liver transplant patients are also at risk of de novo infections due to their immunosup‐pressed state. While the diagnosis of most of these infections is fairly straightforward, post-transplant cytomegalovirus (CMV) and Epstein-Barr virus (EBV) infection can be moredifficult.
5.11. CMV infection
CMV is the most common clinically significant viral infection after solid organ transplanta‐tion, with an incidence of up to 30% prior to the use of routine prophylaxis [41]. The risk ofpost-transplant CMV infection is greatest in CMV-antibody-negative recipients who receivea graft from a CMV-antibody-positive donor. Clinically, CMV infection can present with fe‐ver, myelosuppression, and/or organ involvement (such as gastritis, colitis, hepatitis, orpneumonitis). While detection of CMV in the serum can provide a rapid diagnosis, a liverbiopsy is often required to distinguish CMV from allograft rejection or demonstrate thatboth entities are present [42]. Typically, CMV hepatitis is characterized by mononuclear ormixed portal inflammation, focal bile duct damage, and hepatocytes with CMV inclusions(large eosinophilic nuclear inclusions surrounded by a clear halo [29] (Figure 5). Althoughsome features similar to allograft rejection (portal lymphocytic inflammation, mild endothe‐liitis) can be seen in CMV hepatitis, immunostaining for CMV antigens and/or the presenceof CMV inclusions confirms that CMV is the driving force behind the hepatic dysfunction.
Figure 5. Hepatocyte with intranuclear CMV inclusion (arrowhead) (H&E, 100x)
Liver Biopsy After Liver Transplantationhttp://dx.doi.org/10.5772/52617
199

5.12. EBV infection and post-transplant lymphoproliferative disorder
The clinical presentation of EBV infection can vary from asymptomatic hepatitis to post-transplant lymphoproliferative disorder (PTLD). Patients without pre-transplant immunityto EBV are at the greatest risk of infection. Patients with primary post-transplant EBV infec‐tion, those with previous symptomatic CMV infection, and those with recent excessive im‐munosuppression are at the highest risk for progression to PTLD [43]. EBV hepatitistypically demonstrates portal and sinusoidal infiltrates consisting of atypical lymphocytes.Often the lymphocytes are arranged in a single-file pattern within sinusoids [29]. Anotherhistological pattern which can be seen in EBV hepatitis consists of mixed periportal and si‐nusoidal infiltrates with large atypical mononuclear cells and immunoblasts, mild bile ductdamage, and hepatic lobular activity [44]. The finding of EBV-encoded RNAs (EBERs) isconfirmatory in most cases.
PTLD is a heterogeneous lymphoproliferative disease divided into three main categories:early lesions, polymorphic PTLD, and monomorphic PTLD [45]. Early lesions demonstrateplasmacytic hyperplasia, and may or may not have prominent immunoblasts [29,45]. Poly‐morphic PTLD is characterized by mixed infiltrates of monoclonal or polyclonal plasmacells, immunoblasts, and destruction of the underlying lymphoid architecture [45]. Inmonomorphic PTLD, most cases arise from B cell populations which demonstrate inva‐sion, architectural effacement, and cellular atypia [29]. A fourth category, Hodgkin’s lym‐phoma-like PTLD, is sometimes described [46], and appears histologically like Hodgkin’slymphoma which occurs in non-transplant patients. PTLD patients with positive EBER re‐sults may represent relatively better histopathological features than patients with EBER-negative PTLD [47].
6. Indication and protocol liver biopsies
The majority of post-transplant liver biopsies are performed in response to changes in liverenzyme levels and/or abnormal imaging findings. Particularly in the early post-transplantperiod, these so-called “indication” biopsies are usually diagnostic and often result in achange in management. However, as patient and graft survival continues to improve, it hasbecome clear that normal histology is rarely seen in the long-term liver graft [48]. What isnot clear, however, is whether the histologic abnormalities seen in most late allograft biop‐sies correlate to clinically-significant disease, and whether the routine use of so-called “pro‐tocol” liver biopsies (performed at regular time points despite normal liver enzyme levels) isclinically justified. In our institution, we no longer perform annual protocol biopsies on pa‐tients with alcoholic liver disease, non-alcoholic fatty liver disease, or cryptogenic liver dis‐ease. The use of annual or semi-annual protocol biopsies in patients with AIH, PSC, or PBCis left to the discretion of the treating provider and/or the desires of the patient. In all HCVpatients, protocol biopsies are performed at four months post-transplant, at one year post-transplant, and annually thereafter for at least the first five years. In contrast, an informalsurvey of 35 transplant centers found that only 65% of centers perform protocol liver biop‐
Liver Biopsy - Indications, Procedures, Results200

sies for HCV patients, and only 25% of centers perform protocol biopsies for other post-transplant patients [13].
The rationale for protocol biopsies is the detection of those patients with severe dysfunctionin the hopes that early treatment and/or change in immunosuppression might improve graftsurvival. However, the evidence of the clinical utility of these biopsies is conflicted. In stud‐ies of long-term protocol biopsies in non-viral hepatitis transplant patients, it does appearthat histological abnormalities in the setting of normal liver enzymes likely are not clinicallysignificant [49,50]. The rationale for the use of protocol liver biopsies in HCV patients is theidentification of those with severe HCV recurrence in the hopes that prompt treatmentcould improve graft survival [51]. This appears to be justified, as several studies have dem‐onstrated the clinical utility of protocol biopsies in HCV patients, even as long as 20 yearspost-transplant [52-54]. It is notable, however, that the vast majority of patients with recur‐rent HCV (and all patients with severe recurrent HCV) had abnormal liver enzymes at thepre-determined time of protocol biopsy.
A separate but equally important factor in long-term patient survival is the avoidance of ex‐trahepatic complications of chronic immunosuppression, including renal insufficiency, thedevelopment of diabetes mellitus, and infectious complications. In this regard, another utili‐ty of protocol liver biopsy is the identification of those patients in whom immunosuppres‐sion can be safely lowered. A retrospective study of patients with various liver diseasesfound that protocol biopsy results led to a change in immunosuppression in almost on thirdof patients [55]. Recently, an international working group developed recommendations forprotocol biopsy monitoring in patients in whom minimizing or weaning immunosuppres‐sion is being considered [56].
7. Summary
The liver allograft is susceptible to a broad range of insult and injury from the time that it isremoved from the donor. While some complications are easily diagnosed by the clinical pre‐sentation and advanced imaging, the majority of conditions display overlapping clinical fea‐tures. As the treatment of these various conditions can be radically different, a definitivediagnosis is crucial. To that end, post-transplant liver biopsy continues to play a key role inthe evaluation of liver transplant patients with hepatic dysfunction. While the role of proto‐col biopsies in patients with no biochemical evidence of hepatic dysfunction has begun tofall out of favor (especially in non-HCV patients), the use of biopsy in immunosuppression-weaning protocols could promote a renewed interest in this methodology. The current datasupport the use of protocol biopsies in HCV patients (particularly in the first few years post-transplant). Areas for future investigation include non-invasive alternatives to liver biopsysuch as immune assays and advanced imaging, and the use of routine protocol biopsies inweaning of immunosuppression.
Liver Biopsy After Liver Transplantationhttp://dx.doi.org/10.5772/52617
201
Author details
Alpna R. Limaye1, Lisa R. Dixon2 and Roberto J. Firpi1*
*Address all correspondence to: [email protected]
1 Section of Hepatobiliary Diseases, Division of Gastroenterology, Hepatology, and Nutrition,Department of Medicine, University of Florida, Gainesville, FL, USA
2 Department of Pathology, Immunology, and Laboratory Medicine, University of Florida,Gainesville, FL, USA
References
[1] Rockey DC, Caldwell SH, Goodman ZD, Nelson RC, Smith AD; American Associa‐tion for the Study of Liver Diseases. Liver biopsy. Hepatology. 2009 Mar;49(3):1017-44.
[2] Chan J, Alwahab Y, Tilley C, Carr N. Percutaneous medical liver core biopsies: corre‐lation between tissue length and the number of portal tracts. J Clin Pathol. 2010 Jul;63(7):655-6.
[3] Bravo AA, Sheth SG, Chopra S. Liver Biopsy. N Engl J Med. 2001 Feb 15;344(7):495-500.
[4] Colloredo G, Guido M, Sonzogni A, Leandro G. Impact of liver biopsy size on histo‐logical evaluation of chronic viral hepatitis: the smaller the sample, the milder thedisease. J Hepatol. 2003 Aug;39(2):239-44.
[5] Jacobs WH, Goldberg SB. Statement on outpatient percutaneous liver biopsy. Dig DisSci. 1989 Mar;34(3):322-3.
[6] Firpi RJ, Soldevila-Pico C, Abdelmalak MF, Morelli G, Judah J, Nelson DR. Short re‐covery time after percutaneous liver biopsy: should we change our current practices?Clin Gastroenterol Hepatol. 2005 Sep;3(9):926-9.
[7] Van Ha TG. Liver biopsy in liver transplant recipients. Semin Intervent Radiol. 2004Dec;21(4):271-4.
[8] Miraglia R, Maruzzelli L, Minervini MI, Volpes R, Vissini G, Gruttadauria S, CarusoS, Luca A, Gridelli B. Transjugular liver biopsy in liver transplant patients using an18-gauge automated core biopsy needle. Eur J. Radiol. 2011 Dec;80(3):e269-72.
[9] De Hoyos A, Loredo ML, Martinez-Rios MA, Gil MR, Kuri J, Cardenas M. Transjugu‐lar liver biopsy in 52 patients with an automated Trucut-type needle. Dis Dis Sci1999;44:177-80.
Liver Biopsy - Indications, Procedures, Results202

[10] Cholongitas E, Quaglia A, Samonakis D, Senzolo M, Triantos C, Patch D, Leandro G,Dhillon AP, Burroughs AK. Transjugular liver biopsy: how good is it for accuratehistological interpretation? Gut. 2006 Dec;55(12):1789-94.
[11] Cholongitas E, Senzolo M, Standish R, Marelli L, Quaglia A, Patch D, Dhillon AP,Burroughs AK. A systematic review of the quality of liver biopsy specimens. Am JClin Pathol. 2006 May;125(5):710-21.
[12] West J, Card TR. Reduced mortality rates following elective percutaneous liver biop‐sies. Gastroenterology. 2010 Oct;139(4):1230-7.
[13] Mells G, Neuberger J. Protocol liver allograft biopsies. Transplantation. 2008 Jun27;85(12):1686-92.
[14] Ben-Ari Z, Neville L, Rolles K, Davidson B, Burroughs AK. Liver biopsy in livertransplantation: no additional risk of infections in patients with choledochojejunosto‐my. J Hepatol. 1996 Mar;24(3):324-7.
[15] Sirivatanauksorn Y, Taweerutchana V, Limsrichamrern S, Kositamongkol P, Maha‐withitwong P, Asavakarn S, Tovikkai C, Sanphasitvong V. Analysis of donor risk fac‐tors associated with graft outcomes in orthotopic liver transplantation. TransplantProc. 2012 Mar;44(2):320-3.
[16] Kakizoe S, Yanaga K, Starzl TE, Demetris AJ. Evaluation of protocol before trans‐plantation and after reperfusion biopsies from human orthotopic liver allografts:considerations of preservation and early immunological injury. Hepatology. 1990Jun;11(6):932-41.
[17] Gao Z. Seeking beyond rejection: an update on the differential diagnosis and a practi‐cal approach to liver allograft biopsy interpretation. Adv Anat Pathol. 2009;16:97-117.
[18] Wang JT, Zhao HY, Liu YL. Portal vein thrombosis. Hepatobiliary Pancreat Dis Int.2005 Nov;4(4):515-8.
[19] Shimamatsu K, Wanless IR. Role of ishchemia in causing apoptosis, atrophy, andnodular hyperplasia in human liver. Hepatology. 1997 Aug;26(2):343-50.
[20] Selzner M, Kashfi A, Cattral MS, Selzner N, Greig PD, Lilly L, McGilvray ID, Thera‐pondos G, Adcock LE, Ghanekar A, Levy GA, Renner EL, Grant DR. A graft to bodyweight ratio less than 0.8 does not exclude adult-to-adult right-lobe living donor liv‐er transplantation. Liver Transpl. 2009 Dec;15(12):1776-82.
[21] Alves RC, Fonseca EA, Mattos CA, Abdalla S, Goncalves JE, Waisberg J. Predictivefactors of early graft loss in living donor liver transplantation. Arg Gastroenterol.2012 Jun;49(2):157-61.
[22] Demetris AJ, Kelly DM, Eghtesad B, Fontes P, Wallis Marsh J, Tom K, Tan HP, Shaw-Stiffel T, Boig L, Novelli P, Planinsic R, Fung JJ, Marcos A. Pathophysiologic observa‐tions and histopathologic recognition of the portal hyperperfusion or small-for-sizesyndrome. Am J Surg Pathol. 2006 Aug;30(8):986-93.
Liver Biopsy After Liver Transplantationhttp://dx.doi.org/10.5772/52617
203
[23] Nakanishi C, Kawagishi N, Sekiguchi S, Akamatsu Y, Sato K, Miyagi S, Takeda I,Hukushima K, Aiso T, Sato A, Fujimori K, Satomi S. Steroid-resistant late acute rejec‐tion after a living donor liver transplantation: case report and review of the litera‐ture. Tohuko J Exp Med. 2007 Feb;211(2):195-200.
[24] No authors listed. Banff schema for grading liver allograft rejection: an internationalconsensus document. Hepatology. 1997 Mar;25(3)658-63.
[25] Demetris AJ, Adeyi O, Bellamy CO, Clouston A, Charlotte F, Czaja A, Daskal I, El-Monayeri MS, Fontes P, Fung J, et al; Banff Working Group. Liver biopsy interpreta‐tion for causes of late liver allograft dysfunction. Hepatology. 2006;44:489-501.
[26] Demetris A, Adams D, Bellamy C, Blakolmer K, Clouston A, Dhillon AP, Fung J,Gouw A, Gustafsson B, Haga H, Harrison D, Hart J, et al. Update of the InternationalBanff Schema for Liver Allograft Rejection: working recommendations for the histo‐pathologic staging and reporting of chronic rejection. An International Panel. Hepa‐tology. 2000 Mar;31(3):792-9.
[27] Limaye AR, Firpi RJ. Management of recurrent hepatitis C infection after liver trans‐plantation. Clin Liver Dis. 2011 Nov;15(4);845-58.
[28] Gane EJ. The natural history of recurrent hepatitis C and what influences this. LiverTranspl. 2008;14(Suppl 2):S36-S44.
[29] Adeyi O, Fischer SE, Guindi M. Liver allograft pathology: approach to interpretationof needle biopsies with clinicopathological correlation. J Clin Pathol. 2010;63:47-74.
[30] Moreira RK. Recurrent hepatitis C and acute allograft rejection: clinicopathologic fea‐tures with emphasis on the differential diagnosis between these entitities. Adv AnatPathol. 2011 Sep;18(5):393-405.
[31] Souza P, Prihoda TJ, Hoyumpa AM, Sharkey FE. Morphologic features resemblingtransplant rejection in core biopsies of native livers from patients with Hepatitis C.Hum Pathol. 2009 Jan;40(1):92-7.
[32] Yeh MM, Larson AM, Tung BY, Swanson PE, Upton MP. Endotheliitis in chronic vi‐ral hepatitis: a comparison with acute cellular rejection and non-alcoholic steatohepa‐titis. Am J Surg Pathol. 2006 Jun;30(6):727-33.
[33] Demetris AJ, Eghtesad B, Marcos A, Ruppert K, Nalesnik MA, Randhawa P, Wu T,Krasinskas A, Fontes P, Cacciarelli T, Shakil AO, Murase N, Fung JJ, Starzl TE. Recur‐rent hepatitis C in liver allografts: prospective assessment of diagnostic accuracy,identification of pitfalls, and observations about pathogenesis. Am J Surg Pathol.2004 May;28(5):658-69.
[34] Cabrera R, Ararat M, Soldevila-Pico C, Dixon L, Pan JJ, Firpi R, Machicao V, Levy C,Nelson DR, Morelli G. Using an immune functional assay to differentiate acute cellu‐lar rejection from recurrent hepatitis C in liver transplant patients. Liver Transpl.2009 Feb;15(2);216-22.
Liver Biopsy - Indications, Procedures, Results204
[35] Dixon LR, Crawford JM. Early histologic changes in fibrosing cholestatic hepatitis C.Liver Transpl. 2007 Feb;13(2):219-26.
[36] Laryea MA, Watt KD. Immunoprophylaxis against and prevention of recurrent viralhepatitis after liver transplantation. Liver Transpl. 2012 May;18(5):514-23.
[37] Thung SN. Histologic findings in recurrent HBV. Liver Transpl. 2006 Nov;12(11Suppl 2):S50-53.
[38] Ayata G, Gordon FD, Lewis WD, Pomfret E, Pomposelli JJ, Jenkins RL, Khettry U.Liver transplantation for autoimmune hepatitis: a long-term pathologic study. Hepa‐tology. 2000 Aug;32(2):185-92.
[39] Hennes EM, Zeniya M, Czaja AJ, Pares A, Dalekos GN, Krawitt EL, Bittencourt PL,Porta G, Boberg KM, Hofer H, Bianchi FB, et al; International Autoimmune HepatitisGroup. Simplified criteria for the diagnosis of autoimmune hepatitis. Hepatology.2008 Jul;48(1):169-76.
[40] Demetris AJ, Sebagh M. Plasma cell hepatitis in liver allografts: Variant of rejectionor autoimmune hepatitis? Liver Transpl. 2008 Jun;14(6):750-5.
[41] Lee SO, Razonable RR. Current concepts on cytomegalovirus infection after livertransplantation. World J Hepatol. 2010 Sep 27;2(9):325-36.
[42] Razonable RR. Cytomegalovirus infection after liver transplantation: current con‐cepts and challenges. World J Gastroenterol. 2008 Aug 21;14(31);4849-60.
[43] Knight JS, Tsodikov A, Cibrik DM, Ross CW, Kaminski MS, Blayney DW. Lympho‐ma after solid organ transplantation: risk, response to therapy, and survival at atransplantation center. J Clin Oncol. 2009 Jul 10;27(20):3354-62.
[44] Randhawa P, Blakolmer K, Kashyap R, Raikow R, Nalesnik M, Demetris AJ, Jain A.Allograft liver biopsy in patients with Epstein-Barr virus-associated posttransplantlymphoproliferative disease. Am J Surg Pathol. 2001 Mar;25(3):324-30.
[45] Harris NL, Jaffe ES, Diebold J, Flandrin G, Muller-Hermelink HK, Vardiman J, ListerTA, Bloomfield CD. The World Health Organization classification of the hemato‐poietic and lymphoid tissues: report of the Clinical Advisory Committee meeting—Airlie House, Virginia, November, 1997. Hematol J. 2000;1(1):53-66.
[46] Jagadeesh D, Woda BA, Draper J, Evens AM. Post transplant lymphoproliferativedisorders: risk, classification, and therapeutic recommendations. Curr Treat OptionsOncol. 2012 Mar;13(1);122-36.
[47] Izadi M, Taheri S. Significance of in situ hybridization results for EBV-encoded RNAin post-transplantation lymphoproliferative disorder setting: report from thePTLD.Int Survey. Ann Transplant. 2010 Oct-Dec;15(4):102-9.
[48] Ekong UD. The long-term liver graft and protocol biopsy: do we want to look? Whatwill we find? Curr Opin Organ Transplant. 2011 Oct;16(5):505-8.
Liver Biopsy After Liver Transplantationhttp://dx.doi.org/10.5772/52617
205
[49] Maor-Kendler Y, Batts KP, Burgart LJ, Wiesner RH, Krom RA, Rosen CB, CharltonMR. Comparative allograft histology after liver transplantation for cryptogenic cir‐rhosis, alcohol, hepatitis C, and cholestatic liver diseases. Transplantation. 2000 Jul27;70(2):292-7.
[50] El-Masry M, Gilbert CP, Saab S. Recurrence of non-viral liver disease after orthotopicliver transplantation. Liver Int. 2011 Mar;31(3):291-302.
[51] Firpi RJ, Clark V, Soldevila-Pico C, Morelli G, Cabrera R, Levy C, Machicao VI,Chaoru C, Nelson DR. The natural history of hepatitis C cirrhosis after liver trans‐plantation. Liver Transpl. 2009 Sep;15(9):1063-71.
[52] Berenguer M, Rayon JM, Prieto M, Aguilera V, Nicolas D, Ortiz V, Carrasco D, Lo‐pez-Andujar R, Mir J, Berenguer J. Are posttransplantation protocol liver biopsiesuseful in the long term? Liver Transpl. 2001 Sep;7(9):790-6.
[53] Firpi RJ, Abdelmalek MF, Soldevila-Pico C, Cabrera R, Shuster JJ, Theriaque D, ReedAI, Hemming AW, Liu C, Crawford JM, Nelson DR. One-year protocol liver biopsycan stratify fibrosis progression in liver transplant recipients with recurrent hepatitisC infection. Liver Transpl. 2004 Oct;10(10):1240-7.
[54] Sebagh M, Samuel D, Antonini TM, Coilly A, Degli Esposti D, Roche B, Karam V,Dos Santos A, Duclos-Vallee JC, Roque-Afonso AM, Ballott E, Guettier C, Blandin F,Saliba F, Azoulay D. Twenty-year protocol liver biopsies: invasive but useful for themanagement of liver recipients. J Hepatol. 2012 Apr;56(4):840-7.
[55] Mells G, Mann C, Hubscher S, Neuberger J. Late protocol liver biopsies in the liverallograft: a neglected investigation? Liver Transpl. 2009 Aug;15(8):931-8.
[56] Adeyi O, Alexander G, Baiocchi L, Balasubramanian M, Batal I, OC BC, Bhan A,Bridges N, Bucuvalas J, Charlotte F, et al; The Banff Working Group on Liver Allog‐raft Pathology. Importance of liver biopsy findings in immunosuppression manage‐ment: Biopsy monitoring and working criteria for patients with operational tolerance(OT). Liver Transpl. 2012 May 29. [Epub ahead of print].
Liver Biopsy - Indications, Procedures, Results206

Section 3
Non-Invasive Alternatives of Liver Biopsy


Chapter 10
Non-Invasive Evaluation of Liver Steatosis, Fibrosis andCirrhosis in Hepatitis C Virus Infected Patients UsingUnidimensional Transient Elastography (Fibroscan®)
Monica Lupsor, Horia Stefanescu, Diana Feier andRadu Badea
Additional information is available at the end of the chapter
http://dx.doi.org/10.5772/52621
1. Introduction
1.1. The importance of non-invasive evaluation of liver steatosis and fibrosis in virus Cinfected patients
Chronic conditions of the liver represent an important public health issue. Whatever the na‐ture of the aggression against the liver, it seems that it always follows the same pattern: in‐flamation -> necrosis -> healing (fibrosis) -> regeneration (cirrhosis) -> dysplasia ->hepatocellular carcinoma. An important link in this course of events is represented by fibro‐genesis. On the other hand, there are more and more evidence that, in patients with chronichepatitis C, steatosis is a risk factor independently associated with necroinflammatory activ‐ity and fibrosis progression.
At the moment, the gold standard in the evaluation of both liver fibrosis and steatosis is rep‐resented by liver biopsy (LB), an invasive method with possible side effects. As a result,most of the research done worldwide is focused towards developing other alternative, non-invasive diagnosis methods, that would be capable to evaluate fibrosis and steatosis as accu‐rately as possible.
Therefore, the following pages will present an evaluation of unidimensional transient elas‐tography (TE) performance in the assessment of liver fibrosis and steatosis in patients suffer‐ing from chronic viral hepatitis type C (HCV).
© 2012 Lupsor et al.; licensee InTech. This is an open access article distributed under the terms of the CreativeCommons Attribution License (http://creativecommons.org/licenses/by/3.0), which permits unrestricted use,distribution, and reproduction in any medium, provided the original work is properly cited.

2. Liver biopsy – An imperfect gold standard
Liver biopsy was performed by P Ehrlich in 1883 and became a common exploration meth‐od in 1958, when G Menghini introduced the first biopsy technique with a needle that wasnamed after him [1].
Liver biopsy provides a lot of information [2-6]:
• it represents the gold standard for a positive and differential diagnosis of diffuse liver diseases;
• provides important etiology data;
• allows for the evaluation of the necroinflammatory activity, evolutive stage (fibrosis) andconfirms if cirrhosis is present or not;
• helps establish the prognosis;
• identifies concomitent morphological alterations that may influence therapy response andits evaluation (steatosis, iron overload, etc);
• it can determine treatment efficiency.
At the same time, one can not ignore the fact that liver biopsy has significant limitations:possible complications, including mortality; important sampling errors; high cost; subjectiveappreciations that may be due to important intra and interobserver variations.
Biopsy complications may vary in magnitude and frequency depending on the subjacent liv‐er pathology. Among these can be listed: pain (epigastric area, right shoulder, right hypo‐condrium); vagal response; hemorrhagic accidents (hemoperitoneum, hemobilia, liverhematoma); bile peritonitis, bilioma; bacteremia; infections and abscesses; pneumothoraxand/or pleural reactions; hemothorax; arteriovenous fistula; subcutaneous emphysema; ad‐verse reactions caused by the anesthetic; breaking of the biopsy needle; penetration of otherorgans: lung, kidney, colon. The mortality associated with this technique is low, but it ispossible in 0.0088-0.3% of the cases [7-11].
The most significant problem encountered when interpreting a biopsy is represented bysamplig error. Considering the fact that the tissue sample obtained through liver biopsy rep‐resents approximately 1/50.000-1/100.000 of the liver volume, it can be inadequate for the di‐agnosis of diffuse liver conditions, as the histopathological changes may be spread unevenly[5]. Even though liver biopsy is considered the standard exploration in the evaluation of liv‐er diseases, it has an accuracy of only 80% in staging fibrosis and it can miss cirrhosis in 30%of the cases [12]. For example, Ragev reported that in HCV patients, there is a discrepancy ofat least 1 stage between the right and left lobe in 33% of the patients [13]. At the same time,Siddique observed that a difference of at least one stage between 2 samples (15 mm long) cutfrom the same area occurs in 45% of the cases [14].
Considering all these observations, the results of the studies performed to validate a non-invasive diagnosis method must be interpreted with caution, since they are compared withan imperfect „gold standard”.
Liver Biopsy – Indications, Procedures, Results210
Because of the limitations and invasive nature of liver biopsy, other non-invasive means arebeing tested for the evaluation of diffuse hepatopathies, and implicitly of fibrosis and steato‐sis as major prognosis factors in the evolution of the hepatopathy. Therefore, there is interestin developing other methods, either serological or imaging, which are all non-invasive, inorder to determine the presence and degree of fibrosis, as well as of steatosis. One of thesemethods is unidimensional transient elastography (Fibroscan).
3. The principle of unidimentional transient elastography
The divice consists of a special transducer, that is placed in the axis of a mechanical vibrator.The vibrator generates pain-free vibrations that produce a train of elastic waves that will betransmited through the skin and subcutaneous tissue to the liver. At the same time with acti‐vating the vibration, the probe performs a number of ultrasound acquisitions (the sameprocess of emision-reception used in conventional ultrasonography), with a frequency of 4kHz. Reports on the tissues deformation caused by elastic wave transmission can be formu‐lated by comparing the succesive ultrasound (US) signals acquired in this manner. The timenecessary for the train of waves to propagate along the area of interest, as well as propaga‐tion velocities are being measured. This way liver stiffness can be determined using the fol‐lowing formula: E = 3ρVs2 (E – elasticity module, ρ – density, a constant of the material; Vs –propagation velocity within the liver parenchyma). The more rigid the material, the higherthe velocity of propagation [15-17].
During the examination, the patient is lying down, face-up, with his right arm placed in hy‐perextension and above the head for an adequate exposure of his right hypocondrium. Theprobe is placed in contact with the patient’s skin, at the level of an intercostal space, in anarea of full liver dullness and avoiding any large vessels.
When the button on the probe is pushed, the vibration that will be transmitted through theliver is activated. By analyzing tissue deformation report, the software of the equipment willmeasure the liver stiffness (LS). The results are given in kiloPascals (kPa) and correspond toa median value of 10 valid measurements. The machine can determine values between 2.5and 75 kPa.
The monitor of the machine will display data regarding the patient’s identity, diagnosis,name of the examining physician, the instantaneous value of liver stiffness (CS), the medianstiffness resulted from 10 valid measurements, the success rate (SR), as well as the variationof the 10 values compared with the median value (IQR).
To be in agreement with the recommendations of the producer, the success rate must be atleast 60% and IQR must not exceed 30% of the median liver stiffness [16], even though itseems that the best concordance with liver biopsy is obtained when this value does not ex‐ceed 20% of the median [18].
There are no studies that especially focus on the issue of the variability of LS measurementsand therefore the interpretation of the results is done according to the experience of the ex‐
Non-Invasive Evaluation of Liver Steatosis, Fibrosis and Cirrhosis in Hepatitis C Virus Infected Patients UsingUnidimensional Transient Elastography (Fibroscan®)
http://dx.doi.org/10.5772/52621
211

aminer and the recommandations of the producer [19]. It is not known whether this variabil‐ity is encountered only in the diseased liver or whether it is present in the healthy liver aswell and to what degree this affects the interpretation of the results. The cause of this prob‐lem can be an inadequate technique or the liver pathology itself (for example, in macronod‐ular cirrhosis, liver stiffness can be different in different areas of the liver). When there is ahigh variability of the results, it is important to check whether the probe is placed perfectlyperpendicular on the thoracic wall, if the transmited vibration does not encounter the ribsand if the waves are transmited vertically, strictly between the ribs. If the generated wave islarge, bifid or angulated, than the software of the machine will reconstruct the velocitycurve in different points of the wave and therefore lead to variations of the acquired values.In order to obtain an accurate elastogram the transducer must be placed in the middle areaof the right lobe, avoiding contact with the ribs that may lead to vibration distorsion andabsorbtion [19].
The technique measures the stiffness of a volume that is equivalent with that of a cilinder of1 cm in diameter and 4 cm in length (the measurement can be performed on a distance of 25to 45 cm from the skin). This volume, representing about 1/500 of the liver volume, is at leasta 100 times larger than the one obtained through liver biopsy and it is therefore more repre‐sentative for the whole liver parenchyma [20, 21].
The examination can be performed by a technician following a short period of training (ap‐proximately 100 cases) [22-23], while the clinical interpretation of the results must always bedone by an expert who would consider the demographic data, the etiology of the diseaseand the biochemical profile of the patient at the moment of the examination [21].
A multivariate analysis of the relationship between liver stiffness and fibrosis, necroinflam‐matory activity and steatosis Showed, in some studies, that there is a significant correlationwith fibrosis, but no correlation with necroinflammatory activity and steatosis [16, 24]. Nev‐ertheless, the authors of the initial concept acknowledged, following in vitro studies, that itis unlikely that a single physical parameter (liver stiffness) would describe entirely a com‐plex biological system in which fibrosis is only a part [15].
A prospective assessment of the role of the histopathological parameters seen in LB in ex‐plaining the variance of liver stiffness was performed on 345 chronic hepatitis C patientsthat all underwent liver biopsy [25]. First, LS correlated highly with the degree of fibrosisassessed by liver biopsy,, but we also found a weak correlation with hepatic iron depositionand steatosis and a mild correlation with activity. In multiple regression analysis, fibrosis,activity, and steatosis independently influenced LSM. Iron deposition does not seem to in‐fluence the liver stiffness in CHC patients. Fibrosis, activity, and steatosis together explained62.4% of the variance of the LS. The three significant parameters uniquely explained 45.95%of the amount of LS, with fibrosis making the most unique contribution (44.49%); the differ‐ence of 16.25% (62.4%-45.95%) was accounted for by the joint contribution of the three pa‐rameters. The size and the direction of the relationships suggest that higher LS values areobtained for patients with advanced fibrosis, increased necroinflammatory activity and in‐creased steatosis. Among these three, however, the stage of fibrosis is the single most impor‐tant predictor, as suggested by the squared partial correlation [25].
Liver Biopsy – Indications, Procedures, Results212

The prediction model computed from this study [25] can be expressed as follows:
Liver stiffness (log-transformed) = 0.493 + 0.180*fibrosis stage +0.034*steatosis + 0.033*activi‐ty grade.
Therefore, our studies showed that fibrosis is indeed the main predictor of liver stiffness,but the activity and steatosis cannot be neglected, and may explain the LS variability withinthe same fibrosis stage.
4. Performance of TE for the noninvasive evaluation of liver fibrosisHCV patients
The first condition that benefited from unidimensional transient elastography was chronichepatitis type C [21, 26].
4.1. The diagnosis of liver fibrosis stages
Studies performed on a large number of HCV patients indicate that the LS value is highlycorrelated with the stage of fibrosis. The practical utility of the method is based on establish‐ing cutoff values for each stage of fibrosis. A diagnosis of stage F ≥2, F ≥3 and F4 (cirrhosis)is based on measurements of liver stiffness that vary, according to some studies, from 6.2 to8.8 Kpa, 7.7 to 10.8 kPa and from 11 to 14.8 kPa (Table 1) [24, 26-30].
There are some meta-analyses addressing the issue of diagnosis performance of TE. Fiftystudies were included in the analysis performed by Friedrich Rust et al. The mean AUROCfor the diagnosis of significant fibrosis, severe fibrosis, and cirrhosis were 0.84, 0.89 and 0.94,respectively [31]. In Stebbing’s meta-analysis, a total of 22 studies were selected, comprising4430 patients, most of them suffering from a virus C liver infection. The pooled estimates forsignificant fibrosis (≥F2) measured 7.71 kPa (LSM cutoff value) with a sensitivity of 71.9%and a specificity of 82.4%, whereas for cirrhosis (F4) the results showed a cutoff of 15.08 kPawith a sensitivity of 84.45% and a specificity of 94.69% [32].
It must be underlined that, in spite of the very good areas under the ROC curves, overlapsof the stiffness values were registered in adjacent stages, especially for early fibrosis [33].The increase of liver stiffness is higher between stage F2 (6.6 kPa) and F3 (10.3 kPa) of fibro‐sis than between F1 (5.5 kPa) and F2 (6.6 kPa), a fact that is in agreement with the morpho‐logical data according to which the increase in fibrotic tissue is more significant from F2 toF3 than from F1 to F2 [12].
The diagnosis accuracy of TE is much better in predicting cirrhosis. In Friedrich-Rust metaa‐nalysis [31], the AUROC mean for the diagnosis of cirrhosis was 0.94 and the performanceestimated by Talwalkar [34] was also very good: sensitivity 87%, specificity 91%, positiveprobability rate 11.7, and negative probability rate 0.14 (95% CI 0.10-0.20).
Non-Invasive Evaluation of Liver Steatosis, Fibrosis and Cirrhosis in Hepatitis C Virus Infected Patients UsingUnidimensional Transient Elastography (Fibroscan®)
http://dx.doi.org/10.5772/52621
213
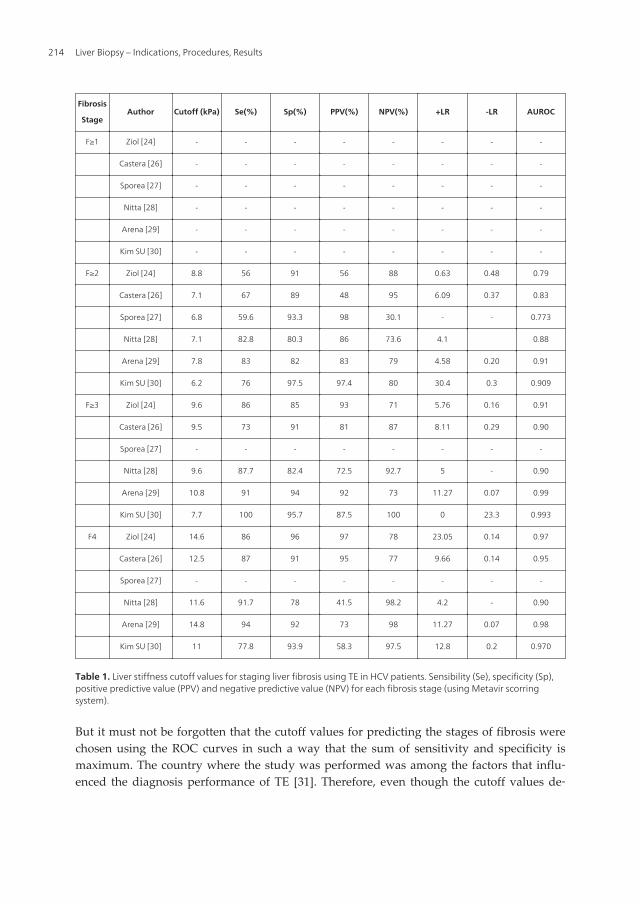
Fibrosis
StageAuthor Cutoff (kPa) Se(%) Sp(%) PPV(%) NPV(%) +LR -LR AUROC
F≥1 Ziol [24] - - - - - - - -
Castera [26] - - - - - - - -
Sporea [27] - - - - - - - -
Nitta [28] - - - - - - - -
Arena [29] - - - - - - - -
Kim SU [30] - - - - - - - -
F≥2 Ziol [24] 8.8 56 91 56 88 0.63 0.48 0.79
Castera [26] 7.1 67 89 48 95 6.09 0.37 0.83
Sporea [27] 6.8 59.6 93.3 98 30.1 - - 0.773
Nitta [28] 7.1 82.8 80.3 86 73.6 4.1 0.88
Arena [29] 7.8 83 82 83 79 4.58 0.20 0.91
Kim SU [30] 6.2 76 97.5 97.4 80 30.4 0.3 0.909
F≥3 Ziol [24] 9.6 86 85 93 71 5.76 0.16 0.91
Castera [26] 9.5 73 91 81 87 8.11 0.29 0.90
Sporea [27] - - - - - - - -
Nitta [28] 9.6 87.7 82.4 72.5 92.7 5 - 0.90
Arena [29] 10.8 91 94 92 73 11.27 0.07 0.99
Kim SU [30] 7.7 100 95.7 87.5 100 0 23.3 0.993
F4 Ziol [24] 14.6 86 96 97 78 23.05 0.14 0.97
Castera [26] 12.5 87 91 95 77 9.66 0.14 0.95
Sporea [27] - - - - - - - -
Nitta [28] 11.6 91.7 78 41.5 98.2 4.2 - 0.90
Arena [29] 14.8 94 92 73 98 11.27 0.07 0.98
Kim SU [30] 11 77.8 93.9 58.3 97.5 12.8 0.2 0.970
Table 1. Liver stiffness cutoff values for staging liver fibrosis using TE in HCV patients. Sensibility (Se), specificity (Sp),positive predictive value (PPV) and negative predictive value (NPV) for each fibrosis stage (using Metavir scorringsystem).
But it must not be forgotten that the cutoff values for predicting the stages of fibrosis werechosen using the ROC curves in such a way that the sum of sensitivity and specificity ismaximum. The country where the study was performed was among the factors that influ‐enced the diagnosis performance of TE [31]. Therefore, even though the cutoff values de‐
Liver Biopsy – Indications, Procedures, Results214

fined for a certain population may be relevant, they may not be applicable in anotherpopulation where the incidence of fibrosis is different. Because of this, it is indicated thateach centre establishes its own cutoff values, in agreement with the prevalence of fibrosisstages in that particular population, and calculates the performance of the method in rela‐tion with those cutoff values. According to our experience on a number of 1138 HCV pa‐tients that underwent liver biopsy, the predictive cutoff values for stages F1, F2, F3 and F4are: 5.1kPa, 7.5kPa, 9.1kPa and 13,2kPa, with an AUROC of 0.836, 0.826, 0.933 and 0.973, anddiagnosis accuracy between 77 and 92.8% [35]. In table 2 are presented the liver stiffness cut‐off values that predict each stage of fibrosis for the Romanian patients suffering from viral Cchronic hepatitis. The table also presents the sensitivity (Se), specificity (Sp), positive predic‐tive value (PPV) and negative predicting value (NPV), false positive (FPR) and false nega‐tive rate (FNR) the area under the ROC curve (AUROC) as well as the diagnosis accuracy(DA) of these cutoff values. In our study, the adjusted AUROC according to the prevalenceof each individual stage of fibrosis did not significantly differ from the observed ones (0.847for F≥1, p=1.00; 0.893 for F≥2, p=0.06; 0.945 for F≥3, p=0.34; 0.983 for F4, p=0.312), thereforethe cutoff values that we obtained may have a large applicability.
4.2. Monitoring disease progression
4.2.1. Diagnosis of liver cirrhosis. Prediction of portal hypertension and related complications
TE has a very good diagnosis accuracy in predicting cirrhosis (stage F4 Metavir), with areasunder ROC varying from 0.90 to 0.99 and cutoff values between 9-26.6 kPa [31], but there isa high interest to determine whether the use of the machine’s entire specter of measure‐ments (up to 75 kPa) can predict the clinical events characteristic to the evolution of cirrho‐sis. Some authors [36] indicated, with a negative predictive value of over 90%, that thesuggestive values for predicting the presence of various complications are: 27.5 kPa for largeesophageal varices; 37.5 kPa for Child B and C cirrhosis; 49.1 kPa for ascites; 53.7 kPa forhepatocarcinoma and 62.7 kPa for bleeding esophageal varices.
Portal hypertension is the main characteristic of liver cirrhosis, and the hepatic venous por‐tal gradient (HVPG) is the best surrogate marker to assess its presence.
A positive strong correlation between liver stiffness and HVPG was reported in HCV pa‐tients [37] and, afterwards, independently confirmed in another group of patients with se‐vere fibrosis (Metavir F3-F4) [38]. The correlation was excellent for HVPG values lower than10 or 12 mm Hg, but the linear regression analysis did not reveal exceptional results forHVPG values >10 mm Hg or >12 mm Hg. This means that, even though TU may detect aprogressive elevation of the portal pressure, mainly because of an increase in intrahepaticvascular resistance caused by the accumulation of extracellular fibrillar matrix, this methodcan not entirely determine the extremely complex hemodynamic alterations that character‐ize the delayed phase of portal hypertension [39]. As a result, some authors believe it is un‐likely that elastography can be useful in monitoring the hemodynamic therapeutic response,as the effect of the treatment is mainly mediated by the splanchnic circulatory changes [40].
Non-Invasive Evaluation of Liver Steatosis, Fibrosis and Cirrhosis in Hepatitis C Virus Infected Patients UsingUnidimensional Transient Elastography (Fibroscan®)
http://dx.doi.org/10.5772/52621
215

≥ F1; F0vsF1234 ≥ F2; F01vsF234 ≥ F3; F012vsF34 F4; F0123vsF4
Liver stiffness cutoff
value (kPa) 5.1 7.5 9.1 13.2
Se (%) 85.09 74.27 86.99 93.59
Sp (%) 65.45 82.95 88.51 92.71
+LR 2.46 4.36 7.57 12.84
-LR 0.23 0.31 0.15 0.07
PPV (%) 97.9 88.8 83.2 83.4
NPV (%) 18.7 63.9 91.2 97.4
FPR (%) 36.36 17.30 12.23 7.41
FNR (%) 13.86 25.59 12.55 6.41
Diagnosis accuracy (%) 85.01 77.34 87.63 92.87
Observed AUROC 0.836 0.860 0.933 0.973
Adjusted AUROC
according to the
prevalence of the
fibrosis stages
0.847 0.893 0.945 0.983
p (difference between
obs vs adj AUROC) 1.00 0.06 0.34 0.312
Table 2. Diagnostic performance of different cutoff values of liver stiffness in staging liver fibrosis in HCV Romanianpatients [35].
Regarding the relationship between liver stiffness and the presence of esophageal varices,the area under the ROC curve for predicting the presence of varices varied between 0.76 and0.84 [38, 41, 42]. Using cutoff values of 13.9 kPa, 17.6 kPa and 21.3 kPa, the sensitivity forvarices prediction was high (95%, 90% and 79%), but the specificity was relatively low (43%,43% and 70%) [38, 41, 42]. There are studies that demonstrated a relationship between thevalue of liver stiffness and the size of the varices [41, 42, 43], while other studies were notable to demonstrate this correlation [38]. Using cutoff values of 19 and 30.5 kPa, the sensitiv‐ity of TE for varices prediction was higher, but the specificity and the positive predictivevalue were modest [41, 42]. TE did not provide better results than the serological markers(like prothrombin time, thrombocytes [44] or FibroTest [45]), neither for varice detection (re‐gardless of their grade), nor for the diagnosis of significant varices [41]. Yet, a predictive roleof liver stiffness in anticipating variceal bleeding cannot be excluded [43, 46].
These contradicting results may be caused by the heterogeneity of the studied populations,the variable prevalence of varices (in general, but also of the large ones), the lack of prospec‐tive validation (all the cited studies were cross-sectional studies) and the variability of thecutoff values [47]. In conclusion, the evaluation of liver stiffness is not safe enough for thedetection and grading of esophageal varices in such a manner that it may replace upper di‐gestive tract endoscopy in patients with cirrhosis, since the specificity and positive predic‐tive value reported until now are too low to allow for a regular use of the method in clinicalpractice.
Liver Biopsy – Indications, Procedures, Results216

The literature data available on this topic are synthetized in table 3
Author etiology prev EV cutoff (kPa) Se Sp VPP VPN AUROC
HVPG VE VEM
Carion[37] HCV - 8.7a - - 90 81 90 81 0.92
Bureau[43] toate - 21b - - 90 93 91 90 0.94
Lemoine [48] HCV - 20.5b - - 63 70 35 88 0.76
-OH 34.9b - - 90 88 64 98 0.94
Vizutti [38] HCV 66% 17.6c - - 94 81 91 86 0.92
- 17.6 - 90 43 66 77 0.76
Kazemi [42] toate 45% - 13.9 - 95 43 91 57 0.84
- - 19 91 60 95 48 0.83
Castera [41] HCV 36% - 21.5 - 76 78 84 68 0.82
- - 30.5 77 85 92 54 0.85
HCV = hepatits C virus; -OH = etanol; EV = esophageal varices; LEV =large esophageal varices; Se = sensibility; Sp =specificity; P/NPV =positive/negative predictive value; AUROC = area under the ROC curve; HVPG = Hepatic venouspressure gradient (a HVPG ≥ 6 mm Hg; b HVPG ≥ 10 mm Hg; c HVPG ≥ 12 mm Hg).
Table 3. TE performance in EV diagnosis and HVPG prediction in liver cirrhosis patiens.
The huge potential of TE for cirrhosis patients was acknowledged ever since the methodwas introduced, as it can serve as a fast and non-invasive screening toll in the assessment ofactual complications, it can estimate the long term risk and thus place the patient in a certainrisk category [49]. The first signs of this possibility were the outcome of a retrospectivestudy which found that the risk of a patient with hepatitis C for developing hepatocellularcarcinoma is 5 times higher in patients with a LS value above 25 kPa, at the moment of thediagnosis [50]. Even more, a recent prospective study [51], that evaluated the role of liverstiffness in predicting complications related to portal hypertension in cirrhosis patients,demonstrated that a LS value < 21.1 kPa at diagnosis was as valuable as a HVPG<12 mmHgin the selection of the patients who will not experiment clinical events.
4.2.2. Optimization of liver stiffness performance in the diagnosis of liver cirrhosis or itscomplications
Based on the principle enounced by Pinzani et al, which states that a concordance betweentwo distinct noninvasive tests is needed for an accurate diagnosis [52], an association be‐tween LS and serum noninvasive tests for liver fibrosis was used to improve the diagnosticaccuracy. Such an algorithm was proposed by the Bordeaux group [53] and it is based on theconcordance between FibroScan and FibroTest. Using this approach, cirrhosis could be diag‐nosed with an accuracy of 93% and liver biopsy could be avoided for the diagnosis of cirrho‐sis in almost 80% of cases.
Non-Invasive Evaluation of Liver Steatosis, Fibrosis and Cirrhosis in Hepatitis C Virus Infected Patients UsingUnidimensional Transient Elastography (Fibroscan®)
http://dx.doi.org/10.5772/52621
217

On the other hand, our group managed to demonstrate that the Lok Score and LS used to‐gether as part of a noninvasive algorithm (see figure 1) can improve (78% diagnostic accura‐cy) the noninvasive estimation of large esophageal varices in cirrhotic patients [54].
Figure 1. Proposition for a non-invasive algorithm for the assessment of esophageal varices in patients with liver cir‐rhosis.
4.2.3. TE efficacy in hepatocellular carcinoma risk assessment
Early detection of hepatocellular carcinoma (HCC) in HCV patients represents an emerginghealth problem. As a common practice, alpha-fetoprotein (AFP) is widely used for the diag‐nosis of HCC, despite its low sensitivity and specificity [55]. Tateyama et al report AFPabove normal levels as a risk factor for the development of hepatocellular carcinoma in pa‐tients infected with hepatitis C virus [56].
Besides AFP, it has been proven that LS values increase as the liver disease progresses, thehighest values being specific for cirrhotic patients with associated HCC [36]. The evidenceprove that the individual role of increased LS measurements and serological markers arepredictive biomarkers of HCC [57, 58]. The first risk evaluation of HCC development inHCV patients using TE was first performed by Foucher et al in 2006, reporting a cut-off val‐ue of 53.7 kPa [36]. Also, according to Akima T et al [59] liver stiffness as measured by TE isa good predictor of HCC development in viral hepatitis, with serum total bilirubin ≥1.0mg/dL significantly correlated with tumor development. The latest published results reportgood diagnostic accuracy of LS in HCC prediction, for cut-off values ranging between 12.5and 53.7 kPa [57,59,60]. However none of these studies have been designed to evaluate theaccuracy of more predictive parameters, others than LS. On the other hand, adding bio‐markers and other variables (such as variance) to LS measurement could represent con‐founding factors in the assessment of patients with liver cirrhosis and HCC [61]. This maylead to an over- or under-estimation of the risk assessed by TE, so a new accuracy testing is
Liver Biopsy – Indications, Procedures, Results218

needed. Nevertheless, increased LS seems to be a determinant of advanced cirrhosis, beingassociated with decompensating episodes (high grade esophageal varices, bleeding, devel‐opment of ascites) as well as with the presence of HCC [62], proving that increased LS alonecannot be a good predictor of HCC.
On the other hand, Japanese studies also suggest that TE could be used as an indicator for the de‐velopment of hepatocellular carcinoma in patients with virus C hepatitis [58, 63], the risk being 5times higher in patients with a liver stiffness of over 25 kPa. Yet, these results must be confirmedin prospective studies performed on larger groups of patients, in order to see whether liver stiff‐ness can trully predict complication development in patients with compensated cirrhosis [21]. Ifthis fact is confirmed, elastography may serve as a non-invasive, quick screening modality whichcould place the cirrhosis patient in a certain risk category [64].
4.2.4. Hepatitis C infection recurrence after liver transplant
ETU is useful in the appreciation of the severity of hepatitis C recurrence after transplanta‐tion, thus reducing the number of liver biopsies [65]. In Carrion's study, for a cutoff value of8.5 kPa, the sensitivity, specificity, negative predictive value and positive predictive value inanticipating significant fibrosis were 90%, 81%, 79% and 92%. The important thing is thatnone of the patients with a liver stiffness below that value presented severe fibrosis (F3), cir‐rhosis (F4) or significant portal hypertension (HVPG ≥10 mm Hg). Furthermore only 6 (10%)out of the 62 patients, having LS below the established threshold limit value,, did developportal hypertension, but in all cases it was a mild hypertension.
In Rigamonti's study [66], during the follow-up after transplantation, in 40 patients withdouble biopsies (at 6 and 21 months), the liver stiffness changed in parallel with the stage offibrosis, having a sensitivity of 86 % and a specificity of 92% in predicting an increase in thestage of fibrosis.
A recently published meta-analysis [67] showed that in patients undergoing transplantation forHCV-related disease, TE appears to be a reliable diagnostic test for the exclusion of liver cirrho‐sis. Furthermore, low TE values can reliable exclude cirrhosis in patients with recurrent HCV af‐ter liver transplantation and liver biopsy may even be avoided in these situations. Among thestudies that evaluated significant fibrosis due to a recurrent HCV infection after liver transplan‐tation, the pooled estimates were 83% for sensitivity, 83% for specificity, 4.95 for the positive like‐lihood ratio, 0.17 for negative likelihood ratio and 30.5 for diagnostic odds ratio. For the studiesthat assessed cirrhosis, the pooled estimates were 98% for sensitivity, 84% for specificity, 7 forpositive likelihood ratio, 0.06 for negative likelihood ratio, and 130 for diagnostic odds ratio[67].
5. Confounding factors influencing the interpretation of liver stiffnessvalues
Since the liver is self-contained in the non extensible Glisson’s capsule, stiffness is definitive‐ly influenced by pressure that can be either hydrostatic or osmotic [68]. There are a few con‐
Non-Invasive Evaluation of Liver Steatosis, Fibrosis and Cirrhosis in Hepatitis C Virus Infected Patients UsingUnidimensional Transient Elastography (Fibroscan®)
http://dx.doi.org/10.5772/52621
219

ditions that may determine false results in situations where other factors, except fromfibrosis, are influencing liver stiffness.
Necroinflammatory activity proved to influence liver stiffness in patients with viral hepatitis,causing an increase in stiffness in parallel with the grade of histological activity [29, 69, 70]. Inagreement with these results, the risk of overestimating the stage of fibrosis may occur in pa‐tients with acute hepatitis or reactivated chronic hepatitis, if just the value of liver stiffness is con‐sidered. Recent studies demonstrated that tissue alterations associated with acute hepatitis in apatient with no liver disease history produce a significant growth of liver stiffness, sometimesreaching cirrhosis values; this is due either to cellular intumescence or to severe cholestasis [71].The contribution of these non-fibrotic changes upon liver stiffness was demonstrated by the pro‐gressive reduction of liver stiffness parallel with the decrease of the transaminases [72, 73].
On the other hand, in patients with reactivated chronic hepatitis (therefore with preexistingfibrosis), the increased stiffness is not caused by fibrosis alone, but also by the added cellularintumescence [74].
From a practical perspective, it is important that the values of liver stiffness in patients withacute hepatitis or in those with reactivated chronic hepatitis must be interpreted carefully,within the patient's clinical and biochemical context [75]. In these patients, a certain diagno‐sis of severe fibrosis or cirrhosis cannot be established. The right management in these casesis to wait until the transaminases come back to normal and only when the potential involve‐ment of inflammation is removed, the real status of fibrosis can be determined; it can thus beestablished whether the event was an acute hepatitis on a diseased liver or a chronic hepati‐tis with pre-existing fibrosis that was reactivated [76].
At the same time, in patients with acute hepatitis, the evaluation of liver stiffness at varioustime intervals, can indicate the evolutive pattern of the condition, that may be characterizedeither by evolution towards fulminant hepatitis (significant increase in LS), or by remission(decrease in LS) [77].
Liver steatosis. The influence of steatosis on liver stiffness remains controversial. In somestudies, steatosis did not have a significant impact on liver stiffness, even after adjusting forfibrosis stage [16, 24, 28]. Still, in these studies, the proportion of patients with severe steato‐sis was too low to reliably quantify a possible influence and therefore further studies arenecessary to clarify this aspect.
We noticed from our experience that, after performing a stratified analysis of liver stiffness foreach stage of fibrosis, for the same grade of necroinflammatory activity (moderate-severe), thepresence of steatosis lead to a significant increase in LS from 5.89 ± 1.64 kPa to 7.15 ± 2.67 kPa forthose with stage F1 Metavir (p=0.004), and from 7.23±2.74 to 8.55±4.67 kPa for those with stage F2(p=0.04) [78]. Besides, our studies have demonstrated that fibrosis is indeed the main predictor ofliver stiffness, but activity and steatosis cannot be neglected and may explain the LS variabilitywithin the same fibrosis stage [25]. Afterwards, Ziol et al, using computer analysis of the micro‐scopic image on a group of 152 patients, confirmed that steatosis clearly influences liver stiffnessindependently from fibrosis, an influence that is insignificant in patients with cirrhosis, but im‐portant in non-cirrhosis patients [79].
Liver Biopsy – Indications, Procedures, Results220

Extra-hepatic cholestasis. The impact of extrahepatic cholestasis on liver stiffness was re‐cently demonstrated by Milloning [80] by evaluating cholestasis before endoscopic retro‐grade cholangiopancreatography as well as 3 and 12 days after the procedure, in a studygroup of patients with cholestasis caused mainly by a neoplastic invasion of the biliarytree. If initially liver stiffness had values close to cirrhosis values (a mean of 15.2 kPa), af‐ter drainage, the LS decreased as low as 7 kPa, in parallel with a decrease in values of bi‐lirubin of 2.8-2.9 mg/dl. In all patients that underwent biliary drainage, the decrease ofliver stiffness correlated with that of the bilirubin values, with a mean of decrease of 1.2±0.56 kPa for a reduction of the bilirubin of 1g/dl. The relationship between liver stiff‐ness and cholestasis was afterwards reproduced in the same study on an animal modelthat underwent ligation of the biliary duct. This resulted in an elevation of liver stiffnessfrom 4.6 kPa to 8.8 kPa in the first 120 minutes after ligation and a decrease in stiffnessto 6.1 kPa within the first 30 minutes after decompression. In conclusion, it is indicatedthat before an interpretation of the stiffness measurements is performed, an eventual ex‐trahepatic cholestasis must be excluded using imaging investigations and lab tests.
Congestive heart failure may lead to an increased liver stiffness, with values similar to cirrho‐sis, because of the elevated blood content of the liver, in 60% of the patients [80-84]. In thecontext of cardiopulmonary conditions, TE may be relevant for the evaluation of treatmentefficacy, as liver stiffness decreases once cardiac compensation is achieved.
6. Optimizing the non-invasive diagnosis of portal hypertension usingspleen stiffness measurements
Splenomegaly is a common finding in liver cirrhosis that should determine changes inspleen density as well, because of tissue hyperplasia and fibrosis [85, 86], and/or because ofportal and splenic congestion due to the splanchnic hyper-dynamic state [87]. These changesmight be quantified by elastography. Until recently, only magnetic resonance elastography(MRE) was used with encouraging results in this respect [88]. The preliminary data showeda highly significant correlation between liver and spleen stiffness in patients with portal hy‐pertension, but, according to the authors, the validity of spleen stiffness as noninvasivemeasure of portal venous pressure is not reliable enough [89].
6.1. Principle of TE for Spleen Stiffness Measurements (SSM) and technique assessment
Our group proposed for the first time the use of FibroScan® for spleen stiffness measure‐ment (SSM) [90]. For the measurement itself we proposed the same procedure as for the liv‐er stiffness measurement, with the sole exception that the patient had his left arm inmaximum abduction and the transducer was placed in the left intercostal spaces, usually onthe posterior axillary line. For better locating the splenic parenchyma, we also used ultra‐sound guidance, so that we could choose the best location for performing the analysis.
Non-Invasive Evaluation of Liver Steatosis, Fibrosis and Cirrhosis in Hepatitis C Virus Infected Patients UsingUnidimensional Transient Elastography (Fibroscan®)
http://dx.doi.org/10.5772/52621
221

6.2. Efficacy of spleen stiffness measurements for the evaluation of the presence and thegrade of esophageal varices
In the above mentioned study, we demonstrated that spleen stiffness can be assessed usingtransient elastography, the sole factor influencing the measurement being the spleen size.Spleen stiffness increases as the liver disease worsens, from normal to chronic hepatitis andto liver cirrhosis (figure 2).
Figure 2. A - Box plots of spleen stiffness values for controls (0), chronic hepatitis (1) and cirrhosis patients (2). The topand the bottom of the boxes are the first and third quartiles, respectively. The length of the box thus represents theinterquartile range within which 50% of the values were located. The line through the middle of each box representsthe median. The error shows the minimum and maximum values (range); B - Graphic representation of the significantincrease of SSM in healthy controls and patients with chronic hepatitis and liver cirrhosis, respectively.
In liver cirrhosis patients, the spleen stiffness measurement, can predict the presence, butnot the grade of esophageal varices. Therefore, for a cutoff value of 46.4 kPa, we managed topredict the presence of esophageal varices with a diagnostic accuracy of 80.45% and an AU‐ROC of 0.781 (figure 3).
Figure 3. A - Box plots showing the increase of SSM in liver cirrhosis patients with esophageal varices as comparedwith those without; B - ROC curve representation of SSM in distinguishing LC patients with or without EV.
Liver Biopsy – Indications, Procedures, Results222

In another more recent study [91], another group demonstrated that SSM also correlateswith HVPG values, suggesting that this new elastographic technique may become a valua‐ble noninvasive method for liver cirrhosis patients
6.3. Improving diagnostic accuracy for esophageal varices by modifying the SSMcalculation algorithm
Regarding the spleen stiffness measurement itself, we observed that the results seem to beinfluenced by the intrinsic characteristics of the machine (FibroScan). Regardless of the vari‐ceal status of the patients, or the grade of the varices, SSM reached the maximum value thatcan be measured by the machine (75 KPa). This is an important drawback, because we haveto face a significant interpolation between the patients groups. If the FibroScan had beenable to determine values beyond 75 KPa, we may have obtained better figures. In order toovercome this situation, we cooperated with the manufacturer of the device for developinga new calculation algorithm, not available on the commercial device, which allows stiffnessmeasurements of up to 150 kPa. In a validation study [54], using the new calculation algo‐rithm, we could differentiate between any classes of esophageal varices, except V1 vs V2(p<0.005) and could select patients with V3 (V012 vs V3 = 63.49 vs 116.08 kPa, p<0.005), theones that are at higher risk for bleeding (figure 4).
7. Noninvasive evaluation of liver steatosis using Controlled AttenuationParameter (CAP)
Even though liver stiffness provides an alternative to liver biopsy for fibrosis staging, it canidentify very important histologic features such as macrovesicular steatosis, ballooned hepa‐tocytes, inflammation, etc [68].
Figure 4. Boxplots representing mean SSM values according to the esophageal varices grade using the original (A) orthe modified (B) calculation algorithm.
Knowing that fat interferes with ultrasound propagation, a novel attenuation parameter hasbeen developed to detect and quantify liver steatosis. This parameter is based on the ultra‐
Non-Invasive Evaluation of Liver Steatosis, Fibrosis and Cirrhosis in Hepatitis C Virus Infected Patients UsingUnidimensional Transient Elastography (Fibroscan®)
http://dx.doi.org/10.5772/52621
223

sonic properties of the radio-frequency back propagated signals acquired by the Fibroscan[92]. It is called controlled attenuation parameter (CAP). This ultrasonic attenuation coeffi‐cient is an estimate of the total ultrasonic attenuation (go-and-return path) at the central fre‐quency of the regular or M Fibroscan® probe, i.e. at 3.5 MHz, and is expressed in dB.m−1.CAP is evaluated using the same radio-frequency data and the same region of interest, asthe region used to assess the LSM. CAP is only appraised if the acquisition is ‘‘valid’’. There‐fore, CAP is guided by vibration-controlled transient elastography (VCTE), which ensuresthat the operator automatically obtains an ultrasonic attenuation value of the liver [92, 93].The device is used to assess, at the same time, LS (which is related to liver fibrosis) and CAP(which is related to liver steatosis).
Even though relatively few studies have been published on this topic [92, 93, 94,95] the pre‐liminary results showed that CAP is a promising non-invasive tool to detect steatosis inCHC patients.
In the study conducted by Sasso et al, the CAP performance was appraised on 115 patients,taking the histological grade of steatosis as reference. CAP was significantly correlated tosteatosis with an AUROC equal to 0.91 and 0.95 for the detection of more than 10% and 33%of steatosis, respectively.
A study performed recently on 615 HCV patients, who underwent both Fibroscan (®) andliver biopsy showed in multivariate analysis, that CAP was related to steatosis, independ‐ently of fibrosis stage (which was related to LS. The AUROCs of the were 0.80, 0.86 and0.88 respectively, for predicting a fatty overload of more than 11%, 33%, and 66%, respec‐tively. CAP also exhibited a good ability to differentiate steatosis grades (Obuchowskimeasure = 0.92) [96].
CAP is evaluated using the same radio-frequency data and the same region of interest, asthe region used to assess the liver stiffness for fibrosis quantification. Preliminary studiesperformed in our department have found significantly different CAP values for differentsteatosis grades and AUROCs of 0.830 and 0.85 respectively, for the prediction of a hepaticfat content over 33% and 66%, respectively [97].
8. The advantages of TE in liver steatosis, fibrosis and cirrhosis diagnosis
Compared with other diagnosis indicators or predictive models based on lab tests, the eval‐uation of fibrosis using elastography has some important advantages [98,99]:
• It is easy to use; noninvasive; pain-free; does not require anesthesia or hospitalization andis therefore easily accepted by the patient;
• It is quick, the time needed for the examination being very short;
• It is not influenced by concomitant conditions;
• It is operator independent;
Liver Biopsy – Indications, Procedures, Results224

• The liver volume used to evaluate fibrosis is 150-400 times higher than the volume ob‐tained through liver biopsy.
As far as the evaluation of liver steatosis is concerned, in comparison to other modalities,CAP is non-invasive, quantitative, non-ionizing, and inexpensive. Furthermore, the proce‐dure is easy to perform, even by an operator who does not have any radiological skills andprovides immediate results. The procedure is also machine-independent and does not re‐quire corrections to be made for gain, frequency, focusing or beam diffraction, and is alsonot subject to operator interpretation. In addition, CAP has been shown to efficiently detectsteatosis at a level of ≥ 10%, which is more sensitive than other imaging modalities. Com‐pared to a liver biopsy, CAP is less prone to sampling error as it explores a liver volume∼100 times larger [92, 93].
9. Limitations of TE
Liver fibrosis can not be evaluated by TE in 5-8 % of the cases. Some of the possible causesfor this are listed below [16]:
• obesity (an ultrasound machine may be used in order to find the best window and thusincrease the ability to measure liver stiffness in overweight patients);
• a narrow intercostal space;
• ascites (vibrations are not transmitted through fluid);
• the quality of the liver parenchyma and other liver structures;
• large vascular structure present in the acquisition window (may lead to false results).
The failure of TE varies according to different authors from 2.4% to 9.4% [16, 21, 24, 36, 74,64, 100]. In a study performed on 2114 patients [101], liver stiffness could not be determinedin 4.5% of the cases and multivariate analysis showed that the only element associated withmeasurement failure is a body mass index over 28. Yet, with more experience, one may real‐ize that a thick thoracic wall is more likely to be a limiting factor for a failed measurementthan the growth of the body mass index in itself [102].
Technical solutions regarding the design of the probe were investigated lately, in order toovercome these limitations. Recently a new probe became available, that was specially de‐signed for obese patients, with a central frequency of 2.5% MHz (compared with the 5MHzprobe that is usually used), and that is able to determine liver stiffness on a distance of 35-75mm from the skin (while the normal probe is able to do that on distance of 25 to 45 cm).With the help of this new transducer, it was possible to obtain valid measurements in 49% ofthe patients with a BMI ≥30 kg/m2, in which the usual probe failed to determine the LS[103].
As far as predicting steatosis in HCV patients is concerned, CAP has further validation inlarger populations and by independent teams, since there are rather few studies published
Non-Invasive Evaluation of Liver Steatosis, Fibrosis and Cirrhosis in Hepatitis C Virus Infected Patients UsingUnidimensional Transient Elastography (Fibroscan®)
http://dx.doi.org/10.5772/52621
225

until now. Another important limitation is that CAP cannot be used with measurements tak‐en from the XL probe, which is a novel probe designed to assess liver stiffness in overweightand obese patients [75,76]. Thus, CAP needs to be developed to work with the XL probe.
10. Conclusions
The possibility of concomitant assessment of liver fibrosis (using liver stiffness measure‐ment) and of steatosis (using CAP) makes Fibroscan a promising non-invasive tool for as‐sessing and quantifying both fibrosis and steatosis, that may broaden the spectrum of non-invasive methods used for the investigation and follow-up of patients with chronic hepatitisC. But it is important that interpretation of the liver stiffness values be done by an experi‐enced physician and always within the clinical and biochemical context of the patient.
Acknowledgments
This material is part of the research project no 27020/ 6/ 15.11.2011, entitled “The non-inva‐sive evaluation of fibrosis and steatosis in diffuse liver diseases by unidimensional transientelastography – Fibroscan” from “Iuliu-Hatieganu” University of Medicine and Pharmacy,Cluj-Napoca.
Author details
Monica Lupsor1, Horia Stefanescu2, Diana Feier1 and Radu Badea1
*Address all correspondence to: [email protected]
1 Medical Imaging Department, Regional Institute of Gastroenterology and Hepatology ProfDr Octavian Fodor, “Iuliu Hatieganu” University of Medicine and Pharmacy, Cluj-Napoca,Romania
2 Hepatology Department, Regional Institute of Gastroenterology and Hepatology Prof DrOctavian Fodor, “Iuliu Hatieganu” University of Medicine and Pharmacy, Cluj-Napoca, Ro‐mania
References
[1] Menghini G. One-second needle biopsy of the liver. Gastroenterology 1958; 35(2):190-199.
Liver Biopsy – Indications, Procedures, Results226

[2] Maharaj B, Maharaj RJ, Leary WP, et al. Sampling variability and its influence on thediagnostic yield of percutaneous needle biopsy of the liver. Lancet. 1986; 1(8480):523-525.
[3] Poynard T, Ratziu V, Benmanov Y, Di Martino V, Bedossa P, Opolon P. Fibrosis inpatients with chronic hepatitis C: detection and significance. Semin Liver Dis. 2000;20(1): 47-55.
[4] Desmet VJ. Liver tissue examination. J Hepatol. 2003; 39(1): S43-49.
[5] Guido M, Rugge M. Liver biopsy sampling in chronic viral hepatitis. Semin LiverDis. 2004; 24(1): 89-97.
[6] Kleiner DE. The liver biopsy in chronic hepatitis C: a view from the other side of themicroscope. Semin Liver Dis. 2005; 25(1): 52-64.
[7] Buscarini E, Di Stasi M. Biopsy of the liver. In:Buscarini E, di Stasi M (eds). Compli‐cations of abdominal interventional ultrasound. Poletto Edizioni 1996, 34-50.
[8] Nazarian LN, Feld RI, Herrine SK, et al. Safety and efficacy of sonographically guid‐ed random core biopsy for diffuse liver disease. J Ultrasound Med 2000;19(8):537-541.
[9] Farrell R, Smiddy PF, Pilkington RM, et al. Guided versus blind liver biopsy forchronic hepatitis C: clinical benefits and costs. J Hepatol 1999; 30: 580-587.
[10] Schiff ER, Schiff L. Needle biopsy of the liver. In: Schiff ER, Schiff L. Diseases of theliver J.B.Lippincott Company, 1993, 216-225.
[11] McGill DB., Rakela J. A 21-year experience with major hemorrage after percutaneousliver biopsy. Gastroenterology 1990; 99: 1396-1400.
[12] Bedossa P, Dargere D, Paradis V. Sampling variability of liver fibrosis in chronic hep‐atitis C. Hepatology. 2003; 38(6): 1449-1457.
[13] Regev A, Berho M, Jeffers LJ, Sampling error and intraobserver variation in liver bi‐opsy in patients with chronic HCV infection. Am J Gastroenterol. 2002; 97(10):2614-2618.
[14] Siddique I, El-Naga HA, Madda JP, Memon A, Hasan F. Sampling variability on per‐cutaneous liver biopsy in patients with chronic hepatitis C virus infection. Scand JGastroenterol. 2003; 38(4): 427-432.
[15] Yeh WC, Li PC, Jeng YM, et al. Elastic modulus measurements of human liver andcorrelation with pathology. Ultrasound Med Biol. 2002; 28(4): 467-474.
[16] Sandrin L, Fourquet B, Hasquenoph JM, et al. Transient elastography: a new nonin‐vasive method for assessment of hepatic fibrosis. Ultrasound Med Biol. 2003; 29(12):1705-1713.
[17] Carstensen EL, Parker KJ, Lerner RM. Elastography in the management of liver dis‐ease. Ultrasound Med Biol. 2008; 34(10): 1535-1546.
Non-Invasive Evaluation of Liver Steatosis, Fibrosis and Cirrhosis in Hepatitis C Virus Infected Patients UsingUnidimensional Transient Elastography (Fibroscan®)
http://dx.doi.org/10.5772/52621
227

[18] Lucidarme D, Foucher J, Le Bail B, et al. Factors of accuracy of transient elastography(Fibroscan) for the diagnosis of liver fibrosis in chronic hepatitis C. Hepatology. 2008;49(4): 1083-1089.
[19] Del Poggio P, Colombo S. Is transient elastography a useful tool for screening liverdisease? World J Gastroenterol. 2009; 15(12): 1409-1414.
[20] Nguyen-Khac E, Capron D. Noninvasive diagnosis of liver fibrosis by ultrasonictransient elastography (Fibroscan). Eur J Gastroenterol Hepatol. 2006; 18(12):1321-1325.
[21] Castera L, Forns X, Alberti A. Non-invasive evaluation of liver fibrosis using transi‐ent elastography. J Hepatol. 2008; 48(5): 835-847.
[22] Kettaneh A, Marcellin P, Douvin C, et al. Features associated with success rate andperformance of FibroScan measurements for the diagnosis of cirrhosis in HCV pa‐tients: a prospective study of 935 patients. J Hepatol. 2007; 46(4): 628-634.
[23] Boursier J, Konate A, Guilluy M, et al. Learning curve and interobserver reproduci‐bility evaluation of liver stiffness measurement by transient elastography. Eur J Gas‐troenterol Hepatol. 2008; 20(7): 693-701.
[24] Ziol M, Handra-Luca A, Kettaneh A, et al. Noninvasive assessment of liver fibrosisby measurement of stiffness in patients with chronic hepatitis C. Hepatology. 2005;41(1): 48-54.
[25] Lupsor M, Badea R, Stefanescu H, et al. Analysis of histopathological changes thatinfluence liver stiffness in chronic hepatitis C. Results from a cohort of 324 patients. JGastrointestin Liver Dis. 2008;17(2):155-63.
[26] Castera L, Vergniol J, Foucher J, et al. Prospective comparison of transient elastogra‐phy, Fibrotest, APRI, and liver biopsy for the assessment of fibrosis in chronic hepati‐tis C. Gastroenterology. 2005; 128(2): 343-350.
[27] Sporea I, Sirli R, Deleanu A, et al. Comparison of the liver stiffness measurement bytransient elastography with the liver biopsy. World J Gastroenterol. 2008; 14(42):6513-6517.
[28] Nitta Y, Kawabe N, Hashimoto S, et al. Liver stiffness measured by transient elastog‐raphy correlates with fibrosis area in liver biopsy in patients with chronic hepatitis C.Hepatol Res. 2009; 39(7): 675-684.
[29] Arena U, Vizzutti F, Abraldes J, et al. Reliability of transient elastography for the di‐agnosis of advanced fibrosis in chronic hepatitis C. Gut. 2008; 57(9): 1288-1293.
[30] Kim SU, Jang HW, Cheong JY, et al. The usefulness of liver stiffness measurementusing FibroScan in chronic hepatitis C in South Korea: a multicenter, prospectivestudy. J Gastroenterol Hepatol. 2011; 26(1): 171-178.
Liver Biopsy – Indications, Procedures, Results228

[31] Friedrich-Rust M, Ong MF, Martens S, et al. Performance of transient elastographyfor the staging of liver fibrosis: a meta-analysis. Gastroenterology. 2008; 134(4):960-974.
[32] Stebbing J, Farouk L, Panos G, et al. A meta-analysis of transient elastography for thedetection of hepatic fibrosis. J Clin Gastroenterol. 2010; 44(3): 214-9.
[33] Castera L. Assessing liver fibrosis. Expert Rev Gastroenterol Hepatol. 2008; 2(4):541-552.
[34] Talwalkar JA, Kurtz DM, Schoenleber SJ, West CP, Montori VM. Ultrasound-basedtransient elastography for the detection of hepatic fibrosis: systematic review andmeta-analysis. Clin Gastroenterol Hepatol. 2007; 5(10): 1214-1220.
[35] Lupsor M, Badea R, Stefanescu H, Sparchez Z, Serban A, Feier D. The diagnosis per‐formance of ultrasonic transient elastography for noninvasive assessment of liver fib‐rosis in 1138 chronic hepatitis C patients. Ultrasound in Medicine and Biology 2011;37 (8S): S81.
[36] Foucher J, Chanteloup E, Vergniol J, et al. Diagnosis of cirrhosis by transient elastog‐raphy (FibroScan): a prospective study. Gut. 2006; 55(3): 403-408.
[37] Carrion JA, Navasa M, Bosch J, Bruguera M, Gilabert R, Forns X. Transient elastogra‐phy for diagnosis of advanced fibrosis and portal hypertension in patients with hep‐atitis C recurrence after liver transplantation. Liver Transpl. 2006; 12(12): 1791-1798.
[38] Vizzutti F, Arena U, Romanelli RG, et al. Liver stiffness measurement predicts severeportal hypertension in patients with HCV-related cirrhosis. Hepatology 2007; 45(5):1290-1297.
[39] Lim JK, Groszmann RJ. Transient elastography for diagnosis of portal hypertensionin liver cirrhosis: Is there still a role for hepatic venous pressure gradient measure‐ment? Hepatology 2007; 45(5): 1087-1090.
[40] Castera L, Forns X, Alberti A. Non-invasive evaluation of liver fibrosis using transi‐ent elastography. J Hepatol. 2008; 48(5): 835-847.
[41] Castera L, Le Bail B, Roudot-Thoraval F, et al. Early detection in routine clinical prac‐tice of cirrhosis and oesophageal varices in chronic hepatitis C: Comparison of transi‐ent elastography (FibroScan) with standard laboratory tests and non-invasive scores.J Hepatol 2009; 50(1): 59-68.
[42] Kazemi F, Kettaneh A, N'kontchou G, et al. Liver stiffness measurement selects pa‐tients with cirrhosis at risk of bearing large oesophageal varices. J Hepatol. 2006;45(2): 230-235.
[43] Bureau C, Metivier S, Peron JM, et al. Transient elastography accurately predictspresence of significant portal hypertension in patients with chronic liver disease. Ali‐ment Pharmacol Ther 2008; 27(12): 1261-1268.
Non-Invasive Evaluation of Liver Steatosis, Fibrosis and Cirrhosis in Hepatitis C Virus Infected Patients UsingUnidimensional Transient Elastography (Fibroscan®)
http://dx.doi.org/10.5772/52621
229

[44] Sanyal AJ, Fontana RJ, Di Bisceglie AM, et al. The prevalence and risk factors associ‐ated with esophageal varices in subjects with hepatitis C and advanced fibrosis. Gas‐trointest Endosc. 2006;64(6): 855-864
[45] Thabut D, Trabut JB, Massard J et al. Non-invasive diagnosis of large oesophagealvarices with FibroTest in patients with cirrhosis: a preliminary retrospective study.Liver International 2006; 26(3):271-278
[46] de Franchis R. Noninvasive diagnosis of esophageal varices: is it feasible? Am J Gas‐troenterol 2006; 101(11): 2520-2522
[47] Bosch J. Predictions from a hard liver. J Hepatol. 2006; 45(2): 174-177
[48] Lemoine M, Katsahian S, Ziol M, et al. Liver stiffness measurement as a predictivetool of clinically significant portal hypertension in patients with compensated hepati‐tis C virus or alcohol-related cirrhosis. Aliment Pharmacol Ther. 2008; 28(9):1102-1110
[49] Pinzani M. Non-invasive evaluation of hepatic fibrosis: don't count your chickens be‐fore they're hatched. Gut. 2006; 55(3): 310-312
[50] Masuzaki R, Tateishi R, Yoshida H, et al. Prospective risk assessment for hepatocellu‐lar carcinoma development in chronic hepatitis C patients by transient elastography.Hepatology 2009; 49(6): 1954–1961
[51] Robic MA, Procopet B, Métivier S, Péron JM, Selves J, Vinel JP, Bureau C. Liver stiff‐ness accurately predicts portal hypertension related complications in patients withchronic liver disease: a prospective study. J Hepatol. 2011; 55(5): 1017-1024.
[52] Pinzani M, Vizzutti F, Arena U, Marra F. Technology Insight: noninvasive assess‐ment of liver fibrosis by biochemical scores and elastography. Nat Clin Pract Gastro‐enterol Hepatol. 2008; 5(2): 95-106.
[53] Castera L, Vergniol J, Foucher J, et al. Prospective comparison of transient elastogra‐phy, Fibrotest, APRI, and liver biopsy for the assessment of fibrosis in chronic hepati‐tis C. Gastroenterology 2005; 128(2): 343-350.
[54] Stefanescu H, Grigorescu M, Lupsor M, et al. A New and Simple Algorithm for theNoninvasive Assessment of Esophageal Varices in Cirrhotic Patients Using SerumFibrosis Markers and Transient Elastography. J Gastrointestin Liver Dis 2011; 20(1):57-64
[55] Zhang G, Ha SA, Kim HK, et al. Combined analysis of AFP and HCCR-1 as an usefulserological marker for small hepatocellular carcinoma: A prospective cohort study.Dis Markers 2012; 32: 265-271.
[56] Tateyama M, Yatsuhashi H, Taura N et al. Alpha-fetoprotein above normal levels asa risk factor for the development of hepatocellular carcinoma in patients infectedwith hepatitis C virus. J Gastroenterol 2011; 46: 92-100.
Liver Biopsy – Indications, Procedures, Results230

[57] Nahon P, Kettaneh A, Lemoine M et al. Liver stiffness measurement i n patients withcirrhosis and hepatocellular carcinoma: a case-control study. Eur J GastroenterolHepatol 2009;21:214-9.
[58] Masuzaki R, Tateishi R, Yoshida H, et al. Prospective risk assessment for hepatocellu‐lar carcinoma development in patients with chronic hepatitis C by transient elastog‐raphy. Hepatology 2009; 49: 1954-1961.
[59] Akima T, Tamano M, Hiraishi H. Liver stiffness measured by transient elastographyis a predictor of hepatocellular carcinoma development in viral hepatitis. HepatolRes 2011; 41: 965-970.
[60] Kuo YH, Lu SN, Hung CH. Liver stiffness measurement in the risk assessment ofhepatocellular carcinoma for patients with chronic hepatitis. Hepatol Int 2010; 4:700-706.
[61] Castéra L, Foucher J, Bernard PH et al. Pitfalls of liver stiffness measurement: a 5-year prospective study of 13,369 examinations. Hepatology. 2010; 5: 828-835.
[62] Tapper EB, Cohen EB, Patel K, et al. Levels of Alanine Aminotransferase ConfoundUse of Transient Elastography to Diagnose Fibrosis in Patients with Chronic HCV In‐fection. Clin Gastroenterol Hepatol 2012; DOI: 10.1016/j.cgh.2012.01.015.
[63] Masuzaki R, Tateishi R, Yoshida H, et al. Risk assessment of hepatocellular carcino‐ma in chronic hepatitis C patients by transient elastography. J Clin Gastroenterol.2008; 42(7): 839-843.
[64] Pinzani M. Non-invasive evaluation of hepatic fibrosis: don't count your chickens be‐fore they're hatched. Gut. 2006; 55(3): 310-312.
[65] Carrion JA, Navasa M, Bosch J, Bruguera M, Gilabert R, Forns X. Transient elastogra‐phy for diagnosis of advanced fibrosis and portal hypertension in patients with hep‐atitis C recurrence after liver transplantation. Liver Transpl. 2006; 12(12): 1791-1798.
[66] Rigamonti C, Donato MF, Fraquelli M, et al. Transient elastography predicts fibrosisprogression in patients with recurrent hepatitis C after liver transplantation. Gut2008; 57(6): 821-827.
[67] Adebajo CO, Talwalkar JA, Poterucha JJ, Kim WR, Charlton MR. Ultrasound-basedtransient elastography for the detection of hepatic fibrosis in patients with recurrenthepatitis C virus after liver transplantation: a systematic review and meta-analysis.Liver Transpl. 2012; 18(3): 323-331. doi: 10.1002/lt.22460.
[68] Sandrin L, Oudry J, Bastard C, Fournier C, Miette V, Mueller S. Non-Invasive Assess‐ment of Liver Fibrosis by Vibration-Controlled Transient Elastography (Fibroscan®).Intech: p293-414.
[69] Fraquelli M, Rigamonti C, Casazza G, et al. Reproducibility of transient elastographyin the evaluation of liver fibrosis in patients with chronic liver disease. Gut 2007;56(7): 968-973.
Non-Invasive Evaluation of Liver Steatosis, Fibrosis and Cirrhosis in Hepatitis C Virus Infected Patients UsingUnidimensional Transient Elastography (Fibroscan®)
http://dx.doi.org/10.5772/52621
231

[70] Chan HL, Wong GL, Choi PC, et al. Alanine aminotransferase-based algorithms ofliver stiffness measurement by transient elastography (Fibroscan) for liver fibrosis inchronic hepatitis B. J Viral Hepat. 2009; 16(1): 36-44.
[71] Kim SU, Han KH, Park JY, et al. Liver stiffness measurement using FibroScan is in‐fluenced by serum total bilirubin in acute hepatitis. Liver Int. 2009; 29(6): 810-5.
[72] Arena U, Vizzutti F, Corti G, et al. Acute viral hepatitis increases liver stiffness val‐ues measured by transient elastography. Hepatology. 2008; 47(2): 380-384.
[73] Sagir A, Erhardt A, Schmitt M, Häussinger D. Transient elastography is unreliablefor detection of cirrhosis in patients with acute liver damage. Hepatology. 2008;47(2): 592-595.
[74] Coco B, Oliveri F, Maina AM, et al. Transient elastography: a new surrogate markerof liver fibrosis influenced by major changes of transaminases. J Viral Hepat. 2007;14(5): 360-369.
[75] Cobbold JF, Taylor-Robinson SD. Transient elastography in acute hepatitis: All that'sstiff is not fibrosis. Hepatology. 2008; 47(2): 370-372.
[76] Lupşor M, Badea R, Stefănescu H. Noninvasive evaluation of chronic liver disseasesusing transient elastography (Fibroscan®). In: Present and perspectives in infectiosdiseases. Conference proceedings, July 4-7, 2008.
[77] Panos G, Holmes P, Valero S, Anderson M, Gazzard B, Nelson M. Transient elastog‐raphy, liver stiffness values, and acute hepatopathy. Hepatology. 2008; 47(6): 2140.
[78] Lupsor M. New ultrasound techniques for non-invasive evaluation of chronic liverdiseases. The added value of elastography and computed imaging techniques. Phthesis, University of Medicine and Pharmacy Cluj-Napoca. 2009.
[79] Ziol M, Kettaneh A, Ganne-Carrié N, Barget N, Tengher-Barna I, Beaugrand M. Rela‐tionships between fibrosis amounts assessed by morphometry and liver stiffnessmeasurements in chronic hepatitis or steatohepatitis. Eur J Gastroenterol Hepatol.2009; 21(11): 1261-1268.
[80] Millonig G, Reimann FM, Friedrich S, et al. Extrahepatic cholestasis increases liverstiffness (FibroScan) irrespective of fibrosis. Hepatology. 2008; 48(5): 1718-1723.
[81] Pozzoni P, Prati D, Berzuini A, et al. Liver stiffness values measured by transientelastography are increased in patients with acutely decompensated heart failure. DigLiver Dis. 2009; 41(3): A39.
[82] Lebray P, Varnous S, Charlotte F, Varaut A, Poynard T, Ratziu V. Liver stiffness is anunreliable marker of liver fibrosis in patients with cardiac insufficiency. Hepatology.2008; 48(6): 2089.
[83] Bioulac-Sage P, Couffinhal T, Foucher J, Balabaud CP. Interpreting liver stiffness inthe cirrhotic range. J Hepatol. 2009; 50(2): 423-424.
Liver Biopsy – Indications, Procedures, Results232

[84] Hopper I, Kemp W, Porapakkham P, et al. Impact of heart failure and changes to vol‐ume status on liver stiffness: non-invasive assessment using transient elastography.Eur J Heart Fail. 2012; 14(6): 621-627
[85] Bolognesi M, Boscato N. Spleen and liver cirrhosis: relationship between spleen en‐largement and portal hypertension in patients with liver cirrhosis. In TM Chen. NewDevelopments in Liver Cirrhosis Research. Nova Science Publishers 2006, pp 49-67.
[86] Bolognesi M, Merkel C, Sacerdoti D, Nava V, Gatta A. The role of spleen enlarge‐ment in cirrhosis with portal hypertension. Dig Liver Dis 2002; 34:144-150.
[87] Kuddus RH, Nalesnik MA, Subbotin VM, Rao AS, Gandhi CR. Enhanced synthesisand reduced metabolism of endothelin 1 (ET-1) by hepatocytes – an important mech‐anism of increased endogenous levels of ET-1 in liver cirrhosis. J Hepatol 2000; 33:725-732.
[88] Yin M, Talwalkar JA, Glaser KJ. A Preliminary Assessment of Hepatic Fibrosis withMagnetic Resonance Elastography. Clin Gastroenterol Hepatol. 2007; 5(10): 1207–1213
[89] Talwalkar J. Evaluation of Fibrosis and Portal Hypertension: Non-Invasive Assess‐ment. Oral presentation abstract, Procedings of EASL Monothematic Conference Por‐tal Hypertension: Advances in Knowledge, Evaluation and Management, Budapest,2009, p47.
[90] Stefanescu H, Grigorescu M, Lupsor M, Procopet B, Maniu A, Badea R. Spleen stiff‐ness measurement using fibroscan for the noninvasive assessment of esophagealvarices in liver cirrhosis patients. J Gastroenterol Hepatol 2011; 26: 164-170.
[91] Colecchia A, Montrone L, Scaioli E, et al. Measurement of Spleen Stiffness to Evalu‐ate Portal Hypertension and the Presence of Esophageal Varices in Patients WithHCV-Related Cirrhosis. Gastroenterology 2012; 143(3): 646-654.
[92] Sasso M, Beaugrand M, de Ledinghen V, et al. Controlled attenuation parameter(CAP): a novel VCTE™ guided ultrasonic attenuation measurement for the evalua‐tion of hepatic steatosis: preliminary study and validation in a cohort of patients withchronic liver disease from various causes. Ultrasound Med Biol. 2010; 36(11):1825-1835.
[93] Sasso M, Miette V, Sandrin L, Beaugrand M. The controlled attenuation parameter(CAP): a novel tool for the non-invasive evaluation of steatosis using Fibroscan. ClinRes Hepatol Gastroenterol. 2012; 36(1): 13-20.
[94] de Lédinghen V, Vergniol J, Foucher J, Merrouche W, le Bail B. Non-invasive diagno‐sis of liver steatosis using controlled attenuation parameter (CAP) and transient elas‐tography. Liver Int. 2012; 32(6) :911-918.
[95] Myers RP, Pollett A, Kirsch R, et al. Controlled Attenuation Parameter (CAP): a non‐invasive method for the detection of hepatic steatosis based on transient elastogra‐phy. Liver Int. 2012; 32(6): 902-910.
Non-Invasive Evaluation of Liver Steatosis, Fibrosis and Cirrhosis in Hepatitis C Virus Infected Patients UsingUnidimensional Transient Elastography (Fibroscan®)
http://dx.doi.org/10.5772/52621
233
[96] Sasso M, Tengher-Barna I, Ziol M, et al. Novel controlled attenuation parameter fornoninvasive assessment of steatosis using Fibroscan(®): validation in chronic hepati‐tis C. J Viral Hepat. 2012; 19(4): 244-253.
[97] Lupsor M, Badea R, Stefanescu H, Feier D, Tamas A, Sparchez Z. The performance ofcontrolled attenuation parameter (CAP) for the non-invasive evaluation of steatozisusing Fibroscan. Preliminary results. J Hepatolol 2012: 56: S514.
[98] Blanc JF, Bioulac-Sage P, Balabaud C, Desmouliere A. Investigation of liver fibrosis inclinical practice. Hepatol Res. 2005; 32(1): 1-8.
[99] Kelleher TB, Afdhal N. Noninvasive assessment of liver fibrosis. Clin Liver Dis. 2005;9(4): 667-683.
[100] Ganne-Carrie N, Ziol M, de Ledinghen V, et al. Accuracy of liver stiffness measure‐ment for the diagnosis of cirrhosis in patients with chronic liver diseases. Hepatology2006; 44(6): 1511-1517.
[101] Foucher J, Castera L, Bernard PH, et al. Prevalence and factors associated with failureof liver stiffness measurement using FibroScan in a prospective study of 2114 exami‐nations. Eur J Gastroenterol Hepatol. 2006; 18(4): 411-412.
[102] Castera L. Non-invasive diagnosis of steatosis and fibrosis. Diabetes Metab. 2008;34(6 Pt 2): 674-679.
[103] De Ledinghen V, Fournier C, Foucher J, et al. New Fibroscan probe for obese pa‐tients. A pilot study of feasibility and performances in patients with BMI≥30 kg/m2. JHepatol 2009; 50(1): S359.
Liver Biopsy – Indications, Procedures, Results234

Chapter 11
Computer Image Analysis of Liver Biopsy Specimens inPatients with Heroin Abuse and Coinfection(Tuberculosis, HCV, HIV)
Ivan B. Tokin, Ivan I. Tokin and Galina F. Filimonova
Additional information is available at the end of the chapter
http://dx.doi.org/10.5772/52971
1. Introduction
The computer morphometry in histopathology is оnе of the most perspective directions incontemporary medicine including the hepatopathology. The potential advantages of meas‐urement in histopathology have been recognized for many years [1]. The quantitative esti‐mation has several advantages over conventional visual assessment such as objectivity andreproducibility [2]. The employment of modern optical equipment and special computerprograms creates the possibilities for significant acceleration of quantitative analysis.
At present the computer morphometry has been rather intensively used to study liverchanges of the patients with chronic viral hepatitis. The quantitative assessment of the fibro‐sis was performed mainly in chronic virus hepatitis C [3, 4, 5, 6, 7. 8, 9].
Many investigators considered that the quantitative evaluation of hepatic fibrosis was most‐ly useful for assessing the origin, location and the stage of fibrosis. Using the morphometricanalysis is also very important for the correct evaluation of repeated biopsies [10]. Some in‐vestigators studied the changes in liver fibrosis after the interferon therapy [11, 12, 13]. Thistechnique can be used in future for therapeutic trials by the estimation of the agents inhibit‐ing the fibrosis progression [7].
Rates of fibrosis progression differ markedly in patients with HIV/HCV co-infection [14, 15,16]. The natural history of hepatitis C virus infection in tuberculosis and in human immuno‐deficiency virus-infected patients has never been studied with the use of the computer mor‐phometric analysis of liver fibrosis progression. In this chapter the changes of liver biopsiesin patients with heroin abuse and infected by hepatitis C virus (HCV), human immunodefi‐
© 2012 Tokin et al.; licensee InTech. This is an open access article distributed under the terms of the CreativeCommons Attribution License (http://creativecommons.org/licenses/by/3.0), which permits unrestricted use,distribution, and reproduction in any medium, provided the original work is properly cited.

ciency virus (HIV), pulmonary tuberculosis (TB) were studied by the morphological andcomputer morphometric analysis.
2. Patients and methods
2.1. Patients
13 male patients with co-infection of pulmonary tuberculosis (TB), chronic viral hepatitis C(HCV) and human immunodeficiency virus (HIV) were investigated during the study. Allthe patients used also the injections of heroin (Table 1).
The patients started their history as a rule from heroin using (mean duration – 9.5 years) andlater all of them acquired HCV (mean duration – 7.1 years), HIV (mean duration – 4.7 years)and TB at last (the duration of TB infection of the most part of patients was less than 1 year).
The diagnosis was established after careful examination of the patients: the anamneses ofdiseases and life, laboratory analyses, virological and morphological studies. Serum level ofalanine aminotransferase (ALT) and aspartate aminotransferase (AST) was expressed. Theupper limit of normal (ULN) of ALT was 41 U/L, AST – 31 U/L.
2.2. Histological evaluation
To refine the diagnosis as well as for detection of the activity of pathological processes in theliver, aspiration biopsy was taken from all the patients. All liver biopsies were performed tothe routine medical follow up program, using the standard Menghini procedure [17, 18].Criteria for adequacy of the biopsy specimens included a core length of 10 mm and at least5-6 portal tracts. So, only 9 biopsy specimens were used for further histological evaluation.Four biopsy specimens were fragmented and weren’t used (Table 1). Samples were formal‐in-fixed and paraffin-embedded. Serial paraffin sections were cut at 5 mcm. Hematoxylin-eosin and tolluidine blue stains were used.
Each biopsy for necro-inflammatory activity and fibrosis was assessed by two hepatologists.Knodell Histology Activity Index (HAI) was used to grade histopathological lesions [19].HAI was graded as minimal (scores 1–3), mild (scores 4–8), moderate (scores 9–12), or severehepatitis (scores 13–18). METAVIR group scoring system was used for detecting the stage offibrosis [20]. Fibrosis was staged on the scale from F0 to F4, as follows: F0 = no fibrosis, F1 =portal fibrosis without septa, F2 = few septa, F3 = numerous septa without cirrhosis, F4 = cir‐rhosis. Only single patient showed any signs of cirrhosis. Fibrosis was also staged by Ishakscoring system[21]. In the Ishak scoring system interface hepatitis (piecemeal necrosis), focalnecrosis in the lobule, portal inflammation were scored from 0 to 4, incomplete cirrhosis(bridging necrosis with occasional nodules) and cirrhosis were scored from 5 to 6.
Liver Biopsy - Indications, Procedures, Results236

Patient
number Sex Age (years)
Biopsy
number in
next tables
Duration of infections (years) Duration of
heroin
abuse
(years)TB HCV HIV
1 male 26 1 1 8 1 7
2 male 26 fragment 1 11 11 11
3 male 27 7 1 1 1 3
4 male 31 8 1 5 5 8
5 male 31 fragment 1 2 2 4
6 male 32 fragment 10 1 8 17
7 male 33 9 12 9 13 15
8 male 33 3 1 1 1 8
9 male 34 6 3 18 3 unknown
10 male 34 2 1 7 8 11
11 male 36 fragment 8 13 1 13
12 male 37 4 5 1 1 10
13 male 39 5 1 16 6 16
Table 1. Characteristics of patients with heroin abuse and co-infection of TB, HCV, HIV. The patients are arrangedaccording to their age.
2.3. Computer digital analysis
Quantitative morphometric analysis was performed using an image analysis system consist‐ing of a microscope (Leica DM 2500) with attached digital camera (Leica DFC 320 R2) and acomputer. Serial pictures of biopsy slices of patients with co-infection were photographedby light microscope and were saved electronically. Serial microphotographs of biopsieswere made by an objective x20. The further process was performed with the computer pro‐gram Adobe Photoshop CS 5.0. Serial microphotographs were mounted to receive the gener‐al picture of liver biopsy (Figure 1). The digital image was converted into a binary image.The two-dimensional patterns were measured by direct pixels counting on the binary im‐ages under simultaneous visual control of the light microscopy.
Figure 1. General picture of the liver biopsy composed by computer microscopy (Obj. x20) using Adobe Photoshop CS5.0. Total area of the biopsy is 11449177 pixels
Three main parameters were used for quantitative evaluation: the total area of portal zones,the total area of intralobular infiltrates and necroses, as well as the total area of hepatic
Computer Image Analysis of Liver Biopsy Specimens in Patients with Heroin Abuse and Coinfection ...http://dx.doi.org/10.5772/52971
237

vessels (central and sublobular veins). We considered the total amount of these main param‐eters as non-parenchymal elements. Liver plates and sinusoids were attributed to the hep‐atic parenchyma.
The measurement of portions (in percentages) of portal area, foci of intralobular necroses,and vessels was estimated.
2.4. Statistical analysis
Statistical analysis was performed by tabulated processor Microsoft Excel 2003 and STA‐TISTIKA 9.0.
3. Results
3.1. Features of histopathological structure of biopsies
Morphological analysis of liver biopsies of the patients – heroin addicts with tuberculosis(TB) and virus (HCV, HIV) co-infection showed that the extension of portal zones, the dam‐age of limiting plates of liver cells and the formation of piecemeal and bridging necrosestook place practically in all biopsies (Figure 2).
Figure 2. Subfigure with two images. Section of the liver biopsy specimen of a patient with co-infection (TB, HCV, HIV)and heroin abuse. Variants (a, b) of the development of interface hepatitis with piecemeal necrosis at the peripheralzone of portal tract. Hematoxylin-eosin. Obj. x40
The peripheral regions of the portal zones were usually densely infiltrated by lymphocytesand mononuclear histiocytes (Figure 2). Sometimes the lymphoid aggregates adjacent to thedamaged bile ducts were formed. Dense connective tissue elements developed more oftenaround the portal vessels (portal veins and hepatic arteries).
Liver Biopsy - Indications, Procedures, Results238

The appearance of focal lymphohistiocyte infiltrates and the formation of numerous intra‐lobular necroses, containing hepatocytes, surrounded by lymphocytes (encircled hepato‐cytes) were typical to peripheral and middle zones of liver lobules (Figure 3).
Figure 3. Subfigure with two images. Section of the liver biopsy specimen of a patient with co-infection (TB, HCV, HIV)and heroin abuse. Variants (a, b) of the development of intralobular necroses containing encircled hepatocytes at themiddle part of liver lobule. Hematoxylin-eosin. Obj. x40
In the liver parenchyma the narrowing of sinusoids, as without of inflammatory infiltrationsigns and with the elements of lymphohistiocyte infiltration and chains of lymphocytes in‐side of them, was predominated (Figure 4).
There were features of moderate protein and vacuole dystrophia in all biopsies. In two casessome hepatocytes contained large lipid inclusions (Figure 5). Disturbance of the lobular ar‐chitecture was observed only in one biopsy (Figure 6).
Computer Image Analysis of Liver Biopsy Specimens in Patients with Heroin Abuse and Coinfection ...http://dx.doi.org/10.5772/52971
239

Figure 4. Section of the liver biopsy specimen of a patient with co-infection (TB, HCV, HIV) and heroin abuse. Severeinfiltration of intralobular sinusoids by lymphocytes and histiocytes at the peripheral zone of liver lobule. Hematoxylin-eosin. Obj. x20
Figure 5. Section of the liver biopsy specimen of a patient with co-infection (TB, HCV, HIV) and heroin abuse. Expan‐sion and infiltration of portal areas, presence of intralobular necroses at the middle zone of liver lobules, deposition oflipid droplets were in some hepatocytes. Hematoxylin-eosin. Obj. x10
Liver Biopsy - Indications, Procedures, Results240

Figure 6. Section of the liver biopsy specimen of a patient with co-infection (TB, HCV, HIV) and heroin abuse. Strongdevelopment of bridging fibroses and disturbance of the lobular architecture. Hematoxylin-eosin. Obj. x10
3.2. Quantitative image analysis for evaluation of pathological changes in liver biopsystructure
Quantitative computer image morphometric analysis included three indexes. We calculatedseparately the square (in pixels) occupied by portal zones, the square of intralobular focalinfiltrates and necroses and the square of hepatic vessels (central and sublobular veins).
The portal areas were divided into two groups: the portal zones with primary formation ofpiece-meal necroses and the portal zones with primary formation of bridging necroses. Wetook into account the calculation of portal zones fragments and septa. We also subdividedthe intralobular damages in liver in two groups: the focal lymphohistiocyte infiltrates with‐out hepatocytes and the intralobular piecemeal necroses with encircled hepatocytes.
As for hepatic vein, we separately considered terminal hepatic veins (central veins) and sub‐lobular veins. In each case we estimated the relative square of the above-mentioned indexesin pixels and then calculated the specific parts in percents to the total square of biopsy.
We assigned the total sum of a specific part of portal zones, the specific part of intralobularfocal infiltrates and necroses and the specific part of the hepatic veins as non-parenchymalelements. Respectively, the hepatic plates and sinusoids were remained in the compositionof the parenchyma.
Then we calculated the parenchyma indexes as the relation of non-parenchymal elements tothe parenchyma; these indexes characterized a certain degree of the replacement of the func‐tioning hepatic tissue.
Computer Image Analysis of Liver Biopsy Specimens in Patients with Heroin Abuse and Coinfection ...http://dx.doi.org/10.5772/52971
241

The data obtained were summarized in the Tables 2, 4, 5, 6 and 7. The samples of biopsieswere arranged in sequence of increasing of non-parenchymal elements in bioptats.
The control group included the analysis of cohort of the patients with the monoinfection ofchronic virus hepatitis C (Table 3). The morphometric analysis of liver structure of the pa‐tients belonging to given group was made earlier with the use of the method of the stereo‐metric point morphometry [8].
3.2.1. The general characterization of morphometric data
The analysis showed that the specific part of non-parenchymal elements strongly varied inthe group of the patients with co-infection and heroin abuse: from 2.65% to 27.43% (Table 2).Mean value of non-parenchymal elements was 12.08±2.38. The specific part of non-paren‐chymal elements varied in cases of monoinfection of hepatitis C with the different degree ofactivity from 2.16% до 11.93%, the mean value was 6.94±0.77. Thus, the mean value of non-parenchymal elements of liver biopsy of the patients – heroin addicts with co-infection ex‐ceeded the mean value of non-parenchymal elements in liver biopsy of the patients withmonoinfection of hepatitis C (HСV) in 1.74 times. The maximal value of the specific part ofnon-parenchymal elements in case of co-infection was in 2.29 times higher than in cases ofmonoinfection HCV (Tables 2 and 3).
Biopsy
number
Parenchymal
elements, %
Non-parenchymal
elements, %
Ratio of non-
parenchymal
elements
Total area
of portal
zones, %
Total area
of spotty
infiltrates ,
%
Total area
of hepatic
veins, %
Chains of
lymphocytes
(absent or
present)
1 97,35 2,65 0,03 1,86 0,52 0,27 -
2 93,39 6,71 0,07 5,80 0,74 0,17 +
3 93,07 6,93 0,07 6,43 0,21 0,27 -
4 90,73 9,27 0,10 7,59 1,33 0,35 +
5 90,52 9,48 0,10 7,93 0,46 1,08 -
6 88,87 11,13 0,13 10,41 0,37 0,35 +
7 83,72 16,28 0,19 14,52 1,53 0,53 +
8 81,19 18,81 0,23 17,99 0,75 0,07 +
9 72,57 27,43 0,38 27,16 0,31 0 +
Table 2. Quantitative characteristics of liver biopsy specimens of patients with heroin abuse and co-infection of TB,HCV and HIV by computer morphometric analysis
Liver Biopsy - Indications, Procedures, Results242

Biopsy
numbe
r
ALT
activity
(U/L)
Total area
of
morphomet
ry (points
of
intersection
s)
Total
number
of
microsco
pic
fields(SU)
(x400)
Parenchy
mal
elements,
%
Non-
parenchy
mal
elements
, %
Ratio of
non-
parenchy
mal
elements
Total area
of portal
area, %
Total area
of spotty
infiltrates
,%
Total area
of hepatic
veins, %
Chains of
lymphocy
tes
(absent
or
present)
1 15, 29450 95 97,84 2,16 0,02 1,79 0,05 0,32 -
2 20 18910 61 97,54 2,46 0,03 2,00 0,25 0,21 -
3 57 37690 126 96,49 3,51 0,04 2,30 0,46 0,75 -
4 14 17980 58 96,40 3,60 0,04 3,18 0,01 0,42 -
5 26 46190 149 95,70 4,30 0,04 3,15 0,12 1,02 -
6 104 70060 226 95,37 4,63 0,05 3,25 0,30 1,09 -
7 15 86800 280 95,30 4,70 0,05 2,91 0,02 1,77 -
8 42 37820 122 94,94 5,06 0,05 3,81 0,26 1,00 -
9 35 80290 259 94,82 5,18 0,05 3,93 0,84 0,41 +
10 441 89900 290 93,36 6,64 0,07 3,29 2,02 1,32 +
11 214 54560 176 91,33 8,67 0,09 7,24 0,89 0,55 -
12 187 70680 228 90,54 9,46 0,10 7,57 1,76 0,13 +
13 333 47720 152 90,32 9,68 0,11 7,51 1,17 1,00 -
14 107 32860 106 90,29 9,71 0,11 8,32 1,02 0,37 -
15 38 53514 193 89,44 10,56 0,12 6,23 2,61 1,71 +
16 122 49600 160 89,11 10,89 0,12 9,07 1,27 0,54 +
17 596 75330 243 88,24 11,76 0,13 9,26 1,56 0,94 +
18 162 60760 196 88,07 11,93 0,14 11,49 0,44 0,00 +
Table 3. Quantitative characteristics of liver biopsy specimens of the patients with monoinfection of chronic hepatitisC by stereometric point morphometry
We made the comparative analysis of histopathological changes in liver biopsy structure inthe group of the patients – heroin addicts and co-infected using the standard semi quantita‐tive methods of the Ishak score evaluation (Table 4).
We determined the histological activity index HAI according to Knodell [19]. The stages ofthe fibrosis development were defined by two ways: with the use of the research groupFrench METAVIR [20] recommendations and with Ishak method [21]. Under the METAVIRsystem we evaluated the fibroses using five indexes where the maximal evaluation was 4scores (F4 – cirrhosis). It consisted 6 scores (F6 – cirrhosis) according the Ishak system.
Computer Image Analysis of Liver Biopsy Specimens in Patients with Heroin Abuse and Coinfection ...http://dx.doi.org/10.5772/52971
243
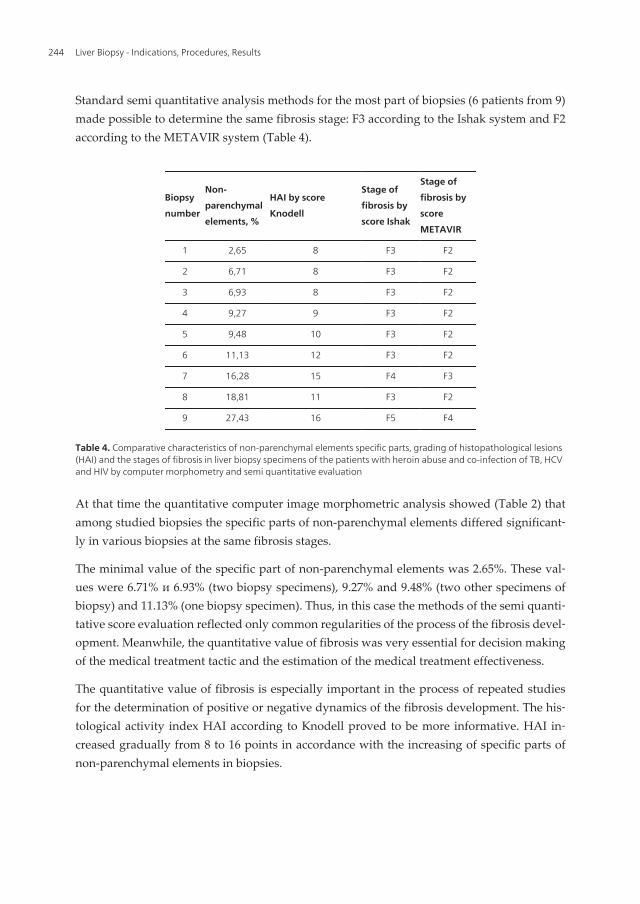
Standard semi quantitative analysis methods for the most part of biopsies (6 patients from 9)made possible to determine the same fibrosis stage: F3 according to the Ishak system and F2according to the METAVIR system (Table 4).
Biopsy
number
Non-
parenchymal
elements, %
HAI by score
Knodell
Stage of
fibrosis by
score Ishak
Stage of
fibrosis by
score
METAVIR
1 2,65 8 F3 F2
2 6,71 8 F3 F2
3 6,93 8 F3 F2
4 9,27 9 F3 F2
5 9,48 10 F3 F2
6 11,13 12 F3 F2
7 16,28 15 F4 F3
8 18,81 11 F3 F2
9 27,43 16 F5 F4
Table 4. Comparative characteristics of non-parenchymal elements specific parts, grading of histopathological lesions(HAI) and the stages of fibrosis in liver biopsy specimens of the patients with heroin abuse and co-infection of TB, HCVand HIV by computer morphometry and semi quantitative evaluation
At that time the quantitative computer image morphometric analysis showed (Table 2) thatamong studied biopsies the specific parts of non-parenchymal elements differed significant‐ly in various biopsies at the same fibrosis stages.
The minimal value of the specific part of non-parenchymal elements was 2.65%. These val‐ues were 6.71% и 6.93% (two biopsy specimens), 9.27% and 9.48% (two other specimens ofbiopsy) and 11.13% (one biopsy specimen). Thus, in this case the methods of the semi quanti‐tative score evaluation reflected only common regularities of the process of the fibrosis devel‐opment. Meanwhile, the quantitative value of fibrosis was very essential for decision makingof the medical treatment tactic and the estimation of the medical treatment effectiveness.
The quantitative value of fibrosis is especially important in the process of repeated studiesfor the determination of positive or negative dynamics of the fibrosis development. The his‐tological activity index HAI according to Knodell proved to be more informative. HAI in‐creased gradually from 8 to 16 points in accordance with the increasing of specific parts ofnon-parenchymal elements in biopsies.
Liver Biopsy - Indications, Procedures, Results244

3.2.2. Computer image analysis of portal zones
The majority of non-parenchymal elements were situated in portal zones. Therefore these in‐dexes were analyzed in details (Table 5).
Biopsy
number
Total
area of
non-
parenchy
mal
elements,
%
Total area of
portal zonesPortal area with piecemeal necroses Portal area with bridging necroses
%
Number
per
biopsy
Total
area, %
Number
per
biopsy
Minimal
size, %
Maximal
size, %
Total
area, %
Number
per biopsy
Minimal
size, %
Maximal
size, %
1 2,65 1,86 5 0,00 0 0 0 1,86 5 0,14 0,99
2 6,71 5,80 13 2,98 5 0,10 0,86 2,82 8 0,10 1,23
3 6,93 6,43 7 0,18 2 0,06 0,12 6,25 5 0,01 3,93
4 9,27 7,59 9 4,94 4 0,16 2,38 2,65 5 0,14 0,97
5 9,48 7,93 8 4,89 4 0,90 1,45 3,04 4 0,37 1,35
6 11,13 10,41 12 0,62 2 0,19 0,42 9,79 10 0,16 2,92
7 16,28 14,52 12 1,13 2 0,47 0,66 13,39 10 0,12 4,51
8 18,81 17,99 5 7,92 4 1,17 3,37 10,07 1 0,01 10,07
9 27,43 27,16 18 11,17 8 0,25 2,39 15,96 10 0,17 4,34
Table 5. Quantitative characteristics of portal zones in liver biopsy specimens of the patients with heroin abuse andco-infection of TB, HCV and HIV by computer morphometric analysis
The amount of portal zones studied in each biopsy varied from 5 to 18. It depended on thetotal biopsy volume. The mean value of the portal zones number was 9.8 9±1.34. Theamount of portal zones with piecemeal necroses varied from 2 to 8 (mean value was3.44±0.72). The amount of portal zones with the septa and bridging necroses was more sig‐nificant, it changed from 1 to 10 (mean value was 6.44±1.01).
In one case (biopsy specimen № 8) the portal zone included several portal tracts forming theextensive confluent bridging necrosis.Thus, the amount of portal zones with bridging ne‐croses (6.44) exceeded in 1.87 times the amount of portal zones with piecemeal necroses (3.44).
The total specific part of portal zones varied from 1.86% to 27.16% (mean value was11.08±2.42) (Table 5).
The specific part of portal zones with piecemeal necroses varied from 0.18% to 11.17%(mean value was 3.76±1.21). The minimal size of such portal zones characterized mainly itsfragment, it changed from 0.06% to 0.9% (mean value is 0.37±0.13). The maximal sizes ofsuch portal zones characterized in general the degree of the portal zone extension, theychanged from 0.12% to 3.37% (mean value was 1.29±0.37).
Computer Image Analysis of Liver Biopsy Specimens in Patients with Heroin Abuse and Coinfection ...http://dx.doi.org/10.5772/52971
245

The specific part of the portal zones with bridging necroses (Table 5) changed from1.86% to15.96% (mean value was 7.31±1.63). Thus, the specific part of portal zones with bridging ne‐croses was practically in 2 times (1.94) more than the specific part of portal zones with piece‐meal necroses.
The minimal size of portal zones with bridging necroses characterized in general the septafragments, it changed from 0.01% to 0.37% (mean value was 0.13±0.03). The maximal sizereflected more correctly the specific part of the portal zones with bridging necroses, itchanged from 0.97% to 10.07% (mean value was 3.37±0.91).
The quantitative computer image morphometric analysis showed that the significant exten‐sion of portal zones with the destruction of the limiting plate and the development of piece‐meal or bridging necroses took place in all bioptats of this patients group. In addition thespecific part of portal zones with bridging necroses exceeded considerably (in 1.9 times) thespecific part of portal zones with piecemeal necroses.
For comparison: the total specific part of portal zones changed from 1.79% tо 11.49% (mеanvalue was 5.35±0.68) at chronic hepatitis C monoinfection (Table 3).
Thus, the specific part of portal zones of liver biopsies of the patients – heroine addicts withtuberculosis and virus (HCV, HIV) co-infection was 2.07 times higher than the specific partof portal zones of liver biopsies of the patients with the monoinfection HCV.
Moreover the bridging and piecemeal necroses were absent in the liver of the patients withmonoinfection HCV under minimal and low activity. Their appearance was noticed only if
the value of specific parts of non-parenchymal elements exceeded 4.7%.
We have not observed any difference between the amounts of piecemeal and bridging ne‐croses in biopsy specimens with monoinfection HCV.
3.2.3. Сomputer image analysis of intralobular infiltrates and necroses
We analyzed the morphometric indexes of intralobular infiltrates and necroses (Table 6).
Intralobular necroses presented in all biopsies, their number varied from 6 to 38 (mean valuewas 16.33±3.42). The amount of focal intralobular lymphohistiocyte infiltrates was signifi‐cantly less in comparison with the intralobular necroses containing encircled hepatocytes.
The total number of focal intralobular infiltrates varied in different biopsies from 1 to 11(mеan value was 3.67±1.09), whereas the total number of intralobular piecemeal necrosesvaried from 4 to 28 (mеan value was 12.78±2.5).
The relation between piecemeal necroses and focal intralobular infiltrates was especially de‐monstrative (Table 6). The number of piecemeal necroses in each biopsy was in severaltimes more (up to 10 times) than the number of focal necroses. The total number of intralob‐ular piecemeal necroses was 115, whereas the number of focal intralobular infiltrates wasonly 33, i.e. in 3.48 times less.
Liver Biopsy - Indications, Procedures, Results246

Biopsy
number
Total
area of
non-
parenc
hymal
elemen
ts, %
Total
area of
intralob
ular
necrose
s, %
Total
number
of
intralob
ular
necrose
s per
biopsy
Focal lymphohistiocyte infiltratesIntralobular necroses with encircled
hepatocytes (piecemeal necroses)
Total
area ,%
Total
number
per
biopsy
Minimal
size, %
Maximal
size, %
Total
area, %
Total
number
per
biopsy
Minimal
size, %
Maximal
size, %
1 2,65 0,52 8 0,01 1 0,01 0,01 0,51 7 0,04 0,18
2 6,71 0,74 22 0,03 6 0 0,01 0,71 16 0,02 0,11
3 6,93 0,21 6 0,05 2 0,02 0,04 0,16 4 0,02 0,08
4 9,27 1,33 28 0,09 6 0,01 0,02 1,24 22 0,02 0,25
5 9,48 0,46 10 0,01 1 0,01 0,01 0,45 9 0,02 0,12
6 11,13 0,37 16 0,03 3 0,01 0,01 0,34 13 0,01 0,06
7 16,28 1,53 38 0,10 11 0,01 0,08 1,52 28 0,01 0,36
8 18,81 0,75 10 0 0 0 0 0,75 10 0,06 0,11
9 27,43 0,31 9 0,04 3 0,01 0,02 0,28 6 0,03 0,06
Table 6. Quantitative characteristics of intralobular necroses in the liver biopsy specimens of the patients with heroinabuse and co-infection of TB, HCV and HIV by computer morphometric analysis
The total specific part of intralobular necroses varied from 0.21% to 1.53% (mеan value was0.69±0.14). The specific part of the focal intralobular infiltrates varied from 0.01% to 0.1%(mеan value was 0.04±0.01). The size of the minimal infiltrate was only 0.01%, the size of themaximal infiltrate was 0.08% (mеan value was 0.02±0.01).
The total specific part of intralobular piecemeal necroses varied from 0.16% to 1.52% (mеanvalue was 0.66±0.14). The minimal size of the specific part of intralobular piecemeal necroseswas 0.01% (mеan value was 0.03±0.01), whereas their maximal size was 0.36 % (mеan valuewas 0.15±0.02).
The analysis of the total biopsy specimen (Figure 1) allowed attributing the topography ofthe intralobular necroses distribution. Thus, under the middle degree of the parenchyma in‐jury (HAI according to Knodell system up to 10 points) the small lymphohistiocyte infil‐trates dominated in periportal zones of lobules. Under the high activity of the process (HAIaccording to Knodell scoring system exceeded 10 points) the large piecemeal necroses domi‐nated, they arranged mainly in the middle zones of lobules.
Hepatocytes surrounded by lymphocytes were well noticeable in large piecemeal necroses(Figure 3b); it is perhaps connected with hepatocytes death, mediated by lymphocytes.
It is typically that the inflammatory infiltration of sinusoids and the formation “chains” oflymphocytes in them are mostly expressed in large piecemeal necroses (Figure 4).
Computer Image Analysis of Liver Biopsy Specimens in Patients with Heroin Abuse and Coinfection ...http://dx.doi.org/10.5772/52971
247

So, the histological activity index HAI according to Knodell reached 15 points, the totalnumber of intralobular necroses reached 38 (28 from them were referred to piecemeal ne‐croses) in the biopsy № 7 (Tables 4 and 6). Remarkably that during the cirrhosis develop‐ment (biopsy № 9, fibrosis stage according to the METAVIR system scale was F4 – cirrhosis)the total number of intralobular necroses considerably reduced (6 piecemeal necroses and 3focal infiltrates in one large biopsy; see Figure 6).
3.2.4. Computer image analysis of hepatic vessels
The amount of venous vessels in biopsy samples varied from 2 to 7 (mean value was3.33±0.63). The central veins with endothelium which are often damaged predominated inall biopsies (Table 7).
Biopsy
number
Total
area of
non-
parenc
hymal
elemen
ts, %
Total
area of
hepatic
vessels ,
%
Total
number
of
hepatic
vessels
per
biopsy
Terminal hepatic veins (central
veins)Sublobular veins
Total
area ,%
Number
per
biopsy
Minimal
size , %
Maximal
size, %
Total
area, %
Number
per
biopsy
Minimal
size, %
Maximal
size, %
1 2,65 0,27 4 0,27 4 0,09 0,11 0 0 0 0
2 6,71 0,17 2 0,17 2 0,03 0,14 0 0 0 0
3 6,93 0,27 3 0,27 3 0,03 0,18 0 0 0 0
4 9,27 0,35 4 0,35 4 0,07 0,11 0 0 0 0
5 9,48 1,08 5 0,13 4 0,02 0,05 0,95 1 0,95 0,95
6 11,13 0,35 7 0,35 7 0,01 0,11 0 0 0 0
7 16,28 0,53 3 0 0 0 0 0,53 3 0,04 0,31
8 18,81 0,07 2 0,07 2 0,03 0,04 0 0 0 0
9 27,43 0 0 0 0 0 0 0 0 0 0
Table 7. Quantitative characteristics of hepatic vessels in liver biopsy specimens of the patients with heroin abuse andco-infection of TB, HCV and HIV by computer morphometric analysis
Sublobular veins were observed only in two biopsies, perhaps they did not get into biopsiesbecause of large sizes in comparison with central veins.
The total specific part of the hepatic vessels varied from 0.07% to 1.08% (mean value was0.34±0.1). The specific part of the central veins varied from 0.17% tо 0.35% (mean value was0.18±0.04). The minimal size of the central vein was 0.01% (mean value was 0.03±0.01), themaximal size was 0.18% (mean value was 0.08±0.02). The specific part of sublobular veinsreached 1.48%, maximal size – 0.95%.
Liver Biopsy - Indications, Procedures, Results248

On the whole it is possible to note the tendencies to the stable extension of vessels and the
damage of its internal walls. In addition, the sharp narrowing of intralobular sinusoids adja‐cent to above mentioned vessels, took part in the contribution of the impairment of the proc‐esses of the microcirculation inside of liver lobules. Perhaps the worsening ofmicrocirculation lead to the bypass ways of the circulation, this may be one of the reasons ofbridging necroses development.
3.3. Investigation of activity of alanin aminotransferase (ALT) and aspartateaminotransferase (AST)
The measurement of liver enzyme activities (serum ALT and AST) are important for diagno‐sis and assessment of liver diseases in clinical practice. However, ALT levels fluctuate inchronic HCV infection and may fall into the normal range [22].The use of many medicationshave been associated with elevated ALT levels [23]. In chronic hepatocellular injury, ALT in‐creasing is more typical than AST. However, when the fibrosis progresses, ALT activity typ‐ically declines, and the ratio of AST to ALT gradually increases [24], especially during thedevelopment of cirrhosis [25,26].
We observed the increasing of the ALT and AST levels practically among all the patients(Table 8).
Biopsy
number
Activity of
ALT (U/L)Activity of AST (U/L)
Ratio of
AST/ALT
1 90 48 0,53
2 36 32 0,88
3 45 42 0,93
4 140 90 0,64
5 162 179 1,10
6 48 39 0,81
7 90 68 0,75
8 88 93 1,05
9 106 84 0,79
Table 8. Activity of serum alanine aminotransferase (ALT) and aspartate aminotransferase (AST) in liver biopsyspecimens of the patients with heroin abuse and co-infection of TB, HCV and HIV
So, the ALT level changed from 36 to 162 points (mean value was 89.4±13.45). The AST levelvaried from 32 to179 points (mean value was 75±14.25). The AST/ALT ratio varied from 0.53to 1.10 points (mean value was 0.83±0.06).
The mostly expressed increase of ALT and AST levels was discovered in the patients withthe samples of biopsy having the specific part of non-parenchymal elements up to 10% (Ta‐
Computer Image Analysis of Liver Biopsy Specimens in Patients with Heroin Abuse and Coinfection ...http://dx.doi.org/10.5772/52971
249

ble 8, samples of biopsies № 4 and № 5). As a rule the ferment activity rather reduced underthe fibrosis intensification. The AST/ALT ratio was increased in 3 patients. In other cases itwas closer to the upper border of the normal level.
We have not discovered any direct interconnections between the ferment activity levels andthe sizes of the specific parts of intralobular necroses. The intralobular piecemeal necroseswere dominant in this group of the patients; perhaps, the hepatocytes destruction wascaused by the special mechanism of the cell death (apoptosis).
4. Discussion
Detailed information about natural history of HIV/HCV co-infection is discussed in specialreview article [27]. Some studies have suggested that human immunodeficiency infectionmodifies the natural history of hepatitis C virus infection accelerating the progression of fib‐rosis and the development of cirrhosis [28, 29, 30, 31].
Co-infection HCV/HIV is very often discovered among injecting drug users [32, 33]. Thus, itwas shown that about 90% drug users (consumers of heroin) are infected by hepatitis C vi‐rus [34]. Intravenous heroin abuse induces significant morphological changes in liver tissue(vesicular changes, fatty changes, chronic hepatitis, cirrhosis), and the severity of thesechanges increases with years of heroin abuse [35]. Authors supposed that worsening of mor‐phological changes in the liver happens mostly often because of a significantly reduced de‐toxification functions of the liver.
Espinal, Peréz, Baéz, Hénriguez et al. [36] analyzed the clinical aspects of the co-infectionHIV and tuberculosis. Tuberculosis remains an important public health problem in theworld that has been exacerbated by HIV epidemic, resulting in increased morbidity andmortality [37, 38]. The pathogenesis and mechanisms of inflammation and accelerated fibro‐sis in co-infected patients are still poorly understood [28, 39].
At present investigation the peculiarities of patients with heroin abuse and co-infection (TB,HCV and HIV) were analyzed (see Table 1). All the patients were males of the age from 26to 39 years (mean value was 32.2 years). The heroin abuse was the longest (mean value was13.6 years). Patients with HCV-infection occupied the second position of disease duration(mean value was 7.1 years), than there were the patients with HIV-infection (mean valuewas 4.7 years) and finally the patients with TB-infection (mean value was 3.5 years). At lastcase the tuberculosis was discovered for the first time of 7 patients from 13 patients. It ischaracteristic that Mycobacterium tuberculosis was not discovered in phlegm of any patientsunder repeated analyses.
We could not detect any interconnections between the quantitative parameters of biopsyspecimen getting with the use of computer microscopy and for the duration of above-men‐tioned observations.
Moreover the tendency to the diseases heaviness increasing is evident. The good example ofthis tendency is the biopsy specimen № 9: the duration of heroin abuse in this case com‐
Liver Biopsy - Indications, Procedures, Results250

posed 15 years, HIV – 13 years, TB – 12 years and HCV – 9 years. In accordance with it thecirrhosis developed in the liver of this patient (see Figure 6) and the segment of non-paren‐chymal elements reached 27.43%. Among them the specific part of portal zones was preva‐lent (27.16%).
The other peculiarity was the presence of the same stage of fibrosis (namely fibrosis F2 byMETAVIR scoring) and F3 (by Ishak scoring) in liver of the majority of the patients.
At that time the segment of non-parenchyma elements in liver of these patients varied from2.65% to 11.13%, and the specific part of the portal zones changed from 1.86% to 10.41%. Thedetailed information about discussion questions and interpretation of liver biopsy assess‐ment by grading and staging systems was presented in recent works [40, 41].
The typical changes included the destruction of limiting plate, the expansion of portal areasand the development of interface hepatitis, formation of short septa or bridging necroses.The image analysis allows calculating of portal zones areas and intralobular infiltrates in dif‐ferent fields of biopsy vision. The expansion of portal zones took place especially during thedevelopment of interface hepatitis. As a rule, intensive lymphohistiocyte infiltration pre‐dominates in such a type of portal zones.
The region of intralobular infiltrates strongly varies. Our investigation showed that intralob‐ular infiltrates developed as a result of lymphocyte-mediated death of hepatocytes (apoptosis).
Earlier we studied the apoptosis in liver biopsy specimens of the patients with HCV withthe use of the TUNEL method [42, 43]. TUNEL-marked cells looked as small groups similarto intralobular piecemeal necroses. All morphometric parameters were significantly higherin comparison with monoinfection HCV [8].
5. Conclusion
Morphometric image analysis gives a possibility to evaluate quantitative parameters of nec‐ro-inflammatory and fibrosis changes in liver biopsy of patients with mixed infections andheroin abuse.
It is characteristic that the combination of different infections leads to the progression of liv‐er inflammation and the increasing of the portion of non-parenchymal elements as a totalsum of portal areas, intralobular infiltrates and distended hepatic vessels.
The investigation showed significant intensification of necroinflammatory lesions. Lympho‐histiocyte infiltration was typical both for portal zones and intralobular areas. These mor‐phological indications could be connected with the change of the immune state of patientsas a result of combine effect of bacterial, viral infections and heroin abuse. So, numerous fac‐tors have been associated with an increased risk of fibrosis progression in liver of such typeof patients.
Computer Image Analysis of Liver Biopsy Specimens in Patients with Heroin Abuse and Coinfection ...http://dx.doi.org/10.5772/52971
251

Of course, it is necessary for more correct analysis to study the biopsies of the patients ofseveral control groups with the sequential cut-off of the definite factors. We plan to carryout such investigation in future.
Quantitative analysis of digital images of total biopsies is indispensable to study the effec‐tiveness of treatment tactics testing as the effect of therapy can be calculated as the percent‐age of morphological changes in biopsy.
Author details
Ivan B. Tokin1*, Ivan I. Tokin2 and Galina F. Filimonova1,2*
*Address all correspondence to: [email protected]
1 St.-Petersburg State University, Russia
2 North-Western State Medical University named after I.I.Mechnikov, Russia
References
[1] Koss, L. G. (1982). Analytical and Quantitative Cytology. A Historical Perspectives.Analytical and Quantitative Cytology and Histolology, 4, 251-256.
[2] Hamilton, P., & Allen, D. (1995). Morphometry in Histopathology. Journal of Patholo‐gy, 175(4), 369-379.
[3] Pilette, S., Rousselet, M., Bedossa, P., Chappard, D., Óberti, F., Rifflet, H., Maiga, M.,Gallois, Y., & Calès, P. (1998). Histopathological Evaluation of Liver Fibrosis: Quanti‐tative Analysis vs Semi-Quantitative Scores. Comparison with Serum Markers. Jour‐nal of Hepatology, 28(3), 439-446.
[4] O` Brien., N., Keating, N., Elderiny, S., Cerda, S., Keaveny, A., Afdhal, N., & Nunes,D. (2000). An assessment of Digital Image Analysis to Measure Fibrosis in Liver Bi‐opsy Specimen of Patients with Chronic Hepatitis C. American Journal of Clinical Path‐ology, 114(5), 712-718.
[5] Zaituon, A., Mardini, H., Awad, S., Ukabam, S., Makadisi, S., & Record, C. (2001).Quantitative Assessment of Fibrosis and Steatosis in Liver biopsies from Patientswith Chronic Hepatitis C. Journal of Clinical Pathology, 54(6), June, 461-465.
[6] Goodman, Z., Becker, R., Pockros, P., & Afdhal, N. (2007). Progression of Fibrosis inAdvanced Chronic Hepatitis C: Evaluation by Morphometric Image Analysis. Hepa‐tology, 45(3), 886-894.
[7] Goodman, Z., Stoddard, A., Bonkovsky, H., Fontana, R., Ghany, M., Morgan, T.,Wright, E., Brunt, E., Kleiner, D., Shiffmann, M., Everson, G., Lindsay, K., Dienstag,
Liver Biopsy - Indications, Procedures, Results252

J., Morishima, C., & the HALT-C Trial Group. (2009). Fibrosis Progression in ChronicHepatitis C: Morphometric Image Analysis in the HALT-C Trial. Hepatology, 50(6),1738-1749.
[8] Filimonova, G., Tokin, I. I., Tokin, I. B., & Hussar, P. (2010). An Assessment of Mor‐phometric Analysis in Liver Biopsy Specimens with Chronic Hepatitis C. Papers onAnthropology. Tartu, Estonia, XIX, 69-80.
[9] Tokin, I. B., Tokin, I. I., & Filimonova, G. F. (2011). Quantitative Morphometric Anal‐ysis of Liver Biopsy: Problems and Perspectives. In: Liver Biopsy. Ed. By Hirokazu Ta‐kahashi, INTECHWEB.ORG, 137-154.
[10] Kage, M., Shimamatu, K., Nakashima, E., Kojiro, M., Inoue, O., & Yano, M. (1997).Long-Term Evolution of Fibrosis from Chronic Hepatitis to Cirrhosis in Patients withHepatitis C: Morphometric Analysis of Repeated Biopsies. Hepatology April , 25(4),1028-1031.
[11] Manabe, N., Chevallier, M., Chossegross, P., Causse, X., Guerret, S., & Trepo, Gri‐maud. G. (1993). Interferon-alfa 2b Therapy Reduces Liver Fibrosis in Cronic A, Non-B Hepatitis: A Quantitative Histological Evaluation. Hepatology, December , 18(6),1344-1349.
[12] Duchatelle, V., Marcellin, P., Giostra, E., Bregeaud, L., Pouteau, M., Boyer, N., Auper‐in, A., Guerret, S., Erlinger, S., Henin, D., & Degott, C. (1998). Changes in Liver Fibro‐sis at the End of Alfa Interferon Therapy and 6 to 18 Months Later in Patients withChronic Hepatitis C: Quantitative Assessment by a Morphometric Method. Journal ofHepatology, 29(1), 20-28.
[13] Caballero, T., Pérez-Milena, A., Masserolli, M., O`, Valle. F., Salmerón, F., Del Moral,R., & Sánches-Salgado, G. (2001). Liver Fibrosis Assessment with SemiquantitativeIndexes and Image Analysis Quantification in Sustained-Responder and Non-Res‐ponder Interferon-treated Patients with Chronic Hepatitis C. Journal of Hepatology,34(1), 740-747.
[14] Benhamou, Y., Di Martino, V., Bochet, M., Colombet, G., Thibault, V., Liou, F., Katla‐ma, K., Poynard, T., & and for the Multivir C Group. (2001). Factors Affecting LiverFibrosis in Human Immunodeficiency Virus and Hepatitis C Virus Co-infected Pa‐tients: Impact of Protease Inhibitor Therapy. Hepatology, 34(2), August, 283-287.
[15] Martinez-Sierra, C., Arizcorreta, A., Diaz, F., Roldán, R., Martin-Herrera, L., Pérez-Guzmán, E., & Girón-González, J. (2003). Progression of Chronic Hepatitis C to LiverFibrosis and Cirrhosis in Patients Coinfected with Hepatitis C Virus and Immunode‐ficiency Virus. Clinical Infectious Diseases, 36(2), 491-498.
[16] Poynard, T., Mathurin, P., Ching-Lung, Lai., Quyader, D., Poupon, R., Tainturier, M.H., Myers, R., Muntenau, M., Ratziu, V., Manns, M., Arndt, V., Capron, F., Chedid,A., & Bedossa, P. (2003). for the Panfibrosis Group. (A Comparison of Fibrosis Pro‐gression in Chronic Liver Diseases. Journal of Hepatology, 38(3), 257-265.
Computer Image Analysis of Liver Biopsy Specimens in Patients with Heroin Abuse and Coinfection ...http://dx.doi.org/10.5772/52971
253

[17] Menghini, G. (1958). One-Second Needle Biopsy of the Liver. Gastroenterology Au‐gust), 0016-5085 , 35(2), 190-199.
[18] Menghini, G., Lauro, G., & Caraseni, M. (1975). Some Innovations in the Technic ofthe One- Second Needle Biopsy of the Liver. American Journal of Gastroenterology,64(3), 175-180.
[19] Knodell, R., Ishak, K., Bkack, W., Chen, T., Graig, R., Kaplowitz, N., Kiernan, T., &Wollman, J. (1981). Formulation and Application of a Numerical Scoring System forAssessing Histological Activity in Asymptomatic Chronic Active Hepatitis. Hepatolo‐gy, 1(5), September/October, 431-435, 0270-9139.
[20] French METAVIR Cooperative Study Group. (1994). Intraobserver and InterobserverVariations in Liver Biopsy Interpretation in Patients with Chronic Hepatitis C. Hepa‐tology, 20(1), 15-20.
[21] Ishak, K., Baptista, A., Bianchi, L., Callea, F., De Groote, J., Gudat, F., Denk, H., Des‐met, V., Korb, J., Mac, Sween. R., Phillips, M., Portmann, B., Poulsen, H., Sheuer, P.,Schmid, M., & Thaler, H. (1995). Histological Grading and Staging of Chronic Hepa‐titis B. Journal of Hepatology, 22(6), 696-699.
[22] Inglesby, T., Rai, R., Astemborsky, J., Gruskin, L., Nelson, K., Vlahov, D., & Thomas,D. (1999). A Prospective Community Based Evaluation of Liver Enzymes in Individ‐uals With Hepatitis C after Drug Use. Hepatology, 29(2), 590-596.
[23] Green, R., & Flamm, S. (2002). AGA Technical Review on the Evaluation of LiverChemistry Tests. Gastroenterology, 123(4), 1367-1384.
[24] Kim, W., Flamm, S., Di Bisceglie, A., & Bodenheimer, H. (2008). Serum Activity ofAlanin Aminotransferase (ALT) as an Indicator of Health and Disease. Hepatology. ,47(4), 1363-1370.
[25] Williams, A., & Hoofnagle, J. (1988). Ratio of Serum Aspartate to Alanin Aminotrans‐ferase in Chronic Hepatitis: Relationship to Cirrhosis. Gastroenterology. 0016-5085 ,95, 734-739.
[26] Sheth, S., Flamm, S., Gordon, F., & Chopra, S. AST/ALT Ratio Predict Cirrhosis in Pa‐tients with Chronic Hepatitis C Virus Infection. American Journal of Gastroenterology,93, 44-48.
[27] Petrovic, L. (2007). HIV/HCV Co-infection: Histopathological Findings, Natural His‐tory, Fibrosis, and Impact of Antiretroviral Treatment: a Review Article. Liver Interna‐tional, 598-606.
[28] Mohsen, A. N., Eastbrook, P. J., Taylor, C., Portman, B., Kulasegaram, R., Murad, S.,et al. (2003). Impact of Human Immunodeficiency Virus (HIV) Infection on the Pro‐gression of Liver Fibrosis in Hepatitis C Virus Infected Patients. Gut, 52(7), July,1035-1040.
Liver Biopsy - Indications, Procedures, Results254

[29] Rullier, A., Trimoulet, P., Neau, D., et al. (2004). Fibrosis is Worse in HIV/HCV Pa‐tients with Low-level Immunosuppression Referred for HCV Treatment than inHCV-matched Patients. Human Pathology, 35, 1088-1094.
[30] Kelleher, T., & Afdhal, N. (2006). Assessment of Liver Fibrosis in Co-infected Pa‐tients. Journal of Hepatology, 44(1), S126-S131.
[31] Vallet-Pichard, A., & Pol, S. (2006). Natural History and Predictors of Severity ofChronic Hepatitis C Virus (HCV) and Human Immunodeficiency Virus (HIV) Co-in‐fection. Journal of Hepatology, 44, 528-534.
[32] Thomas, D. L., Shih, J. W., Alter, H. I., et al. (1996). Effect of Human Immunodeficien‐cy Virus on Hepatitis C Virus Infection among Injecting Drug Users. Journal InfectiousDiseases, 174, 690-695.
[33] Di Martino, V., Rufat, P., Boyer, N., Renard, P., Degos, F., Martinot-Peignoix, M.,Matherov, S., Le Moins, V., Vachin, F., Degott, C., Valla, D., & Marcellin, P. (2001).The Influence of Human Immunodeficiency Virus Coinfection on Chronic HepatitisC in Injection Drug Users: a Long-term Retrospective Cohort Study. Hepatology De‐cember , 34(6), 1193-1199.
[34] Tennant, F. (2001). Hepatitis C, B, D and A: Contrasting Features and Liver FunctionAbnormalities in Heroin Addicts. Journal of Addictive Diseases, 20(1), 9-17.
[35] Ilic, G., Karadzic, R., Kostic-Banovic, L., & Stojanovic, J. (2005). Chronic IntravenousHeroin Abuse: Impact on the Liver. Facta Universitats Series: Medicine and Biology,12(3), 150-153.
[36] Espinal, M., Peréz, E., Baéz, J., Hénriguez, L., Fernández, K., Lopez, M., Olivo, P., &Reingold, A. (2000). Infectiousness of Mycobacterium tuberculosis in HIV-1-infectedPatients with Tuberculosis: a Prospective Study. The Lancet, 355(9200), January,275-280.
[37] Sharma, S., Mohan, A., & Kadhitavan, T. (2005). HIV-TB Co-infection: Epidemiology,Diagnosis and Management. Indian Journal of Medical Research. 0971-5916 , 121,550-567.
[38] Sterlig, T. R., Pham, P. A., & Chaisson, R. E. (2010). HIV Infection-Related Tuberculo‐sis: Clinical Manifestations and Treatment. Clinical Infectious Diseases, 50(3), May,S223-S230.
[39] Jones, R., Dunning, J., & Nelson, M. (2005). HIV and Hepatitis C Co-infection. Inter‐national Journal Clinical Practice., 59, 1082-1092.
[40] Theise, N. D. (2007). Liver Biopsy Assessment in Chronic Viral Hepatitis: a Personal,Practical Approach. Modern Pathology, 20(7), July 2006, S3-S14.
[41] Shiha, G., & Zalata, K. (2011). Ishak versus MERAVIR: Terminology, Convertibilityand Correlation with Laboratory Changes in Chronic Hepatitis C. In: Liver Biopsy. Edby Hirokazu Takahashi, INTECHWEB.ORG, 155-170.
Computer Image Analysis of Liver Biopsy Specimens in Patients with Heroin Abuse and Coinfection ...http://dx.doi.org/10.5772/52971
255

[42] Tokin, I. B., Hussar, P., Filimonova, G., Hussar, U., Jarveots, T., Suuroju, T., & Tokin,I. I. (2008). Features of the Liver Apoptosis in Patients with Chronic Hepatitis C ViralInfection (HCV). In: Proceedings of the 7th International Cell Death Society Symposium“Targeting cell death pathway for human diseases”, Shanghai Mega City, China, 127.
[43] Tokin, I. B., Hussar, P., Filimonova, G., Hussar, U., Jarveots, T., Suuroju, T., & Tokin,I. I. (2009). Features of Liver Apoptosis in Chronic Hepatitis C Virus (HCV) Infection.Papers on Anthropology Tartu, Estonia., 1406-0140 , XVIII, 361-371.
Liver Biopsy - Indications, Procedures, Results256

Chapter 12
Future Aspects of Liver Biopsy: From Reality toMathematical Basis of Virtual Microscopy
Ludmila Viksna, Ilze Strumfa, Boriss Strumfs,Valda Zalcmane, Andrejs Ivanovs andValentina Sondore
Additional information is available at the end of the chapter
http://dx.doi.org/10.5772/52753
1. Introduction
Tissue investigation remains one of the most reliable diagnostic ways in both general medicalpractice and liver pathology. At present, the routine liver biopsy investigation should includeobtaining a representative tissue sample, adequate technological processing and applicationof histochemical stain panel [1-5]. The evaluation must be done in accordance with up-to-datedisease classifications and validated diagnostic criteria [6]. Protocol approach is recommend‐ed in order to decrease the variability in description. In case of chronic inflammatory liver dis‐ease, semiquantitative evaluation of inflammatory activity by Knodell, Ishak, METAVIR orScheuer score, or analogous system [7-11] must be applied. Additional methods as immuno‐histochemistry or polymerase chain reaction are applied by necessity. The morphologicalevaluation of biopsy is a part of medical teamwork. It should be preceded by clinical and lab‐oratory investigations and biopsy findings must be incorporated in the general patient’s in‐formation. Many of these principles will remain in use in the nearest future. However, bothclinical diagnostics and medical research undergo almost unlimited progress. The upcominginnovations in liver biopsy analysis include incorporation of digital image analysis, geneticinvestigations and immunohistochemistry for functionally important molecules as cytokines,cell cycle markers and viral life cycle markers into everyday practice.
2. Morphological evaluation of liver: Today’s reality
Despite the fact that the histological assessment of liver tissues plays an essential role in thediagnosis of liver diseases and the histological conclusion serves quite often as a basis for
© 2012 Viksna et al.; licensee InTech. This is an open access article distributed under the terms of the CreativeCommons Attribution License (http://creativecommons.org/licenses/by/3.0), which permits unrestricted use,distribution, and reproduction in any medium, provided the original work is properly cited.

establishing the diagnosis, there are factors or reasons to be taken into consideration whichcan negatively influence the results obtained in morphological evaluation of liver biopsy.
We have "assessed" the percentage of each factor’s influence on the final result– descriptionand conclusion regarding diagnosis, where "0" is considered a factor that does not affect theevaluation and its outcome, but "100%” – the factor which actually hinders the correct diag‐nosis of the disease. The factors that may affect the liver tissue morphological assessmentand diagnosis of disease are summarized in Table 1.
No. Factors affecting liver tissue
morphologic assessment
Evaluation of impact on
final outcome in % *
Comments
1. Biopsy site selection in liver tissues 100 – 0It can be completely non-
representative site, such as subcapsular
2. Fixation and transfer of biopsy sample 100 – 0
Chemical environment (composition)
and temperature of fixation can affect
the biopsy specimen
3.Selection of certain section out of the
whole sample50 – 0
If the whole sample is used, then the
error theoretically is not possible
4.Selection and quality of staining (panel of
visualization methods) of the sample100 – 0
If the sample is not stained for the
reason to label a certain substance,
e.g., Fe, the error can reach 100%
5.Quality of biopsy specimen sections or
microtomy30 – 0
Thick or disrupted tissue sections can
hinder the pathology from the
observer. The thickness should not
exceed 3-4 micrometres.
6. Number of viewable visual fields 80 – 0Inaccuracies can occur if only some
separate visual fields are examined
7. Technical condition of the microscope 80 – 0
Incomplete quality of optical system
can hinder the pathology from the
observer.
8. Selection of evaluation scale 100 – 0
If the specimen where the basic
pathology relates to fatty changes
(steatosis) is assessed according to
Knodell scale, then the assessment is
inadequate if compared to the actual
liver tissue damage
* 100% - affecting
0% - not affecting
Table 1. Factors affecting liver tissue morphologic assessment
Liver Biopsy – Indications, Procedures, Results258

Further we will have a look at each factor separately. The first reason which may significant‐ly affect the final result is the incidental character of biopsy specimen collection by means of“blind” biopsy. In case of diffuse liver damage, it is important to obtain liver specimen froma representative site (which is not subcapsular) or under ultrasonographic (USG) control. Ifthe liver specimen is obtained during invasive procedure (laparoscopy or open abdominalsurgery), it is of high importance to give information about preferable biopsy site to the col‐league obtaining liver specimen. The liver specimens obtained during surgery are certainlymore targeted. More or less qualitative methodological performance of tissue collection mayalso cause certain imperfections affecting quality of specimen evaluation.
Presuming that the biopsy specimen is obtained from the site typical for the certain liverpathology, one more important issue is the quality of biopsy specimens’ fixation and slicing.
The aspect of „special” tissue staining must also be looked at, because in case of absence ofexamination request or list of preliminary diagnosis provided by clinician, that emphasizesthe need for particular staining, morphologist is unable to give an adequate diagnostic as‐sessment of biopsy specimen. Thus diagnosis like haemochromatosis and other pathologiesknown as "storage diseases" can be missed.
The next factor, i.e., selection of certain section out of the whole biopsy specimen, is an issuearising only in case if the biopsy specimen is not examined throughout or along its horizon‐tal length. The cross-sectioning gives the chance to analyze tissues on different "depths" or„levels” of the biopsy specimen.
The technical condition or quality of the microscope and number of viewable visual fields areto be considered seriously. Nowadays, the usual practice of the pathologist is a general over‐view of the material to gain insight into overall picture, noticing the most typical and impor‐tant peculiarities. Inaccuracies can occur if only some separate visual fields are examined.
The subjective component of the morphological assessment of liver specimens and interpre‐tation of the observed changes and their compliance or adherence to one or the other pathol‐ogy is essential also. The problem could be the qualification and experience of clinician toput together or combine visual insight in the particular biopsy specimen and clinical diagno‐sis made up of biochemical, immunological and genetic parameters, and to use the interpre‐tation of morphologist properly for establishing the diagnosis.
Selection of morphological or histological evaluation scale is significant. These scales arevery advantageous for standardizing expert’s assessment, converting it into measurablecharacteristics and helping the clinician to make final decision about patient’s diagnosis. Incase of light microscopy the issue of selection of evaluation scale is a factor with up to 100%error probability. For example, the use of the Knodell scale for patient with steatohepatosis,HAI = 0, leads to incorrect conclusion that the patient is healthy, especially if the biochemi‐cal parameters of blood are not altered.
If in addition the electron microscopic investigation of sequential liver biopsy specimens aredone, obtained results and conclusions are also affected by the whole process of the above men‐tioned biopsy specimen collection and processing. The electron microscopy is currently consid‐
Future Aspects of Liver Biopsy: From Reality to Mathematical Basis of Virtual Microscopyhttp://dx.doi.org/10.5772/52753
259

ered as an auxiliary method or technique, yet in the age of high-tech medicine, processesongoing on the level of organelles are the ones which by characteristic ultrastructural changesfrequently refer to or indicate a particular pathology. The following must be strictly observed inelectron microscopy: 1) liver tissue sampling and slicing into 1 mm3 pieces without mechanical‐ly squeezing them and immediate immersion in fixing solution; 2) chemical composition of fix‐ing solution, temperature, sample fixation and rinsing time; 3) embedding of liver tissuesamples in mixture of epoxy resins in accordance with polymerization time of these resins; 4)quality of sample cutting with ultramicrotome and contrasting with uranyl acetate and lead cit‐rate; 5) all cells and their organelles visible in the ultra-thin slices under the electron microscopehave to be examined. It should be noted that resolution of transmission electron microscope(TEM) is within the range of 0.2 to 2 nm and resolution of scanning electron microscope is 4 nm.
3. Virtual microscopy: The general principles
To reduce the potential inaccuracies in the processing and evaluation of biopsy specimens itis important to look for modern solutions in order to maximize the efficiency of use of biop‐sy specimens. One of the solutions could be application of virtual microscopy having exten‐sive mathematical basis with fractal and entropy considerations as well as technologicalsupport by appropriate software and hardware. Implementation of innovations into practicecould significantly increase the effectiveness of liver biopsy specimens.
The digital image analysis [12-14] and computed morphometry in general is considered animportant tool in pathology. It can decrease the workload of voluminous repeated measure‐ments and increase the accuracy and objectiveness of the results. In several fields, e.g., im‐munohistochemical and molecular typing of breast cancer, the application of digital imageanalysis is already highly practical [13].
In virtual microscopy, the demands for mathematical basis are higher than in routine histol‐ogy. This is illustrated by examples of entropy considerations, Delaunay’s triangulation orfractal geometry and general non-Euclidean geometry for irregularly shaped biological ob‐jects [14-16]. Sophisticated software must be elaborated as well. Additional technical re‐quirements exist for image resolution and size, fast wide-band data transfer as well asdigital data storing [12, 13]. The slide scanners and visualisation software are available andimprove continuously [12].
Computed morphometry becomes more practical in association with virtual microscopy anddigital image analysis as well. As postulated in reference [16] the natural development ofscience occurs from the ability to recognize, name and classify the object (corresponding tothe diagnosis, e.g., chronic viral hepatitis C) to semiquantitative, ordering measurements(e.g., the activity assessment by Knodell or any analogous scale), finally reaching quantita‐tive characteristics. Descriptive diagnoses and semiquantitative estimates are widely used inthe „classic” liver pathology. In order to gain sufficient reliability and fastness, scalar meas‐urements would require digital assessment [16]. Computed morphometry on the basis ofvirtual microscopy is a way towards scalar measurements.
Liver Biopsy – Indications, Procedures, Results260

The virtual microscopy can be performed in two different ways. Interactive virtual micro‐scopy by whole slide imaging leaves the conclusion in the hands of pathologist. It changessignificantly the working tools from optical microscopy and subjective decisions to comput‐er screen and objective measurements. The automated virtual microscopy is even more ex‐citing as computer system should evaluate the diagnoses [14].
In liver pathology, the software develops regarding assessment of steatosis [17-19] and fib‐rosis [20-24]. Necroinflammatory changes can be quantified as well [16].
Regarding liver ultrastructure, morphometric evaluation of hepatocyte volume can haveprognostic significance predicting survival as shown in liver cirrhosis associated with portalhypertension [25]. Morphometric analysis of liver parenchyma in different alcohol-relatedpathologic conditions has been tested with good results [26]. Thus, changes in the volumefraction of parenchymal interstitial space and in the surface density of hepatocyte plasmamembrane, rough endoplasmic reticulum and outer mitochondrial membrane can be of im‐portance for distinguishing between cirrhosis and non-cirrhotic states. Hepatocyte nuclearvolume fraction measurement can predict the survival in case of cirrhosis. Interestingly, fewimages are necessary to perform these measurements thus helping to characterise evenscarce tissue material [26].
Combination of multiplex quantum dot immunostaining with high resolution whole-slidedigital imaging and automated image analysis has been described [27].
At present, the two most frequently studied targets for computer-assisted and/or digital im‐age analysis in liver biopsies include steatosis and fibrosis.
4. Digital assessment of liver steatosis
Among Western population, liver steatosis is a frequent finding [28-29] as it is associatedwith such common factors as chronic viral hepatitis [19], alcohol drinking, diabetes mellitusor obesity [17]. It has been considered a risk factor for liver fibrosis [18, 19]. Steatosis, includ‐ing non-alcoholic steatohepatitis [19] has become an important target in diagnostics and sci‐entific research therefore highly reproducible measurements are necessary to evaluate thecourse of disease, outcome and effect of treatment. The biopsy is still considered a goldstandard in the diagnosis and assessment of steatosis as the imaging including ultrasonogra‐phy, computed tomography and magnetic resonance imaging can be affected by lower sen‐sitivity [17, 30]. The severity of steatosis in liver biopsies can be graded by several semi-quantitative systems (Table 2) assessing the eyeballed proportion of affected cells [30-35].
The present semiquantitative estimates are subjective and limit the possibilities of statisticanalysis [18]. Numerical value, expressing the exact percentage of affected cells would bemore reliable if an adequate biopsy is analysed. Such measurement is possible, especially incomputer-assisted way, but it would require architecturally arranged count of nuclei and fatvacuoles per biopsy. Thus, the measurement would be time-consuming and accordingly ex‐pensive. On the other hand, steatosis is relatively easy target for digital quantification of the
Future Aspects of Liver Biopsy: From Reality to Mathematical Basis of Virtual Microscopyhttp://dx.doi.org/10.5772/52753
261

general fat amount due to the regular shape and distinct colour of fat vacuoles [18, 19]. Thedigital quantification of steatosis shows high reproducibility exceeding the quality of man‐ual estimate [19]. Commercial software for image analysis has been recently employed andnovel automated procedures are under development [18]. The estimate is more reliable ifboth morphological and chromatic operators are used in order to characterise lipid particles[18]. The fat vacuole is optically and geometrically simple object – optically empty after rou‐tine processing and deparaffinisation, thus white and rounded. If colour only is used foridentification, however, the sinusoids, empty portal vessels and bile ducts [30] as well asglycogen nuclei in hepatocytes might be undertaken as false positives (Figure 1). The round‐ed shape of fat vacuole helps to exclude longitudinal or tangential sections of sinusoids,blood vessels and portal bile ducts. In haematoxylin-eosin stained sections, the colour con‐trast can be used to identify glycogen nuclei as in this case the optically empty space is sur‐rounded by basophilic nuclear membrane in contrast to fat vacuole located in eosinophiliccytoplasm. Thus, the conclusion at present is to include both chromatic, size and shape as‐sessment [18, 30]. Manual check can improve the accuracy in case of perpendicular sectionsof small vessels and fat cysts [30]. However, such control would increase the workload. Thebenefits of objectiveness and numerical value of continuous variable still remain. More stud‐ies would be necessary to determine how accurate the control must be for practical means;theoretically the significant vascular changes in cirrhosis point towards the idea that accu‐rate identification of fat vacuoles is a must to avoid non-random errors.
Grading Reference
Mild: less than 30% hepatocytes involved
Moderate: 30-60% hepatocytes involved
Severe: more than 60% hepatocytes involved
[31]
Grade 0 (no or minimal steatosis): less than 5% hepatocytes involved
Grade 1: at least 5% but less than 25% hepatocytes involved
Grade 2: at least 25% but less than 50% hepatocytes involved
Grade 3: at least 50% but less than 75% hepatocytes involved
Grade 4: at least 75% hepatocytes involved
[32]
Estimating the percentage of affected hepatocytes in 5% bands [30]
Grade 0: less than 1%
Grade 1: at least 1% but less than 6% hepatocytes involved
Grade 2: at least 6% but less than 34% hepatocytes involved
Grade 3: at least 34% but less than 67% hepatocytes involved
Grade 4: at least 67% hepatocytes involved
[34]
[35]
Grade 1: less than 33%
Grade 2: at least 33% but less than 66% hepatocytes involved
Grade 3: more than 66% hepatocytes involved
[33]
Table 2. The different grading systems of liver steatosis
Liver Biopsy – Indications, Procedures, Results262

Figure 1. Liver steatosis. Note the macrovesicular steatosis (stars) characterised by size of fat vacuole exceeding thediameter of hepatocyte nucleus, and the microvesicular steatosis (small arrows) caused by fat vacuoles smaller thanhepatocyte nucleus. The optically empty fat vacuoles must be promptly distinguished from glycogen nuclei (large ar‐row) and sinusoids (arrowhead). Haematoxylin-eosin stain, original magnification 400x
The fat stains as Sudan IV are well-known [4]. However, several researchers have reported tech‐nical problems. The artifacts can include deformation of lipid vacuoles as well as sinusoidal andbackground staining [17, 36-38]. The non-lipid positivity would limit the possibilities of colouranalysis, and the deformation – of shape analysis. The practicality of osmium tetroxide stain isnegatively affected by the necessity to use frozen tissue and by the toxicity of reagents [4].
Several research groups have reported that manual assessment of steatosis leads to signifi‐cantly higher estimates than computer-obtained data [17, 19] regardless if area measurementor stereological point counting is used [30]. The coefficient can be as high as 3.78 [19]. Practi‐cising physicians should remember that association between degree of steatosis and risk ofcirrhosis is proved using manual assessments and thus the scales are adjusted for manualuse. Consequently, interpretation of digital data cannot involve the use of unadjusted previ‐ous scales as risk classes.
It should be noted that the principal meaning of diagnosing steatosis is not affected by theevaluation method. Increasing steatosis percent is associated with advancing fibrosis stageboth manually and digitally [19]. The data obtained by pathologist and automated softwareshow close correlation [17]. After liver transplantation, aspartate aminotransferase, alanineaminotransferase and prothrombin time have shown better correlation with automatedmeasurements in 4 of 5 posttransplant time points but the total bilirubin level correlated bet‐ter with manual assessment in 3 of 5 time points. The graft survival showed a significant as‐sociation with macrovesicular steatosis both in automated and manual measurementsalthough the p value was less for automated measurement [17].
Future Aspects of Liver Biopsy: From Reality to Mathematical Basis of Virtual Microscopyhttp://dx.doi.org/10.5772/52753
263

When analysing liver steatosis, the observations of higher accuracy in resin-embedded sam‐ples [18] request more technological progress in order to create methodology for easy use inroutine samples.
Digital stereological point counting has been employed in liver steatosis evaluation as well[33]. The researchers have observed the same fact that manual semiquantitative assessmenttends to be significantly higher. The lack of precision in manual evaluation can be related tothe physiology of vision and processing of the visual information [19, 39].
Some researchers have also come to the conclusion that automated assessment of liver stea‐tosis is more time-consuming than manual [30]. The time input for digital measurement isfound to be threefold greater than for manual evaluation [19]. Although this opinion isbased on trustable experience, half of the problem is solved already as the whole slide imag‐ing eliminates the need to choose appropriate number of representative fields submitted foranalysis and the necessity for human participation in the obtaining and archiving of digitalimages. Besides the whole slide imaging, the degree of automatisation must be further in‐creased: optimal software abolishes the manual correction of object inclusion into measure‐ments. However, this deserves morphologically correct mathematical model. Other groupshave considered computer-aided morphometry to be fast and objective [16].
5. Digital assessment of inflammation in liver biopsy
The computer-aided assessment of necroinflammatory processes in chronic viral hepatitis hasbeen tested. To perform this, immunohistochemical visualisation is necessary in order to high‐light inflammatory cells. The application of immunohistochemistry increases the expenses.This drawback can be counterbalanced by gains of rapid measurement, resulting in rigorousresults expressed in scalar numbers as well as by complete characteristics more exactly reflect‐ing the status of the whole organ [16].
The assessment of hepatic fibrosis and the closely related architectural deformities as bridgingfibrosis and liver cirrhosis have important role in the diagnostics, treatment and prognosticevaluation of chronic liver diseases [24]. The studies of liver fibrosis are facilitated by standarduse of special stains for the routine evaluation of liver biopsies in case of diffuse liver disease.Masson’s trichrome is an efficient method to highlight fibrosis [3]. The sharp contrast betweenblue collagen and red parenchyma allows visualisation of even small excess amounts of colla‐gen [23]. Sirius red stain has also been employed [21, 40]; it has the benefit of selective stainingof collagen but not proteoglycans [22]. Not surprisingly, comparatively many authors have ap‐plied digital image analysis to quantify fibrosis in liver tissue [24]. Validation studies of com‐puter-assisted morphometry have also been performed [21]. Besides the well-developedmethodology including software, the application of computer analysis has resulted in exactnumerical data allowing detection of interesting biological relationships. For instance, the cor‐relation of fibrosis burden with end-stage liver disease score, serum total bilirubin and interna‐tional standard ratio of prothrombin has been shown in hepatitis B-related decompensatedcirrhosis. Thus, the correlation between the amount of connective tissue in cirrhotic liver and
Liver Biopsy – Indications, Procedures, Results264

hepatic functional reserve was demonstrated [24]. The problem was insufficient accuracy ofcomputer-assisted morphometry [21] manifesting as inter-observer differences. Poor correla‐tion of the fibrosis area with Ishak staging score has been observed as well [21]. Other scientistshave also found that analysis of early fibrosis necessities qualitative assessment despite thegeneral correlation between amount of connective tissue and Ishak grade of fibrosis [20]. Tis‐sue geometry differences in subsequent sections also can be more accurately classified by hu‐man eye [22]. Full section digital analysis seems to be important [20].
Digital image analysis for the evaluation of fibrosis in chronic viral hepatitis C has beenstudied also as mentioned in references [41-42]. Automatic quantification of liver fibrosis in‐cluding the validation of the method has been performed as described in reference [43]. Oth‐er investigators have employed computerised image analysis for the evaluation of fibrosis aswell [44-47]. In most investigations, correlation between digital and manual semiquantita‐tive score has been shown [20, 44-47]. However, the digital data do not allow to differentiatebetween low stages of fibrosis [20, 45, 47].
6. Digital biopsy analysis for inflammatory liver lesion: Future beginstoday
The incorporation of Mandelbrot’s fractal geometry [48] into the digital evaluation of liverbiopsy for chronic hepatitis has brought revolutionary changes [40].
The short description of fractal is provided in Table 3; detailed characteristics can be foundin recent reviews [49].
Definition and essential
features of fractal
The fractal is a mathematical object characterised by self-similar patterns. At every scale,
fractal shows (infinitely) either the same structure or is at least similar to other scales. The
complexity is retained independently of magnification. Thus, although fractal curve is one
dimensional similarly to regular line, the fractal dimension is greater than topological
dimension. Due to the infinite similarity, fractals cannot be measured in traditional ways.
Although fractals have got significant popularity due to their beauty, the importance of
fractal theory is in the mathematical basis and the ability to describe, among other
processes, the biological phenomena.
Fractals in nature: selected
examples
Beds of rivers, irregularity of coastline, profiles of mountain chain, clouds
Fractals in biology: selected
examples
Branching of blood vessels or bronchi, the invasive edge of tumour, neurons. See also Figure 2-6
Peculiarities of fractals in
biology
Biological fractal-like objects have limited range of self-similarity upon magnification thus
behaving as random fractals, in contrast to mathematical/geomaterical constructs with unlimited
level of complexity (self-exact fractals)
Table 3. The characteristics of fractals
Future Aspects of Liver Biopsy: From Reality to Mathematical Basis of Virtual Microscopyhttp://dx.doi.org/10.5772/52753
265

Figure 2. Highly irregular structure of biological object. Use of Mandelbrot’s fractal geometry is suggested to describetargets with remarkable degree of complexity and irregularity. Note also the similarity of complex, branching outlinewith Figures 4 and 5
Figure 3. Retained irregularity of the biological structure at higher magnification: note the remarkable similarity withFigure 2. The persisting complexity at different levels of magnification is another feature suggesting the necessity forfractal analysis. The inflammation in liver biopsy (shown in Figures 4 and 5) depicts analogous features
Liver Biopsy – Indications, Procedures, Results266

Hurst’s exponent is another albeit related mathematical construct with major meaning in thedigital analysis of liver biopsy. It was first used to study the variation in water flow in Nile ba‐sin during the construction of the Aswan dam [16, 50]. In general, it can be used to detect the ir‐regularity – a key parameter analysing the activity of inflammation in the liver as the activeinflammation manifests with periportal piecemeal necrosis causing irregularity in the normal‐ly smooth border of portal field. Hurst’s exponent also can be detected by fractal mathematics.It can describe quantitatively the deviation from smooth contour in natural fractal objects.
To detect the border of inflammatory cell cluster, Delaunay’s triangulation can be used withsuccess. In general, Delaunay’s triangulation involves set of points in such way that no point isinside the circle drawn through 3 points. It maximizes the minimum angle avoiding narrowtriangles. If circle drawn through 2 input points contain the third point in the outside, thesepoints form Delaunay’s triangle. The method can be used to mesh the space. By this triangula‐tion, lines were drawn in the scanned image of liver biopsy through each pair of adjacent in‐flammatory cells resulting in network of triangles showing common border. The most externaltriangle short sides formed the border of inflammatory cell infiltrate. The triangle side was de‐fined as appropriately short if it was equal of less than 20 microns based on empiric analysis.After the cluster has been outlined, both the amount (by area) of inflammatory cells and theborder irregularity and area of cluster-affected tissue can be evaluated [16].
The mathematical basis of so-called geometry of irregularity (Figure 2-3) has allowed to detectthe amount of residual liver parenchyma, inflammation (Figure 4-5) and fibrosis (Figure 6-7) aswell as to provide index characterising the appropriateness of liver tissue structure (named tec‐tonic index by the authors).
Figure 4. Irregular outline (arrowheads) of portal field in chronic active hepatitis. Haematoxylin-eosin stain, originalmagnification 100x
Future Aspects of Liver Biopsy: From Reality to Mathematical Basis of Virtual Microscopyhttp://dx.doi.org/10.5772/52753
267

Figure 5. Branching pattern (arrowheads) of periportal inflammatory infiltrate. Note the remarkable similarity withFigure 4 analogous to the relationship between Figures 2-3. The fractal nature of inflammation is thus highlighted.Haematoxylin-eosin stain, original magnification 400x
Figure 6. Branching outline of connective tissue fields in liver cirrhosis. Note both the large areas of connective tissue(star) and the thin septa (arrowheads). Masson’s trichrome stain, original magnification 100x
Liver Biopsy – Indications, Procedures, Results268

Figure 7. Branching pattern of connective tissue fields in arachnoid liver fibrosis (arrowhead). Masson’s trichromestain, original magnification 400x
The Dioguardi Histological Metriser machine, described in reference [40] is able to pro‐duce measurements and even simple diagnoses, working with reasonable speed. The rel‐evant equipment ensures microscope focusing and full slide scanning, and determinesthe above mentioned parameters excluding any unfilled spaces as vessels, sinusoids, bili‐ary ducts and artifactual holes. The system is able to identify and exclude the Glisson’scapsule from the analysis. Colour thresholds are used to select the areas of interest. Theinflammatory cells are identified by immunohistochemical visualisation of leukocytecommon antigen. For the analysis, the inflammatory cell clusters are outlined by imagi‐nary line connecting the centres of the outermost cells; after that the area of clusters ismeasured. Thinking in the usual terms, the portal and periportal infiltrates are character‐ised by this measurement; the portal fibrosis also can influence this measurement provid‐ing homing space for inflammatory infiltrate. The area of extra-cluster inflammatory cellsis measured separately; these could mostly correspond to intralobular infiltrate. Whenanalysing fibrosis, area of fibrotic tissue is measured. The wrinkledness is detected as theratio between the perimeter and area of an object. As portal field in healthy liver issmooth, the concept of wrinkledness is an efficient way to detect periportal inflammationand portal fibrosis. The irregularity of collagen islets necessitates the correction by fractaldimension; the fibrotic foci are considered truncated planar fractals. The residual paren‐chyma is characterised by the tissue area that is not occupied by inflammatory cells andfibrosis. Finally, the loss of order is characterised mathematically. In order to characterisethe course of the disease in analogue with the usual staging, the individual fibrosis sca‐lar is compared with the curve of fibrosis development over the course of disease detect‐ing the percentage of the disease course before collagen deposition reaches the maximal
Future Aspects of Liver Biopsy: From Reality to Mathematical Basis of Virtual Microscopyhttp://dx.doi.org/10.5772/52753
269

tolerated level of 32% [40] or approximately 36% in liver cirrhosis necessitating livertransplantation [24]. Thus, three approaches are combined: the outlines of regular struc‐tures as vacuoles are characterised by traditional, non-fractal geometry, the area of fibro‐sis and parenchyma are detected using the traditional measurements corrected by thefractal dimension, and the tectonic index is based on the relationships between the Eucli‐dean and fractal dimensions of liver tissue. One of the many positive features of this sys‐tem is the ability to generate continuous scalar variables. When analysing dynamics inrepeated liver biopsies by scalar data, naturally, less biopsies are characterised as lackingsignificant changes.
Although fractal concept is used in medicine, including at least microscopy, neuroscienceand ophthalmology as well as automated measurements not limited to pathology [49, 51,52], the study described in reference [40] is remarkable as it is highly sophisticated and prac‐tical; it is understandable that the research group considers their machine as an intelligentcollaborator – and this is exactly the way how future biopsy analysis should proceed.
7. Functional liver tissue analysis in biopsy
The diagnostic evaluation of liver biopsy is mostly based on panel of histochemicalstains including hematoxylin-eosin [2], Masson’s trichrome [3], PAS [5] and Perl’s [1]stains as well as others by necessity. These visualisation techniques should be comple‐mented by various “- omics” tools [27] to gain more data on the function of liver cells.The cytokines, inflammatory mediators, viral proteins, cell cycle proteins and apoptosismarkers can be detected; metabolic pathways can be investigated as well. At present,most or proteomic and genetic studies are carried out for scientific research in order tooutline the pathogenesis of different diseases. However, in future it could be advisable toinclude such studies with validated value in the routine investigation as technically theamount of tissue in liver biopsy is sufficient.
Cytokine expression can be analysed, e.g., TGF, EGFR and others [25]. When studying inter‐leukin-6 (IL-6) expression in liver biopsies, higher IL-6 expression was found in non-alcohol‐ic steatohepatitis than in steatosis. Correlation between IL-6 expression and degree ofinflammation and stage of fibrosis was detected as well [53]. Due to the complex nature ofcytokine action, wide spectrum of different molecules and their receptors must be analysedin details in order to avoid insignificant or contradictory results. This leads to a clear-cut ne‐cessity for virtual microscopy and digital image analysis. Toll-like receptor-4 (TLR4) expres‐sion can be analysed in liver biopsy by immunohistochemistry. The expression of TLR4 hasbeen shown in hepatic progenitor cells and interlobular bile duct epithelium in correlationwith stage of liver disease, grade of liver inflammation and activity of portal/septal myofi‐broblasts [54]. The expression of interferon stimulated gene 15 can be analysed by IHC atprotein level; up-regulation in hepatocytes is more pronounced in patients not respondingto interferon / ribavirin treatment in contrast to predominant expression in Kuppfer cells intreatment responders [55]. Proteomic studies including immunohistochemistry in liver biop‐
Liver Biopsy – Indications, Procedures, Results270

sy have targeted cell structure-associated proteins - actin, tropomyosin, transgelin and hu‐man microfibril-associated protein 4 in order to identify biomarkers of liver cirrhosis [56].COX-2 is over-expressed in chronic hepatitis C and the expression decreases following treat‐ment with interferon alpha regardless of sustained virological response [57]. Increased en‐doglin and TGF beta 1 expression is significantly associated with progressive hepaticfibrosis in chronic viral hepatitis C [58].
Cell cycle analysis can add valuable information [59]; digital image analysis should be add‐ed in the logistics again. Arrested cell cycle status has been demonstrated in chronic hepati‐tis C infection analysing the expression of mini-chromosome maintenance protein-2 ashigher sensitivity proliferation marker, G1 phase marker cyclin D1, S phase marker cyclin A,cell cycle regulators p21 and p53, apoptotic protein caspase 3 and anti-apoptotic proteinBcl-2 [60, 61]. When analysing liver biopsies from patients with chronic viral hepatitis C,higher G1 and lower S phase fractions has been found also by Werling et al., employing im‐age analysis method [59]. Apoptosis-related pathways can be explorated including evalua‐tion of Bax, Bcl-xL and Bcl-2 proteins [62]. Thus, hepatitis C virus infection can deregulatethe cellular processes [63] and it can be practical to reveal the way and degree of the regula‐tory shift.
Viral antigens including hepatitis C antigen can be detected in liver tissue by immunohisto‐chemistry [64]; the finding can be helpful in cases with difficult differential diagnosis orcombined liver pathology. The association of expression pattern with fibrosis may suggestpathogenetically important information as well [64].
Metabolic pathways can be evaluated in liver biopsy. For instance, widespread expression ofvitamin D receptor has been shown in the hepatocytes and inflammatory cells in case ofchronic liver disease including non-alcoholic steatohepatitis and chronic viral hepatitis C.The expression decreases as the liver histology is damaged [65].
Inflammatory cells are as important components in diffuse liver disease as the hepatocytes.Thus, higher numbers of intrahepatic follicular T-helper lymphocytes in conjunction withIL28B polymorphism analysis is found to be strongly predictive of treatment response usingpegylated interferon and ribavirin [66]. CD4+ regulatory T cells can be evaluated [67].
Logistic structures have been implemented to develop next generation toolkits for automat‐ed image analysis to enable quantification of molecular markers. The group of researchers[27] have collaborated within open source image analysis project [68] to reach effective out‐put by combination of quantitative analysis, multiplex quantum dot (nanoparticle) stainingand high resolution whole slide imaging to detect nine different fluorescent signals for mul‐tiple antigens [27].
DNA microarray technology has enabled genome-wide analysis of gene transcript levels.This technology has been applied in order to compare gene expression profiles at differentstages of chronic hepatitis C and hepatocellular carcinoma in the setting of hepatitis virus Cinfection [63, 69]. Hundreds of genes involved in carcinogenesis, cell growth, proliferationand death are differently expressed in advanced viral hepatitis C in comparison to early vi‐ral hepatitis C or non-viral hepatitis [63]. In chronic hepatitis C, the up-regulation involves
Future Aspects of Liver Biopsy: From Reality to Mathematical Basis of Virtual Microscopyhttp://dx.doi.org/10.5772/52753
271

genes related to metabolism and immune responses. In hepatocellular carcinoma arising inhepatitis C patients, genes associated with cell cycle, growth, proliferation and apoptosis areup-regulated [69]. Chronic hepatitis B and autoimmune liver disease have been studied bythis technology as well [70]. In advanced chronic viral hepatitis B, genes associated with ex‐tracellular matrix turnover, cell growth and DNA repair are up-regulated but the expressionof genes regulating complement activation and innate immune response is decreased. Inearly disease stages, the gene expression is different in case of chronic viral hepatitis B, auto‐immune hepatitis and primary biliary cirrhosis. Chronic viral hepatitis B is associated withexpression of genes considering chemotaxis and cell homeostasis; autoimmune hepatitis –with down-regulation of genes associated with protein binding, but primary biliary cirrhosisin early stages involves the actin and myosin gene expression. As chronic viral hepatitis Bprogresses, the expression of genes regarding signalling pathway, cell communication, col‐lagen turnover, chemokine ligands and metallothionein changes [70]. The findings are ofmajor interest displaying the pathogenesis of different inflammatory liver diseases and neo‐plastic transformation. Diagnostic consequences should follow soon as the differential diag‐nosis of inflammatory liver diseases regarding aetiology can represent a difficult task.
The level of mRNA can be post-transciptionally regulated by micro RNA (miRNA). The reg‐ulation of biological processes by miRNA is shown also in case of such canonical diffuse liv‐er disease as chronic viral hepatitis C. Technological studies have been conducted usingbiopsy material [71]. Transcriptome analysis has shown prognostic value, e.g., in order topredict the severity of fibrosis progression after liver transplantation in recurrent viral hepa‐titis C patients [72].
8. Conclusions
Liver biopsy investigation could soon shift from routine light microscopy to digital imageanalysis by virtual microscopy and incorporation of numerical measurements in conjunctionwith integrated analysis of cell functions at DNA, RNA, protein and signalling level. Thisshift could lead from static to dynamic tissue evaluation. The technological logistics shouldinclude the best standards of tissue fixation, processing, microtomy and visualisation com‐plemented by automated immunostaining, full slide scanning to ensure complete digitalanalysis and optimal choice of software considering the biological appropriateness of theanalysis algorithm.
As the diagnostic electron microscopy is continually developing, we expect that in future itwill be used in hepatology as an auxiliary method, based on digital analysis of electrono‐grams. Liver biopsy analysis using transmission and scanning electron microscope couldcontinue to provide important additional information in diagnostic hepatology and scientif‐ic research of liver diseases, as well as it could help to study unresolved molecular mecha‐nisms regulating liver cells’ functions. In future the ultrastructural studies of liver biopsy inhepatology will probably be associated with assessment of liver tissues in cases of livertransplantation, with studies of new medicinal products – detection or exclusion of their po‐
Liver Biopsy – Indications, Procedures, Results272

tential hepatotoxic effect, with identification of viruses, as well as with determination of in‐fluence of various environmental hazards.
Author details
Ludmila Viksna1,2, Ilze Strumfa1, Boriss Strumfs3, Valda Zalcmane1, Andrejs Ivanovs1 andValentina Sondore2
1 Riga Stradins University, Riga, Latvia
2 Riga Eastern Clinical University Hospital, Riga, Latvia
3 Latvian Institute of Organic Synthesis, Riga, Latvia
References
[1] Churukian CJ. Pigments and minerals. In: Theory and practice of histological techni‐ques, 5th ed. Ed. by Bancroft JD, Gamble M. Churchill Livingstone, Edinburgh, 2002.p243-267.
[2] Gamble M, Wilson I. The hematoxylins and eosin. In: Theory and practice of histo‐logical techniques, 5th ed. Ed. by Bancroft JD, Gamble M. Churchill Livingstone, Ed‐inburgh, 2002. p125-138.
[3] Jones ML. Connective tissues and stains. In: Theory and practice of histological tech‐niques, 5th ed. Ed. by Bancroft JD, Gamble M. Churchill Livingstone, Edinburgh,2002. p139-162.
[4] Jones ML. Lipids. In: Theory and practice of histological techniques, 5th ed. Ed. byBancroft JD, Gamble M. Churchill Livingstone, Edinburgh, 2002. p201-230.
[5] Totty BA. Mucins. In: Theory and practice of histological techniques, 5th ed. Ed. byBancroft JD, Gamble M. Churchill Livingstone, Edinburgh, 2002. p163-200.
[6] Kanel GC, Korula J. Atlas of liver pathology, 3rd ed. Elsevier Saunders, USA, 2011.
[7] Knodell RG,Ishak KG, Black WC, Chen TS, Craig R, Kaplowitz N, Kiernan TW, Woll‐man J. Formulation and application of a numerical scoring system for assessing his‐tological activity in asymptomatic chronic active hepatitis. Hepatology, 1981;1:431-435.
[8] Scheuer PJ. Classification of chronic viral hepatitis: a need for reassessment. J Hepa‐tol, 1991; 13:372-374.
Future Aspects of Liver Biopsy: From Reality to Mathematical Basis of Virtual Microscopyhttp://dx.doi.org/10.5772/52753
273

[9] Ishak K, Baptista A, Bianchi L, Callea F, De Groote J, Gudat F, Denk H, Desmet V,Korb G, MacSween RN. Histological grading and staging of chronic hepatitis. J Hep‐atol, 1995; 22:696-699.
[10] Bedossa P, Poynard T. An algorithm for the grading of activity in chronic hepatitis C.The METAVIR Cooperative Study Group. Hepatology, 1996; 24:289-293.
[11] Shiha G, Zalata K. Ishak versus METAVIR: terminology, convertibility and correla‐tion with laboratory changes in chronic hepatitis C. In: Liver Biopsy, ISBN:978-953-307-644-7. Ed. by Takahashi H. InTech, 2011.
[12] Giansanti D, Grigioni M, D’Avenio G, Morelli S, Maccioni G, Bondi A, GiovagnoliMR. Virtual microscopy and digital cytology: state of the art. Ann Ist Super Sanita,2010; 46(2):115-122.
[13] Pantanowitz L, Valenstein PN, Evans AJ, Kaplan KJ, Pfeifer JD, Wilbur DC, CollinsLC, Colgan TJ. Review of the current state of whole slide imaging in pathology. JPathol Inform, 2011: 2:36, doi:10.4103/2153-3589.83746.
[14] Kayser K, Gortler J, Borkenfeld S, Kayser G. How to measure diagnosis-associated in‐formation in virtual slides. Diagn Pathol, 2011; 6 (Suppl 1):S9.
[15] Grizzi F, Ceva-Grimaldi G, Dioguardi N. Fractal geometry: a useful tool for quantify‐ing irregular lesions in human liver biopsy specimens. Ital J Anat Embryol, 2001;106(2 Suppl 1):337-346.
[16] Dioguardi N, Franceschini B, Russo C, Grizzi F. Computer-aided morphometry ofliver inflammation in needle biopsies. World J Gastroenterol, 2005; 11(44):6995-7000.
[17] Marsman H, Matsushita T, Dierkhising R, Kremers W, Rosen C, Burgart L, NybergSL. Assessment of donor liver steatosis: pathologist or automated software? HumPathol, 2004; 35:430-435.
[18] Liquori GE, Calamita G, Cascella D, Mastrodonato M, Portincasa P, Ferri D. An inno‐vative methodology for the automated morphometric and quantitative estimation ofliver steatosis. Histol Histopathol, 2009; 24(1):49-60.
[19] Rawlins SR, El-Zammar O, Zinkievich JM, Newman N, Levine RA. Digital quantifi‐cation is more precise than traditional semiquantitation of hepatic steatosis: correla‐tion with fibrosis in 220 treatment-naive patients with chronic hepatitis C. Dig DisSci, 2010; 55(7):2049-2057.
[20] O’Brien MJ, Keating NM, Elderiny S, Cerda S, Keaveny AP, Afdhal NH, Nunes DP.An assessment of digital image analysis to measure fibrosis in liver biopsy specimensof patients with chronic hepatitis C. Am J Clin Pathol, 2000; 114(5):712-718.
[21] Maduli E, Andorno S, Rigamonti C, Capelli F, Morelli S, Colombi S, Nicosia G, Bol‐dorini R, Abate M, Sartori M. Evaluation of liver fibrosis in chronic hepatitis C with acomputer-assisted morphometric method. Ann Ital Med Int, 2002; 17(4):242-247.
Liver Biopsy – Indications, Procedures, Results274

[22] Wright M, Thursz M, Pullen R, Thomas H, Goldin R. Quantitative versus morpho‐logical assessment of liver fibrosis: semi-quantitative scores are more robust thandigital image fibrosis area estimation. Liver Int, 2003; 23:28-34.
[23] Dahab GM, Kheriza MM, El-Beltagi HM, Fouda AMM, El-Din OAS. Digital quantifi‐cation of fibrosis in liver biopsy sections: description of a new method by Photoshopsoftware. J Gastroenterol Hepatol, 2004; 19:78-85.
[24] Xie SB, Ma C, Lin CS, Zhang Y, Zhu JY, Ke WM. Collagen proportionate area of livertissue determined by digital image analysis in patients with HBV-related decompen‐sated cirrhosis. Hepatobiliary Pancreat Dis Int, 2011; 10(5):497-501.
[25] Khan S, Dodson A, Campbell F, Kawesha A, Grime JS, Critchley M, Sutton R. Prog‐nostic potential of hepatocyte volume and cytokine expression in cirrhotic portal hy‐pertension. J Gastroenterol Hepatol, 2005; 20(10):1519-1526.
[26] Ryoo JW, Buschmann RJ. Morphometry of liver parenchyma in needle biopsy speci‐mens from patients with alcoholic liver disease: preliminary variables for the diagno‐sis and prognosis of cirrhosis. Mod Pathol, 1989; 2(4):382-389.
[27] Isse K, Grama K, Abbott IM, Lesniak A, Lunz JG, Lee WM, Specht S, Corbitt N, Miz‐uguchi Y, Roysam B, Demetris AJ. Adding value to liver (and allograft) biopsy evalu‐ation using a combination using a combination of multiplex quantum dotimmunostaining, high-resolution whole-slide digital imaging, and automated imageanalysis. Clin Liver Dis, 2010; 14(4):669-685.
[28] Bellentani S, Tiribelli C, Saccoccio G, Sodde M, Fratti N, De Martin C, Cristianini G.Prevalence of chronic liver disease in the general population of northern Italy: TheDionysos Study. Hepatology, 1994; 20(6):1442-1449.
[29] Hornboll P, Olsen TS. Fatty changes in the liver: the relation to age, overweight anddiabetes mellitus. Acta Pathol Microbiol Immunol Scand A, 1982; 90(3):199-205.
[30] Turlin B, Ramm GA, Purdie DM, Laine F, Perrin M, Deugnier Y, Macdonald GA. As‐sessment of hepatic steatosis: comparison of quantitative and semiquantitative meth‐ods in 108 liver biopsies. Liver Int, 2009; 29(4):530-535; doi:10.1111/j.1478-3231.2008.01874.x
[31] Ploeg RJ, D’Alessandro AM, Knechtle SJ, Stegall MD, Pirsch JD, Hoffmann RM, Sasa‐ki T, Sollinger HW, Belzer FO, Kalayoglu M. Risk factors for primary dysfunction af‐ter liver transplantation: A multivariate analysis. Transplantation, 1993; 55:807-813.
[32] Turlin B, Mendler MH, Moirand R, Guyader D, Guillygomarc’h A, Deugnier Y. His‐tologic features of the liver in insulin resistance-associated iron overload. A study of139 patients. Am J Clin Pathol, 2001; 116:263-270.
[33] Franzen LE, Ekstedt M, Kechagias S, Bodin L. Semiquantitative evaluation overesti‐mates the degree of steatosis in liver biopsies: a comparison to stereological pointcounting. Mod Pathol, 2005; 18(7):912-916.
Future Aspects of Liver Biopsy: From Reality to Mathematical Basis of Virtual Microscopyhttp://dx.doi.org/10.5772/52753
275
[34] Lok AS, Everhart JE, Chung RT, Padmanabhan L, Greenson JK, Shiffman ML, Ever‐son GT, Lindsay KL, Bonkovsky HL, Di Bisceglie AM, Lee WM, Morgan TR, GhanyMG, Morishima C; HALT-C Trial Group. Hepatic steatosis in hepatitis C: Compari‐son of diabetic and nondiabetic patients in the hepatitis C antiviral long-term treat‐ment against cirrhosis trial. Clin Gastroenterol Hepatol, 2007; 5(2):245-254.
[35] Lok AS, Everhart JE, Chung RT, Kim HY, Everson GT, Hoefs JC, Greenson JK, Ster‐ling RK, Lindsay KL, Lee WM, Di Bisceglie AM, Bonkovsky HL, Ghany MG, Morish‐ima C; HALT-C Trial Group. Evolution of hepatic steatosis in patients with advancedhepatitis C: results from the hepatitis C antiviral long-term treatment against cirrho‐sis (HALT-C) trial. Hepatology, 2009; 49(6):1828-1837.
[36] Markin RS, Wisecarver JL, Radio SJ, Stratta RJ, Langnas AN, Hirst K, Shaw BW Jr.Frozen section evaluation of donor livers before transplantation. Transplantation,1993; 56(6):1403-1409.
[37] Trevisani F, Colantoni A, Caraceni P, Van Thiel DH. The use of donor fatty liver forliver transplantation: a challenge or a quagmire? J Hepatol, 1996; 24(1):114-121.
[38] Fukumoto S, Fujimoto T. Deformation of lipid droplets in fixed samples. HistochemCell Biol, 2002; 118:423-428.
[39] Redden JP, Hoch SJ. The presence of variety reduces perceived quantity. J ConsumRes, 2009; 36:406-417.
[40] Dioguardi N, Grizzi F, Fiamengo B, Russo C. Metrically measuring liver biopsy: Achronic hepatitis B and C computer-aided morphological description. World J Gas‐troenterol, 2008; 14(48):7335-7344.
[41] Standish RA, Cholongitas E, Dhillon A, Burroughs AK, Dhillon AP. An appraisal ofthe histopathological assessment of liver fibrosis. Gut, 2006; 55:569-578.
[42] Calvaruso V, Burroughs AK, Standish R, Manousou P, Grillo F, Leandro D, MaimoneS, Plequezuelo M, Xirouchakis I, Guerrini GP, Patch D, Yu D, O’Beirne J, Dhillon AP.Computer-assisted image analysis of liver collagen: relationship to Ishak scoring andhepatic venous pressure gradient. Hepatology, 2009; 49:1236-1244.
[43] Masseroli M, Caballero T, O’Valle F, Del Moran RM, Perez-Milena A, Del Moral RG.Automatic quantification of liver fibrosis: design and validation of a new image anal‐ysis method: comparison with semi-quantitative indexes of fibrosis. J Hepatol, 2000;32(3):453-464.
[44] Chevallier M, Guerret S, Chossegros P, Gerard F, Grimaud JA. A histological semi‐quantitative scoring system for evaluation of hepatic fibrosis in needle liver biopsyspecimens: comparison with morphometric studies. Hepatology, 1994; 20(2):349-355.
[45] Kage M, Shimamatu K, Nakashima E, Kojiro M, Inoue O, Yano M. Long-term evolu‐tion of fibrosis from chronic hepatitis to cirrhosis in patients with hepatitis C: mor‐phometric analysis of repeated biopsies. Hepatology, 1997; 25(4):1028-1031.
Liver Biopsy – Indications, Procedures, Results276

[46] Duchatelle V, Marcellin P, Giostra E, Bregeaud L, Pouteau M, Boyer N, Auperin A,Guerret S, Erlinger S, Henin D, Degott C. Changes in liver fibrosis at the end of alphainterferon therapy and 6 to 18 months later in patients with chronic hepatitis C:quantitative assessment by a morphometric method. J Hepatol, 1998; 29(1):20-28.
[47] Pilette C, Rousselet MC, Bedossa P, Chappard D, Oberti F, Rifflet H, Maiga MY, Gal‐lois Y, Cales P. Histopathological evaluation of liver fibrosis: quantitative image anal‐ysis vs. semi-quantitative scores. J Hepatol, 1998; 28(3):439-446.
[48] Mandelbrot BB. The fractal geometry of nature. Freeman, San Francisko, 1982.
[49] Landini G. Fractals in microscopy. J Microsc, 2011; 241(1):1-8.
[50] Hurst HE. Lon-term storage capacity of reservoirs. Trans Amer Soc Civ Eng, 1951;116:770-808.
[51] Karperien AL, Jelinek HF, Buchan AM. Box-counting analysis of microglia form inschizophrenia, Alzheimer’s disease and affective disorder. Fractals, 2008; 16(2):103,doi: 10.1142/S0218348X08003880.
[52] Karperien A, Jelinek HF, Leandro JJ, Soares JV, Cesar RM Jr., Luckie A. Automateddetection of proliferative retinopathy in clinical practice. Clin Ophthalmol, 2008; 2(1):109-122.
[53] Wieckowska A, Papouchado BG, Li Z, Lopez R, Zein NN, Feldstein AE. Increasedhepatic and circulating interleukin-6 levels in human nonalcoholic steatohepatitis.Am J Gastroenterol, 2008; 103(6):1372-1379.
[54] Vespasiani-Gentilucci U, Carotti S, Onetti-Muda A, Perrone G, Ginanni-Corradini S,Latasa MU, Avila MA, Carpino G, Picardi A, Morini S. Toll-like receptor-4 expres‐sion by hepatic progenitor cells and biliary epithelial cells in HCV-realted chronicliver disease. Mod Pathol, 2012; 25(4):576-589.
[55] Chen L, Borozan I, Sun J, Guindi M, Fischer S, Feld J, Anand N, Heathcote J, Ed‐wards AM, McGilvray ID. Cell-type specific gene expression signature in liver un‐derlies response to interferon therapy in chronic hepatitis C infection.Gastroenterology, 2010; 138(3):1123-1133.
[56] Molleken C, Sitek B, Henkel C, Poschmann G, Sipos B, Wiese S, Warscheid B,Broelsch C, Reiser M, Friedman SL, Tornoe I, Schlosser A, Kloppel G, Schmiegel W,Meyer HE, Holmskov U, Stuhler K. Detection of novel biomarkers of liver cirrhosisby proteomic analysis. Hepatology, 2009; 49(4):1257-1266.
[57] Manning DS, Sheehan KM, Byrne MF, Kay EW, Murray FE. Cyclooxygenase-2 ex‐pression in chronic hepatitis C and the effect of interferon alpha treatment. J Gastro‐enterol Hepatol, 2007; 22(10):1633-1637.
[58] Clemente M, Nunez O, Lorente R, Rincon D, Matilla A, Salcedo M, Catalina MV, Ri‐poll C, Iacono OL, Banares R, Clemente G, Garcia-Monzon C. Increased intrahepaticand circulating levels of endoglin, a TGF-beta1 c-receptor, in patients with chronic
Future Aspects of Liver Biopsy: From Reality to Mathematical Basis of Virtual Microscopyhttp://dx.doi.org/10.5772/52753
277

hepatitis C virus infection: relationship to histological and serum markers of hepaticfibrosis. J Viral Hepat, 2006; 13(9):625-632.
[59] Werling K, Szentirmay Z, Szepesi A, Schaff Z, Szalay F, Szabo Z, Telegdy L, David K,Stotz G, Tulassay Z. Hepatocyte proliferation and cell cycle phase fractions in chronicviral hepatitis C by image analysis method. Eur J Gastroenterol Hepatol, 2010; 13(5):489-493.
[60] Marshall A, Rushbrook S, Daves SE, Morris LS, Scott IS, Vowler SL, Coleman N,Alexander G. Relation between hepatocyte G1 arrest, impaired hepatic regeneration,and fibrosis in chronic hepatitis C virus infection. Gastroenterology, 2005; 128(1):33-42.
[61] Sarfraz S, Hamid S, Siddiqui A, Hussain S, Pervez S, Alexander G. Altered expres‐sion of cell cycle and apoptotic proteins in chronic hepatitis C virus infection. BMCMicrobiology, 2008; 8:133, doi:10.1186/1471-2180-8-133.
[62] Piekarska A, Kubiak R, Omulecka A, Szymczak W, Piekarski J. Expression of Bax,Bcl-xL and Bcl-2 proteins in relation to grade of inflammation and stage of fibrosis inchronic hepatitis C. Histopathology, 2007; 50(7):928-935.
[63] Khalid SS, Hamid S, Siddiqui AA, Qureshi A, Qureshi N. Gene profiling of early andadvanced liver disease in chronic hepatitis C patients. Hepatol Int, 2011; 5(3):782-788.
[64] Shiha GE, Zalata KR, Abdalla AF, Mohamed MK. Immunohistochemical identifica‐tion of HCV target antigen in paraffin-embedded liver tissue: reproducibility andstaining patterns. Liver Int, 2005; 25(2):254-260.
[65] Barchetta I, Carotti S, Labbadia G, Vespasiani GU, Onetti MA, Angelico F, SilecchiaG, Leonetti F, Fraioli A, Picardi A, Morini S, Cavallo M. Liver VDR, CYP2R1 andCYP27A1 expression: Relationship with liver histology and vitamin D3 levels in pa‐tients with NASH or HCV hepatitis. Hepatology, 2012, Epub ahead of print on Jun30, 2012; doi: 10.1002/hep.25930.
[66] Tripodo C, Petta S, Guarnotta C, Pipitone R, Cabibi D, Colombo MP, Craxi A. Liverfollicular helper T-cells predict the achievement of virological response following in‐terferon-based treatment in HCV-infected patients. Antivir Ther, 2012; 17(1):111-118.
[67] Yang G, Liu A, Xie Q, Guo TB, Wan B, Zhou B, Zhang JZ. Association ofCD4+CD25+Foxp3+ regulatory T cells with chronic activity and viral clearance in pa‐tients with hepatitis B. Int Immunol, 2007; 19(2):133-140.
[68] Farsight; http://farsight-toolkit.org (accessed 31.07.2012.)
[69] Furuta K, Sato S, Yamauchi T, Kakumu S. Changes in intrahepatic gene expressionprofiles from chronic hepatitis to hepatocellular carcinoma in patients with hepatitisC virus infection. Hepatol Res, 2008; 38(7):673-682.
Liver Biopsy – Indications, Procedures, Results278

[70] Furuta K, Sato S, Yamauchi T, Ozawa T, Harada M, Kakumu S. Intrahepatic gene ex‐pression profiles in chronic hepatitis B and autoimmune liver disease. J Gastroenter‐ol, 2008; 43(11):866-874.
[71] Peng X, Li Y, Walters KA, Rosenzweig ER, Lederer SL, Aicher LD, Proll S, Katze MG.Computational identification of hepatitis C virus associated microRNA-mRNA regu‐latory modules in human livers. BMC Genomics, 2009; 10:373.
[72] Mas V, Maluf D, Archer KJ, Potter A, Suh J, Gehray R, Descalzi V, Villamil F. Tran‐scriptome at the time of hepatitis C virus recurrence may predict the severity of fib‐rosis progression after liver transplantation. Liver Transpl, 2011; 17(7):824-835.
Future Aspects of Liver Biopsy: From Reality to Mathematical Basis of Virtual Microscopyhttp://dx.doi.org/10.5772/52753
279


Chapter 13
Real-Time Tissue Elastography and TransientElastography for Evaluation of Hepatic Fibrosis
Hiroyasu Morikawa
Additional information is available at the end of the chapter
http://dx.doi.org/10.5772/52695
1. Introduction
Liver fibrosis develops as a sequel of chronic liver injury of various etiologies, including vi‐ral infection, immunological reaction, and toxic and metabolic insults, and is characterizedby the accumulation of extracellular matrix(ECM) components produced by fibroblast-likecells including activated stellate cells and myofibroblasts in the hepatic parenchyma. Hepat‐ic fibrosis progresses towards cirrhosis, an end-stage liver injury, leading to hepatic failure,hepatocellular carcinoma, and finally death. Hepatitis C virus (HCV) infection is the mostcommon cause of liver fibrosis. HCV infects approximately 170 million individuals world‐wide according to a report from the
World Health Organization [1]. Liver biopsy has been considered the ‘gold standard’ meth‐od for the evaluation of liver fibrosis in chronic hepatitis C [2]. However, liverbiopsy hassome limitations, including its invasiveness, risk of complications, sampling error, variabili‐ty in histopathological interpretation, and the reluctance of patients to subject to repeatedexaminations [3-11].Because of these disadvantages, there is a growing shift inclinical prac‐tice to utilize or develop ‘non-invasive’methodologies to evaluate the stage of liver fibrosis.In particular, liver stiffness measurement by Vibration-Controlled Transient Elastography(Fibroscan) has become establishedas an important modality. Recently we and other investi‐gator reported the usefulness of real-time tissue elastography (RTE) for noninvasive, visualassessment of liver stiffness in patients with chronic hepatitis C [12.13]. RTE is a method in‐tegrated in a sonography machine and developed in Japan for the visual assessment of tis‐sue elasticity, based on a Combined Autocorrelation Method that calculates rapidly therelative hardness of tissue from the degree of tissue distortion and which displays this infor‐mation as a color image [14]. This technology has already been proved to be diagnostically
© 2012 Morikawa; licensee InTech. This is an open access article distributed under the terms of the CreativeCommons Attribution License (http://creativecommons.org/licenses/by/3.0), which permits unrestricted use,distribution, and reproduction in any medium, provided the original work is properly cited.

valuable in the breast cancer [15]. We show here the additional value of RTE, in comparsionto Fibroscanin patients with chronic liver disease.
2. Principle of elastography imaging
The two major categories of non-invasive hepatic elasticity imaging are dynamic elastogra‐phy techniques, such as Fibroscan, and static elastography techniques, such as RTE. Atpresent the dynamic elastography techniques have the advantage of allowing a quantitativeimaging and better resolution than the static elastography techniques. These techniques re‐quire more complex equipment for the generation mode and imaging modalities. Ultra‐sound and magnetic resonance imaging are the major imaging modalities. The dynamicelastography techniques may be devided into two groups, based on the method of generat‐ing the shear wave: remote generation using radiation force and mechanical vibration. Ofthe static elastography techniques, real time tissue elastography developed by Hitachi Medi‐cal is most advanced ultrasound technique and can reveal tissue distortion using the hartbeat and pulsing of the aorta. Several elastography techniques are summarized in Table 1.
Principle Mode of generation Imaging modality
Real-time Tissue Elastography (RTE) Tissue distortion Pulsing of the aorta Ultrasound
Vibration-Controlled Transient
Elastography (VCTE, Fibroscan)
Propagating shear wave Mechanical vibration Ultrasound
Acoustic Radiation Force Impulse
(ARFI)
Propagating shear wave Radiation force Ultrasound
Magnetic Resonance Elastography
(MRE)
Propagating shear wave Mechanical vibration Magnetic resonance
imaging
Supersonic Shear Imaging (SSI) Propagating shear wave Radiation force Ultrasound
Table 1. Elastography techniques for measurement of liver stiffness.
3. Real time tissue elastography
The principle underlining RTE is shown in Figure 1A, which illustrates this as a spring mod‐el [16]. When a spring is compressed, the displacement in each section of the spring dependson its stiffness: a soft spring compresses more than a hard spring. The strain distribution canbe measured by differentiating the spatial displacement at each location. Although the tissuedisplacement usually is generated by manual compression and relaxation of the probe inpractice, we were able to improve the acquisition of RTE images representing the distortionof liver tissue as a result of the beating of the heart or pulsing of the abdominal aorta.
Liver Biopsy – Indications, Procedures, Results282

RTE is carried out using a high quality ultrasound system (Hitachi AlokaMedical, Chiba, Ja‐pan). The software uses a complex algorithm to process in a very short time all the datacoming from the lesion as radiofrequency impulses and to minimize the artifacts due to lat‐eral dislocations, allowing accurate measurement of the degree of tissue distortion. We usedthe Hitachi EUB-8500 and EUP-L52 Linear probe (3–7 MHz; Hitachi AlokaMedical) for RTE.
Figure 1. The principle and procedure of image analyses for real-time tissue elastography.(A) When a spring is com‐pressed, displacement in each section of the spring depends on the stiffness of that part of the spring: a soft sectioncompresses more than a hard section. The strain distribution can be measured by differentiating the spatial displace‐ment at each location. (B) The ROI was fixed to a rectangle of approximately 20-30 mm length x 20 mm breadth witha 400–600 mm2 area located 5-10 mm below the surface of the liver.left; RTE image, right; B-mode image. (C-D) Thecolor-coded images from the ROI of the RTE were analyzed by the software Elasto_ver1.5.1. The colors ranged fromblue to red indicating the relative gradients from hardness to softness. The Mean and Standard deviation were calcu‐lated by a histogram, which was generated by 256 stepwise grading derived from the color image. The Area and Com‐plexity were calculated from the binary image. Area was derived from the percentage of white regions (asterisks, i.e.hard area). Complexity was calculated asperiphery2/Area. Median value of the data were recorded as representativeof RTE parameters.
This system is currently commercially available for the diagnosis of mammary neoplasm.Patients were examined in a supine position with the right arm elevated above the head,and were instructed to hold their breath. The examination was performed on the right lobeof the liver through the intercostal space, and liver biopsy and Fibroscan also were per‐formed at the same site. The RTE equipment displays two images simultaneously; oneshows the regions of interest (ROI) as a colored area and the other indicates the conventional
Real-Time Tissue Elastography and Transient Elastography for Evaluation of Hepatic Fibrosishttp://dx.doi.org/10.5772/52695
283

B-mode image (Fig. 1B). We chose an area where the tissue was free from large vessels andnear the biopsy point. The measurement was fixed to a rectangle 30 mm in length and 20mm in breadth located 5-10 mm below the surface of the liver (Fig. 1B). The color in the ROIwas graded from blue (representing hard areas) to red (representing soft areas, Fig. 1B). Westored the RTE images for 2- 3min as moving digital images (Fig. 1B) and ten static imageswere captured at random from the moving images by the observer using AVI2JPG v6.10converter software (Novo, Tokyo, Japan) and analyzed on a personal computer using thenovel software Elasto_ver 1.5.1,which was developed and donated by Hitachi Medical. Nu‐merical values of pixels were from 0 to 255 (256 stepwise grading) according to color map‐ping from blue (0) to red (255), and a histogram of the distribution was generated (Fig. 1C).The scale ranged from red for components with the greatest strain (i.e., the softest compo‐nents) to blue for those with no strain (i.e., the hardest components). Green indicated aver‐age strain in the ROI, and therefore intact liver tissue was displayed as a diffusehomogeneous green pattern. An appearance of unevenness in the color pattern was consid‐ered to reflect a change in the liver stiffness. For quantification, all pixel data in the coloredimage were transferred into a histogram and binary image (Fig. 1C, D).
4. Vibration-controlled transient elastography (Fibroscan)
Fibroscan, which has been developed for the measurement of liver stiffness, is currently con‐sidered to reflect the degree of liver fibrosis directly and better than other methods. Fibro‐Scan502 was developed by ECOSENS (Paris, France) to evaluate liver fibrosis noninvasivelyin a short examination period by measuring the propagation of low frequency signals of amechanical shear wave running through the liver tissue. Fibroscan measures liver stiffnessin a volume that approximates a cylinder 10-mm wide and 40-mm in length between 25 and65 mm below the skin surface. This volume is at least 100 times greater than that obtainedby liver biopsy and is therefore considered to be far more representative of the condition ofthe hepatic parenchyma [17-21].The results that were obtained from ten valid measurementswith a success rate of at least 60% and an interquartile range under 30% were consideredsuccessful. Failure was defined as when fewer than ten valid measurements were obtained.The median of 10 valid measurements was expressed in kilopascals (kPa) and regarded asthe liver stiffness of a given subject.
Reports in 2005 from Castera et al. and Ziol et al. were pioneering; the liver stiffness measure‐ments could be useful for assessing the presence of significant fibrosis (F2-4) and for suggest‐ing the presence of cirrhosis in cohorts of patients with chronichepatitis C. The AUROCsranged from 0.79 to 0.83 for the prediction of F2-4 and were over 0.95 for the identification ofcirrhosis [22, 23]. Moreover, reproducibility of Fibroscan has been shown to be excellent forboth interobserver and intraobserver agreement with an intraclass correlation coefficient of0.98 [24, 25]. Friedrich-Rust et al. [26] assessed the overall performance of TE for the diagnosisof liver fibrosis by a meta-analysis that included fifty articles; the mean AUROCs for the diag‐nosis of significant fibrosis, severe fibrosis, and cirrhosis were 0.84, 0.89, and 0.94, respective‐ly. A recent report from Degos et al. [27] of amulticenter prospective study reported that the
Liver Biopsy – Indications, Procedures, Results284

AUROCs for the diagnosis of significant fibrosis and cirrhosis were 0.76 and 0.90, respectively.Table 2 shows concisely the diagnostic accuracy of Fibroscan. The limitations of this method al‐so have been discussed; intraobserver agreement is influenced by variables, such as body massindex (particularly when<28 kg/m2), hepatic steatosis, and flares of transaminases [17.23].
Study Patients (n) Prognosis Cutoff
(kPa)
Sen Spe PPV NPV AUC
Catera et al.
2005
n=183, CHC ≥F2
Cirrhosis
7.1
12.5
67%
87%
89%
91%
95%
77%
48%
95%
0.83
0.95
Zioi et al.
2005
n=251, CHC ≥F2
Cirrhosis
8.6
14.6
56%
86%
91%
96%
88%
78%
56%
97%
0.79
0.97
Friedrich-Rust et al.
2008
50 studies, liver
disease
≥F2
Cirrhosis
0.84
0.94
Degos et al. 2010 n=1307, viral
hepatitis
≥F2
Cirrhosis
5.2
12.9
90%
70%
34%
90%
64%
53%
72%
95%
0.76
0.79
Sen, Sensitivity; Spe, Specificity; PPV, Positive Predictive Value; NPV, Negative Predictive Value; AUC, Area Under theReceiver-Operator-Characteristic curve; CHC, chronic hepatitis C.
Table 2. Diagnostic accuracies of transient elastography
5. Acoustic Radiation Force Impulse (ARFI) and Magnetic ResonanceElastography (MRE)
The technology applied most recent is acoustic radiation force impulse (ARFI) imaging. AR‐FI imaging permits evaluation of the elastic properties of a region of interest during real-time B-mode conventional hepatic US examination. Results are expressed in meters persecond and the region of interest can be chosen using ultrasound guidance, there by avoid‐ing large blood vessels and the ribs. Previous reports have indicated that the diagnosticpower of ARFI imaging for the staging of liver fibrosis is the same as that of Fibroscan [28.29].
New technological advances have been made in the clinical application of MRI such as dif‐fusion-weighted MRI and MRI elastography. The former measures the apparent diffusioncoefficient of water and the parameter is dependent on the tissue structure [30]. The lattermeasures the propagation characteristic of the shear waves from an acoustic driver withinthe liver. Although MRI elastography has been shown to be superior to APRI and Fibroscanfor determining the stage of fibrosis in patients with various under lying liver diseases [31],it cannot be performed on aniron-overloaded liver because of noise. In addition, MRI takeslonger and costs more than the ultrasound-base delastographic examinations.
Real-Time Tissue Elastography and Transient Elastography for Evaluation of Hepatic Fibrosishttp://dx.doi.org/10.5772/52695
285

6. Our results
Patients: Two hundred and one patients with chronic hepatitis received liver biopsy and Fi‐broscan examination within one week after RTE procedure in the Department of Hepatolo‐gy, Osaka City University Hospital between 2007 and 2010. Etiologies of chronic liverdiseases were hepatitis C virus (CHC; n=129, 64.2 %), hepatitis B virus infection (n=13, 6.5%), non-alcohol steatohepatitis (n=30, 14.9 %), and others (n=29, 14.4 %). Liver fibrosis wasevaluated according to the METAVIR score. Table 3 shows the characteristics of the patientswho received these examinations.
Sex: male/ female 89/112
Age 55±13 y (21-80)*
BMI (kg/m2) 22.7±3.5 (14.1-33.2)*
Fibrosis stage(METAVIR Score)
F0 16
F1 98
F2 33
F3 27
F4 27
Etiology
HCV 129
NASH 30
HBV 13
Autoimmune hepatitis 9
Primary biliary cirrhosis 6
Others 14
BMI, body mass index.
Table 3. Characteristics of the patients
Results: Histological and laparoscopical examination: 16 (8 %) patients were classified as F0, 98(49 %) as F1, 33 (16 %) as F2, 27 (13 %) as F3, and 27 (13 %) as F4 (cirrhosis). RTE was performedsuccessfully on all patients but Fibroscan measurements could not be obtained for 14 patients(7.0 %)because of obesity and liver atrophy. The Mean decreased in proportion to the increaseof fibrosis score (Jonckheere–Terpstra test, p<0.0001). SD, Area, Complexity, and Fibroscan in‐creased in proportion to the increase of fibrosis score (Jonckheere–Terpstra test, p< 0.0001).
Liver Biopsy – Indications, Procedures, Results286

Figure 2. Receiver operating characteristic curves of each parameter obtained by RTE and Fibroscan for F0-1.
Table 4 shows linear regression analysis of the values obtained by RTE compared to the liverstiffness values obtained by Fibroscan. Although simple regression analyses indicated thatMean, SD, Area, and Complexity were all significantly correlated with liver stiffness meas‐ured by Fibroscan, the r value did not indicate a high correlation.
Mean r=0.458
SD r=0.377
Area r=0.487
Complexity r=0.451
p<0.001)
Table 4. Correlation between fibroscan and the image features of RTE
The area under the receiver operating characteristic curve (AUC) for stage F0-1 were 0.69,0.65, 0.69, 0.67, and 0.87 for Mean, SD, Area, Complexity, and Fibroscan, respectively (Fig2).The AUC for stage F0-2 were 0.79, 0.70, 0.77, 0.73, and 0.87 for Mean, SD, Area, Complexi‐ty, and Fibroscan, respectively (Fig 3). The AUC for cirrhosis (F4) were 0.78, 0.68, 0.77, 0.76,and 0.84 for each of respective values (Fig 4).
Real-Time Tissue Elastography and Transient Elastography for Evaluation of Hepatic Fibrosishttp://dx.doi.org/10.5772/52695
287

Figure 3. Receiver operating characteristic curves of each parameter obtained by RTE and Fibroscan for F0-2.
Figure 4. Receiver operating characteristic curves of each parameter obtained by RTE and Fibroscan for F4.
Liver Biopsy – Indications, Procedures, Results288

7. Further research
Although our results showed that RTE was inferior to Fibroscan in determining the earlystage of liver fibrosis(Fig 2 and 3), Figure 4 indicated that the performance of RTE comparesfavorably with that of Fibroscan for detecting liver cirrhosis in patients with chronic hepati‐tis. Unfortunately the best method for the analysis and quantification of RTE remains un‐clear, but this may be determined by future multicenter studies using larger patient cohortsand the combination of these parameters will enable improvement of the accuracy of assess‐ing hepatic fibrosis.
Fibroscan has been reported to have several limitations and disadvantages in evaluating pa‐tients with obesity and ascites. In fact, in our study, we evaluated successfully all patientswith RTE, while Fibroscan measurements could not be obtained for fourteen patients be‐cause of obesity and liver atrophy (data not shown).
In the future, a combination of imaging modalities and serological parameters or of differentimaging modalities will improve further the accuracy in differentiating fibrosis stages. Inter‐estingly, Castera et al. reported that the best results were achieved by a combination of Fi‐broscan and the Fibro Test [22]. Although ARFI, the most recent technology, Fibroscan, andMRE are all based on shear wave propagation, RTE is constructed by an original theorywhich is based on tissue distortion. The best diagnostic accuracy will be obtained by com‐bining the RTE elasticity score with shear wave propagation.
8. Conclusion
We have described a static elastography technique, RTE, for the “noninvasive” visual assess‐ment of liver stiffness. Although RTE was inferior to Fibroscan in determining the earlystage of liver fibrosis, the performance of RTE compares favorably with that of Fibroscanwhen detecting liver cirrhosis in patients with chronic liver disease. We suggest that RTEcould also be used as a routine imaging method to evaluate the degree of liver fibrosis inpatients with other liver diseases. Future studies of larger patient cohorts will be necessaryfor the validation of RTE analysis, and the combination of RTE with other clinical values in‐cluding dynamic elastography techniques (i.e. Fibroscan, ARFI and MRE) and serum bio‐markers will enable improvement of the accuracy of assessing hepatic fibrosis.
Acknowledgments
We thank Ms. Akiko Tonomura and Mr. Junji Warabino, Hitachi AlokaMedical Co., for thetechnical support for RTE. Hiroyasu Morikawa was supported by a research grant from theCannon Foundation (2011-12).
Real-Time Tissue Elastography and Transient Elastography for Evaluation of Hepatic Fibrosishttp://dx.doi.org/10.5772/52695
289

Author details
Hiroyasu Morikawa
Department of Hepatology, Graduate School of Medicine, Osaka City University, Osaka, Ja‐pan
References
[1] Global surveillance and control of hepatitis C. Report of a WHO Consultation organ‐ized in collaboration with the Viral Hepatitis Prevention Board, Antwerp, Belgium. JViral Hepat. 1999;6:35–47.
[2] Bravo AA, Sheth SG, Chopra S. Liver biopsy. N Engl J Med.2001;344:495–500.
[3] Sporea I, Popescu A, Sirli R. Why, who and how should performliver biopsy inchronic liver diseases. World J Gastroenterol.2008;14:3396–402.
[4] Castera L, Negre I, Samii K, Buffet C. Pain experienced during percutaneous liver bi‐opsy. Hepatology. 1999;30:1529–30.
[5] Castera L, Negre I, Samii K, Buffet C. Patient administer ednitrous oxide/oxygen in‐halation provides safe and effective analgesia for percutaneous liver biopsy: arandomized placebo controlled trial. Am J Gastroenterol. 2001;96:1553–7.
[6] Piccinino F, Sagnelli E, Pasquale G, Giusti G. Complications following percutaneousliver biopsy. A multicentre retrospectivestudy on 68, 276 biopsies. J Hepatol.1986;2:165–73.
[7] Bedossa P, Darge`re D, Paradis V. Sampling variability of liver fibrosis in chronichepatitis C. Hepatology. 2003;38:1449–57.
[8] Regev A, Berho M, Jeffers LJ, Milikowski C, Molina EG, Pyrsopoulos NT, et al. Sam‐pling error and intraobserver variation in liver biopsy in patients with chronic HCVinfection. Am J Gastroenterol.2002;97:2614-8.
[9] Rousselet MC, Michalak S, Dupre F, Croue A, Bedossa P, SaintAndre JP, et al. Sour‐ces of variability in histological scoring of chronic viral hepatitis. Hepatology.2005;41:257–64.
[10] Bedossa P, Carrat F. Liver biopsy: the best, not the gold standard.J Hepatol.2009;50:1–3.
[11] Cadranel JF, Rufat P, Degos F. Practices of liver biopsy inFrance: results of a prospec‐tive nationwide survey. For the Groupof Epidemiology of the French Association forthe Study of theLiver (AFEF). Hepatology. 2000;32:477–81.
Liver Biopsy – Indications, Procedures, Results290

[12] Morikawa H, Fukuda K, Kobayashi S, Fujii H, Iwai S, Enomoto M, et al. Real-timetissue elastography as a tool for the noninvasive assessment of liver stiffness in pa‐tients with chronic hepatitis C. J Gastroenterol. 2011;46:350–8.
[13] Koizumi Y, Hirooka M, Kisaka Y, Konishi I, Abe M, MurakamiH, et al. Liver fibrosisin patients with chronic hepatitis C: noninvasive diagnosis by means of real-time tis‐sue elastographyestablishment of the method for measurement. Radiology.2011;258:610–7.
[14] Shiina T, Nitta N, Ueno E, Bamber JC. Real time tissue elasticity imaging using thecombined autocorrelation method. J MedUltrason. 2002;29:119–28.
[15] Itoh A, Ueno E, Tohno E, Kamma H, Takahashi H, Shiina T,et al. Breast disease: clini‐cal application of US elastography fordiagnosis. Radiology. 2006;239:341–50.
[16] Ophir J, Céspedes I, Ponnekanti H, Yazdi Y, Li X. (1991) Elastography: a quantitativemethod for imaging the elasticity of biological tissues. Ultrason Imaging.1991;13:111-34.
[17] Pinzani M, Vizzutti F, Arena U, Marra F. Technology insight:noninvasive assessmentof liver fibrosis by biochemical scoresand elastography. Nat ClinPractGastroenterol‐Hepatol. 2008;5:95–106.
[18] Sandrin L, Tanter M, Gennisson JL, Catheline S, Fink M. Shearelasticity probe for softtissues with 1D transient elastography. IEEE Trans UltrasonFerroelectrFreq Control.2002;49:436–46.
[19] Ganne-Carrie´ N, Ziol M, de Ledinghen V, Douvin C, Marcellin P, Castera L, et al.Accuracy of liver stiffness measurement for the diagnosis of cirrhosis in patients withchronic liver diseases. Hepatology. 2006;44:1511–7.
[20] Yeh WC, Li PC, Jeng YM, Hsu HC, Kuo PL, Li ML, et al. Elastic modulus measure‐ments of human liver and correlation with pathology. Ultrasound Med Biol.2002;28:467–74.
[21] Sandrin L, Fourquet B, Hasquenoph JM, Yon S, Fournier C, Mal F, et al. Transientelastography: a new noninvasive method for assessment of hepatic fibrosis. Ultra‐sound Med Biol. 2003;29: 1705–13.
[22] Castera L, Vergniol J, Foucher J, Le Bail B, Chanteloup E, Haaser M, et al. Prospectivecomparison of transient elastography, Fibrotest, APRI, and liver biopsy for the as‐sessment of fibrosis in chronic hepatitis C. Gastroenterology. 2005;128:343–50.
[23] Ziol M, Handra-Luca A, Kettaneh A, Christidis C, Mal F, Kazemi F, et al. Noninva‐sive assessment of liver fibrosis by measurement of stiffness in patients with chronichepatitis C. Hepatology. 2005;41:48–54.
[24] Fraquelli M, Rigamonti C, Casazza G, Conte D, Donato MF, Ronchi G, et al. Repro‐ducibility of transient elastography in the evaluation of liver fibrosis in patients withchronic liver disease. Gut. 2007;56:968–73.
Real-Time Tissue Elastography and Transient Elastography for Evaluation of Hepatic Fibrosishttp://dx.doi.org/10.5772/52695
291
[25] Boursier J, Konate A, Guilluy M, Gorea G, Sawadogo A,Quemener E, et al. Learningcurve and interobserver reproducibility evaluation of liver stiffness measurement bytransient elastography. Eur J GastroenterolHepatol. 2008;20:693–701.
[26] Friedrich-Rust M, Ong MF, Martens S, Sarrazin C, Bojunga J,Zeuzem S, et al. Per‐formance of transient elastography for the staging of liver fibrosis: a meta-analysis.Gastroenterology.2008;134:960–74.
[27] Degos F, Perez P, Roche B, Mahmoudi A, Asselineau J, Voitot H,et al. Diagnostic ac‐curacy of FibroScan and comparison to liver fibrosis biomarkers in chronic viral hep‐atitis: a multicenter prospective study (the FIBROSTIC study). J Hepatol.2010;53:1013–21.
[28] Friedrich-Rust M, Wunder K, Kriener S, Sotoudeh F, Richter S, Bojunga J, et al. Liverfibrosis in viral hepatitis: noninvasive assessment with acoustic radiation force im‐pulse imaging versustransient elastography. Radiology. 2009;252:595–604.
[29] Yoneda M, Suzuki K, Kato S, Fujita K, Nozaki Y, Hosono K,et al. Nonalcoholic fattyliver disease: US-based acoustic radiationforce impulse elastography. Radiology.2010;256:640–7.
[30] Lewin M, Poujol-Robert A, Boe°lle PY, Wendum D, Lasnier E,Viallon M, et al. Diffu‐sion-weighted magnetic resonance imaging for the assessment of fibrosis in chronichepatitis C. Hepatology.2007;46:658–65.
[31] Huwart L, Sempoux C, VicautE, Salameh N, Annet L, Danse E, et al. Magnetic reso‐nance elastography for the noninvasive staging of liver fibrosis. Gastroenterology.2008;135:32–40.
Liver Biopsy – Indications, Procedures, Results292