LiveOps Insight Reporting Guide
69
Version: 2.0 Revision Date: 2012-08-22 LiveOps Insight Reporting Guide LiveOps Insight is a suite that contains LiveDashboards and Historical Reporting applications. LiveOps Insight is designed to answer questions about any aspect of your Contact Center performance. Copyright © 2012 LiveOps, Inc. All rights reserved. LiveOps, LiveOps Applications, LiveOps Authoring, LiveOps Insight, LiveOps Social and LiveOps Voice are either registered trademarks or trademarks of LiveOps, Inc. All other names may be trademarks of their respective owners.
Transcript of LiveOps Insight Reporting Guide
Version: 2.0Revision Date: 2012-08-22
LiveOps Insight Reporting Guide
LiveOps Insight is a suite that contains LiveDashboards andHistorical Reporting applications. LiveOps Insight is designed toanswer questions about any aspect of your Contact Centerperformance.
Copyright © 2012 LiveOps, Inc. All rights reserved. LiveOps, LiveOps Applications, LiveOps Authoring, LiveOps Insight, LiveOps Social and LiveOps Voice areeither registered trademarks or trademarks of LiveOps, Inc. All other names may be trademarks of their respective owners.
LiveOps Insight Reporting GuideVersion: 2.0Revision Date: 2012-08-22
Table of Contents
Getting Started
IntroductionWhat is LiveOps Insight?
What's New?
About This Guide
Intended Audience
What You Should Know Before You Begin
Typographical Conventions
Further Reading
Contact Info
Revision History
1: New to LiveOps Insight? Start Here!1.1: UI Tour
1.2: The Report Process
2: Tutorials2.1: Quick Feature Tour
2.2: Running a Report
2.3: Drilling Down
2.4: Refining Your report
2.5: Saving Your Report
2.6: Printing Your Report
2.7: Emailing Your Report
2.8: Exporting Your Report
3: Understanding the Answer Table3.1: Answer Table Header
3.2: Query Results
3.3: Utility Links
4: Identifying a Contact: Calls vs. Messages4.1: Call Segments and Transfer
4.2: Calls and Date Constraints
4.3: The Call Visualizer
Refining Reports
5: Report Types5.1: Group vs. Detail Reports
5.2: The Report Type Glossary
6: Working with Dates6.1: Dates and Saved Reports
6.2: Enforcing Date Constraints
6.3: Querying For Generic Times
6.4: Using Date Math
6.5: Using Grouping to Compare Time Frames
7: Filtering Results7.1: Using the Where: Fields
7.2: Using the Having: Fields
7.3: Query Operators
8: Selecting Columns8.1: Show Fields
8.2: Field Categories
8.3: Field Extensions
9: Grouping Results9.1: Group By
10: Additional Query Options10.1: Include Outbound Calls not Connected to an Agent
10.2: Don't Display 'No' Columns
10.3: Don't Display Totals
10.4: Transpose Table
Managing Reports
11: Saving Reports11.1: Running a Saved Report
11.2: Report Categories
11.3: Report Options
11.4: Save a Copy
11.5: Deleting Reports
11.6: Dates and Saved Reports
12: Communicating Reports12.1: Emailing Reports
12.2: Exporting Reports
13: Best Practices13.1: Verifying Your Query
13.2: Reducing Query Time
13.3: Phone Number Format
13.4: Retrieving Null and Non-Null Values
13.5: Drilling Down
13.6: Troubleshooting
Reference
14: LiveOps Insight Capabilities14.1: System Requirements
14.2: Report Capabilities
14.3: Query Options
15: Report Type Descriptions15.1: Agents
15.2: Agent Status
15.3: Audit Results
15.4: Call Interaction
15.5: Call Segment
15.6: Concurrent Agents
15.7: Multichannel Agent Activity
15.8: Multichannel Messages
15.9: Multichannel Session
15.10: Quiz Answers
16: Field Categories16.1: Agents
16.2: Agent Status
16.3: Call Interaction
16.4: Call Segment
16.5: Telephony Billing
17: Field Glossary17.1: Selected Field Glossary
18: Query Operators
In this chapter...What is LiveOps Insight?
What's New?
About This Guide
Intended Audience
What You Should KnowBefore You Begin
Typographical Conventions
Further Reading
Contact Info
Revision History
Are you an experienced LiveOps Insight user? Read the LiveOps Insight Update Overview.
Download the PDF version.
Introduction
What is LiveOps Insight?
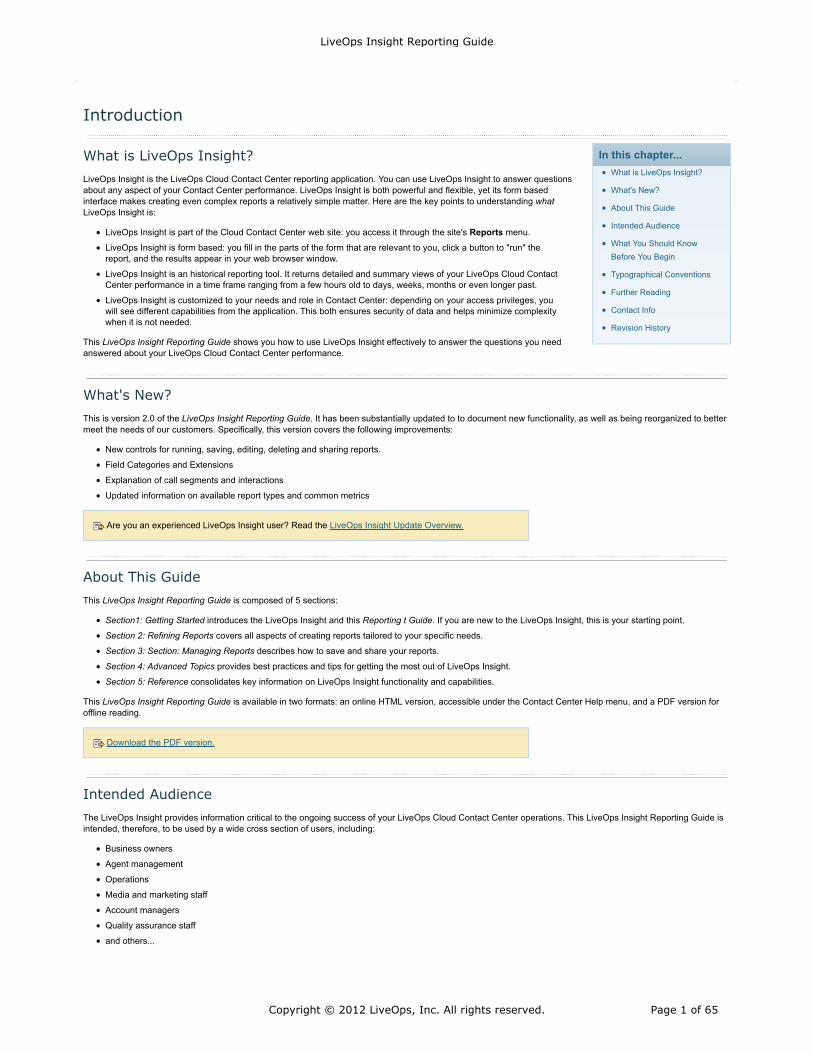
LiveOps Insight is the LiveOps Cloud Contact Center reporting application. You can use LiveOps Insight to answer questionsabout any aspect of your Contact Center performance. LiveOps Insight is both powerful and flexible, yet its form basedinterface makes creating even complex reports a relatively simple matter. Here are the key points to understanding whatLiveOps Insight is:
LiveOps Insight is part of the Cloud Contact Center web site: you access it through the site's Reports menu.
LiveOps Insight is form based: you fill in the parts of the form that are relevant to you, click a button to "run" thereport, and the results appear in your web browser window.
LiveOps Insight is an historical reporting tool. It returns detailed and summary views of your LiveOps Cloud ContactCenter performance in a time frame ranging from a few hours old to days, weeks, months or even longer past.
LiveOps Insight is customized to your needs and role in Contact Center: depending on your access privileges, youwill see different capabilities from the application. This both ensures security of data and helps minimize complexitywhen it is not needed.
This LiveOps Insight Reporting Guide shows you how to use LiveOps Insight effectively to answer the questions you needanswered about your LiveOps Cloud Contact Center performance.
What's New?
This is version 2.0 of the LiveOps Insight Reporting Guide. It has been substantially updated to to document new functionality, as well as being reorganized to bettermeet the needs of our customers. Specifically, this version covers the following improvements:
New controls for running, saving, editing, deleting and sharing reports.
Field Categories and Extensions
Explanation of call segments and interactions
Updated information on available report types and common metrics
About This Guide
This LiveOps Insight Reporting Guide is composed of 5 sections:
Section1: Getting Started introduces the LiveOps Insight and this Reporting t Guide. If you are new to the LiveOps Insight, this is your starting point.
Section 2: Refining Reports covers all aspects of creating reports tailored to your specific needs.
Section 3: Section: Managing Reports describes how to save and share your reports.
Section 4: Advanced Topics provides best practices and tips for getting the most out of LiveOps Insight.
Section 5: Reference consolidates key information on LiveOps Insight functionality and capabilities.
This LiveOps Insight Reporting Guide is available in two formats: an online HTML version, accessible under the Contact Center Help menu, and a PDF version foroffline reading.
Intended Audience
The LiveOps Insight provides information critical to the ongoing success of your LiveOps Cloud Contact Center operations. This LiveOps Insight Reporting Guide isintended, therefore, to be used by a wide cross section of users, including:
Business owners
Agent management
Operations
Media and marketing staff
Account managers
Quality assurance staff
and others...
LiveOps Insight Reporting Guide
Copyright © 2012 LiveOps, Inc. All rights reserved. Page 1 of 65
In addition, executive and operational decision makers can use the Reference section as a data sheet for pre-sales evaluation purposes.
What You Should Know Before You Begin
To get the most out of this LiveOps Insight Reporting Guide, readers should have some basic knowledge and familiarity with the LiveOps Cloud Contact Centerplatform. For all users, this means:
Knowing how to sign into the platform with your user name and password
Having a solid grasp of Contact Center objects and terminology: e.g., Programs, Campaigns, Agents, Routing Attributes, Pools, etc.
Typographical Conventions
Throughout this guide, we use font color to denote the following:
Commands, button or menu namesTerms and concepts as they are introduced for the first time
Method or variable names
User input
Table or Figure caption
Document or page name
Page section or other emphasized term
In addition, we use a few icons to call out helpful information:
Tip—advice or suggestions that will make your experience with the product more effective or enjoyable.
Note—A possible catch or "gotcha" to watch out for or keep in mind.
See Also—a reference to further reading material or resources.
Denotes the end of a long series of steps in a procedure. This ensure you don't miss any steps if the list is longer than will fit on a single screen. This isoften omitted for short procedures.
If a term appears as a green link, you can follow that to see the Contact Center Glossary entry for that term.
Finally, you can easily navigate throughout the LiveOps Insight Reporting Guide using the breadcrumb links at the top of each page, or you can jump to the next orprevious chapters using links at the top and bottom of each chapter.
Further Reading
If you are new to the LiveOps Cloud Contact Center platform, you can find additional useful documentation under the Contact Center Help Menu.
Contact Info
If you have comments or suggestions on this document, please email them to [email protected].
Revision History
Table 0-1: LiveOps Insight Reporting Guide Revision History
Version (Date) Highlights
2.0 (2012-08-22) Major revision:
New toolbar UI
Expanded functional descriptions
New doc structure
Video tutorials.
1.0 (2005-12-01) Initial document
LiveOps Insight Reporting Guide
Copyright © 2012 LiveOps, Inc. All rights reserved. Page 2 of 65
In this chapter...
UI Tour1.
The Report Process2.
To follow along with this chapter, launch LiveOps Insight in a separate window:
Select the Reports > Report Tool menu.
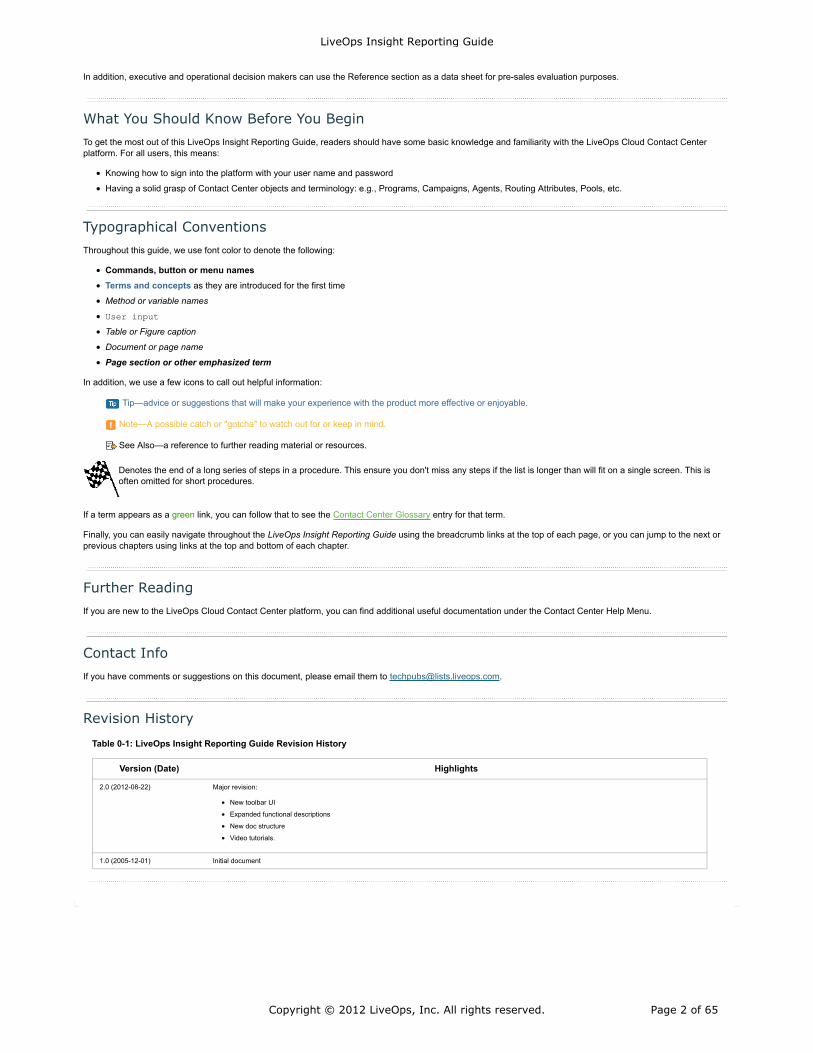
Figure 1-1: LiveOps Insight Page Regions
Restore Defaults will clear any unsaved modifications to a report. To avoid losing your work, save thereport before choosing this option.
1. New to LiveOps Insight? Start Here!
The goal of this chapter is to give you a big picture view of LiveOps Insight before focusing on the details. Subsequentchapters in this guide describe the features and functions of LiveOps Insight in depth, so don't worry if something doesn'tmake immediate sense here. If you are new to the LiveOps Cloud Contact Center or to LiveOps Insight , this chapter is foryou. We will start off with a quick tour of the user interface, with brief descriptions of the main options available to you.Following that, we'll describe the process of running a simple report.
1.1 UI Tour
LiveOps Insight is organized into 5 distinct regions on the page, as shown in Figure 1-1.
Header Tool BarThe top of the LiveOps Insight page contains the header tool bar. When youfirst launch LiveOps Insight, you will see:
Your Reports—Load a previously saved report.
After running a report, you will see:
Save—Save the current report configuration so you can run it againlater.
Save a Copy...—Save a copy of the currently displayed saved report.
Delete—PERMANENTLY delete the currently displayed saved report.
Edit Options—Edit the currently displayed saved report's options.
Send to...—Send the currently displayed report's results via email.
New Report—Clear the report form.
Answer TableThis region appears after you run your report. The result of your query isdisplayed here. Each field you have selected to show or group by will bepresented as a column of data. You can sort your answer table by clicking acolumn header. Clicking a specific aggregated result in your answer "drillsdown" into that result, showing you the breakdown for that particular field inyour report.
Answer Table Tool BarThe tool bar beneath the answer table gives you the following options:
RUN NOW—Run the current report and display the answer table withyour results.
Load Extensions—Add selected field extensions to the query form,so you can include them in the report.
Restore Defaults—Restore the report configuration to the defaultsettings for this report type.
Report Types—Load a predefined report type.
Show results in a new window—Display the report results in aseparate window. This is useful if you want to compare multiplereports side by side.
Field Glossary—Display a searchable document describing all thefields and metrics available in the current report type.
Query FormThe query form lets you refine or change your report by adding or removing fields, changing date ranges, including selection criteria, setting data thresholds and
LiveOps Insight Reporting Guide
Copyright © 2012 LiveOps, Inc. All rights reserved. Page 3 of 65
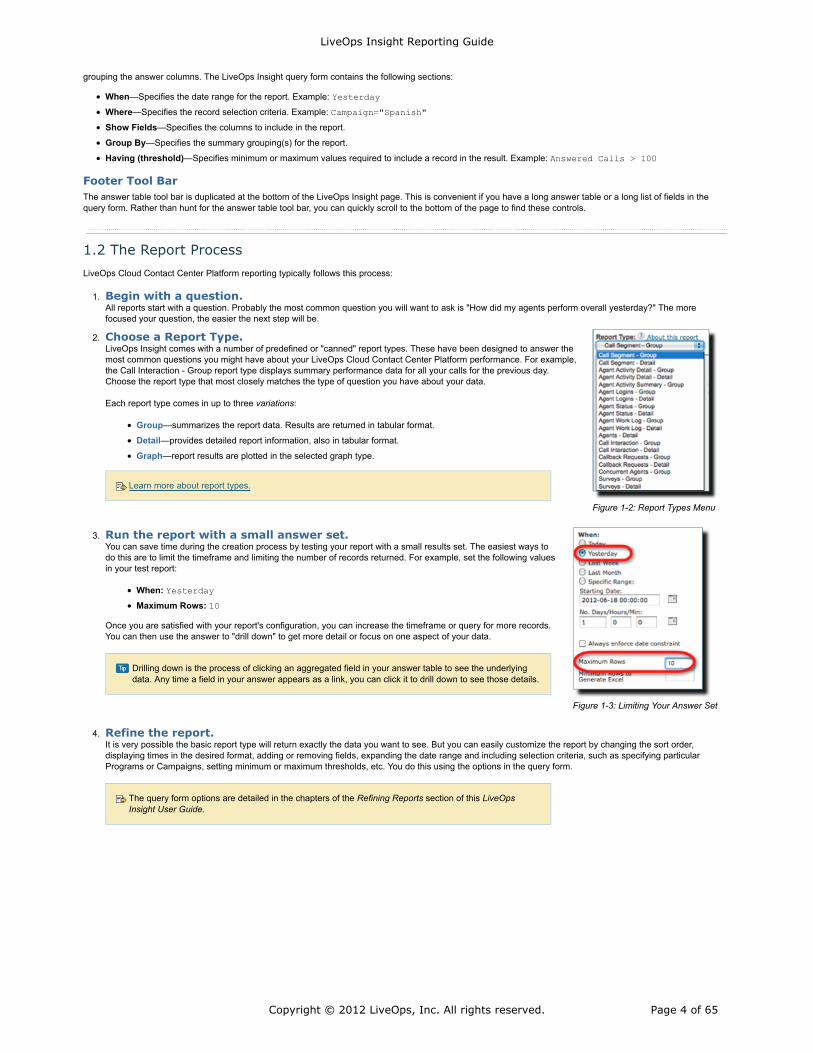
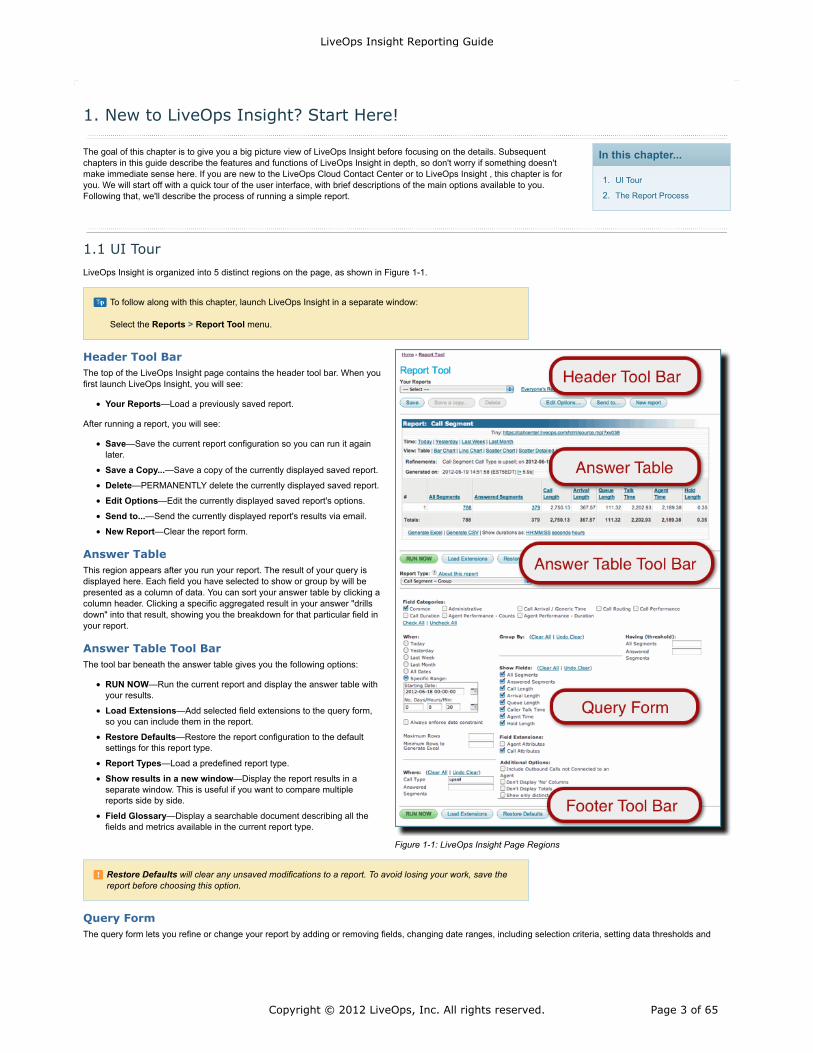
Figure 1-2: Report Types Menu
Learn more about report types.
Figure 1-3: Limiting Your Answer Set
Drilling down is the process of clicking an aggregated field in your answer table to see the underlyingdata. Any time a field in your answer appears as a link, you can click it to drill down to see those details.
The query form options are detailed in the chapters of the Refining Reports section of this LiveOpsInsight User Guide.
grouping the answer columns. The LiveOps Insight query form contains the following sections:
When—Specifies the date range for the report. Example: Yesterday
Where—Specifies the record selection criteria. Example: Campaign="Spanish"
Show Fields—Specifies the columns to include in the report.
Group By—Specifies the summary grouping(s) for the report.
Having (threshold)—Specifies minimum or maximum values required to include a record in the result. Example: Answered Calls > 100
Footer Tool BarThe answer table tool bar is duplicated at the bottom of the LiveOps Insight page. This is convenient if you have a long answer table or a long list of fields in thequery form. Rather than hunt for the answer table tool bar, you can quickly scroll to the bottom of the page to find these controls.
1.2 The Report Process
LiveOps Cloud Contact Center Platform reporting typically follows this process:
Begin with a question.All reports start with a question. Probably the most common question you will want to ask is "How did my agents perform overall yesterday?" The morefocused your question, the easier the next step will be.
1.
Choose a Report Type.LiveOps Insight comes with a number of predefined or "canned" report types. These have been designed to answer themost common questions you might have about your LiveOps Cloud Contact Center Platform performance. For example,the Call Interaction - Group report type displays summary performance data for all your calls for the previous day.Choose the report type that most closely matches the type of question you have about your data.
Each report type comes in up to three variations:
Group—summarizes the report data. Results are returned in tabular format.
Detail—provides detailed report information, also in tabular format.
Graph—report results are plotted in the selected graph type.
2.
Run the report with a small answer set.You can save time during the creation process by testing your report with a small results set. The easiest ways todo this are to limit the timeframe and limiting the number of records returned. For example, set the following valuesin your test report:
When: YesterdayMaximum Rows: 10
Once you are satisfied with your report's configuration, you can increase the timeframe or query for more records.You can then use the answer to "drill down" to get more detail or focus on one aspect of your data.
3.
Refine the report.It is very possible the basic report type will return exactly the data you want to see. But you can easily customize the report by changing the sort order,displaying times in the desired format, adding or removing fields, expanding the date range and including selection criteria, such as specifying particularPrograms or Campaigns, setting minimum or maximum thresholds, etc. You do this using the options in the query form.
4.
LiveOps Insight Reporting Guide
Copyright © 2012 LiveOps, Inc. All rights reserved. Page 4 of 65
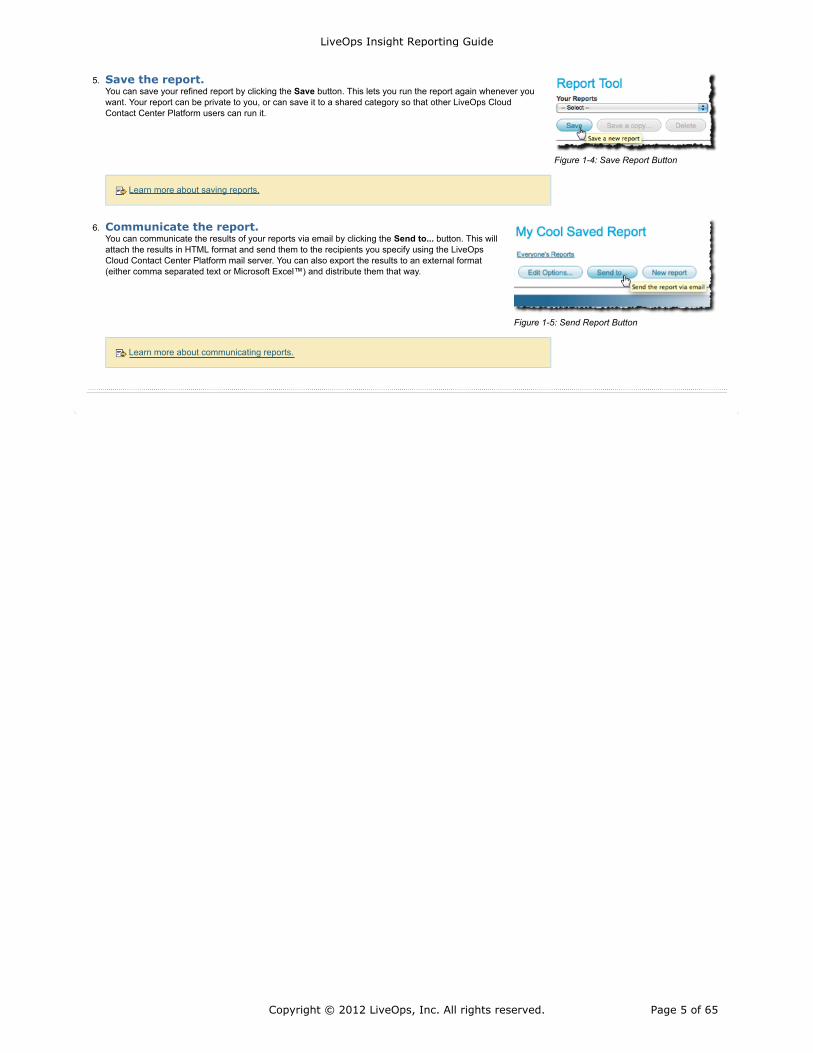
Figure 1-4: Save Report Button
Learn more about saving reports.
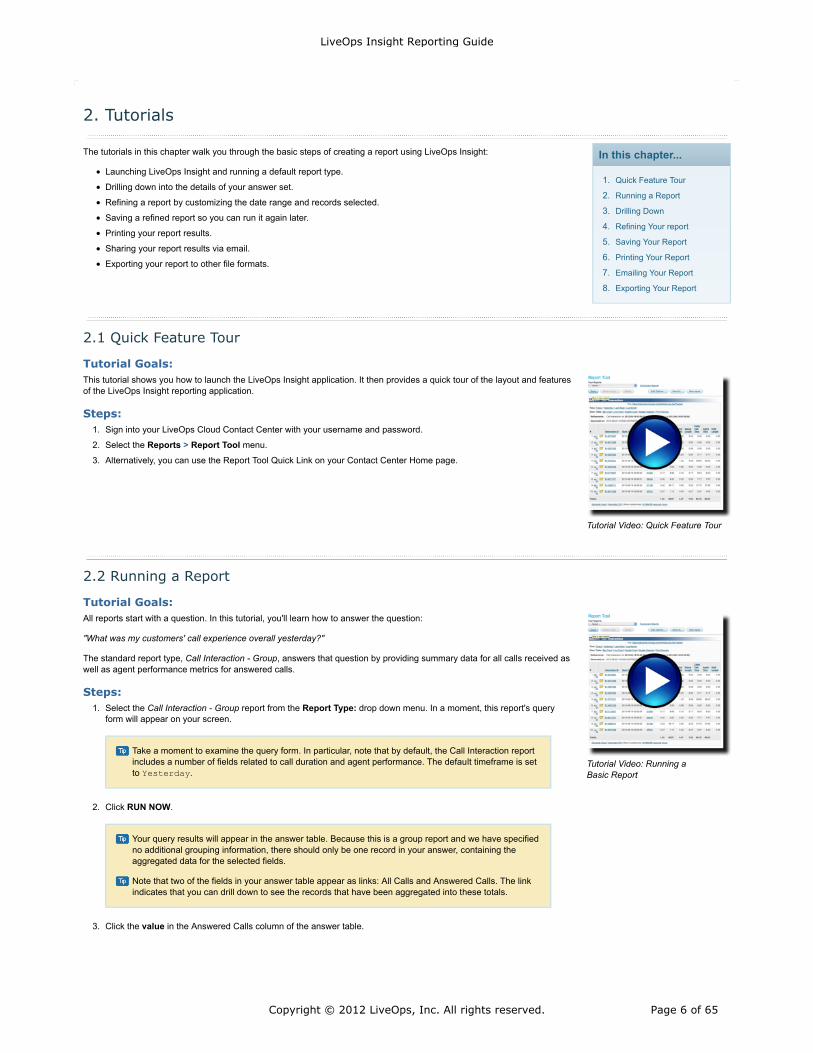
Figure 1-5: Send Report Button
Learn more about communicating reports.
Save the report.You can save your refined report by clicking the Save button. This lets you run the report again whenever youwant. Your report can be private to you, or can save it to a shared category so that other LiveOps CloudContact Center Platform users can run it.
5.
Communicate the report.You can communicate the results of your reports via email by clicking the Send to... button. This willattach the results in HTML format and send them to the recipients you specify using the LiveOpsCloud Contact Center Platform mail server. You can also export the results to an external format(either comma separated text or Microsoft Excel™) and distribute them that way.
6.
LiveOps Insight Reporting Guide
Copyright © 2012 LiveOps, Inc. All rights reserved. Page 5 of 65
In this chapter...
Quick Feature Tour1.
Running a Report2.
Drilling Down3.
Refining Your report4.
Saving Your Report5.
Printing Your Report6.
Emailing Your Report7.
Exporting Your Report8.
Tutorial Video: Quick Feature Tour
Tutorial Video: Running aBasic Report
Take a moment to examine the query form. In particular, note that by default, the Call Interaction reportincludes a number of fields related to call duration and agent performance. The default timeframe is setto Yesterday.
Your query results will appear in the answer table. Because this is a group report and we have specifiedno additional grouping information, there should only be one record in your answer, containing theaggregated data for the selected fields.
Note that two of the fields in your answer table appear as links: All Calls and Answered Calls. The linkindicates that you can drill down to see the records that have been aggregated into these totals.
2. Tutorials
The tutorials in this chapter walk you through the basic steps of creating a report using LiveOps Insight:
Launching LiveOps Insight and running a default report type.
Drilling down into the details of your answer set.
Refining a report by customizing the date range and records selected.
Saving a refined report so you can run it again later.
Printing your report results.
Sharing your report results via email.
Exporting your report to other file formats.
2.1 Quick Feature Tour
Tutorial Goals:This tutorial shows you how to launch the LiveOps Insight application. It then provides a quick tour of the layout and featuresof the LiveOps Insight reporting application.
Steps:Sign into your LiveOps Cloud Contact Center with your username and password.1.
Select the Reports > Report Tool menu.2.
Alternatively, you can use the Report Tool Quick Link on your Contact Center Home page.3.
2.2 Running a Report
Tutorial Goals:All reports start with a question. In this tutorial, you'll learn how to answer the question:
"What was my customers' call experience overall yesterday?"
The standard report type, Call Interaction - Group, answers that question by providing summary data for all calls received aswell as agent performance metrics for answered calls.
Steps:Select the Call Interaction - Group report from the Report Type: drop down menu. In a moment, this report's queryform will appear on your screen.
1.
Click RUN NOW.2.
Click the value in the Answered Calls column of the answer table.3.
LiveOps Insight Reporting Guide
Copyright © 2012 LiveOps, Inc. All rights reserved. Page 6 of 65
This "drills down" into your data, focused on the Answered Calls records of your report. In effect, thisruns the Call Interaction - Detail report, with the selection criteria of answered calls only.
Take a moment to examine the result table:
Your new results show each individual answered call, identified by its unique Interaction ID, aswell as the agent who handled the call.
The Refinements: section in the table header will say: Call Interaction: AnsweredCalls = 1; Yesterday
The Report Type drop down menu will be set to Call Interaction - Detail.
The Answered Calls field in the Where: section will contain the value 1.
Tutorial Video: Drilling Down
This tutorial assumes you have completed the previous steps outlined above. If not, please run the CallInteraction - Detail report before proceeding with this tutorial.
This "drills down" into your data, focused on the individual agent you selected. In effect, this runs theCall Interaction - Detail report, with the selection criteria based on the agent you selected, for answeredcalls only.
Take a moment to examine the result table:
Your new results show all the calls handled by the selected agent "yesterday."
The Refinements: section in the table header will say: Call Interaction: Agent is<agent_id>; Answered Calls = 1; Yesterday
The Report Type drop down menu will be set to Call Interaction - Detail.
The Answered Calls field in the Where: section will contain the value 1.
The Agent field in the Where: section will contain the value <agent_id>.
2.3 Drilling Down
Tutorial Goals:In LiveOps Insight, your data is multidimensional and interactive. You can examine different aspects of your Contact Centerperformance by "drilling down" into your data. In this tutorial, you'll learn how to drill down to answer the question:
"How did a specific agent do yesterday?"
Steps:Select an individual call in your answer table and click the value in the Agent column.1.
Select an individual call in your answer table and click the value in the Interaction ID column.2.
LiveOps Insight Reporting Guide
Copyright © 2012 LiveOps, Inc. All rights reserved. Page 7 of 65
Take a moment to examine the Refinements: section. There are three things to note here:
Drilling down into an Interaction ID runs the Call Segment - Detail report. This is because multiplecall segments can be associated with a given call interaction.
The new results are filtered by the Interaction ID you just clicked on and the Agent value from theprevious report.
The date constraint of "Yesterday" has been removed: this is because you are filtering on anInteraction ID, which may transcend that date.
See chapter 4 for more on call segments.
See chapter 6 for more on the date constraint feature.
Tutorial Video: Refining a Report
This tutorial assumes you have completed the previous steps outlined above. If not, please run the CallInteraction - Detail report and select calls for a single agent before proceeding with this tutorial.
This displays a number of new field options, highlighted in blue, in the query form.
Learn more about Field Categories.
This instructs LiveOps Insight to select records where the call length is greater than 10 minutes.
Learn more about selecting records using Where.
This instructs LiveOps Insight to only select records where the call started during the last week.
Learn more about working with dates.
In a few moments, you will see the calls this agent took during the last week longer than 10 minutes(depending on your actual data, this might be none, a few or many).
2.4 Refining Your report
Tutorial Goals:Refining a report is the process of modifying a base report type to answer even more specific questions. In this tutorial, you'lllearn how to refine the Call Interaction - Detail report you generated in the preceding tutorial to answer the question:
"What are the details for calls over 10 minutes in length taken by a specific agent over the past week?"
Steps:Locate the Field Categories: section in the query form and click the Call Duration checkbox.1.
Locate the Where: section in the query form and enter the value >10 the Call Duration entry field.2.
Locate the When: section in the query form and click the Last Week radio button.3.
Click RUN NOW to run this report.4.
2.5 Saving Your Report
Tutorial Goals:When you save a report, all of your modifications to the base report type are preserved. You can load that report from the Your Reports drop down menu, theContact Center Reports menu, or from the My Reports quick links widget on the home page. In this tutorial, you will learn:
How to save a report for later reuse.
LiveOps Insight Reporting Guide
Copyright © 2012 LiveOps, Inc. All rights reserved. Page 8 of 65
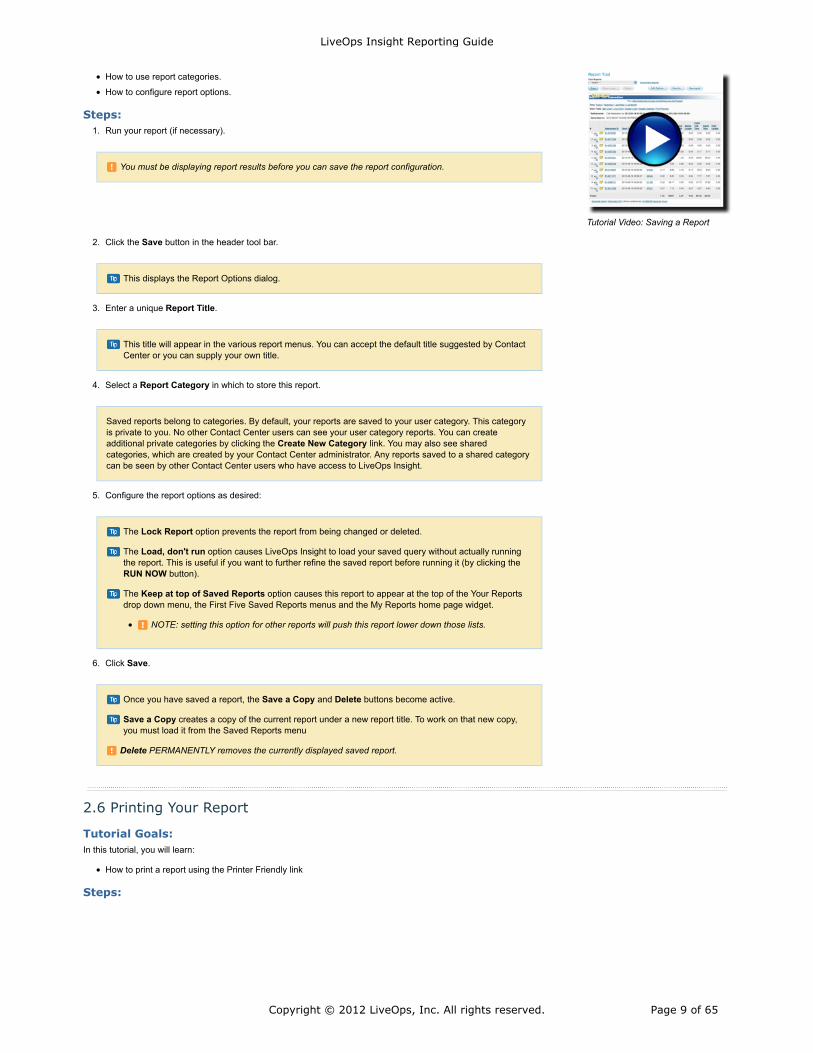
Tutorial Video: Saving a Report
You must be displaying report results before you can save the report configuration.
This displays the Report Options dialog.
This title will appear in the various report menus. You can accept the default title suggested by ContactCenter or you can supply your own title.
Saved reports belong to categories. By default, your reports are saved to your user category. This categoryis private to you. No other Contact Center users can see your user category reports. You can createadditional private categories by clicking the Create New Category link. You may also see sharedcategories, which are created by your Contact Center administrator. Any reports saved to a shared categorycan be seen by other Contact Center users who have access to LiveOps Insight.
The Lock Report option prevents the report from being changed or deleted.
The Load, don't run option causes LiveOps Insight to load your saved query without actually runningthe report. This is useful if you want to further refine the saved report before running it (by clicking theRUN NOW button).
The Keep at top of Saved Reports option causes this report to appear at the top of the Your Reportsdrop down menu, the First Five Saved Reports menus and the My Reports home page widget.
NOTE: setting this option for other reports will push this report lower down those lists.
Once you have saved a report, the Save a Copy and Delete buttons become active.
Save a Copy creates a copy of the current report under a new report title. To work on that new copy,you must load it from the Saved Reports menu
Delete PERMANENTLY removes the currently displayed saved report.
How to use report categories.
How to configure report options.
Steps:Run your report (if necessary).1.
Click the Save button in the header tool bar.2.
Enter a unique Report Title.3.
Select a Report Category in which to store this report.4.
Configure the report options as desired:5.
Click Save.6.
2.6 Printing Your Report
Tutorial Goals:In this tutorial, you will learn:
How to print a report using the Printer Friendly link
Steps:
LiveOps Insight Reporting Guide
Copyright © 2012 LiveOps, Inc. All rights reserved. Page 9 of 65
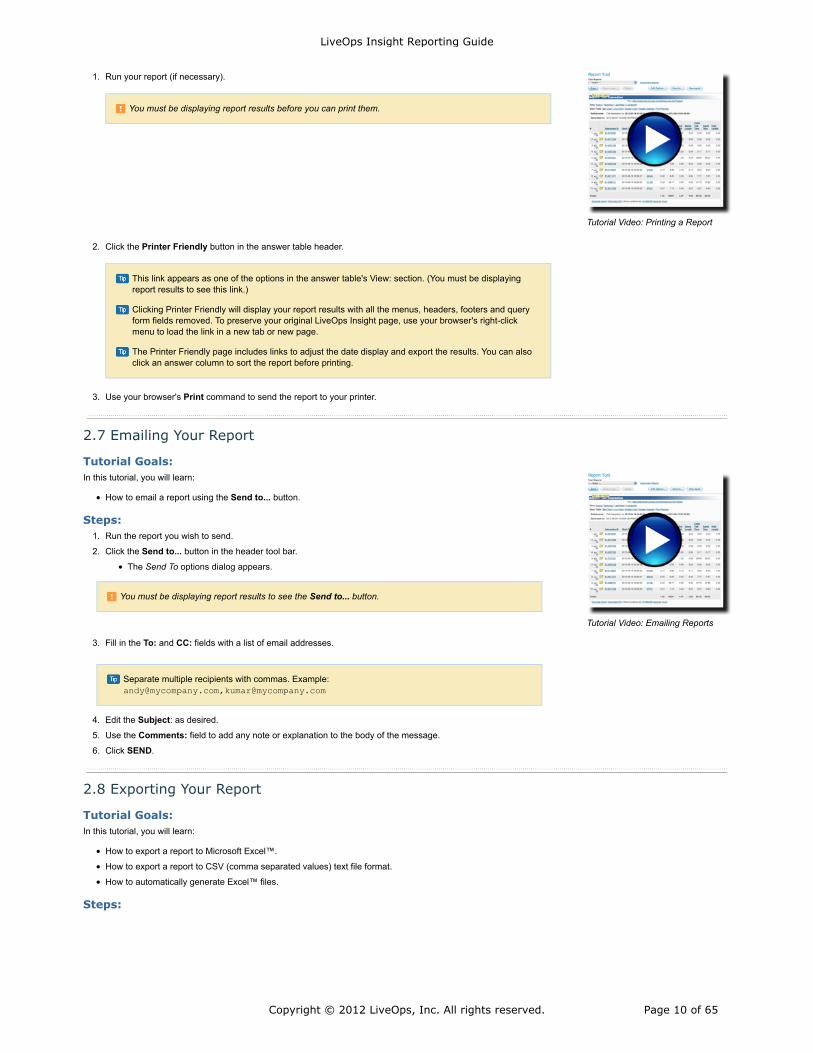
Tutorial Video: Printing a Report
You must be displaying report results before you can print them.
This link appears as one of the options in the answer table's View: section. (You must be displayingreport results to see this link.)
Clicking Printer Friendly will display your report results with all the menus, headers, footers and queryform fields removed. To preserve your original LiveOps Insight page, use your browser's right-clickmenu to load the link in a new tab or new page.
The Printer Friendly page includes links to adjust the date display and export the results. You can alsoclick an answer column to sort the report before printing.
Tutorial Video: Emailing Reports
You must be displaying report results to see the Send to... button.
Separate multiple recipients with commas. Example:[email protected],[email protected]
Run your report (if necessary).1.
Click the Printer Friendly button in the answer table header.2.
Use your browser's Print command to send the report to your printer.3.
2.7 Emailing Your Report
Tutorial Goals:In this tutorial, you will learn:
How to email a report using the Send to... button.
Steps:Run the report you wish to send.1.
Click the Send to... button in the header tool bar.2.
The Send To options dialog appears.
Fill in the To: and CC: fields with a list of email addresses.3.
Edit the Subject: as desired.4.
Use the Comments: field to add any note or explanation to the body of the message.5.
Click SEND.6.
2.8 Exporting Your Report
Tutorial Goals:In this tutorial, you will learn:
How to export a report to Microsoft Excel™.
How to export a report to CSV (comma separated values) text file format.
How to automatically generate Excel™ files.
Steps:
LiveOps Insight Reporting Guide
Copyright © 2012 LiveOps, Inc. All rights reserved. Page 10 of 65
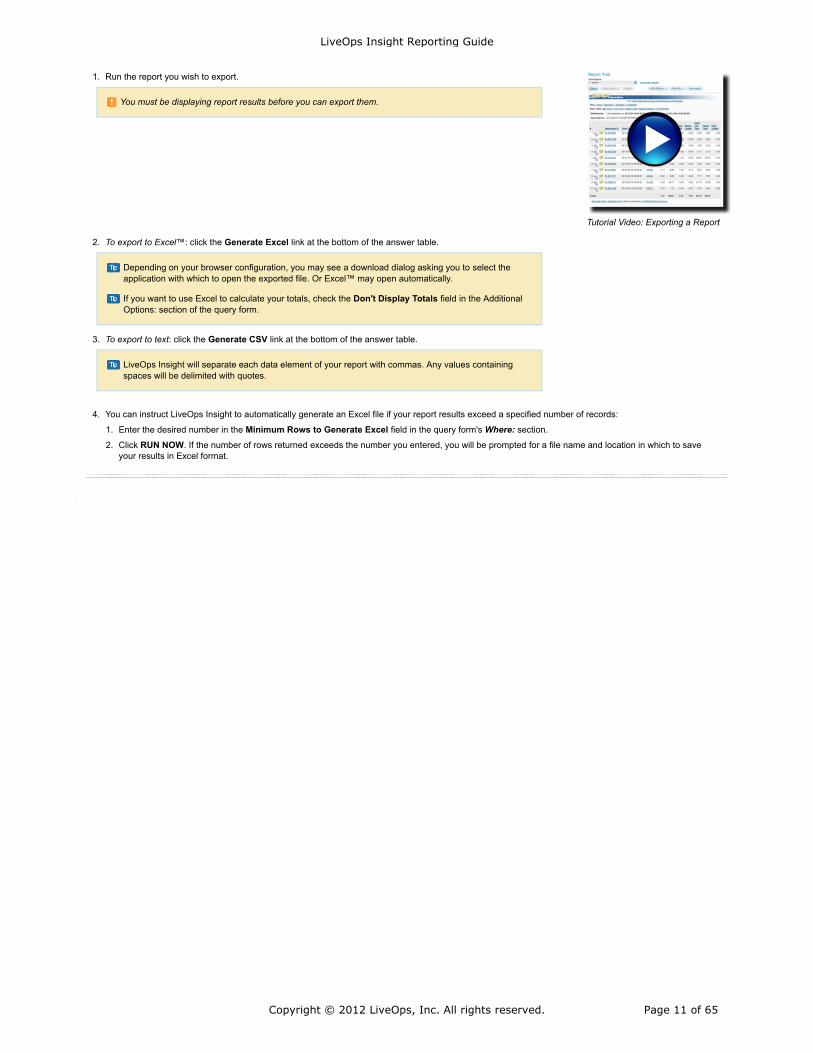
Tutorial Video: Exporting a Report
You must be displaying report results before you can export them.
Depending on your browser configuration, you may see a download dialog asking you to select theapplication with which to open the exported file. Or Excel™ may open automatically.
If you want to use Excel to calculate your totals, check the Don't Display Totals field in the AdditionalOptions: section of the query form.
LiveOps Insight will separate each data element of your report with commas. Any values containingspaces will be delimited with quotes.
Run the report you wish to export.1.
To export to Excel™: click the Generate Excel link at the bottom of the answer table.2.
To export to text: click the Generate CSV link at the bottom of the answer table.3.
You can instruct LiveOps Insight to automatically generate an Excel file if your report results exceed a specified number of records:4.
Enter the desired number in the Minimum Rows to Generate Excel field in the query form's Where: section.1.
Click RUN NOW. If the number of rows returned exceeds the number you entered, you will be prompted for a file name and location in which to saveyour results in Excel format.
2.
LiveOps Insight Reporting Guide
Copyright © 2012 LiveOps, Inc. All rights reserved. Page 11 of 65
In this chapter...
Answer Table Header1.
Query Results2.
Utility Links3.
Please include the tiny URL when requesting reporting help from LiveOps Customer Support.
3. Understanding the Answer Table
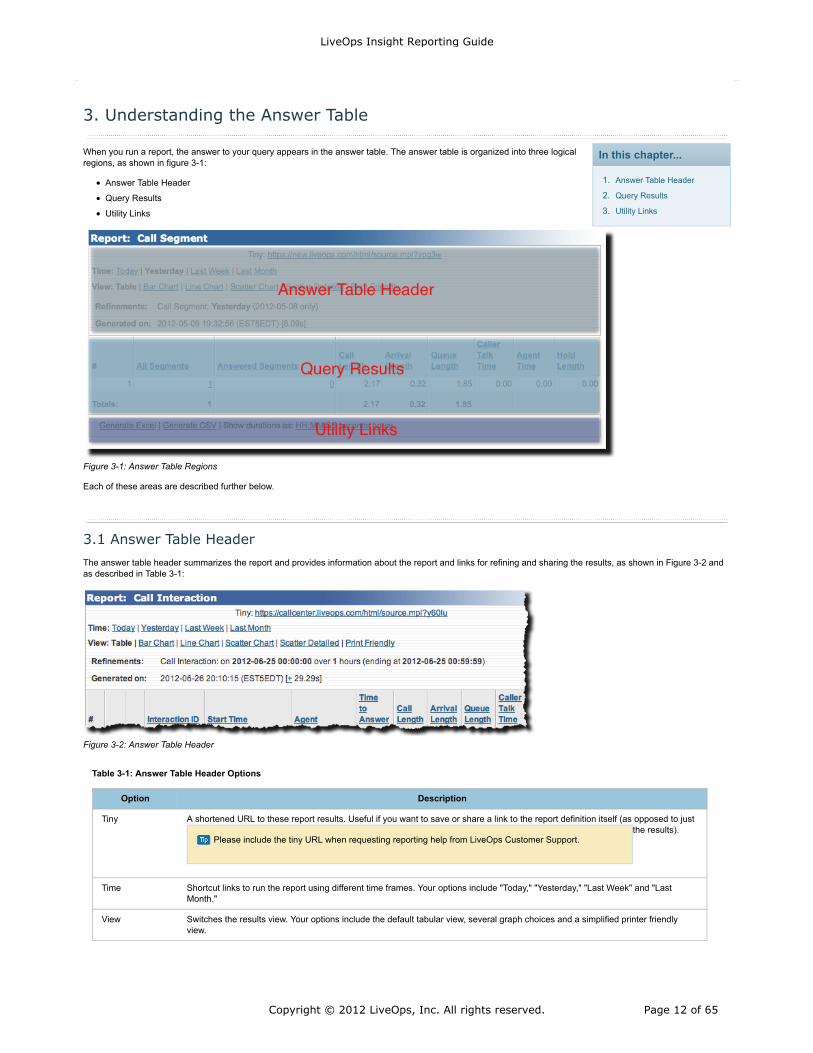
When you run a report, the answer to your query appears in the answer table. The answer table is organized into three logicalregions, as shown in figure 3-1:
Answer Table Header
Query Results
Utility Links
Figure 3-1: Answer Table Regions
Each of these areas are described further below.
3.1 Answer Table Header
The answer table header summarizes the report and provides information about the report and links for refining and sharing the results, as shown in Figure 3-2 andas described in Table 3-1:
Figure 3-2: Answer Table Header
Table 3-1: Answer Table Header Options
Option Description
Tiny A shortened URL to these report results. Useful if you want to save or share a link to the report definition itself (as opposed to justthe results).
Time Shortcut links to run the report using different time frames. Your options include "Today," "Yesterday," "Last Week" and "LastMonth."
View Switches the results view. Your options include the default tabular view, several graph choices and a simplified printer friendlyview.
LiveOps Insight Reporting Guide
Copyright © 2012 LiveOps, Inc. All rights reserved. Page 12 of 65
Refinements Describes the base report type and any refinements you've made to produce the current results.
Generated on Provides the report's creation date and time. The time stamp may also include the age of the cached data.
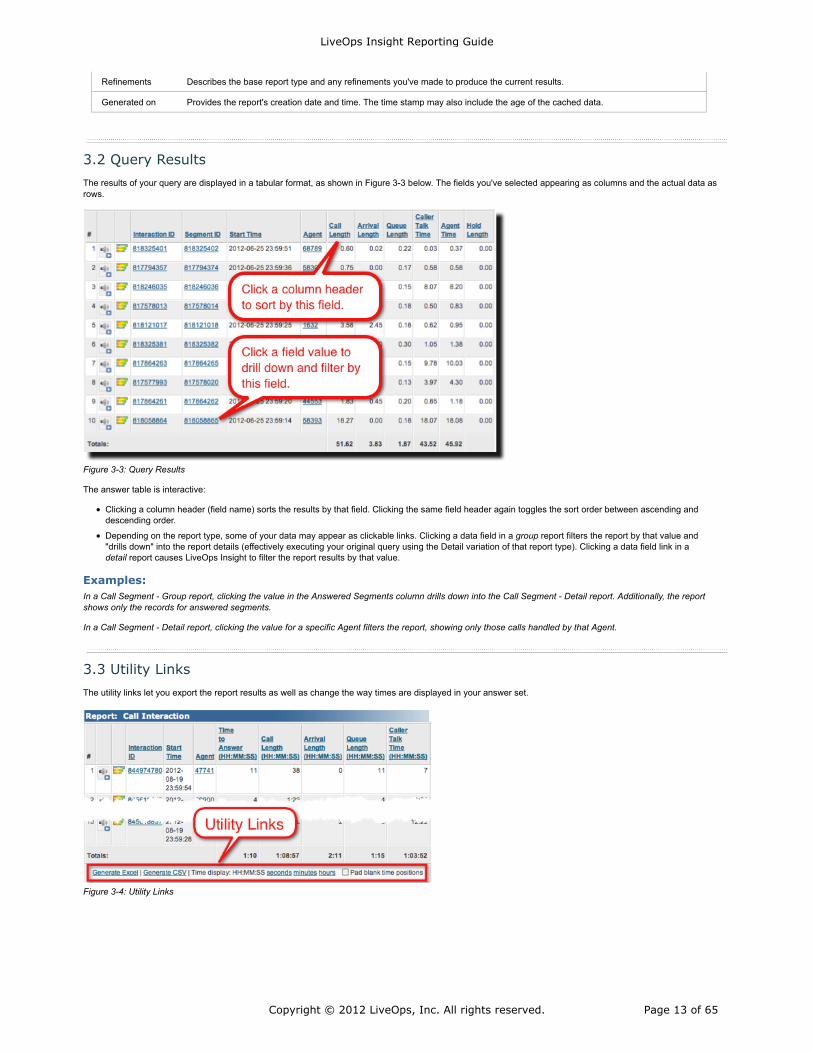
3.2 Query Results
The results of your query are displayed in a tabular format, as shown in Figure 3-3 below. The fields you've selected appearing as columns and the actual data asrows.
Figure 3-3: Query Results
The answer table is interactive:
Clicking a column header (field name) sorts the results by that field. Clicking the same field header again toggles the sort order between ascending anddescending order.
Depending on the report type, some of your data may appear as clickable links. Clicking a data field in a group report filters the report by that value and"drills down" into the report details (effectively executing your original query using the Detail variation of that report type). Clicking a data field link in adetail report causes LiveOps Insight to filter the report results by that value.
Examples:In a Call Segment - Group report, clicking the value in the Answered Segments column drills down into the Call Segment - Detail report. Additionally, the reportshows only the records for answered segments.
In a Call Segment - Detail report, clicking the value for a specific Agent filters the report, showing only those calls handled by that Agent.
3.3 Utility Links
The utility links let you export the report results as well as change the way times are displayed in your answer set.
Figure 3-4: Utility Links
LiveOps Insight Reporting Guide
Copyright © 2012 LiveOps, Inc. All rights reserved. Page 13 of 65
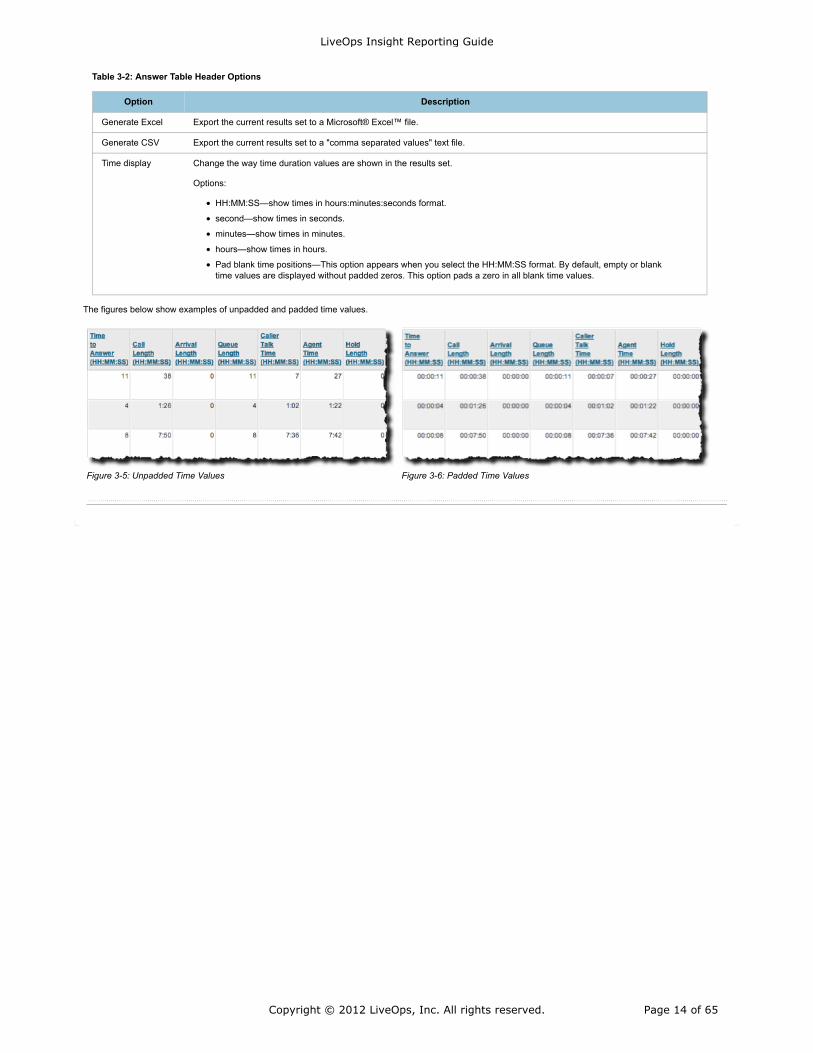
Table 3-2: Answer Table Header Options
Option Description
Generate Excel Export the current results set to a Microsoft® Excel™ file.
Generate CSV Export the current results set to a "comma separated values" text file.
Time display Change the way time duration values are shown in the results set.
Options:
HH:MM:SS—show times in hours:minutes:seconds format.
second—show times in seconds.
minutes—show times in minutes.
hours—show times in hours.
Pad blank time positions—This option appears when you select the HH:MM:SS format. By default, empty or blanktime values are displayed without padded zeros. This option pads a zero in all blank time values.
The figures below show examples of unpadded and padded time values.
Figure 3-5: Unpadded Time Values Figure 3-6: Padded Time Values
LiveOps Insight Reporting Guide
Copyright © 2012 LiveOps, Inc. All rights reserved. Page 14 of 65
In this chapter...
Call Segments andTransfer
1.
Calls and Date Constraints2.
The Call Visualizer3.
Key Concepts
LiveOps Insight reports on both message (social) and call (voice) based customer contacts.
LiveOps Social contacts are identified by their Message ID.
LiveOps Voice contacts are identified by their Interaction ID.
Interaction IDs represent the caller's experience of the call.
Interaction IDs contain one or more Segment IDs.
Segment IDs represent the agent's experience of the call.
Each agent involved in an interaction will generate a new Segment ID.
Each segment will have its own metrics (e.g., start time, end time, duration, queue length, etc.)
Previously, calls were referenced by their "Session ID", which was defined as "the unique identifier for acall." This term is ambiguous, as a single call could generate multiple Session IDs, for example, in thecase of a transfer. Using Interaction IDs and Segment IDs resolves this ambiguity.
Speed dial transfers to an external number do not generate a new Segment ID.
4. Identifying a Contact: Calls vs. Messages
The LiveOps Cloud Contact Center platform handles both call (voice) and message (non-voice) based customer contacts.LiveOps Insight can report on both kinds of contacts through dedicated call-only or message-only reports, as well as through aunified report that combines voice and non-voice related metrics. A key concept in understanding these reports is knowinghow the platform identifies a customer contact.
Message-based contacts are handled through the LiveOps Social application. This application assigns a unique Message IDto each message handled, as well as a Message Type to distinguish the type of channel on which the message was received.In this way, the various Multichannel report types can report on chat, SMS, Twitter and Facebook messages in an integratedfashion.
Call-based contacts are handled by the LiveOps Voice application. In LiveOps Voice, a contact is identified by an InteractionID, which represents the caller's complete experience, plus a summary of agent data. Within a call interaction, there will beone or more call segments, identified by a unique Segment ID. Each segment represents a new connection within theplatform. (Call segments are sometimes referred to as "legs.") For simple call flows, where the caller connects directly with asingle Agent, with no transfers, an interaction will contain only one Segment ID. For more complex call flows, one interactioncan encapsulate multiple Segment IDs. Some of the situations that will produce multiple Segment IDs for a single interactioninclude:
Transfers (caused by an IVR or an agent)
Conferences between agents
Callback attempts
In any of these scenarios, each agent involved in the call will be associated with a different call segment.
The Call Segment and Call Interaction reports give you insight into your Cloud Contact Center's performance from these twoperspectives (complete call experience vs. individual agent segments). This difference in perspective can result in summaryfields appearing to not be in agreement between the two report types in certain cases. See the Call Visualizer section belowfor an example and further explanation.
4.1 Call Segments and Transfer
As noted above, transferring a call between Agents on the platform creates a new Segment ID for each transfer. The same is true for conferences. The newsegment's start time begins when the transfer is initiated. Each new segment will have its own components (e.g., pre-IVR, queue, surveys, etc.), depending on theCampaign configuration.
4.2 Calls and Date Constraints
As a convenience, when your query filters by a specific Call Segment ID or Call Interaction ID, LiveOps Insight ignores any date ranges in the report. For example, ifyou are looking for a particular call segment you don't need to provide the actual date on which that segment occured. LiveOps Insight will ignore any date constraintset by the query and return that segment no matter when it occurred. Similarly, if you query for a specific Interaction ID using the absolute date 2012-05-24,LiveOps Insight will return that interaction even if some of the call segments related to this interaction occurred on the 25th.
This feature can be helpful when you don't know the exact date or time of a call or when a call may span some date or time boundary. You only need to know the
LiveOps Insight Reporting Guide
Copyright © 2012 LiveOps, Inc. All rights reserved. Page 15 of 65
Learn more about working with dates.
Segment ID or Interaction ID. However, you can override this behavior and only find a segment or interaction if it occurs within the date and time you specify bychecking the Always Enforce Date Constraint check box in the query form's When: section.
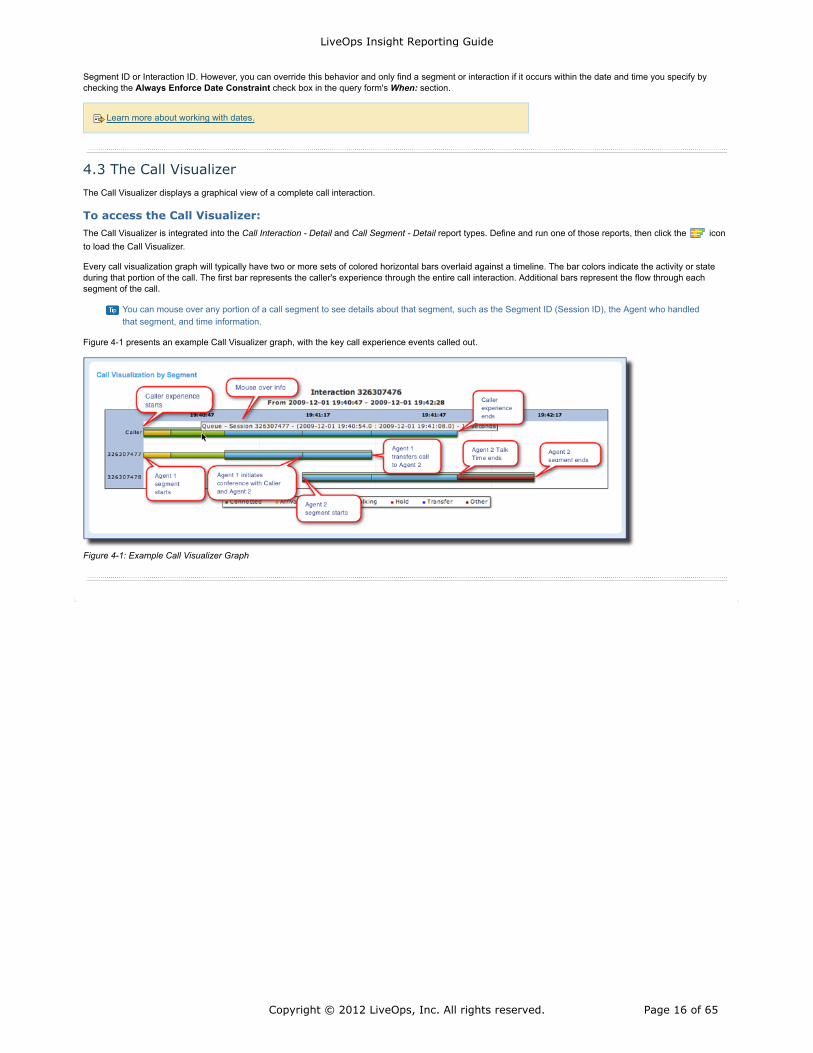
4.3 The Call Visualizer
The Call Visualizer displays a graphical view of a complete call interaction.
To access the Call Visualizer:The Call Visualizer is integrated into the Call Interaction - Detail and Call Segment - Detail report types. Define and run one of those reports, then click the iconto load the Call Visualizer.
Every call visualization graph will typically have two or more sets of colored horizontal bars overlaid against a timeline. The bar colors indicate the activity or stateduring that portion of the call. The first bar represents the caller's experience through the entire call interaction. Additional bars represent the flow through eachsegment of the call.
You can mouse over any portion of a call segment to see details about that segment, such as the Segment ID (Session ID), the Agent who handledthat segment, and time information.
Figure 4-1 presents an example Call Visualizer graph, with the key call experience events called out.
Figure 4-1: Example Call Visualizer Graph
LiveOps Insight Reporting Guide
Copyright © 2012 LiveOps, Inc. All rights reserved. Page 16 of 65
In this chapter...
Group vs. Detail Reports1.
The Report Type Glossary2.
Chapter 15 describes the standard report types.
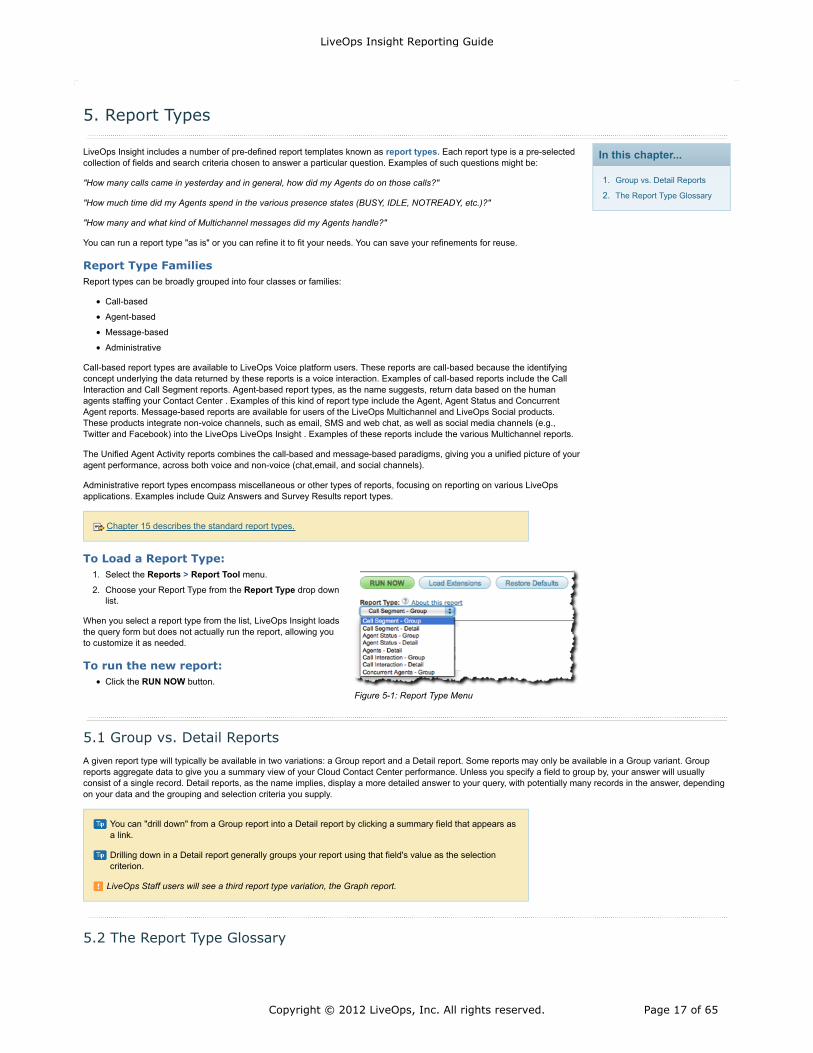
Figure 5-1: Report Type Menu
You can "drill down" from a Group report into a Detail report by clicking a summary field that appears asa link.
Drilling down in a Detail report generally groups your report using that field's value as the selectioncriterion.
LiveOps Staff users will see a third report type variation, the Graph report.
5. Report Types
LiveOps Insight includes a number of pre-defined report templates known as report types. Each report type is a pre-selectedcollection of fields and search criteria chosen to answer a particular question. Examples of such questions might be:
"How many calls came in yesterday and in general, how did my Agents do on those calls?"
"How much time did my Agents spend in the various presence states (BUSY, IDLE, NOTREADY, etc.)?"
"How many and what kind of Multichannel messages did my Agents handle?"
You can run a report type "as is" or you can refine it to fit your needs. You can save your refinements for reuse.
Report Type FamiliesReport types can be broadly grouped into four classes or families:
Call-based
Agent-based
Message-based
Administrative
Call-based report types are available to LiveOps Voice platform users. These reports are call-based because the identifyingconcept underlying the data returned by these reports is a voice interaction. Examples of call-based reports include the CallInteraction and Call Segment reports. Agent-based report types, as the name suggests, return data based on the humanagents staffing your Contact Center . Examples of this kind of report type include the Agent, Agent Status and ConcurrentAgent reports. Message-based reports are available for users of the LiveOps Multichannel and LiveOps Social products.These products integrate non-voice channels, such as email, SMS and web chat, as well as social media channels (e.g.,Twitter and Facebook) into the LiveOps LiveOps Insight . Examples of these reports include the various Multichannel reports.
The Unified Agent Activity reports combines the call-based and message-based paradigms, giving you a unified picture of youragent performance, across both voice and non-voice (chat,email, and social channels).
Administrative report types encompass miscellaneous or other types of reports, focusing on reporting on various LiveOpsapplications. Examples include Quiz Answers and Survey Results report types.
To Load a Report Type:Select the Reports > Report Tool menu.1.
Choose your Report Type from the Report Type drop downlist.
2.
When you select a report type from the list, LiveOps Insight loadsthe query form but does not actually run the report, allowing youto customize it as needed.
To run the new report:Click the RUN NOW button.
5.1 Group vs. Detail Reports
A given report type will typically be available in two variations: a Group report and a Detail report. Some reports may only be available in a Group variant. Groupreports aggregate data to give you a summary view of your Cloud Contact Center performance. Unless you specify a field to group by, your answer will usuallyconsist of a single record. Detail reports, as the name implies, display a more detailed answer to your query, with potentially many records in the answer, dependingon your data and the grouping and selection criteria you supply.
5.2 The Report Type Glossary
LiveOps Insight Reporting Guide
Copyright © 2012 LiveOps, Inc. All rights reserved. Page 17 of 65
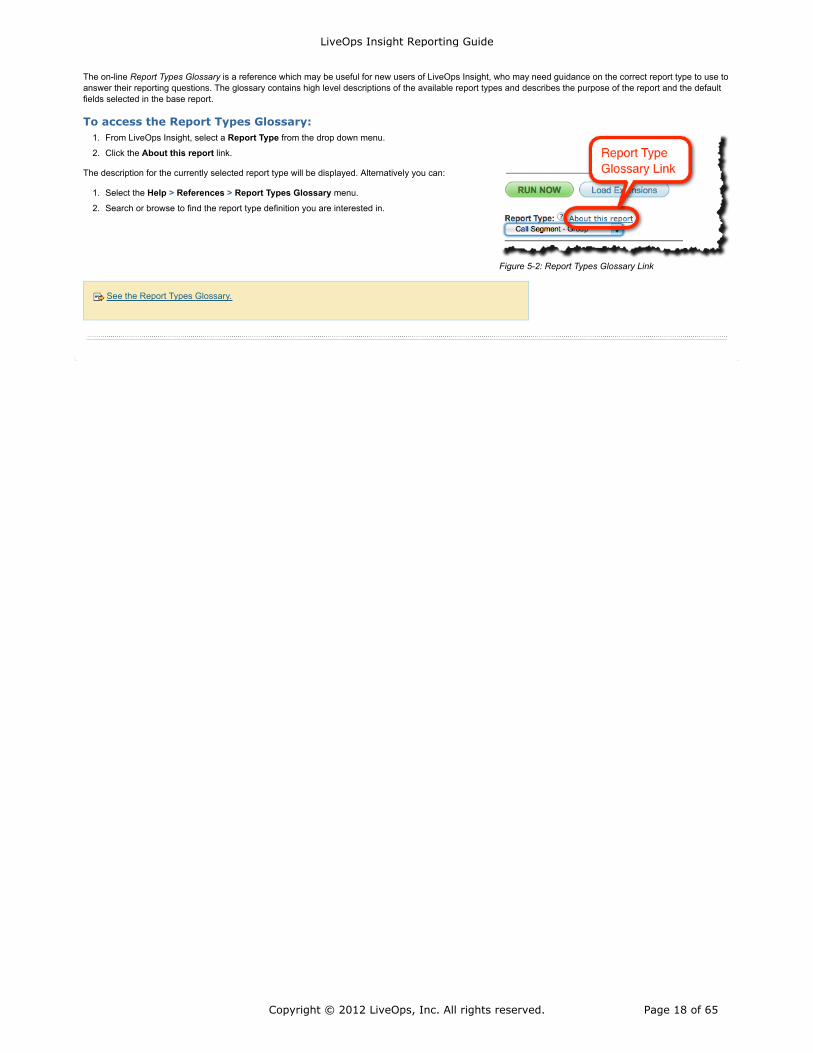
Figure 5-2: Report Types Glossary Link
See the Report Types Glossary.
The on-line Report Types Glossary is a reference which may be useful for new users of LiveOps Insight, who may need guidance on the correct report type to use toanswer their reporting questions. The glossary contains high level descriptions of the available report types and describes the purpose of the report and the defaultfields selected in the base report.
To access the Report Types Glossary:From LiveOps Insight, select a Report Type from the drop down menu.1.
Click the About this report link.2.
The description for the currently selected report type will be displayed. Alternatively you can:
Select the Help > References > Report Types Glossary menu.1.
Search or browse to find the report type definition you are interested in.2.
LiveOps Insight Reporting Guide
Copyright © 2012 LiveOps, Inc. All rights reserved. Page 18 of 65
In this chapter...
Dates and Saved Reports1.
Enforcing Date Constraints2.
Querying For GenericTimes
3.
Using Date Math4.
Using Grouping toCompare Time Frames
5.
You configure a report's date range using the fields in the query form's When: section.
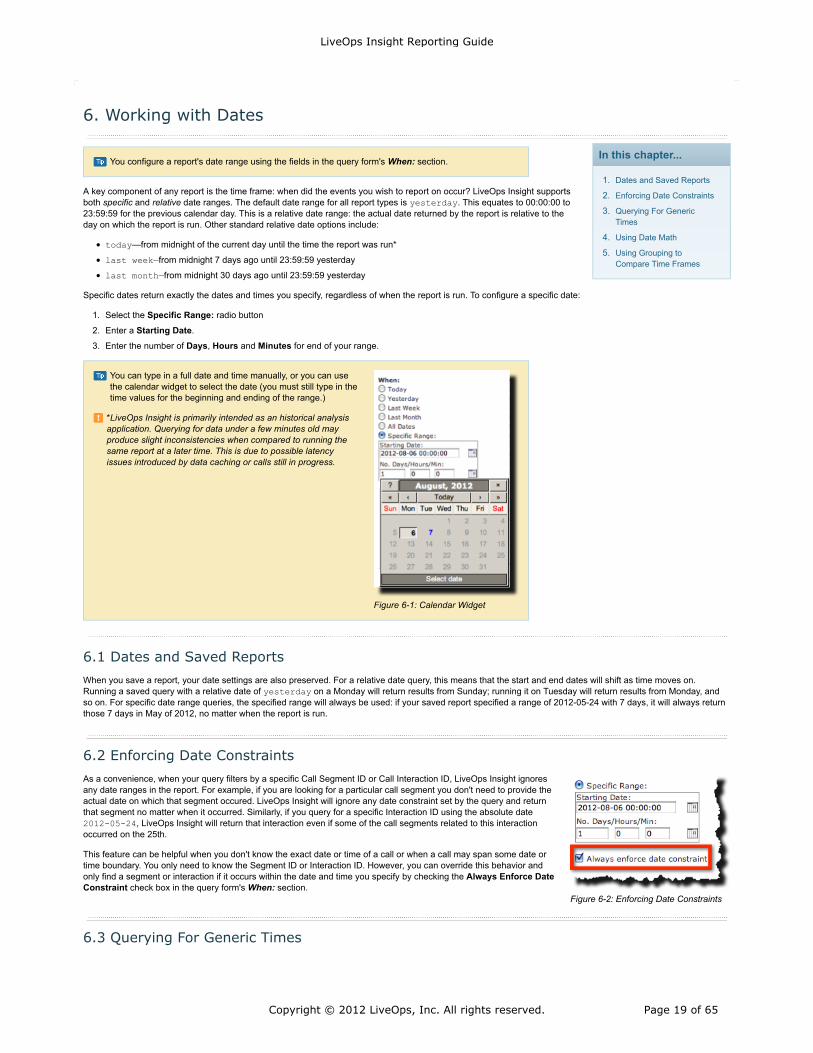
Figure 6-1: Calendar Widget
You can type in a full date and time manually, or you can usethe calendar widget to select the date (you must still type in thetime values for the beginning and ending of the range.)
*LiveOps Insight is primarily intended as an historical analysisapplication. Querying for data under a few minutes old mayproduce slight inconsistencies when compared to running thesame report at a later time. This is due to possible latencyissues introduced by data caching or calls still in progress.
Figure 6-2: Enforcing Date Constraints
6. Working with Dates
A key component of any report is the time frame: when did the events you wish to report on occur? LiveOps Insight supportsboth specific and relative date ranges. The default date range for all report types is yesterday. This equates to 00:00:00 to23:59:59 for the previous calendar day. This is a relative date range: the actual date returned by the report is relative to theday on which the report is run. Other standard relative date options include:
today—from midnight of the current day until the time the report was run*
last week—from midnight 7 days ago until 23:59:59 yesterday
last month—from midnight 30 days ago until 23:59:59 yesterday
Specific dates return exactly the dates and times you specify, regardless of when the report is run. To configure a specific date:
Select the Specific Range: radio button1.
Enter a Starting Date.2.
Enter the number of Days, Hours and Minutes for end of your range.3.
6.1 Dates and Saved Reports
When you save a report, your date settings are also preserved. For a relative date query, this means that the start and end dates will shift as time moves on.Running a saved query with a relative date of yesterday on a Monday will return results from Sunday; running it on Tuesday will return results from Monday, andso on. For specific date range queries, the specified range will always be used: if your saved report specified a range of 2012-05-24 with 7 days, it will always returnthose 7 days in May of 2012, no matter when the report is run.
6.2 Enforcing Date Constraints
As a convenience, when your query filters by a specific Call Segment ID or Call Interaction ID, LiveOps Insight ignoresany date ranges in the report. For example, if you are looking for a particular call segment you don't need to provide theactual date on which that segment occured. LiveOps Insight will ignore any date constraint set by the query and returnthat segment no matter when it occurred. Similarly, if you query for a specific Interaction ID using the absolute date2012-05-24, LiveOps Insight will return that interaction even if some of the call segments related to this interactionoccurred on the 25th.
This feature can be helpful when you don't know the exact date or time of a call or when a call may span some date ortime boundary. You only need to know the Segment ID or Interaction ID. However, you can override this behavior andonly find a segment or interaction if it occurs within the date and time you specify by checking the Always Enforce DateConstraint check box in the query form's When: section.
6.3 Querying For Generic Times
LiveOps Insight Reporting Guide
Copyright © 2012 LiveOps, Inc. All rights reserved. Page 19 of 65
The "day minus n" notation never includes the specified day. For example, today-1 means "yesterday,"Friday-2 means "Saturday," etc. To include the specified day, make the No. Days field equal to n+1.E.g., No. Days = 3 will return data for the previous 2 full days plus today.
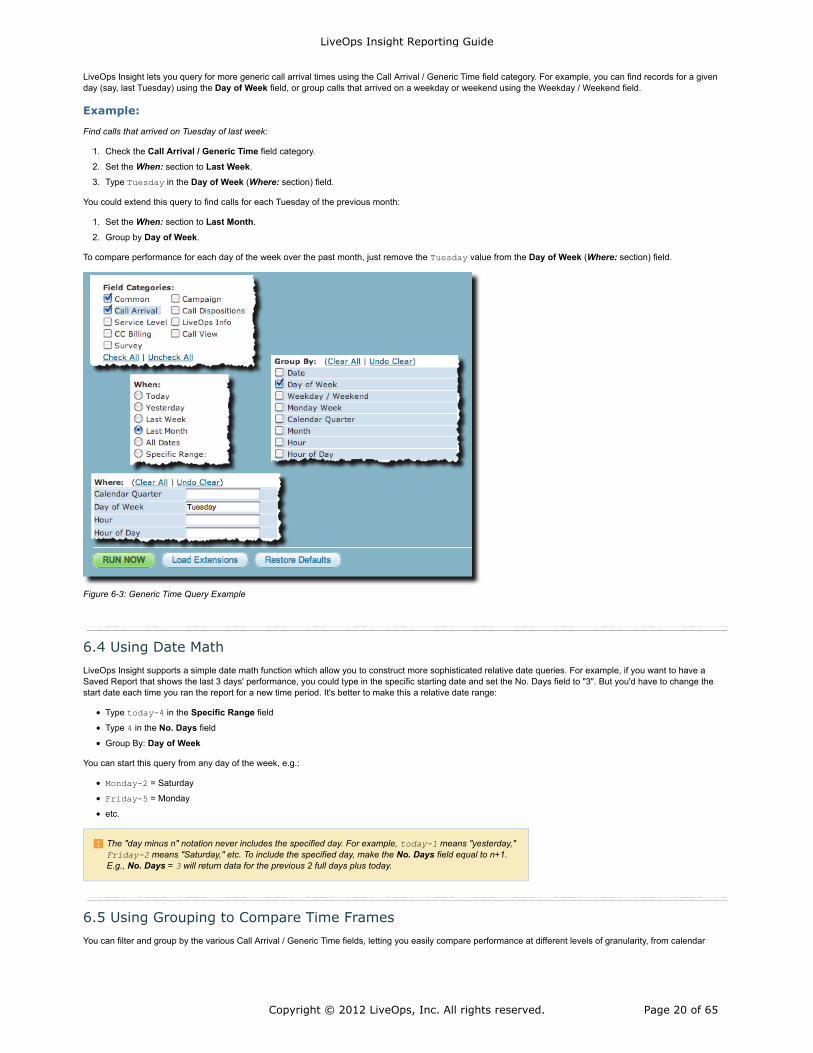
LiveOps Insight lets you query for more generic call arrival times using the Call Arrival / Generic Time field category. For example, you can find records for a givenday (say, last Tuesday) using the Day of Week field, or group calls that arrived on a weekday or weekend using the Weekday / Weekend field.
Example:
Find calls that arrived on Tuesday of last week:
Check the Call Arrival / Generic Time field category.1.
Set the When: section to Last Week.2.
Type Tuesday in the Day of Week (Where: section) field.3.
You could extend this query to find calls for each Tuesday of the previous month:
Set the When: section to Last Month.1.
Group by Day of Week.2.
To compare performance for each day of the week over the past month, just remove the Tuesday value from the Day of Week (Where: section) field.
Figure 6-3: Generic Time Query Example
6.4 Using Date Math
LiveOps Insight supports a simple date math function which allow you to construct more sophisticated relative date queries. For example, if you want to have aSaved Report that shows the last 3 days' performance, you could type in the specific starting date and set the No. Days field to "3". But you'd have to change thestart date each time you ran the report for a new time period. It's better to make this a relative date range:
Type today-4 in the Specific Range field
Type 4 in the No. Days field
Group By: Day of Week
You can start this query from any day of the week, e.g.:
Monday-2 = Saturday
Friday-5 = Monday
etc.
6.5 Using Grouping to Compare Time Frames
You can filter and group by the various Call Arrival / Generic Time fields, letting you easily compare performance at different levels of granularity, from calendar
LiveOps Insight Reporting Guide
Copyright © 2012 LiveOps, Inc. All rights reserved. Page 20 of 65
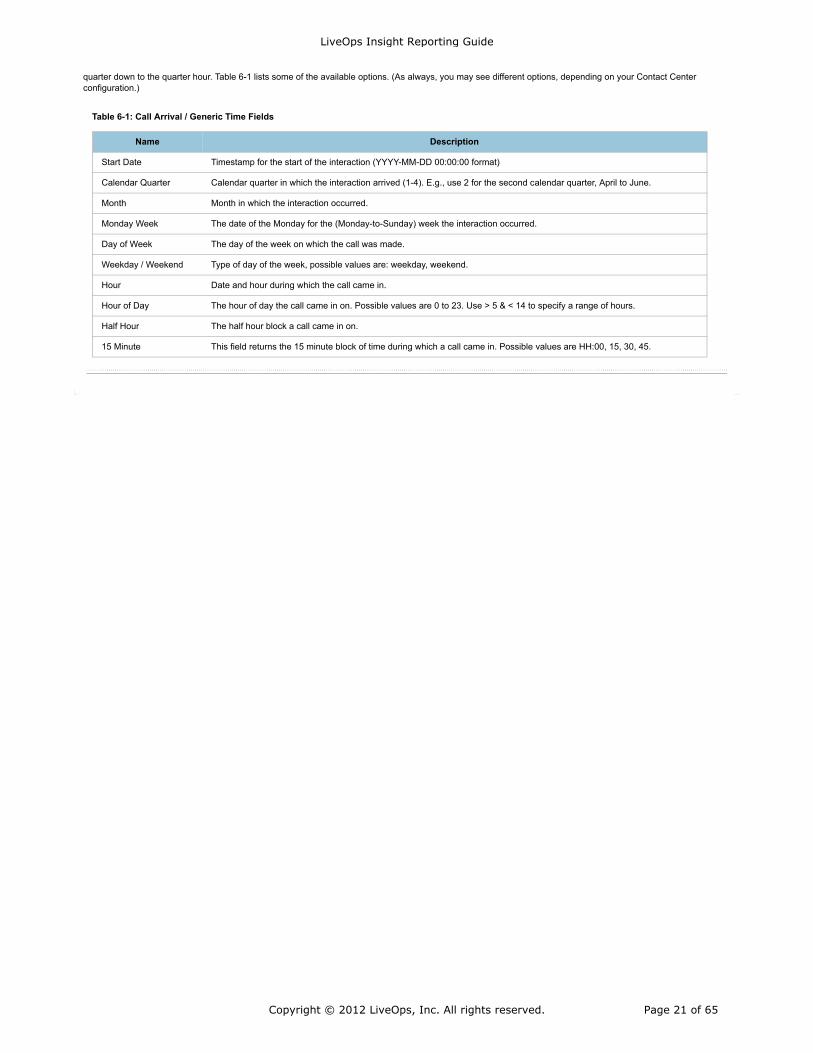
quarter down to the quarter hour. Table 6-1 lists some of the available options. (As always, you may see different options, depending on your Contact Centerconfiguration.)
Table 6-1: Call Arrival / Generic Time Fields
Name Description
Start Date Timestamp for the start of the interaction (YYYY-MM-DD 00:00:00 format)
Calendar Quarter Calendar quarter in which the interaction arrived (1-4). E.g., use 2 for the second calendar quarter, April to June.
Month Month in which the interaction occurred.
Monday Week The date of the Monday for the (Monday-to-Sunday) week the interaction occurred.
Day of Week The day of the week on which the call was made.
Weekday / Weekend Type of day of the week, possible values are: weekday, weekend.
Hour Date and hour during which the call came in.
Hour of Day The hour of day the call came in on. Possible values are 0 to 23. Use > 5 & < 14 to specify a range of hours.
Half Hour The half hour block a call came in on.
15 Minute This field returns the 15 minute block of time during which a call came in. Possible values are HH:00, 15, 30, 45.
LiveOps Insight Reporting Guide
Copyright © 2012 LiveOps, Inc. All rights reserved. Page 21 of 65
In this chapter...
Using the Where: Fields1.
Using the Having: Fields2.
Query Operators3.
Field categories are described in Chapter 8.
7. Filtering Results
7.1 Using the Where: Fields
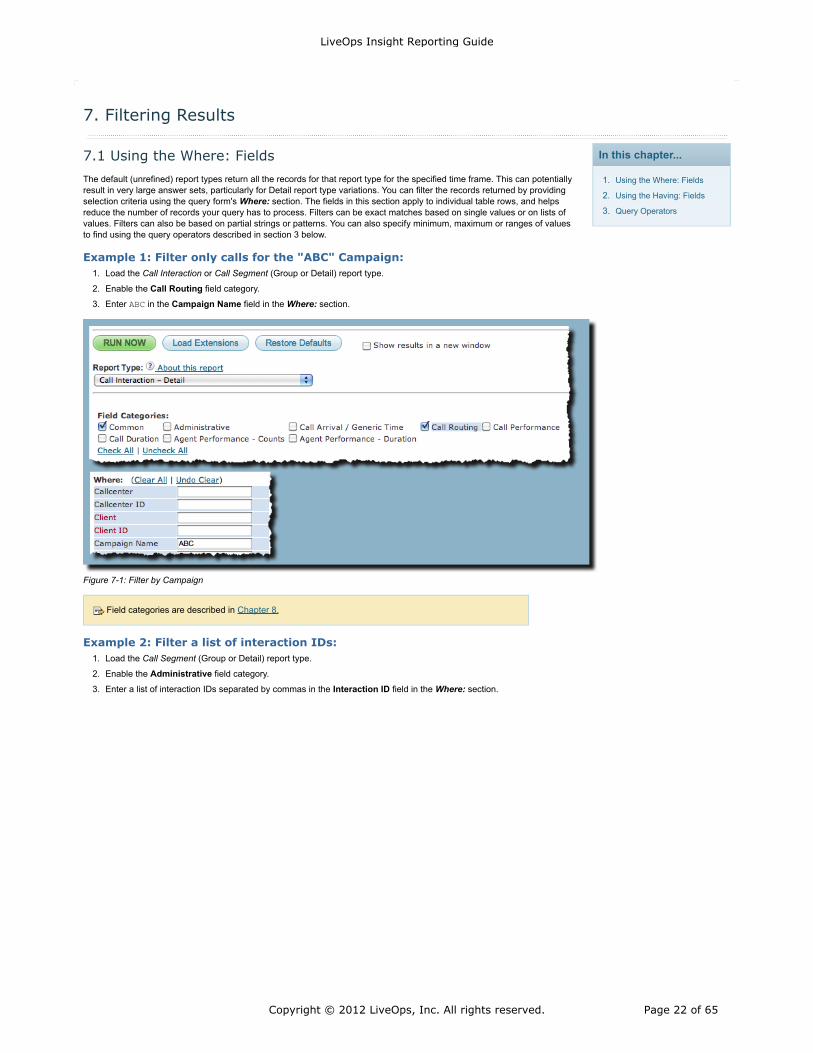
The default (unrefined) report types return all the records for that report type for the specified time frame. This can potentiallyresult in very large answer sets, particularly for Detail report type variations. You can filter the records returned by providingselection criteria using the query form's Where: section. The fields in this section apply to individual table rows, and helpsreduce the number of records your query has to process. Filters can be exact matches based on single values or on lists ofvalues. Filters can also be based on partial strings or patterns. You can also specify minimum, maximum or ranges of valuesto find using the query operators described in section 3 below.
Example 1: Filter only calls for the "ABC" Campaign:Load the Call Interaction or Call Segment (Group or Detail) report type.1.
Enable the Call Routing field category.2.
Enter ABC in the Campaign Name field in the Where: section.3.
Figure 7-1: Filter by Campaign
Example 2: Filter a list of interaction IDs:Load the Call Segment (Group or Detail) report type.1.
Enable the Administrative field category.2.
Enter a list of interaction IDs separated by commas in the Interaction ID field in the Where: section.3.
LiveOps Insight Reporting Guide
Copyright © 2012 LiveOps, Inc. All rights reserved. Page 22 of 65
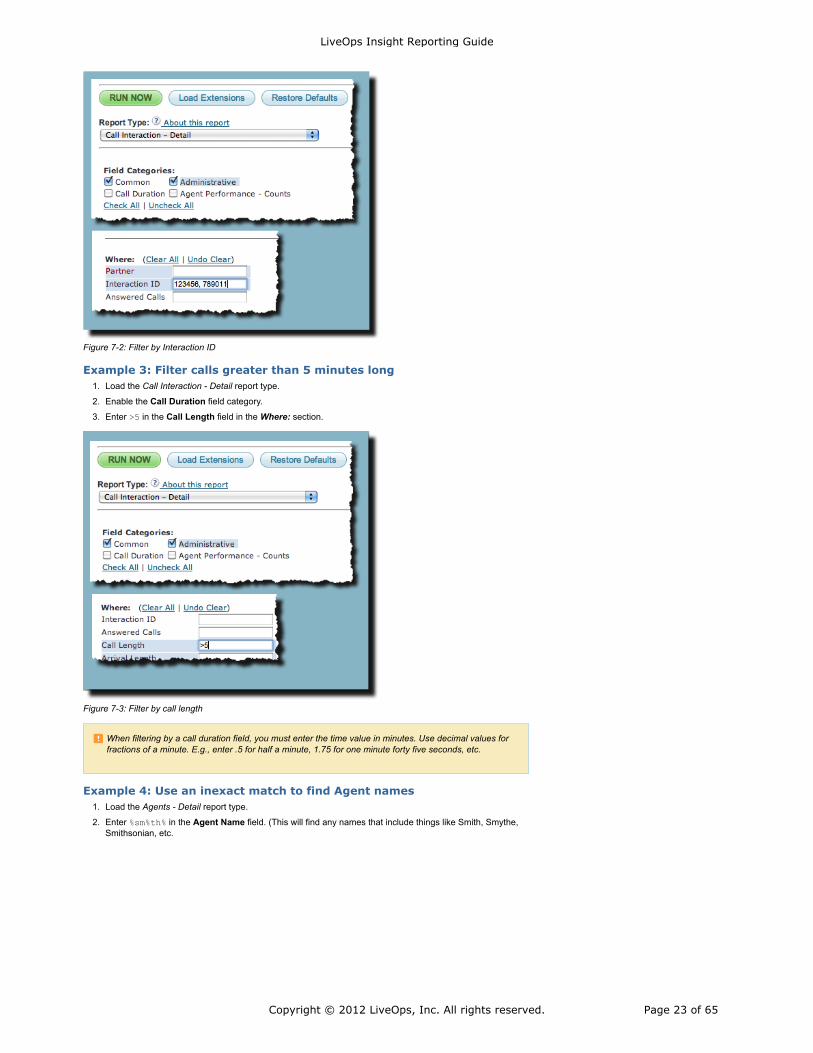
When filtering by a call duration field, you must enter the time value in minutes. Use decimal values forfractions of a minute. E.g., enter .5 for half a minute, 1.75 for one minute forty five seconds, etc.
Figure 7-2: Filter by Interaction ID
Example 3: Filter calls greater than 5 minutes longLoad the Call Interaction - Detail report type.1.
Enable the Call Duration field category.2.
Enter >5 in the Call Length field in the Where: section.3.
Figure 7-3: Filter by call length
Example 4: Use an inexact match to find Agent namesLoad the Agents - Detail report type.1.
Enter %sm%th% in the Agent Name field. (This will find any names that include things like Smith, Smythe,Smithsonian, etc.
2.
LiveOps Insight Reporting Guide
Copyright © 2012 LiveOps, Inc. All rights reserved. Page 23 of 65
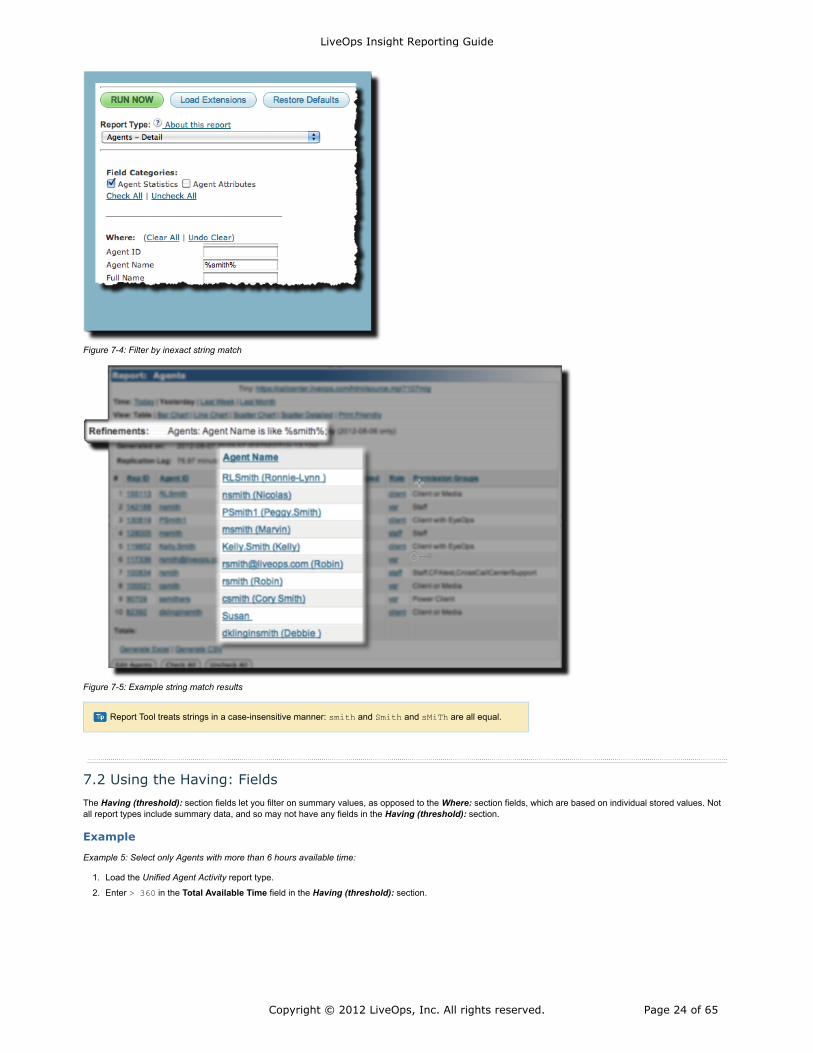
Report Tool treats strings in a case-insensitive manner: smith and Smith and sMiTh are all equal.
Figure 7-4: Filter by inexact string match
Figure 7-5: Example string match results
7.2 Using the Having: Fields
The Having (threshold): section fields let you filter on summary values, as opposed to the Where: section fields, which are based on individual stored values. Notall report types include summary data, and so may not have any fields in the Having (threshold): section.
Example
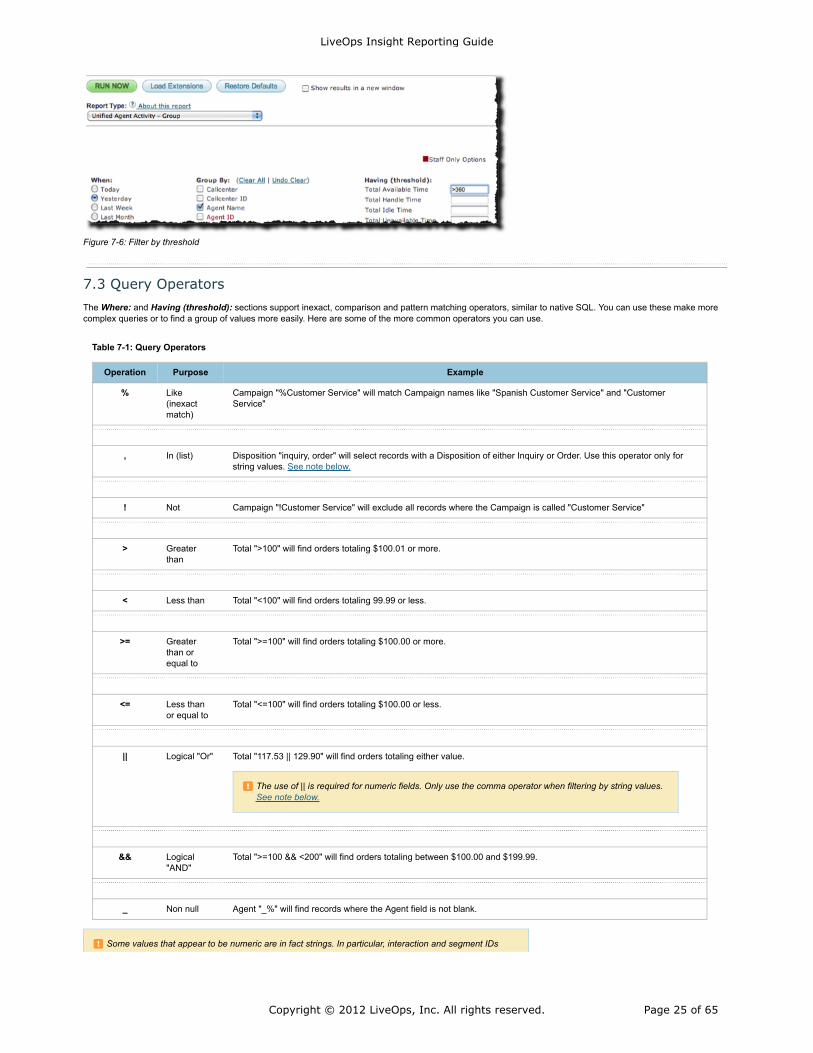
Example 5: Select only Agents with more than 6 hours available time:
Load the Unified Agent Activity report type.1.
Enter > 360 in the Total Available Time field in the Having (threshold): section.2.
LiveOps Insight Reporting Guide
Copyright © 2012 LiveOps, Inc. All rights reserved. Page 24 of 65
The use of || is required for numeric fields. Only use the comma operator when filtering by string values.See note below.
Some values that appear to be numeric are in fact strings. In particular, interaction and segment IDs
Figure 7-6: Filter by threshold
7.3 Query Operators
The Where: and Having (threshold): sections support inexact, comparison and pattern matching operators, similar to native SQL. You can use these make morecomplex queries or to find a group of values more easily. Here are some of the more common operators you can use.
Table 7-1: Query Operators
Operation Purpose Example
% Like(inexactmatch)
Campaign "%Customer Service" will match Campaign names like "Spanish Customer Service" and "CustomerService"
, In (list) Disposition "inquiry, order" will select records with a Disposition of either Inquiry or Order. Use this operator only forstring values. See note below.
! Not Campaign "!Customer Service" will exclude all records where the Campaign is called "Customer Service"
> Greaterthan
Total ">100" will find orders totaling $100.01 or more.
< Less than Total "<100" will find orders totaling 99.99 or less.
>= Greaterthan orequal to
Total ">=100" will find orders totaling $100.00 or more.
<= Less thanor equal to
Total "<=100" will find orders totaling $100.00 or less.
|| Logical "Or" Total "117.53 || 129.90" will find orders totaling either value.
&& Logical"AND"
Total ">=100 && <200" will find orders totaling between $100.00 and $199.99.
_ Non null Agent "_%" will find records where the Agent field is not blank.
LiveOps Insight Reporting Guide
Copyright © 2012 LiveOps, Inc. All rights reserved. Page 25 of 65
contain only numbers, yet are stored as strings for performance reasons. Hints that an apparent numericfield is actually a string include:
The field contents are left justified (numbers are always right justified)
The column has no total value displayed. (This is not an absolute, as you can turn display oftotals off and on in the Additional Options: section.
When querying for monetary amounts, do not enter dollar signs; just type in the numeric value, e.g.100.59
LiveOps Insight Reporting Guide
Copyright © 2012 LiveOps, Inc. All rights reserved. Page 26 of 65
In this chapter...
Show Fields1.
Field Categories2.
Field Extensions3.
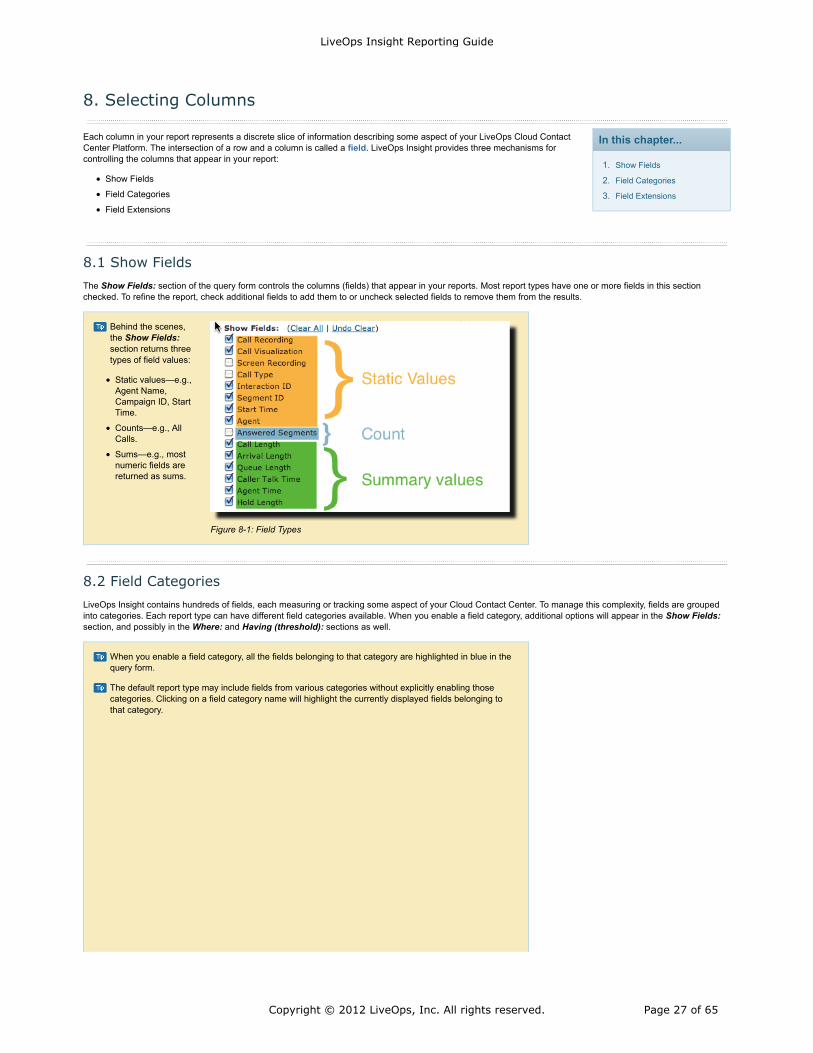
Figure 8-1: Field Types
Behind the scenes,the Show Fields:section returns threetypes of field values:
Static values—e.g.,Agent Name,Campaign ID, StartTime.
Counts—e.g., AllCalls.
Sums—e.g., mostnumeric fields arereturned as sums.
When you enable a field category, all the fields belonging to that category are highlighted in blue in thequery form.
The default report type may include fields from various categories without explicitly enabling thosecategories. Clicking on a field category name will highlight the currently displayed fields belonging tothat category.
8. Selecting Columns
Each column in your report represents a discrete slice of information describing some aspect of your LiveOps Cloud ContactCenter Platform. The intersection of a row and a column is called a field. LiveOps Insight provides three mechanisms forcontrolling the columns that appear in your report:
Show Fields
Field Categories
Field Extensions
8.1 Show Fields
The Show Fields: section of the query form controls the columns (fields) that appear in your reports. Most report types have one or more fields in this sectionchecked. To refine the report, check additional fields to add them to or uncheck selected fields to remove them from the results.
8.2 Field Categories
LiveOps Insight contains hundreds of fields, each measuring or tracking some aspect of your Cloud Contact Center. To manage this complexity, fields are groupedinto categories. Each report type can have different field categories available. When you enable a field category, additional options will appear in the Show Fields:section, and possibly in the Where: and Having (threshold): sections as well.
LiveOps Insight Reporting Guide
Copyright © 2012 LiveOps, Inc. All rights reserved. Page 27 of 65
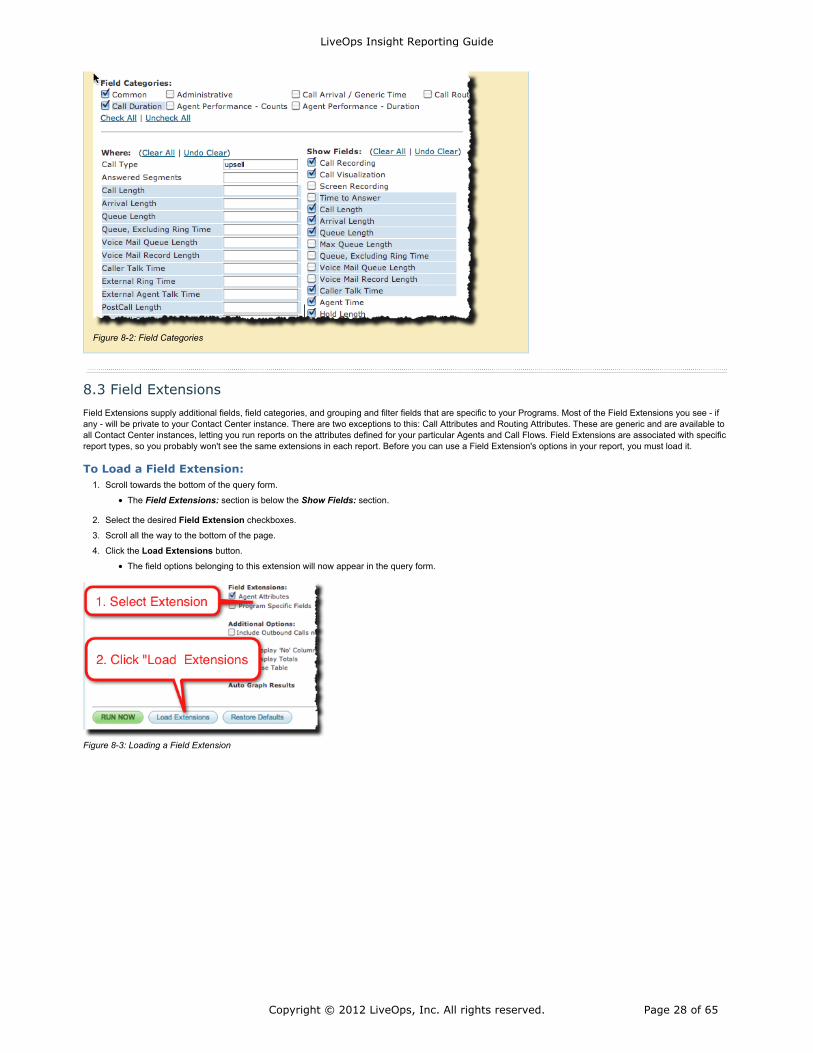
Figure 8-2: Field Categories
8.3 Field Extensions
Field Extensions supply additional fields, field categories, and grouping and filter fields that are specific to your Programs. Most of the Field Extensions you see - ifany - will be private to your Contact Center instance. There are two exceptions to this: Call Attributes and Routing Attributes. These are generic and are available toall Contact Center instances, letting you run reports on the attributes defined for your particular Agents and Call Flows. Field Extensions are associated with specificreport types, so you probably won't see the same extensions in each report. Before you can use a Field Extension's options in your report, you must load it.
To Load a Field Extension:Scroll towards the bottom of the query form.1.
The Field Extensions: section is below the Show Fields: section.
Select the desired Field Extension checkboxes.2.
Scroll all the way to the bottom of the page.3.
Click the Load Extensions button.4.
The field options belonging to this extension will now appear in the query form.
Figure 8-3: Loading a Field Extension
LiveOps Insight Reporting Guide
Copyright © 2012 LiveOps, Inc. All rights reserved. Page 28 of 65
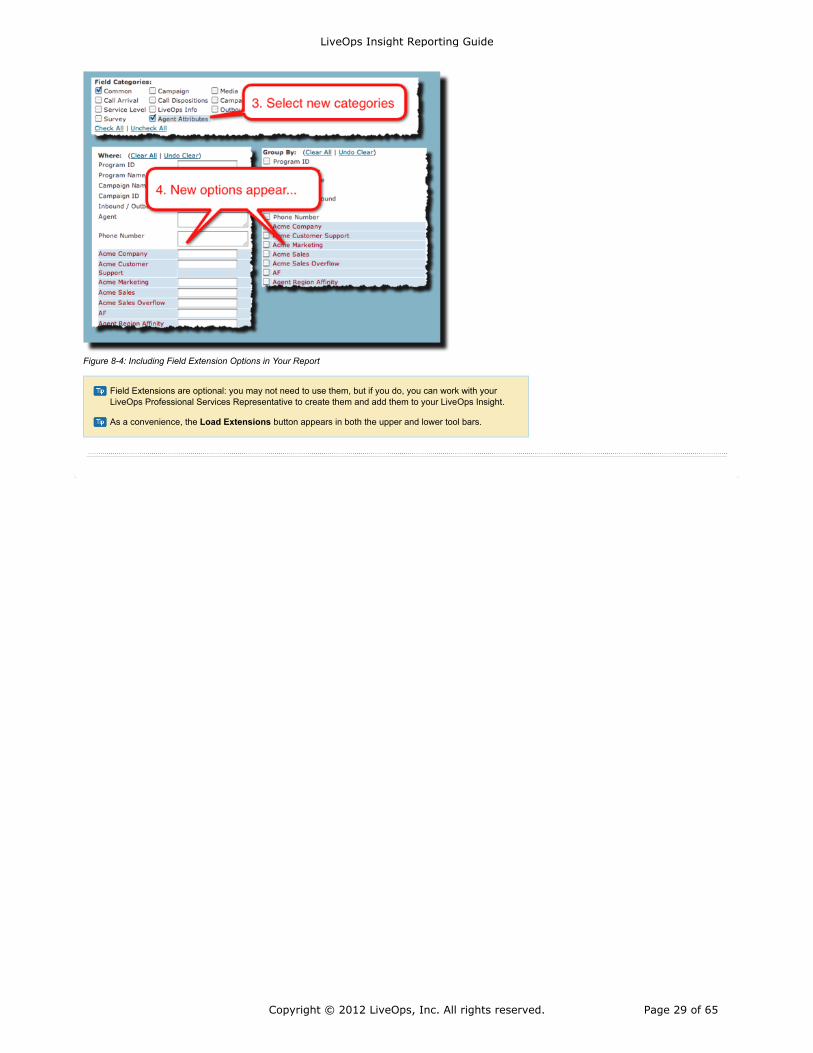
Field Extensions are optional: you may not need to use them, but if you do, you can work with yourLiveOps Professional Services Representative to create them and add them to your LiveOps Insight.
As a convenience, the Load Extensions button appears in both the upper and lower tool bars.
Figure 8-4: Including Field Extension Options in Your Report
LiveOps Insight Reporting Guide
Copyright © 2012 LiveOps, Inc. All rights reserved. Page 29 of 65
In this chapter...
Group By1.
When you group a LiveOps Insight report, each line of the report represents the group, with subtotals forthat grouping inline. Grouping by multiple fields will generate one line per grouping combination.
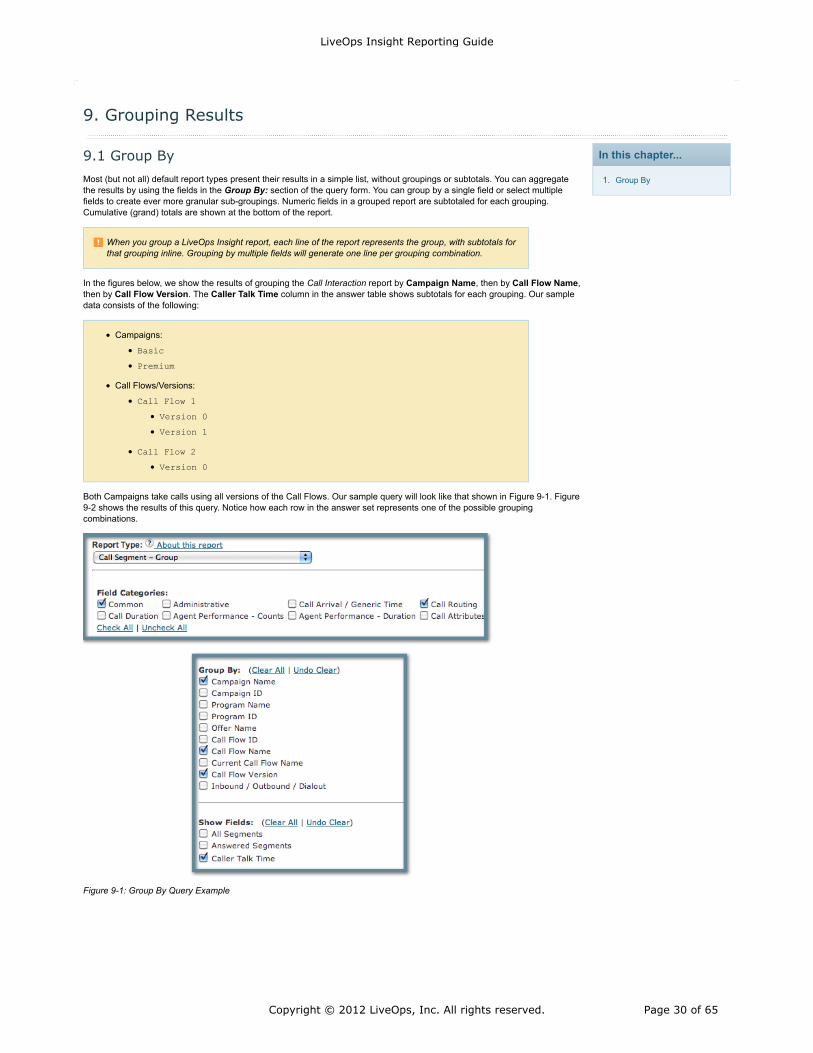
Campaigns:
Basic
Premium
Call Flows/Versions:
Call Flow 1
Version 0
Version 1
Call Flow 2
Version 0
9. Grouping Results
9.1 Group By
Most (but not all) default report types present their results in a simple list, without groupings or subtotals. You can aggregatethe results by using the fields in the Group By: section of the query form. You can group by a single field or select multiplefields to create ever more granular sub-groupings. Numeric fields in a grouped report are subtotaled for each grouping.Cumulative (grand) totals are shown at the bottom of the report.
In the figures below, we show the results of grouping the Call Interaction report by Campaign Name, then by Call Flow Name,then by Call Flow Version. The Caller Talk Time column in the answer table shows subtotals for each grouping. Our sampledata consists of the following:
Both Campaigns take calls using all versions of the Call Flows. Our sample query will look like that shown in Figure 9-1. Figure9-2 shows the results of this query. Notice how each row in the answer set represents one of the possible groupingcombinations.
Figure 9-1: Group By Query Example
LiveOps Insight Reporting Guide
Copyright © 2012 LiveOps, Inc. All rights reserved. Page 30 of 65
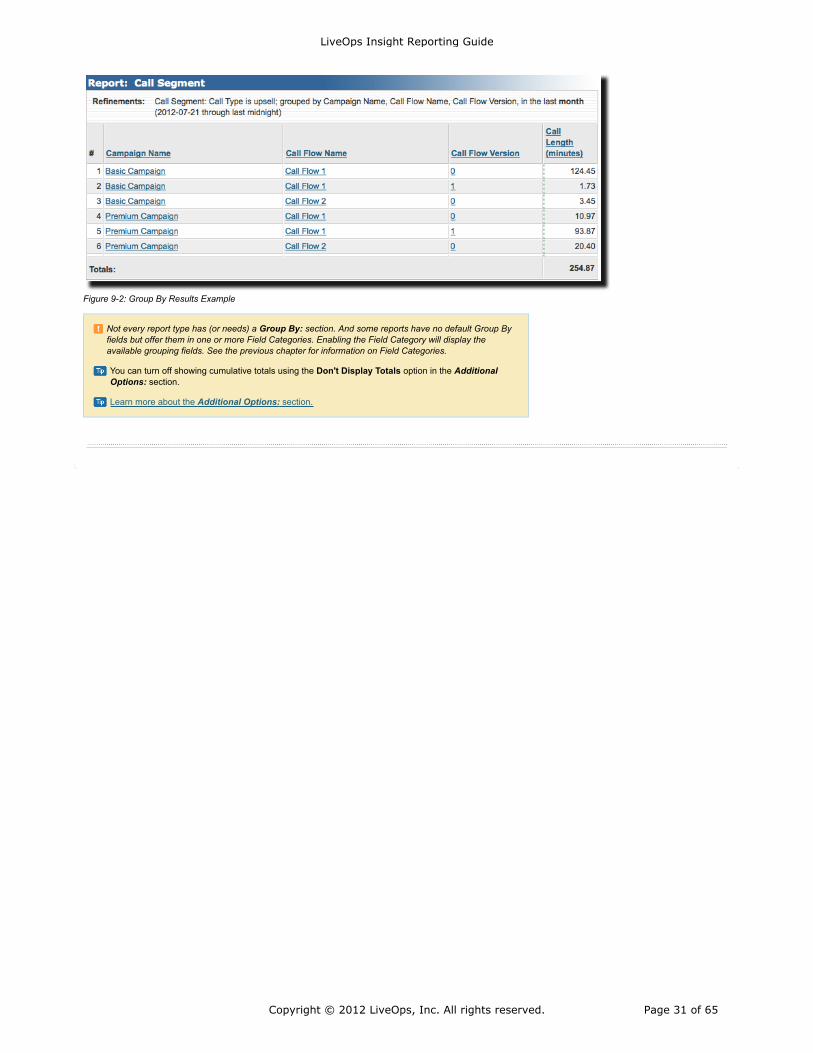
Not every report type has (or needs) a Group By: section. And some reports have no default Group Byfields but offer them in one or more Field Categories. Enabling the Field Category will display theavailable grouping fields. See the previous chapter for information on Field Categories.
You can turn off showing cumulative totals using the Don't Display Totals option in the AdditionalOptions: section.
Learn more about the Additional Options: section.
Figure 9-2: Group By Results Example
LiveOps Insight Reporting Guide
Copyright © 2012 LiveOps, Inc. All rights reserved. Page 31 of 65
In this chapter...
Include Outbound Calls notConnected to an Agent
1.
Don't Display 'No' Columns2.
Don't Display Totals3.
Transpose Table4.
Applying this option to long results sets will produce a very wide answer table. Your Internet browser maynot be optimized to display thousands of columns in this fashion. As an alternative, you can run yourreport without this option, export the report to Microsoft Excel™ and use that application's PivotTablereport feature to analyse your data.
10. Additional Query Options
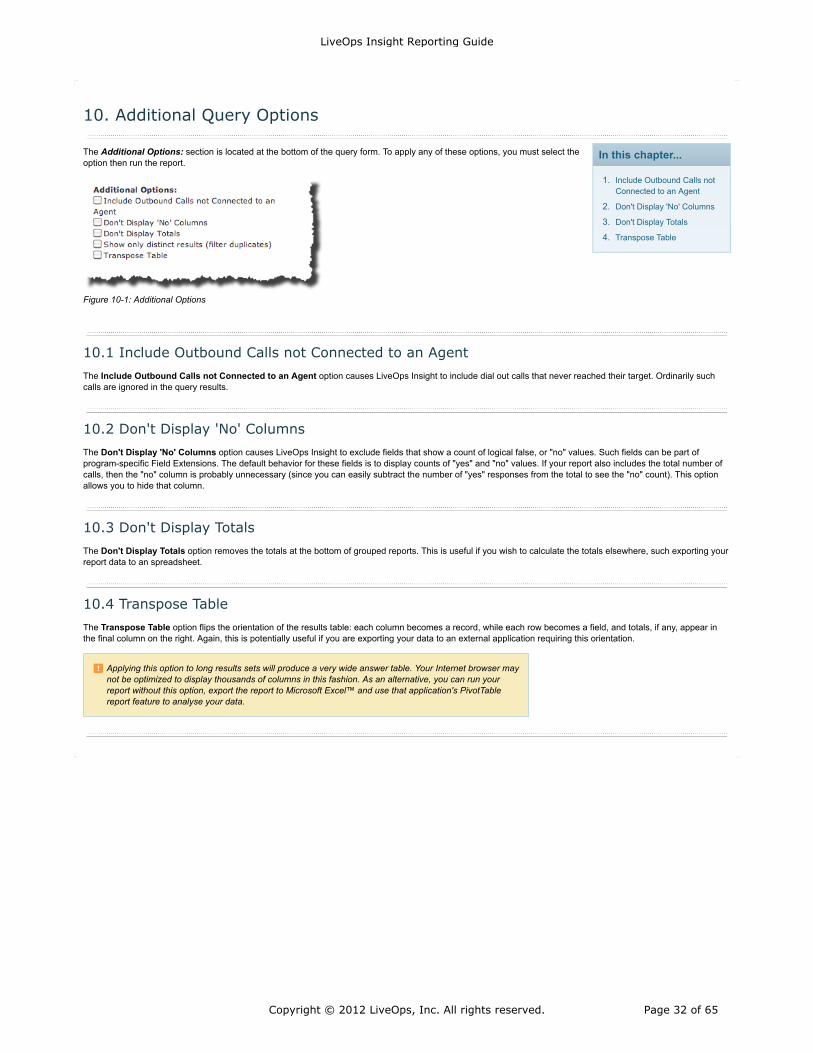
The Additional Options: section is located at the bottom of the query form. To apply any of these options, you must select theoption then run the report.
Figure 10-1: Additional Options
10.1 Include Outbound Calls not Connected to an Agent
The Include Outbound Calls not Connected to an Agent option causes LiveOps Insight to include dial out calls that never reached their target. Ordinarily suchcalls are ignored in the query results.
10.2 Don't Display 'No' Columns
The Don't Display 'No' Columns option causes LiveOps Insight to exclude fields that show a count of logical false, or "no" values. Such fields can be part ofprogram-specific Field Extensions. The default behavior for these fields is to display counts of "yes" and "no" values. If your report also includes the total number ofcalls, then the "no" column is probably unnecessary (since you can easily subtract the number of "yes" responses from the total to see the "no" count). This optionallows you to hide that column.
10.3 Don't Display Totals
The Don't Display Totals option removes the totals at the bottom of grouped reports. This is useful if you wish to calculate the totals elsewhere, such exporting yourreport data to an spreadsheet.
10.4 Transpose Table
The Transpose Table option flips the orientation of the results table: each column becomes a record, while each row becomes a field, and totals, if any, appear inthe final column on the right. Again, this is potentially useful if you are exporting your data to an external application requiring this orientation.
LiveOps Insight Reporting Guide
Copyright © 2012 LiveOps, Inc. All rights reserved. Page 32 of 65
In this chapter...
Running a Saved Report1.
Report Categories2.
Report Options3.
Save a Copy4.
Deleting Reports5.
Dates and Saved Reports6.
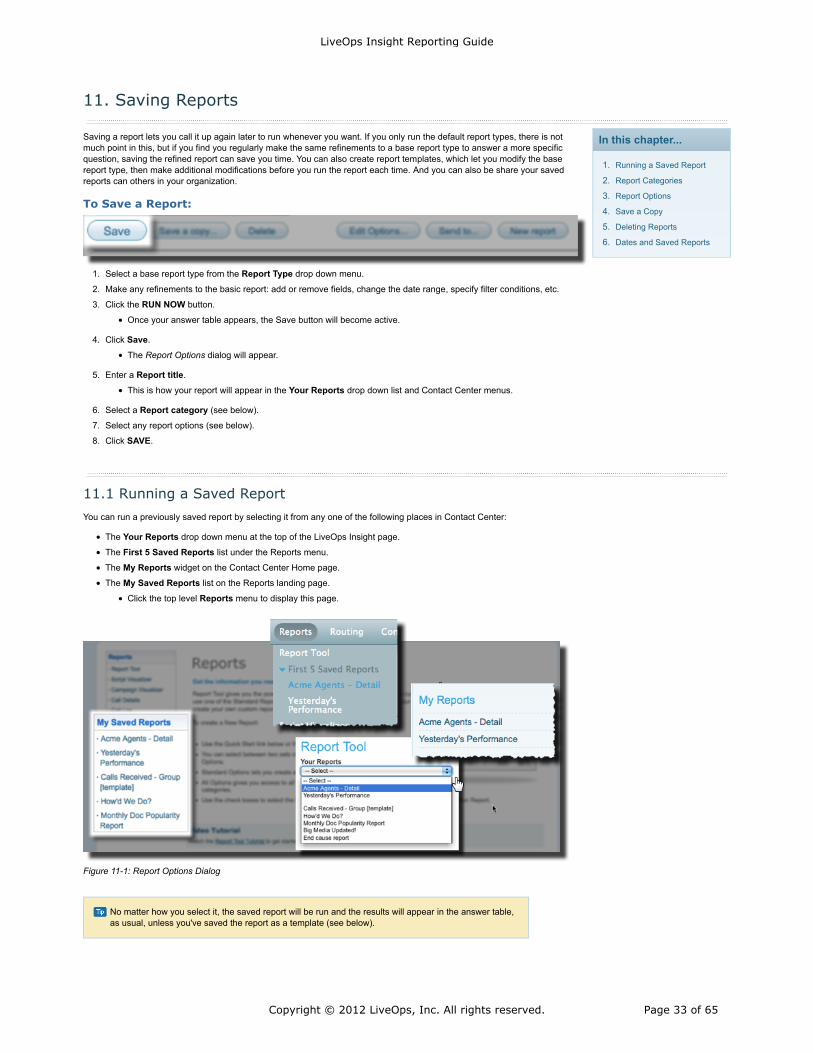
No matter how you select it, the saved report will be run and the results will appear in the answer table,as usual, unless you've saved the report as a template (see below).
11. Saving Reports
Saving a report lets you call it up again later to run whenever you want. If you only run the default report types, there is notmuch point in this, but if you find you regularly make the same refinements to a base report type to answer a more specificquestion, saving the refined report can save you time. You can also create report templates, which let you modify the basereport type, then make additional modifications before you run the report each time. And you can also be share your savedreports can others in your organization.
To Save a Report:
Select a base report type from the Report Type drop down menu.1.
Make any refinements to the basic report: add or remove fields, change the date range, specify filter conditions, etc.2.
Click the RUN NOW button.3.
Once your answer table appears, the Save button will become active.
Click Save.4.
The Report Options dialog will appear.
Enter a Report title.5.
This is how your report will appear in the Your Reports drop down list and Contact Center menus.
Select a Report category (see below).6.
Select any report options (see below).7.
Click SAVE.8.
11.1 Running a Saved Report
You can run a previously saved report by selecting it from any one of the following places in Contact Center:
The Your Reports drop down menu at the top of the LiveOps Insight page.
The First 5 Saved Reports list under the Reports menu.
The My Reports widget on the Contact Center Home page.
The My Saved Reports list on the Reports landing page.
Click the top level Reports menu to display this page.
Figure 11-1: Report Options Dialog
LiveOps Insight Reporting Guide
Copyright © 2012 LiveOps, Inc. All rights reserved. Page 33 of 65
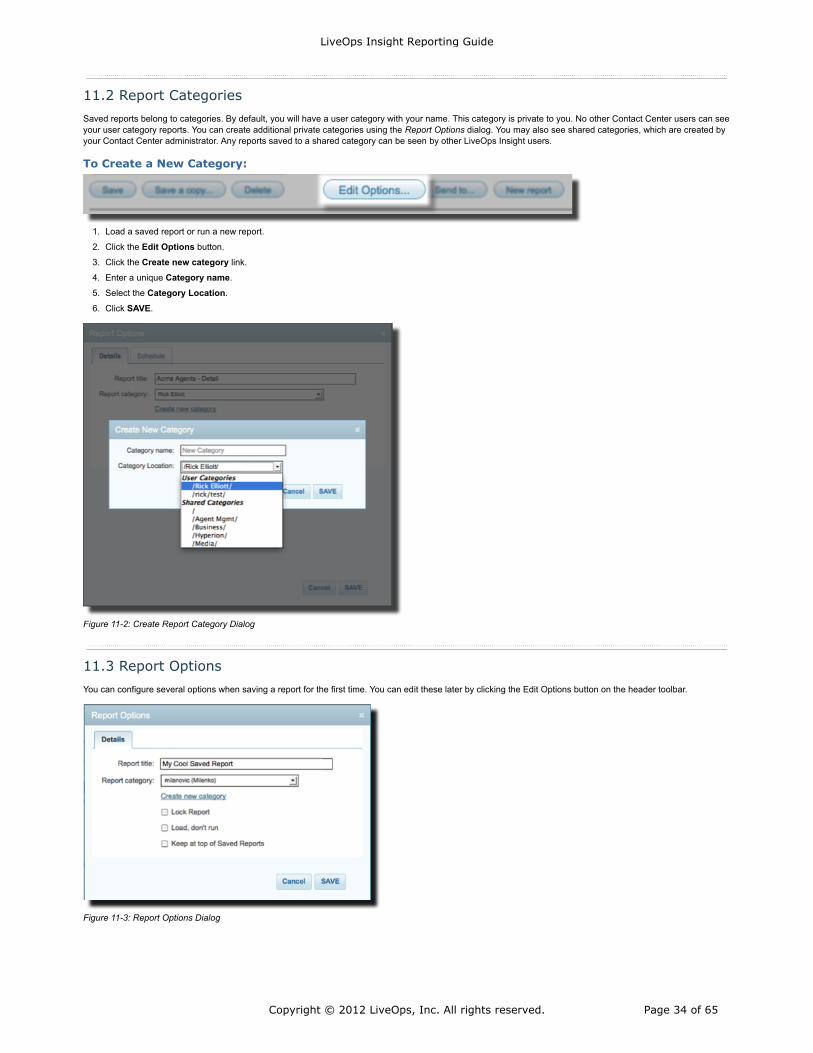
11.2 Report Categories
Saved reports belong to categories. By default, you will have a user category with your name. This category is private to you. No other Contact Center users can seeyour user category reports. You can create additional private categories using the Report Options dialog. You may also see shared categories, which are created byyour Contact Center administrator. Any reports saved to a shared category can be seen by other LiveOps Insight users.
To Create a New Category:
Load a saved report or run a new report.1.
Click the Edit Options button.2.
Click the Create new category link.3.
Enter a unique Category name.4.
Select the Category Location.5.
Click SAVE.6.
Figure 11-2: Create Report Category Dialog
11.3 Report Options
You can configure several options when saving a report for the first time. You can edit these later by clicking the Edit Options button on the header toolbar.
Figure 11-3: Report Options Dialog
LiveOps Insight Reporting Guide
Copyright © 2012 LiveOps, Inc. All rights reserved. Page 34 of 65
Saving a copy does not display the copy. To load the copy, refresh your browser to the update the YourReports menu, then select the copied report.
If you want to see your copy right away, click the link in the confirmation banner that appears after youclick SAVE. This banner only appears for a few seconds. After that, you can load the report as notedabove.
Be careful! Deleting a report cannot be undone. However, only the report definition is deleted; your datais secure, so you can always recreate the report if required.
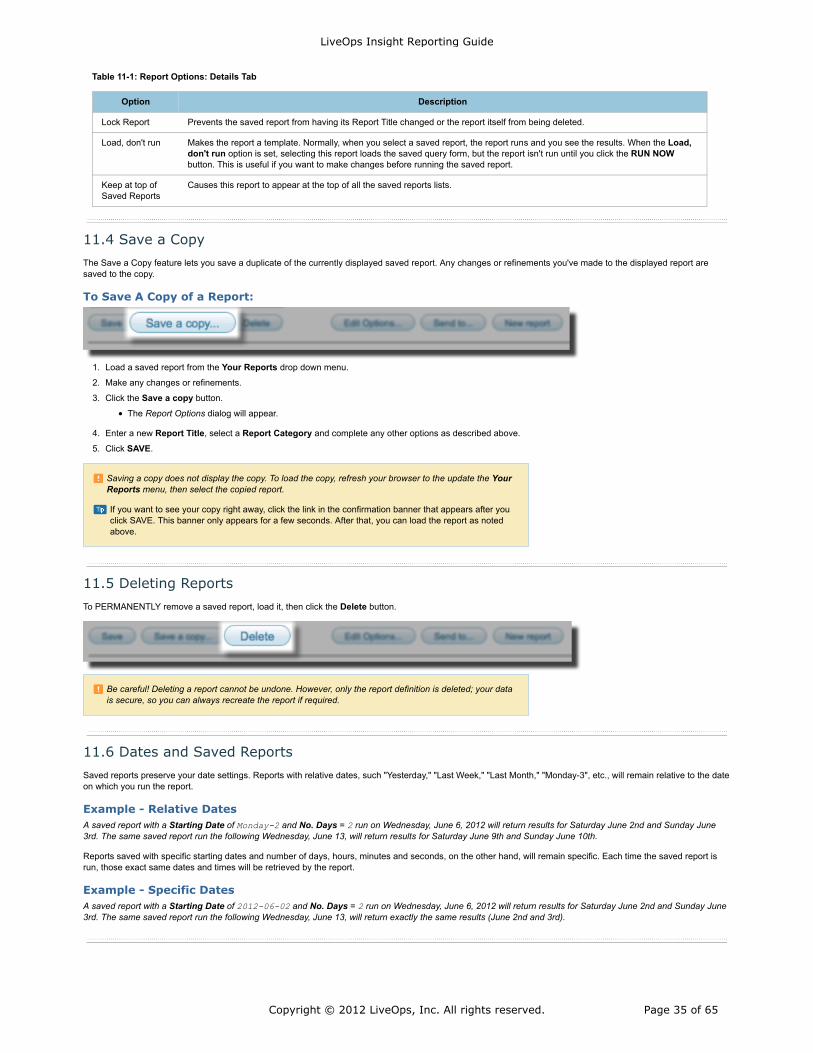
Table 11-1: Report Options: Details Tab
Option Description
Lock Report Prevents the saved report from having its Report Title changed or the report itself from being deleted.
Load, don't run Makes the report a template. Normally, when you select a saved report, the report runs and you see the results. When the Load,don't run option is set, selecting this report loads the saved query form, but the report isn't run until you click the RUN NOWbutton. This is useful if you want to make changes before running the saved report.
Keep at top ofSaved Reports
Causes this report to appear at the top of all the saved reports lists.
11.4 Save a Copy
The Save a Copy feature lets you save a duplicate of the currently displayed saved report. Any changes or refinements you've made to the displayed report aresaved to the copy.
To Save A Copy of a Report:
Load a saved report from the Your Reports drop down menu.1.
Make any changes or refinements.2.
Click the Save a copy button.3.
The Report Options dialog will appear.
Enter a new Report Title, select a Report Category and complete any other options as described above.4.
Click SAVE.5.
11.5 Deleting Reports
To PERMANENTLY remove a saved report, load it, then click the Delete button.
11.6 Dates and Saved Reports
Saved reports preserve your date settings. Reports with relative dates, such "Yesterday," "Last Week," "Last Month," "Monday-3", etc., will remain relative to the dateon which you run the report.
Example - Relative DatesA saved report with a Starting Date of Monday-2 and No. Days = 2 run on Wednesday, June 6, 2012 will return results for Saturday June 2nd and Sunday June3rd. The same saved report run the following Wednesday, June 13, will return results for Saturday June 9th and Sunday June 10th.
Reports saved with specific starting dates and number of days, hours, minutes and seconds, on the other hand, will remain specific. Each time the saved report isrun, those exact same dates and times will be retrieved by the report.
Example - Specific DatesA saved report with a Starting Date of 2012-06-02 and No. Days = 2 run on Wednesday, June 6, 2012 will return results for Saturday June 2nd and Sunday June3rd. The same saved report run the following Wednesday, June 13, will return exactly the same results (June 2nd and 3rd).
LiveOps Insight Reporting Guide
Copyright © 2012 LiveOps, Inc. All rights reserved. Page 35 of 65
In this chapter...
Emailing Reports1.
Exporting Reports2.
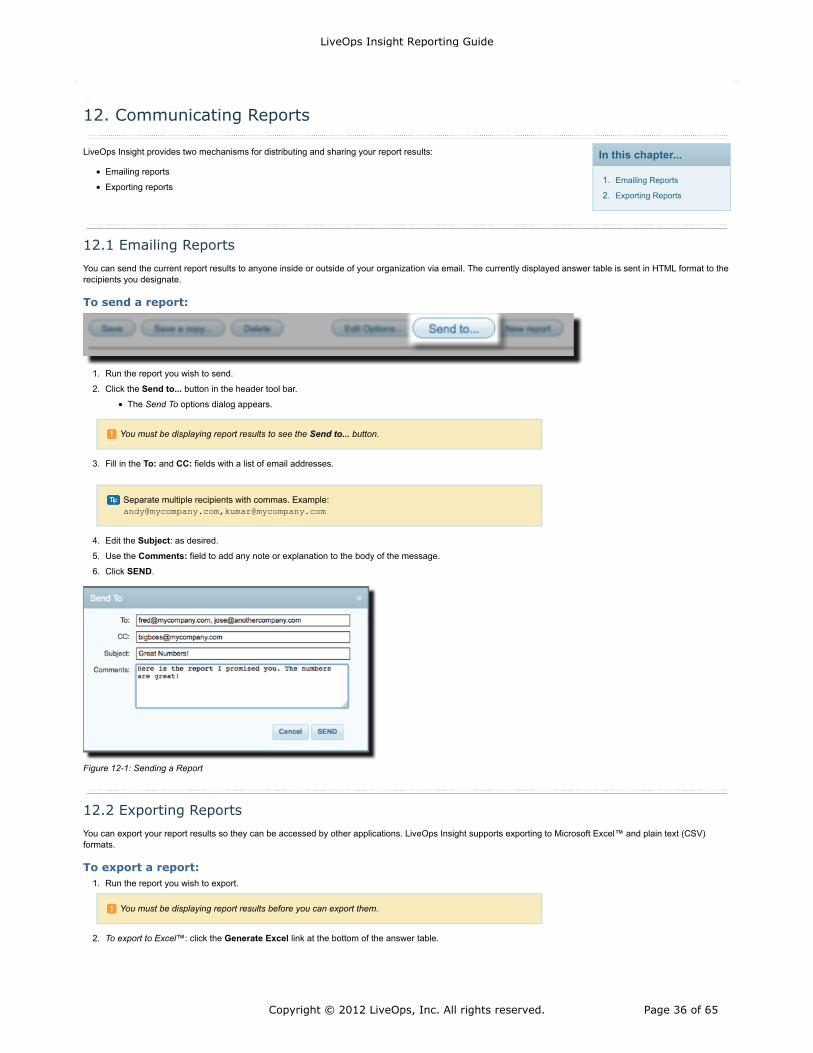
You must be displaying report results to see the Send to... button.
Separate multiple recipients with commas. Example:[email protected],[email protected]
You must be displaying report results before you can export them.
12. Communicating Reports
LiveOps Insight provides two mechanisms for distributing and sharing your report results:
Emailing reports
Exporting reports
12.1 Emailing Reports
You can send the current report results to anyone inside or outside of your organization via email. The currently displayed answer table is sent in HTML format to therecipients you designate.
To send a report:
Run the report you wish to send.1.
Click the Send to... button in the header tool bar.2.
The Send To options dialog appears.
Fill in the To: and CC: fields with a list of email addresses.3.
Edit the Subject: as desired.4.
Use the Comments: field to add any note or explanation to the body of the message.5.
Click SEND.6.
Figure 12-1: Sending a Report
12.2 Exporting Reports
You can export your report results so they can be accessed by other applications. LiveOps Insight supports exporting to Microsoft Excel™ and plain text (CSV)formats.
To export a report:Run the report you wish to export.1.
To export to Excel™: click the Generate Excel link at the bottom of the answer table.2.
LiveOps Insight Reporting Guide
Copyright © 2012 LiveOps, Inc. All rights reserved. Page 36 of 65
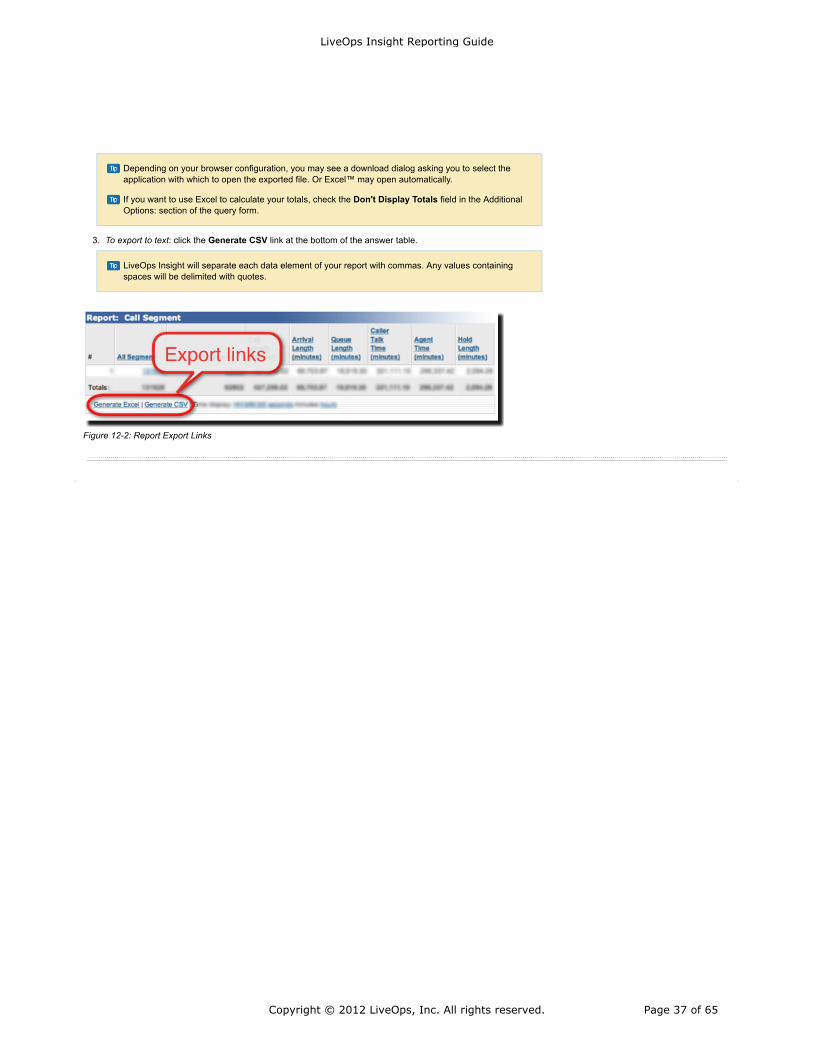
Depending on your browser configuration, you may see a download dialog asking you to select theapplication with which to open the exported file. Or Excel™ may open automatically.
If you want to use Excel to calculate your totals, check the Don't Display Totals field in the AdditionalOptions: section of the query form.
LiveOps Insight will separate each data element of your report with commas. Any values containingspaces will be delimited with quotes.
To export to text: click the Generate CSV link at the bottom of the answer table.3.
Figure 12-2: Report Export Links
LiveOps Insight Reporting Guide
Copyright © 2012 LiveOps, Inc. All rights reserved. Page 37 of 65
In this chapter...
Verifying Your Query1.
Reducing Query Time2.
Phone Number Format3.
Retrieving Null andNon-Null Values
4.
Drilling Down5.
Troubleshooting6.
Legacy telephone numbers may exist on the platform which do not conform to this standard (i.e., do notbegin with a plus sign). In these cases, begin the number with 1.
You can use an inexact match operator to find numbers that may or may not contain leading charactersor country codes. E.g., %8004114700 will find +18004114700, 18004114700 or 8004114700.
Although US and Canadian numbers are displayed in your answer table with hyphens between thecountry code, area code, prefix and line number (e.g., +1-800-411-4700), you don't need to formatthe phone numbers you enter in Where: section filters. The dashes are ignored by the query.
Learn more about the E. 164 recommendation at http://en.wikipedia.org/wiki/E.164
13. Best Practices
The LiveOps LiveOps Insight is both powerful and flexible. The following are suggested best practices to help new usersmaster that power and get the most out of the application.
13.1 Verifying Your Query
LiveOps Insight answers the question you asked. If the results produced don't match your expectation, perhaps you asked a different question than you intended.Use the Refinements section of the answer table to double check the query that was actually passed to LiveOps Insight.
13.2 Reducing Query Time
LiveOps Insight response time is influenced by a number of factors, including
Number of records in the answer set.
Number of calculated (Show Fields: section) fields.
Number of grouping levels.
Pattern matching in filter (Where: section) fields.
To get the best response time, consider the following guidelines:
Restrict the time scale of your query to the minimum necessary. If you only need two weeks of data, construct a query that asks for that time frame, ratherthan querying for a full month.
Use the Maximum Rows field to limit the number of records returned. You can use this to test the results of your query on a small answer set, thenincrease or remove the restriction for the final report.
Only include the fields you actually need. Uncheck superfluous fields in the Show Fields: section.
Use Where: section criteria to filter the records returned to just the subset you actually need.
Keep Group By: section fields to the minimum required.
Sometimes, it's faster to do two queries on shorter time scales: if possible, break your query up into chunks.
13.3 Phone Number Format
The LiveOps Cloud Contact Center supports telephone numbers that conform to the E. 164 recommendation. This is an international standard that, among otherthings, recommends that all telephone numbers start with a plus sign (+), followed by their country code. For the U.S.A. and Canada, phone numbers start with +1.We recommend you follow this standard when supplying phone numbers for features such as dial out or external transfers. When filtering your reports on thesenumbers, be sure to preface them +1 in Where: section filters.
Example: +18004114700
13.4 Retrieving Null and Non-Null Values
LiveOps Insight Reporting Guide
Copyright © 2012 LiveOps, Inc. All rights reserved. Page 38 of 65
Why does this work? The underscore (_) means "any single non-null character." The percent sign (%) isan inexact (wildcard) match. Taken together, this means "find non-null anything.")
The exclamation point (!) is a negation operator (meaning "not"). Taken together, this means "find notnon-null anything.") But it's easier to say "find null values."
Learn more about query operators.
To filter records where a certain field contains a specific value, simply type that value in that field in the Where: section of the query form. For example, to filterrecords by the Program named "Spanish," type Spanish in the Program field in the Where: section. But to find records where a certain field contains any value, aslong as it's not empty, use the "underscore percent" operators: _%
To use this, enter this combination of operators as the selection criterion for a field in the Where: section. LiveOps Insight will return all records where that field has anon-null value.
To reverse this and filter records containing only empty or null values in a particular field, add an exclamation point: !_%
13.5 Drilling Down
Fields that appear in your answer table as links allow you to interact with your data and run different reports without going through the basic report creation process.Drilling down is the action of clicking such a link. The behavior of these links varies depending on the type of field clicked and the report type. In a Group report,drilling down can generate the Detail version of this report, filtering on the field on which you clicked.
Example:In the Call Segment - Group report, clicking on the Answered Segments field link in the answer table runs the Call Segment - Detail report, with a filter ofAnswered Segments = 1.
Drilling down may run a different report type, one that better answers your intended question.
Example:
In the Call Segment - Detail report, clicking on a Call Interaction field link runs the Call Interaction - Detail report, filtered by the Interaction ID on which you clicked.
13.6 Troubleshooting
LiveOps Insight can be used to help diagnose a range of possible issues by finding patterns or highlighting anomalies. Issues related to telephony carriers,misbehaving agents or even prank callers can be identified through data analysis.
The fundamental concepts in any troubleshooting methodology are:
Look for patterns
Confirm with details
Try to limit the number of variables
The specifics of which report type to start with, and which fields to use depends on the problem or issue you are investigating, but we can make somegeneralizations.
Start with a Group ReportGroup reports can quickly highlight anomalous data. For example, you could use the Agent Status - Group report to find agents with exceptionally high pauserates:
Select the Agent Status - Group report type.1.
Select the Paused Count and Calls Offered fields (Show Fields: section).2.
Select the Agent field (Group By: section).3.
Click RUN NOW.4.
Sort the answer table by clicking the Paused Count column label.5.
You may find one or more agents with unusually high pause counts compared to the number of calls offered.
Drill down with a Details ReportTo investigate further, you can drill down into Detail reports. Using the example above, click on the Calls Offered field for a single agent. This will run the the AgentStatus - Details report, filtering by that Agent ID
Use the Call Visualizer and Call Recording ToolsIn addition to statistical and quantitative data, LiveOps Insight provides convenient visualization and audio features that can help resolve issues. For example, the"Call Waiting" feature of some telephone services can cause LiveOps Cloud Contact Center Platform to pause Agents. Listening to the call recording for a suspiciouscall, you may hear the beep tone of such a service. The Call Visualizer displays a graphical view of a complete call interaction. You can use it to see the callexperience for the agent and the caller. It is particularly useful in understanding that experience during transferred calls.
LiveOps Insight Reporting Guide
Copyright © 2012 LiveOps, Inc. All rights reserved. Page 39 of 65

Learn more about Call Recording.
Learn more about the Call Visualizer.
To access Call Recordings and the Call Visualizer, run either the Call Segment - Detail or Call Interaction - Detail report and be sure the Call Recording and CallVisualization fields (Show Fields: section) are checked.
LiveOps Insight Reporting Guide
Copyright © 2012 LiveOps, Inc. All rights reserved. Page 40 of 65
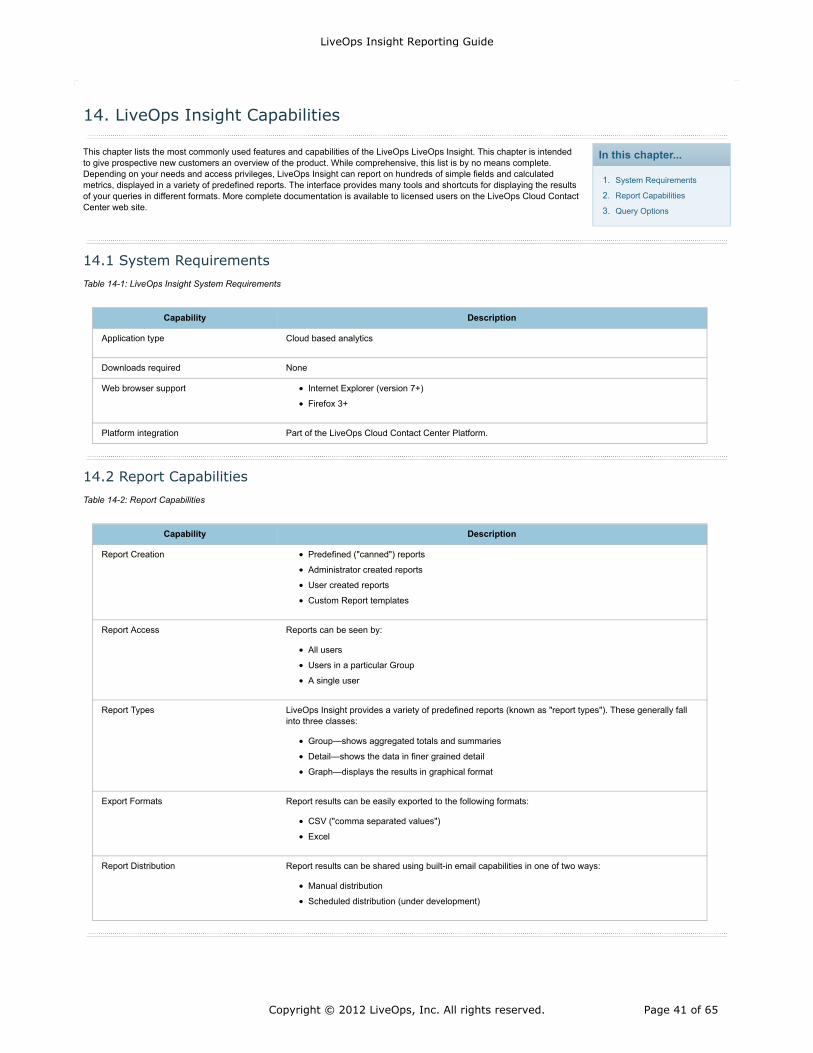
In this chapter...
System Requirements1.
Report Capabilities2.
Query Options3.
14. LiveOps Insight Capabilities
This chapter lists the most commonly used features and capabilities of the LiveOps LiveOps Insight. This chapter is intendedto give prospective new customers an overview of the product. While comprehensive, this list is by no means complete.Depending on your needs and access privileges, LiveOps Insight can report on hundreds of simple fields and calculatedmetrics, displayed in a variety of predefined reports. The interface provides many tools and shortcuts for displaying the resultsof your queries in different formats. More complete documentation is available to licensed users on the LiveOps Cloud ContactCenter web site.
14.1 System Requirements
Table 14-1: LiveOps Insight System Requirements
Capability Description
Application type Cloud based analytics
Downloads required None
Web browser support Internet Explorer (version 7+)
Firefox 3+
Platform integration Part of the LiveOps Cloud Contact Center Platform.
14.2 Report Capabilities
Table 14-2: Report Capabilities
Capability Description
Report Creation Predefined ("canned") reports
Administrator created reports
User created reports
Custom Report templates
Report Access Reports can be seen by:
All users
Users in a particular Group
A single user
Report Types LiveOps Insight provides a variety of predefined reports (known as "report types"). These generally fallinto three classes:
Group—shows aggregated totals and summaries
Detail—shows the data in finer grained detail
Graph—displays the results in graphical format
Export Formats Report results can be easily exported to the following formats:
CSV ("comma separated values")
Excel
Report Distribution Report results can be shared using built-in email capabilities in one of two ways:
Manual distribution
Scheduled distribution (under development)
LiveOps Insight Reporting Guide
Copyright © 2012 LiveOps, Inc. All rights reserved. Page 41 of 65
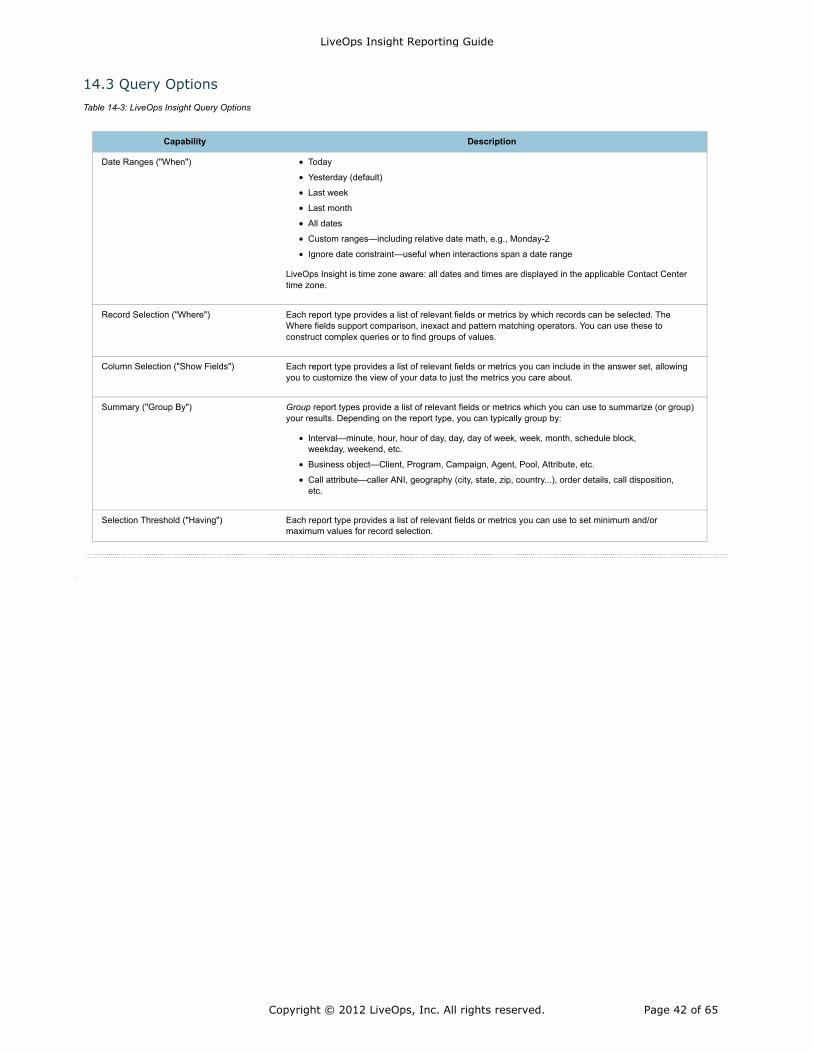
14.3 Query Options
Table 14-3: LiveOps Insight Query Options
Capability Description
Date Ranges ("When") Today
Yesterday (default)
Last week
Last month
All dates
Custom ranges—including relative date math, e.g., Monday-2
Ignore date constraint—useful when interactions span a date range
LiveOps Insight is time zone aware: all dates and times are displayed in the applicable Contact Centertime zone.
Record Selection ("Where") Each report type provides a list of relevant fields or metrics by which records can be selected. TheWhere fields support comparison, inexact and pattern matching operators. You can use these toconstruct complex queries or to find groups of values.
Column Selection ("Show Fields") Each report type provides a list of relevant fields or metrics you can include in the answer set, allowingyou to customize the view of your data to just the metrics you care about.
Summary ("Group By") Group report types provide a list of relevant fields or metrics which you can use to summarize (or group)your results. Depending on the report type, you can typically group by:
Interval—minute, hour, hour of day, day, day of week, week, month, schedule block,weekday, weekend, etc.
Business object—Client, Program, Campaign, Agent, Pool, Attribute, etc.
Call attribute—caller ANI, geography (city, state, zip, country...), order details, call disposition,etc.
Selection Threshold ("Having") Each report type provides a list of relevant fields or metrics you can use to set minimum and/ormaximum values for record selection.
LiveOps Insight Reporting Guide
Copyright © 2012 LiveOps, Inc. All rights reserved. Page 42 of 65
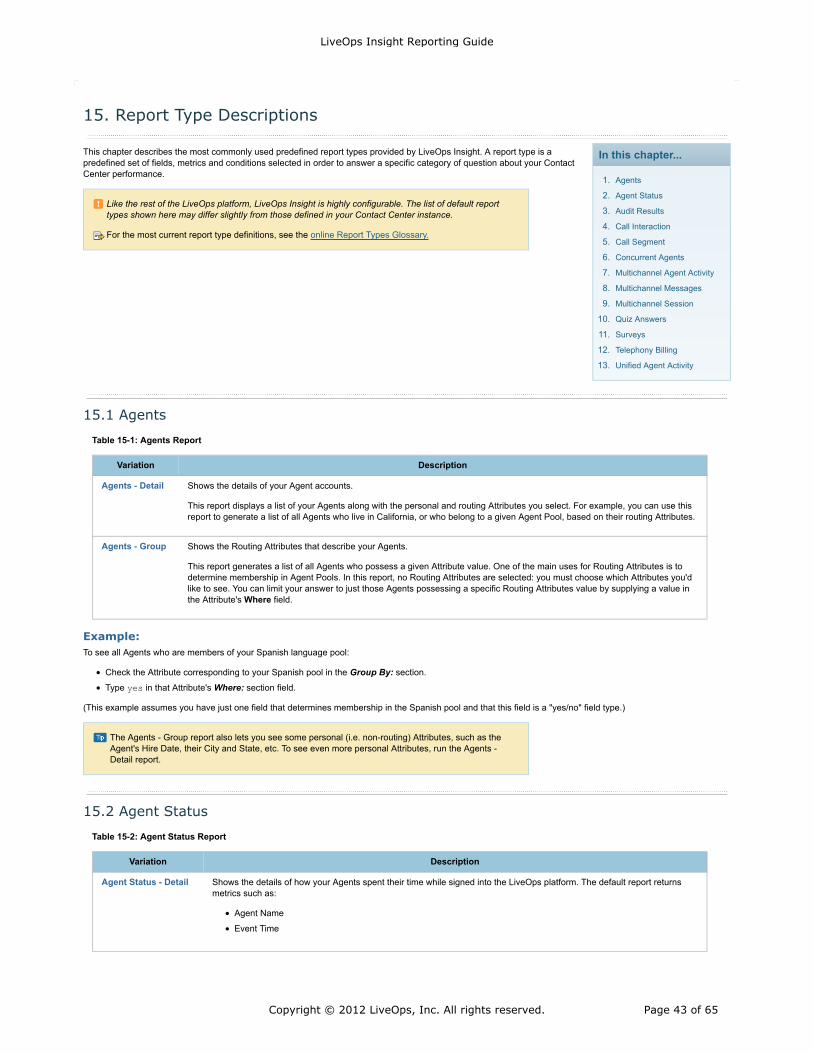
In this chapter...
Agents1.
Agent Status2.
Audit Results3.
Call Interaction4.
Call Segment5.
Concurrent Agents6.
Multichannel Agent Activity7.
Multichannel Messages8.
Multichannel Session9.
Quiz Answers10.
Surveys11.
Telephony Billing12.
Unified Agent Activity13.
Like the rest of the LiveOps platform, LiveOps Insight is highly configurable. The list of default reporttypes shown here may differ slightly from those defined in your Contact Center instance.
For the most current report type definitions, see the online Report Types Glossary.
The Agents - Group report also lets you see some personal (i.e. non-routing) Attributes, such as theAgent's Hire Date, their City and State, etc. To see even more personal Attributes, run the Agents -Detail report.
15. Report Type Descriptions
This chapter describes the most commonly used predefined report types provided by LiveOps Insight. A report type is apredefined set of fields, metrics and conditions selected in order to answer a specific category of question about your ContactCenter performance.
15.1 Agents
Table 15-1: Agents Report
Variation Description
Agents - Detail Shows the details of your Agent accounts.
This report displays a list of your Agents along with the personal and routing Attributes you select. For example, you can use thisreport to generate a list of all Agents who live in California, or who belong to a given Agent Pool, based on their routing Attributes.
Agents - Group Shows the Routing Attributes that describe your Agents.
This report generates a list of all Agents who possess a given Attribute value. One of the main uses for Routing Attributes is todetermine membership in Agent Pools. In this report, no Routing Attributes are selected: you must choose which Attributes you'dlike to see. You can limit your answer to just those Agents possessing a specific Routing Attributes value by supplying a value inthe Attribute's Where field.
Example:To see all Agents who are members of your Spanish language pool:
Check the Attribute corresponding to your Spanish pool in the Group By: section.
Type yes in that Attribute's Where: section field.
(This example assumes you have just one field that determines membership in the Spanish pool and that this field is a "yes/no" field type.)
15.2 Agent Status
Table 15-2: Agent Status Report
Variation Description
Agent Status - Detail Shows the details of how your Agents spent their time while signed into the LiveOps platform. The default report returnsmetrics such as:
Agent Name
Event Time
LiveOps Insight Reporting Guide
Copyright © 2012 LiveOps, Inc. All rights reserved. Page 43 of 65
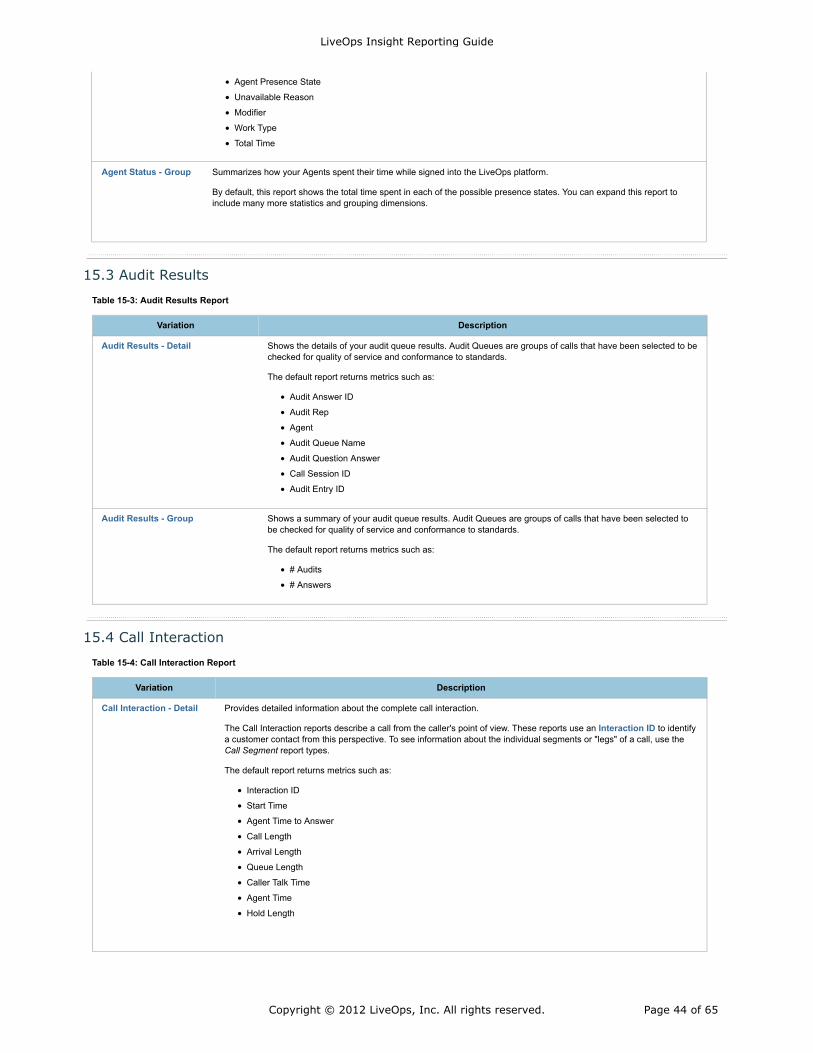
Agent Presence State
Unavailable Reason
Modifier
Work Type
Total Time
Agent Status - Group Summarizes how your Agents spent their time while signed into the LiveOps platform.
By default, this report shows the total time spent in each of the possible presence states. You can expand this report toinclude many more statistics and grouping dimensions.
15.3 Audit Results
Table 15-3: Audit Results Report
Variation Description
Audit Results - Detail Shows the details of your audit queue results. Audit Queues are groups of calls that have been selected to bechecked for quality of service and conformance to standards.
The default report returns metrics such as:
Audit Answer ID
Audit Rep
Agent
Audit Queue Name
Audit Question Answer
Call Session ID
Audit Entry ID
Audit Results - Group Shows a summary of your audit queue results. Audit Queues are groups of calls that have been selected tobe checked for quality of service and conformance to standards.
The default report returns metrics such as:
# Audits
# Answers
15.4 Call Interaction
Table 15-4: Call Interaction Report
Variation Description
Call Interaction - Detail Provides detailed information about the complete call interaction.
The Call Interaction reports describe a call from the caller's point of view. These reports use an Interaction ID to identifya customer contact from this perspective. To see information about the individual segments or "legs" of a call, use theCall Segment report types.
The default report returns metrics such as:
Interaction ID
Start Time
Agent Time to Answer
Call Length
Arrival Length
Queue Length
Caller Talk Time
Agent Time
Hold Length
LiveOps Insight Reporting Guide
Copyright © 2012 LiveOps, Inc. All rights reserved. Page 44 of 65
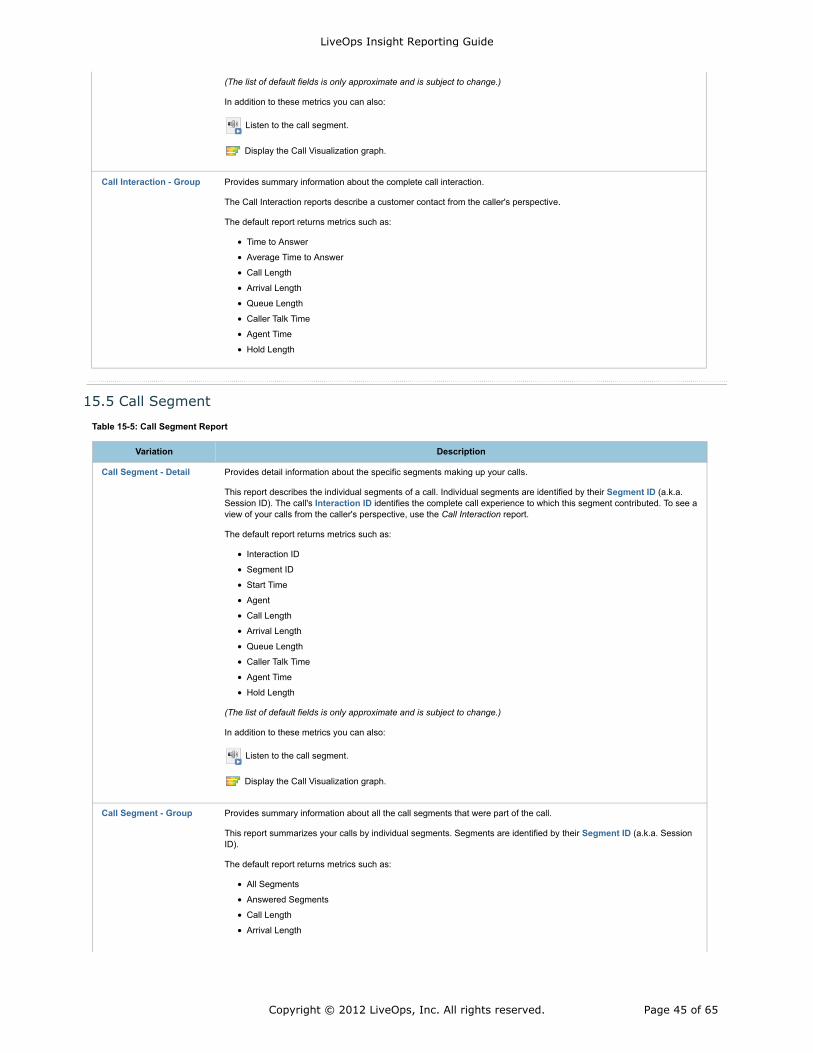
(The list of default fields is only approximate and is subject to change.)
In addition to these metrics you can also:
Listen to the call segment.
Display the Call Visualization graph.
Call Interaction - Group Provides summary information about the complete call interaction.
The Call Interaction reports describe a customer contact from the caller's perspective.
The default report returns metrics such as:
Time to Answer
Average Time to Answer
Call Length
Arrival Length
Queue Length
Caller Talk Time
Agent Time
Hold Length
15.5 Call Segment
Table 15-5: Call Segment Report
Variation Description
Call Segment - Detail Provides detail information about the specific segments making up your calls.
This report describes the individual segments of a call. Individual segments are identified by their Segment ID (a.k.a.Session ID). The call's Interaction ID identifies the complete call experience to which this segment contributed. To see aview of your calls from the caller's perspective, use the Call Interaction report.
The default report returns metrics such as:
Interaction ID
Segment ID
Start Time
Agent
Call Length
Arrival Length
Queue Length
Caller Talk Time
Agent Time
Hold Length
(The list of default fields is only approximate and is subject to change.)
In addition to these metrics you can also:
Listen to the call segment.
Display the Call Visualization graph.
Call Segment - Group Provides summary information about all the call segments that were part of the call.
This report summarizes your calls by individual segments. Segments are identified by their Segment ID (a.k.a. SessionID).
The default report returns metrics such as:
All Segments
Answered Segments
Call Length
Arrival Length
LiveOps Insight Reporting Guide
Copyright © 2012 LiveOps, Inc. All rights reserved. Page 45 of 65
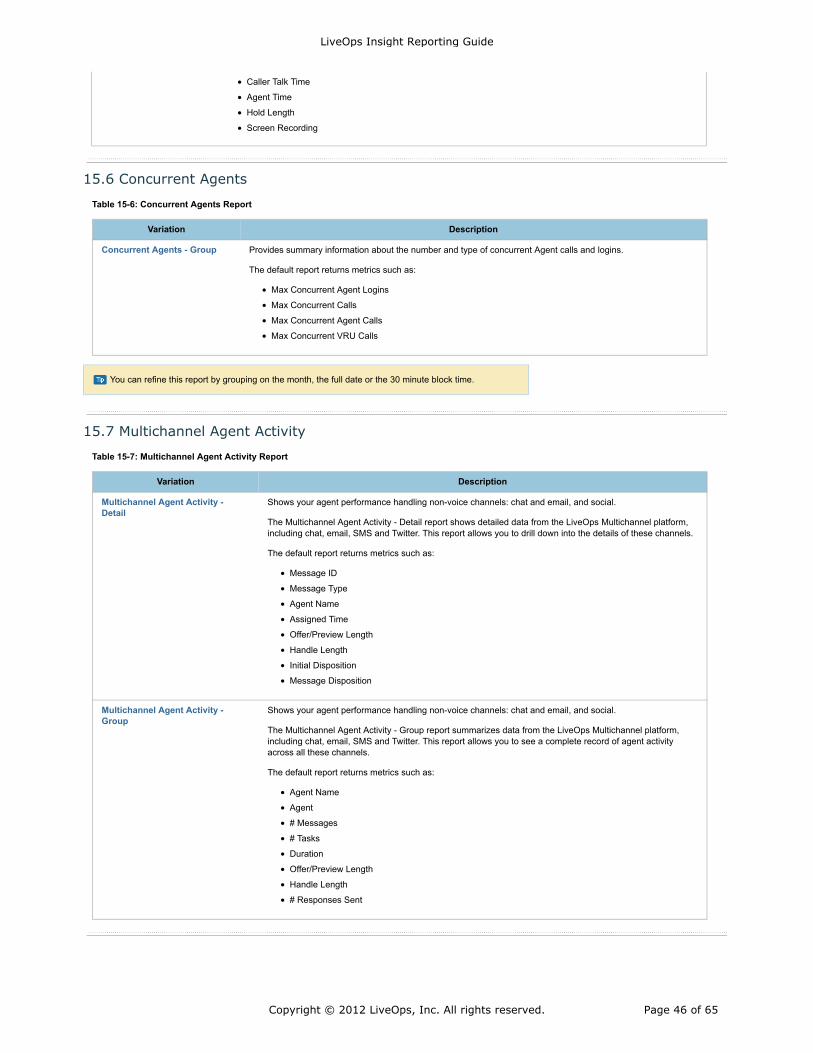
You can refine this report by grouping on the month, the full date or the 30 minute block time.
Caller Talk Time
Agent Time
Hold Length
Screen Recording
15.6 Concurrent Agents
Table 15-6: Concurrent Agents Report
Variation Description
Concurrent Agents - Group Provides summary information about the number and type of concurrent Agent calls and logins.
The default report returns metrics such as:
Max Concurrent Agent Logins
Max Concurrent Calls
Max Concurrent Agent Calls
Max Concurrent VRU Calls
15.7 Multichannel Agent Activity
Table 15-7: Multichannel Agent Activity Report
Variation Description
Multichannel Agent Activity -Detail
Shows your agent performance handling non-voice channels: chat and email, and social.
The Multichannel Agent Activity - Detail report shows detailed data from the LiveOps Multichannel platform,including chat, email, SMS and Twitter. This report allows you to drill down into the details of these channels.
The default report returns metrics such as:
Message ID
Message Type
Agent Name
Assigned Time
Offer/Preview Length
Handle Length
Initial Disposition
Message Disposition
Multichannel Agent Activity -Group
Shows your agent performance handling non-voice channels: chat and email, and social.
The Multichannel Agent Activity - Group report summarizes data from the LiveOps Multichannel platform,including chat, email, SMS and Twitter. This report allows you to see a complete record of agent activityacross all these channels.
The default report returns metrics such as:
Agent Name
Agent
# Messages
# Tasks
Duration
Offer/Preview Length
Handle Length
# Responses Sent
LiveOps Insight Reporting Guide
Copyright © 2012 LiveOps, Inc. All rights reserved. Page 46 of 65
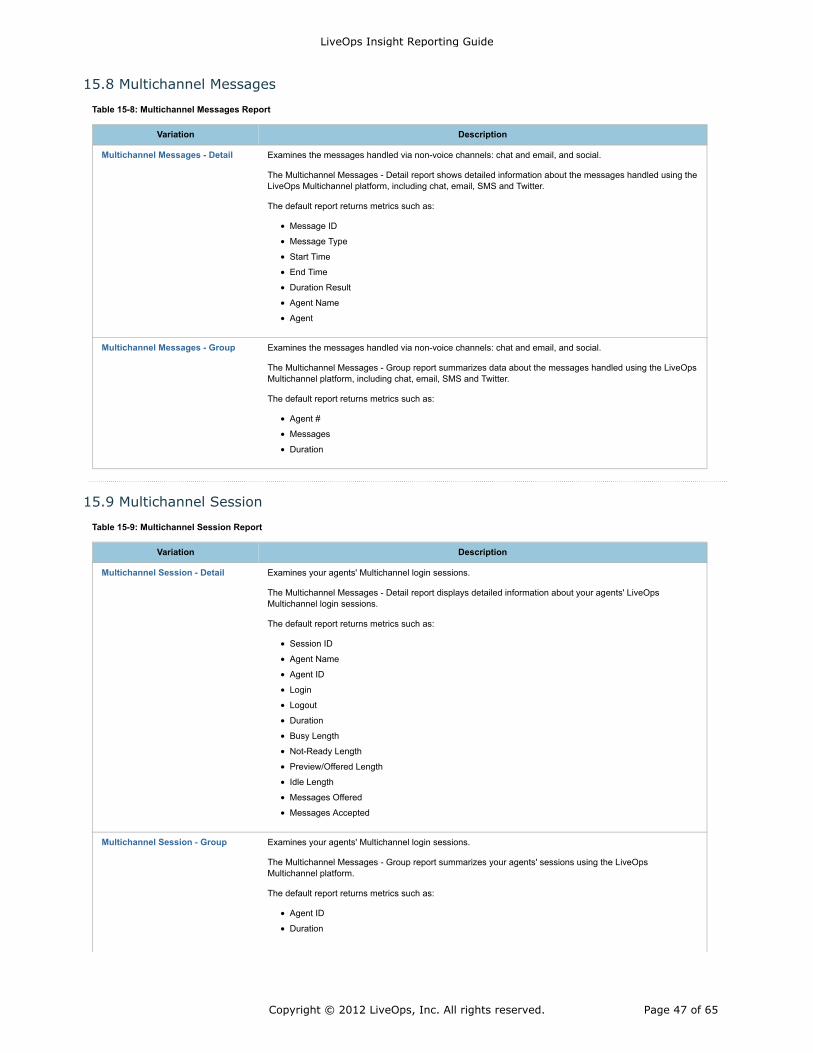
15.8 Multichannel Messages
Table 15-8: Multichannel Messages Report
Variation Description
Multichannel Messages - Detail Examines the messages handled via non-voice channels: chat and email, and social.
The Multichannel Messages - Detail report shows detailed information about the messages handled using theLiveOps Multichannel platform, including chat, email, SMS and Twitter.
The default report returns metrics such as:
Message ID
Message Type
Start Time
End Time
Duration Result
Agent Name
Agent
Multichannel Messages - Group Examines the messages handled via non-voice channels: chat and email, and social.
The Multichannel Messages - Group report summarizes data about the messages handled using the LiveOpsMultichannel platform, including chat, email, SMS and Twitter.
The default report returns metrics such as:
Agent #
Messages
Duration
15.9 Multichannel Session
Table 15-9: Multichannel Session Report
Variation Description
Multichannel Session - Detail Examines your agents' Multichannel login sessions.
The Multichannel Messages - Detail report displays detailed information about your agents' LiveOpsMultichannel login sessions.
The default report returns metrics such as:
Session ID
Agent Name
Agent ID
Login
Logout
Duration
Busy Length
Not-Ready Length
Preview/Offered Length
Idle Length
Messages Offered
Messages Accepted
Multichannel Session - Group Examines your agents' Multichannel login sessions.
The Multichannel Messages - Group report summarizes your agents' sessions using the LiveOpsMultichannel platform.
The default report returns metrics such as:
Agent ID
Duration
LiveOps Insight Reporting Guide
Copyright © 2012 LiveOps, Inc. All rights reserved. Page 47 of 65
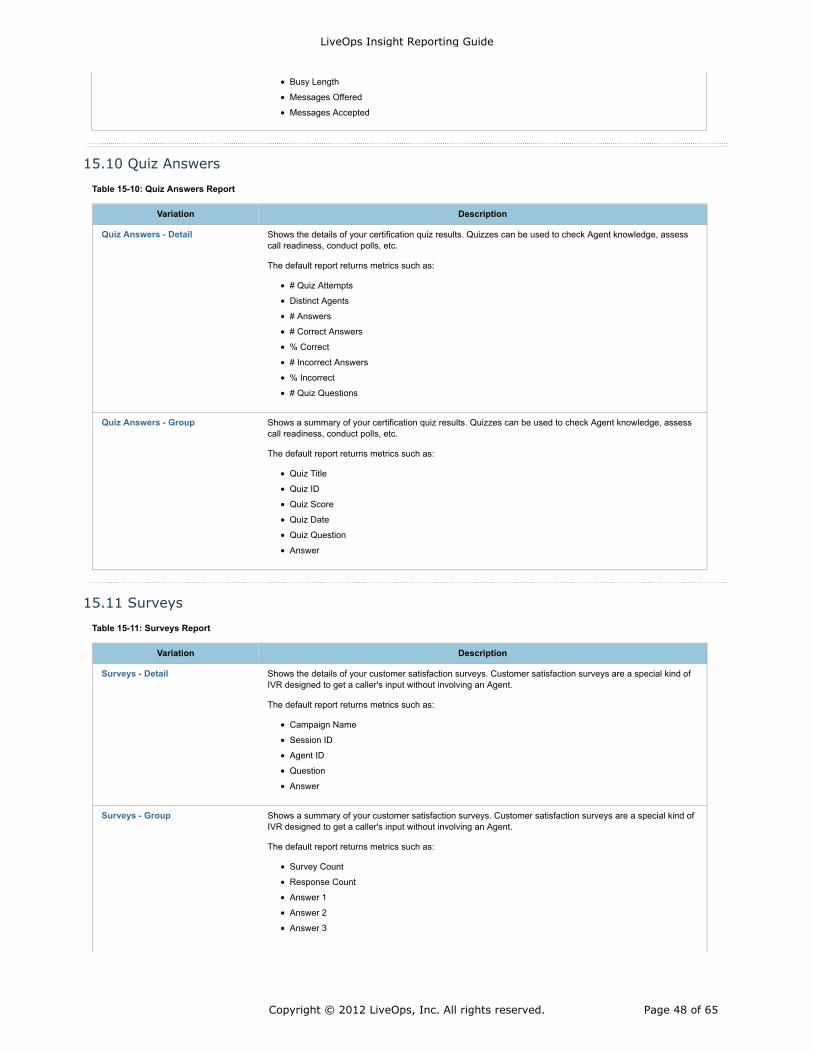
Busy Length
Messages Offered
Messages Accepted
15.10 Quiz Answers
Table 15-10: Quiz Answers Report
Variation Description
Quiz Answers - Detail Shows the details of your certification quiz results. Quizzes can be used to check Agent knowledge, assesscall readiness, conduct polls, etc.
The default report returns metrics such as:
# Quiz Attempts
Distinct Agents
# Answers
# Correct Answers
% Correct
# Incorrect Answers
% Incorrect
# Quiz Questions
Quiz Answers - Group Shows a summary of your certification quiz results. Quizzes can be used to check Agent knowledge, assesscall readiness, conduct polls, etc.
The default report returns metrics such as:
Quiz Title
Quiz ID
Quiz Score
Quiz Date
Quiz Question
Answer
15.11 Surveys
Table 15-11: Surveys Report
Variation Description
Surveys - Detail Shows the details of your customer satisfaction surveys. Customer satisfaction surveys are a special kind ofIVR designed to get a caller's input without involving an Agent.
The default report returns metrics such as:
Campaign Name
Session ID
Agent ID
Question
Answer
Surveys - Group Shows a summary of your customer satisfaction surveys. Customer satisfaction surveys are a special kind ofIVR designed to get a caller's input without involving an Agent.
The default report returns metrics such as:
Survey Count
Response Count
Answer 1
Answer 2
Answer 3
LiveOps Insight Reporting Guide
Copyright © 2012 LiveOps, Inc. All rights reserved. Page 48 of 65
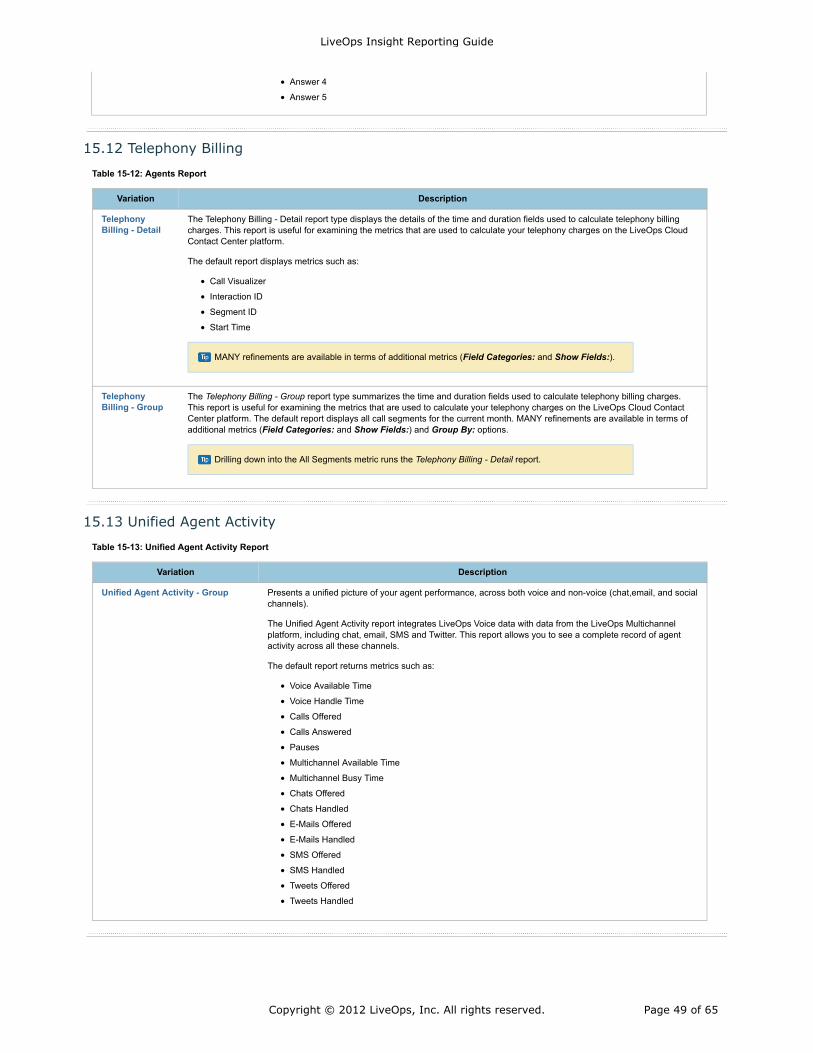
MANY refinements are available in terms of additional metrics (Field Categories: and Show Fields:).
Drilling down into the All Segments metric runs the Telephony Billing - Detail report.
Answer 4
Answer 5
15.12 Telephony Billing
Table 15-12: Agents Report
Variation Description
TelephonyBilling - Detail
The Telephony Billing - Detail report type displays the details of the time and duration fields used to calculate telephony billingcharges. This report is useful for examining the metrics that are used to calculate your telephony charges on the LiveOps CloudContact Center platform.
The default report displays metrics such as:
Call Visualizer
Interaction ID
Segment ID
Start Time
TelephonyBilling - Group
The Telephony Billing - Group report type summarizes the time and duration fields used to calculate telephony billing charges.This report is useful for examining the metrics that are used to calculate your telephony charges on the LiveOps Cloud ContactCenter platform. The default report displays all call segments for the current month. MANY refinements are available in terms ofadditional metrics (Field Categories: and Show Fields:) and Group By: options.
15.13 Unified Agent Activity
Table 15-13: Unified Agent Activity Report
Variation Description
Unified Agent Activity - Group Presents a unified picture of your agent performance, across both voice and non-voice (chat,email, and socialchannels).
The Unified Agent Activity report integrates LiveOps Voice data with data from the LiveOps Multichannelplatform, including chat, email, SMS and Twitter. This report allows you to see a complete record of agentactivity across all these channels.
The default report returns metrics such as:
Voice Available Time
Voice Handle Time
Calls Offered
Calls Answered
Pauses
Multichannel Available Time
Multichannel Busy Time
Chats Offered
Chats Handled
E-Mails Offered
E-Mails Handled
SMS Offered
SMS Handled
Tweets Offered
Tweets Handled
LiveOps Insight Reporting Guide
Copyright © 2012 LiveOps, Inc. All rights reserved. Page 49 of 65
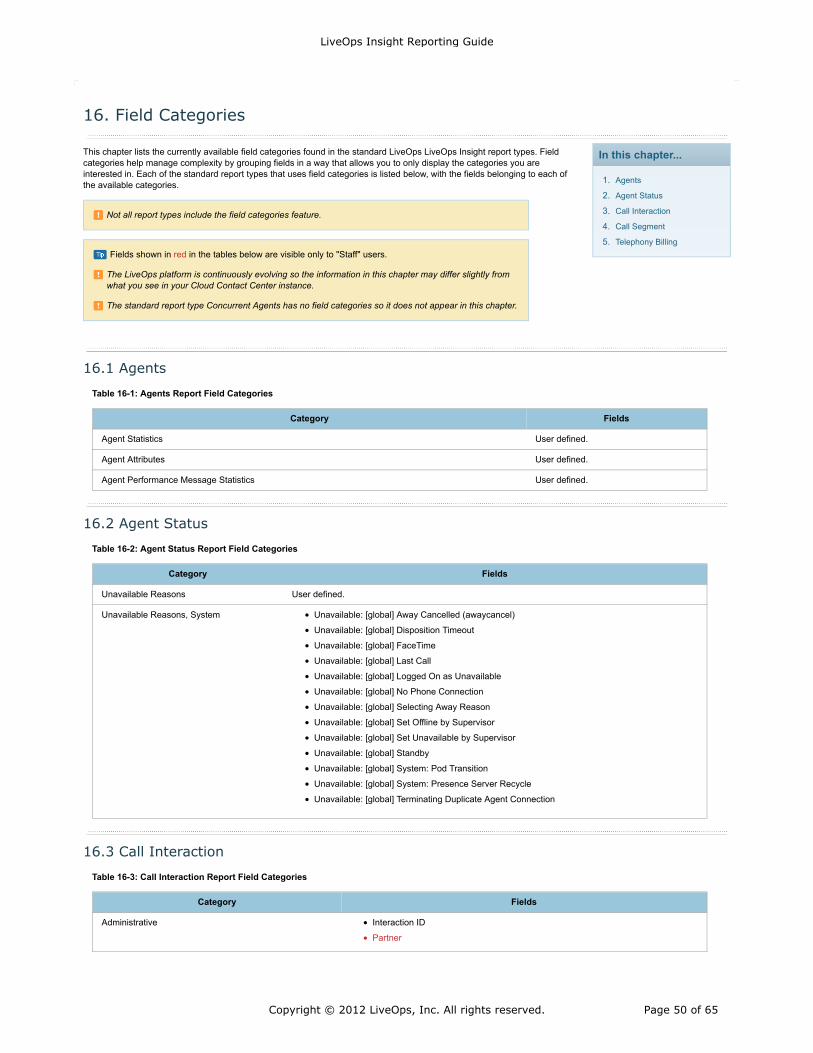
In this chapter...
Agents1.
Agent Status2.
Call Interaction3.
Call Segment4.
Telephony Billing5.
Not all report types include the field categories feature.
Fields shown in red in the tables below are visible only to "Staff" users.
The LiveOps platform is continuously evolving so the information in this chapter may differ slightly fromwhat you see in your Cloud Contact Center instance.
The standard report type Concurrent Agents has no field categories so it does not appear in this chapter.
16. Field Categories
This chapter lists the currently available field categories found in the standard LiveOps LiveOps Insight report types. Fieldcategories help manage complexity by grouping fields in a way that allows you to only display the categories you areinterested in. Each of the standard report types that uses field categories is listed below, with the fields belonging to each ofthe available categories.
16.1 Agents
Table 16-1: Agents Report Field Categories
Category Fields
Agent Statistics User defined.
Agent Attributes User defined.
Agent Performance Message Statistics User defined.
16.2 Agent Status
Table 16-2: Agent Status Report Field Categories
Category Fields
Unavailable Reasons User defined.
Unavailable Reasons, System Unavailable: [global] Away Cancelled (awaycancel)
Unavailable: [global] Disposition Timeout
Unavailable: [global] FaceTime
Unavailable: [global] Last Call
Unavailable: [global] Logged On as Unavailable
Unavailable: [global] No Phone Connection
Unavailable: [global] Selecting Away Reason
Unavailable: [global] Set Offline by Supervisor
Unavailable: [global] Set Unavailable by Supervisor
Unavailable: [global] Standby
Unavailable: [global] System: Pod Transition
Unavailable: [global] System: Presence Server Recycle
Unavailable: [global] Terminating Duplicate Agent Connection
16.3 Call Interaction
Table 16-3: Call Interaction Report Field Categories
Category Fields
Administrative Interaction ID
Partner
LiveOps Insight Reporting Guide
Copyright © 2012 LiveOps, Inc. All rights reserved. Page 50 of 65
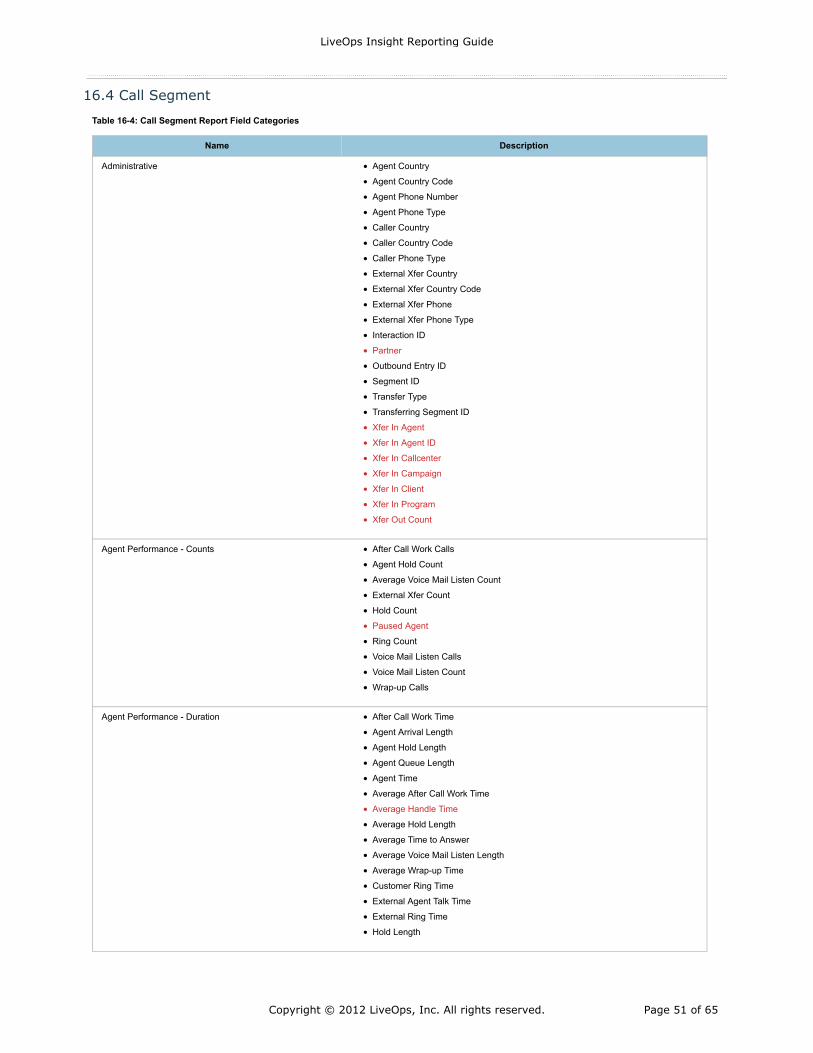
16.4 Call Segment
Table 16-4: Call Segment Report Field Categories
Name Description
Administrative Agent Country
Agent Country Code
Agent Phone Number
Agent Phone Type
Caller Country
Caller Country Code
Caller Phone Type
External Xfer Country
External Xfer Country Code
External Xfer Phone
External Xfer Phone Type
Interaction ID
Partner
Outbound Entry ID
Segment ID
Transfer Type
Transferring Segment ID
Xfer In Agent
Xfer In Agent ID
Xfer In Callcenter
Xfer In Campaign
Xfer In Client
Xfer In Program
Xfer Out Count
Agent Performance - Counts After Call Work Calls
Agent Hold Count
Average Voice Mail Listen Count
External Xfer Count
Hold Count
Paused Agent
Ring Count
Voice Mail Listen Calls
Voice Mail Listen Count
Wrap-up Calls
Agent Performance - Duration After Call Work Time
Agent Arrival Length
Agent Hold Length
Agent Queue Length
Agent Time
Average After Call Work Time
Average Handle Time
Average Hold Length
Average Time to Answer
Average Voice Mail Listen Length
Average Wrap-up Time
Customer Ring Time
External Agent Talk Time
External Ring Time
Hold Length
LiveOps Insight Reporting Guide
Copyright © 2012 LiveOps, Inc. All rights reserved. Page 51 of 65
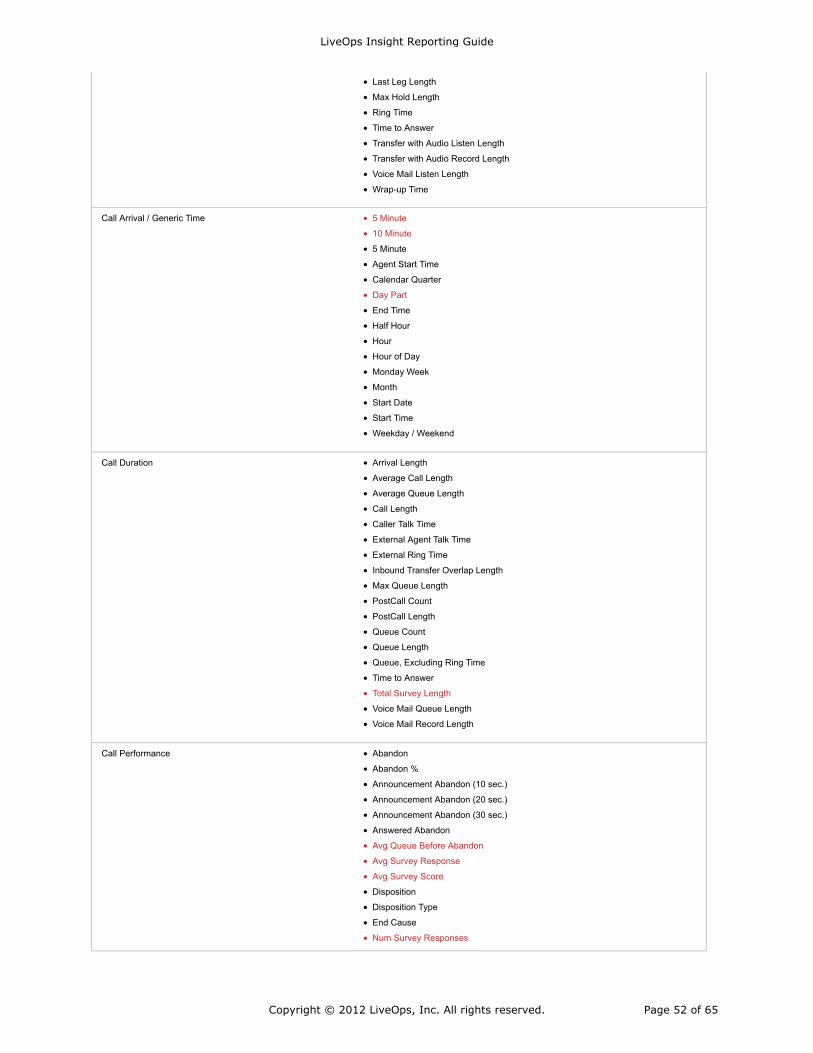
Last Leg Length
Max Hold Length
Ring Time
Time to Answer
Transfer with Audio Listen Length
Transfer with Audio Record Length
Voice Mail Listen Length
Wrap-up Time
Call Arrival / Generic Time 5 Minute
10 Minute
5 Minute
Agent Start Time
Calendar Quarter
Day Part
End Time
Half Hour
Hour
Hour of Day
Monday Week
Month
Start Date
Start Time
Weekday / Weekend
Call Duration Arrival Length
Average Call Length
Average Queue Length
Call Length
Caller Talk Time
External Agent Talk Time
External Ring Time
Inbound Transfer Overlap Length
Max Queue Length
PostCall Count
PostCall Length
Queue Count
Queue Length
Queue, Excluding Ring Time
Time to Answer
Total Survey Length
Voice Mail Queue Length
Voice Mail Record Length
Call Performance Abandon
Abandon %
Announcement Abandon (10 sec.)
Announcement Abandon (20 sec.)
Announcement Abandon (30 sec.)
Answered Abandon
Avg Queue Before Abandon
Avg Survey Response
Avg Survey Score
Disposition
Disposition Type
End Cause
Num Survey Responses
LiveOps Insight Reporting Guide
Copyright © 2012 LiveOps, Inc. All rights reserved. Page 52 of 65
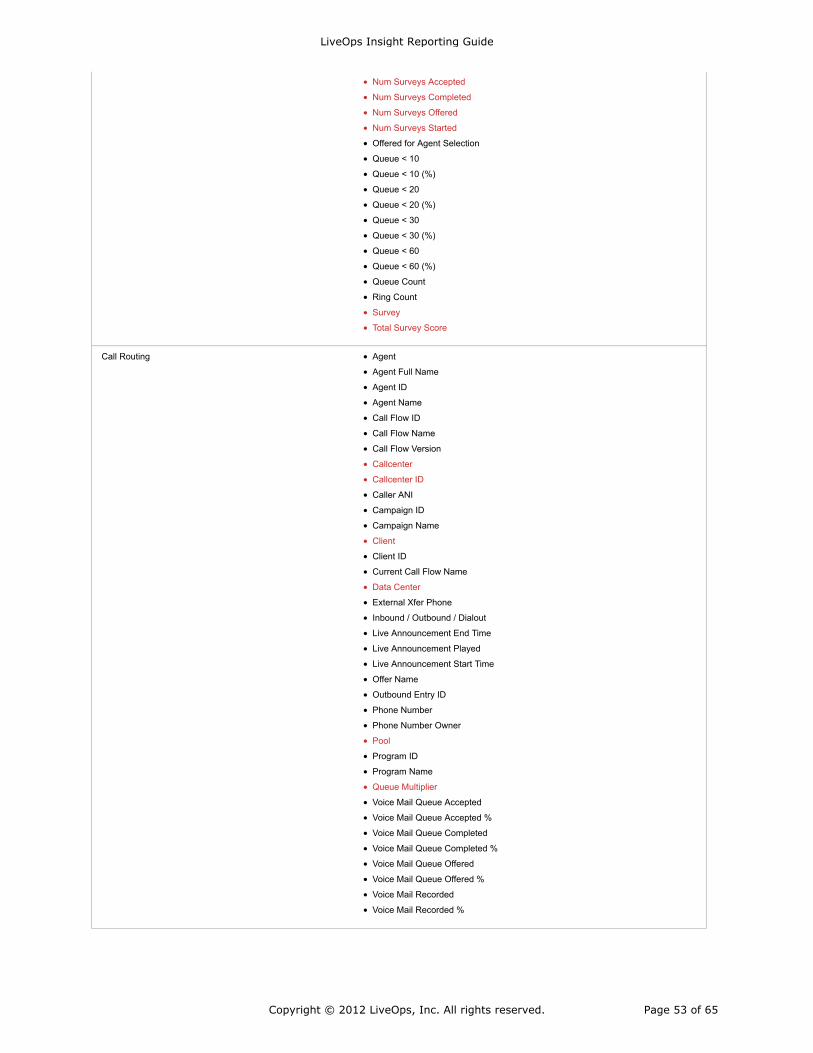
Num Surveys Accepted
Num Surveys Completed
Num Surveys Offered
Num Surveys Started
Offered for Agent Selection
Queue < 10
Queue < 10 (%)
Queue < 20
Queue < 20 (%)
Queue < 30
Queue < 30 (%)
Queue < 60
Queue < 60 (%)
Queue Count
Ring Count
Survey
Total Survey Score
Call Routing Agent
Agent Full Name
Agent ID
Agent Name
Call Flow ID
Call Flow Name
Call Flow Version
Callcenter
Callcenter ID
Caller ANI
Campaign ID
Campaign Name
Client
Client ID
Current Call Flow Name
Data Center
External Xfer Phone
Inbound / Outbound / Dialout
Live Announcement End Time
Live Announcement Played
Live Announcement Start Time
Offer Name
Outbound Entry ID
Phone Number
Phone Number Owner
Pool
Program ID
Program Name
Queue Multiplier
Voice Mail Queue Accepted
Voice Mail Queue Accepted %
Voice Mail Queue Completed
Voice Mail Queue Completed %
Voice Mail Queue Offered
Voice Mail Queue Offered %
Voice Mail Recorded
Voice Mail Recorded %
LiveOps Insight Reporting Guide
Copyright © 2012 LiveOps, Inc. All rights reserved. Page 53 of 65
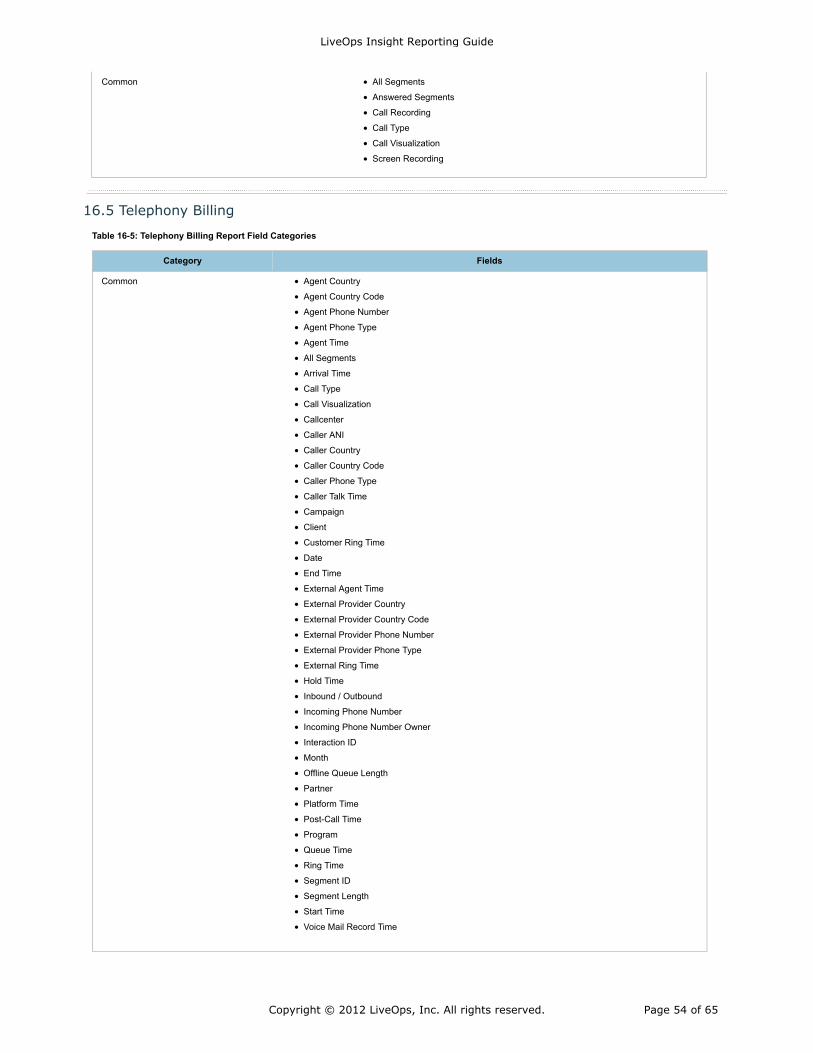
Common All Segments
Answered Segments
Call Recording
Call Type
Call Visualization
Screen Recording
16.5 Telephony Billing
Table 16-5: Telephony Billing Report Field Categories
Category Fields
Common Agent Country
Agent Country Code
Agent Phone Number
Agent Phone Type
Agent Time
All Segments
Arrival Time
Call Type
Call Visualization
Callcenter
Caller ANI
Caller Country
Caller Country Code
Caller Phone Type
Caller Talk Time
Campaign
Client
Customer Ring Time
Date
End Time
External Agent Time
External Provider Country
External Provider Country Code
External Provider Phone Number
External Provider Phone Type
External Ring Time
Hold Time
Inbound / Outbound
Incoming Phone Number
Incoming Phone Number Owner
Interaction ID
Month
Offline Queue Length
Partner
Platform Time
Post-Call Time
Program
Queue Time
Ring Time
Segment ID
Segment Length
Start Time
Voice Mail Record Time
LiveOps Insight Reporting Guide
Copyright © 2012 LiveOps, Inc. All rights reserved. Page 54 of 65
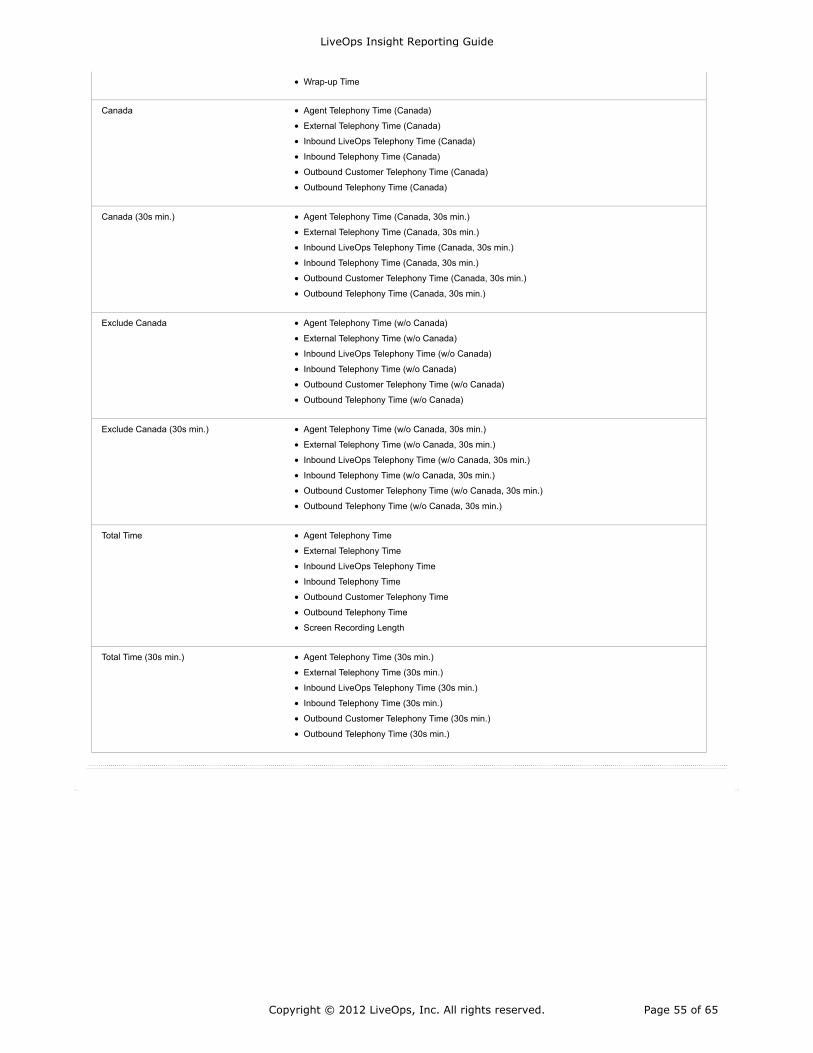
Wrap-up Time
Canada Agent Telephony Time (Canada)
External Telephony Time (Canada)
Inbound LiveOps Telephony Time (Canada)
Inbound Telephony Time (Canada)
Outbound Customer Telephony Time (Canada)
Outbound Telephony Time (Canada)
Canada (30s min.) Agent Telephony Time (Canada, 30s min.)
External Telephony Time (Canada, 30s min.)
Inbound LiveOps Telephony Time (Canada, 30s min.)
Inbound Telephony Time (Canada, 30s min.)
Outbound Customer Telephony Time (Canada, 30s min.)
Outbound Telephony Time (Canada, 30s min.)
Exclude Canada Agent Telephony Time (w/o Canada)
External Telephony Time (w/o Canada)
Inbound LiveOps Telephony Time (w/o Canada)
Inbound Telephony Time (w/o Canada)
Outbound Customer Telephony Time (w/o Canada)
Outbound Telephony Time (w/o Canada)
Exclude Canada (30s min.) Agent Telephony Time (w/o Canada, 30s min.)
External Telephony Time (w/o Canada, 30s min.)
Inbound LiveOps Telephony Time (w/o Canada, 30s min.)
Inbound Telephony Time (w/o Canada, 30s min.)
Outbound Customer Telephony Time (w/o Canada, 30s min.)
Outbound Telephony Time (w/o Canada, 30s min.)
Total Time Agent Telephony Time
External Telephony Time
Inbound LiveOps Telephony Time
Inbound Telephony Time
Outbound Customer Telephony Time
Outbound Telephony Time
Screen Recording Length
Total Time (30s min.) Agent Telephony Time (30s min.)
External Telephony Time (30s min.)
Inbound LiveOps Telephony Time (30s min.)
Inbound Telephony Time (30s min.)
Outbound Customer Telephony Time (30s min.)
Outbound Telephony Time (30s min.)
LiveOps Insight Reporting Guide
Copyright © 2012 LiveOps, Inc. All rights reserved. Page 55 of 65
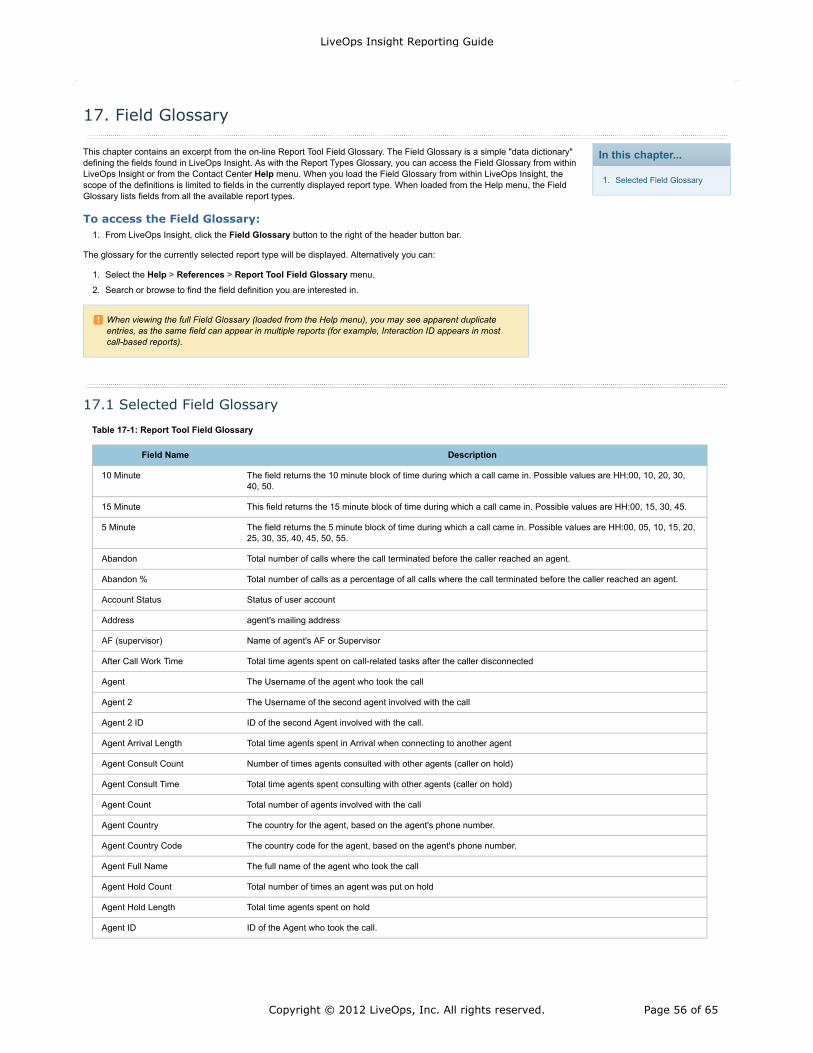
In this chapter...
Selected Field Glossary1.
When viewing the full Field Glossary (loaded from the Help menu), you may see apparent duplicateentries, as the same field can appear in multiple reports (for example, Interaction ID appears in mostcall-based reports).
17. Field Glossary
This chapter contains an excerpt from the on-line Report Tool Field Glossary. The Field Glossary is a simple "data dictionary"defining the fields found in LiveOps Insight. As with the Report Types Glossary, you can access the Field Glossary from withinLiveOps Insight or from the Contact Center Help menu. When you load the Field Glossary from within LiveOps Insight, thescope of the definitions is limited to fields in the currently displayed report type. When loaded from the Help menu, the FieldGlossary lists fields from all the available report types.
To access the Field Glossary:From LiveOps Insight, click the Field Glossary button to the right of the header button bar.1.
The glossary for the currently selected report type will be displayed. Alternatively you can:
Select the Help > References > Report Tool Field Glossary menu.1.
Search or browse to find the field definition you are interested in.2.
17.1 Selected Field Glossary
Table 17-1: Report Tool Field Glossary
Field Name Description
10 Minute The field returns the 10 minute block of time during which a call came in. Possible values are HH:00, 10, 20, 30,40, 50.
15 Minute This field returns the 15 minute block of time during which a call came in. Possible values are HH:00, 15, 30, 45.
5 Minute The field returns the 5 minute block of time during which a call came in. Possible values are HH:00, 05, 10, 15, 20,25, 30, 35, 40, 45, 50, 55.
Abandon Total number of calls where the call terminated before the caller reached an agent.
Abandon % Total number of calls as a percentage of all calls where the call terminated before the caller reached an agent.
Account Status Status of user account
Address agent's mailing address
AF (supervisor) Name of agent's AF or Supervisor
After Call Work Time Total time agents spent on call-related tasks after the caller disconnected
Agent The Username of the agent who took the call
Agent 2 The Username of the second agent involved with the call
Agent 2 ID ID of the second Agent involved with the call.
Agent Arrival Length Total time agents spent in Arrival when connecting to another agent
Agent Consult Count Number of times agents consulted with other agents (caller on hold)
Agent Consult Time Total time agents spent consulting with other agents (caller on hold)
Agent Count Total number of agents involved with the call
Agent Country The country for the agent, based on the agent's phone number.
Agent Country Code The country code for the agent, based on the agent's phone number.
Agent Full Name The full name of the agent who took the call
Agent Hold Count Total number of times an agent was put on hold
Agent Hold Length Total time agents spent on hold
Agent ID ID of the Agent who took the call.
LiveOps Insight Reporting Guide
Copyright © 2012 LiveOps, Inc. All rights reserved. Page 56 of 65
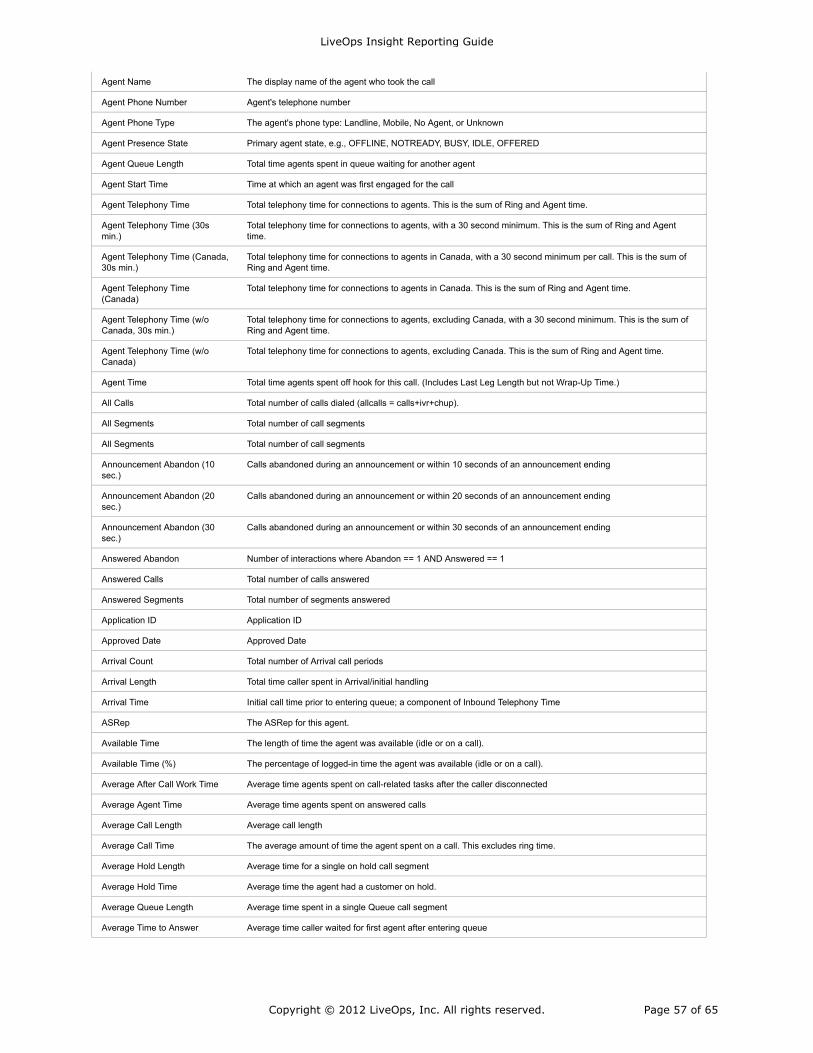
Agent Name The display name of the agent who took the call
Agent Phone Number Agent's telephone number
Agent Phone Type The agent's phone type: Landline, Mobile, No Agent, or Unknown
Agent Presence State Primary agent state, e.g., OFFLINE, NOTREADY, BUSY, IDLE, OFFERED
Agent Queue Length Total time agents spent in queue waiting for another agent
Agent Start Time Time at which an agent was first engaged for the call
Agent Telephony Time Total telephony time for connections to agents. This is the sum of Ring and Agent time.
Agent Telephony Time (30smin.)
Total telephony time for connections to agents, with a 30 second minimum. This is the sum of Ring and Agenttime.
Agent Telephony Time (Canada,30s min.)
Total telephony time for connections to agents in Canada, with a 30 second minimum per call. This is the sum ofRing and Agent time.
Agent Telephony Time(Canada)
Total telephony time for connections to agents in Canada. This is the sum of Ring and Agent time.
Agent Telephony Time (w/oCanada, 30s min.)
Total telephony time for connections to agents, excluding Canada, with a 30 second minimum. This is the sum ofRing and Agent time.
Agent Telephony Time (w/oCanada)
Total telephony time for connections to agents, excluding Canada. This is the sum of Ring and Agent time.
Agent Time Total time agents spent off hook for this call. (Includes Last Leg Length but not Wrap-Up Time.)
All Calls Total number of calls dialed (allcalls = calls+ivr+chup).
All Segments Total number of call segments
All Segments Total number of call segments
Announcement Abandon (10sec.)
Calls abandoned during an announcement or within 10 seconds of an announcement ending
Announcement Abandon (20sec.)
Calls abandoned during an announcement or within 20 seconds of an announcement ending
Announcement Abandon (30sec.)
Calls abandoned during an announcement or within 30 seconds of an announcement ending
Answered Abandon Number of interactions where Abandon == 1 AND Answered == 1
Answered Calls Total number of calls answered
Answered Segments Total number of segments answered
Application ID Application ID
Approved Date Approved Date
Arrival Count Total number of Arrival call periods
Arrival Length Total time caller spent in Arrival/initial handling
Arrival Time Initial call time prior to entering queue; a component of Inbound Telephony Time
ASRep The ASRep for this agent.
Available Time The length of time the agent was available (idle or on a call).
Available Time (%) The percentage of logged-in time the agent was available (idle or on a call).
Average After Call Work Time Average time agents spent on call-related tasks after the caller disconnected
Average Agent Time Average time agents spent on answered calls
Average Call Length Average call length
Average Call Time The average amount of time the agent spent on a call. This excludes ring time.
Average Hold Length Average time for a single on hold call segment
Average Hold Time Average time the agent had a customer on hold.
Average Queue Length Average time spent in a single Queue call segment
Average Time to Answer Average time caller waited for first agent after entering queue
LiveOps Insight Reporting Guide
Copyright © 2012 LiveOps, Inc. All rights reserved. Page 57 of 65
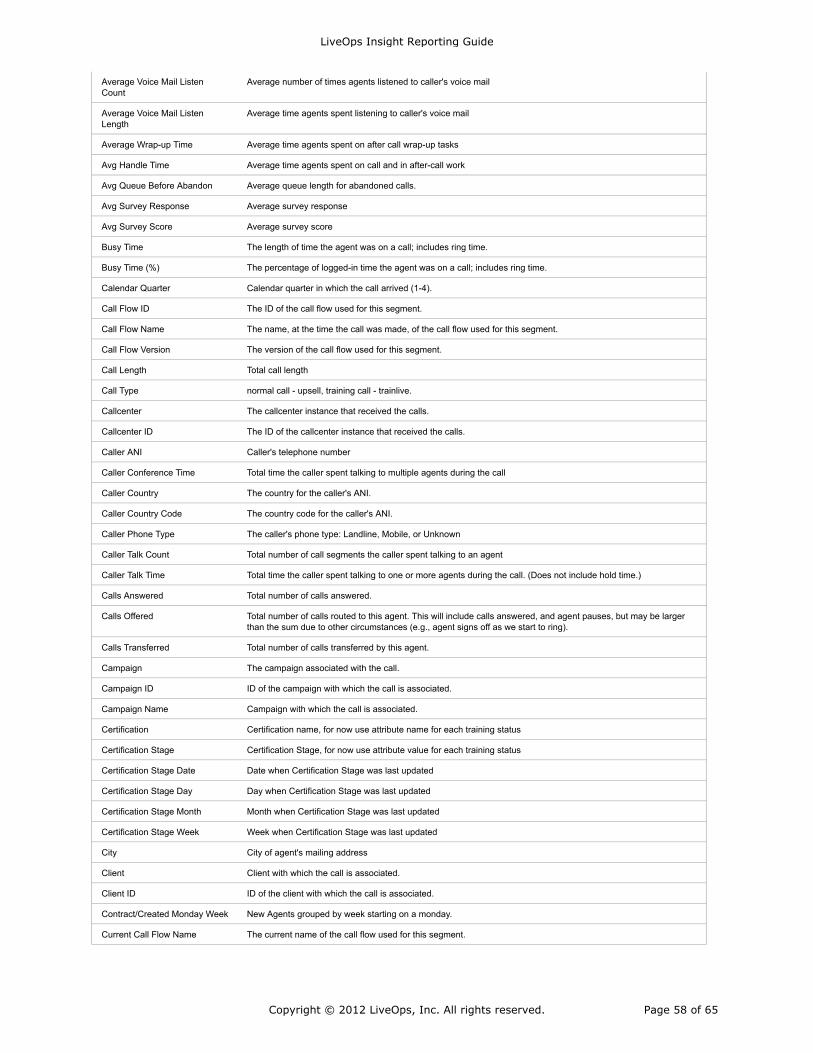
Average Voice Mail ListenCount
Average number of times agents listened to caller's voice mail
Average Voice Mail ListenLength
Average time agents spent listening to caller's voice mail
Average Wrap-up Time Average time agents spent on after call wrap-up tasks
Avg Handle Time Average time agents spent on call and in after-call work
Avg Queue Before Abandon Average queue length for abandoned calls.
Avg Survey Response Average survey response
Avg Survey Score Average survey score
Busy Time The length of time the agent was on a call; includes ring time.
Busy Time (%) The percentage of logged-in time the agent was on a call; includes ring time.
Calendar Quarter Calendar quarter in which the call arrived (1-4).
Call Flow ID The ID of the call flow used for this segment.
Call Flow Name The name, at the time the call was made, of the call flow used for this segment.
Call Flow Version The version of the call flow used for this segment.
Call Length Total call length
Call Type normal call - upsell, training call - trainlive.
Callcenter The callcenter instance that received the calls.
Callcenter ID The ID of the callcenter instance that received the calls.
Caller ANI Caller's telephone number
Caller Conference Time Total time the caller spent talking to multiple agents during the call
Caller Country The country for the caller's ANI.
Caller Country Code The country code for the caller's ANI.
Caller Phone Type The caller's phone type: Landline, Mobile, or Unknown
Caller Talk Count Total number of call segments the caller spent talking to an agent
Caller Talk Time Total time the caller spent talking to one or more agents during the call. (Does not include hold time.)
Calls Answered Total number of calls answered.
Calls Offered Total number of calls routed to this agent. This will include calls answered, and agent pauses, but may be largerthan the sum due to other circumstances (e.g., agent signs off as we start to ring).
Calls Transferred Total number of calls transferred by this agent.
Campaign The campaign associated with the call.
Campaign ID ID of the campaign with which the call is associated.
Campaign Name Campaign with which the call is associated.
Certification Certification name, for now use attribute name for each training status
Certification Stage Certification Stage, for now use attribute value for each training status
Certification Stage Date Date when Certification Stage was last updated
Certification Stage Day Day when Certification Stage was last updated
Certification Stage Month Month when Certification Stage was last updated
Certification Stage Week Week when Certification Stage was last updated
City City of agent's mailing address
Client Client with which the call is associated.
Client ID ID of the client with which the call is associated.
Contract/Created Monday Week New Agents grouped by week starting on a monday.
Current Call Flow Name The current name of the call flow used for this segment.
LiveOps Insight Reporting Guide
Copyright © 2012 LiveOps, Inc. All rights reserved. Page 58 of 65
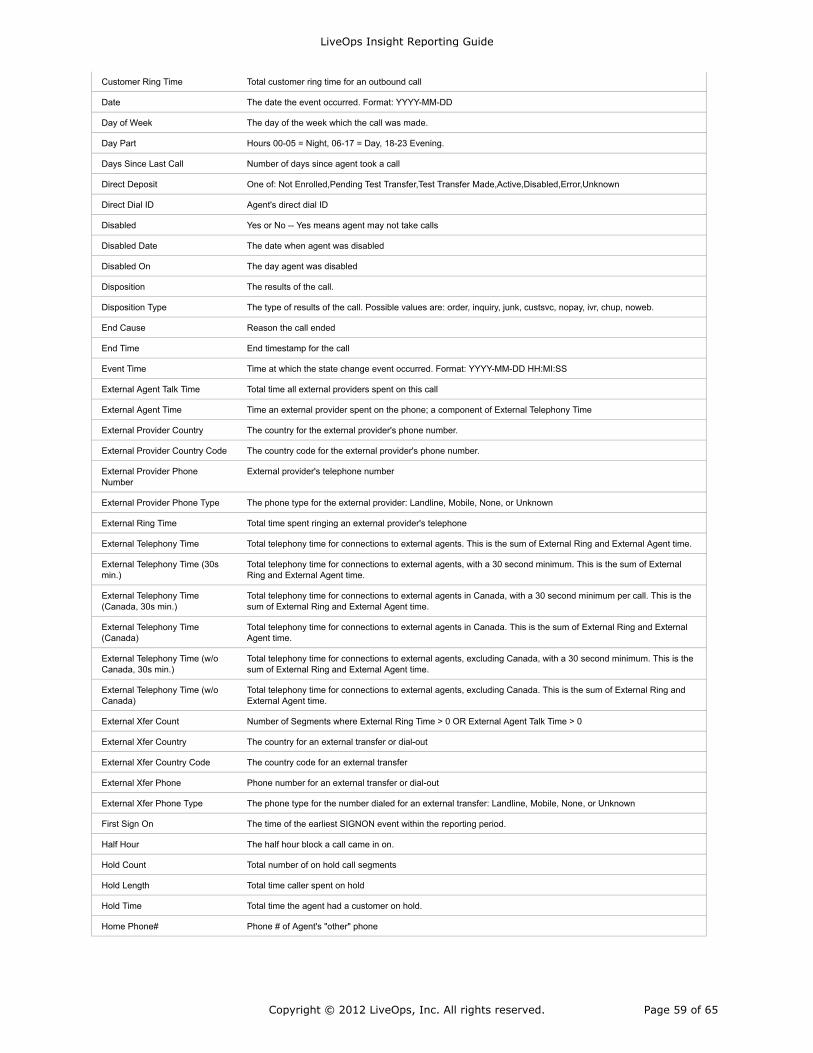
Customer Ring Time Total customer ring time for an outbound call
Date The date the event occurred. Format: YYYY-MM-DD
Day of Week The day of the week which the call was made.
Day Part Hours 00-05 = Night, 06-17 = Day, 18-23 Evening.
Days Since Last Call Number of days since agent took a call
Direct Deposit One of: Not Enrolled,Pending Test Transfer,Test Transfer Made,Active,Disabled,Error,Unknown
Direct Dial ID Agent's direct dial ID
Disabled Yes or No -- Yes means agent may not take calls
Disabled Date The date when agent was disabled
Disabled On The day agent was disabled
Disposition The results of the call.
Disposition Type The type of results of the call. Possible values are: order, inquiry, junk, custsvc, nopay, ivr, chup, noweb.
End Cause Reason the call ended
End Time End timestamp for the call
Event Time Time at which the state change event occurred. Format: YYYY-MM-DD HH:MI:SS
External Agent Talk Time Total time all external providers spent on this call
External Agent Time Time an external provider spent on the phone; a component of External Telephony Time
External Provider Country The country for the external provider's phone number.
External Provider Country Code The country code for the external provider's phone number.
External Provider PhoneNumber
External provider's telephone number
External Provider Phone Type The phone type for the external provider: Landline, Mobile, None, or Unknown
External Ring Time Total time spent ringing an external provider's telephone
External Telephony Time Total telephony time for connections to external agents. This is the sum of External Ring and External Agent time.
External Telephony Time (30smin.)
Total telephony time for connections to external agents, with a 30 second minimum. This is the sum of ExternalRing and External Agent time.
External Telephony Time(Canada, 30s min.)
Total telephony time for connections to external agents in Canada, with a 30 second minimum per call. This is thesum of External Ring and External Agent time.
External Telephony Time(Canada)
Total telephony time for connections to external agents in Canada. This is the sum of External Ring and ExternalAgent time.
External Telephony Time (w/oCanada, 30s min.)
Total telephony time for connections to external agents, excluding Canada, with a 30 second minimum. This is thesum of External Ring and External Agent time.
External Telephony Time (w/oCanada)
Total telephony time for connections to external agents, excluding Canada. This is the sum of External Ring andExternal Agent time.
External Xfer Count Number of Segments where External Ring Time > 0 OR External Agent Talk Time > 0
External Xfer Country The country for an external transfer or dial-out
External Xfer Country Code The country code for an external transfer
External Xfer Phone Phone number for an external transfer or dial-out
External Xfer Phone Type The phone type for the number dialed for an external transfer: Landline, Mobile, None, or Unknown
First Sign On The time of the earliest SIGNON event within the reporting period.
Half Hour The half hour block a call came in on.
Hold Count Total number of on hold call segments
Hold Length Total time caller spent on hold
Hold Time Total time the agent had a customer on hold.
Home Phone# Phone # of Agent's "other" phone
LiveOps Insight Reporting Guide
Copyright © 2012 LiveOps, Inc. All rights reserved. Page 59 of 65
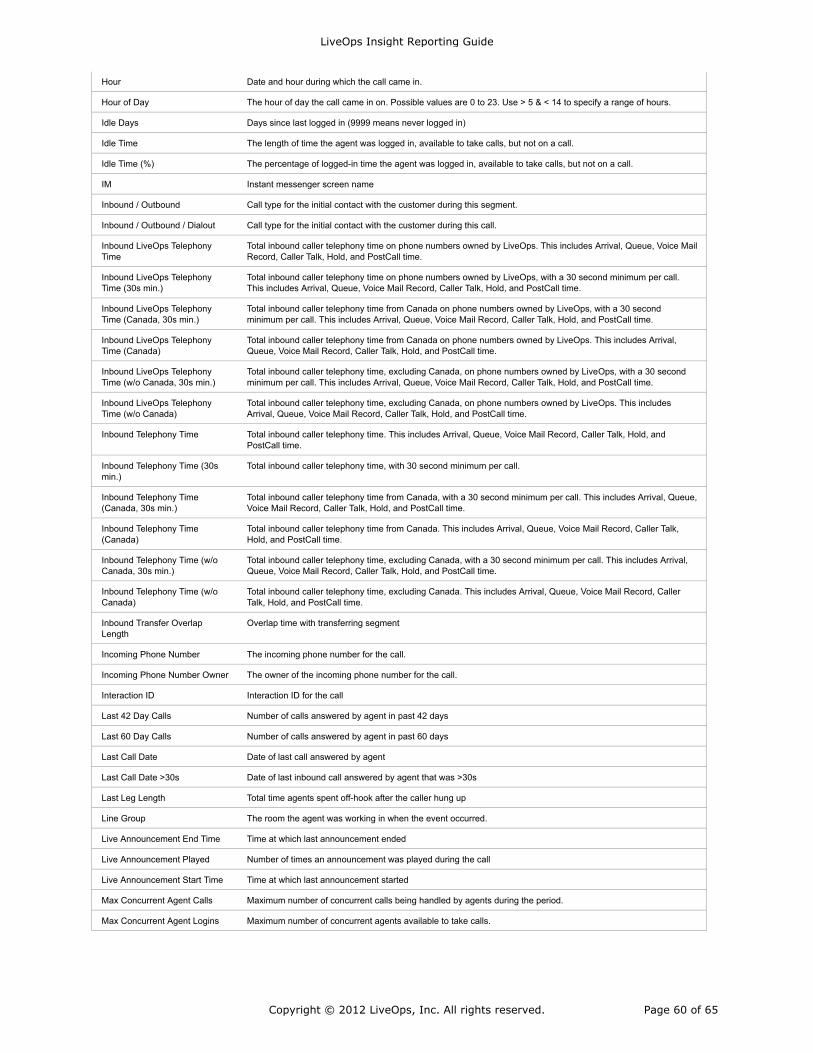
Hour Date and hour during which the call came in.
Hour of Day The hour of day the call came in on. Possible values are 0 to 23. Use > 5 & < 14 to specify a range of hours.
Idle Days Days since last logged in (9999 means never logged in)
Idle Time The length of time the agent was logged in, available to take calls, but not on a call.
Idle Time (%) The percentage of logged-in time the agent was logged in, available to take calls, but not on a call.
IM Instant messenger screen name
Inbound / Outbound Call type for the initial contact with the customer during this segment.
Inbound / Outbound / Dialout Call type for the initial contact with the customer during this call.
Inbound LiveOps TelephonyTime
Total inbound caller telephony time on phone numbers owned by LiveOps. This includes Arrival, Queue, Voice MailRecord, Caller Talk, Hold, and PostCall time.
Inbound LiveOps TelephonyTime (30s min.)
Total inbound caller telephony time on phone numbers owned by LiveOps, with a 30 second minimum per call.This includes Arrival, Queue, Voice Mail Record, Caller Talk, Hold, and PostCall time.
Inbound LiveOps TelephonyTime (Canada, 30s min.)
Total inbound caller telephony time from Canada on phone numbers owned by LiveOps, with a 30 secondminimum per call. This includes Arrival, Queue, Voice Mail Record, Caller Talk, Hold, and PostCall time.
Inbound LiveOps TelephonyTime (Canada)
Total inbound caller telephony time from Canada on phone numbers owned by LiveOps. This includes Arrival,Queue, Voice Mail Record, Caller Talk, Hold, and PostCall time.
Inbound LiveOps TelephonyTime (w/o Canada, 30s min.)
Total inbound caller telephony time, excluding Canada, on phone numbers owned by LiveOps, with a 30 secondminimum per call. This includes Arrival, Queue, Voice Mail Record, Caller Talk, Hold, and PostCall time.
Inbound LiveOps TelephonyTime (w/o Canada)
Total inbound caller telephony time, excluding Canada, on phone numbers owned by LiveOps. This includesArrival, Queue, Voice Mail Record, Caller Talk, Hold, and PostCall time.
Inbound Telephony Time Total inbound caller telephony time. This includes Arrival, Queue, Voice Mail Record, Caller Talk, Hold, andPostCall time.
Inbound Telephony Time (30smin.)
Total inbound caller telephony time, with 30 second minimum per call.
Inbound Telephony Time(Canada, 30s min.)
Total inbound caller telephony time from Canada, with a 30 second minimum per call. This includes Arrival, Queue,Voice Mail Record, Caller Talk, Hold, and PostCall time.
Inbound Telephony Time(Canada)
Total inbound caller telephony time from Canada. This includes Arrival, Queue, Voice Mail Record, Caller Talk,Hold, and PostCall time.
Inbound Telephony Time (w/oCanada, 30s min.)
Total inbound caller telephony time, excluding Canada, with a 30 second minimum per call. This includes Arrival,Queue, Voice Mail Record, Caller Talk, Hold, and PostCall time.
Inbound Telephony Time (w/oCanada)
Total inbound caller telephony time, excluding Canada. This includes Arrival, Queue, Voice Mail Record, CallerTalk, Hold, and PostCall time.
Inbound Transfer OverlapLength
Overlap time with transferring segment
Incoming Phone Number The incoming phone number for the call.
Incoming Phone Number Owner The owner of the incoming phone number for the call.
Interaction ID Interaction ID for the call
Last 42 Day Calls Number of calls answered by agent in past 42 days
Last 60 Day Calls Number of calls answered by agent in past 60 days
Last Call Date Date of last call answered by agent
Last Call Date >30s Date of last inbound call answered by agent that was >30s
Last Leg Length Total time agents spent off-hook after the caller hung up
Line Group The room the agent was working in when the event occurred.
Live Announcement End Time Time at which last announcement ended
Live Announcement Played Number of times an announcement was played during the call
Live Announcement Start Time Time at which last announcement started
Max Concurrent Agent Calls Maximum number of concurrent calls being handled by agents during the period.
Max Concurrent Agent Logins Maximum number of concurrent agents available to take calls.
LiveOps Insight Reporting Guide
Copyright © 2012 LiveOps, Inc. All rights reserved. Page 60 of 65
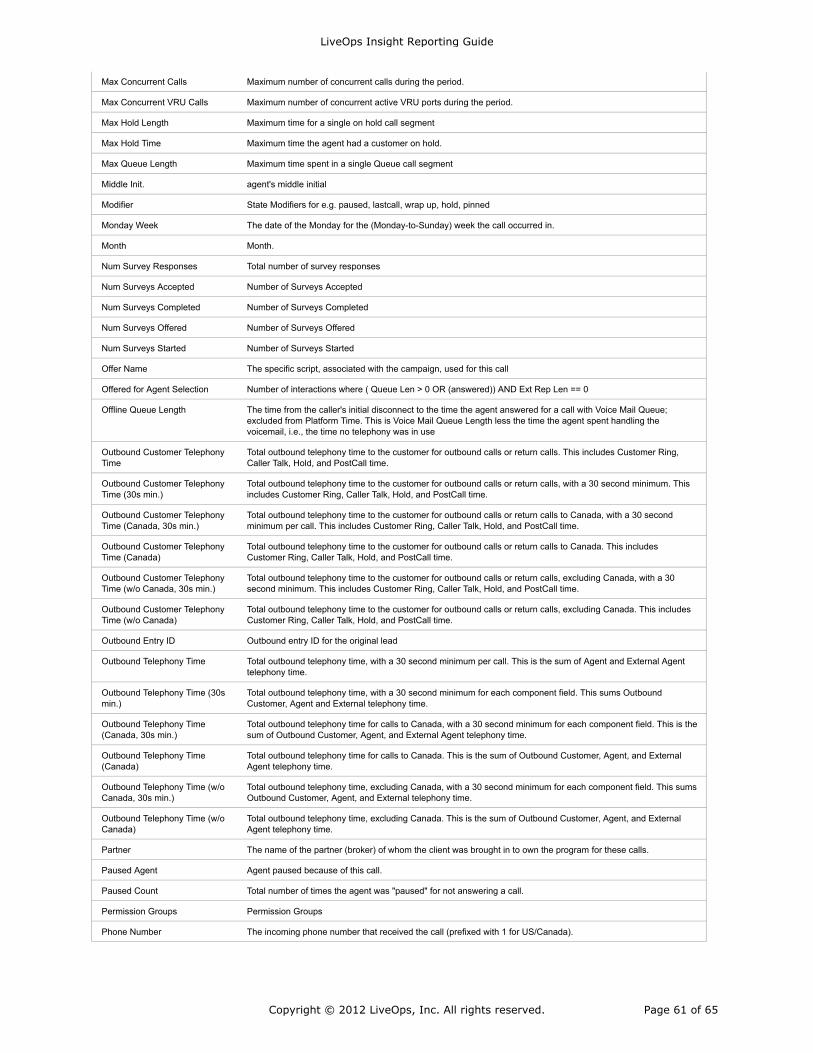
Max Concurrent Calls Maximum number of concurrent calls during the period.
Max Concurrent VRU Calls Maximum number of concurrent active VRU ports during the period.
Max Hold Length Maximum time for a single on hold call segment
Max Hold Time Maximum time the agent had a customer on hold.
Max Queue Length Maximum time spent in a single Queue call segment
Middle Init. agent's middle initial
Modifier State Modifiers for e.g. paused, lastcall, wrap up, hold, pinned
Monday Week The date of the Monday for the (Monday-to-Sunday) week the call occurred in.
Month Month.
Num Survey Responses Total number of survey responses
Num Surveys Accepted Number of Surveys Accepted
Num Surveys Completed Number of Surveys Completed
Num Surveys Offered Number of Surveys Offered
Num Surveys Started Number of Surveys Started
Offer Name The specific script, associated with the campaign, used for this call
Offered for Agent Selection Number of interactions where ( Queue Len > 0 OR (answered)) AND Ext Rep Len == 0
Offline Queue Length The time from the caller's initial disconnect to the time the agent answered for a call with Voice Mail Queue;excluded from Platform Time. This is Voice Mail Queue Length less the time the agent spent handling thevoicemail, i.e., the time no telephony was in use
Outbound Customer TelephonyTime
Total outbound telephony time to the customer for outbound calls or return calls. This includes Customer Ring,Caller Talk, Hold, and PostCall time.
Outbound Customer TelephonyTime (30s min.)
Total outbound telephony time to the customer for outbound calls or return calls, with a 30 second minimum. Thisincludes Customer Ring, Caller Talk, Hold, and PostCall time.
Outbound Customer TelephonyTime (Canada, 30s min.)
Total outbound telephony time to the customer for outbound calls or return calls to Canada, with a 30 secondminimum per call. This includes Customer Ring, Caller Talk, Hold, and PostCall time.
Outbound Customer TelephonyTime (Canada)
Total outbound telephony time to the customer for outbound calls or return calls to Canada. This includesCustomer Ring, Caller Talk, Hold, and PostCall time.
Outbound Customer TelephonyTime (w/o Canada, 30s min.)
Total outbound telephony time to the customer for outbound calls or return calls, excluding Canada, with a 30second minimum. This includes Customer Ring, Caller Talk, Hold, and PostCall time.
Outbound Customer TelephonyTime (w/o Canada)
Total outbound telephony time to the customer for outbound calls or return calls, excluding Canada. This includesCustomer Ring, Caller Talk, Hold, and PostCall time.
Outbound Entry ID Outbound entry ID for the original lead
Outbound Telephony Time Total outbound telephony time, with a 30 second minimum per call. This is the sum of Agent and External Agenttelephony time.
Outbound Telephony Time (30smin.)
Total outbound telephony time, with a 30 second minimum for each component field. This sums OutboundCustomer, Agent and External telephony time.
Outbound Telephony Time(Canada, 30s min.)
Total outbound telephony time for calls to Canada, with a 30 second minimum for each component field. This is thesum of Outbound Customer, Agent, and External Agent telephony time.
Outbound Telephony Time(Canada)
Total outbound telephony time for calls to Canada. This is the sum of Outbound Customer, Agent, and ExternalAgent telephony time.
Outbound Telephony Time (w/oCanada, 30s min.)
Total outbound telephony time, excluding Canada, with a 30 second minimum for each component field. This sumsOutbound Customer, Agent, and External telephony time.
Outbound Telephony Time (w/oCanada)
Total outbound telephony time, excluding Canada. This is the sum of Outbound Customer, Agent, and ExternalAgent telephony time.
Partner The name of the partner (broker) of whom the client was brought in to own the program for these calls.
Paused Agent Agent paused because of this call.
Paused Count Total number of times the agent was "paused" for not answering a call.
Permission Groups Permission Groups
Phone Number The incoming phone number that received the call (prefixed with 1 for US/Canada).
LiveOps Insight Reporting Guide
Copyright © 2012 LiveOps, Inc. All rights reserved. Page 61 of 65
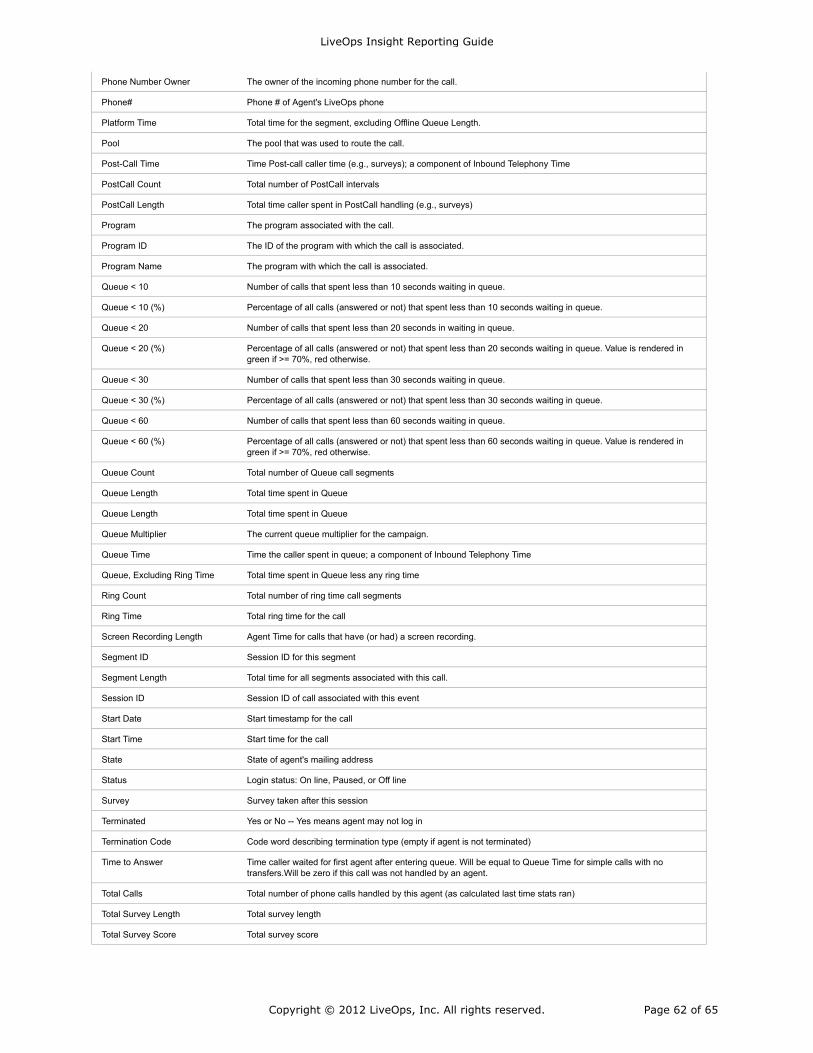
Phone Number Owner The owner of the incoming phone number for the call.
Phone# Phone # of Agent's LiveOps phone
Platform Time Total time for the segment, excluding Offline Queue Length.
Pool The pool that was used to route the call.
Post-Call Time Time Post-call caller time (e.g., surveys); a component of Inbound Telephony Time
PostCall Count Total number of PostCall intervals
PostCall Length Total time caller spent in PostCall handling (e.g., surveys)
Program The program associated with the call.
Program ID The ID of the program with which the call is associated.
Program Name The program with which the call is associated.
Queue < 10 Number of calls that spent less than 10 seconds waiting in queue.
Queue < 10 (%) Percentage of all calls (answered or not) that spent less than 10 seconds waiting in queue.
Queue < 20 Number of calls that spent less than 20 seconds in waiting in queue.
Queue < 20 (%) Percentage of all calls (answered or not) that spent less than 20 seconds waiting in queue. Value is rendered ingreen if >= 70%, red otherwise.
Queue < 30 Number of calls that spent less than 30 seconds waiting in queue.
Queue < 30 (%) Percentage of all calls (answered or not) that spent less than 30 seconds waiting in queue.
Queue < 60 Number of calls that spent less than 60 seconds waiting in queue.
Queue < 60 (%) Percentage of all calls (answered or not) that spent less than 60 seconds waiting in queue. Value is rendered ingreen if >= 70%, red otherwise.
Queue Count Total number of Queue call segments
Queue Length Total time spent in Queue
Queue Length Total time spent in Queue
Queue Multiplier The current queue multiplier for the campaign.
Queue Time Time the caller spent in queue; a component of Inbound Telephony Time
Queue, Excluding Ring Time Total time spent in Queue less any ring time
Ring Count Total number of ring time call segments
Ring Time Total ring time for the call
Screen Recording Length Agent Time for calls that have (or had) a screen recording.
Segment ID Session ID for this segment
Segment Length Total time for all segments associated with this call.
Session ID Session ID of call associated with this event
Start Date Start timestamp for the call
Start Time Start time for the call
State State of agent's mailing address
Status Login status: On line, Paused, or Off line
Survey Survey taken after this session
Terminated Yes or No -- Yes means agent may not log in
Termination Code Code word describing termination type (empty if agent is not terminated)
Time to Answer Time caller waited for first agent after entering queue. Will be equal to Queue Time for simple calls with notransfers.Will be zero if this call was not handled by an agent.
Total Calls Total number of phone calls handled by this agent (as calculated last time stats ran)
Total Survey Length Total survey length
Total Survey Score Total survey score
LiveOps Insight Reporting Guide
Copyright © 2012 LiveOps, Inc. All rights reserved. Page 62 of 65
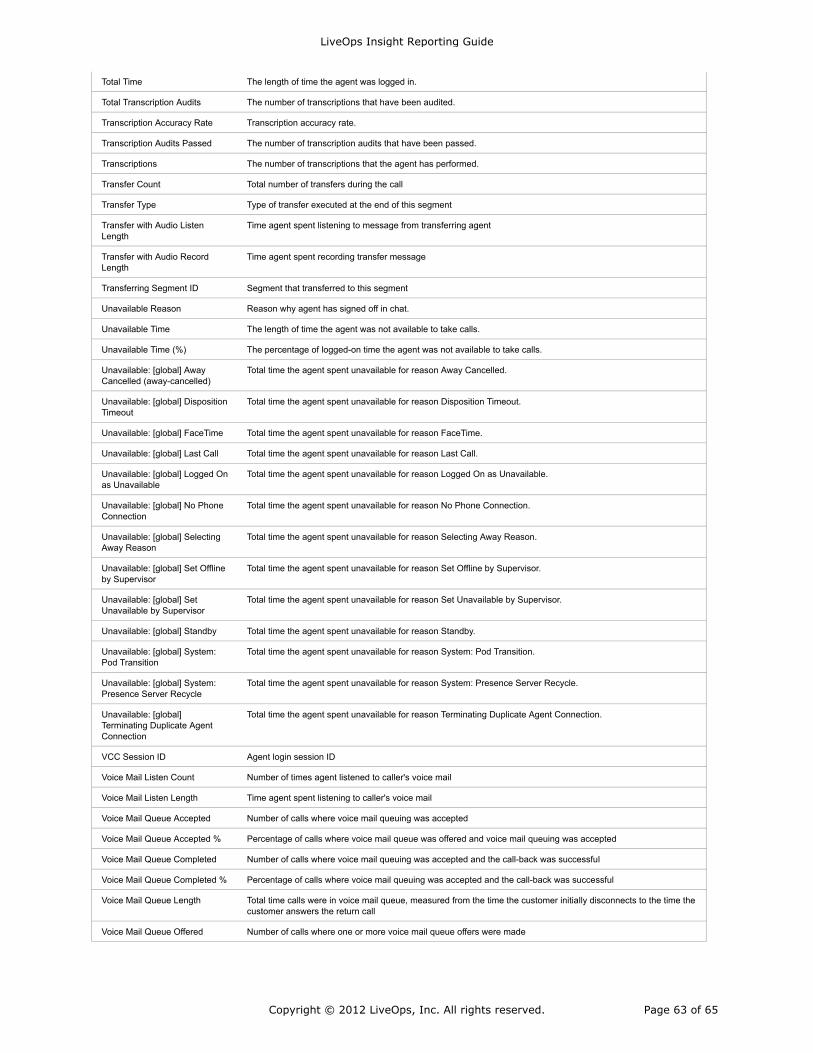
Total Time The length of time the agent was logged in.
Total Transcription Audits The number of transcriptions that have been audited.
Transcription Accuracy Rate Transcription accuracy rate.
Transcription Audits Passed The number of transcription audits that have been passed.
Transcriptions The number of transcriptions that the agent has performed.
Transfer Count Total number of transfers during the call
Transfer Type Type of transfer executed at the end of this segment
Transfer with Audio ListenLength
Time agent spent listening to message from transferring agent
Transfer with Audio RecordLength
Time agent spent recording transfer message
Transferring Segment ID Segment that transferred to this segment
Unavailable Reason Reason why agent has signed off in chat.
Unavailable Time The length of time the agent was not available to take calls.
Unavailable Time (%) The percentage of logged-on time the agent was not available to take calls.
Unavailable: [global] AwayCancelled (away-cancelled)
Total time the agent spent unavailable for reason Away Cancelled.
Unavailable: [global] DispositionTimeout
Total time the agent spent unavailable for reason Disposition Timeout.
Unavailable: [global] FaceTime Total time the agent spent unavailable for reason FaceTime.
Unavailable: [global] Last Call Total time the agent spent unavailable for reason Last Call.
Unavailable: [global] Logged Onas Unavailable
Total time the agent spent unavailable for reason Logged On as Unavailable.
Unavailable: [global] No PhoneConnection
Total time the agent spent unavailable for reason No Phone Connection.
Unavailable: [global] SelectingAway Reason
Total time the agent spent unavailable for reason Selecting Away Reason.
Unavailable: [global] Set Offlineby Supervisor
Total time the agent spent unavailable for reason Set Offline by Supervisor.
Unavailable: [global] SetUnavailable by Supervisor
Total time the agent spent unavailable for reason Set Unavailable by Supervisor.
Unavailable: [global] Standby Total time the agent spent unavailable for reason Standby.
Unavailable: [global] System:Pod Transition
Total time the agent spent unavailable for reason System: Pod Transition.
Unavailable: [global] System:Presence Server Recycle
Total time the agent spent unavailable for reason System: Presence Server Recycle.
Unavailable: [global]Terminating Duplicate AgentConnection
Total time the agent spent unavailable for reason Terminating Duplicate Agent Connection.
VCC Session ID Agent login session ID
Voice Mail Listen Count Number of times agent listened to caller's voice mail
Voice Mail Listen Length Time agent spent listening to caller's voice mail
Voice Mail Queue Accepted Number of calls where voice mail queuing was accepted
Voice Mail Queue Accepted % Percentage of calls where voice mail queue was offered and voice mail queuing was accepted
Voice Mail Queue Completed Number of calls where voice mail queuing was accepted and the call-back was successful
Voice Mail Queue Completed % Percentage of calls where voice mail queuing was accepted and the call-back was successful
Voice Mail Queue Length Total time calls were in voice mail queue, measured from the time the customer initially disconnects to the time thecustomer answers the return call
Voice Mail Queue Offered Number of calls where one or more voice mail queue offers were made
LiveOps Insight Reporting Guide
Copyright © 2012 LiveOps, Inc. All rights reserved. Page 63 of 65
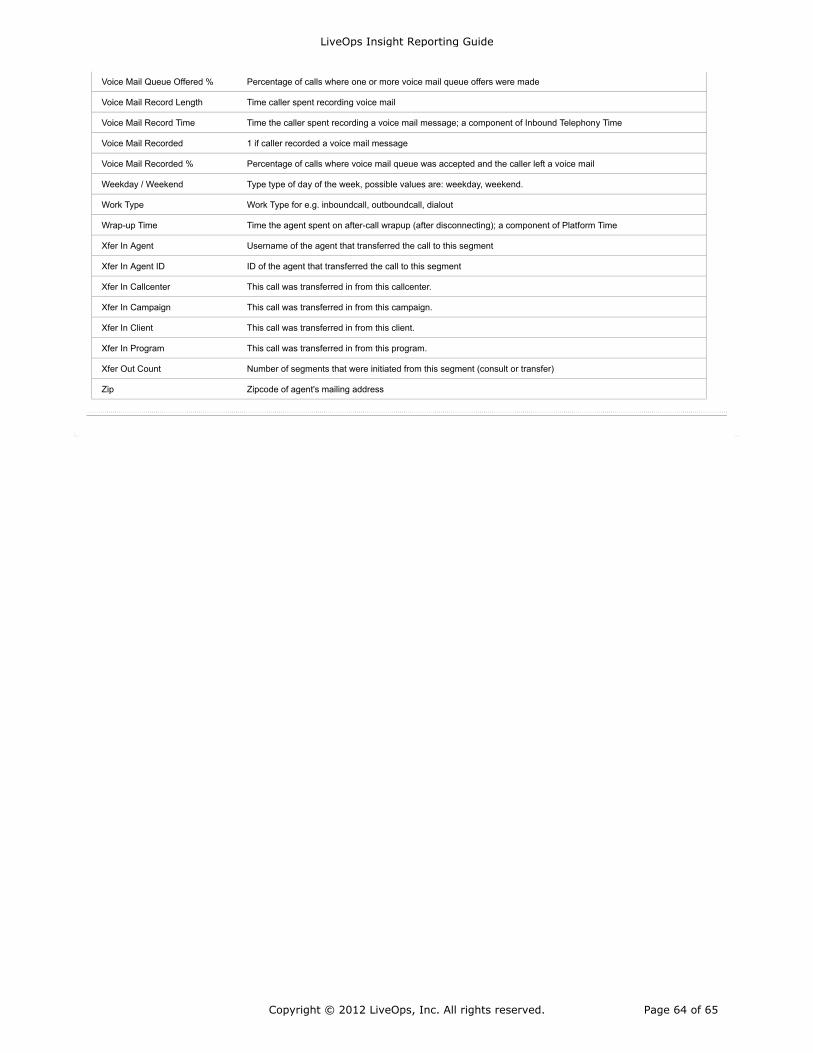
Voice Mail Queue Offered % Percentage of calls where one or more voice mail queue offers were made
Voice Mail Record Length Time caller spent recording voice mail
Voice Mail Record Time Time the caller spent recording a voice mail message; a component of Inbound Telephony Time
Voice Mail Recorded 1 if caller recorded a voice mail message
Voice Mail Recorded % Percentage of calls where voice mail queue was accepted and the caller left a voice mail
Weekday / Weekend Type type of day of the week, possible values are: weekday, weekend.
Work Type Work Type for e.g. inboundcall, outboundcall, dialout
Wrap-up Time Time the agent spent on after-call wrapup (after disconnecting); a component of Platform Time
Xfer In Agent Username of the agent that transferred the call to this segment
Xfer In Agent ID ID of the agent that transferred the call to this segment
Xfer In Callcenter This call was transferred in from this callcenter.
Xfer In Campaign This call was transferred in from this campaign.
Xfer In Client This call was transferred in from this client.
Xfer In Program This call was transferred in from this program.
Xfer Out Count Number of segments that were initiated from this segment (consult or transfer)
Zip Zipcode of agent's mailing address
LiveOps Insight Reporting Guide
Copyright © 2012 LiveOps, Inc. All rights reserved. Page 64 of 65
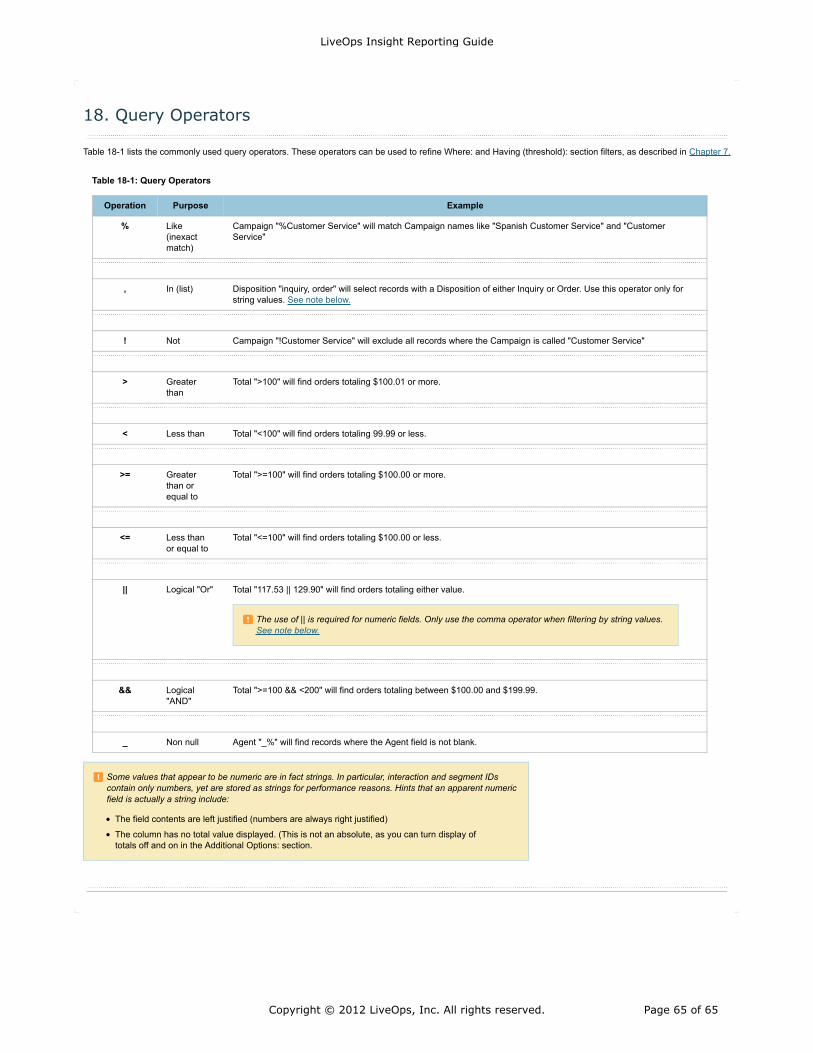
The use of || is required for numeric fields. Only use the comma operator when filtering by string values.See note below.
Some values that appear to be numeric are in fact strings. In particular, interaction and segment IDscontain only numbers, yet are stored as strings for performance reasons. Hints that an apparent numericfield is actually a string include:
The field contents are left justified (numbers are always right justified)
The column has no total value displayed. (This is not an absolute, as you can turn display oftotals off and on in the Additional Options: section.
18. Query Operators
Table 18-1 lists the commonly used query operators. These operators can be used to refine Where: and Having (threshold): section filters, as described in Chapter 7.
Table 18-1: Query Operators
Operation Purpose Example
% Like(inexactmatch)
Campaign "%Customer Service" will match Campaign names like "Spanish Customer Service" and "CustomerService"
, In (list) Disposition "inquiry, order" will select records with a Disposition of either Inquiry or Order. Use this operator only forstring values. See note below.
! Not Campaign "!Customer Service" will exclude all records where the Campaign is called "Customer Service"
> Greaterthan
Total ">100" will find orders totaling $100.01 or more.
< Less than Total "<100" will find orders totaling 99.99 or less.
>= Greaterthan orequal to
Total ">=100" will find orders totaling $100.00 or more.
<= Less thanor equal to
Total "<=100" will find orders totaling $100.00 or less.
|| Logical "Or" Total "117.53 || 129.90" will find orders totaling either value.
&& Logical"AND"
Total ">=100 && <200" will find orders totaling between $100.00 and $199.99.
_ Non null Agent "_%" will find records where the Agent field is not blank.
LiveOps Insight Reporting Guide
Copyright © 2012 LiveOps, Inc. All rights reserved. Page 65 of 65