Livelihood, Land Use and Carbon - iwgia.org · PDF fileLivelihood, land use and carbon in ......
60
A Study on the Carbon Footprint of a Shifting Cultivation Community in Kayah State Livelihood, Land Use and Carbon Karuna Mission Social Solidarity (KMSS) – Loikaw 2017
Transcript of Livelihood, Land Use and Carbon - iwgia.org · PDF fileLivelihood, land use and carbon in ......

A Study on the Carbon Footprint of a Shifting
Cultivation Community in Kayah State
Livelihood, Land Use and Carbon
Karuna Mission Social Solidarity (KMSS) – Loikaw
2017


Livelihood, Land Use and Carbon
A Study on the Carbon Footprint of a Shifting Cultivation Community
in Kayah State
Karuna Mission Social Solidarity (KMSS) - Loikaw
2017

Livelihood, Land Use and Carbon
A Study on the Carbon Footprint of a Shifting Cultivation Community in Kayah State
Karuna Mission Social Solidarity (KMSS)-Loikaw
Copyright © KMSS-Loikaw 2017
The contents of this book may be reproduced and distributed for non-commercial purposes if prior notice is given to the copyright holders and the source and authors are duly acknowledged.
Published by Karuna Mission Social Solidarity (KMSS)-Loikaw
KMSS: www.kmss-caritasmyanmar.org
Written by: Christian Erni and KMSS-Loikaw Livelihood Programme team
Editing: Christian Erni
Layout and Cover Design: Sa Zat Design
Photos: Alesio Ngairi (Fig. 05, 06, 07, 08, 19, 20, 21, 25, 35, 37)
Ignatio (Fig. 22)
Christian Erni (p. 6, Fig. 04, 09, 12, 13, 14, 15, 17, 18, 23, 26, 27, 28, 29, 30, 36, 38, 40, p.52)
Cover photos: Christian Erni, Alesio Ngairi
Maps: Nabwong Chuaychuwong (Fig. 02); all other maps and satellite images were created by Prawit Nikornuaychai
Printed in Yangon by MINT color offset

Financial support of the research and the publication of this report was generously provided by MISEREOR, and the International Work Group for Indigenous Affairs (IWGIA) with funding from the Danish Ministry of Foreign Affairs.
We would also like to express our gratitude to Dr. Pathipan Sutigoolabud, Faculty of Agricultural Production, Mae Jo University, Chiang Mai, Thailand for his support and advice.


ContentsIntroduction 7
1. Scope and method of the study 8
The scope 9
Methods 10
I. Land use and carbon in Khupra community 11
1. Khupra community 11
2. Livelihood and land use 14
3. Land use and carbon 23
Shifting cultivation 25
The cycle 26
Carbon stock change 30
Other sources of greenhouse gas emissions 40
II. Carbon and lifestyle: Khupra farmers’ carbon footprint 43
1. Using online carbon calculators 43
2. Individual Carbon footprint: The results 44
III. Livelihood, land use and carbon in Khupra: Some conclusions 49
Comparison with other forms of land use 50
The way ahead 51


Introduction
In Myanmar, many upland communities depend for their livelihood on shifting cultivation. Reliable figure on the number of shifting cultivators in the country do not exist and estimates vary consider-ably, from 2 to 20 million people. But it is probably up to half of the country’s upland population that makes a living from shifting cultivation.1
Like elsewhere in the region, negative prejudices on shifting cultivation – often also called swidden farming/swidden agriculture, or in Myanmar taungya2 – are prevalent among decision makers in Myanmar. Throughout Asia, colonial and post-colonial governments have since more than a century devised policies and laws seeking to eradicate shifting cultivation.3 Many of the arguments brought forward against this form of land use – that it is an economically inefficient and ecologically harmful practice – have been proven inaccurate or outright wrong.4 Notwithstanding all evidence, however, attitudes by decision makers and, consequently, state policies have hardly changed. This is also the case in Myanmar, which has recently become evident in the 2015 Election Manifesto of the National League for Democracy. On page 20 of the authorized English translation of the manifesto, it states under chapter 4. The freedom and security to prosper, paragraph viii) Environment:
The NLD will carry out the following activities in order to reduce the current levels of pollution and environmental harm, and to create a better environment:
……..
2. Farming: We will provide education and practical assistance in order to eradicate shifting cultivation practices.
Despite a somewhat more sympathetic attitude that has emerged over the past years, especially in academic circles, pressure on shifting cultivation has increased in recent years in the wake of the discussions on drivers of climate change and on mitigation schemes like REDD+.5 Policy makers are proposing to use REDD+ to encourage the replacement of shifting cultivation with other types of land use, like oil palm, rubber or other types of agroforestry.6
This comes at a time when economic transformations, population increase and policy interventions that promote large-scale agro-industrial plantations on the one hand and forest conservation and thus the restriction of access to land for upland farmers on the other have already lead to a rapid decline of shifting cultivation throughout Southeast Asia. Fox et.al. conclude that “the conditions necessary for swiddening, both the availability of land and the aspirations of people, simply no longer exist in many parts of Southeast Asia”.7

8 INTRODUCTION
However, in a recent global meta-analysis it was found that “swidden remains important in many frontier areas where farmers have unequal or insecure access to investment and market opportunities, or where multifunctionality of land uses has been preserved as a strategy to adapt to current ecologi-cal, economic and political circumstances.”8
Most important, recent global analysis of available data show that the transition from shifting cultiva-tion to other forms of land use in many cases lead to an increase of income, but that other expected benefits, above all with respect to forest and biodiversity conservation or increased carbon sequestra-tion, are not at all certain.9
In 2011, Myanmar joined the UN-REDD Programme (United Nations Collaborative Programme on Reducing Emissions from Deforestation and Forest Degradation in Developing Countries). The REDD+ Core Unit under the Ministry of Natural Resources and Environmental Conservation (MONREC) is in charge of coordinating and guiding the implementation of REDD+ activities identi-fied in its REDD+ Readiness Roadmap of 2013.
According to Myanmar’s Intended Nationally Determined Contributions (INDC), submitted to the United Nations Framework Convention on Climate Change (UNFCCC) in 2015, the country aims at having 30% of the land area within the permanent forest estate and 10% of the land area as protected areas by the year 2030, as targeted in Myanmar’s 30-Year National Forestry Master Plan (2001-30).
Currently, the UN-REDD Programme and MONREC are working on a report identifying drivers of deforestation, which will be part of Myanmar’s National REDD+ Strategy. At the time of writing this study, it is not certain what the conclusions and recommendations of the report are with regards to shifting cultivation and, more important, how the future National REDD+ Strategy will address shift-ing cultivation.
Since Karuna Loikaw10 has worked with shifting cultivation communities for many years and is con-cerned that future policies on climate change and environmental conservation may have a negative impact on them, as well as on thousands of other upland communities throughout the country, it decided to contribute to the discussion revolving around the impact of land use under shifting culti-vation on climate change by conducting a study with one of its partner communities.
A number of other concerned NGOs as well as academics working in and on Myanmar have over the recent years tried to correct the prevailing, negatively biased view on shifting cultivation, but more efforts are needed to ensure that environmental conservation and upland development policies and programs are not impacting negatively on shifting cultivators, but rather support them in adapting to changing environmental, economic and social conditions. Karuna Loikaw hopes that this study will be a contribution toward that goal.
1. Scope and method of the study
The study is part of a participatory action research (PAR) conducted by members of Khupra commu-nity and the Livelihood Program team of Karuna Mission Social Solidarity-Loikaw (KMSS-Loikaw) between October 2015 and July 2016. The PAR is one of the components of the project that supports indigenous communities in Kayah state to document and seek official recognition of their customary land and natural resource rights and management practices. Concerned about the current debate on the impact of shifting cultivation on climate change and its possible policy implications Karuna felt it should get involved in the debate and contribute by conducting a study on the “carbon footprint” of one of its partner communities.
9INTRODUCTION
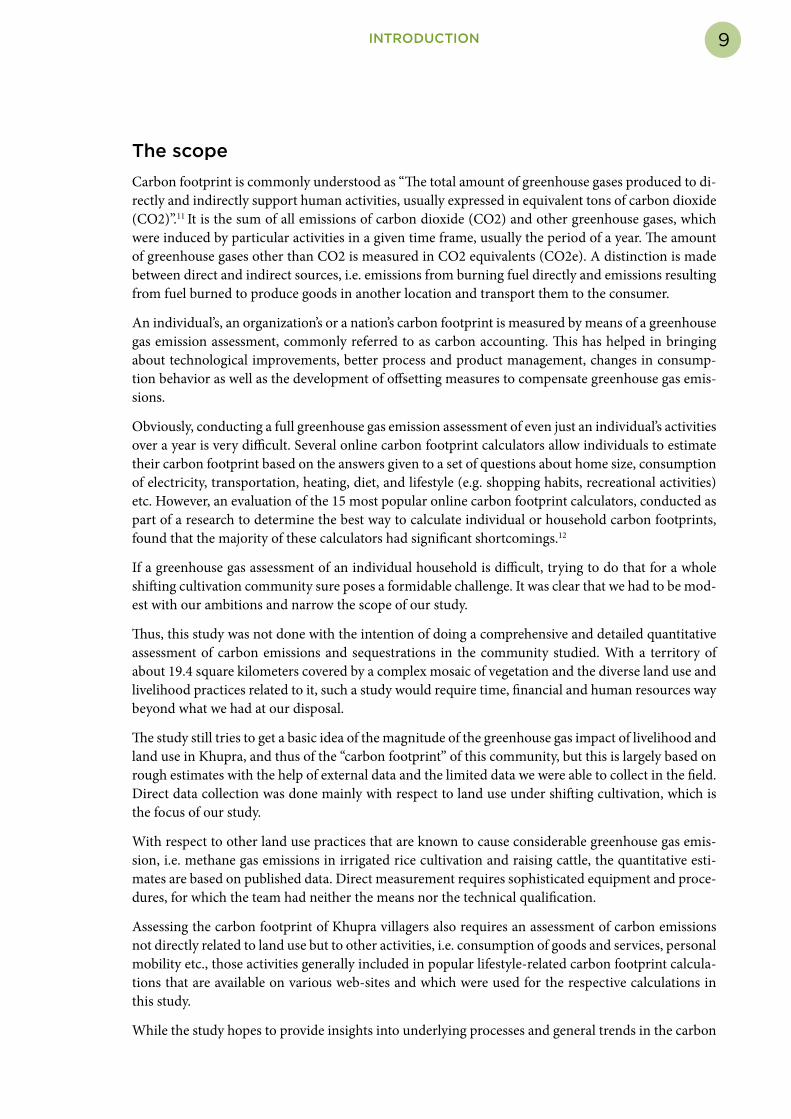
The scopeCarbon footprint is commonly understood as “The total amount of greenhouse gases produced to di-rectly and indirectly support human activities, usually expressed in equivalent tons of carbon dioxide (CO2)”.11 It is the sum of all emissions of carbon dioxide (CO2) and other greenhouse gases, which were induced by particular activities in a given time frame, usually the period of a year. The amount of greenhouse gases other than CO2 is measured in CO2 equivalents (CO2e). A distinction is made between direct and indirect sources, i.e. emissions from burning fuel directly and emissions resulting from fuel burned to produce goods in another location and transport them to the consumer.
An individual’s, an organization’s or a nation’s carbon footprint is measured by means of a greenhouse gas emission assessment, commonly referred to as carbon accounting. This has helped in bringing about technological improvements, better process and product management, changes in consump-tion behavior as well as the development of offsetting measures to compensate greenhouse gas emis-sions.
Obviously, conducting a full greenhouse gas emission assessment of even just an individual’s activities over a year is very difficult. Several online carbon footprint calculators allow individuals to estimate their carbon footprint based on the answers given to a set of questions about home size, consumption of electricity, transportation, heating, diet, and lifestyle (e.g. shopping habits, recreational activities) etc. However, an evaluation of the 15 most popular online carbon footprint calculators, conducted as part of a research to determine the best way to calculate individual or household carbon footprints, found that the majority of these calculators had significant shortcomings.12
If a greenhouse gas assessment of an individual household is difficult, trying to do that for a whole shifting cultivation community sure poses a formidable challenge. It was clear that we had to be mod-est with our ambitions and narrow the scope of our study.
Thus, this study was not done with the intention of doing a comprehensive and detailed quantitative assessment of carbon emissions and sequestrations in the community studied. With a territory of about 19.4 square kilometers covered by a complex mosaic of vegetation and the diverse land use and livelihood practices related to it, such a study would require time, financial and human resources way beyond what we had at our disposal.
The study still tries to get a basic idea of the magnitude of the greenhouse gas impact of livelihood and land use in Khupra, and thus of the “carbon footprint” of this community, but this is largely based on rough estimates with the help of external data and the limited data we were able to collect in the field. Direct data collection was done mainly with respect to land use under shifting cultivation, which is the focus of our study.
With respect to other land use practices that are known to cause considerable greenhouse gas emis-sion, i.e. methane gas emissions in irrigated rice cultivation and raising cattle, the quantitative esti-mates are based on published data. Direct measurement requires sophisticated equipment and proce-dures, for which the team had neither the means nor the technical qualification.
Assessing the carbon footprint of Khupra villagers also requires an assessment of carbon emissions not directly related to land use but to other activities, i.e. consumption of goods and services, personal mobility etc., those activities generally included in popular lifestyle-related carbon footprint calcula-tions that are available on various web-sites and which were used for the respective calculations in this study.
While the study hopes to provide insights into underlying processes and general trends in the carbon

10 INTRODUCTION
dynamics of land use in Khupra community, due to mainly technical limitations the related quantita-tive assessments are at best indicative, and the study’s main value may therefore lie more in raising questions and identifying needs for further research.
MethodsAs a participatory action research, the study was conducted by a team composed of members of the community, KMSS staff and advisers. The community members who were part of the research team are: From Upper Khupra Khu Ka Bwe, Saw Saw Htoo , Htoo Dayl, Poe Po and Day Khaing; from Old Khupra Giovanni Shwerino, Leone and Marta Ma Oo; from New Khupra Pilatio and Anthony. The research team members from KMSS-Loikaw’s were Christina Ti Myar, Elena, Anne Mary Ne Ne, Ale-sio Ngairi and Ignatio. The PAR was supported by Dr. Christian Erni, Prawit Nikornuaychai and Gam Angkang Shimray as trainers, during field testing of the research methodology, and through technical support during data consolidation and analysis, and report writing.
A combination of quantitative and qualitative research methods were applied in this study. Basic demographic and socio-economic data was collected by means of a household census conducted by the research team. This data was complemented by the findings from a range of standard qualitative research methods such as group interviews, individual interviews, focal group discussions and vari-ous tools and methods that are commonly used in research guided by the Participatory Learning and Action (PLA) approach (community mapping, time line, transect walk, land use sketch mapping, priority ranking etc.).
Spatial information on land use was collected through participatory mapping, with the help of both satellite imagery and GPS ground survey, and processed with Geographical Information System soft-ware (ArcGIS and QGIS).
Carbon stock assessment was done in six areas: a newly cut swidden field and fields of two, five, six, nine and a twelve years old fallow. In each of these areas, in proportion to their size, between 5 and 10 sample plots of 10x10 m were chosen randomly. The tree and bamboo biomass (and the correspond-ing carbon stock) was estimated with the standard forest biomass assessment method measuring di-ameter of trees at breast height, and bamboo according to the species, i.e. per individual pole or whole clumps, and using the allometric equations for trees and bamboo in dry evergreen forests developed by RECOF-TC for forests in Thailand. The hills of Kayah state fall within the same bioregion and the allometric equation was therefore considered applicable to the forests of Khupra village. Undergrowth was cut and litter collected in four 1x1m sub-plots in each of the sample plots, dried and both wet and dry weight recorded for the calculation of their carbon content.
Soil samples were taken in each of the four sub-plots in each sample plot, and a combined sample for each sample plot analyzed for pH value, organic matter and carbon content at the laboratory of Mae Jo University in Chiang Mai.
Finally, the individual carbon footprint assessment was done through a combination of three online carbon footprint calculators, as explained in more detail in the chapter II.
I. Land use and carbon in Khupra
community1. Khupra community
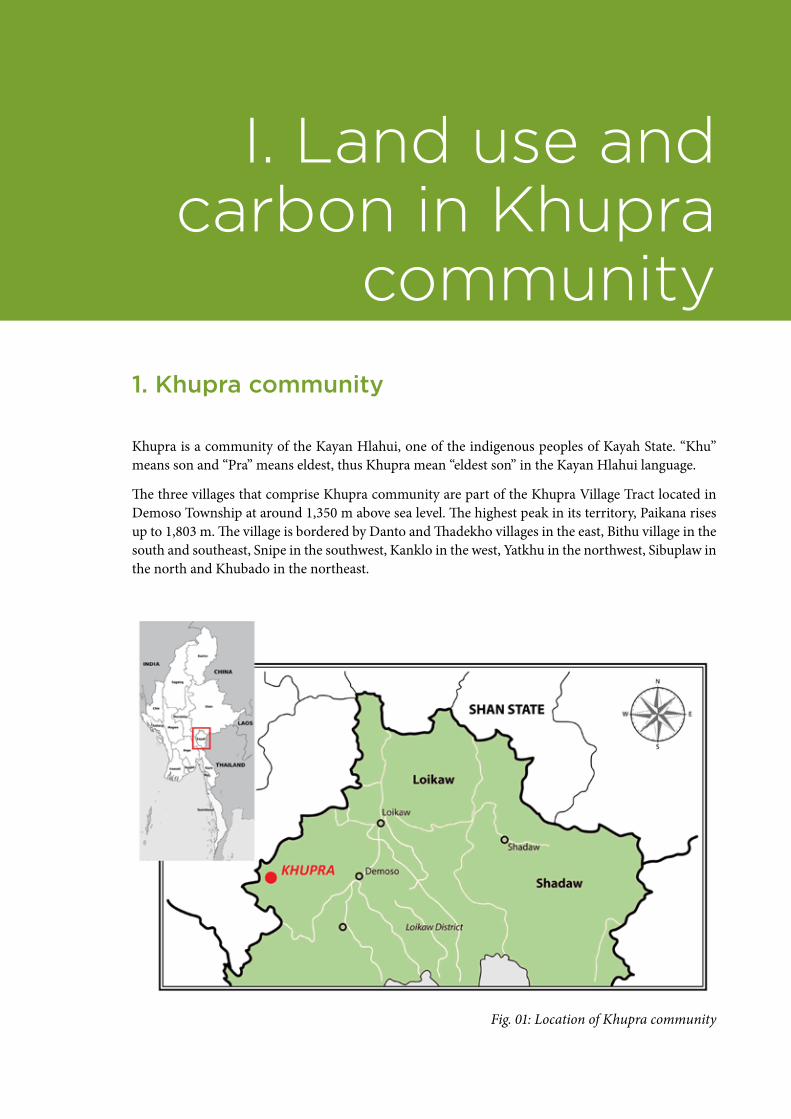
Khupra is a community of the Kayan Hlahui, one of the indigenous peoples of Kayah State. “Khu” means son and “Pra” means eldest, thus Khupra mean “eldest son” in the Kayan Hlahui language.
The three villages that comprise Khupra community are part of the Khupra Village Tract located in Demoso Township at around 1,350 m above sea level. The highest peak in its territory, Paikana rises up to 1,803 m. The village is bordered by Danto and Thadekho villages in the east, Bithu village in the south and southeast, Snipe in the southwest, Kanklo in the west, Yatkhu in the northwest, Sibuplaw in the north and Khubado in the northeast.
Fig. 01: Location of Khupra community

12 LAND USE AND CARBON
Khupra community’s territory measures approximately 19.4 square kilometers (4,790 acres). It extends for about 6 kilometers between 19°30’22.98”N and 96°55’43.76”E in the North and 19°27’2.17”N and 96°55’21.35”E in the south, and is between 2 and 4 kilometers wide. The precise area could not be measured since the boundaries between Khupra and its neighboring villages are disputed and currently under negotiation.
Fig. 02: Satellite image of Khupra community’s territory with approximate boundary.
Khupra’s territory consists mostly of mountainous land, and very little flat land along the Kanklo river and its tributaries. Most of the uplands are covered by secondary forest, grass and shrub land and some residual old-growth forest. Most of the secondary forests are shifting cultivation fallow at various stages of regeneration.
The community is composed of three villages: Dou Du (“Big Village”, in Burmese and English usually referred to as “Upper Khupra”) with 62 households, Dou Lû (”Old Village”, i.e. “Old Khupra”) with 26 and Dou Thû (“New Village”, i.e. “New Khupra”) with 24 households. All of them belong to the Kayan Hlahui ethnic group. The members of Upper Khupra hamlet are Baptists, while the members of Old Khupra and New Khupra are Catholics. The total population of the 112 households is 612 persons, of which 323 are males and 289 females.13

13LAND USE AND CARBON
According to oral history, the settlement that later came to be known as Khupra was founded by Lein Phar Plaung around 1360 A.D. Since then, 22 village leaders succeeded him, whose names are all remembered and recorded by Khupra villagers. Assuming that a leader remains in his position between 20 and 30 year, this confirms the foundation date of the village pretty well.
Over the centuries, there was considerable movement of people in and out of the area that today is known as Khupra, and the village site was shifted several times as well. There is only scant information available on the population dynamics over this long period of time. The earliest figure we have is for the early 20th century, the time of conversion to Christianity. According to the village history written by Saya Saw Htoo Wah, the village split into Baptists and Catholics in connection with a power struggle between two village chiefs. 20 families supported U Khin Maung and became Baptists in 1903 (today’s Upper Khupra), while around 30 families supported U Mu Htraw and became Catholics in 1906 (today’s Old and New Khupra).
Fig. 03: Satellite image of the three villages of Khupra community. To the left of Old Khupra is the swidden field cleared in 2016.

14 LAND USE AND CARBON
Fig. 04: View of the three villages of Khupra community: Part of New Khupra visible at bottom left of the image, Old Khupra above at center left, and New Khupra to the right.
In 1952, 20 households from New Khupra moved to Okhuri due to scarcity of land, and in 1956, another ten households from New Khupra moved to Patongan. In 1960 five households from Old Khupra migrated to Six Mile (Sanpya). All lie in in Demoso Township.
During 1991-1992, the whole of Khupra community was forced to relocate to Aungmingala in Demoso Township because of the armed conflict between the Tatmadaw, the armed forces of Myanmar, and the Karenni National Progressive Party (KNPP). A total of 66 households were reportedly displaced. They were able to return to Khupra after two years.
Thus, partly due to outmigration, the population of Khupra grew only little (ca. 38%) over the 85 years between 1906 and 1991, when Khupra counted 66 households. Since then, over the past 25 years, the population has grown by 70%, or an average of 2.8% per year.
2. Livelihood and land use
Agriculture is the backbone of the livelihood of Khupra villagers. Except for one household, everyone in Khupra is engaged in farming. However, most households are not able to cover all their needs from farming alone and combine it with a broad range of other livelihood activities to support food security and generate cash income, such as the sale of handicrafts and forest products, doing carpentry or masonry work for others, daily labor in their own and neighboring villages and seasonal labor migration. Small retail shops provide additional income for a few families, but only one household lives entirely off running a retail shop.

15LAND USE AND CARBON
Paddy fields are owned by individuals, usually men. Only two plots are owned by women. Most households own some paddy land. Only 10 of the 111 households that grow rice do not own paddy fields. However, the size of the holdings differ considerably, ranging from 0.3 to 3.5 acres.
Due to the limited flat land for paddy cultivation terraces have been cut in suitable areas, a practice that started generations ago and was supported by means of technical training by the French NGO Action Contre la Faim (ACF) in 2010-2011 as part of a project on sustainable agriculture. These terraces are called krain. They also rely on rain and water from creeks and streams. Now some families started transforming their swidden and grazing land into rice terraces. Making rice terraces is very labor intensive, which not all families can afford. They continue to rely on shifting cultivation to make ends meet.
Fig. 05: Rice terraces
Since paddy land is so limited, all households grow rice in shifting cultivation and most household (99 of 111) own or co-own shifting cultivation land. Around half of the shifting cultivation plots are owned by individuals (again in most cases men), the rest are owned collectively by clans. The size of shifting cultivation land owned ranges from 1 to 20 acres (average 10.5 acres).
A few people started growing cardamom, coffee and bamboo as a cash crop in permanent gardens and two households own a small orchard. The few permanent gardens and orchards in the community were established on individually owned shifting cultivation land.
Since land ownership is unevenly distributed in Khupra, almost half of all household (47 of 112) were renting land from others in 2016. In some cases they are allowed to use the land for free, but in most cases a rent is paid either in cash (10,000 kyat, ca. 8 US$, per field), a share of the rice product (usually one third) or in labor (10 days).

16 LAND USE AND CARBON
Only 13 of the 111 rice-growing households are able to produce enough rice to cover their needs throughout the year. 19 have enough for about 8 months, 26 for about 6 months and almost half (households) have enough rice for less than 6 months. Since most households need to buy rice and all of them need cash for purchasing other goods, the various income generating activities are of critical importance for the livelihood of Khupra villagers.
Fig. 06: Threshing paddy
Cash crops such as cucumber, pumpkin, beans, lack root (a kind of vegetable) and above all chili are grown on shifting cultivation and paddy fields, but only to a limited extent: less than 10% of all households plant these cash crops. Almost 70% of all households earn money through casual labor in the area or through seasonal labor migration. The second most important source of cash income is forest products, above all the sale of baskets and brooms made from bamboo and broom grass respectively. A broad range of other forest products are collected for cash income: firewood, timber for construction, fibers for weaving mats, herbal medicine, honey, flowers and stems of wild banana, orchids, mushrooms, wild vegetables and meat of wild animals. The dependence on forest products in the livelihood of Khupra villagers is considerable: Almost 40% of all households depend for their cash income partly on the sale of forest products, and over 90% of all households gather forest products for their own use and consumption.
17LAND USE AND CARBON
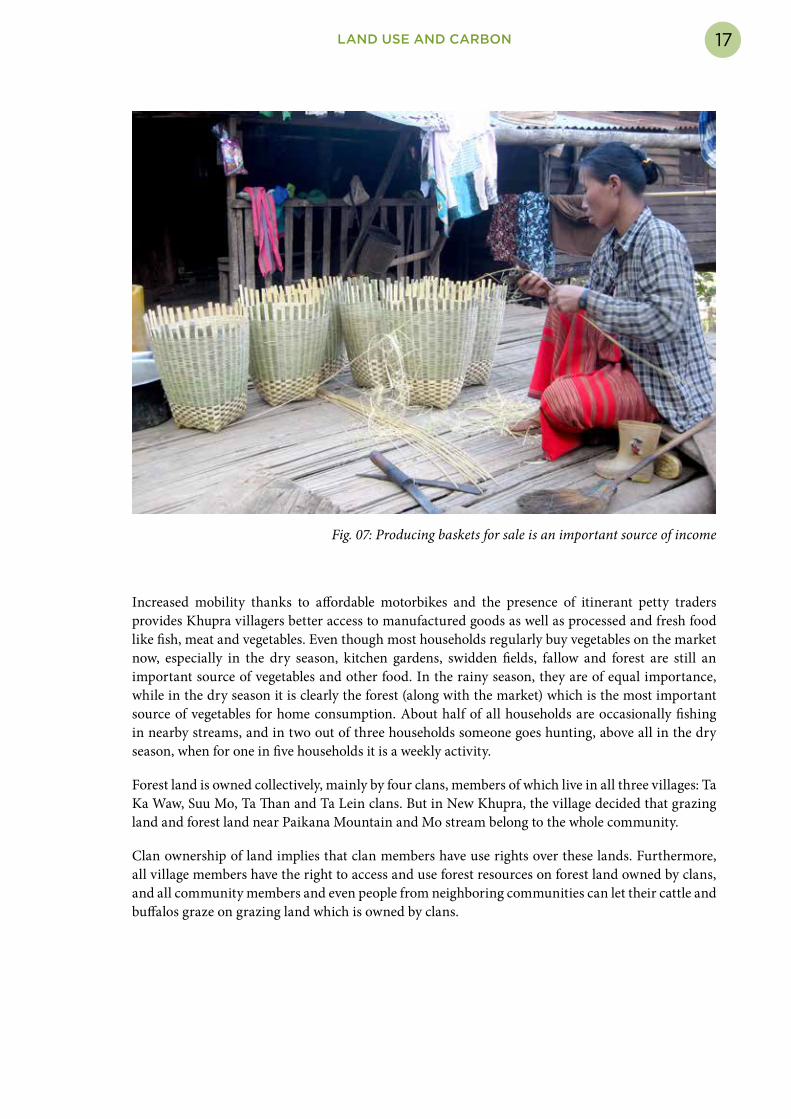
Fig. 07: Producing baskets for sale is an important source of income
Increased mobility thanks to affordable motorbikes and the presence of itinerant petty traders provides Khupra villagers better access to manufactured goods as well as processed and fresh food like fish, meat and vegetables. Even though most households regularly buy vegetables on the market now, especially in the dry season, kitchen gardens, swidden fields, fallow and forest are still an important source of vegetables and other food. In the rainy season, they are of equal importance, while in the dry season it is clearly the forest (along with the market) which is the most important source of vegetables for home consumption. About half of all households are occasionally fishing in nearby streams, and in two out of three households someone goes hunting, above all in the dry season, when for one in five households it is a weekly activity.
Forest land is owned collectively, mainly by four clans, members of which live in all three villages: Ta Ka Waw, Suu Mo, Ta Than and Ta Lein clans. But in New Khupra, the village decided that grazing land and forest land near Paikana Mountain and Mo stream belong to the whole community.
Clan ownership of land implies that clan members have use rights over these lands. Furthermore, all village members have the right to access and use forest resources on forest land owned by clans, and all community members and even people from neighboring communities can let their cattle and buffalos graze on grazing land which is owned by clans.

18 LAND USE AND CARBON
Fig. 08: Grazing land at Saphukanar
Two thirds of all household own cattle and/or buffalos, in total 121 heads of cattle and 35 buffalos. Some animals are kept near the house but most households let their livestock graze on the pastures which are collectively owned by the clans.
Over 70% of Khupra’s land area is covered by forest. However, most of this is fallow on shifting cultivation land and therefore subject to the forest succession dynamics resulting from this form of land use. Thus, while the vegetation cover on community, protected and spirit forests remain fairly stable, over 50% of the village territory is covered by a mosaic of secondary forest of between 1 and 14 years of age, the actual pattern of which is constantly changing as new areas are cleared and old fields are left fallow every year.
Around 17% of the land is under permanent forest. The community declared an area of 17.8 acres around the spring that is their water source as a protected forest. There are three small spirit forests14 and five old and new cemetery areas. In these forests any cutting of trees is forbidden and they are therefore the only remnants of old-growth forests.
A little over 20% of the land is used mainly for grazing. In parts of these areas forest is recovering and a few families started using small plots for shifting cultivation.

19LAND USE AND CARBON
Fig. 09: Forests provide many kinds of vegetable, herbs and spices throughout the year
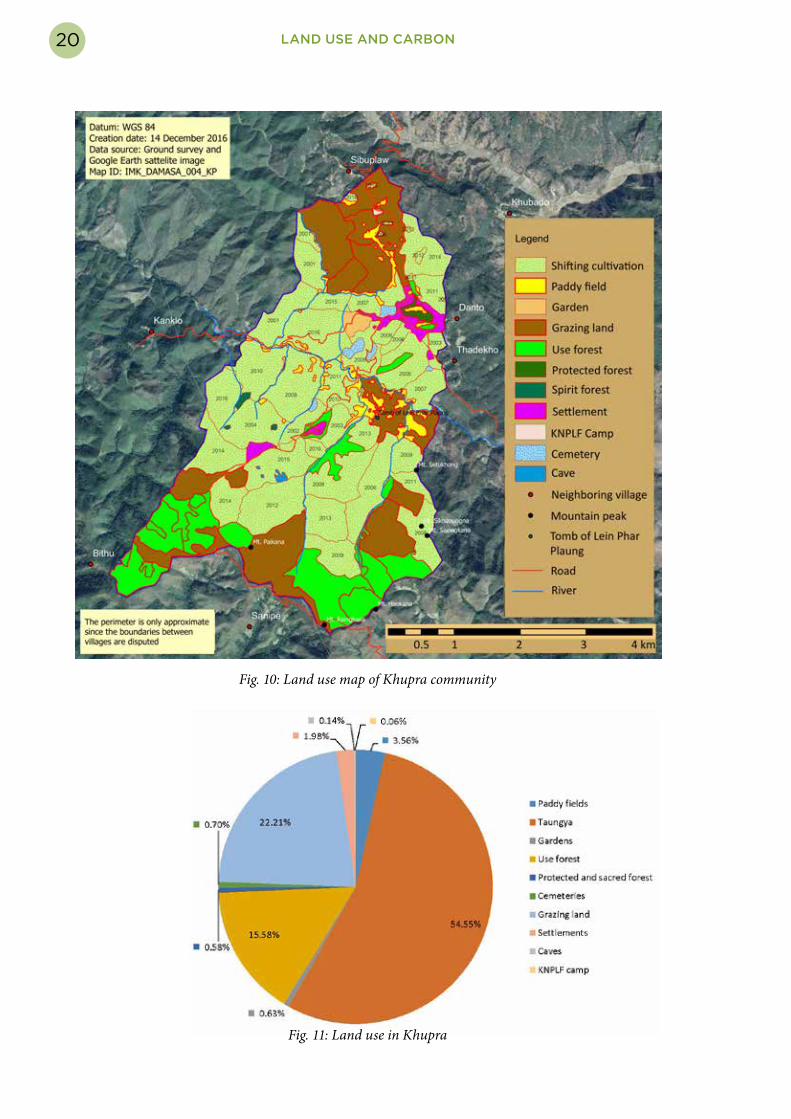
Table 01: Land use in Khupra
Land use Area (acres) ha %
Agricultural land Paddy fields (Sūena) 170.54 69.07 3.56Shifting cultivtion (Sue khu Sue kar) 2,613.47 1,058.46 54.55Gardens (Thoū tar phar) 30.15 12.21 0.63
Forest land Use forests (Thoūphar) 746.56 302.36 15.58
Protected and spirit forests (Kan Du) 27.66 11.20 0.58
Cemeteries (Lu khu) 33.53 13.58 0.70Other land
Grazing land (Bon Panan Kalan Ansar Gan) 1,064.00 430.92 22.21
Settlements (Doū) 95.03 38.49 1.98Caves (Lōn Ku) 6.54 2.65 0.14KNPLF camp 3.09 1.25 0.06
Total land area 4,790.57 1,940.18 100.00
20 LAND USE AND CARBON
Fig. 10: Land use map of Khupra community
Fig. 11: Land use in Khupra

21LAND USE AND CARBON
Fig. 12: Land use in Khupra. New swidden field and cemetery forest in the foreground, paddy fields in the valley below
Fig. 13: Land use in Khupra: Terraced fields and shifting cultivation fallow forests

22 LAND USE AND CARBON
Fig. 14: Phandain cemetery forest

23LAND USE AND CARBON
3. Land use and carbon
Sequestration of atmospheric carbon dioxide in vegetation and soil organic matter is an important factor affecting greenhouse gas concentration in the atmosphere. Therefore, any form of human land use that changes vegetation cover has an impact on the exchange of greenhouse gases between the atmosphere and terrestrial ecosystems. As land use changes, so does the balance between emission and sequestration of greenhouse gases, depending on the kind of vegetation cover resulting from land use change.
This is most obvious when a forest is cleared, as described in the 2000 report of the Intergovernmental Panel on Climate Change:
“…the carbon stocks in aboveground biomass are either removed as products, released by combustion, or decay back to the atmosphere through microbial decomposition. Stocks of carbon in soil will also be affected, although this effect will depend on the subsequent treatment of the land. Following clearing, carbon stocks in aboveground biomass may again increase, depending on the type of land cover associated with the new land use. During the time required for the growth of the new land cover –which can be decades for trees – the aboveground carbon stocks will be smaller than their original value.”15
Like in most parts of the world, almost all the original vegetation cover in Khupra village territory has been altered by centuries of human land use. The most drastic transformation occurred where forest was turned into permanent agricultural land like rice fields or grasslands for pastures.
The shift from forest to permanent land use implies the largest loss of carbon stock. Above ground carbon estimates in two of Khupra’s cemetery forests showed a very high stock of over 400 t/ha due to the high density of very large trees. These small residual forests may not be representative for the area’s original forests; thus a somewhat lower carbon stock value should be assumed. The above-ground carbon in Southeast Asian forests is reported to range from 40 to 400 t C/ha, with a center value of 220 t C/ha.16 For tropical seasonal forests in Asia, like those found in Khupra, the Intergovernmental Panel on Climate Change’s Guidelines for National Greenhouse Gas Inventories gives a range of 105-169 t C/ha.17
The above-ground carbon stock of grasslands, pastures and shrubs ranges from 3 to 35 t/ha18. Our carbon stock estimates of grazing land in Khupra range from 3.5 to 15.3 t C/ha, with an average of 7.25 t C/ha. So if we assume an average original forest carbon stock of 137 t C/ha (see footnote 17) the conversion to grasslands means a reduction of 94.7% of carbon stock. Continuous annual cropping systems, like paddy fields, have a carbon stock of 1 to 4 t C/ha19, which implies a carbon stock loss of 97.1 to 99.3% as forests were turned into paddy fields.
Land under shifting cultivation also has a reduced carbon stock compared to old-growth forests, but the loss is much smaller since most of the land is kept under fallow secondary forest. Based on our own field measurements we estimated the above-ground carbon stock in a 9 to 12 years old fallow forests to be between 90 and 95 t C/ha. This means that after the first clearing of the forest for a swidden field, when almost all of the original carbon stock is lost, there is a recovery of 65.7 to 69.3% of the original carbon stock by the time the fallow forest on that plot of land is old enough and ready for a new cropping cycle. At the landscape level, long-fallow systems of shifting cultivation, as
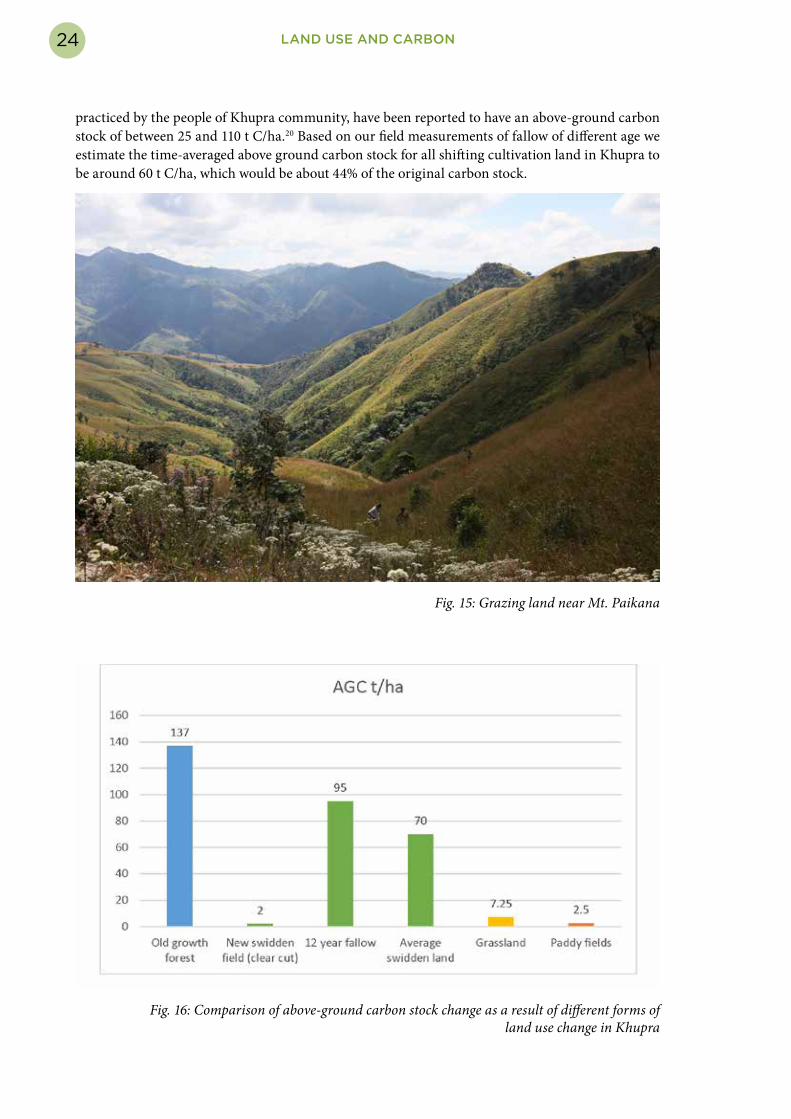
24 LAND USE AND CARBON
practiced by the people of Khupra community, have been reported to have an above-ground carbon stock of between 25 and 110 t C/ha.20 Based on our field measurements of fallow of different age we estimate the time-averaged above ground carbon stock for all shifting cultivation land in Khupra to be around 60 t C/ha, which would be about 44% of the original carbon stock.
Fig. 15: Grazing land near Mt. Paikana
Fig. 16: Comparison of above-ground carbon stock change as a result of different forms of land use change in Khupra

25LAND USE AND CARBON
Fig. 17. Shifting cultivation landscape: new swidden in the back, fallow forest of different age and paddy fields in the valley bottom
There is no doubt that the carbon stored in the vegetation covering Khupra’s territory today is much less than what it was before human settlement. However, the transformation of the landscape has been by far less drastic than what occurred in today’s densely settled rice-growing areas of Southeast Asia’s lowlands, where forests have almost completely disappeared. In the highlands they are still part of the landscape, despite hundreds of years of human settlement. In a landscape created by shifting cultivation we find a complex mosaic of forest, shrub and grassland, which is constantly changing, and along with it the carbon stock of its vegetation cover.
Shifting cultivationShifting cultivation is a form of land use practiced all over the world’s tropics and sub-tropics. It has been estimated that in Southeast Asia it is part of the livelihood of between 15 and 35 million people.21 Most of these people belong to ethnic groups that are generally subsumed under categories like ethnic minorities, tribal people, hill tribes, aboriginal people or indigenous peoples.
Shifting cultivation can be defined as a “land use system that employs a natural or improved fallow phase, which is longer than the cultivation phase of annual crops, sufficiently long to be dominated by woody vegetation, and cleared by means of fire”.22
In Myanmar, the commonly used term for shifting cultivation is taungya (taung meaning ‘hill’ and ya meaning ‘cultivation’). However, the term is not only used for shifting cultivation but for any form of agriculture on sloping land in the uplands. The more precise term for shifting cultivation in Burmese would be shwe pyaung taungya.23 In Kayan Hlahui, the language spoken in Khupra community, shifting cultivation is called soû khu soû kar which means “the field on the mountain.
26 LAND USE AND CARBON
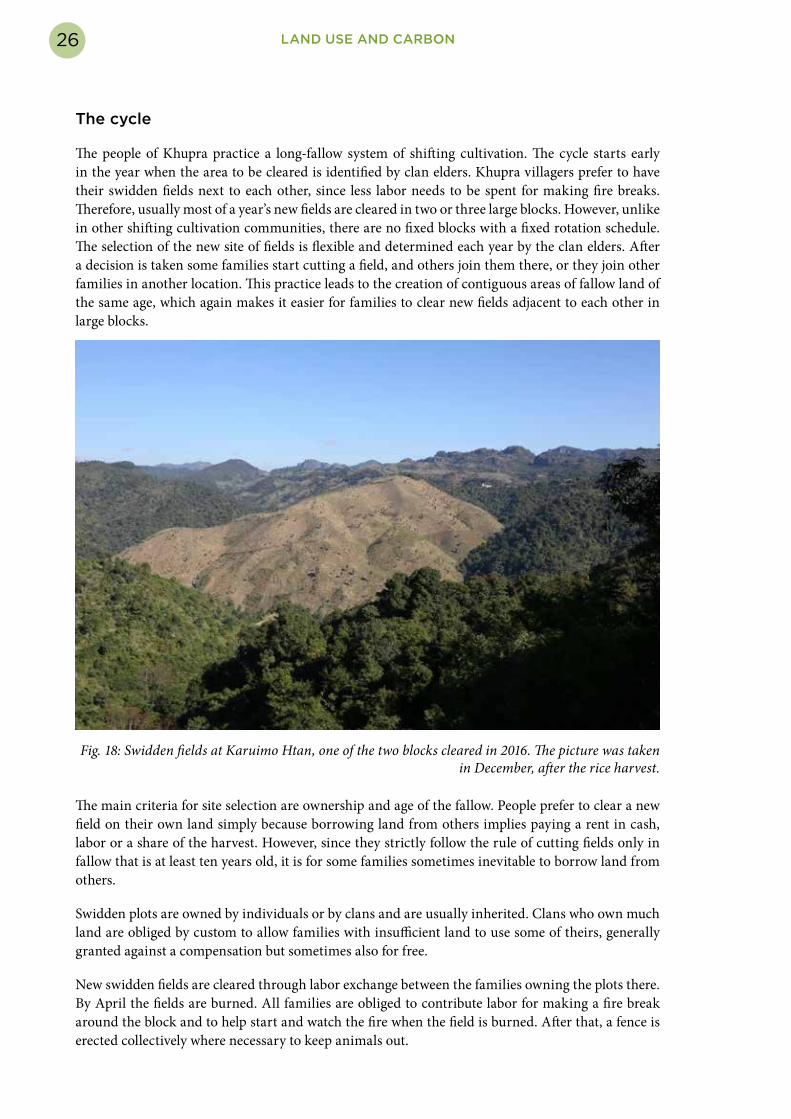
The cycle
The people of Khupra practice a long-fallow system of shifting cultivation. The cycle starts early in the year when the area to be cleared is identified by clan elders. Khupra villagers prefer to have their swidden fields next to each other, since less labor needs to be spent for making fire breaks. Therefore, usually most of a year’s new fields are cleared in two or three large blocks. However, unlike in other shifting cultivation communities, there are no fixed blocks with a fixed rotation schedule. The selection of the new site of fields is flexible and determined each year by the clan elders. After a decision is taken some families start cutting a field, and others join them there, or they join other families in another location. This practice leads to the creation of contiguous areas of fallow land of the same age, which again makes it easier for families to clear new fields adjacent to each other in large blocks.
Fig. 18: Swidden fields at Karuimo Htan, one of the two blocks cleared in 2016. The picture was taken in December, after the rice harvest.
The main criteria for site selection are ownership and age of the fallow. People prefer to clear a new field on their own land simply because borrowing land from others implies paying a rent in cash, labor or a share of the harvest. However, since they strictly follow the rule of cutting fields only in fallow that is at least ten years old, it is for some families sometimes inevitable to borrow land from others.
Swidden plots are owned by individuals or by clans and are usually inherited. Clans who own much land are obliged by custom to allow families with insufficient land to use some of theirs, generally granted against a compensation but sometimes also for free.
New swidden fields are cleared through labor exchange between the families owning the plots there. By April the fields are burned. All families are obliged to contribute labor for making a fire break around the block and to help start and watch the fire when the field is burned. After that, a fence is erected collectively where necessary to keep animals out.
27LAND USE AND CARBON
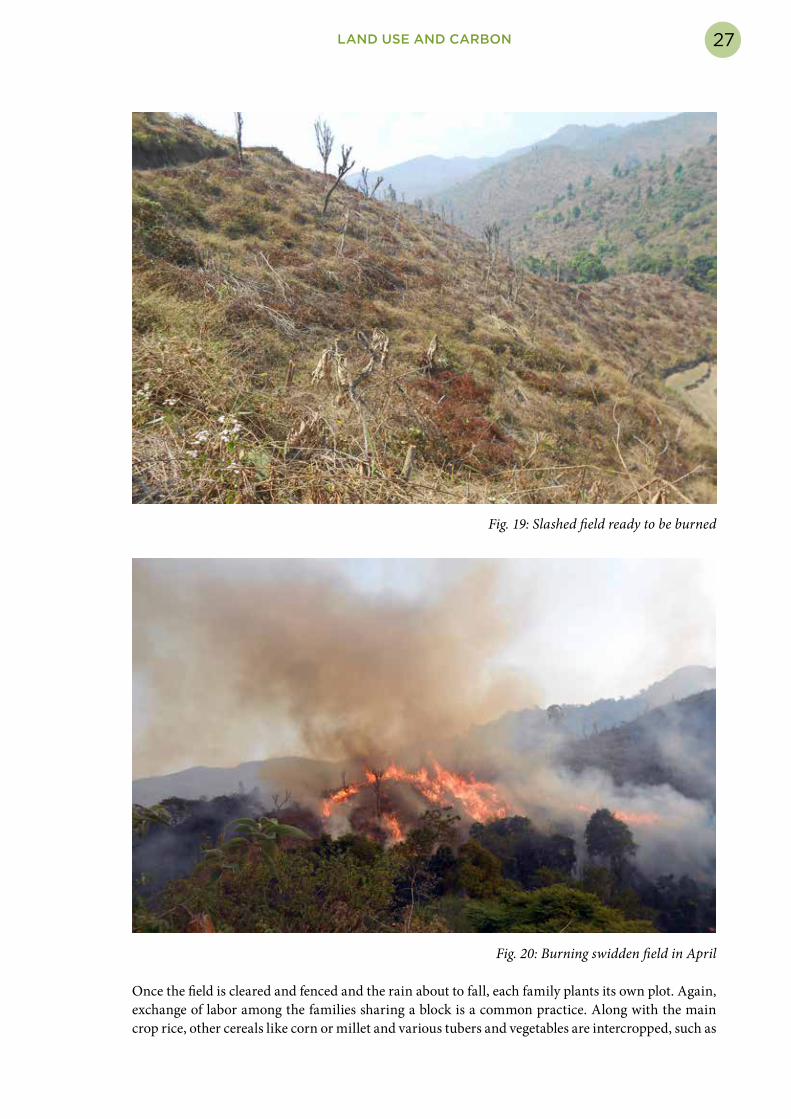
Fig. 19: Slashed field ready to be burned
Fig. 20: Burning swidden field in April
Once the field is cleared and fenced and the rain about to fall, each family plants its own plot. Again, exchange of labor among the families sharing a block is a common practice. Along with the main crop rice, other cereals like corn or millet and various tubers and vegetables are intercropped, such as

28 LAND USE AND CARBON
taro, yam, cucumber, pumpkin, mustard, lettuce, cilantro and beans. Some families may plant part of a field with cash crops like chilies.
Seeds are sown with the dibble method in small teams of a man and a woman. Usually, the man makes a shallow hole with the dibble stick in which the woman places the seeds. Compared to harrowing or plowing, this causes only minimal disturbance of the top soil and helps reduce soil erosion.
Fig. 21: Sowing rice with dibble method
During the growing season, fields need to be weeded at least two or three times. No chemical inputs are used in shifting cultivation in Khupra, but there is also no formal prohibition against it. The first vegetables can be harvested a few weeks after planting, corn in July and August, rice is harvested in November and millet in December.
Only rarely is a field used for a second year, when it is replanted with corn and other less demanding crops like chilies. Usually it is left fallow already after one season of use. Young fallow fields continue to provide tubers and some vegetables until the fields are completely taken over by secondary forest.
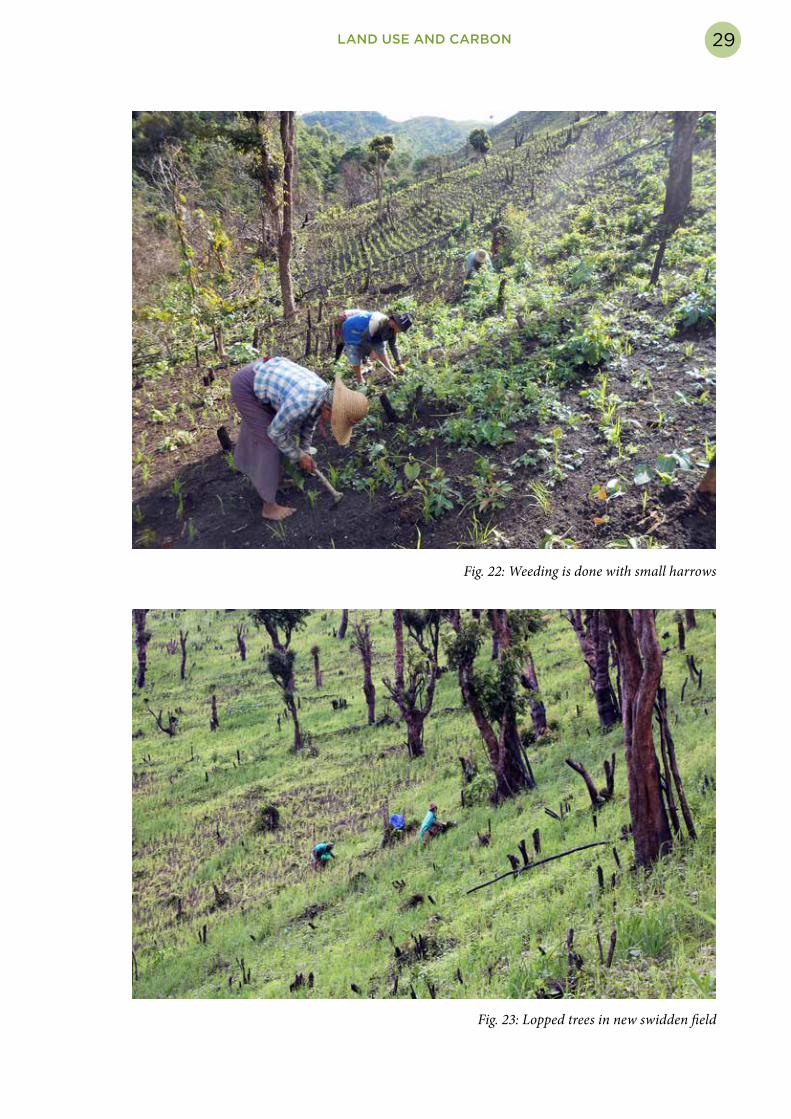
Khupra villagers never cut all trees in a field. They prefer to keep some larger trees and only lop the branches. Some smaller trees are also left standing and lopped, to provide support for beans or yam, and since many trees are cut a foot or two above the ground they start to grow shoots again from the root stock. This helps the forest fallow to establish itself very quickly. Many of the large trees have obviously survived many swidden cycles and have grown to a considerable size despite repeated lopping.
29LAND USE AND CARBON
Fig. 22: Weeding is done with small harrows
Fig. 23: Lopped trees in new swidden field
30 LAND USE AND CARBON
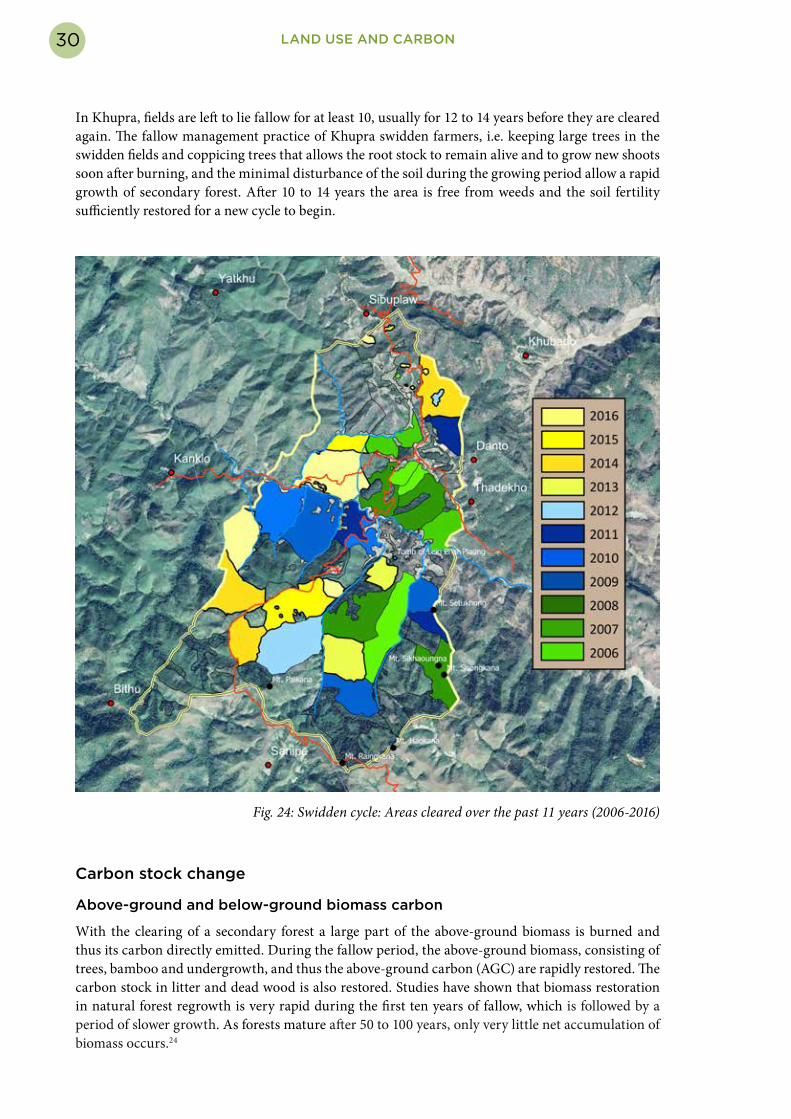
In Khupra, fields are left to lie fallow for at least 10, usually for 12 to 14 years before they are cleared again. The fallow management practice of Khupra swidden farmers, i.e. keeping large trees in the swidden fields and coppicing trees that allows the root stock to remain alive and to grow new shoots soon after burning, and the minimal disturbance of the soil during the growing period allow a rapid growth of secondary forest. After 10 to 14 years the area is free from weeds and the soil fertility sufficiently restored for a new cycle to begin.
The people of Khupra take precautions to make sure that the fallow is not accidentally destroyed by fire. If fire accidentally destroys fallow the vegetation has to be left to recover for another ten or more years before cultivation is possible in that area again.
Fig. 24: Swidden cycle: Areas cleared over the past 11 years (2006-2016)
Carbon stock change
Above-ground and below-ground biomass carbon
With the clearing of a secondary forest a large part of the above-ground biomass is burned and thus its carbon directly emitted. During the fallow period, the above-ground biomass, consisting of trees, bamboo and undergrowth, and thus the above-ground carbon (AGC) are rapidly restored. The carbon stock in litter and dead wood is also restored. Studies have shown that biomass restoration in natural forest regrowth is very rapid during the first ten years of fallow, which is followed by a period of slower growth. As forests mature after 50 to 100 years, only very little net accumulation of biomass occurs.24
31LAND USE AND CARBON
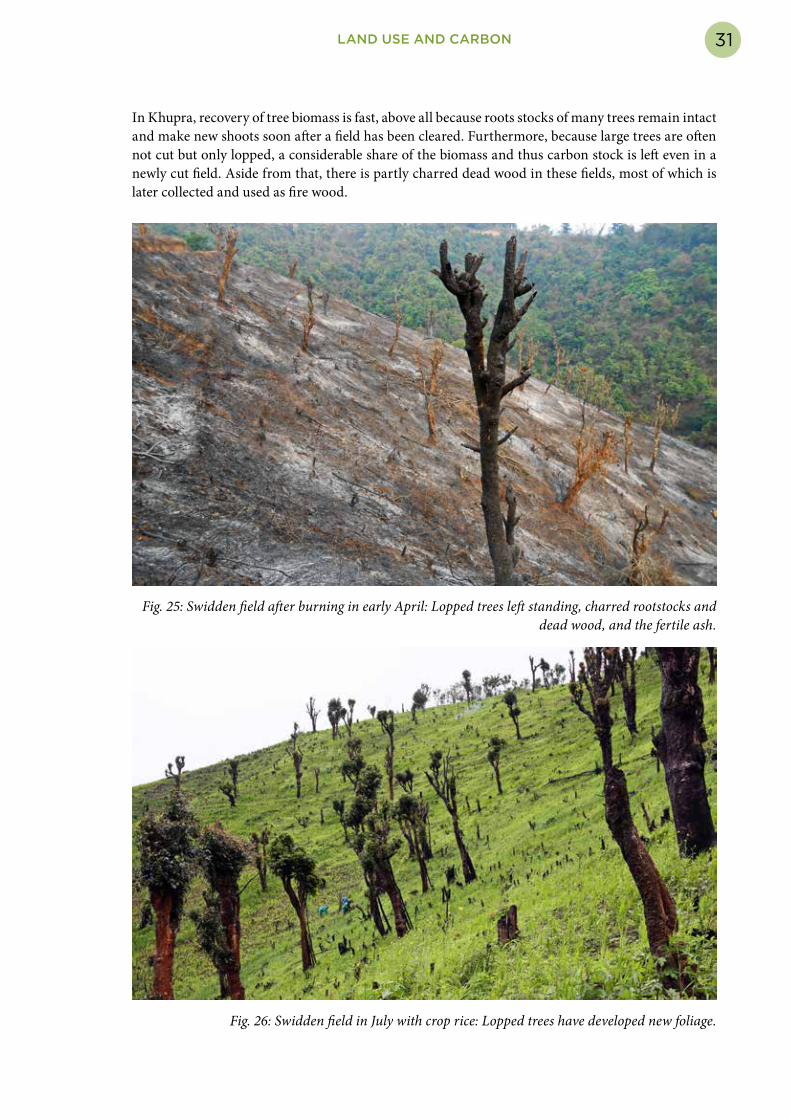
In Khupra, recovery of tree biomass is fast, above all because roots stocks of many trees remain intact and make new shoots soon after a field has been cleared. Furthermore, because large trees are often not cut but only lopped, a considerable share of the biomass and thus carbon stock is left even in a newly cut field. Aside from that, there is partly charred dead wood in these fields, most of which is later collected and used as fire wood.
Fig. 25: Swidden field after burning in early April: Lopped trees left standing, charred rootstocks and dead wood, and the fertile ash.
Fig. 26: Swidden field in July with crop rice: Lopped trees have developed new foliage.

32 LAND USE AND CARBON
Fig. 27: Swidden field after rice harvest in December: All over the field tree root stocks that remained alive made new shoots, allowing for fast recovery of fallow forest.
Table 2: Above-ground carbon stock in new field and fallow
Year AGC trees AGC bamboo
AGC under-growth*
AGC litter and dead wood**
AGC total
New field 28,820 2,000 1,489 32,309
2 years fallow 17,601 6,622 4,709 28,932
5 years fallow 111,706 2,329 4,292 118,326
6 years fallow 108,493 2,259 5,062 115,814
9 years fallow 52,706 37,565 1,671 3,031 94,973
12 years fallow 90,300 418 1,506 92,224
*In the new swidden field the “undergrowth” is the standing crop (rice etc.)** In the new swidden field there is no litter but some dead wood, while in fallow fields there is hardly any dead wood. Litter tends to decrease in old fallow probably because of decomposition into top soil
33LAND USE AND CARBON
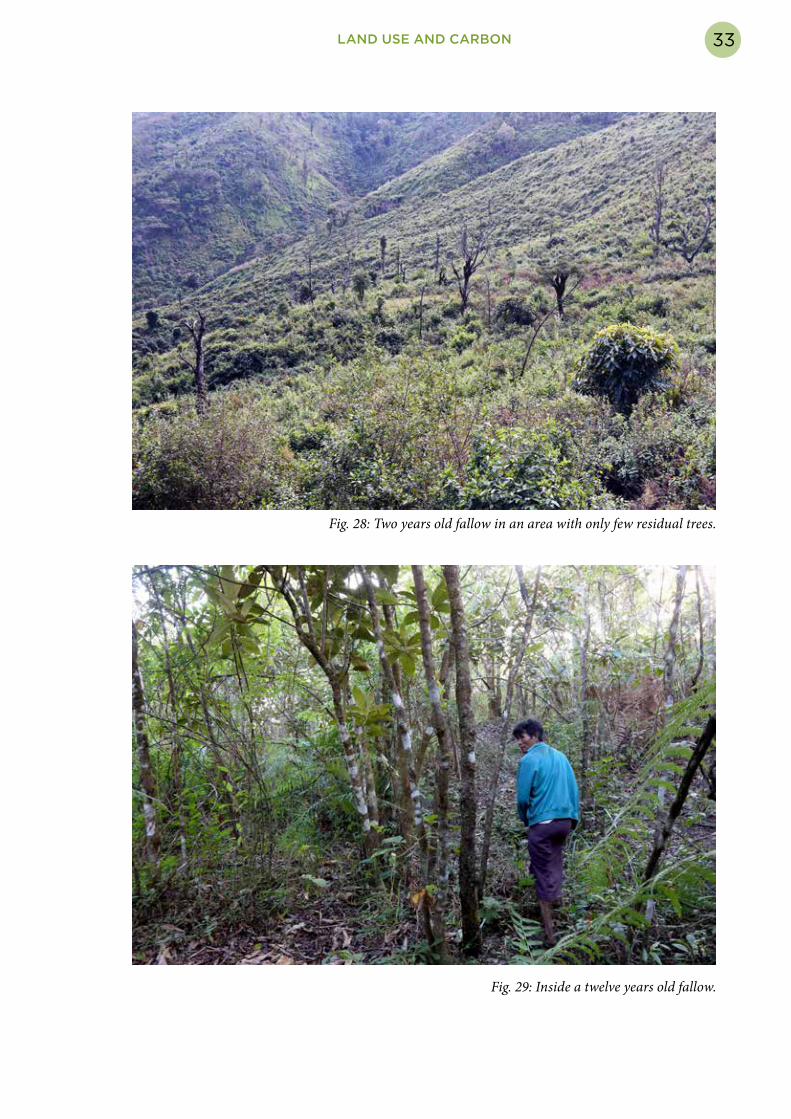
Fig. 28: Two years old fallow in an area with only few residual trees.
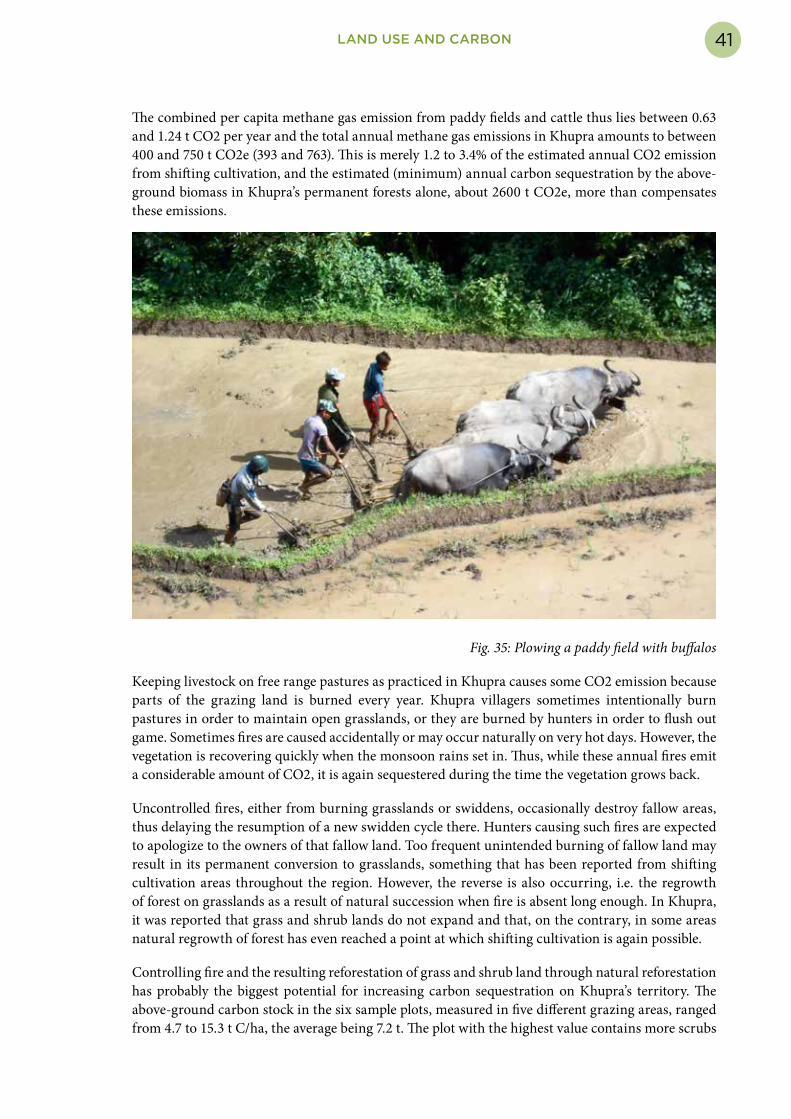
Fig. 29: Inside a twelve years old fallow.

34 LAND USE AND CARBON
The biomass and thus carbon content of the lopped trees that remain in a field can also be reasonably well estimated with the standard method use in forest carbon stock assessment.25 For the large field cleared in Karuimo Htan in 2016 the estimated carbon stock of these residual trees amounted to 28.8 t C/ha (see table 3).
It can be expected that the below-ground biomass of lopped trees is at least the standard 20% of the above-ground biomass, probably higher since the root system of the tree may not be much affected by the cutting of the branches. The total below-ground biomass of the whole field must be much larger since many of the coppiced trees remain alive and thus their root system intact. However, it is very difficult to estimate the below-ground biomass of these trees since right after the clearing of a field it cannot be predicted which coppiced trees will remain alive and how much of the root biomass remains intact after coppicing. In any case, a swidden field with as many lopped and coppiced trees as the one measured in Karuimo Htan will have a combined above-ground and below-ground carbon stock from remaining tree biomass well over 30 t C/ha. This is much more than the above-ground and below-ground carbon stock of the planted crop (rice, tubers, vegetables etc.) and the little dead wood that was left in the field. The above-ground carbon stock of the standing crop is not likely to exceed 2 t C/ha,26 and the corresponding below-ground stock will not be more than 0.4 t C/ha. Dead wood was estimated to be around 1.5 t C/ha, some of which may however still have been collected and used as fire wood (see table 2).
The presence of residual trees also explains the high carbon stock of some of the young fallow forests. The total carbon stock measured in 5 and 6 years old fallow exceed the stock of the 9 and 12 years old fallow because they contain more large residual trees, some of them over 40 cm diameter at breast height. In the 2-year old fallow, residual trees make up 37%, in the five and six years old fallow 40 to 50% of the biomass and thus carbon stock, as compared to about 18% and 25% for the 9 and 12 years old fallow fields respectively.27
Table 3. Share of AGC of residual tree in total AGC in fallow forests
Year AGC total AGC residual trees
% of AGC total
New field 32,309 28,820 89.2%
2 years fallow 28,932 10,773 37.2%
5 years fallow 118,326 58,115 49.1%
6 years fallow 115,814 47,075 40.6%
9 years fallow 94,973 17,008 17.9%
12 years fallow 92,224 22,932 24.9%

35LAND USE AND CARBON
Fig. 30: Young fallow with lopped large residual trees in the background.
Fig. 31. Above-ground carbon stock
Due to the presence of residual trees in the newly cleared swidden field at Karuimo Htan the AGC stock was still around 30% of the AGC of a mature fallow forest. This may not be as high in all cleared fields since not all of them contain as many residual trees. But in any case, without the conscious fallow management of Khupra farmers, who make an effort to preserve trees in their fields, the AGC stock of new fields and, subsequently, the fallow would be much lower. A new field would probably have not more than 2 tons C/ha,28 and a mature fallow maybe have around 70 t C/ha instead of the measured 90 to 95 t AGC.

36 LAND USE AND CARBON
Soil carbon
The analysis of the soil samples collected from the top 30 cm in the six swidden areas in Khupra showed a content of organic matter of between 4.16% (the new swidden field) and 5.69%. An organic matter content of 3 to 5% is considered “relatively high” for tropical upland soils.29 Consequently, the carbon content of the soils on shifting cultivation land in Khupra is also fairly high, ranging from 47 t C/ha to over 64 t C/ha. These are similar to soil carbon stocks measured in shifting cultivation fallow elsewhere in the region.30
Table 4: Soil organic matter and soil carbon
Year Organic matter
Soil carbon kg/ha
New field 4.16 47,012 2 years fallow 5.66 63,997 5 years fallow 4.65 50,630 6 years fallow 4.66 52,741 9 years fallow 4.63 52,405 12 years fallow 5.69 64,365
Fig. 32: Soil carbon stock in new fields and fallow
Like with regards to biomass carbon stock, we were not able to directly measure and document the stock change of soil carbon in a particular field over a whole swidden cycle. We could only analyze soils in fallow fields of different age and compare them. This method has its limitations since the properties of soils can vary greatly even within a small area, particularly in the mountains, due to different geological and microclimatic conditions. This may, for example, explain the exceptionally high carbon content in the soil of the 2 years old fallow.

37LAND USE AND CARBON
The results of the soil analysis for the six areas do not show great differences between soils of fallow of five to nine years. Also, the organic matter and carbon of the soil of a the new swidden field, which had been burned three months before the soil samples were taken, is still high, only about 10% less than in the soils of older fallow and 17% less than the exceptionally high content in the 12 years old fallow measured.
Soil carbon makes up over 50% of the total carbon in the newly cut field. In fallow fields with higher above-ground biomass, soil carbon is still around 30% of the total carbon stock.
Table 5: Soil carbon and total carbon stock
Year Soil carbon kg/ha
Total carbon stock kg/ha
% of total carbon
New swidden field 47,012 85,484 55.0%2 years fallow 63,997 102,498 62.4%5 years fallow 50,630 191,763 26.4%6 years fallow 52,741 190,706 27.7%9 years fallow 52,405 165,767 31.6%12 years fallow 64,365 174,728 36.8%
Fig. 33: Share of soil carbon in total carbon stock

38 LAND USE AND CARBON
*
Like in all long-fallow systems of shifting cultivation carbon stock on Khupra’s swidden land is undergoing rapid changes: a radical reduction when the field is cleared is followed by a rapid recovery during biomass regrowth in the fallow period. Due to the effective fallow management of Khupra swidden farmers a fairly large permanent stock of carbon in the form of residual trees, root stocks and soil carbon is retained throughout the cycle. Therefore, the total carbon stock on Khupra’s shifting cultivation land must be fairly high.
We estimate the time-averaged above-ground carbon stock for Khupra’s swidden land under a 12-year cycle to be around 60 t C/ha.31 With the corresponding below-ground biomass carbon of 1/5 of the above-ground stock and the average 50 t C/ha for soil carbon the average carbon stock for Khupra’s swidden land would amount to roughly 120 t C/ha. This means that Khupra’s 1057 ha (2613 acres) of shifting cultivation land stores around 127,000 tons of carbon (which corresponds to 470,000 t CO2),32, probably much more.
Carbon emission and sequestration
In shifting cultivation carbon emission occurs mostly at the time of burning of the newly cleared field. The actual amount of biomass burned is difficult to estimate and it varies according to how well the field is burned in a particular year, which is a major concern of all shifting cultivators. They all prefer a clean burn which means less work for cleaning up before sowing the field, and more nutrient rich ash.33 Unsuccessful burning of the slashed biomass causes a lot of additional work as the remaining debris has to be heaped up and burned again. Large stems and branches never burn completely, but are a valuable source of fire wood. Three months after the burning of the new swidden field iat Karuimo Htan, which lies quite close to Old Khupra, there was hardly any wood left lying in the field as almost all had already been brought to the village.
As already pointed out, when clearing a field, many large trees are left standing and only their branches are lopped. The swidden field cleared in 2016 at Karuimo Htan thus still had an above-ground carbon stock of 28 t C/ha. Assuming that the field prior to clearing had an above-ground carbon stock of around 95 t C/ha, like measured for a 9 to 12 years old fallow area, and that all the rest of the newly cut swidden field’s carbon stock is emitted through burning and decomposition, the carbon emission from shifting cultivation in Khupra would be between 67 t C/ha for fields with residual trees left standing and up to 95 t C/ha for fields in which all trees are cut. This would be equivalent to between 245.89 and 348.65 tons of CO2 per ha.
The total area cleared for swidden fields in all of Khupra varies from year to year.34 Estimates for the past 10 years range from 120 to 280 acres (48 to 114 ha), with an average of 219 acres (88.7 ha). The average is just about what we would expect for a fallow cycle of 12 years: 1/12 of the total shifting cultivation area in Khupra is 88 ha (218 acres). Therefore, if we assume that on average 1/12 of the shifting cultivation area is cleared, this would amount to between 21,638 t CO2 (with many residual trees) and a maximum of 30,681 t CO2 (for a clear-cut field) for all of Khupra community, or about 35 to 50 t CO2 per capita per year.
However, all this carbon is again sequestered during the ensuing 10 to 14 years long fallow period. This observation is supported by findings of recent studies, which conclude that long-fallow shifting cultivation can be carbon neutral or even positive, i.e. sequester more carbon than they emit.35

39LAND USE AND CARBON
Fig. 34: Long-fallow shifting cultivation landscape: Satellite image of the South-eastern part of Khupra’s territory, showing the mosaic of fallow, forests and grazing land.
A similar scenario is very likely with regards to below-ground carbon, particularly soil carbon. Carbon emission resulting from decomposing organic matter in the soil during the cultivation period seems to be quite limited as soil carbon in new fields were found to be only about 10% lower than that of an old fallow, and it is likely that the soil carbon lost during the cultivation period recovers during the fallow period. This observation is also in line with the findings of various recent expert studies:
Several studies looking at the whole fallow–cropping cycle of swidden systems in Borneo have found SOC contents to be unaffected by swiddening (Bruun et al. 2006; Kleinman et al. 1996; Mertz et al. 2008). In another study from Borneo, de Neergaard et al. (2008) found that neither SOC concentration (%) nor total content was affected by swiddening in soil layers down to 90 cm depth. Similar findings are reported by Sommer et al. (2000), who examined the upper 6 m of an Ultisol in Brazil36
The length of the fallow is critical for maintenance of soil carbon levels. A comprehensive review of research on the impacts of shifting cultivation on tropical forest soil found that shorter fallow time does not allow for the entrance of new carbon into the soil organic carbon and that the system begins to emit carbon into the atmosphere. However, in longer fallow “time allows for the entrance of new C into the SOC. The system begins to capture C from the atmosphere”.37
The review concludes that shifting cultivation cannot be considered “to be unsustainable per se in relation to the soil system dynamics” and that the causes that may lead to the unsustainability of shifting cultivation “are related to the social, economic, political, and cultural changes that affect the communities that subsist on this agricultural practice” that may “cause the resilience capacity of the

40 LAND USE AND CARBON
soils to be surpassed”.38
A study among the Dayak in West-Kalimantan, Indonesia, found that the long-fallow shifting as practiced by the Dayak even “makes soils more fertile than those in undisturbed primary forest”.39 The researcher found her findings “’surprising,’ [ ] because they contradict negative perceptions of ‘slash and burn’ methods that the Dayaks themselves employ to clear land.”40
Other sources of greenhouse gas emissions: Forestry, paddy fields and cattleSmall-scale logging for house construction, cutting of firewood and harvesting of other forest products in Khupra’s use forests and fallow land inevitably result in CO2 emissions. While some of the carbon removed is at least temporarily stored in the form of buildings, furniture, tools etc., part of it is directly emitted when waste decomposes or wood is burned. To measure or just estimate the emissions caused by the extraction of forest products in Khupra is a very difficult task, which we did not try to undertake. However, it is safe to assume that compared to the emissions from other forms of land use, e.g. the annual burning of swidden fields or grazing land, the amount is small and it can be expected that it is well offset by carbon sequestration in Khupra’s forest and fallow land.
Except for the small areas of spirit forests and cemetery forests, which are the only remnants of old-growth forests, Khupra’s permanent forest land is covered by secondary forests. These forests have partly been used for swidden farming in the past and they are generally very similar to old swidden fallow, also with respect to biomass and carbon stock. But carbon sequestration is slower in older forests. While carbon sequestration rates in above-ground biomass during the first ten years of fallow have been reported to be between 4 and 12, or even 4 to 20 t C/ha per year (the average being 3.8 and 5.7 respectively), for 12 year old fallow and primary seasonal forests they are 2.2 and 2.4 t C respectively. If we assume an annual carbon sequestration rate of just 2.2 t C/ha, the above-ground biomass of the 327 ha of permanent forest in Khupra would sequester 719 t C per year, which corresponds to 2649 t CO2.
Methane is a greenhouse gas that is 21 to 23 times more potent than CO2.41 Paddy fields and cattle are the main sources of human induced methane emissions. Since we were not able to directly measure the amount of methane emitted from Khupra’s paddy fields and its livestock we can only make a rough estimate based on published data from other research.
The amount of methane emitted by paddy fields varies considerably. Measurements in Chiang Mai, Northern Thailand showed a range of between 90 and 210 kg/ha and season.42 Numerous factors, like land use and irrigation techniques, temperature, soil condition, fertilizers applied etc. determine the rate of methane emission. Assuming a methane emission rate of 90 to 210 kg/ha and a CO2 conversion factor of 23, the 69 ha (170.54 acres) of paddy fields in Khupra emit between 143 and 333 t CO2 equivalent per year. For the 619 residents of Khupra this will be between 0.23 and 0.54 t CO2 equivalents per year. Direct offsetting on paddy fields through sequestration is minimal since the above-ground carbon stock of fully developed paddy fields is comparable small (2 to 4 t C/ha) and mostly removed and consumed by people and cattle or burned after harvest.
Khupra villagers own 121 heads of cattle and 35 buffalos. On average, cattle emit between 70 and 120 kg of methane per year.43 Thus, the 156 heads of cattle are causing an emission of between about 250 and 430 t CO2 equivalents per year, or 0.4 to 0.7 t CO2e per person in Khupra village.
41LAND USE AND CARBON
The combined per capita methane gas emission from paddy fields and cattle thus lies between 0.63 and 1.24 t CO2 per year and the total annual methane gas emissions in Khupra amounts to between 400 and 750 t CO2e (393 and 763). This is merely 1.2 to 3.4% of the estimated annual CO2 emission from shifting cultivation, and the estimated (minimum) annual carbon sequestration by the above-ground biomass in Khupra’s permanent forests alone, about 2600 t CO2e, more than compensates these emissions.
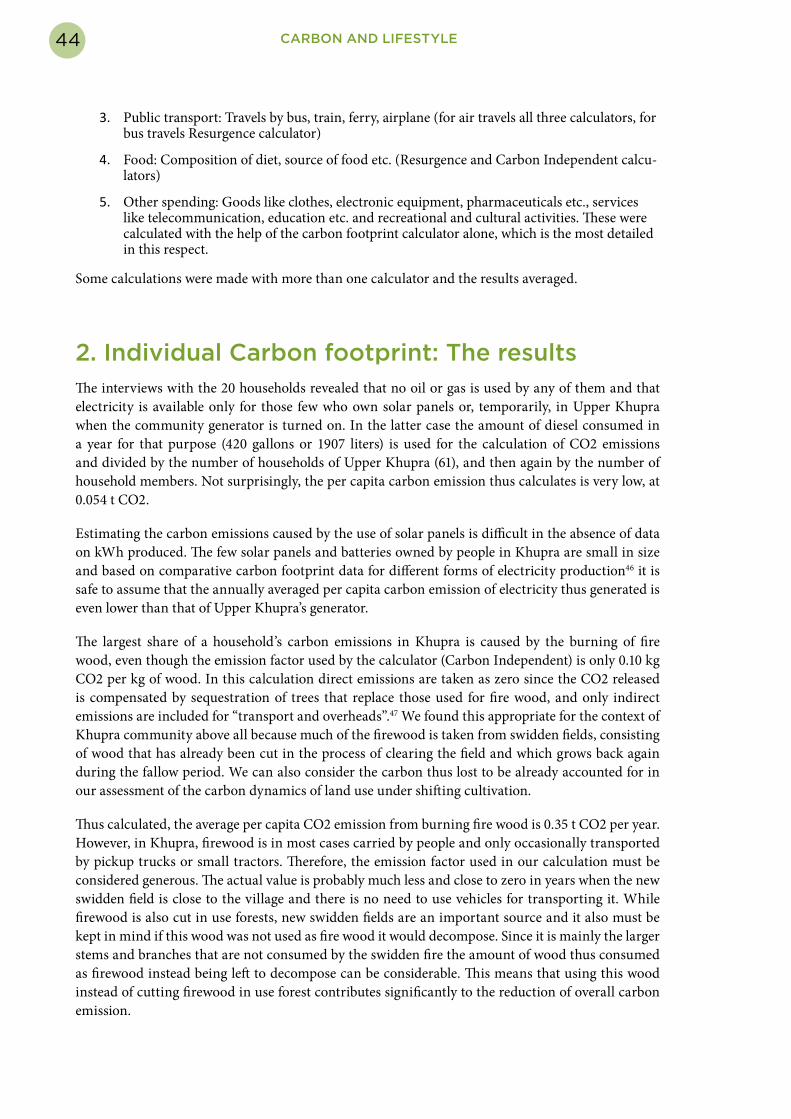
Fig. 35: Plowing a paddy field with buffalos
Keeping livestock on free range pastures as practiced in Khupra causes some CO2 emission because parts of the grazing land is burned every year. Khupra villagers sometimes intentionally burn pastures in order to maintain open grasslands, or they are burned by hunters in order to flush out game. Sometimes fires are caused accidentally or may occur naturally on very hot days. However, the vegetation is recovering quickly when the monsoon rains set in. Thus, while these annual fires emit a considerable amount of CO2, it is again sequestered during the time the vegetation grows back.
Uncontrolled fires, either from burning grasslands or swiddens, occasionally destroy fallow areas, thus delaying the resumption of a new swidden cycle there. Hunters causing such fires are expected to apologize to the owners of that fallow land. Too frequent unintended burning of fallow land may result in its permanent conversion to grasslands, something that has been reported from shifting cultivation areas throughout the region. However, the reverse is also occurring, i.e. the regrowth of forest on grasslands as a result of natural succession when fire is absent long enough. In Khupra, it was reported that grass and shrub lands do not expand and that, on the contrary, in some areas natural regrowth of forest has even reached a point at which shifting cultivation is again possible.
Controlling fire and the resulting reforestation of grass and shrub land through natural reforestation has probably the biggest potential for increasing carbon sequestration on Khupra’s territory. The above-ground carbon stock in the six sample plots, measured in five different grazing areas, ranged from 4.7 to 15.3 t C/ha, the average being 7.2 t. The plot with the highest value contains more scrubs

42 LAND USE AND CARBON
and young trees and has a similar carbon stock like some plots of 2 years old fallow. Allowing the forest in these areas to recover further could probably lead to an eight to ten time higher biomass within a ten years period.
Fig. 36: Regenerating grazing land
There is an increasing awareness among Khupra villagers of the need to conserve forest, which is reflected, for example, in the decision of New Khupra to declare part of the former gazing and swidden land as community forest. Biomass and thus carbon stock in these areas will certainly increase over the coming years.
*
Shifting cultivation is the main source of carbon emission in land use of Khupra villagers, but under the long-fallow system practiced in this community all this carbon – and maybe, as other research suggests, even more than that – is sequestered by the fallow vegetation, i.e. in land use by shifting cultivation there is a direct offset of carbon emission. Such direct emission offsetting also happens on grazing land, when burned vegetation recovers during the ensuing months or years, and for the harvesting of forest products in Khupra’s use forests (timber for construction, fire wood, other non-timber forest products).
Furthermore, other direct or indirect greenhouse gas emissions, i.e. methane gas from paddy fields and livestock are offset by sequestration in Khupra’s permanent forests. Natural reforestation occurring on grazing land also seems to increase carbon stock. Therefore, at the landscape level, there is most likely a positive carbon balance under the present land use system in Khupra.
However, the question is also how much carbon emission is caused by activities other than those related to land use, and whether these are of a magnitude that can also be compensated by the sequestration capacity of Khupra’s territory. To find an answer to these questions an assessment of the individual live-style related carbon footprint is needed.

43
II. Carbon and lifestyle: Khupra farmers’ carbon
footprintAlmost all the people in Khupra are farmers living off the land and resources of their community. But people here are not pure subsistence farmers and depend on regular cash income, a large part of which comes from casual labor and temporary labor migration. Also, nowadays Khupra villagers have better access to the market not just for selling their products but also for buying goods, most own motorbikes, some have cars, small tractors or generators for electricity. All this causes direct and indirect carbon emissions, which have to be taken into account when assessing the size of their “carbon footprint”.
1. Using on-line carbon calculatorsOn-line carbon calculators offer the possibility to estimate one’s personal carbon footprint. As already mentioned, an evaluation of the 15 most popular online carbon footprint calculators found that the majority of these calculators had significant shortcomings.44 Furthermore, they are all designed for people living in developed countries with a mostly urban lifestyle and could not be easily applied to the situation of Khupra villagers. However, we found that each of them seem to have certain advantages and disadvantages, that certain components of some of these calculators appeared to be useful for our purpose and that through a combination of three of them – the calculator of Carbon Independent, the Resurgence calculator developed by Resurgence and the Ecologist, and the calculator of carbon footprint45 – a reasonable assessment of Khupra villagers’ individual carbon footprint should be possible. Based on the selection of different components of these three calculators a questionnaire was developed and used in interviews in 20 households. The selection of these households was not entirely random since we wanted to make sure that some of those household were included which were rather exceptional, i.e., who possess a car or whose members went for work abroad.
The following lifestyle aspects were covered and analyzed with the help of the three on-line calculators.
1. Household use of energy: Electricity, gas, oil, fire wood (Resurgence and Carbon Indepen-dent calculators)
2. Private transport: Private car, motorbike and others (tractor) (Resurgence and carbon foot-print calculators)
44 CARBON AND LIFESTYLE
3. Public transport: Travels by bus, train, ferry, airplane (for air travels all three calculators, for bus travels Resurgence calculator)
4. Food: Composition of diet, source of food etc. (Resurgence and Carbon Independent calcu-lators)
5. Other spending: Goods like clothes, electronic equipment, pharmaceuticals etc., services like telecommunication, education etc. and recreational and cultural activities. These were calculated with the help of the carbon footprint calculator alone, which is the most detailed in this respect.
Some calculations were made with more than one calculator and the results averaged.
2. Individual Carbon footprint: The resultsThe interviews with the 20 households revealed that no oil or gas is used by any of them and that electricity is available only for those few who own solar panels or, temporarily, in Upper Khupra when the community generator is turned on. In the latter case the amount of diesel consumed in a year for that purpose (420 gallons or 1907 liters) is used for the calculation of CO2 emissions and divided by the number of households of Upper Khupra (61), and then again by the number of household members. Not surprisingly, the per capita carbon emission thus calculates is very low, at 0.054 t CO2.
Estimating the carbon emissions caused by the use of solar panels is difficult in the absence of data on kWh produced. The few solar panels and batteries owned by people in Khupra are small in size and based on comparative carbon footprint data for different forms of electricity production46 it is safe to assume that the annually averaged per capita carbon emission of electricity thus generated is even lower than that of Upper Khupra’s generator.
The largest share of a household’s carbon emissions in Khupra is caused by the burning of fire wood, even though the emission factor used by the calculator (Carbon Independent) is only 0.10 kg CO2 per kg of wood. In this calculation direct emissions are taken as zero since the CO2 released is compensated by sequestration of trees that replace those used for fire wood, and only indirect emissions are included for “transport and overheads”.47 We found this appropriate for the context of Khupra community above all because much of the firewood is taken from swidden fields, consisting of wood that has already been cut in the process of clearing the field and which grows back again during the fallow period. We can also consider the carbon thus lost to be already accounted for in our assessment of the carbon dynamics of land use under shifting cultivation.
Thus calculated, the average per capita CO2 emission from burning fire wood is 0.35 t CO2 per year. However, in Khupra, firewood is in most cases carried by people and only occasionally transported by pickup trucks or small tractors. Therefore, the emission factor used in our calculation must be considered generous. The actual value is probably much less and close to zero in years when the new swidden field is close to the village and there is no need to use vehicles for transporting it. While firewood is also cut in use forests, new swidden fields are an important source and it also must be kept in mind if this wood was not used as fire wood it would decompose. Since it is mainly the larger stems and branches that are not consumed by the swidden fire the amount of wood thus consumed as firewood instead being left to decompose can be considerable. This means that using this wood instead of cutting firewood in use forest contributes significantly to the reduction of overall carbon emission.

45CARBON AND LIFESTYLE
Fig. 37: Firewood that has been brought from the swidden field
18 of the 20 households interviewed own a motorbike. Only two own a car and one a small tractor, the engine of which is also used for milling rice. Annual mileage and estimated fuel consumption were used to calculate the CO2 emissions from private transport. Car emissions were divided by two since in most cases more than one, usually several people are using a car together. For motorbike emissions the full value was taken even though in many cases two or even more people ride on a motorbike. On average a per capita emission of 0.2 t CO2 was calculated for private transport by motorbike and 0.01 t CO2 for private car transport.
Khupra villagers travel regularly to nearby Lobakhu and Demoso, mostly to attend the weekly market, and occasionally to the state capital Loikaw. Most of them use their motorbike, but some use the transport service offered by pickup truck owners. A few have used the bus to travel to more distant destinations like Yangon or Pathein. In three households a member travelled by bus and airplane to Singapore for work. CO2 emissions caused by travels with public transport are calculated on the basis of mileage. These range from a modest 0.05 t CO2 for infrequent use of buses, to 0.87 t CO2 in the case of a leader who is traveling quite often to attend meetings, or the 1.03 t CO2 of those who travelled by bus and airplane to Singapore. The calculated average for travels by bus is 0.14 t CO2 and for flights 0.09 t CO2.
For the calculation of indirect CO2 emissions from food consumption, the main criteria are how regular meat and dairy products are consumed, the source of food (locally produced or not), how it is produced (organically or not), whether it is processed and packed and how much is wasted. Today, Khupra villagers have more access to processed and packaged food as well as meat and fish from the market, and these have become a regular part of their diet. However, the majority still cover most of their dietary needs with products from their own fields and gardens or the forest, or from purchased food that has been produced locally. The average carbon footprint for food consumption in Khupra is 0.61 t CO2, with a majority of having low values of around 0.5 t and a few people, who are more well-to-do and are traveling more often (and thus eating out), of up to 1.7 t.

46 CARBON AND LIFESTYLE
Fig. 38: Fire place in an Old Khupra kitchen: Preparing a meal and instant coffee. Pork bought on the market is being smoke-dried.
CO2 emissions caused by the consumption of other goods, services and recreational and cultural activities were estimated with the help of only one calculator (carbon footprint). The basis for the calculation are the annual expenses for the following categories: food and drink products, pharmaceuticals, clothes, textiles and shoes, paper based products (e.g. books, magazines, newspapers), computers and IT equipment, television, radio and phone (equipment), motor vehicles (not including fuel costs), furniture and other manufactured goods, hotels, restaurants etc., telephone, mobile/cell phone call costs, banking and finance (mortgage and loan interest payments), insurance, education, recreational, cultural and sporting activities.
Expenses were made by one or the other household on all of these categories except on IT equipment. Nobody in the households included in the sample bought a computer or any other IT equipment. The amount spent by Khupra villagers on consumer goods, services and cultural activities over the past year varies considerably between households, ranging from 246 to 3771 US$ for a household which bought a second-hand car. Aside from such high one-time expenses, the highest regular expenses are for food, ranging from 84 to 1210 US$ and an average of 498 US$ per year. Expenses for cultural activities are for social events like church related activities and celebrations. With an average of 1391 US$ per year, per-capita expenses for all consumer goods, services and cultural activities and the corresponding CO2 emissions are very low: an average of 0.21 t CO2 per year.
Finally, a standard share for public services, infrastructure, defense etc. was added. The standard share used by the Carbon Independent calculator and the Resurgence calculator are 1.1 t CO2 and 1 t CO2 per year respectively. However, these are shares for the context of the United Kingdom. Given the low level of development in Myanmar, the overall rather poor infrastructure and public services, and the lack of access to these for many rural communities, only half of this, i.e. 0.5 t CO2 per person and year was included in our calculation. For a remote community such as Khupra this value may still be too high.
47CARBON AND LIFESTYLE
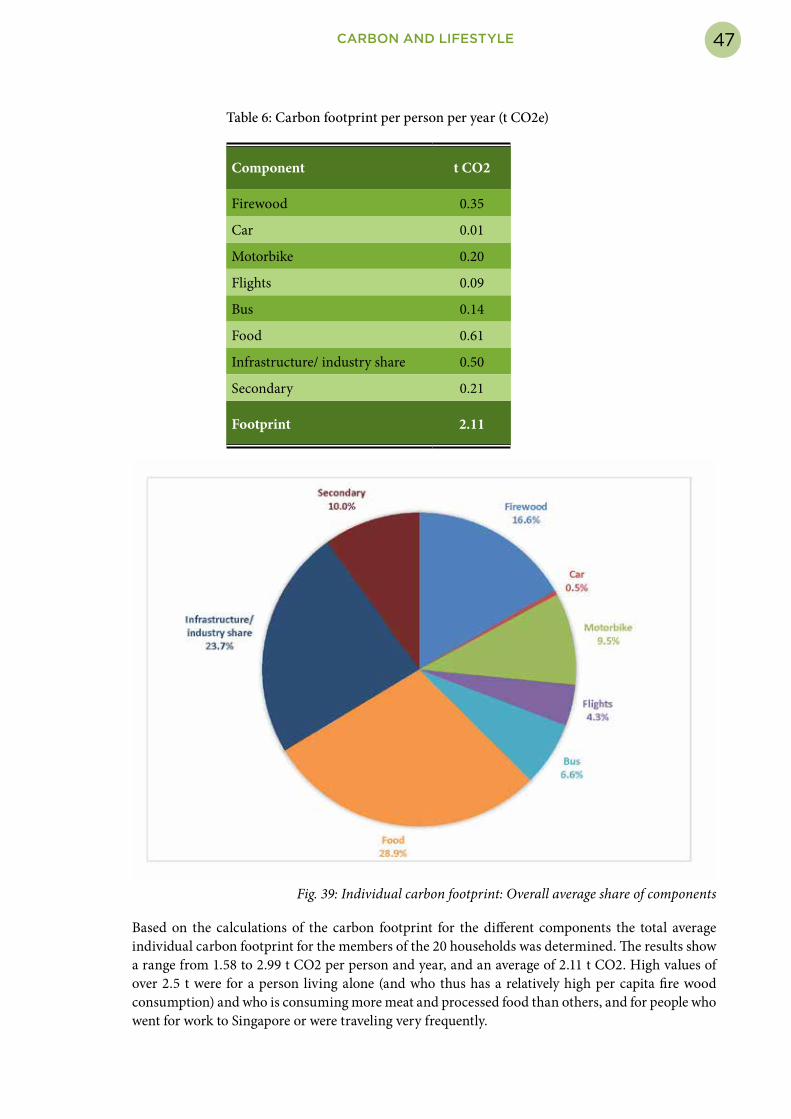
Table 6: Carbon footprint per person per year (t CO2e)
Component t CO2
Firewood 0.35
Car 0.01
Motorbike 0.20
Flights 0.09
Bus 0.14
Food 0.61
Infrastructure/ industry share 0.50
Secondary 0.21
Footprint 2.11
Fig. 39: Individual carbon footprint: Overall average share of components
Based on the calculations of the carbon footprint for the different components the total average individual carbon footprint for the members of the 20 households was determined. The results show a range from 1.58 to 2.99 t CO2 per person and year, and an average of 2.11 t CO2. High values of over 2.5 t were for a person living alone (and who thus has a relatively high per capita fire wood consumption) and who is consuming more meat and processed food than others, and for people who went for work to Singapore or were traveling very frequently.
48 CARBON AND LIFESTYLE
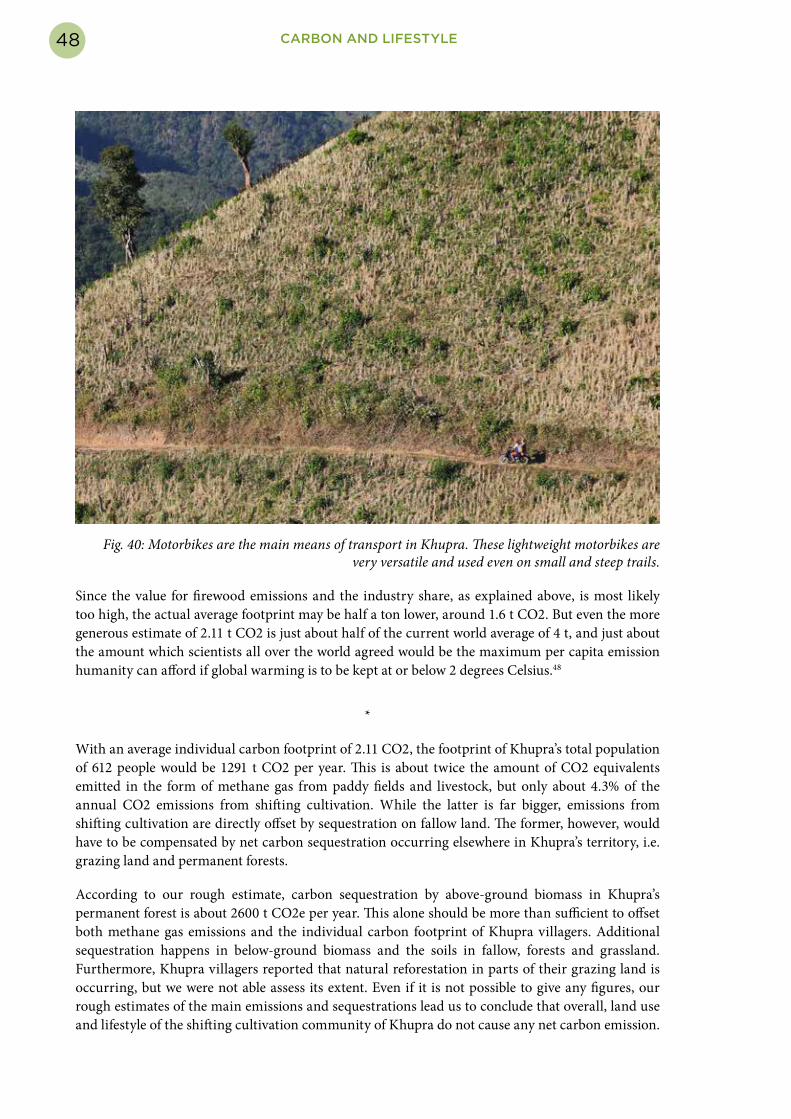
Fig. 40: Motorbikes are the main means of transport in Khupra. These lightweight motorbikes are very versatile and used even on small and steep trails.
Since the value for firewood emissions and the industry share, as explained above, is most likely too high, the actual average footprint may be half a ton lower, around 1.6 t CO2. But even the more generous estimate of 2.11 t CO2 is just about half of the current world average of 4 t, and just about the amount which scientists all over the world agreed would be the maximum per capita emission humanity can afford if global warming is to be kept at or below 2 degrees Celsius.48
*
With an average individual carbon footprint of 2.11 CO2, the footprint of Khupra’s total population of 612 people would be 1291 t CO2 per year. This is about twice the amount of CO2 equivalents emitted in the form of methane gas from paddy fields and livestock, but only about 4.3% of the annual CO2 emissions from shifting cultivation. While the latter is far bigger, emissions from shifting cultivation are directly offset by sequestration on fallow land. The former, however, would have to be compensated by net carbon sequestration occurring elsewhere in Khupra’s territory, i.e. grazing land and permanent forests.
According to our rough estimate, carbon sequestration by above-ground biomass in Khupra’s permanent forest is about 2600 t CO2e per year. This alone should be more than sufficient to offset both methane gas emissions and the individual carbon footprint of Khupra villagers. Additional sequestration happens in below-ground biomass and the soils in fallow, forests and grassland. Furthermore, Khupra villagers reported that natural reforestation in parts of their grazing land is occurring, but we were not able assess its extent. Even if it is not possible to give any figures, our rough estimates of the main emissions and sequestrations lead us to conclude that overall, land use and lifestyle of the shifting cultivation community of Khupra do not cause any net carbon emission.
49
II. Livelihood, land use and carbon
in Khupra: Some conclusions
The purpose of our study is to get a basic idea of the nature of the greenhouse gas impact of livelihood and land use in Khupra, and thus of the “carbon footprint” of this community, by focusing on the carbon dynamics on land under shifting cultivation and assessing the individual, lifestyle related carbon footprint of Khupra villagers. The reason for focusing on shifting cultivation is not just the importance of shifting cultivation in the livelihood of Khupra villagers but above all the controversy surrounding it with respect to its alleged negative impact on the climate.
Our study shows that annual emissions from burning new fields under shifting cultivation are considerable, but that under the long-fallow system as practiced in Khupra carbon is rapidly sequestered again by the secondary forest growing during the fallow period. We also concluded that, similarly, CO2 emissions from burning grasslands are sequestered by the regrowth of grasses and shrubs, and that emissions of methane from paddy fields and livestock are comparably small and well compensated by sequestration of Khupra’s permanent forest land. Our study also shows that the individual, lifestyle related carbon footprint of Khupra villagers is modest and still within what has been identified as the limit for humanity to avoid global warming to exceed 2 degrees Celsius. Compared to the emissions caused by land use, and above all from burning swidden fields, these emissions are very small, and the considerable sequestration happening in Khupra’s large areas of forest, fallow land and grassland easily offsets them. Overall, we can conclude, Khupra community is very likely to have a positive carbon balance, i.e. Khupra’s territory sequesters more carbon than what its people emit and it can be considered a carbon sink.
Our study is supported by other research conducted in recent years that have come to the conclusion that long-fallow systems of shifting cultivation do not cause net carbon emissions but are carbon neutral or even carbon positive, i.e. sequester more carbon than what they emit.49
In Khupra’s long-fallow system of shifting cultivation fields are left fallow for a period of 10 to 14 years. Conscious fallow management, consisting of the preservation of lopped residual trees and coppicing of trees, thus keeping their root stock alive, ensures a rapid recovery of fallow forest after the cultivation of a field ends.
Since over 90% of the land under shifting cultivation is covered by fallow forest at any given point of time, since there is a comparably high carbon stock also in cultivated fields due to the presence of residual trees, high below ground carbon content due to the preservation of the root stock of coppiced

50 CONCLUSIONS
trees, and since there is a high content of soil carbon that is preserved over the whole swidden cycle, this form of land use preserves a considerable carbon stock. According to our rough estimate of an average total carbon stock – including above-ground and below-ground biomass carbon and soil carbon – of 120 t C/ha on swidden land Khupra’s 1058 ha swidden farm area must store at least 127,000 tons of carbon, corresponding to about 466,000 t CO2.
Comparison with other forms of land use Several studies conducted in recent years have also shown that land under long fallow shifting cultivation can store a considerable amount of carbon. It is certainly less than that of undisturbed natural forests, but comparing environmental aspects of shifting cultivation with those of primary forests is problematic “most fundamentally because a primary forest is not a production system, thus for the farmers forests to not represent an alternative to swidden cultivation”.50
Some of these studies have also concluded that it is rather doubtful that other forms of land use, such as plantations, which are widely promoted by policy makers are a better alternative for sequestering carbon. A meta-analysis of 250 studies reporting above- and below-ground carbon estimates for different land-use types indicates “great uncertainty in the net total ecosystem carbon changes that can be expected from many transitions, including the replacement of various types of swidden agriculture with oil palm, rubber, or some other types of agroforestry systems.”51 The study concludes that “there is little evidence to suggest that transitions from swidden agriculture to many other land uses will directly or reliably produce positive carbon gains, e.g., from intermediate- or long-fallow swidden systems to oil palm and rubber plantations.”52
The study found that with an above-ground carbon stock of 25 to 143 t/ ha for rubber plantations and 25 to 110 t/ha for long-fallow swidden systems there is no great difference between the two.53 Other forms of land use that are often encouraged or actively promoted do not seem to be a better alternative either (see table 7).
The adoption of alternative forms of land use has other impacts that also need to be taken into account. While the transition from shifting cultivation to cash crops for many farmers leads to increased income, is has been shown that these changes may also have long-term negative impacts on the environment and local livelihoods. Aside from a reduction of carbon sequestration, environmental impacts include “a permanent decrease in forest cover at the landscape scale combined with substantial losses of wild biodiversity and agro-biodiversity, increases in weed pressure, decreases in soil fertility, accelerated erosion, declines in stream water quality”54. The impact on local livelihoods includes increased economic vulnerability and reduced food security.55
Therefore, it is not only doubtful that replacing shifting cultivation with other forms of land use will have any carbon benefits, possible economic benefits may be outweighed by negative environmental and social impacts. Instead of pushing for the blanket eradication of shifting cultivation land use policies in shifting cultivation areas need to be informed by a better understanding of this form of land use, and be sensitive and responsive not just to the ecological and economic but also to the social and cultural conditions of the communities involved.

51CONCLUSIONS
Table 7: Above-ground carbon stock in vegetation under different forms of land use (tons/ha)
Shifting cultivation
Long fallow-systems (>10 years) 80 (24-160) Bruun et.al. 2009
8-years fallow forest 74 van Noordwijk et.al. 1995
4-years fallow system 8-9 Bruun et.al. 2009
Agroforests
Rubber agroforest (Indonesia) 90 Bruun et.al. 2009
Rubber (agro)forest (Indonesia) 116 van Noordwijk et.al. 1995
Permanent agriculture seasonal crops
Continuous annual cropping 1-4 Bruun et.al. 2009
Annual cropping vegetables 2 van Noordwijk et.al. 1995
Annual cropping cassava 4 van Noordwijk et.al. 1995
Monoculture tree plantations
Casuarina tree monoculture plantation 21-55 Bruun et.al. 2009
Rubber plantation 50 Bruun et.al. 2009
Oil palm
Indonesia, 20-25 years rotation 48-91 Bruun et.al. 2009, van Noordwijk et. al. 1995
Malaysia 36 Bruun et.al. 2009
The way aheadShifting cultivators themselves are innovative and adaptive, they have been quick in responding to both pressures and opportunities and have often transformed their land use systems in ways that differ considerably from what is conventionally considered shifting cultivation.56 Building on and improving long-fallow shifting cultivation systems may not only strengthen local livelihoods but further increase carbon sequestration and other environmental services.
From Khupra villagers we can learn, for example, that good fallow management, which preserves below-ground biomass and soil carbon as well as above-ground biomass carbon in the form of residual trees has a considerable potential for maintaining a large carbon stock, supporting rapid fallow growth and, overall, increasing carbon sequestration in shifting cultivation.
What we also have learned in this study is that good fire management and above all the prevention of unwanted fires in grasslands and fallow is critical, and that there is a considerable potential to increase the overall carbon stock by allowing natural reforestation of parts of grasslands. Some villagers in Khupra are already using some of these lands for shifting cultivation. Others started experimenting with agroforestry gardens on fallow land.
External support in the form of research and experimentation in cooperation with farmers, technical support, credit and market access for agroforestry products and other measures that take the existing form of land use as a point of departure can lead to new, innovative forms of land use which increase income and thus also alternatives to urban migration. Keeping people on the land by providing decent and sustainable livelihoods will also help in preventing the further spread of lifestyles and the corresponding carbon footprint that humanity simply cannot afford.

52
53
Notes and references
1 Springate-Baginski, Oliver 2013. Rethinking Shifting Cultivation in Myanmar. Policies for sustainable livelihoods and food security. University of East Anglia/Pyoe Ping. http://www.burmalibrary.org/docs20/Springate-Baginski-2013-Rethinking_Swidden_Cultivation_in_Myanmar-en-red.pdf
2 Swidden farming/swidden agriculture is derived from the Old English term “swidden”, meaning “burnt clearing” (IFAD, IDRC, ICRAF and IIRR 2001. Shifting Cultivation: Towards Sustainability and Resource Conservation in Asia. International Institute of Rural Reconstruction, Cavite, Philippines, p. 24f). In this report, we will use shifting cultivation and swidden farming/agriculture interchangeably.
3 See e.g. for Souhteast Asia in general: Fox, Jefferson et.al. 2009. Policies, Political-Economy, and Swidden in Southeast Asia. Human Ecology 37; Padoch, Christine, Kevin Coffey, Ole Mertz, Stephen J. Leisz, Jefferson Fox & Reed L. Wadley 2007. The Demise of Swidden in Southeast Asia? Local Realities and Regional Ambiguities. Danish Journal of Geography 107(1); for Laos: IWGIA (International Work Group for Indigenous Affairs) 2007. The Indigenous World 2007. Copenhagen: IWGIA; for the Philippines: Pulhin, Juan M., Marcial C. Amaro, Jr.and Domingo Bacalla 2005. Philippines Community-based Forest Management 2005; in: RECOFTC 2005. First Regional Community Forestry Forum – Regulatory Frameworks for Community Forestry in Asia – Proceedings of a Regional Forum held in Bangkok, Thailand, August 24-25, 2005; http://www.recoftc.org/site/fileadmin/docs/publications/The_Grey_Zone/2006/CF_Forum/policy_philippines.pdf; for Thailand: Laungaramsri, Pinkaew 2005. Swidden Agriculture in Thailand: Myths, Realities and Challenges; in: Christina Erni (ed.), Shifting Cultivation. Indigenous Affairs 2/05. Copenhagen: IWGIA, Forsyth, Timothy J. 1999. Questioning the impacts of shifting cultivation, Watershed, 5, 1: 23–29; for Vietnam: Phuc, To Xuan 2008. Does Forest Devolution Benefit the Upland Poor? An Ethnography of Forest Access and Control in Vietnam. Resource Politics and Cultural Transformation in the Mekong Region, Working Paper Series. Regional Center for Social Science and Sustainable Development (RCSD), Faculty of Social Sciences, University of Chiang Mai; for Indonesia:, for Indonesia: Dove, Michael R. 1985. The Agroecological Mythology of the Javanese and the Political Economy of Indonesia. Indonesia No. 39 (April). Cornell Southeast Asia Program.
4 See e.g. Dove, Michael R. 1983. Theories of swidden agriculture, and the political economy of ignorance. Agroforestry Systems 1: 85-99. The Hague: Nijhoff/Junk Publishers; Dove 1985 op.cit.; Dove, M. 1996. So Far from Power, So Near to the Forest: A Structural Analysis of Gain and Blame in Tropical Forest Development; in: Padoch and Peluso (eds.). Borneo in Transition. People, Forests, Conservation and Development. Kuala Lumpur: Oxford; Padoch, Christine 1985. Labor Efficiency and Intensity of Land Use in Rice Production: An Example from Kalimantan. Human Ecology 13(3): 271-289; Forsyth op.cit.; Laungaramsri op.cit.; Nielsen, Uffe, Ole Mertz, and Gabriel Tonga Noweg 2006. The Rationality of Shifting Cultivation Systems: Labor Productivity Revisited. Human Ecology 34 (2):201-218; Forsyth, Tim and Andrew Walker 2008. Forest Guardians, Forest Destroyers. The Politics of Environmental Knowledge in Northern Thailand. Chiang Mai, Thailand Silkworm Books
5 REDD+ (or REDD-plus) replaces the previously used acronym REDD. It refers to “reducing emissions from deforestation and forest degradation in developing countries, and the role of conservation, sustainable management of forests, and enhancement of forest carbon stocks in developing countries”; the terminology used by the Conference of Parties (COP) of the UN Framework Convention on Climate Change (UNFCCC). However, the widely used acronym has not been coined nor is it officially used by the COP of the UNFCCC.
6 Ziegler, Alan D. et.al. 2012. Carbon outcomes of major land-cover transitions in SE Asia: great uncertainties and REDD+ policy implications. Global Change Biology (2012) 18, p. 3087
7 Fox, Jefferson et.al. 2009. Policies, Political-Economy, and Swidden in Southeast Asia. Human Ecology 37, p. 319
8 Van Vliet, Nathalie et. al. 2012. Trends, drivers and impacts of changes in swidden cultivation in tropical forest-agriculture frontiers: A global assessment. Global Environmental Change 22, p. 418

54
9 Ibid.; Ziegler et.al. op.cit.; Dressler, Wolfram H., D. Wilson, J. Clendenning, et al. 2016. The impact of swidden decline on livelihoods and ecosystem services in Southeast Asia: A review of the evidence from 1990 to 2015. Ambio (2016). doi:10.1007/s13280-016-0836-z
10 Karuna Mission Social Solidarity-Loikaw (KMSS-Loikaw) is one of the 16 Diocese-level offices of Karuna Mission Social Solidarity (KMSS), a faith-based social network of the Catholic Church of Myanmar. KMSS has been established and is mandated by the Catholic Bishops’ Conference of Myanmar (CBCM).
11 http://timeforchange.org/what-is-a-carbon-footprint-definition
12 https://en.wikipedia.org/wiki/Carbon_footprint
13 These are the figures according to the household census conducted for this study in 2016. The official figures according of the government census of 2014 are slightly different: 629 persons of which 332 are male and 297 are female.
14 It is strongly prohibited to cut any trees in these forests since it would anger the spirits dwelling there and bring harm to people. In 1986, seven villagers allegedly died for making a swidden field in a forest believed to be protected by spirits.
15 Intergovernmental Panel on Climate Change 2000. Land Use, Land-Use Change and Forestry. http://www.ipcc.ch/ipccreports/sres/land_use/index.php?idp=33
16 Ziegler, Alan D. et.al. 2012. Carbon outcomes of major land-cover transitions in SE Asia: great uncertainties and REDD+ policy implications. Global Change Biology (2012) 18, p. 3092
17 IPCC 2006. IPCC Guidelines for National Greenhouse Gas Inventories. Prepared by the National Greenhouse Gas Inventories Programme, ed. H. S. Eggleston, L. Buendia, K. Miwa, T. Ngara andK. Tanabe. Japan: Institute For Global Environmental Strategies
The terminology used in forest type classification in Southeast Asia differs between authors. Seasonally dry evergreen upland forests like those in Khupra (above 1000m absl) may fall into categories like evergreen moist forest (distinguished from evergreen rain forest), hill evergreen forest, evergreen mountain forest, tropical seasonal forest, or mixed evergreen upland forest.
In this report consider Khupra’s forests as “tropical seasonal forest” in accordance with the IPCCC, and use their recommendation for carbon stock assessment, i.e. the average of 106-169, which is 137 t C/ha. This corresponds more or less to the 138 t recommended by ICCC in 1997 (Lasco, Rodel D. 2002. Forest carbon budgets in Southeast Asia following harvesting and land cover change. Science in China, Vol. 45, p. 56) and the 142 t C/ha of Gibbs and Brown (2007a, 2007b) quoted in Gibbs et. al. 2007 (http://iopscience.iop.org/article/10.1088/1748-9326/2/4/045023/fulltext/)
18 Zielger et.al. op.cit.
19 Bruun, Thilde Bech, Andreas de Neergaard, Deborah Lawrence, Alan D. Ziegler 2009. Environmental Consequences of the Demise in Swidden Cultivation in Southeast Asia: Carbon Storage and Soil Quality. Human Ecology 37, p. 380
20 Ziegler et.al. op.cit.
21 Dressler, Wolfram H., D. Wilson, J. Clendenning, et al. 2016. The impact of swidden decline on livelihoods and ecosystem services in Southeast Asia: A review of the evidence from 1990 to 2015. Ambio (2016). doi:10.1007/s13280-016-0836-z
22 Mertz, Ole et.al. 2009. Swidden Change in Southeast Asia: Understanding Causes and Consequences. Human Ecology 37, p. 261
23 Ennion, Jim David 2015. From conflicting to complementing: The formalisation of customary land management Systems governing swidden cultivation in Myanmar. Master of Law thesis. Victoria University Wellington, p. 15. http://www.burmalibrary.org/docs21/Ennion-2015-Formalisation_of_swidden_land_use_rights_in_Myanmar-red.pdf
Ennion also points out that the term taungya“[ ] is also used to describe the forest management system the British established in the mid-19th century. In the colonial taungya system, British colonialists paid

55
swiddeners to plant and tend teak trees amongst their crops after clearing the land, in order to re-establish teak forests.” (ibid.)
24 Thilde Bech Bruun & Andreas de Neergaard & Deborah Lawrence & Alan D. Ziegler 2009. Environmental Consequences of the Demise in Swidden Cultivation in Southeast Asia: Carbon Storage and Soil Quality. Human Ecology (2009) 37, p. 377f
The cited report (p. 377) refers to biomass accumulation rates during the first 10 years of fallow of 4–20 t C/ha per year. More specific data for fallow in upland tropical seasonal forests in Myanmar, like those in Khupra, has not been available at the time of writing this report. The only recent study was conducted in an evergreen lowland forest in the Bago Yoma, at 250-450 m asl. (Chan, N., Takeda, S., Suzuki, R. et al. 2016. Assessment of biomass recovery and soil carbon storage of fallow forests after swidden cultivation in the Bago Mountains, Myanmar. New Forests 2016: 47). The range of biomass increments during the first ten years fallow is similar to those quoted above (3.9 to 22.38 t C/ha per year), but in most years low, and biomasses of fallows are considerably lower than those measured in Khupra.
25 In the case of the freshly lopped trees in newly cut fields, the biomass and carbon stock was calculated using the formula for tree trunks only, while for the residual trees in fallow fields, whose branches have grown back, the formula for whole trees was used.
26 Based on the reported range of 1 to 4 t C/ha, see Bruun, Thilde Bech, et.al. 2009 op.cit.
27 In our stock assessment, in young (2 years old) fallow trees with a dbh over 20cm were considered residual trees, for 5 to 6 years old fallow the trees with dbh over 25cm, and for old fallow (9 and 12 years) trees with a dbh of over 30 cm.
28 Bruun, Thilde Bech, et.al. 2009 op.cit.
29 Nguyen The Dang and Christoph Klinnert 2001. Problems with and local solutions for organic mat-ter management Vietnam. Nutrient Cycling in Agroecosystems 61. In: Martius, Christopher, Holm Tiessen, Paul Vlek (eds.). Managing Organic Matter in Tropical Soils: Scope and Limitations. Kluwer Academic Pub-lishers, p. 90p
30 Chan et. al. op.cit., p. 581
31 Assuming a moderate to low occurrence of residual trees, thus an initial stock of 10 t C/ha for a newly cleared swidden and 90 t C/ha for a 9 to 12 year old fallow.
32 One ton of carbon equals 44/12 = 11/3 = 3.67 tons of carbon dioxide. https://www.epa.gov/energy/ghg-equivalencies-calculator-calculations-and-references
33 Ash also helps balancing the pH level of the soil, which can be critical in tropical areas with high rainfall that tend to have acidic soils (personal communication of the late Delbert Rice on shifting cultivation by the Ikalahan in the Northern Philippines).
34 With the help of satellite images villagers tried to identify the areas cleared in a particular year. There was considerable uncertainty especially for older fields, but for the past ten years at least a rough estimate was possible. It turned out that that the total area cleared in a year varies considerably, in accordance with the livelihood choices made by Khupra farmers in a particular year, i.e. their engagement in other income generating activities.
35 Dressler et. al. op.cit.
36 Bruun et.al. op.cit., p. 379
37 Ribeiro Filho, Alexandre Antunes; Adams, Cristina; Murrieta, Rui Sergio Sereni. The impacts of shifting cultivation on tropical forest soil: a review. Boletim do Museu Paraense Emílio Goeldi. Ciências Humanas, v. 8, n. 3, p. 693-727, set.-dez. 2013, p. 714
38 Ibid. p. 720
39 Duke Researcher Finds Some Tropical Farming Practices Have Surprising Consequences. Science Daily August 16, 1997. https://www.sciencedaily.com/releases/1997/08/970816100758.htm
40 Ibid.

56
41 Bracmort, Kelsi et.al. (eds.) 2011. Methane Capture: Options for Greenhouse Gas Emission Reduction. Congressional Research Series Report. P. 6; and http://timeforchange.org/are-cows-cause-of-global-warming-meat-methane-CO2
42 Revised 1996 IPCC Guidelines for National Greenhouse Gas Inventories: Reference Manual, p. 4.56. http://www.ipcc-nggip.iges.or.jp/public/gl/invs1.html
43 http://timeforchange.org/are-cows-cause-of-global-warming-meat-methane-CO2
44 https://en.wikipedia.org/wiki/Carbon_footprint
45 Carbon Independent: http://www.carbonindependent.org/; Resurgence http://www.old.resurgence.org/education/carbon-calculator.html; carbon footprint http://www.carbonfootprint.com/calculator.aspx
46 The carbon footprint of a solar photovoltaic panel, i.e. the average amount of greenhouse gas emissions it is causing over its lifetime – has been calculated to be around 88 g CO2 equivalent per kilowatt-hour of electricity generated (which ranges from 75 to 116 gCO2eq/kWh under different operating conditions). This is much lower than electricity generated by, for example, gas or coal fired power plants (488 and 786 to 990 gCO2eq/kWh. (http://www.parliament.uk/documents/post/postpn_383-carbon-footprint-electricity-generation.pdf)
47 http://www.carbonindependent.org/
48 https://www.theccc.org.uk/tackling-climate-change/the-science-of-climate-change/setting-a-target-for-emission-reduction/
49 Dressler et.al. op.cit.
50 Bech Brun, Thilde, Andreas de Neergaard, Deborah Lawrence & Alan D. Ziegler (2009). Environmental Consequences of the Demise in Swidden Cultivation in Southeast Asia: Carbon Storage and Soil Quality. Human Ecology 37, p. 377
51 Ziegler et.al. op.cit., p.3087
52 Ibid., p. 3095
53 Ziegler et.al. op.cit., p.3092
54 Van Vliet et.al. op.cit., p. 426
55 Dressler et.al. op.cit.
56 Padoch, Christine, Kevin Coffey, Ole Mertz, Stephen J. Leisz, Jefferson Fox & Reed L. Wadley 2007. The Demise of Swidden in Southeast Asia? Local Realities and Regional Ambiguities. Danish Journal of Geography 107(1), p. 30