Live-Cell Imaging of Focal Adhesions Peyton Lab Journal Review Dannielle Ryman May 1, 2012.
19
Live-Cell Imaging of Focal Adhesions Peyton Lab Journal Review Dannielle Ryman May 1, 2012
-
Upload
zoe-brooks -
Category
Documents
-
view
216 -
download
1
Transcript of Live-Cell Imaging of Focal Adhesions Peyton Lab Journal Review Dannielle Ryman May 1, 2012.
Live-Cell Imaging of Focal Adhesions
Peyton Lab Journal ReviewDannielle Ryman
May 1, 2012
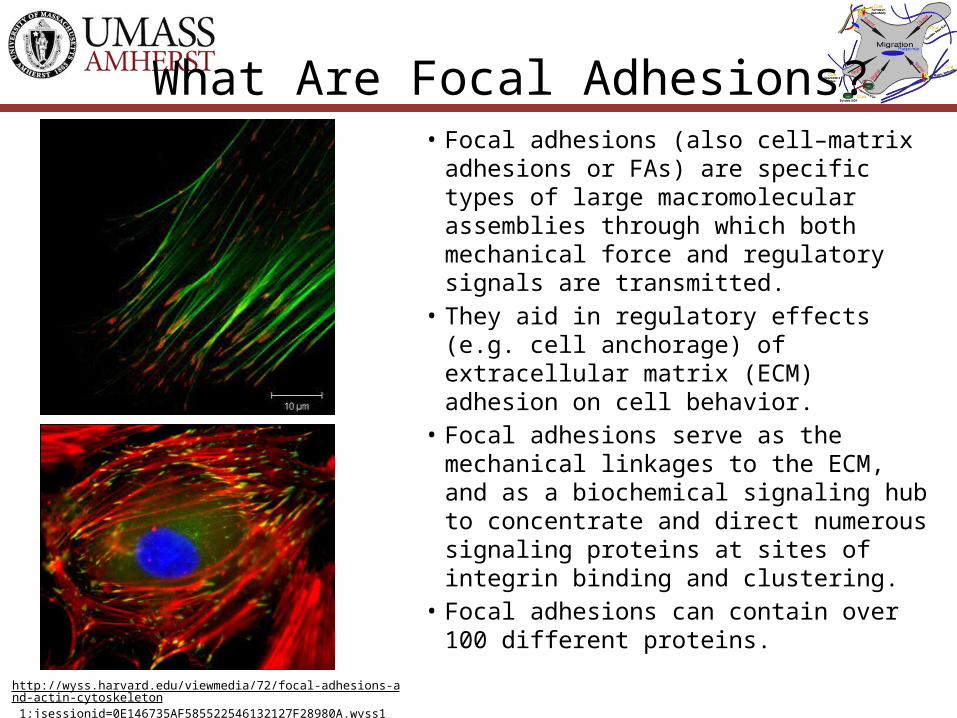
What Are Focal Adhesions?• Focal adhesions (also cell–matrix
adhesions or FAs) are specific types of large macromolecular assemblies through which both mechanical force and regulatory signals are transmitted.
• They aid in regulatory effects (e.g. cell anchorage) of extracellular matrix (ECM) adhesion on cell behavior.
• Focal adhesions serve as the mechanical linkages to the ECM, and as a biochemical signaling hub to concentrate and direct numerous signaling proteins at sites of integrin binding and clustering.
• Focal adhesions can contain over 100 different proteins.http://wyss.harvard.edu/viewmedia/72/focal-adhesions-and-actin-cytoskeleton
1;jsessionid=0E146735AF585522546132127F28980A.wyss1
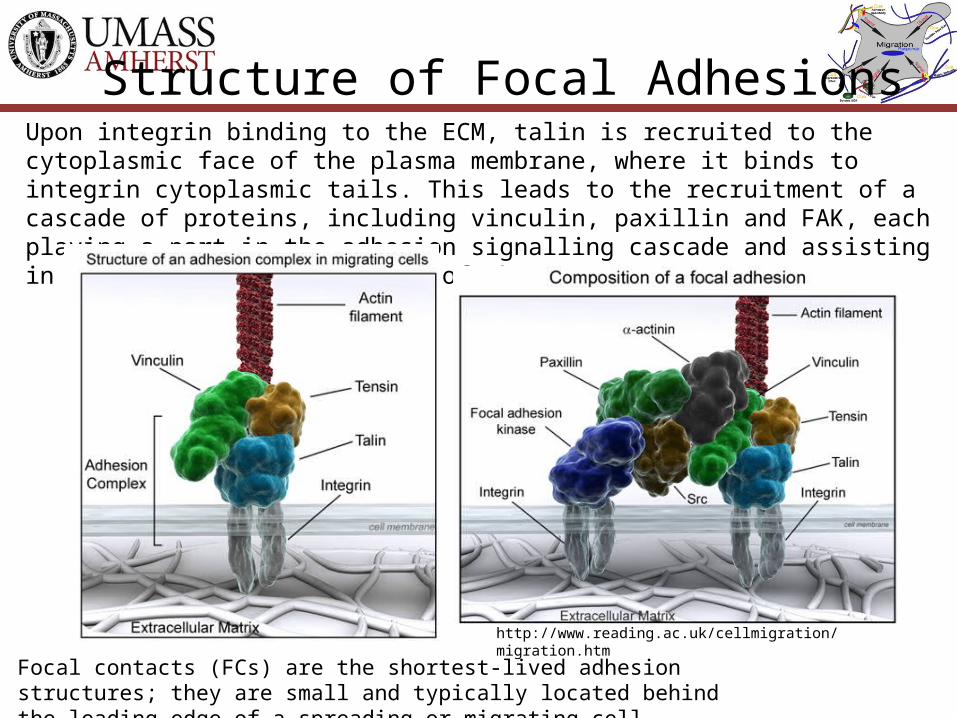
Structure of Focal AdhesionsUpon integrin binding to the ECM, talin is recruited to the cytoplasmic face of the plasma membrane, where it binds to integrin cytoplasmic tails. This leads to the recruitment of a cascade of proteins, including vinculin, paxillin and FAK, each playing a part in the adhesion signalling cascade and assisting in determining the life span of the structure.
Focal contacts (FCs) are the shortest-lived adhesion structures; they are small and typically located behind the leading edge of a spreading or migrating cell.
http://www.reading.ac.uk/cellmigration/migration.htm
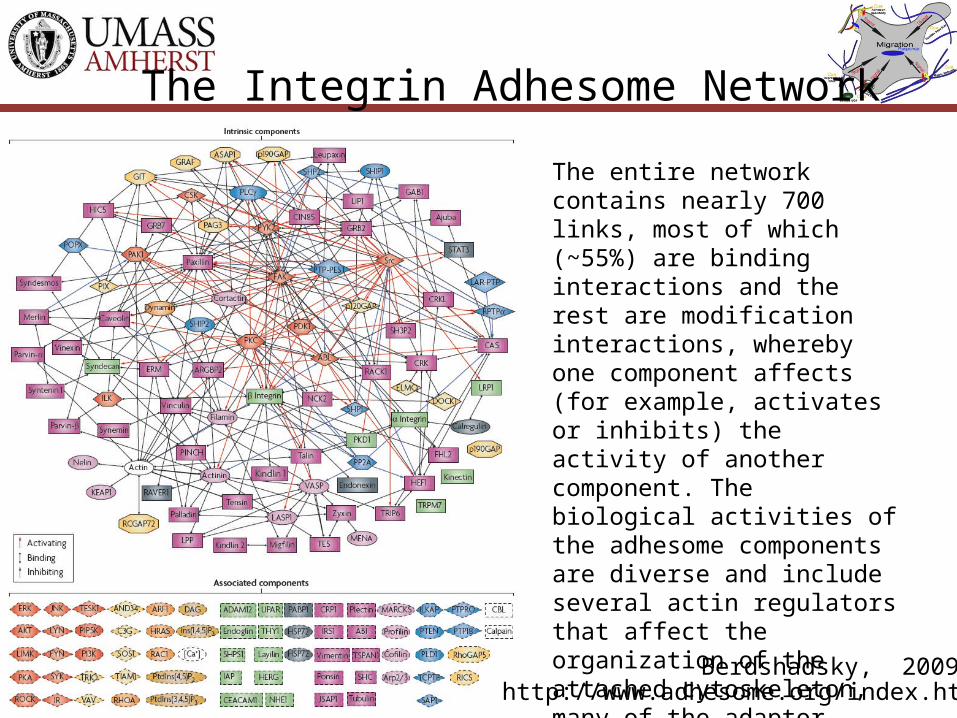
The Integrin Adhesome Network
The entire network contains nearly 700 links, most of which (~55%) are binding interactions and the rest are modification interactions, whereby one component affects (for example, activates or inhibits) the activity of another component. The biological activities of the adhesome components are diverse and include several actin regulators that affect the organization of the attached cytoskeleton, many of the adaptor proteins that link actin to integrins either directly or indirectly, and a wide range of signalling molecules, such as kinases, phosphatases and G proteins and their regulators.
http://www.adhesome.org/index.htmBerdshadsky, 2009
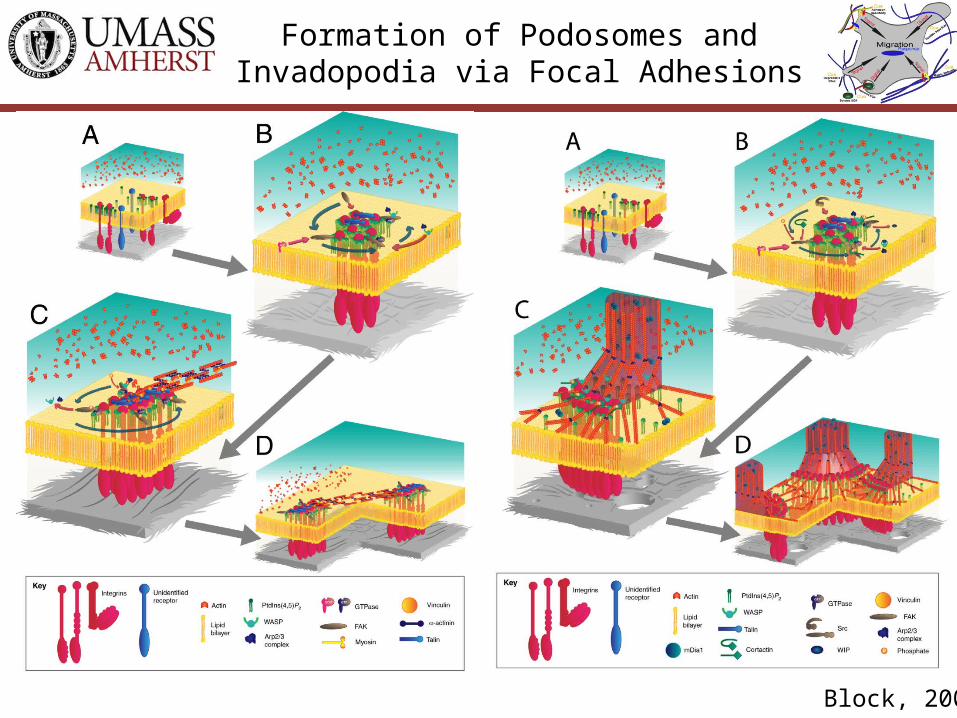
Formation of Podosomes and Invadopodia via Focal Adhesions
Block, 2009

Environmental Sensing Through Focal Adhesions
Berdshadsky, 2009
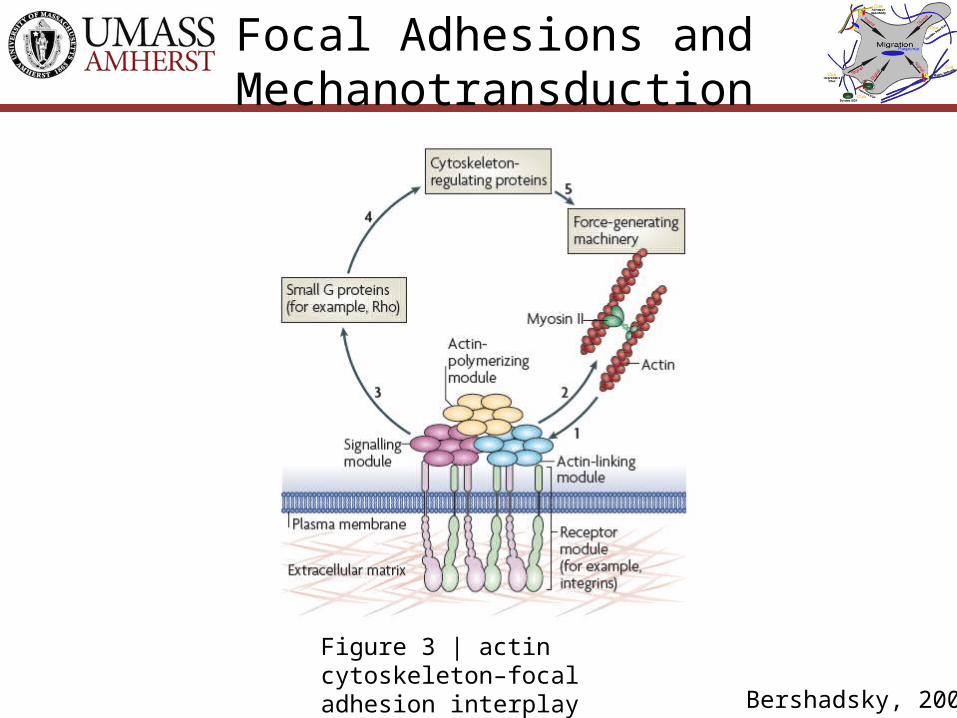
Focal Adhesions and Mechanotransduction
Figure 3 | actin cytoskeleton–focal adhesion interplay
Bershadsky, 2009
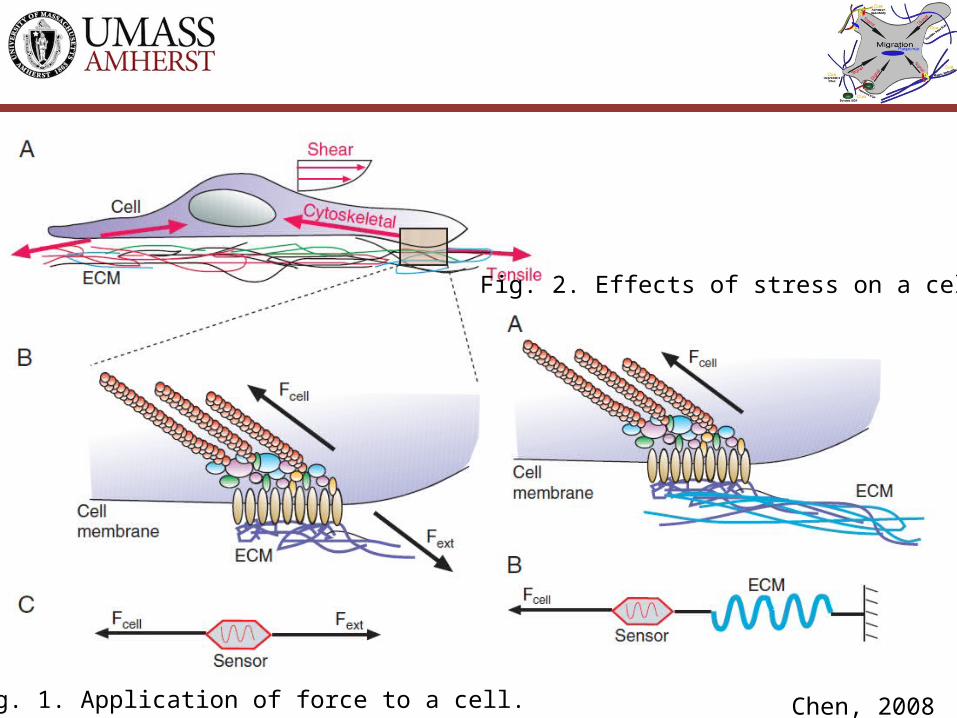
Fig. 2. Effects of stress on a cell.
Fig. 1. Application of force to a cell. Chen, 2008
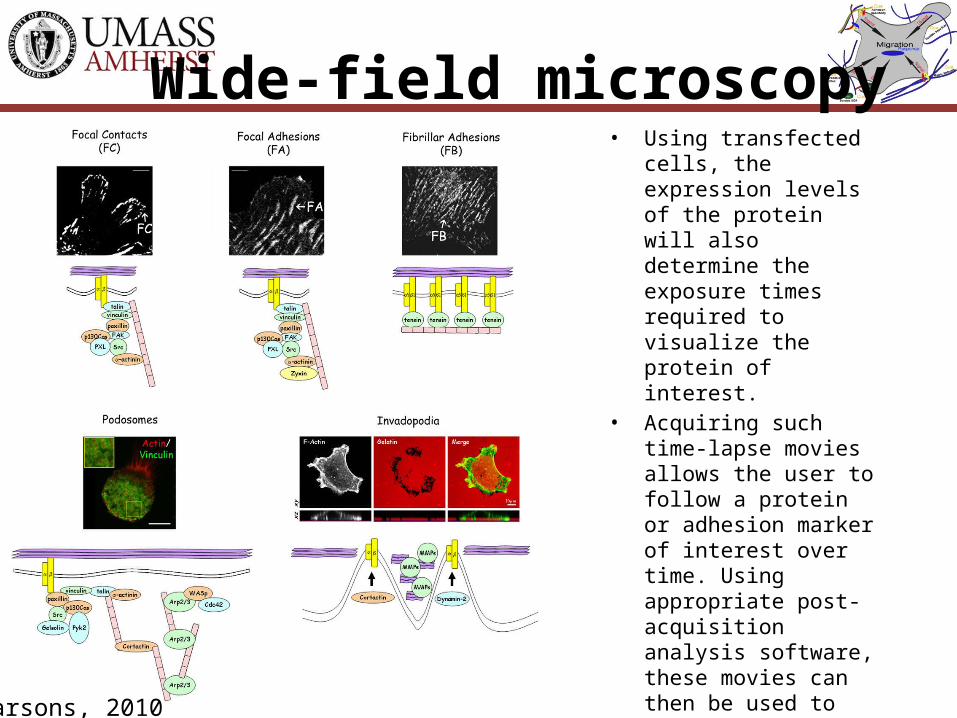
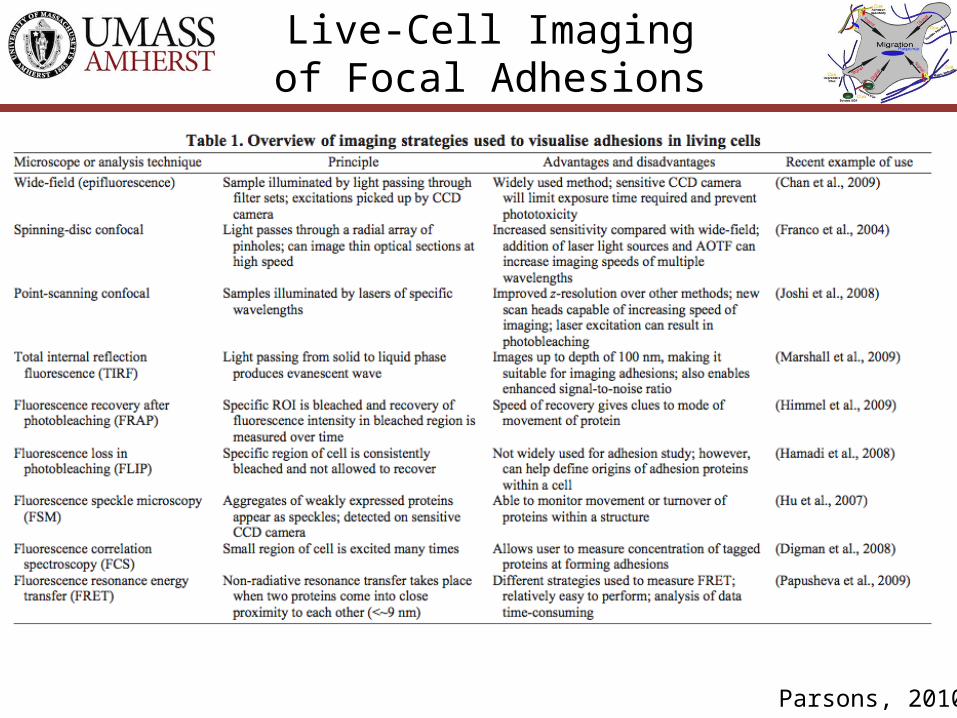
Wide-field microscopy• Using transfected cells, the
expression levels of the protein will also determine the exposure times required to visualize the protein of interest.
• Acquiring such time-lapse movies allows the user to follow a protein or adhesion marker of interest over time. Using appropriate post-acquisition analysis software, these movies can then be used to calculate, for example, adhesion numbers, rates of adhesion assembly or disassembly, and intensity profile changes in subcellular localization over time.
Parsons, 2010
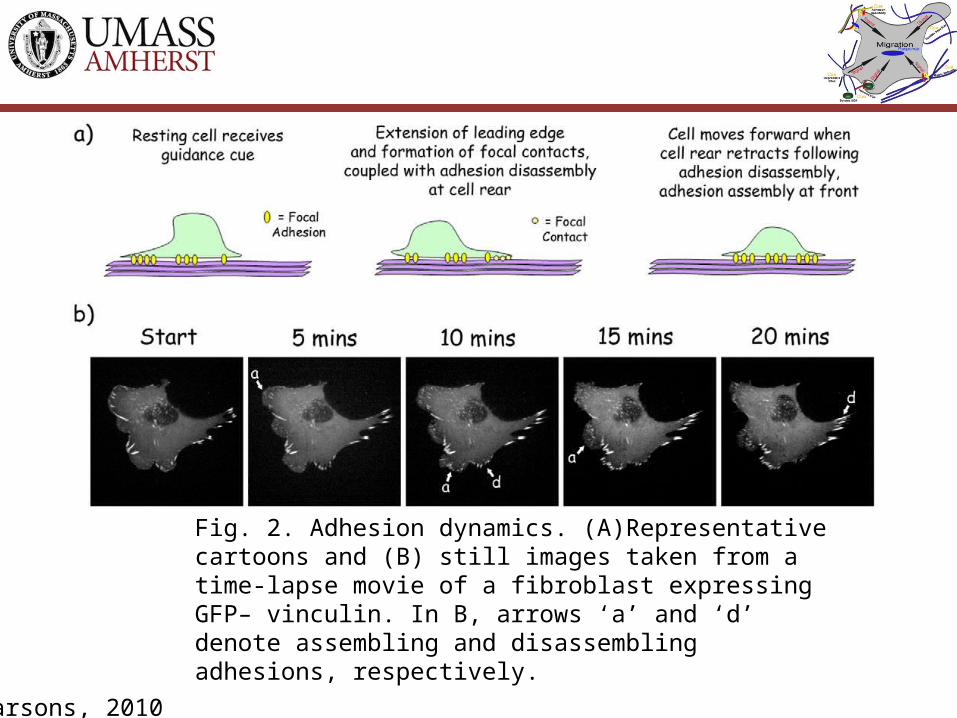
Fig. 2. Adhesion dynamics. (A)Representative cartoons and (B) still images taken from a time-lapse movie of a fibroblast expressing GFP– vinculin. In B, arrows ‘a’ and ‘d’ denote assembling and disassembling adhesions, respectively.
Parsons, 2010
Spinning-Disk Microscopy
• A higher signal-to-noise ratio compared to widefield microscopy.• Laser light sources can also be used; the addition of an acousto optical tunable
filter (AOTF) allows switching of excitation wavelengths in the order of microseconds. This modification also allows fast imaging of multiple fluorophores within a sample.
• Rates of assembly and disassembly of adhesions can be calculated from resulting movies through measuring the incorporation or loss of fluorescent signal of the protein being studied. Increase of signal will be the result of adhesion assembly and growth, whereas adhesion disassembly will result in loss of fluorescent signal. Plotting signal intensity values over time on semi-logarithmic graphs will provide a profile of intensity ratios over time (Franco et al., 2004).
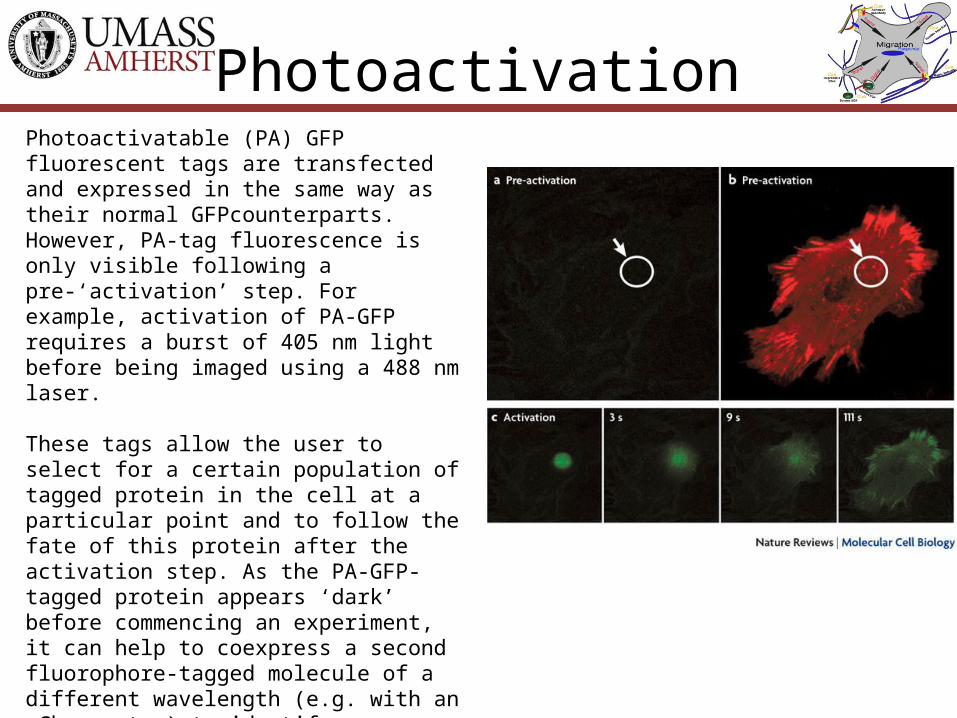
PhotoactivationPhotoactivatable (PA) GFP fluorescent tags are transfected and expressed in the same way as their normal GFPcounterparts. However, PA-tag fluorescence is only visible following a pre-‘activation’ step. For example, activation of PA-GFP requires a burst of 405 nm light before being imaged using a 488 nm laser.
These tags allow the user to select for a certain population of tagged protein in the cell at a particular point and to follow the fate of this protein after the activation step. As the PA-GFP-tagged protein appears ‘dark’ before commencing an experiment, it can help to coexpress a second fluorophore-tagged molecule of a different wavelength (e.g. with an mCherry tag) to identify structures or organelles of interest. This provides not only a guide to pinpoint the subcellular site that is to be photoactivated, but also a reference against which the intensity of the PA-GFP protein can be compared to over the time course of the experiment.
Florescence Recovery After Photobleaching
Fluorescence recovery after photobleaching (FRAP) is anothercommonly used technique to quantify protein kinetics in livingcells. Cells are transfected with a fluorescently tagged protein, imaged live and then subjected to a bleach step, in which a specific point or region of interest (ROI) is exposed to high-intensity burst(s) of laser emission. Cells are then imagedover a period of time and the time taken for recovery of the tagged protein into the bleached ROI is determined. The dynamics of protein movement can be calculated from these recovery rates and from immobile fractions within the bleached ROI, which provide information on both on and off rates of the protein of interest at that particular site. Recovery can be expressed as half-life, which is the time required for the signal intensity to return to half of its full final recovery value.
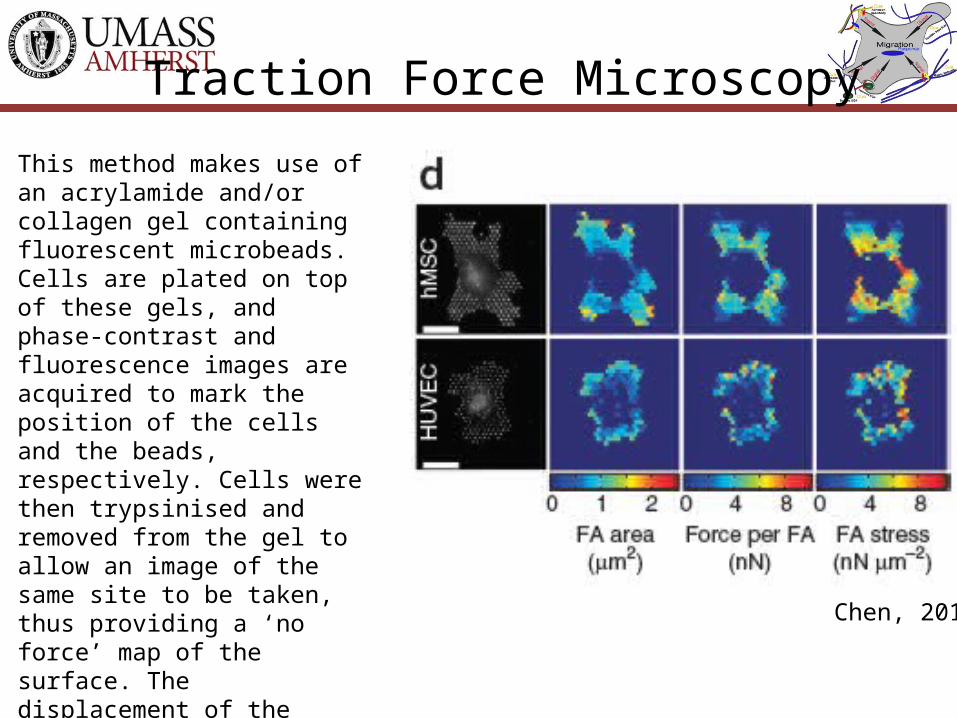
Traction Force Microscopy
This method makes use of an acrylamide and/or collagen gel containing fluorescent microbeads. Cells are plated on top of these gels, and phase-contrast and fluorescence images are acquired to mark the position of the cells and the beads, respectively. Cells were then trypsinised and removed from the gel to allow an image of the same site to be taken, thus providing a ‘no force’ map of the surface. The displacement of the beads, as seen in the differences between these images, can then be analysed using a number of complex algorithms depending on the nature of the gel used
Chen, 2010
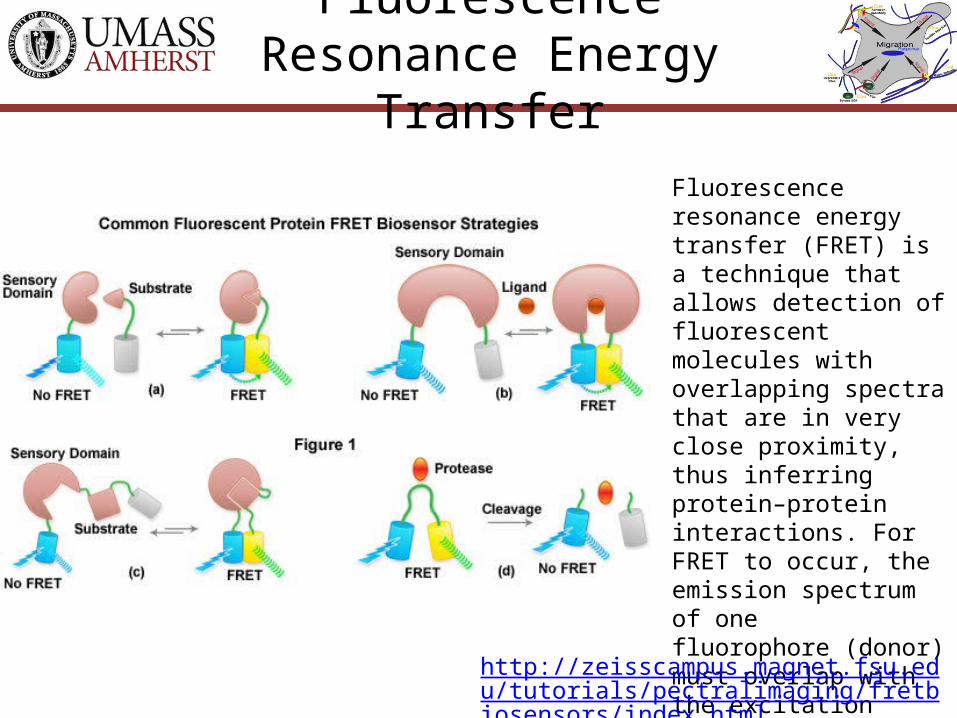
Fluorescence Resonance Energy Transfer
Fluorescence resonance energy transfer (FRET) is a technique thatallows detection of fluorescent molecules with overlapping spectrathat are in very close proximity, thus inferring protein–proteininteractions. For FRET to occur, the emission spectrum of onefluorophore (donor) must overlap with the excitation spectrum ofthe second (acceptor).
http://zeisscampus.magnet.fsu.edu/tutorials/pectralimaging/fretbiosensors/index.html
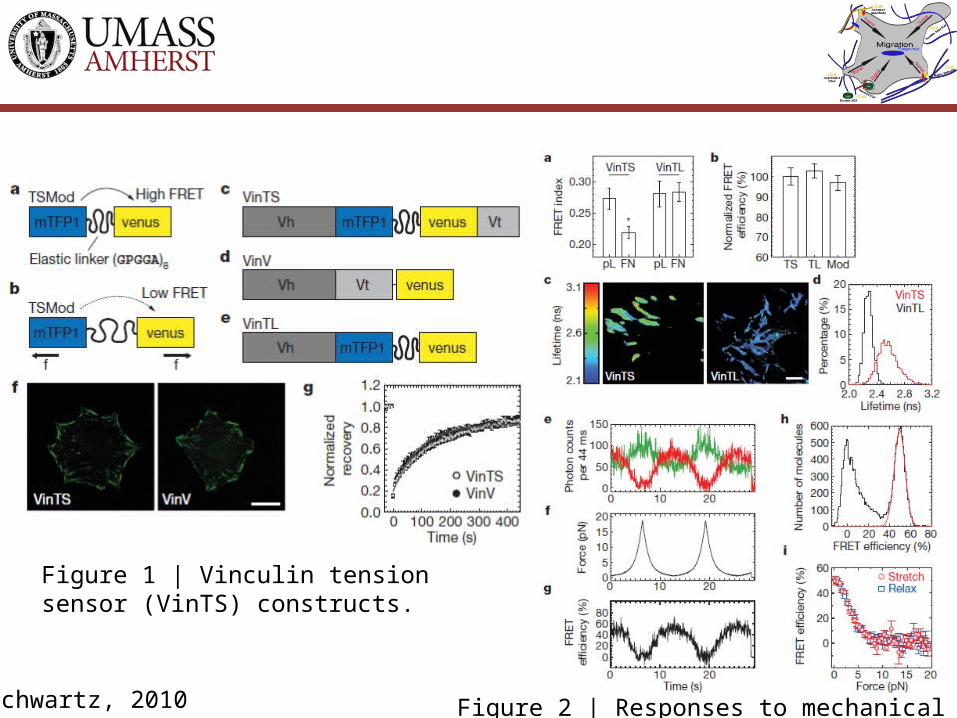
Figure 1 | Vinculin tension sensor (VinTS) constructs.
Figure 2 | Responses to mechanical force.Schwartz, 2010
Live-Cell Imaging of Focal Adhesions
Parsons, 2010
References• Geiger, B., Spatz, J. P., & Bershadsky, A. D. (2009). Environmental sensing through
focal adhesions. Nature reviews. Molecular cell biology, 10(1), 21-33. doi:10.1038/nrm2593
• Eyckmans, J., Boudou, T., Yu, X., & Chen, C. S. (2011). A hitchhiker’s guide to mechanobiology. Developmental cell, 21(1), 35-47. Elsevier Inc. doi:10.1016/j.devcel.2011.06.015
• Chen, C. S. (2008). Mechanotransduction - a field pulling together? Journal of cell science, 121(Pt 20), 3285-92. doi:10.1242/jcs.023507
• Grashoff, C., Hoffman, B. D., Brenner, M. D., Zhou, R., Parsons, M., Yang, M. T., McLean, M. a, et al. (2010). Measuring mechanical tension across vinculin reveals regulation of focal adhesion dynamics. Nature, 466(7303), 263-6. Nature Publishing Group. doi:10.1038/nature09198
• Worth, D. C., & Parsons, M. (2010). Advances in imaging cell-matrix adhesions. Journal of cell science, 123(Pt 21), 3629-38. doi:10.1242/jcs.064485