Live BizX Adhoc data in the Online Report Designer SuccessFactors Analytics.
60
Live BizX Adhoc data in the Online Report Designer SuccessFactors Analytics
-
Upload
stacy-tinley -
Category
Documents
-
view
231 -
download
2
Transcript of Live BizX Adhoc data in the Online Report Designer SuccessFactors Analytics.

Live BizX Adhoc data in theOnline Report Designer
SuccessFactors Analytics

2 SuccessFactors Proprietary and Confidential © 2012 SuccessFactors, An SAP Company. All rights reserved.
Online Report Designer Sample
List Report
Pivot Chart
Pivot Table

3 SuccessFactors Proprietary and Confidential © 2012 SuccessFactors, An SAP Company. All rights reserved.
Online Report Designer- Summary of Advantages
• Self Service: Build your own reports from within the easy to use SFSF Online Report Designer tool
• Formatted & Presentation Ready: Visualize queries in tabular list format, as pivot tables and in a wide variety of chart styles
• Exportable: PPT, PDF, Word, Excel, Schedule & Email
• Customization: Relabel Fields, Custom Calculations & Concatenate Fields, If/Then/Else statements, hide duplicates, transpose rows to columns
4 SuccessFactors Proprietary and Confidential © 2012 SuccessFactors, An SAP Company. All rights reserved.
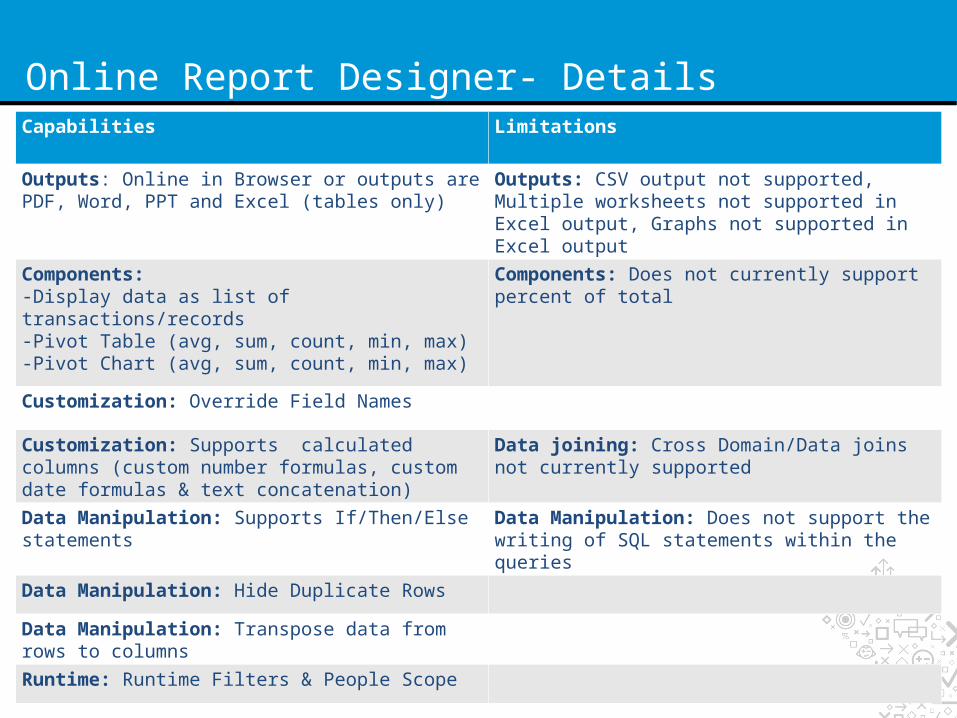
Online Report Designer- DetailsCapabilities Limitations
Outputs: Online in Browser or outputs are PDF, Word, PPT and Excel (tables only)
Outputs: CSV output not supported, Multiple worksheets not supported in Excel output, Graphs not supported in Excel output
Components: -Display data as list of transactions/records-Pivot Table (avg, sum, count, min, max)-Pivot Chart (avg, sum, count, min, max)
Components: Does not currently support percent of total
Customization: Override Field Names
Customization: Supports calculated columns (custom number formulas, custom date formulas & text concatenation)
Data joining: Cross Domain/Data joins not currently supported
Data Manipulation: Supports If/Then/Else statements Data Manipulation: Does not support the writing of SQL statements within the queries
Data Manipulation: Hide Duplicate Rows
Data Manipulation: Transpose data from rows to columns
Runtime: Runtime Filters & People Scope
5 SuccessFactors Proprietary and Confidential © 2012 SuccessFactors, An SAP Company. All rights reserved.
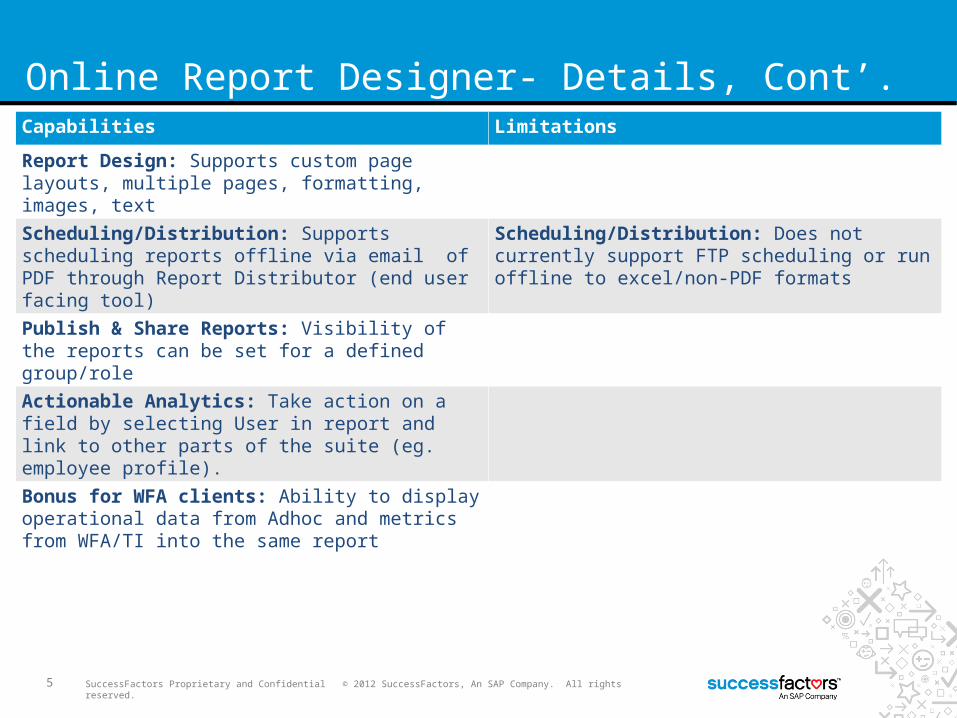
Online Report Designer- Details, Cont’.Capabilities Limitations
Report Design: Supports custom page layouts, multiple pages, formatting, images, textScheduling/Distribution: Supports scheduling reports offline via email of PDF through Report Distributor (end user facing tool)
Scheduling/Distribution: Does not currently support FTP scheduling or run offline to excel/non-PDF formats
Publish & Share Reports: Visibility of the reports can be set for a defined group/role Actionable Analytics: Take action on a field by selecting User in report and link to other parts of the suite (eg. employee profile). Bonus for WFA clients: Ability to display operational data from Adhoc and metrics from WFA/TI into the same report
User Guide

7 SuccessFactors Proprietary and Confidential © 2012 SuccessFactors, An SAP Company. All rights reserved.
User Guide
Category Feature Slide
Creating a Report
Adding Pages 10
Page Designer 11-12
List Report Adding a List Report 14-16
Adding Fields 17
People Scope 18
Filters 19
Sorting Columns 20
Calculated Columns 21
Field Concatenation 22
Number Formulas 23
Date Formulas 24
If/Then/Else Statements 25
Edit Labels 26
Custom Row Calculations 27
Group By 29
Form Based View 30
Formatting 31
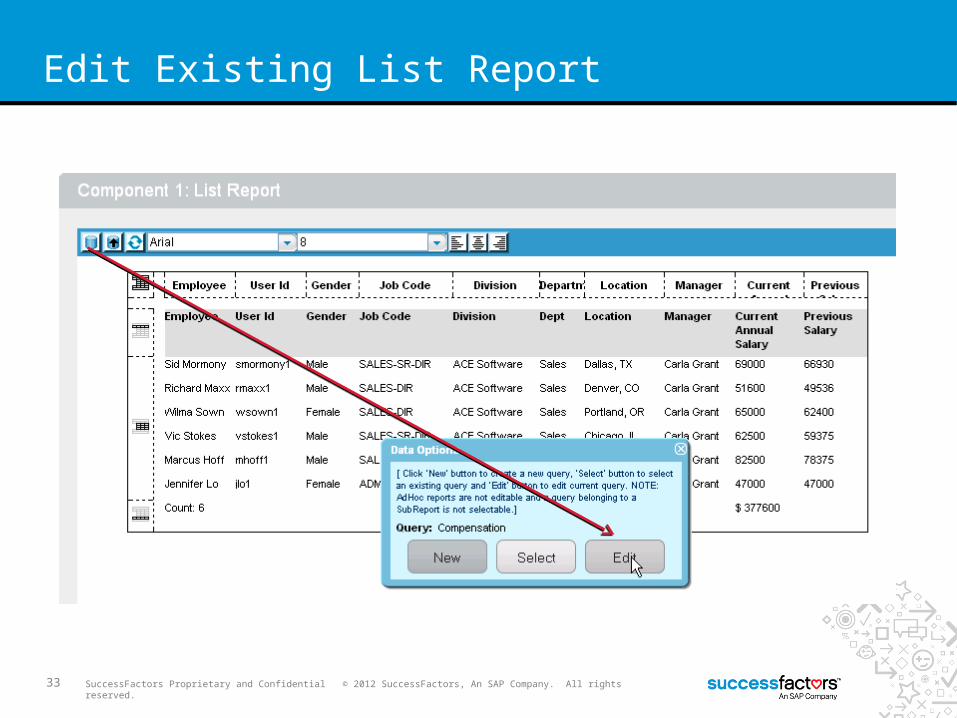
Edit Existing List Report 32
Category Feature Slide Pivots Pivot a List Report 34
Pivot Table Pivot a List Report 36-41
Formatting 42
Pivot Chart Pivot a List Report 44-49
Formatting 50
Tips & Tricks Keyboard Shortcuts 52
Left Hand Quick Panel 53
Chart & Table Templates 54
Report Headers & Footers 55
Sharing Reports
Sharing Reports 57
Report Menu Security 58
Report Ownership 59

Create New Report
9 SuccessFactors Proprietary and Confidential © 2012 SuccessFactors, An SAP Company. All rights reserved.
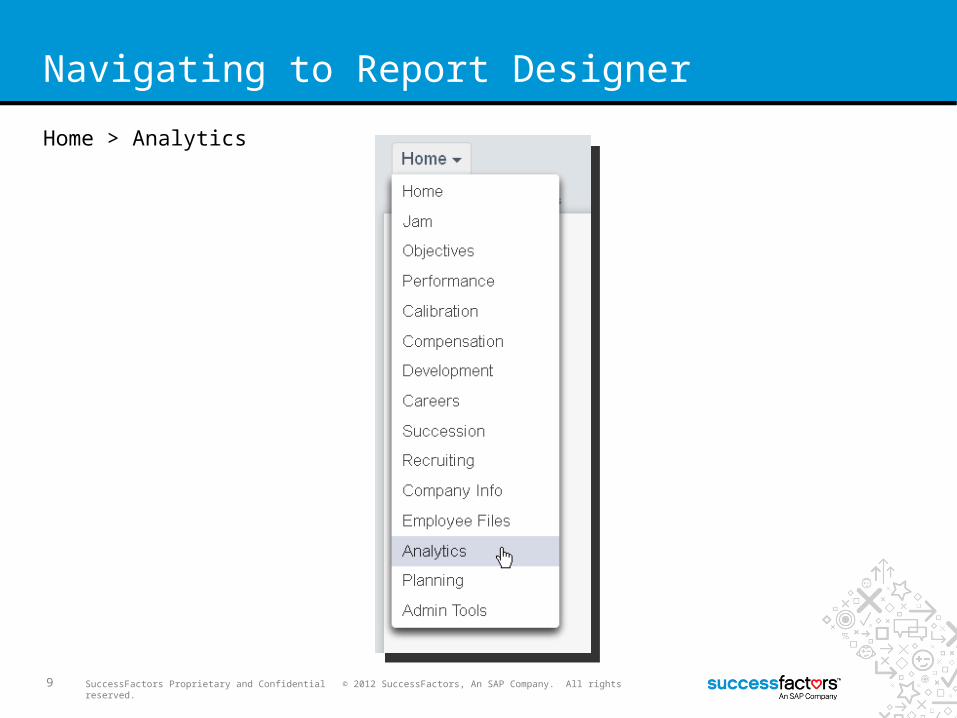
Navigating to Report Designer
Home > Analytics
10 SuccessFactors Proprietary and Confidential © 2012 SuccessFactors, An SAP Company. All rights reserved.
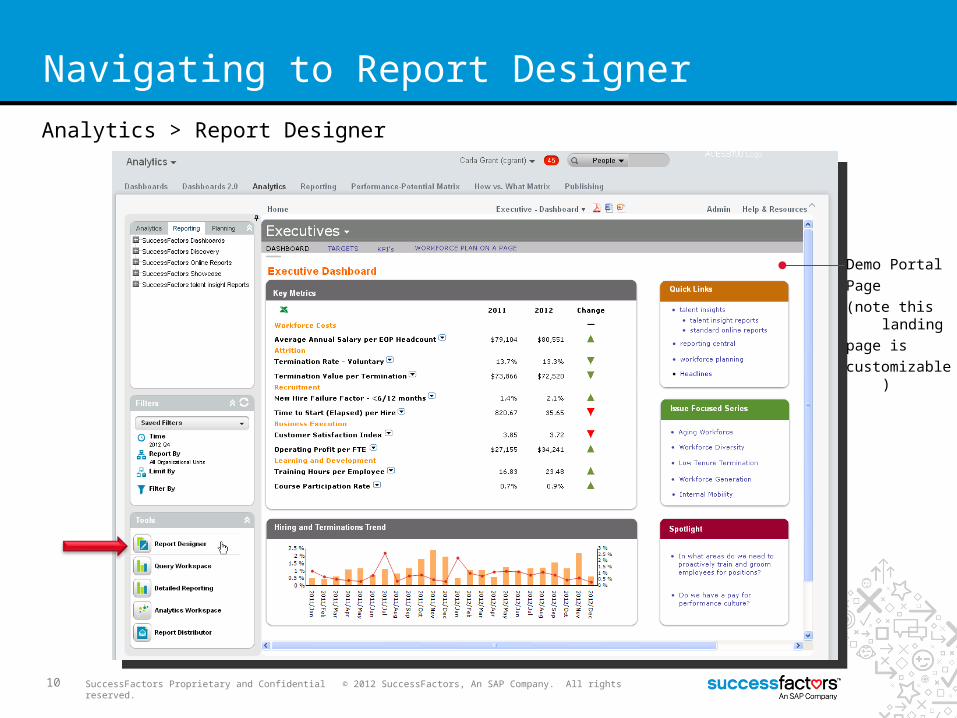
Navigating to Report Designer
Analytics > Report Designer
Demo Portal
Page
(note this landing
page is
customizable)
11 SuccessFactors Proprietary and Confidential © 2012 SuccessFactors, An SAP Company. All rights reserved.
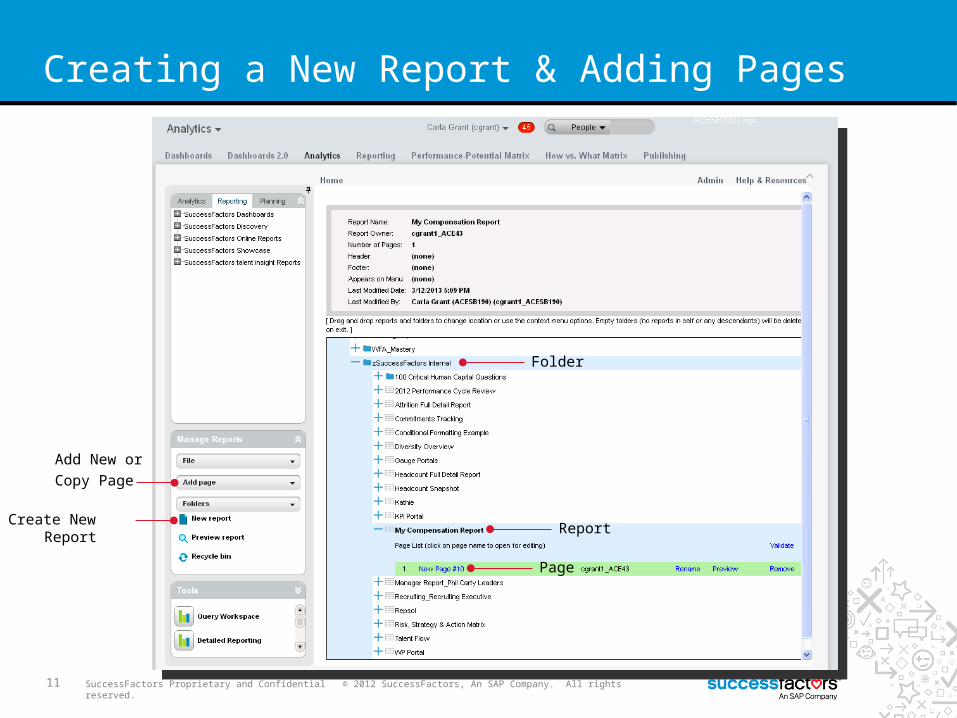
Creating a New Report & Adding Pages
Folder
Report
Page
Create New Report
Add New or
Copy Page
12 SuccessFactors Proprietary and Confidential © 2012 SuccessFactors, An SAP Company. All rights reserved.
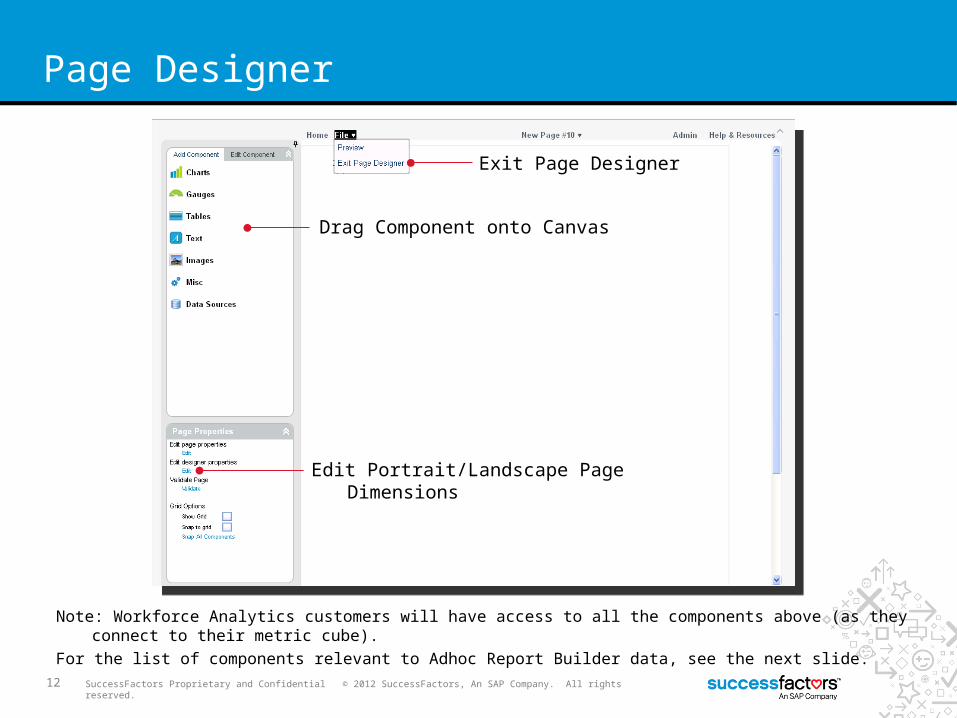
Page Designer
Exit Page Designer
Drag Component onto Canvas
Edit Portrait/Landscape Page Dimensions
Note: Workforce Analytics customers will have access to all the components above (as they connect to their metric cube).
For the list of components relevant to Adhoc Report Builder data, see the next slide.
13 SuccessFactors Proprietary and Confidential © 2012 SuccessFactors, An SAP Company. All rights reserved.
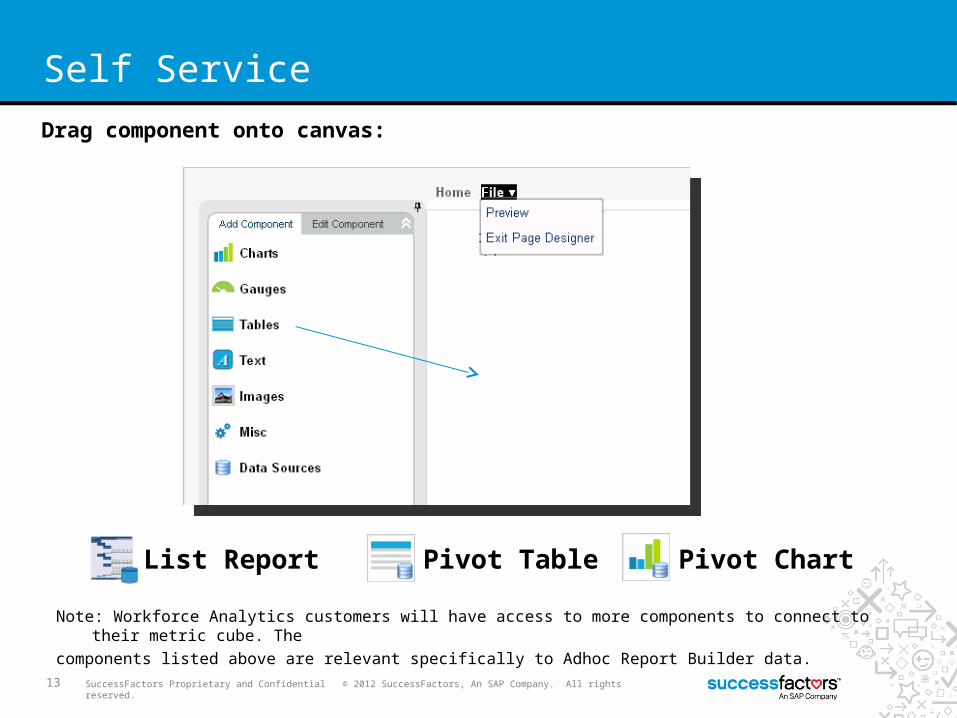
Self Service
Drag component onto canvas:
List Report Pivot ChartPivot Table
Note: Workforce Analytics customers will have access to more components to connect to their metric cube. The
components listed above are relevant specifically to Adhoc Report Builder data.
List Report Component
15 SuccessFactors Proprietary and Confidential © 2012 SuccessFactors, An SAP Company. All rights reserved.
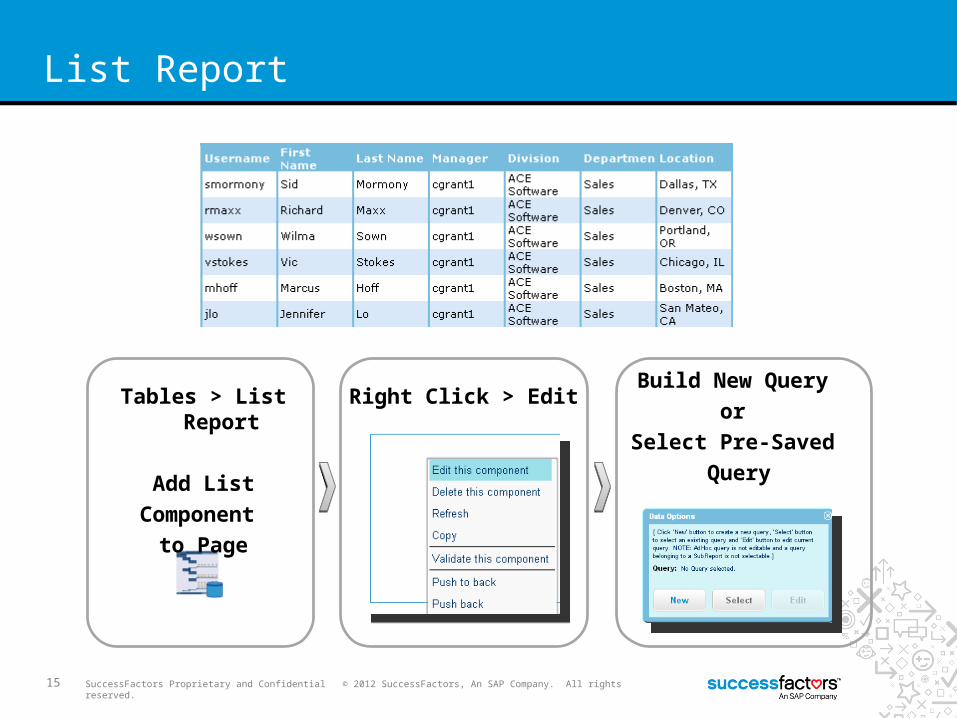
List Report
Right Click > EditBuild New Query
or
Select Pre-Saved
Query
Tables > List Report
Add List
Component
to Page

16 SuccessFactors Proprietary and Confidential © 2012 SuccessFactors, An SAP Company. All rights reserved.
New or Existing List Reports
ARB 2.0
Queries
Queries saved in
Detailed Reporting
Select an Existing/Saved Query
Build a New Query

17 SuccessFactors Proprietary and Confidential © 2012 SuccessFactors, An SAP Company. All rights reserved.
Build a New Query
1. Select Fields
(double click or
drag)
2. Add Filters
3. Change People
(eg. team view, detailed
reporting rights, etc)
4. Sort Columns
5. Add Calculated
Columns
6. Hide Duplicate
Rows
7. Pivot the List
8. Save
11
33
445566
22
7788
18 SuccessFactors Proprietary and Confidential © 2012 SuccessFactors, An SAP Company. All rights reserved.
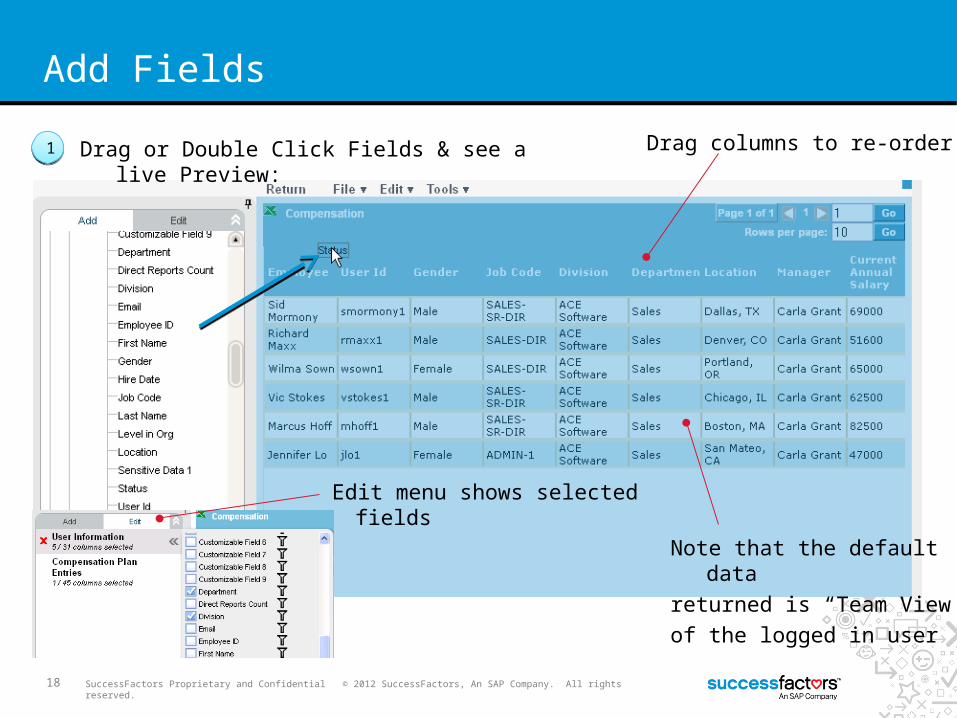
Add Fields
11 Drag or Double Click Fields & see a live Preview: Drag columns to re-order
Edit menu shows selected fields
Note that the default data
returned is “Team View”
of the logged in user

19 SuccessFactors Proprietary and Confidential © 2012 SuccessFactors, An SAP Company. All rights reserved.
Define People Scope
33 Define the scope of the people/records you want returned in your query
^ Detailed Reporting Privileges will appear here
20 SuccessFactors Proprietary and Confidential © 2012 SuccessFactors, An SAP Company. All rights reserved.
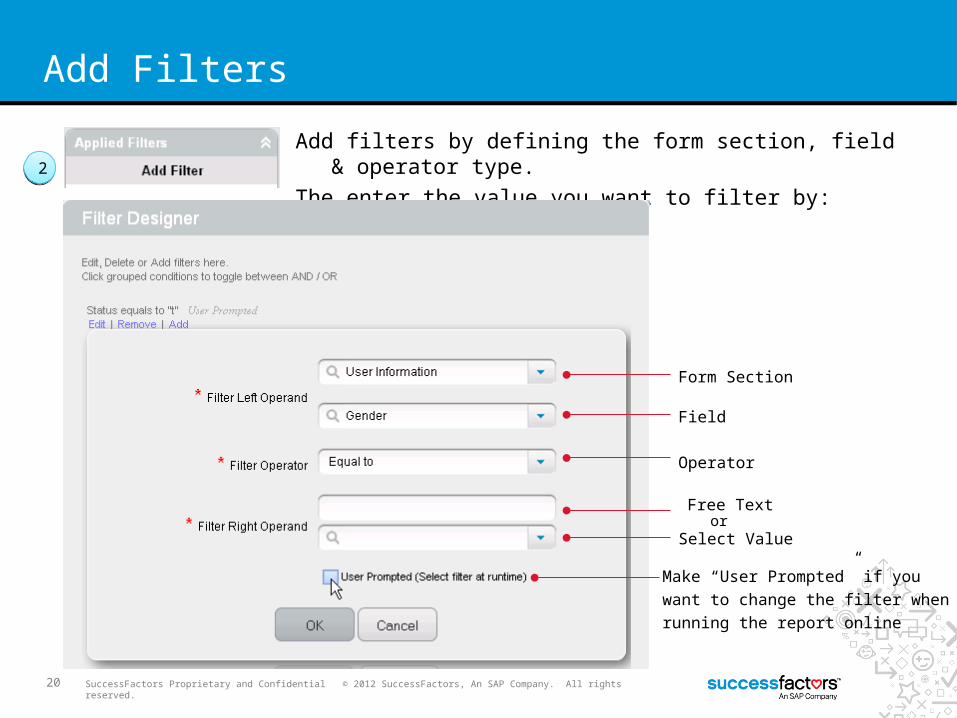
Add Filters
22
Add filters by defining the form section, field & operator type.
The enter the value you want to filter by:
Make “User Prompted” if you
want to change the filter when
running the report online
Form Section
Field
Operator
Free Text
Select Valueor
21 SuccessFactors Proprietary and Confidential © 2012 SuccessFactors, An SAP Company. All rights reserved.
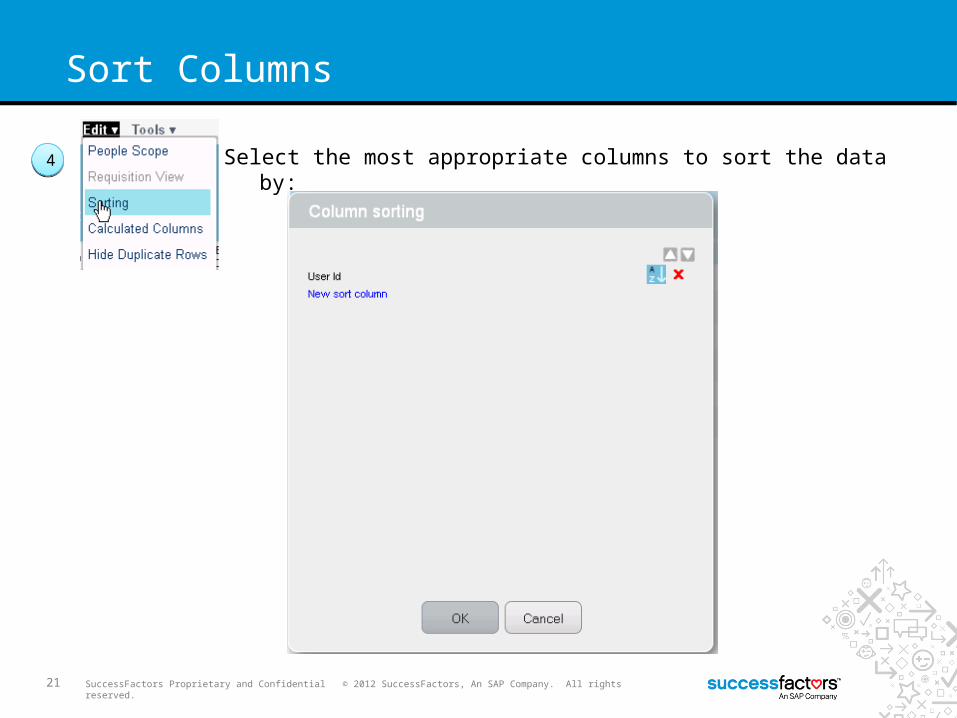
Sort Columns
44 Select the most appropriate columns to sort the data by:

22 SuccessFactors Proprietary and Confidential © 2012 SuccessFactors, An SAP Company. All rights reserved.
Calculated & Concatenated Columns
55Insert custom columns to calculate results or concatenate fields:
23 SuccessFactors Proprietary and Confidential © 2012 SuccessFactors, An SAP Company. All rights reserved.
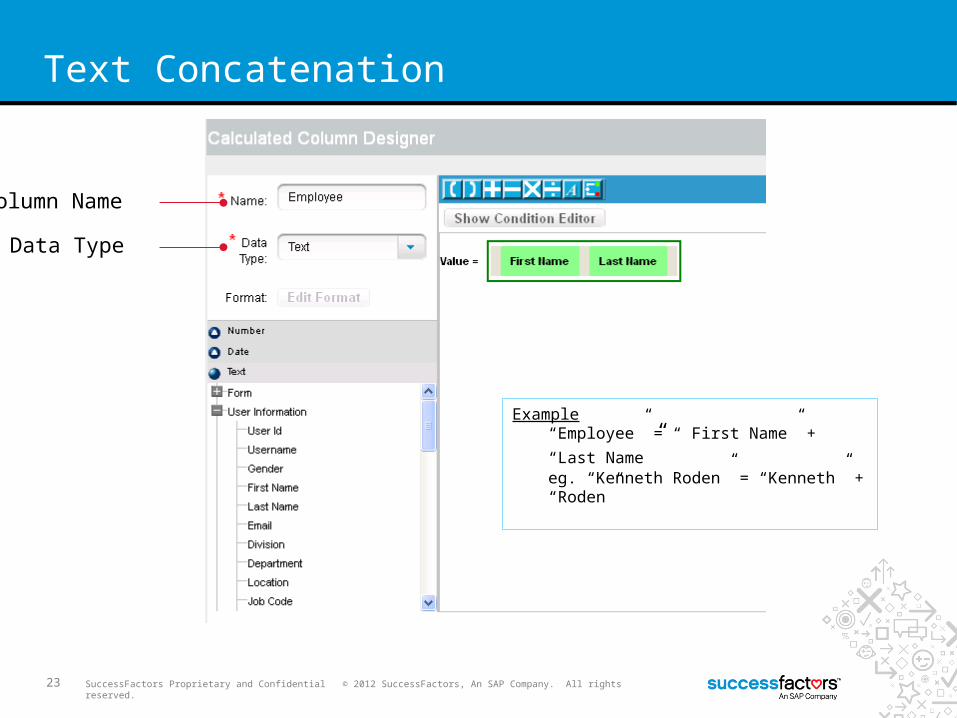
Text Concatenation
Data Type
Example
“Employee” = “ First Name” + “Last Name”eg. “Kenneth Roden” = “Kenneth” + “Roden”
Column Name
24 SuccessFactors Proprietary and Confidential © 2012 SuccessFactors, An SAP Company. All rights reserved.
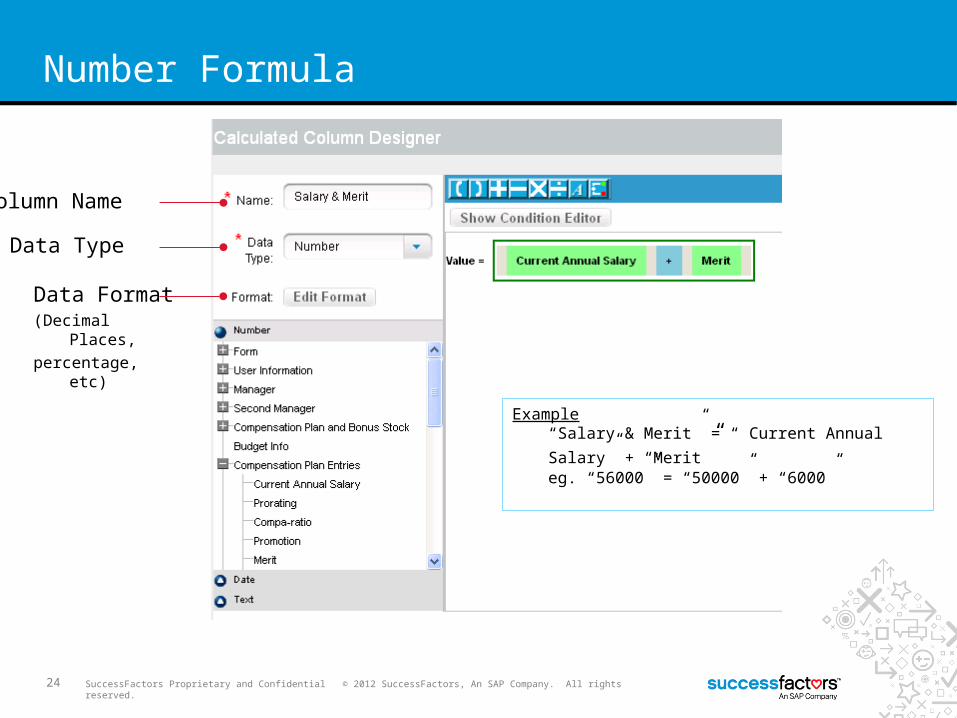
Number Formula
Data Type
Example
“Salary & Merit” = “ Current Annual Salary” + “Merit”eg. “56000” = “50000” + “6000”
Column Name
Data Format(Decimal Places,
percentage, etc)

25 SuccessFactors Proprietary and Confidential © 2012 SuccessFactors, An SAP Company. All rights reserved.
Date Formula
Data Type
Example
“Form Overdue Days” = “ Form End Date” + “Form Due Date
eg. “4” = “01/20/2013” - “01/16/2013”
Column Name
Data Format

26 SuccessFactors Proprietary and Confidential © 2012 SuccessFactors, An SAP Company. All rights reserved.
If/Then/Else Statements
Use the last icon to start
an if/then/else statement
Use the
“&&” or “OR”
icons to add
in more statements
Example
If Gender = M, Then = MaleElse = Female

27 SuccessFactors Proprietary and Confidential © 2012 SuccessFactors, An SAP Company. All rights reserved.
Easily Change Labels
Change the column heading by right clicking on the cell and replacing the text:
28 SuccessFactors Proprietary and Confidential © 2012 SuccessFactors, An SAP Company. All rights reserved.
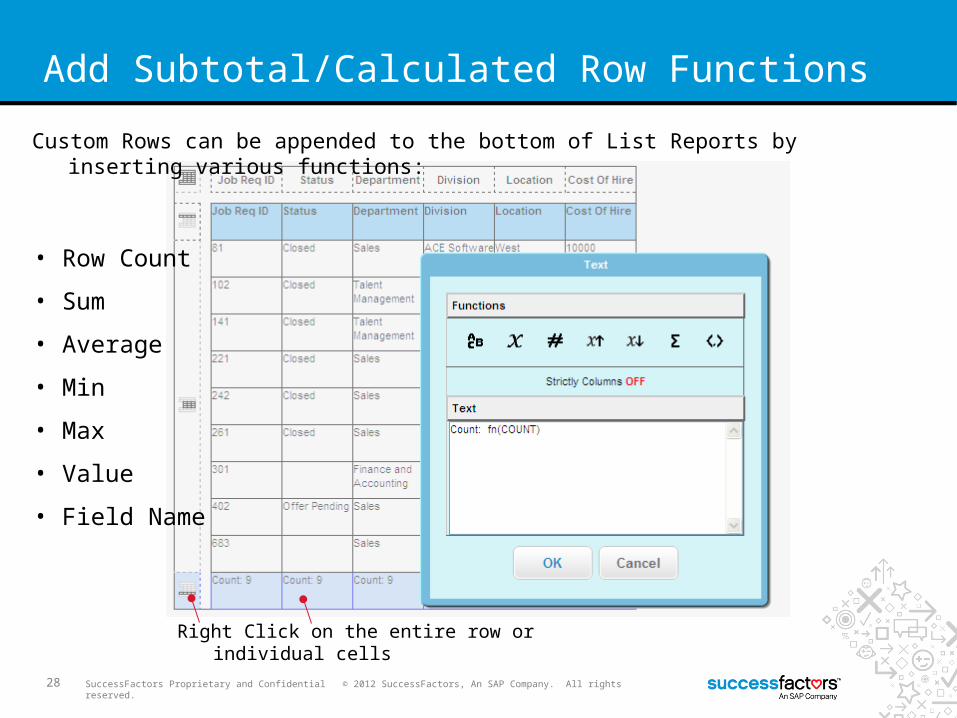
Add Subtotal/Calculated Row Functions
• Row Count
• Sum
• Average
• Min
• Max
• Value
• Field Name
Custom Rows can be appended to the bottom of List Reports by inserting various functions:
Right Click on the entire row or individual cells

29 SuccessFactors Proprietary and Confidential © 2012 SuccessFactors, An SAP Company. All rights reserved.
Hide/Show
Hide or Show sub total rows:
30 SuccessFactors Proprietary and Confidential © 2012 SuccessFactors, An SAP Company. All rights reserved.
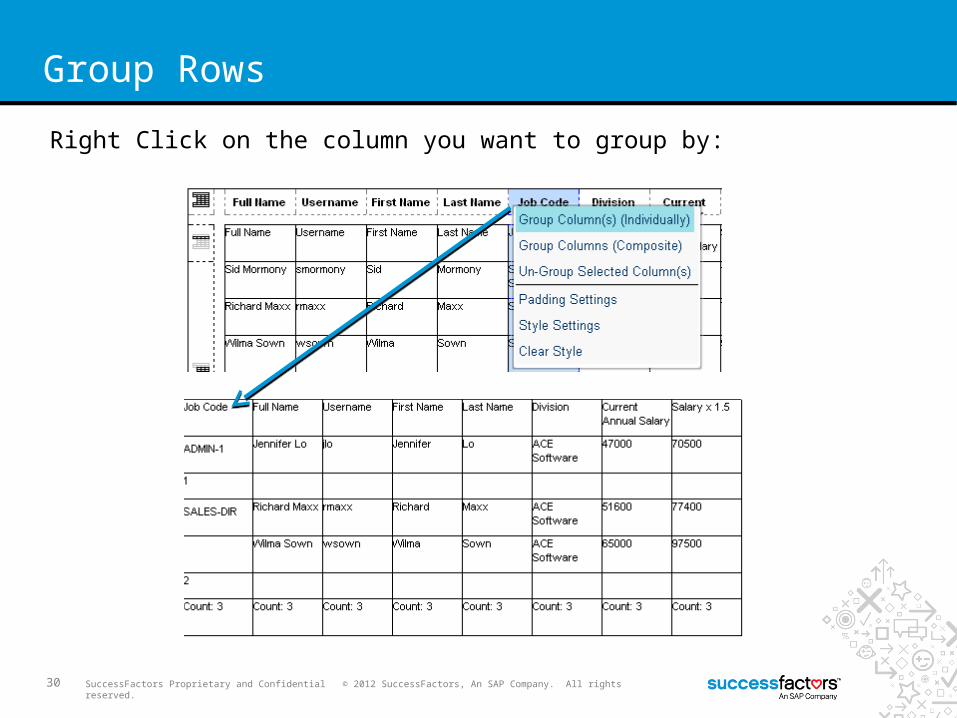
Group Rows
Right Click on the column you want to group by:

31 SuccessFactors Proprietary and Confidential © 2012 SuccessFactors, An SAP Company. All rights reserved.
Form Based View
Move fields around the canvas to create a form type view:
32 SuccessFactors Proprietary and Confidential © 2012 SuccessFactors, An SAP Company. All rights reserved.
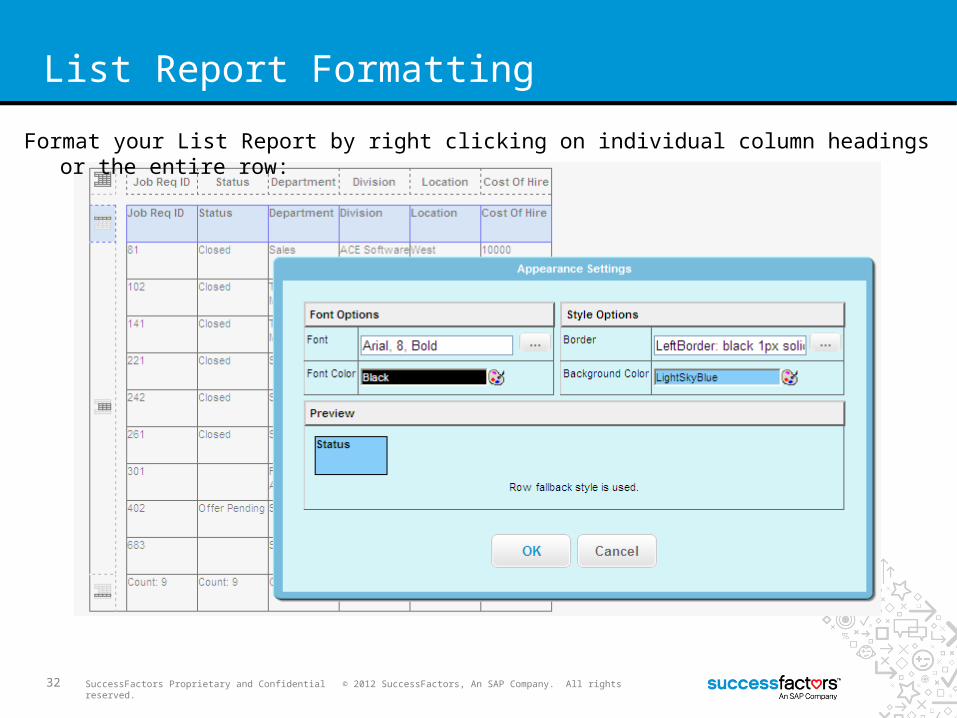
List Report Formatting
Format your List Report by right clicking on individual column headings or the entire row:
33 SuccessFactors Proprietary and Confidential © 2012 SuccessFactors, An SAP Company. All rights reserved.
Edit Existing List Report
Pivots
35 SuccessFactors Proprietary and Confidential © 2012 SuccessFactors, An SAP Company. All rights reserved.
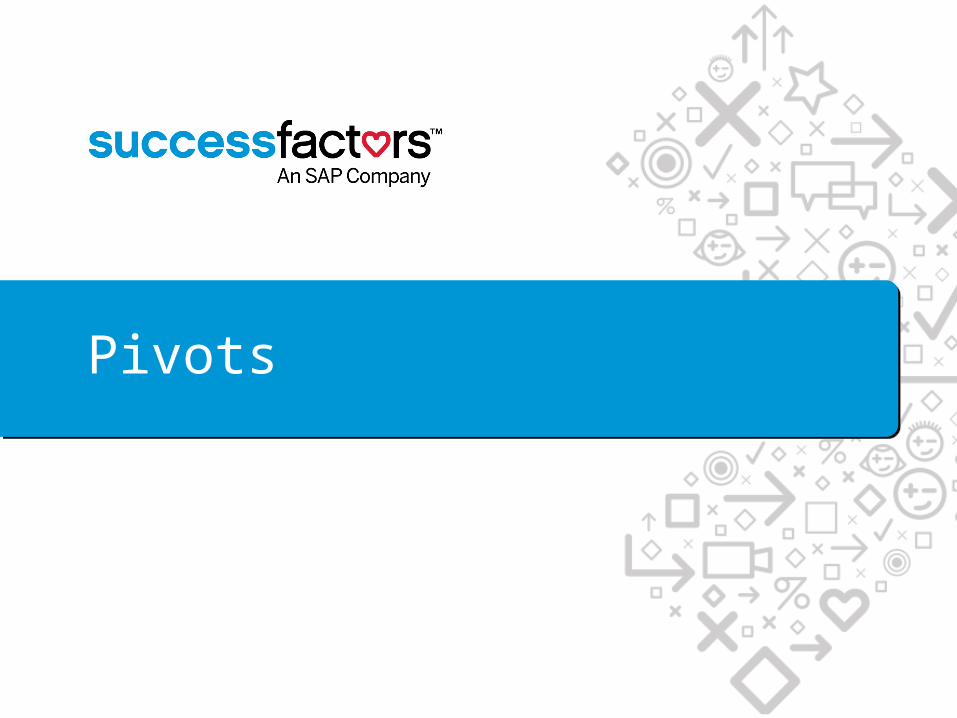
Pivot a List of Data
A List Report can be pivoted and then displayed as either a Table or Chart visual

Pivot Tables

37 SuccessFactors Proprietary and Confidential © 2012 SuccessFactors, An SAP Company. All rights reserved.
Pivot from a List Report
To Pivot a list of data, go to Tools > Pivot Query Designer:

38 SuccessFactors Proprietary and Confidential © 2012 SuccessFactors, An SAP Company. All rights reserved.
Create your Pivot in 3 steps:
Decide what you want to measure (drag into the white area of the workspace):11
22 Decide how you want to pivot the data- eg. Sum, Count, Average, Min or Max:

39 SuccessFactors Proprietary and Confidential © 2012 SuccessFactors, An SAP Company. All rights reserved.
Create your Pivot in 3 steps:
Slice the data by adding fields onto the columns & rows:33

40 SuccessFactors Proprietary and Confidential © 2012 SuccessFactors, An SAP Company. All rights reserved.
Pivot Tables
Use “Show Design View” to edit the Measures/Columns/Rows:

41 SuccessFactors Proprietary and Confidential © 2012 SuccessFactors, An SAP Company. All rights reserved.
Save your Pivot to add to your page
22
When finished, save your Pivot so that you can add it into a Pivot Table or Chart component:
42 SuccessFactors Proprietary and Confidential © 2012 SuccessFactors, An SAP Company. All rights reserved.
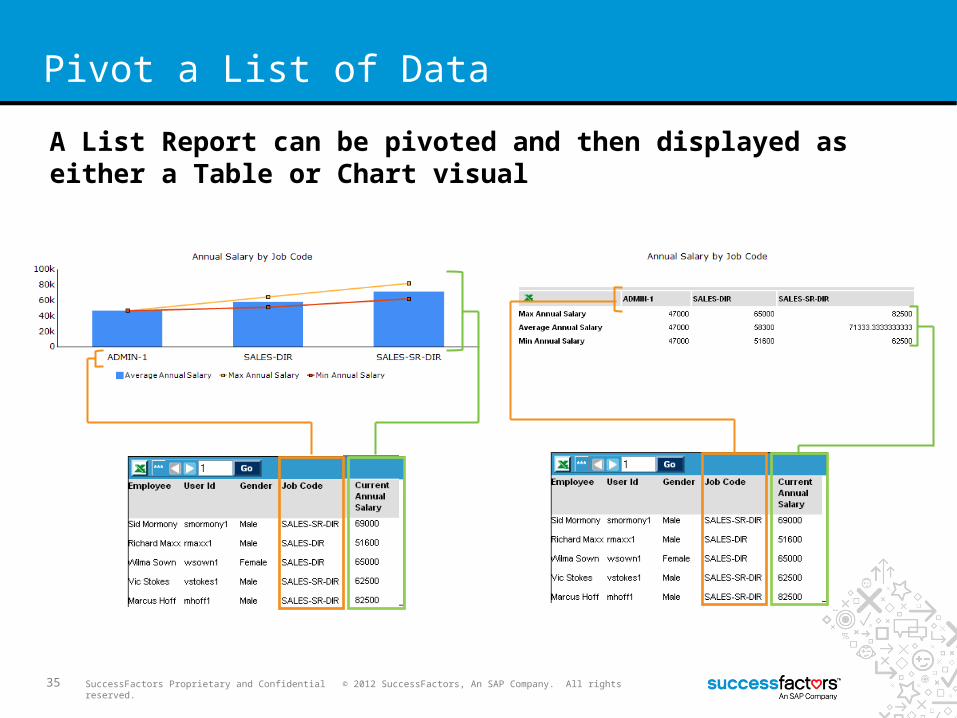
Pivot Table
Right Click > EditTables > Published Data Table
Add Table
Component
to Page
Select Query
To lay out the Pivot on the page, you must add a Pivot Component, then attach the saved query from your List Report:

43 SuccessFactors Proprietary and Confidential © 2012 SuccessFactors, An SAP Company. All rights reserved.
Pivot Table Formatting
Save a Table TemplateAdjust Column WidthsAdd Title, Border Color & Cell Padding
Pivot Chart
45 SuccessFactors Proprietary and Confidential © 2012 SuccessFactors, An SAP Company. All rights reserved.
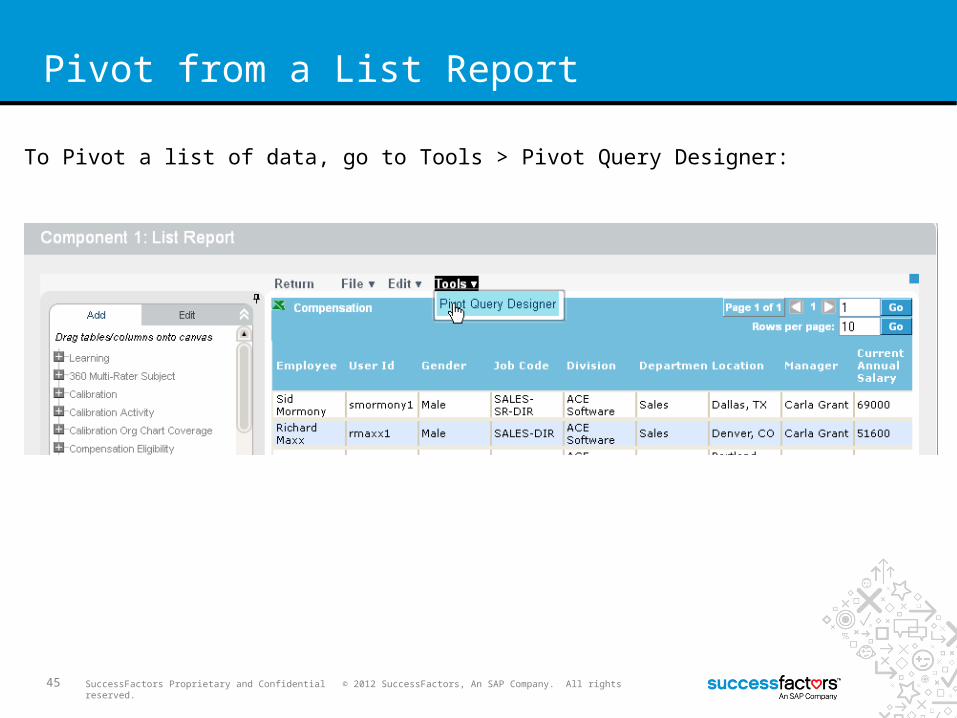
Pivot from a List Report
To Pivot a list of data, go to Tools > Pivot Query Designer:

46 SuccessFactors Proprietary and Confidential © 2012 SuccessFactors, An SAP Company. All rights reserved.
Create your Pivot in 3 steps:
Decide what you want to measure (drag into the white area of the workspace):11
22 Decide how you want to pivot the data- eg. Sum, Count, Average, Min or Max:

47 SuccessFactors Proprietary and Confidential © 2012 SuccessFactors, An SAP Company. All rights reserved.
Create your Pivot in 3 steps:
Slice the data by adding fields onto the columns & rows:33
48 SuccessFactors Proprietary and Confidential © 2012 SuccessFactors, An SAP Company. All rights reserved.
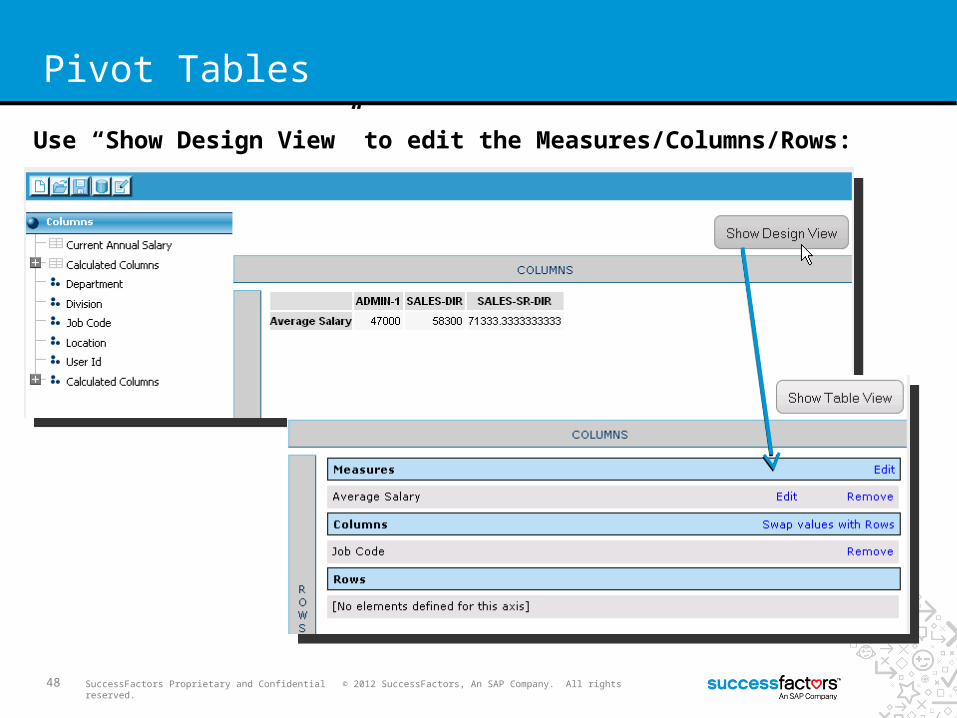
Pivot Tables
Use “Show Design View” to edit the Measures/Columns/Rows:

49 SuccessFactors Proprietary and Confidential © 2012 SuccessFactors, An SAP Company. All rights reserved.
Save your Pivot to add to your page
22
When finished, save your Pivot so that you can add it into a Pivot Table or Chart component:

50 SuccessFactors Proprietary and Confidential © 2012 SuccessFactors, An SAP Company. All rights reserved.
Pivot Chart
Right Click > EditChart >
Published Data
Chart
Add Chart
Component
to Page
Select Query
To lay out the Pivot on the page, you must add a Pivot Chart Component, then select the saved query from your List Report:

51 SuccessFactors Proprietary and Confidential © 2012 SuccessFactors, An SAP Company. All rights reserved.
Pivot Chart Formatting
Click on
each tab
to see different
options
Chart Type
(eg. Bar, Line,
Pie etc)
Chart Title
Preview
Changes
Turn on Value Labels Chart Colors Turn on/off Gridlines Save a Chart Template

Report Designer Tips

53 SuccessFactors Proprietary and Confidential © 2012 SuccessFactors, An SAP Company. All rights reserved.
Right Click Menu & Keyboard Shortcuts
Right Click to Edit, Delete, Copy and Paste.
Tip: Keyboard shortcuts “Del”, “Ctrl + C”, “CTRL + P” will also work.

54 SuccessFactors Proprietary and Confidential © 2012 SuccessFactors, An SAP Company. All rights reserved.
Left Hand Quick Panel
Make quick formatting changes using the left hand panel
55 SuccessFactors Proprietary and Confidential © 2012 SuccessFactors, An SAP Company. All rights reserved.
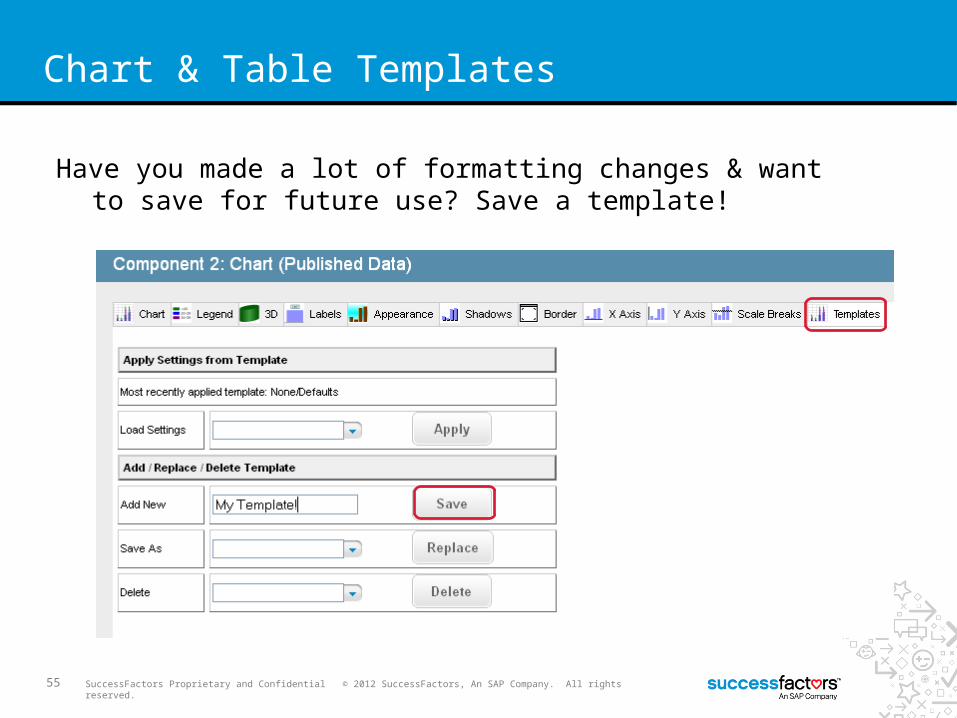
Chart & Table Templates
Have you made a lot of formatting changes & want to save for future use? Save a template!
56 SuccessFactors Proprietary and Confidential © 2012 SuccessFactors, An SAP Company. All rights reserved.
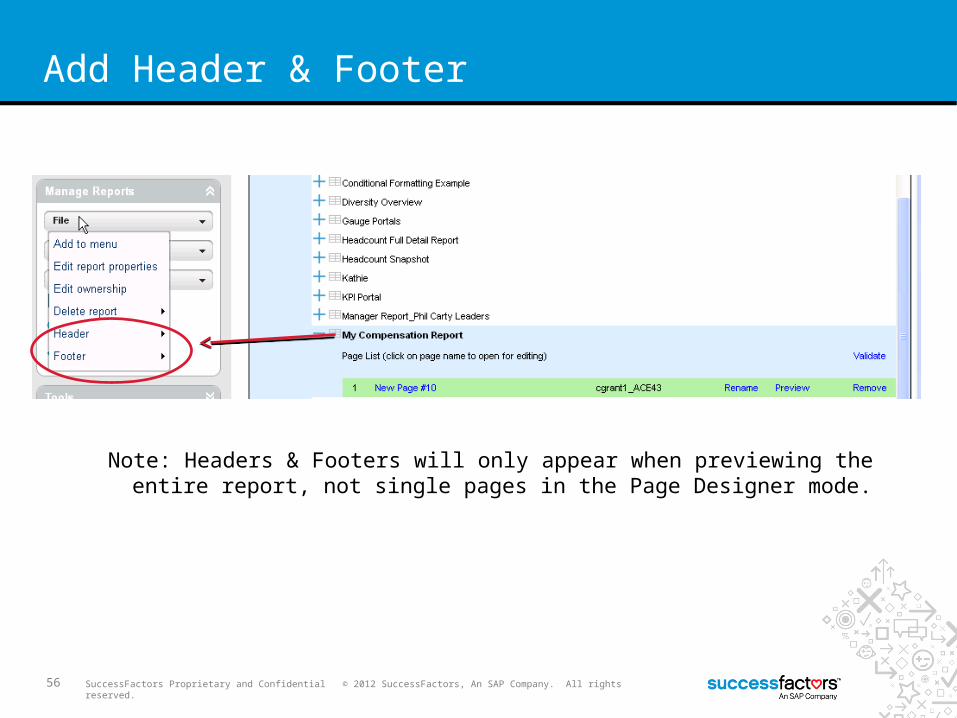
Add Header & Footer
Note: Headers & Footers will only appear when previewing the entire report, not single pages in the Page Designer mode.

Sharing Reports
58 SuccessFactors Proprietary and Confidential © 2012 SuccessFactors, An SAP Company. All rights reserved.
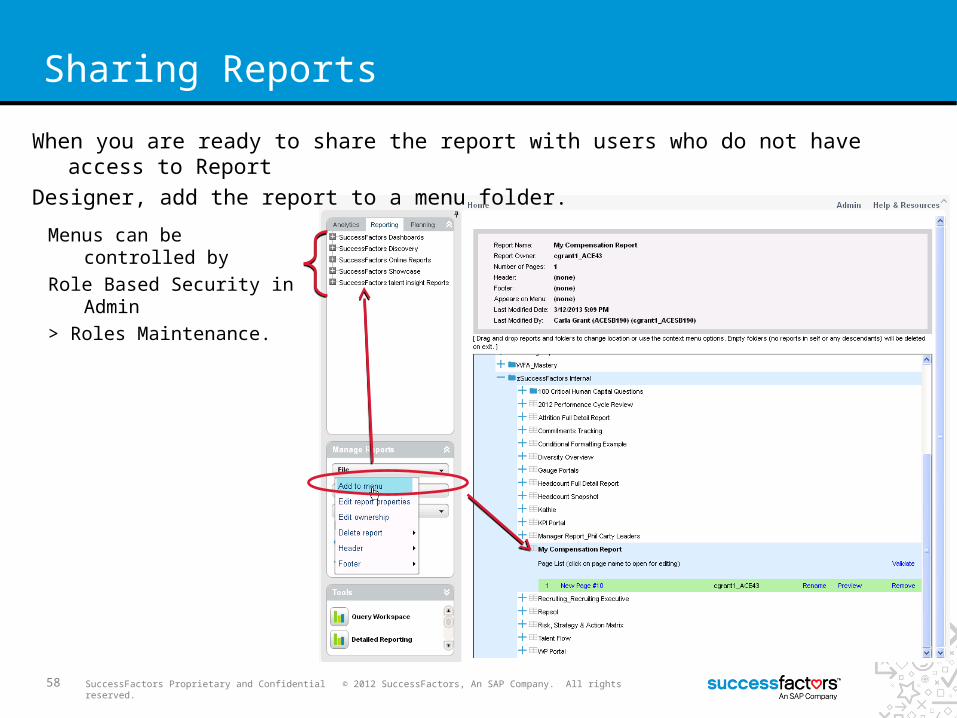
Sharing Reports
When you are ready to share the report with users who do not have access to Report
Designer, add the report to a menu folder.
Menus can be controlled by
Role Based Security in Admin
> Roles Maintenance.
59 SuccessFactors Proprietary and Confidential © 2012 SuccessFactors, An SAP Company. All rights reserved.
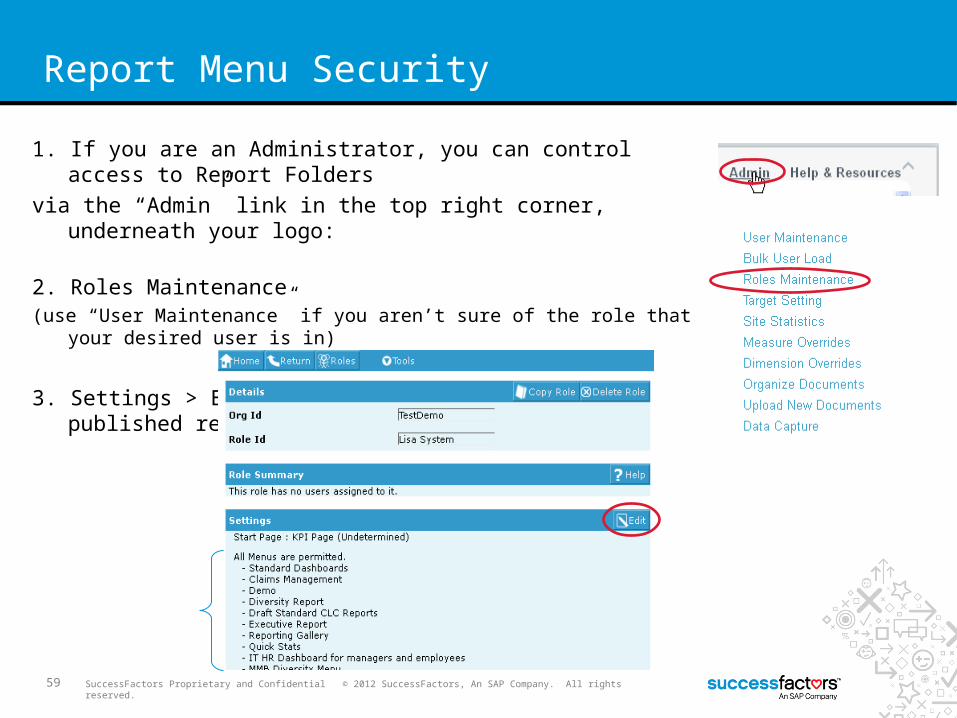
Report Menu Security
1. If you are an Administrator, you can control access to Report Folders
via the “Admin” link in the top right corner, underneath your logo:
2. Roles Maintenance (use “User Maintenance” if you aren’t sure of the role that your desired user is in)
3. Settings > Edit to refine list of available published report folder

60 SuccessFactors Proprietary and Confidential © 2012 SuccessFactors, An SAP Company. All rights reserved.
Report Ownership & Editing Rights
• Reports are owned by the user that creates them. • Reports can only be edited by the owner, unless an other user has the “Report Designer
Admin” permission.• The Report Owner or individual Page Owner can be change by using File > Edit Ownership.