Lithospheric Layering in the North American Cratonbeneath the North American plate, Lithos, 77(1-4),...
24
IRIS CORE PROPOSAL 2010 | VOLUME II | LITHOSPHERE, LITHOSPHERE/ASTHENOSPHERE BOUNDARY | II- 145 Lithospheric Layering in the North American Craton Huaiyu Yuan (Berkeley Seismological Laboratory), Barbara Romanowicz (Berkeley Seismological Laboratory) Recent receiver function studies detect structural boundaries under continental cratons at depths too shallow to be consis- tent with the lithosphere-asthenosphere boundary (LAB) as inferred from seismic tomography and other geophysical studies. Using the new results from our regional surface wave tomographic inversion for the North American upper mantle shear wave structure, we show (Figure1) that changes in the direction of azimuthal anisotropy with depth reveal the presence of two distinct lithospheric layers throughout the stable part of the North American (NA) continent [Yuan and Romanowicz, 2010]. (Figure 1 here) e top layer is thick (~150 km) under the Archean core and tapers out on the Paleozoic borders. Its thickness variations follow those of a highly depleted layer inferred from thermo-barometric analysis of xenoliths [Griffin et al., 2004]. e LAB is relatively flat (180-240km), in agreement with the presence of a thermal conductive root that subsequently formed around the depleted chemical layer [Cooper et al., 2004]. Our findings tie together seismological, geochemical and geodynamical studies of the cratonic lithosphere in North America. ey also suggest that the horizon detected in receiver function studies likely cor- responds to the sharp mid-lithospheric boundary rather than to the more gradual LAB. e change of fast axis direction of azi- muthal anisotropy with depth is a powerful tool for the detection of lithospheric layering under continents. Our study indicates that the "tectosphere" is no thicker than ~200-240km and that its chemically most depleted part reaches thicknesses of ~160-170 km (Figure 1). While the morphology of the North American craton may be exceptionally simple, the application of this tool to other continents should provide further insights on the assembly and evolution of cratons worldwide. References Cooper, C. M., A. Lenardic, and L. Moresi (2004), e thermal structure of stable continental lithosphere within a dynamic mantle, Earth Planet. Sci. Lett., 222(3-4), 807-817. Griffin, W. L., S. Y. O'Reilly, B. J. Doyle, N. J. Pearson, H. Coopersmith, K. Kivi, V. Malkovets, and N. Pokhilenko (2004), Lithosphere mapping beneath the North American plate, Lithos, 77(1-4), 873-922. Yuan, H., and B. Romanowicz (2010), Lithospheric layering in the North American Craton, Nature, DOI: 10.1038/nature09332, in press. Acknowledgements: is study was supported by NSF EAR-0643060 grant to BR. We are grateful to the IRIS DMC and the Geological Survey of Canada for providing the waveforms, K. Liu, M. Fouch, R. Allen, A. Frederiksen and A. Courtier for sharing their SKS splitting measure- ments, and S. Whitmeyer and K. Karlstrom for providing their Proterozoic Laurentia structural map. 0 100 200 300 400 35 40 45 50 55 60 65 A A’ Δ Δ Δ Y K W 3 F F C U L M 0 ° 50 ° Deviation from APM 1.55–1.35 Granite Proterozoic 2.5–1.8 Archean Crust 1.76–1.72 Yavapai 1.69–1.65 Mazatzal 1.3–0.95 Grenville 1.0–0.95 Mid- Continent Rift Eastern rift basins Greville Front Continent Rift Margin Layer 1 Layer 2 Asthenosphere LAB Upper mantle layering defined by changes in the direction of fast axis of azimuthal anisotropy. Left: deviation of the fast axis direction from the NA absolute plate motion direction, as a function of depth along a depth cross-section AA. Rapid changes of the fast axis directions mark the boundarie
Transcript of Lithospheric Layering in the North American Cratonbeneath the North American plate, Lithos, 77(1-4),...

IRIS CoRe PRoPoSal 2010 | Volume I I | l ITHoSPHeRe, l ITHoSPHeRe/aSTHenoSPHeRe bounDaRY | I I -145
Lithospheric Layering in the North American CratonHuaiyu Yuan (Berkeley Seismological Laboratory), Barbara Romanowicz (Berkeley Seismological Laboratory)
Recent receiver function studies detect structural boundaries under continental cratons at depths too shallow to be consis-tentwiththelithosphere-asthenosphereboundary(LAB)asinferredfromseismictomographyandothergeophysicalstudies.Using the new results from our regional surface wave tomographic inversion for the North American upper mantle shear wave structure,weshow(Figure1)thatchangesinthedirectionofazimuthalanisotropywithdepthrevealthepresenceoftwodistinctlithosphericlayersthroughoutthestablepartoftheNorthAmerican(NA)continent[Yuan and Romanowicz,2010].(Figure1here)Thetoplayeristhick(~150km)undertheArcheancoreandtapersoutonthePaleozoicborders.Itsthicknessvariationsfollow those of a highly depleted layer inferred from thermo-barometric analysis of xenoliths [Griffin et al.,2004].TheLABisrelativelyflat(180-240km),inagreementwiththepresenceofathermalconductiverootthatsubsequentlyformedaroundthedepleted chemical layer [Cooper et al.,2004].Ourfindingstietogetherseismological,geochemicalandgeodynamicalstudiesofthe cratonic lithosphere in North America. They also suggest that the horizon detected in receiver function studies likely cor-respondstothesharpmid-lithosphericboundaryratherthantothemoregradualLAB.Thechangeoffastaxisdirectionofazi-muthal anisotropy with depth is a powerful tool for the detection of lithospheric layering under continents. Our study indicates thatthe"tectosphere"isnothickerthan~200-240kmandthatitschemicallymostdepletedpartreachesthicknessesof~160-170km(Figure1).WhilethemorphologyoftheNorthAmericancratonmaybeexceptionallysimple,theapplicationofthistooltoother continents should provide further insights on the assembly and evolution of cratons worldwide.
References
Cooper,C.M.,A.Lenardic,andL.Moresi(2004),Thethermalstructureofstablecontinentallithospherewithinadynamicmantle,Earth Planet. Sci. Lett., 222(3-4),807-817.
Griffin,W.L.,S.Y.O'Reilly,B.J.Doyle,N.J.Pearson,H.Coopersmith,K.Kivi,V.Malkovets,andN.Pokhilenko(2004),Lithospheremappingbeneath the North American plate, Lithos, 77(1-4),873-922.
Yuan,H.,andB.Romanowicz(2010),LithosphericlayeringintheNorthAmericanCraton,Nature,DOI:10.1038/nature09332,inpress.
Acknowledgements:ThisstudywassupportedbyNSFEAR-0643060granttoBR.WearegratefultotheIRISDMCandtheGeologicalSurveyofCanadaforprovidingthewaveforms,K.Liu,M.Fouch,R.Allen,A.FrederiksenandA.CourtierforsharingtheirSKSsplittingmeasure-ments,andS.WhitmeyerandK.KarlstromforprovidingtheirProterozoicLaurentiastructuralmap.
0
100
200
300
4003540
4550556065
A A’∆
∆ ∆
YKW3
FFC
ULM
0 ° 50 °
Deviation from APM
1.55–1.35 Granite
Proterozoic 2.5–1.8
Archean Crust
1.76–1.72 Yavapai
1.69–1.65 Mazatzal
1.3–0.95 Grenville1.0–0.95 Mid-Continent Rift
Eastern rift basins
Greville FrontContinent Rift Margin
Layer 1
Layer 2
Asthenosphere
LAB
Figure 1.
upper mantle layering defined by changes in the direction of fast axis of azimuthal anisotropy. left: deviation of the fast axis direction from the na absolute plate motion direction, as a function of depth along a depth cross-section aa. Rapid changes of the fast axis directions mark the boundarie

II-146 | IRIS CoRe PRoPoSal 2010 | Volume I I | l ITHoSPHeRe, l ITHoSPHeRe/aSTHenoSPHeRe bounDaRY
Survival and Demise of Thick Continental Lithosphere under Highly Extended CrustVera Schulte-Pelkum (University of Colorado at Boulder), Glenn Biasi (University of Nevada, Reno), Anne Sheehan (University of Colorado at Boulder), Craig Jones (University of Colorado at Boulder)
Wefindanunusually thick lithosphereunder ahighly extendedportionof theBasinandRange.WedeterminedMohodepthsusingP-to-SreceiverfunctionsfromtheEarthScopeTransportableArrayandtheSouthernGreatBasinDigitalSeismicNetwork.Asonewouldexpectfromisostasy,thecrustisthickerunderthehigh-elevationNorthernBasinandRangeandthin-nerinthelow-lyingSouthernBasinandRange.However,wefindanunexpectedcrustalkeelunderthehighlyextendedDeathValleyextensionalareainbetween,underlyinglowsurfaceelevationsandputtingthecrustwelloutsideofisostaticequilibrium.Dense crust is not found in this area in refraction results, but a lithospheric mantle keel fits the seismic observations as well as the observation of anomalous isotope ratios in basalts from this area that require an old, enriched lithospheric source [Farmer et al., 1989].UnusuallylowεNdvaluesindicatinganoldlithosphericmantlesourcewerereplacedbyasthenosphericbasaltsintheLakeMeadextensionalarea,butpersistduringtheentirehistoryofbasalticmagmatism(12-0Ma)intheDeathValleyextensional area, matching the geographical extent of dense mantle. If the anomaly is isostatic and a lithosphere-asthenosphere densitycontrastof50kg/m³(0.05g/cm³)isassumed,thelithosphere-asthenosphereboundaryliesatameandepthof120kmwithintheanomaly,comparedtoameanof40kmoutsidetheanomaly.Weconcludethatdeformationwashighlyincoherentbetweenthesurfaceandthelowercrustandmantlelithosphere,andthatanislandofPrecambrianlithospherehassurvivedbeneaththeDeathValleyextensionalareaandmaycurrentlybesinking.
References
Farmer,G.L.,F.V.Perry,S.Semken,B.Crowe,D.Curtis,D.J.DePaolo,Isotopicevidenceonthestructureandoriginofsubcontinentallitho-spheric mantle in southern Nevada, J. Geophys. Res. 94,B6,7885-7898,1989
Acknowledgements:ThisresearchisfundedbyNSFgrantEAR-0838509.SeismicdatawiththeexceptionofthosefromtheSouthernGreatBasinDigitalSeismicNetworkwereobtainedfromtheIRISDMC.
Seismic station
Basalt samples:
Nd = +4 to +10
Nd = -5 to +4
Nd = -12 to -7
(asthenospheric)
(intermediate)
(old lithospheric)
refraction profile
man
tle
con
trib
uti
on
to s
urf
ace
elev
atio
n (k
m)
Death
Valley
Nevada Test Site
Ow
ensValley
SierraN
evada
Lunar Crater
Cima
LakeMead
Amargosa
Desert
NEVADA
CALIFORNIA ARI
ZON
AU
TAH
SpringMtns
Co
lora
do
Pla
teau
mantle contribution to surface elevation (color), overlaid by topography (shading) for orienta-tion. Pink triangles (seismic stations) are location where moho depth was measured, white stars (refraction profile centers) mark crustal velocity and density values from refraction experiments used to convert receiver function moho times to depth and to calculate isostatic contribution of the crust. mantle buoyancy is well constrained in areas where both seismic stations and refraction data exist in the vicinity. Circles mark locations of basalts with measured neodymium isotope ratios and are plotted so that younger samples overlay older ones.

IRIS CoRe PRoPoSal 2010 | Volume I I | l ITHoSPHeRe, l ITHoSPHeRe/aSTHenoSPHeRe bounDaRY | I I -147
The Lithospheric Structure of the Mendocino Triple Junction from Receiver Function AnalysisYongbo Zhai (Rice University), Alan Levander (Rice University)
The Mendocino Triple Junction (MTJ), whichoccurs offshore from Cape Mendocino at ~ 40.50N in northern California, is the intersection of the Gorda plate, Pacific plate, and North Americanplate. It was formed ~28 Ma when the Pacificspreading ridge first contacted the western margin of the North American plate. In rigid plate frame, thenorthwardmigratingMTJ leaves in itswakeaslab-free region filled by upwelling asthenospheric mantle just south of the Gorda plate, widely known as the “slab window” model.
ToexaminethelithosphericstructureintheMTJregion, especially the structure of the “slab win-dow”,wegenerateda3DPdSreceiverfunctionCCPimage.We used 186 earthquakes recorded at 111broadband stations of the Flexible Array Mendocino Experiment (FAME) together with the BerkeleyDigitalSeismicNetworkandUSArrayTransportableArray. The data were depth mapped and laterally migrated incorporating 3D traveltime corrections determinedfrom3DP-andS-tomographymodels.
The resulting image confirms the crustal structure oftheMendocinoTripleJunctionSeismicExperiment(MTJSE)andrevealsdetailedlithosphericstructure.The top and bottom of the Gorda slab are identified by theMohoandLithosphere-AsthenosphereBoundary(LAB) in the subduction regime, showing that thethickness of the Gorda slab is ~ 40 km, comparable with that predicted by half-space cooling model. The “slab window” in the transform regime has a com-plex structure, but its top can be traced continuously to theGorda LAB, although the transition ismoreabrupt than that suggested by the refraction veloc-itymodel.TheLABisshallowestbeneathClearLakevolcanoandLakePillsburywherehighheatflowandbasalt intrusions are observed respectively. Under the westernpartofnorthernGreatValley,theMohosig-nal is absent, likely due to the hydration and serpen-tinization of the upper mantle during the subduction oftheGordaslab~2Ma.TheGreatValleyophioliteisobserved at the crustal depth instead.
References
Zhai,Y.,andA.Levander(2010),TheLithosphere-AsthenosphereBoundaryandtheSlabWindowintheMendocinoTripleJunctionRegion,inpreparation.
Acknowledgements:ThisprojectissupportedbyNSFgrantsEAR-0642474andEAR-0746379.
-150
-125
-100
-75
-50
0
Dep
th (k
m)
050100150200250
-1 0 1Distance (km)
-505
10152025303540
Dept
h (k
m)
0 50 100 150 200 250Distance (km)
2.5 3.0 3.5 4.0 4.5 5.0 5.5 6.0 6.5 7.0 7.5 8.0 8.5 Velocity, km/s
SP 901 902 903 904 905 906 907 908 909 910 911
MTJSE Line 9Line 1
NorthSouth
Clear Lake VBasaltIntrusions
LAB Gorda Plate
Slab Window
MTJSE Line 9 & 1.25 Hz PdS RFs
MFZ
SEDGE
Top OCGorda Moho
Transform Moho
Multiple
Subduction regimeTransform regime
−126˚ −124˚ −122˚ −120˚38˚
40˚
42˚
−6000 −4000 −2000 0 2000 4000elevation (m)
Flexible Array Mendocino Experiment (FAME)
-125
-100
-75
-50
0
Dep
th (k
m)
0 50 100 150 200 250 300Distance (km)
-1 0 1
7
7
6
5 4
5 67 8
3
2 3 4 5 6 7 830
20
10
0
140160180200220
Depth b
.s.l. (km
)
West
b)2 4 51 8 3 6 7
reflective zones on depth-migrated section of Line 1
Line 9
100 80 60 40 20 0
39.5 North: MTJSE Line 1 & 1.25 Hz PdS RFs
1.25 Hz / 15km
No Vertical Exaggeration
West East
0102030D
epth
(km
) -100 -75 -50 -25 0 25 50 75 100CoastSAF MF BSF
1.5 3.5 5.5 7.5 8.5
Great Valley
Slab Window
CR MohoSN Moho
GV Ophiolite
Basalt Sills
−126˚ −124˚ −122˚ −120˚38˚
40˚
42˚
−6000 −4000 −2000 0 2000 4000elevation (m)
Flexible Array Mendocino Experiment (FAME)
figure 1. Coast-range-parallel receiver function cross-section. P-wave velocity model of mTJSe line 9 is shown in the upper panel, superimposed by the depth migrated single-fold section. The black solid line on top of the CCP image schematically shows the surface elevation along the cross-section, whereas the red dashed line schematically shows the heat flow. The red tri-angles denote projected stations, and the black dots denote the projected earthquake hypo-centers since 1985 with m > 3.0. The three strong events in the CCP image in order of depth are the moho, lab, and first moho multiple respectively. The black lines mark the moho depth determined by the Rf image, and white lines mark the top and bottom of the Gorda slab. The basalt intrusions near lake Pillsbury are represented by strong reflections of the depth migrated section from the lower crust and moho. black dashed line illustrates the southern edge of the Gorda plate, which dips to the south.
figure 2. east-west receiver function cross-section at 39.50n. P-wave velocity model of the mTJSe line 1 is shown in the upper panel, superimposed by the depth migrated single-fold section. The white dots denote the projected earthquakes beneath the maacama fault and bartlett Springs fault. The black lines mark the moho depth determined by the Rf image. The basalt intrusions near lake Pillsbury are represented by strong reflections from the lower crust and moho. The Great Valley ophiolite (GVo) is a high velocity body bounded by white lines between the Coast Ranges (CR) and Sierra nevada (Sn) moho. note that no clear moho signal is observed beneath the northern Great Valley.
II-148 | IRIS CoRe PRoPoSal 2010 | Volume I I | l ITHoSPHeRe, l ITHoSPHeRe/aSTHenoSPHeRe bounDaRY
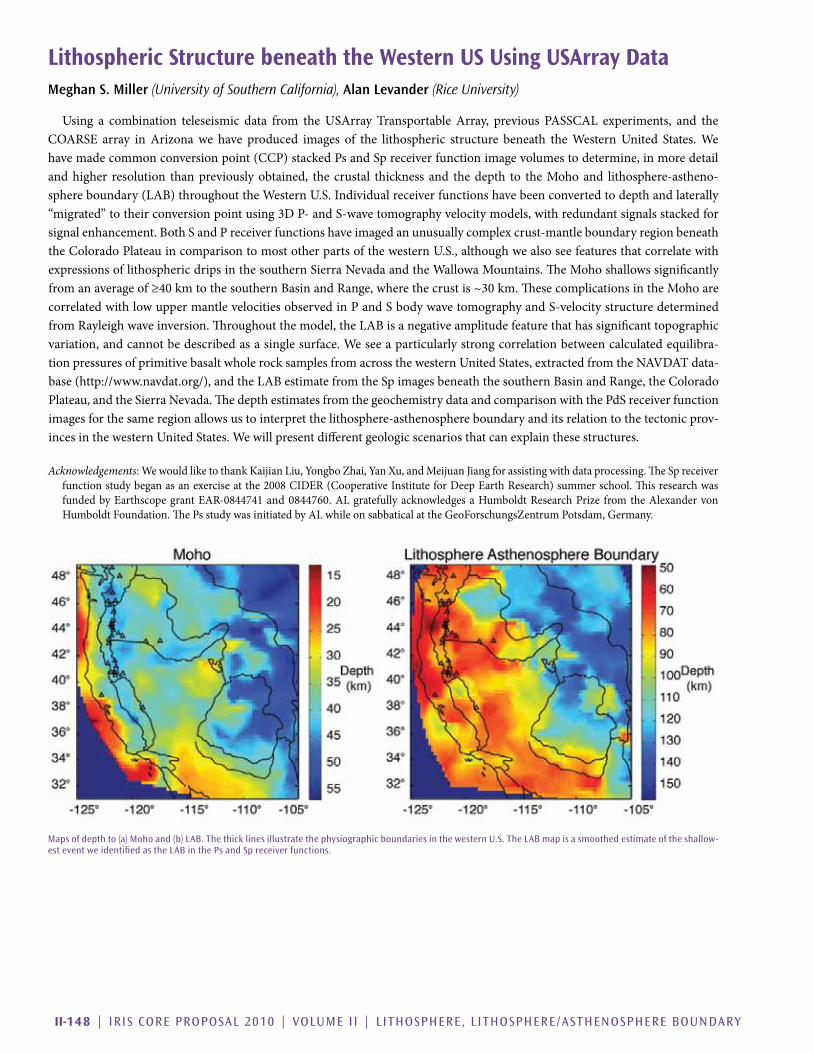
Lithospheric Structure beneath the western US Using USArray DataMeghan S. Miller (University of Southern California), Alan Levander (Rice University)
Using a combination teleseismic data from theUSArray TransportableArray, previous PASSCAL experiments, and theCOARSE array inArizonawe have produced images of the lithospheric structure beneath theWesternUnited States.Wehavemadecommonconversionpoint(CCP)stackedPsandSpreceiverfunctionimagevolumestodetermine,inmoredetailand higher resolution than previously obtained, the crustal thickness and the depth to the Moho and lithosphere-astheno-sphereboundary(LAB)throughouttheWesternU.S.Individualreceiverfunctionshavebeenconvertedtodepthandlaterally“migrated”totheirconversionpointusing3DP-andS-wavetomographyvelocitymodels,withredundantsignalsstackedforsignalenhancement.BothSandPreceiverfunctionshaveimagedanunusuallycomplexcrust-mantleboundaryregionbeneaththeColoradoPlateauincomparisontomostotherpartsofthewesternU.S.,althoughwealsoseefeaturesthatcorrelatewithexpressionsoflithosphericdripsinthesouthernSierraNevadaandtheWallowaMountains.TheMohoshallowssignificantlyfromanaverageof≥40kmtothesouthernBasinandRange,wherethecrustis~30km.ThesecomplicationsintheMohoarecorrelatedwithlowuppermantlevelocitiesobservedinPandSbodywavetomographyandS-velocitystructuredeterminedfromRayleighwaveinversion.Throughoutthemodel,theLABisanegativeamplitudefeaturethathassignificanttopographicvariation,andcannotbedescribedasasinglesurface.Weseeaparticularlystrongcorrelationbetweencalculatedequilibra-tionpressuresofprimitivebasaltwholerocksamplesfromacrossthewesternUnitedStates,extractedfromtheNAVDATdata-base(http://www.navdat.org/),andtheLABestimatefromtheSpimagesbeneaththesouthernBasinandRange,theColoradoPlateau,andtheSierraNevada.ThedepthestimatesfromthegeochemistrydataandcomparisonwiththePdSreceiverfunctionimages for the same region allows us to interpret the lithosphere-asthenosphere boundary and its relation to the tectonic prov-incesinthewesternUnitedStates.Wewillpresentdifferentgeologicscenariosthatcanexplainthesestructures.
Acknowledgements: WewouldliketothankKaijianLiu,YongboZhai,YanXu,andMeijuanJiangforassistingwithdataprocessing.TheSpreceiverfunctionstudybeganasanexerciseatthe2008CIDER(CooperativeInstituteforDeepEarthResearch)summerschool.ThisresearchwasfundedbyEarthscopegrantEAR-0844741and0844760.ALgratefullyacknowledgesaHumboldtResearchPrize fromtheAlexandervonHumboldtFoundation.ThePsstudywasinitiatedbyALwhileonsabbaticalattheGeoForschungsZentrumPotsdam,Germany.
maps of depth to (a) moho and (b) lab. The thick lines illustrate the physiographic boundaries in the western u.S. The lab map is a smoothed estimate of the shallow-est event we identified as the lab in the Ps and Sp receiver functions.

IRIS CoRe PRoPoSal 2010 | Volume I I | l ITHoSPHeRe, l ITHoSPHeRe/aSTHenoSPHeRe bounDaRY | I I -149
The Lithosphere-Asthenosphere Boundary beneath North America and AustraliaHeather A. Ford (Brown University), David L. Abt (ExxonMobil Exploration Company), Karen M. Fischer (Brown University)
The concept of a strong lithosphere that translates as a relatively coherent layer over a weak asthenosphere is fun-damental to models of plate motions, tectonics, and man-tleconvection.However,muchremainstobelearnedaboutthe physical and chemical properties that create rheological differencesbetween the lithosphereandasthenosphere.WehaveusedSpandPsscatteredwavestoimagemantlediscon-tinuities beneath North America and Australia.
In the tectonically active western U.S., large portions of thePhanerozoiceasternU.S.,PhanerozoiceasternAustraliaand the adjacent edge of the Australian craton, prominent Sp phases from a negative velocity contrast were found at depths of50-130km,consistentwiththelithosphere-asthenosphereboundary depth range from surface wave tomography. Thesephases imply significant (4-10%)velocitydropsoverdepth ranges of 30-40 km or less, and thus cannot be simply explained by a lithosphere-asthenosphere boundary that is governed purely by temperature. Rather, they imply that the asthenosphere is hydrated with respect to a drier, depleted lithosphere or contains a small amount of partial melt.
In contrast, no significant negative Sp phase was found at the base of the thick cratonic lithosphere in either continent, implying that the cratonic lithosphere-asthenosphere veloc-ity gradient is distributed over more than 50-70 km in depth. This gradient may be purely thermal in origin, although gra-dational changes in composition or melt content cannot be ruled out. A negative discontinuity internal to the cratonic lithospherewasobservedatdepthsof50-115km.Thedepthof this boundary is comparable to the thickness of oce-anic and younger continental lithosphere. This discontinu-ity may date from the formation of the cratonic lithosphere, oritcouldreflectlateralterationofthecratoniclithosphereby melting and metasomatism, perhaps as the top of a melt cumulate layer.
References
Ford,H.A.,K.M.Fischer,D.L.Abt,CatherineA.Rychert,L.T.Elkins-Tanton(2010),Thelithosphere-asthenosphereboundaryandcratoniclithospheric layering beneath Australia from Sp wave imaging, Earth Planet. Sci. Lett., submitted.
Abt,D.L.,K.M.Fischer,S.W.French,H.A.Ford,H.Yuan,B.Romanowicz (2010),NorthAmerican lithosphericdiscontinuity structureimagedbyPsandSpreceiverfunctions,J. Geophys. Res., in press.
Fischer,K.M.,H.A.Ford,D.L.Abt,C.A.Rychert(2010),Thelithosphere-asthenosphereboundary,Ann. Rev. Earth Planet. Sci., 38,551-575.
Acknowledgements: Data used in these studies were collected from the IRIS DMS. This work was supported by the National Science Foundation underawardsEAR-0538155(Geophysics)andEAR-0641772(EarthScope).
Depth (km)50 60 70 80 90 100 110 120 130
Depth (km)60 70 80 90 100 110 12050
a
b
ARMA
COEN
EIDS
FITZ
FORTKMBL STKA
TOO
YNG
WRAB CTAOMBWA
NWAO
LAB
Ambiguous
LABMLD
LAB MLD
Negative Sp phaseinterpretation
LABAmbiguous
MLDLAB
BBOO
Plat
e bo
unda
ry
FischerFig05.pdf 1 2/8/10 12:31 PM
mantle discontinuity depths estimated from Sp receiver functions in north america by abt et al. (2010) (a) and in australia by ford et al. (2010) (b). The dots are colored for depth/amplitude and represent Sp piercing points that have been interpolated onto a fine grid and smoothed with a circular filter with a 30 km radius. (a) north america. black inverted triangles indicate stations where the negative Sp phase is interpreted as the lithosphere-asthenosphere bound-ary (lab), white inverted triangles are stations where the phase is interpreted as a mid-lithospheric discontinuity (mlD), and gray stations indicate ambiguity in the interpretation of the negative Sp phase. (b) australia. negative Sp phases at stations in Phanerozoic eastern australia and just within the eastern margin of the Proterozoic craton (bboo and stations to its east) are interpreted as the lab. negative Sp phases at most stations in the Proterozoic and archean craton (sta-tion WRab and the stations to its west

II-150 | IRIS CoRe PRoPoSal 2010 | Volume I I | l ITHoSPHeRe, l ITHoSPHeRe/aSTHenoSPHeRe bounDaRY
Receiver Function Imaging of the Lithosphere-Asthenosphere BoundaryCatherine A. Rychert (University of Bristol, U.K.), Peter M. Shearer (University of California, San Diego, U.S.A.)
Thelithosphere-asthenosphereboundary,orLAB,isoftendefinedseismicallyasthetopofthelowvelocityzoneunderly-ing the higher velocities of the lithospheric lid. Surface-wave studies have shown the global extent of upper-mantle low-velocity zones,butdonothavetheverticalresolutiontoconstrainthedetailsofLABdepthandsharpness.Betterdepthresolution,atleast in the vicinity of seismic stations, is provided by receiver-function studies of converted phases, although care must be taken todistinguishLABsignalsfromnoiseandcrustalreverberations.Thecontinuedoperationoftheglobalseismicnetworks,byIRISandotheragencies,hasprovidedasufficientvolumeofdatathatreceiver-functionimagingoftheLABisnowpossibleonaglobalscale.Wehaveanalyzed15yearsofglobalseismicdatausingP-to-S(Ps)convertedphasesfromover150stationsandimagedaninterfacethatcorrelateswithtectonicenvironment,varyinginaveragedepthfrom95±4kmbeneathPrecambrianshieldsandplatformsto81±2kmbeneathtectonicallyalteredregionsand70±4kmatoceanicislandstations.BecausethepolarityofthePsarrivalsindicatesashear-velocitydropwithdepth,thisinterfaceislikelytheLABinmostregions,althoughitmayconstituteanotherboundarybeneaththecratonicinteriorsofcontinentswheretheLABisexpectedtobemuchdeeper.ThehighfrequenciesobservedinthePsarrivalsrequireasharpdiscontinuity,implyingachangeincomposition,melting,oranisotropy, not temperature alone.
References
Rychert,C.A.,andP.M.Shearer,Aglobalviewofthelithosphere-asthenosphereboundary, Science, 324,2009.
Rychert,C.A.,P.M.ShearerandK.M.Fischer,Scatteredwaveimagingofthelithosphere-asthenosphereboundary,Lithos, 2010.
Jordan,T.H.,GlobalTectonicregionalizationforseismologicaldataanalysis,Bull. Seismol. Soc. Amer., 71(4):1131-1141,1981.
Acknowledgements:ThisresearchwassupportedbyNationalScienceFoundationawardsEAR-0229323andEAR-0710881.
Global map of the depth to the lithosphere-asthenosphere boundary imaged using Ps receiver functions. Color indicates depth. Triangles show the 169 stations used in this study. Station color corresponds to tectonic regionalization, after Jordan (1981). Tectonic regions colored as follows: oceanic – black, Phanerozoic orogenic zones and magmatic belts – red, Phanerozoic platforms – cyan, Precambrian shields and platforms – green. although the work of Jordan (1981) divides oceanic envi-ronments into three age groupings, a single oceanic bin, encompassing all ages, is used here, since sampling of this region is sparse.

IRIS CoRe PRoPoSal 2010 | Volume I I | l ITHoSPHeRe, l ITHoSPHeRe/aSTHenoSPHeRe bounDaRY | I I -151
S-Velocity Structure of Cratons, from Broad-Band Surface-wave DispersionSergei Lebedev (Dublin Institute for Advanced Studies), Jeannot Trampert (Utrecht University)
Despiterecentprogressinmappingthelateralextentofcratonicrootsworldwide[e.g.Lebedev&vanderHilst,2008],pro-filesofseismicvelocitieswithinthemremainuncertain.Here,anovelcombinationofwaveform-analysistechniqueswasusedtomeasureinter-station,Rayleigh-andLove-wavephasevelocitiesinbroadperiodranges.Thenewmeasurementsyieldresolutionfrom the upper crust to deep upper mantle beneath a selection of cratons from around the globe and provide new constraints onthethermalandcompositionalstructureandevolutionofPrecambrianlithosphere.
Shear-wavespeedVsisconsistentlyhigherinthelithosphereofcratonsthaninthelithosphereofProterozoicfoldbelts.BecauseknowneffectsofcompositionalvariationsinthelithosphereonVsaretoosmalltoaccountforthedifference,thisconfirmsthattemperature in the cratonic lithosphere is consistently lower. This is in spite of sub-lithospheric mantle beneath continents being thermally heterogeneous, with some cratons currently underlain by a substantially hotter asthenosphere compared to others.
AnincreaseinVsbetweentheMohoanda100-150kmdepthisconsistentlypreferredbythedataandislikelytobeduetophase transformations, in particular the transition from spinel peridotite to garnet peridotite, proposed previously to give rise tothe“Halesdiscontinuity”withinthisdepthinterval.Thedepthandthewidthofthephasetransformationdependonmantlecomposition; it is likely to occur deeper and over a broader depth interval beneath cratons than elsewhere because of the high Cr content in the depleted cratonic lithosphere, as evidenced by a number of xenolith studies. Seismic data available at present would beconsistentwithbothasharpandagradualincreaseinVsintheupperlithosphere(aHalesdiscontinuityora“Halesgradient”).
Radial anisotropy in the upper crust indicates vertically oriented anisotropic fabric(Vsh<Vsv);thismayyieldaclueon how cratons grew, lending support to the view that distributed crustal short-ening with sub-vertical flow patternsoccurred over large scales in hot ancient orogens. In the lower crust and upper lithospheric mantle, radial anisotropy reveals horizontal fabric (Vsh > Vsv),likely to be a record of horizontal ductile flowinthe lowercrustandlithosphericmantle at the time of the formation and stabilisation of the cratons.
References
Lebedev, S., J.Boonen, J.Trampert, Seismicstructure of Precambrian lithosphere:New constraints from broadband sur-face-wave dispersion, Lithos, Special Issue "Continental Lithospheric Mantle:the Petro-Geophysical Approach", 109,96-111,2009.
Lebedev, S., R. D. van der Hilst, Globalupper-mantle tomography with the auto-mated multimode inversion of surface and S-wave forms, Geophys. J. Int., 173, 505-518,2008.
Top left: phase-velocity measurements sampling Precambrian continental lithosphere. Top right: summary profile of the isotropic-average shear speed beneath archean cratons. The ranges of Vs values include the best-fitting profiles from all the cratonic locations sampled. bottom: radial anisotropy within the upper Precambrian lithosphere. anisotropy with horizontally polarised shear waves propagating faster than verti-cally polarised ones (Vsh > Vsv) is observed in the lower crust and mantle lithosphere and indicates horizon-tally oriented fabric. anisotropy with Vsh < Vsv is observed in the upper crust beneath a number of locations and suggests the occurrence of vertically oriented fabric.

II-152 | IRIS CoRe PRoPoSal 2010 | Volume I I | l ITHoSPHeRe, l ITHoSPHeRe/aSTHenoSPHeRe bounDaRY
First Multi-Scale, Finite-Frequency Tomography Illuminates 3-D Anatomy of the Tibetan PlateauShu-Huei Hung (National Taiwan University, Taiwan, R.O.C.), Wang-Ping Chen (University of Illinois, Urbana-Champaign), Ling-Yun Chiao (National Taiwan University, Taiwan, R.O.C.)
Withanewmulti-scaleparameterization,3-D images fromfinite-frequencyseismic tomography, including theveryfirstimagesbeneathcentralTibetfromS-waves,revealthatregionsoflowelectricresistivityinthecrust,previouslyobservedalongactiveriftsinsouthernTibet,correlatewellwithregionsoflowP-andS-wavespeeds(V).However,suchregionsarenotinter-connected, indicating thataprevailing south-directed, channel-likecrustalflowseems inactiveor thispopulargeodynamicmodelneedsmodification.Intheuppermantle,thereisnoclearindicationofregionaldown-wellingbetweendepthsof100to400km.Instead,astrong,lateralboundarybetweenhighandlowVextendsupto33°N,markingthenorthernlimitofsub-horizontally advancing Indian lithospheric mantle.
References
Hung,S.-H.,W.-P.Chen,L.-Y.ChiaoandT.-L.Tseng,Firstmulti-scale,finite-frequencytomographyilluminates3-DanatomyoftheTibetanplateau, Geophys. Res. Lett., 37,doi:10.1029/2009GL041875(withon-linesupplements),2010.
Acknowledgements:WethankS.-L.Chungforhelpfuldiscussions,L.Zhao,ananonymousreferee,andtheEditorfortheircommentsthathelpimprovethemanuscript.ThisworkwassupportedbyNationalScienceCouncilofTaiwangrants96-2119-M-002-016and97-2745-M-002-011(S.-H.H.)andU.S.NationalScienceFoundationgrantsEAR99-09362(“Hi-CLIMB”),EAR05-51995,andEAR06-35419(W.-P.C.)
a map showing color-coded topography of the Himalayan-Tibetan collision zone. finite-frequency travel-times recorded by 108 broadband stations (green triangles) are used to obtain multi-scaled, tomographic images for a large volume beneath western Tibet (box outlined by dashed lines). blue solid lines indicate loca-tions of profiles along which cross-sections of δlnV
P and δlnV
S are
shown in figure 3b and 3c. blue dashed lines mark profiles across the lunggar and the Yadong-Gulu rifts where profiles of electric resistivity are inferred from magnetotelluric (mT) measurements (at locations shown as purple open circles) and being directly com-pared with our results of δlnV
S in figure 3d. for reference, posi-
tions of other temporary seismic stations, located to the east of our region of study and whose data were used to construct the tomographic profile of Tilmann et al. [2003], are also plotted (brown dashed line and orange inverted triangles). other features not explained in the legend are: Young or active normal faults (red curves, Taylor and Yin [2009]); major geologic boundaries (solid curves), including (from north to south) JRS, the Jinsha River Suture; bnS, the bangong-nujiang Suture; IYS, the Indus-Yarlung Suture; STD, the South Tibet Detachment System; mCT, the main Central Thrust; and mbT, the main boundary Thrust.

IRIS CoRe PRoPoSal 2010 | Volume I I | l ITHoSPHeRe, l ITHoSPHeRe/aSTHenoSPHeRe bounDaRY | I I -153
Seismic Structure of the Crust and the Upper Mantle beneath the HimalayasGaspar Monsalve (university of Colorado at boulder), Anne Sheehan (university of Colorado at boulder)
Seismic structureof the crust and theuppermantlebeneath theHimalayas:Evidence for eclogitizationof lower crustalrocksintheIndianPlateG.Monsalve,A.Sheehan,C.Rowe,andS.RajaureVariationsintheseismicvelocitystructureoftheHimalayancollisionzoneincludesignificantdifferencesbetweenitsnorthandsouthportions,withtransitionsinphysicalprop-ertiesacrosstheGreaterHimalaya.WecombinedP-andS-wavetraveltimesfromatemporarybroadbandseismicnetworkineasternNepalandsouthernTibetwitharrivaltimesatthepermanentstationnetworkoftheDepartmentofMinesandGeologyofNepaltodeterminetheseismicvelocitystructureacrosstheHimalaya,usinglocalearthquaketomographyandtraveltimesofregionalearthquakes.TheP-to-Svelocityratio(Vp/Vs)structuremarksthedifferencebetweentheIndianPlateandtheoverly-ingmaterials,withtheVp/Vsratiosbeinghighfortheformerandlowforthelatter.Wealsofoundasignificantincreaseintheuppermostmantleseismicvelocitiesfromsouthtonorth,reachingP-wavevelocities(Vp)over8.4km/snorthoftheGreaterHimalaya.ThesehighVpvaluesdonotseemtobetheresultofbiasesduetoanisotropyintheuppermantlebeneaththeGreaterandTethyanHimalayas.Instead,wesuggestthatrocksinthelowercrustoftheunderthrustingIndianPlateundergometamor-phism to eclogite as they plunge to greater depth beneath the mountain range, explaining the high seismic velocities.
References
Monsalve,G.,A. Sheehan,C.Rowe, andS.Rajaure (2008), Seismic structureof the crust and theuppermantlebeneath theHimalayas:EvidenceforeclogitizationoflowercrustalrocksintheIndianPlate, J. Geophys. Res., 113,B08315,doi:10.1029/2007JB005424.
Acknowledgements:BroadbandseismometersusedinthisexperimentarefromtheIRISPASSCALprogramanddataarearchivedattheIRISDMC.WethankthestaffoftheDepartmentofMinesandGeologyofNepalfortheirassistancewiththeexperimentandforsharingtheirnetwork seismic data with us. This work was supported by grants from the National Science Foundation and the Department of Energy.
Two-dimensional north-south structure of Vp and Vp/Vs beneath eastern nepal and the southern Tibetan Plateau. earthquakes are projected onto an n-S cross-section. (a) north-south topographic cross-section at 86.5°e, red triangles denote projected station locations. (b) north-south Vp structure. Horizontal axis is latitude in degrees north. (c) north-south Vp/Vs structure.

II-154 | IRIS CoRe PRoPoSal 2010 | Volume I I | l ITHoSPHeRe, l ITHoSPHeRe/aSTHenoSPHeRe bounDaRY
Evolution of Caribbean – South American Plate Boundary from Surface wave TomographyMeghan S. Miller (University of Southern California), Alan Levander (Rice University), Fenglin Niu (Rice University)
WehavemeasuredshearwavevelocitystructureofthecrustanduppermantleoftheCaribbean–SouthAmericanbound-aryregionbyanalysisoffundamentalmodeRayleighwavesinthe20-100speriodbandrecordedattheBOLIVAR/GEODINOSstations from 2003 to 2005. The model shows lateral variations that primarily correspond to tectonic provinces and boundaries. Aclearlinearvelocitychangeparallelstheplateboundingdextralstrike-slipfaultsystemalongthenortherncoastofVenezuela,illustratingthedifferencesbetweentheSouthAmericancontinentallithosphere,theVenezuelanarchipelago,andtheCaribbeanoceaniclithosphere.Atdepthsupto120kilometersbeneaththeVenezuelanAndesandtheMaracaiboblockthereisevidenceof underthrusting of the Caribbean plate, but there is no other evidence of subduction of the Caribbean plate beneath the South Americanplate.IneasternVenezuelalinearcrustallowvelocitiesareassociatedwiththefoldandthrustbeltswhereasashighercrustal velocities are imaged in the Guayana shield lithosphere. The subducting oceanic part of the South American plate is imaged beneath the Antilles Arc. The surface wave images combined with seismicity data suggest shear tearing of the oceanic lithosphereawayfromthebuoyantcontinentalSouthAmericanplateoffshoreofnortheasternVenezuela.Thecontinentallitho-spheresouthoftheslabtearisbentdowntowardstheplateboundaryinresponsetothepropagatingtearinthelithosphere.Weinterpretanearlyverticallowvelocity“column”westofthetearcenteredbeneaththeCariacoBasin,withthreedimensionalasthenosphericflowaroundthesouthernedgeofthesubductingoceaniclithosphere,withtheasthenosphereescapingfrombeneath continental South America, and rising into the plate boundary zone. The complex plate boundary structure is best examinedinthree-dimensions.Wediscussthenewsurfacewavetomographicinversioninthecontextofresultsfromotherresearchers including local seismicity, teleseismic shear wave splits, and interpretations from active source profiling.
Acknowledgements:BOLIVARwasfundedbygrantsEAR0003572andEAR0607801fromtheNSFContinentalDynamicsProgram,andfund-ingtoourVenezuelancolleaguesfromCONICIT,theVenezuelaScienceFoundation,andPDVSA.
Surface wave tomography model illustrating the structure of the South american mantle lithosphere as viewed from the northwest. The yellow dots are relocated seismicity, which define the Paria cluster and the location of the subducted oceanic lithosphere beneath the antilles arc tearing away from the continental lithosphere along the Caribbean-South american plate boundary.

IRIS CoRe PRoPoSal 2010 | Volume I I | l ITHoSPHeRe, l ITHoSPHeRe/aSTHenoSPHeRe bounDaRY | I I -155
Subducted Oceanic Asthenosphere and Upper Mantle Flow beneath the Juan de Fuca SlabR. M. Russo (University of Florida)
Many studies have shown that typical oceanic lithosphere is underlain by a well developed asthenosphere characterized by slowseismicvelocitiesfrom~100-250kmdepth.However,thefateoftheoceanicasthenosphereatsubductionzonesispoorlyunderstood. I show here using shear wave splitting of S waves emanating from earthquakes in the Juan de Fuca slab that upper mantle asthenospheric anisotropy beneath the slab is consistent with the presence of two distinct subducted asthenospheric lay-ers, one with fast shear trends parallel to the subduction trench, and a second, deeper layer with fast upper mantle fabrics paral-leltothemotionoftheJuandeFucaplatewithrespecttothedeepermantle.TheconsistentorientationofunsubductedPacificasthenospheric anisotropy in the direction of current plate motion implies that the trench-parallel sub-slab anisotropy develops when the lithosphere subducts.
References
Russo,R.M.,SubductedoceanicasthenosphereanduppermantleflowbeneaththeJuandeFucaslab, Lithosphere, 1,195-205,2009.
block diagram showing Juan de fuca slab geometry (green meshed surface), and top-of-slab depth contours (heavy blue dashed lines, bottom). Source side S splitting measurements are compatible with presence of two anisotropic layers beneath the Juan de fuca slab: a layer immediately beneath the slab which is characterized by trench-parallel fast shear azimuths, and a deeper layer with fast shear trends parallel to the motion of the Juan de fuca plate with respect to assumed fixed hotspots (Gripp and Gordon, 2003). orange arrows schematically show the anisotropy and possibly upper mantle flow directions in these two layers.

II-156 | IRIS CoRe PRoPoSal 2010 | Volume I I | l ITHoSPHeRe, l ITHoSPHeRe/aSTHenoSPHeRe bounDaRY
Subduction of the Chile Ridge: Upper Mantle Structure and FlowR. M. Russo (University of Florida), J. C. VanDecar (DTM - Carnegie Inst. Washington), D. Comte (Universidad de Chile), V. I. Mocanu (University of Bucharest), A. Gallego (University of Florida), R. E. Murdie (Goldfields Australia)
Wedeployed39broadbandseismometersinsouthernChilefromDec.2004toFeb.2007todeterminelithosphereanduppermantlestructure,includingpossibleslabwindows,inthevicinityofthesubductingChileRidge.Body-wavetravel-timetomog-raphy clearly shows the existence of a long-hypothesized slab window, a gap between the subducted Nazca and Antarctic litho-spheres.P-wavevelocitiesintheslabwindowaredistinctlyslowrelativetosurroundingasthenosphericmantle.Thus,thegapbetween slabs visible in the imaging appears to be filled by unusually warm asthenosphere, consistent with subduction of the ChileRidge.Shear-wavesplittingintheChileRidgesubductionregionisverystrong(meandelaytimenearly~3s)andhighlyvariable. North of the slab window, splitting fast directions are mostly trench parallel, but, in the region of the slab gap, splitting fasttrendsappeartofanfromNW-SEtrendstothenorth,throughENE-WSWtrendstowardthemiddleoftheslabwindow,toNE-SWtrendssouthoftheslabwindow.Weinterprettheseresultsas
indicatingflowofasthenosphericuppermantleintotheslabwindow.
References
Russo,R.M.,J.C.VanDecar,D.Comte,V.I.Mocanu,A.Gallego,andR.E.Murdie,SubductionoftheChileRidge:UpperMantleStructureandFlow, GSA Today, 20(9),4-10,doi:10.1130/GSATG61A.1,2010.
Acknowledgements:SupportedbyU.S.NationalScienceFoundationgrantEAR-0126244andCONICYTgrantno.1050367fromthegovern-ment of Chile.
Schematic 3-d block diagram of upper mantle flow in the vicinity of the slab window delineated by the travel time inversions. map on top of block shows relief and locations of Chile Ridge structures before subduction and after. bottom of block shows coastline and Chile Ridge structures over color-coded slab plates: nazca plate in dark yellow, antarctic plate in blue-green. Same colors for portions of slab visible in the block diagram itself. Red arrow parallels shear wave splitting fast trends and upper mantle flow in the vicinity of the slab window opening. View from the SW, looking ne. note the northern, shallower portion of the slab window is not vis-ible from this viewpoint.

IRIS CoRe PRoPoSal 2010 | Volume I I | l ITHoSPHeRe, l ITHoSPHeRe/aSTHenoSPHeRe bounDaRY | I I -157
Detecting the Limit of Slab Break-off in Central Turkey: New High-resolution Pn Tomography ResultsC.R. Gans (University of Arizona), S.L. Beck (University of Arizona), G. Zandt (University of Arizona), C.B. Biryol (University of Arizona), A.A. Ozacar (Middle East Technical University)
InversionofPntraveltimeresidualsfroma39-stationportablebroadbandarray(instrumentsprovidedbyIRISPASSCAL)providesahigh-resolutionimageofthevelocitystructureintheuppermostmantlebeneathcentralTurkey.IndividuallypickedPnphasearrivalsfromeventsrecordedbytheNorthAnatolianFaultPassiveSeismicExperimentandtheKandilliObservatorywerecombinedwithadditionaleventsassociatedwiththeEasternTurkeySeismicExperiment.TomographyresultsshownochangeinPnvelocityacrosstheNorthAnatolianFault,althoughlongitudinalvariationsareevident.AregionofverylowPnvelocities(<7.8km/s)isimagedeastoftheCentralAnatolianFaultZone(CAFZ),withatransitiontofastervelocities(>8.1km/s)westofthefault.ThesharptransitionalongtheCAFZ,whichfollowsthepaleotectonicInnerTaurideSuture,mayrepre-sentthelocationoftheedgeoftheslabwindow,createdwhentheoceanicslabbrokeoffalongtheBitlis-ZagrosSuturearound11Ma,astheArabianplatecollidedwiththeEurasianplate.
References
Faccenna,C.,Bellier,O.,Martinod,J.,Piromallo,C.andV.Regard(2006),SlabdetachmentbeneatheasternAnatolia:Apossiblecausefortheformation of the North Anatolian fault, Earth Planet. Sci. Lett., 242,85-97.
Acknowledgements:NationalScienceFoundationGrantEAR0309838
Figure 1. Pn tomography results for north-central Turkey. Stations shown by triangles, Holocene volcanoes by red asterisks. NAFZ - North Anatolian Fault Zone, CAFZ - Central Anatolian Fault Zone, EAFZ - East Anatolian Fault Zone, ITS - Inner Tauride Suture, KM - Kirsehir massif, SB - Safranbolu Basin, CB - Cankiri Basin, BZS - Bitlis Zagros Suture. Red asterisks are Holocene volcanoes. Inset: Cartoon showing hypothesized upper mantle slab detachment and resulting slab window consistent with Pn tomography results. The downdip edge of the slab window corresponds to the northern edge of the low Pn region that partially follows the CAFZ. The western extent of the tear is uncertain. Modified after Faccenna et al. [2006].
28˚
28˚
30˚
30˚
32˚
32˚
34˚
34˚
36˚
36˚
38˚
38˚
40˚
40˚
42˚
42˚
44˚
44˚
36˚ 36˚
38˚ 38˚
40˚ 40˚
42˚ 42˚
44˚ 44˚
7.6 7.9 8.1 8.3Pn Velocity (km/s)
NAFZ
EAFZ
CAFZ
Damping = 200Avg. Velocity = 7.9 km/sVelocity Max. = 8.23 km/sVelocity Min. = 7.57 km/s
KMITS
BZS
CB
SB
**
**
*
NAFZCAFZ
N
continentallithosphere
oceaniclithosphere
slab
window
BZS
?
Anatoliaoceanic lithosphere
ArabianPlatform
figure 1. Pn tomography results for north-central Turkey. Stations shown by triangles, Holocene volcanoes by red asterisks. nafZ - north anatolian fault Zone, CafZ - Central anatolian fault Zone, eafZ - east anatolian fault Zone, ITS - Inner Tauride Suture, Km - Kirsehir massif, Sb - Safranbolu basin, Cb - Cankiri basin, bZS - bitlis Zagros Suture. Red asterisks are Holocene volcanoes. Inset: Cartoon showing hypothesized upper mantle slab detachment and resulting slab window consistent with Pn tomography results. The downdip edge of the slab window corresponds to the northern edge of the low Pn region that partially follows the CafZ. The western extent of the tear is uncertain. modified after faccenna et al. [2006].

II-158 | IRIS CoRe PRoPoSal 2010 | Volume I I | l ITHoSPHeRe, l ITHoSPHeRe/aSTHenoSPHeRe bounDaRY
Imaging the Flat Slab Beneath the Sierras Pampeanas, Argentina, Using Receiver Functions: Evidence for Overthickened and Broken Subducted Oceanic CrustC.R. Gans (University of Arizona), S.L. Beck (University of Arizona), G. Zandt (University of Arizona), H. Gilbert (Purdue University), P. Alvarado (Universidad Nacional de San Juan, Argentina)
The western margin of South America between 30° and 32° S is characterizedbytheflatslabsubductionofthe~43Maoceanic Nazca plate beneath the con-tinental South American plate. Several arrays of PASSCAL broadband seismicinstruments have been deployed in Chile and western Argentina to study this phe-nomenon (e.g., CHARGE, 2000-2002;SIEMBRA,2007-2009;ESP,2008-2010).The low angle subduction has prevented magmatism in the area since the late Miocene, and spatially correlates with the formation of both thick-skinned (Sierras Pampeanas) basement coreduplifts and the thin-skinned (AndeanPrecordillera)foldandthrustbeltwithinthe region. In order to better constrain the crust and upper mantle structure in the transition region between flat slaband normal subduction to the south, we havecalculatedreceiverfunctions(RFs)from teleseismic earthquakes. Using our dense SIEMBRA array, combined withthe broader CHARGE and ESP arrays,weareabletoimageindetailtheflatslab,which contains a distinct negative arrival (indicativeofalowvelocityzone)atthetopoftheflatslab,followedbyastrongpositiveP-to-Sconversion.Whiletheexactcausesofflatslabsubductioncontinuetobedebated,oneoverridingthemeisthenecessityofhavinganoverthickenedcrustinordertoincreasethebuoyancyofthesubductingslab.Inthisregion,thehotspotseamountchainoftheJuanFernandezRidge(JFR)isthoughttoprovidesuchamechanism.Koppetal.[2004],however,didnotfindoverthickenedcrustintheoffshoreportionoftheJFR,butratheronlymoderatelythickoceaniccrust.PreliminaryresultsfromourRFs,comparedwithsyntheticRFs,indi-catethattheoceaniccrustatthetopoftheslab(thelowvelocityzone)mustbeatleast~12-14kmthick.OurresultssupporttheideaofanoverthickenedcrustinthesubductedflatslabbeneathwesternArgentina.Further,thereareindicationsinthereceiverfunctions that the subducted oceanic crust in the region directly along the path of the subducted ridge is broken by trench paral-lel faults. One explanation for this could be that these are older faults in the oceanic crust, created when the crust was first sub-ducted.Alternatively,itispossiblethatnewfaultsareformingduetostressesinducedbyincreasedcouplingintheflatslabregion.
References
Kopp,H.,Flueh,E.R.,Papenberg,C.andD.Klaeschen(2004),SeismicinvestigationsoftheO’HiggensSeamountGroupandJuanFernandezRidge: Aseismic ridge emplacement and lithosphere hydration, Tectonics, 23
Acknowledgements:NationalScienceFoundationGrant#EAR-0510966.
Top: location map with PaSSCal stations and nodes for Common Conversion Point (CCP) mesh. bottom: line 3, along the direct line of the JfR. note the complex and broken character of the oceanic crust. blue triangles are seismic stations, black circles are slab earthquakes recorded during SIembRa.

IRIS CoRe PRoPoSal 2010 | Volume I I | l ITHoSPHeRe, l ITHoSPHeRe/aSTHenoSPHeRe bounDaRY | I I -159
Pn Tomography of the western United States using USArrayJanine Buehler (SIO, University of California, San Diego), Peter Shearer (SIO, University of California, San Diego)
Inthisstudy,weanalyzePnarrivaltimesfromthetransportablestationsofUSArraytoresolvecrustanduppermost-mantlestructure. Seismic tomography has the potential to provide detailed images of Earth structure, but is often limited by the cover-age of the available seismic data. The USArray with its very dense and almost uniformly spaced stations has greatly improved tomographicresolutionformuchofthewesternUnitedStates.Becauseofthelargecontrastinseismicvelocitiesbetweenthelowercrustandtheuppermantleandtheshallowvelocitygradientintheuppermantle,Pntomographicvelocityperturba-tion images show results for a very confined depth in the uppermost mantle, complementing surface-wave or other body-wave tomographies that average anomalies over larger depth intervals.
Acknowledgements:We thankLucianaAstiz and theoperatorsof theArrayNetworkFacility formaking theirphasepicksavailable.ThisresearchwasfundedbygrantEAR-0710881fromtheNationalScienceFoundation.
Isotropic velocity perturbations resulting from a combined iso-anisotropic inversion. Red colors indicate areas of lower velocities and blue colors regions with higher velocities. The locations of the major anomalies correlate well with known active processes, as for example the large low velocity anomalies in the Snake River Plain leading to the Yellowstone hotspot. The black lines indicate the Pn fast axis with the length of the line proportional to the strength of the anisotropy. We obtain large anisotropic anomalies in the Great basin desert, off the coast of northern California, and in southern California/northern mexico.
Crustal thickness estimates. Thicker crust is observed in the Sierra nevada, the Cascade Range, and southern Wyoming. In the northern basin and Range prov-ince crustal thickness is reduced as expected in an extensional tectonic regime. The thinner crust in the southern basin and Range is very distinct, with thicker crust indicated to the north below the Colorado Plateau.

II-160 | IRIS CoRe PRoPoSal 2010 | Volume I I | l ITHoSPHeRe, l ITHoSPHeRe/aSTHenoSPHeRe bounDaRY
geophysical Detection of Relict Metasomatism from an Archean (~3.5 ga) Subduction ZoneChin-Wu Chen (Carnegie Institution of Washington), Stephane Rondenay (Massachusetts Institute of Technology), Rob. Evans (Woods Hole Oceanographic Institution), David Snyder (Geological Survey of Canada)
The origin of Archean cratonic lithosphere is the subject of much debate. Geological and geochemical data are consistent with a plate tectonic origin involving assembly of predominantly oceanic terranes and micro continents into large stable cratons. Deep probing geophysical surveys of Archean cratons provide a means of understanding the processes responsible for the for-mation of these earliest continents, although the signals are complex and present-day cratons are only the surviving remnants ofoncelargerentities.HerewepresentauniquegeophysicalviewofstructurewithintheArcheanSlavecraton,innorthwesternCanada, that shows clear evidence for subduction processes frozen into Archean lithosphere. New seismic imaging results from the central Slave are synthesized with a coincident magnetotelluric model, and interpreted using petrological and geochemical constraintsfrommantlexenoliths.Wefindthemoststrikingcorrelationbetweenseismicandelectricalstructureseverobservedinacontinentalsettingintheformofacoincidentseismicdiscontinuityandelectricalconductorat~100kmdepth.Themag-nitude of both anomalies, in conjunction with the occurrence of phlogopite rich xenoliths originating at the same depth, point toametasomaticorigin.Webelievethatfluidswerereleasedfromasubductingslabandalteredthemantledirectlybelowthebase of a pre-cratonic lithosphere. Our model suggests that cratons are formed by subduction underplating and accretion of pre-existing fragments, and that these processes were active as early as 3.5 billion years ago.
References
Chen,C.-W.,S.Rondenay,R.L.Evans,andD.B.Snyder,GeophysicaldetectionofrelictmetasomatismfromanArchean(~3.5Ga)subduc-tion zone, Science, 326,1089-1091,2009.
Jones,A.G.,P.Lezaeta,I.J.Ferguson,A.D.Chave,R.L.Evans,X.GarciaandJ.Spratt,TheelectricalstructureoftheSlavecraton.Lithos, 71, 505-527, 2003.
Acknowledgements:ThisworkisfundedbythePOLARISconsortiumandNSFgrantEAR-0409509(S.R.).
map of the Slave craton (exposed craton outlined in red). Inset shows the craton in center (green square), with the 62 earthquakes (red circles) used for the analysis. Crustal topology and geochemical signatures broadly subdivide the Slave craton into two distinct regions: The older (4.03-2.83 Ga) Central Slave basement Complex to the west (brown), and isotopically juvenile rocks (2.67-2.6 Ga) to the east (blue). The lateral extent of an ultra-depleted harzburgitic layer of the mantle lithosphere has been inferred from petrological analysis of mantle xenoliths (green outline) and geochemical analyses of garnet xenocrysts (between black dashed lines). The seismic stations are from PolaRIS (circles) and mIT (squares). a-a' marks the location of the seismic profile shown in fig. 2. The lateral extent of the seismic discontinuity is indicated by blue shading, and that of the conductive anomaly is outlined in red. b-b' is the nominal projected location of the mT array.
Teleseismic receiver-function (Rf) and mag-netotelluric (mT) profiles across the Slave craton. (a) Color-coded seismic profile along the line a-a' (fig. 1). Red and blue colors effectively represent positive (downward slow-to-fast) and negative (downward fast to slow) seismic velocity contrasts, respectively. m, moho; R1 and R2, free-surface reverbera-tions. (b) mT-derived resistivity profile [Jones et al., 2003] across the line b-b' shows the central Slave conductive anomaly (red to yel-low) at 80-120 depth. The solid black line highlights the base of the conductive anom-aly within the region of interest (dashed black box), repeated to scale in Rf profiles for comparison. (c) Close-up Rf traces for bins in the region of interest.
5 5 1 1 -
5 1 1 -
0 1 1 -
0 1 1 -
1 - 0
1 - 5 0
2 6 2 6
4 6 4 6
6 6 6 6
8 6 8 6
0 50 100
km
A
A’ B’
B
Seismic discontinuity
Electrical conductive anomaly
Outline of the harzburgitic layer (from mantle xenoliths)
POLARIS station
MIT station
Outline of the harzburgitic layer (from garnet xenocrysts)
A-A’: Seismic profile
B-B’: Electrical profile
120 140 160 180 200 220 240
20
40
60
80
100
120
140
160
180
Horizontal distance (km)
Dep
th (
km)
0 50 100 150 200 250 300 350
0
50
100
150
200
Horizontal distance (km)
Dep
th (
km)
A A’
A
C
B B’
B
M
R1
R2

IRIS CoRe PRoPoSal 2010 | Volume I I | l ITHoSPHeRe, l ITHoSPHeRe/aSTHenoSPHeRe bounDaRY | I I -161
figure1. Rayleigh wave phase velocity map derived from anT at 12 s period where the main geological units are outlined with black contours and the prin-cipal sedimentary basins and hotspot are identified with abbreviations.
figure2. Vertical cross section of shear wave velocity along 40°n delineated by the black line in figure 1, where the crustal part is plotted as absolute shear velocity and the mantle is plotted as the shear velocity perturbation relative to the average velocity profile.
3-D Isotropic Shear Velocity Model from Ambient Noise and Earthquake TomographyWeisen Shen (University of Colorado at Boulder), Yingjie Yang (University of Colorado at Boulder), Fan-Chi Lin (University of Colorado at Boulder), Michael H. Ritzwoller (University of Colorado at Boulder)
AmbientNoiseTomography (ANT) is anefficientway to image theearth’s crust since its inception in2005.Weuseover300,000cross-correlationsfromambientnoisebasedonthepastthreeyearsofEarthScope/USArrayTransportableArray(TA)data.Thisdatasetprovidesempiricalgreen’sfunctionsbetweeneachpairofstationsandfinallyresultsinover100,000highSNRRayleighwavedispersionmeasurementsfrom8and40secperiod.Figure1showsthe12sRayleighwavevelocitymapwiththeYellowstonehotspotandtheprincipalsedimentarybasinsidentified:CV(CentralValley),UB(UintaBasin),GRB(GreenRiverBasin),YS(Yellowstone),WB(WashakieBasin),PRB(PowderRiverBasin),DB(DenverBasin),AB(AlbuquerqueBasin),PB(PermianBasin),AB(AnadarkoBasin).Inaddition,weperformsurfacewavetomographybasedonteleseismicearthquakeswiththesamestationsetusingmorethan200earthquakesintwo-plane-wavetomography(TPWT)toproduceRayleighwavedis-persionmapsatfrom25to144sec.AtInoverlappingperiodband(25-40s)thetwomethodsproducesimilardispersionmaps.
Withthesedispersionmapsfrom8to144secperiod,weapplyMonte-Carloinversiontoconstructa3-Dshearvelocitymodelon the western US and the transition region to cratonic North America. Figure 2 shows a cross section of the 3model along 40oNinwhichgeologicalprovincesareshown:BR(BasinandRange),CP(ColoradoPlateau),RM(RockyMountains),andGP(GreatPlains).LowvelocitiesareobservedintheGreatPlainsandthenorthernColoradoplateauintheshallowcrust,whichcoincideswithsedimentarybasins.Inthemantle,lowvelocityanomaliesareobservedbeneaththeentireBasinandRangeprov-inceextendingfrom113oWto120oW.HighvelocityanomaliesbeneaththeColoradoPlateauandtheGreatBasinextendtothedepthof~150km,indicatingthickenedlithosphere.ThehighhorizontalvelocitygradientalongtheRockyMountainfrontreveals the boundary between the tectonic western US and the cratonic eastern US. Future work will assimilate body wave infor-mation(receiverfunctions)andgeothermalinformationtoreducethecrustalthickness-velocitytrade-off.
References
Yang,Y.,M.H.Ritzwoller,F.-C.Lin,M.P.Moschetti,andN.M.Shapiro(2008),Structureofthecrustanduppermostmantlebeneaththewest-ern United States revealed by ambient noise and earthquake tomography, J. Geophys. Res., 113,B12310
Acknowledgements:AlldatausedwereobtainedfromtheIRISDataManagementCenter.TheauthorsaregratefultoHershGilbertforprovid-ing the crustal thickness map.

II-162 | IRIS CoRe PRoPoSal 2010 | Volume I I | l ITHoSPHeRe, l ITHoSPHeRe/aSTHenoSPHeRe bounDaRY
Shear-wave Birefringence and Current Configuration of Converging Lithosphere under TibetWang-Ping Chen (University of Illinois, Urbana-Champaign), Michael Martin (University of Illinois, Urbana-Champaign)
Newdatafromwest-centralTibetshowthatbire-fringence of S-waves has two pronounced increases in magnitude toward the hinterland. Null birefrin-gence persists to about 75 km north of the Indus-Yarlungsuture (IYS)between the IndianshieldandtheLhasaterraneofsouthernTibet.Asecond,rapidincrease occurs about 100 km farther north of theBangong-NujiangsuturesbetweentheLhasaterraneandtheQiangtangterraneincentralTibet.Thelatterfeature is consistently observed along three long tran-sectsthatcollectivelyspanalateral(orogen-parallel)distanceof about 600 kmand is likely tomark thenorthern, leading edge of sub-horizontally advancing mantlelithosphereoftheIndianshield(the“GreaterIndia”)–aninterpretationconsistentwiththelatestresultsoffinite-frequencytomographyusingbothP-and S-wave travel-times, previous results of modeling gravity anomalies, and a host of other seismic obser-vations. Similarly, complementary constraints indi-cate that the sudden onset of significant birefringence northof the IYS is likely tobe the southern termi-nation of Eurasian mantle lithosphere. Curiously, the shortest of three transects showed null birefringence throughmuchoftheLhasaterrane,apatternincon-sistentwiththoseofHeisotopesandgravity.
References
Chen,W.-P.,M.Martin,T.-L.Tseng,R.L.Nowack,S.-H.Hung, and B.-S. Huang, Shear-wave birefringenceand current configuration of converging lithosphere underTibet,Earth Planet. Sci. Lett., 295(1-2),297-304,doi:10.1016/j.epsl.2010.04.017,2010
Chen,W.-P., and T.-L. Tseng, Small 660-km seismic dis-continuity beneath Tibet implies resting ground fordetached lithosphere, J. Geophys. Res., 112,B05309(15pp.),doi:10.1029/2006JB004607,2007.
Acknowledgements: This work was supported by U.S. National Science Foundation grants EAR99-09362,EAR05-51995, EAR06-35419 (W.-P.C.), EAR EAR06-35611(R.L.N.), U.S. Air Force contract FA8718-08-C-002(R.L.N.andW.-P.C.),NationalScienceCouncilofTaiwangrants96-2119-M-002-016and97-2745-M-002-011(S.-H.H.),andAcademiaSinica,Taiwan (B.-S.H.)whichprovidedadditionalpersonnel (Wen-TzongLiang,Chia-LungWu, JohnLin, andChun-ChiLiu).SeismicexperimentswerecarriedoutjointlywithOregonStateUniversity(leadbyJohnNabelek),ChineseAcademyofGeologicalSciences(leadbyJiangMeiandHepingSu),NepalDepartmentofMinesandGeology(leadbySomaSapkotaandM.Pandey)andPekingUniversity(leadbyJohnChen).Wethanktwoanonymousreviewersforusefulcommentsonthemanuscript,F.Tilmannfordiscussions,andZhaohuiYang(UniversityofIllinois)forhelpwithGISdatabases.
(a) to (c) Comparisons of three large-scale profiles of S-wave split time (dt in s) across Tibet. open circles are isolated cases of birefringence south of the mantle suture. measurements with error-bars (and shown in dark grey) are those analyzed by us; otherwise we plot val-ues reported in the literature. The horizontal dotted-line represents the threshold for null birefringence. (d) a schematic cross-section showing the current configuration of the sub-continental lithospheric mantle, including a large-scale anomaly of high P-wave speed resting on top of the lower mantle and interpreted as the remnant of thickened (and subsequently detached due to Rayleigh-Taylor instability) lithospheric mantle (Chen and Tseng, 2007).

IRIS CoRe PRoPoSal 2010 | Volume I I | l ITHoSPHeRe, l ITHoSPHeRe/aSTHenoSPHeRe bounDaRY | I I -163
Seismic Anisotropy Associated with Continental Lithosphere Accretion beneath the CANOE ArrayAnna M. Courtier (James Madison University), James B. Gaherty (Lamont-Doherty Earth Observatory), Justin Revenaugh (University of Minnesota), Michael G. Bostock (University of British Columbia), Edward J. Garnero (Arizona State University)
TheCanadianNorthwestExperiment(CANOE)isanarrayof~60broadbandseismometerslocatedinnorthernAlbertaandBritishColumbiaandsouthernYukonandNorthwestTerritories.Thearrayspansnearly4.0Gaofgeologichistory,transition-ingfromtheancientcratonintheeastacrosstheCanadiancordillerainthewest.WeexaminedanisotropybeneaththearrayusingshearwavesplittingofSKS,SKKS,andsSKSphases.Fastdirectionsareroughlyconsistentwithabsoluteplatemotionacrossmuchofthearray,suggestingthatacoherent,asthenosphericfabricunderliestheregion.Variabilityinfastdirectionsonsmallerlengthscales(~50-200km)generallycorrelateswithsurfacestructuresandtectonicfeatures,indicatingalithosphericcontributiontotheanisotropy.Withinthecraton,anomaloussplittingisobservedatanancientsuturezoneandappearstostemfrom dipping fabric produced during continental assembly [Mercier et al., 2008].Themantlesignatureofthecraton-cordilleratransition appears to coincide with the Rocky Mountain front, indicated by an abrupt change in fast directions. In the west-ern cordillera, fast directions become parallel to the plate boundary, indicating that fabrics associated with the plate boundary deformationextend~200kmintothecontinent.Splittingtimesaverage~0.65sacrossthearray,thoughdelaytimesaresmalleracross much of the cordillera. Smaller delay times indicate that anisotropy is weaker or less coherent across the cordillera rela-tive to the craton.
References
Courtier,A.M.,J.B.Gaherty,J.Revenaugh,M.G.Bostock,andE.J.Garnero(InPress).Seismicanisotropyassociatedwithcontinentallitho-sphere accretion beneath the CANOE array, northwestern Canada, Geology.
Gripp,A.E.,andR.G.Gordon(2002).Youngtracksofhotspotsandcurrentplatevelocities:Geophys. J. Int., 150,321–361.
Mercier,J.-P.,M.G.Bostock,P.Audet,J.B.Gaherty,E.J.Garnero,andJ.S.Revenaugh(2008).TheTeleseismicSignatureofFossilSubduction:Northwestern Canada, J. Geophys. Res., 113,B04308.
Acknowledgements: All data were obtained from the IRIS DMC; Data for CNSN stations were made available by the Geological Survey of Canada.FundingwasprovidedbytheNationalScienceFoundation-Geophysics,theLITHOPROBEproject,andaUniversityofMinnesotaDoctoralDissertationFellowship(AMC).
Regional geologic setting and multi-event station averages at Canoe and CnSn stations. Center of bar indicates station location; length of bar indi-cates dt; orientation of bars indicates fast direc-tion (φ). Red = ne components, blue = RT com-ponents. uncertainty estimates are φ ±8° and dt ±0.2 s. Circles indicate null measurements; white arrows indicate plate motion from hot spot and no net rotation models (Gripp and Gordon, 2002).

II-164 | IRIS CoRe PRoPoSal 2010 | Volume I I | l ITHoSPHeRe, l ITHoSPHeRe/aSTHenoSPHeRe bounDaRY
Stratified Seismic Anisotropy beneath the East Central United StatesFrédéric Deschamps (eTH Zurich), Sergei Lebedev (DIAS Dublin), Thomas Meier (University Bochum), Jeannot Trampert (University Utrecht)
A key problem in seismology is to resolve the radial distribution of azimuthal anisotropy beneath continents. Seismic anisot-ropy can be related to rock deformation that occurs during various geodynamical events, and can thus be used to better under-stand the deformation history of continental lithosphere. Array studies of azimuthal variations in surface-wave phase veloc-ity are well suited to recover the radial distribution of anisotropy, provided that dispersion curves can be measured in a broad enough period range. Using about 20000 records from the IRIS database, we measured broadband inter-station dispersion curves of the Rayleigh-wave phase velocity and built an anisotropic Rayleigh-wave model that clearly resolves the radial dis-tributionofazimuthalanisotropybeneaththeEast-centralUnitedStates(31°-41°Nand82°-92°E)[Deschampsetal.,2008a].WethenestimatedtheamplitudeofVS-anisotropyasafunctionofdepth,fromthelowercrusttotheupperasthenosphericmantle(≤400km)[Deschampsetal.,2008b].Beneaththeorogenicterrains(southandeastoftheGrenvillefront),distinctpat-ternscanbeidentifiedinthreeperiodranges(Figure1),suggestingthatanisotropyisradiallydistributedwithinthreedistinctlayers.At20-35s(samplingtheupperlithosphere),anisotropyisstrong(~1%oftheregionalaverageisotropicvelocity),withadirectionoffastpropagationsub-paralleltoorogenicfronts.At45-60s(samplingthelowerlithosphere),anisotropyismod-erate(~0.5%),andthedirectionoffastpropagationisparalleltothereconstructedmotionoftheNorth-Americanplate160-125Maago.Finally,around140s(samplingtheupperasthenosphere), anisotropy is strong again (> 1%),and the direction of fast propagation is in good agree-mentwithSKS splittingandwith theabsoluteplatemotionofNorthAmerica.Beneaththecratonicter-rains (north and west of the Grenville front), onlythe anisotropy at 140s, likely related to the currentmotion of the North American plate, is clearly visi-ble. This distribution suggests the following scenario: ca 270 My ago, the upper lithosphere deformed dur-ing thefinal stagesof theAppalachianorogeny (forinstance,duetolateralextrusion), leadingtofabricsthat are now frozen and seen by Rayleigh wave azi-muthal anisotropy at 20-35s. After the orogen, the hotter, softer, lower lithosphere recorded the motion of the North-America plate during a brief laps of time(160-125Ma),resultinginfabricsthatarenowobservedat45-60s.Finally,atpresenttime,theasthe-nosphericflowinducesdeformationsatthetopoftheasthenosphere,whicharemappedaround140s.
References
Deschamps,F.,S.Lebedev,T.Meier,etJ.Trampert,2008a.Azimuthal anisotropy of Rayleigh-wave phase velocities in the east-central United States, Geophys. J. Int., 173, 827-843,DOI:10.1111/j.1365-246X.2008.03751.x.
Deschamps,F.,S.Lebedev,T.Meier,etJ.Trampert,2008b.Stratified seismic anisotropy reveals past and present deformation beneath the east-central United States, Earth Planet. Sci. Lett., 274, 489-498, doi:10.1016/j.epsl.2008.07.058.
Rayleigh wave azimuthal anisotropy (yellow bars) at 28, 55, and 140 s. The orientation and size of the bar show the direction of fastest propagation of Rayleigh waves at the period and the amplitude of the anisotropy, respectively. also plotted are main tectonic boundaries, past and present absolute plate motion, and previous anisotropy measure-ments. (a) at 28 s, the Rayleigh-wave fast-propagation direction beneath orogenic prov-inces is roughly parallel to the Grenville and appalachian fronts, as well as to Pn fast-propagation direction. (b) at 55 s, the fast-propagation azimuth is close to the direction of the nnW drift of the north american plate during the mesozoic. (c) at 140 s, the fast-propagation direction is parallel to the current absolute plate motion, as well as to most fast-propagation directions inferred from shear-wave splitting observations in the area.

IRIS CoRe PRoPoSal 2010 | Volume I I | l ITHoSPHeRe, l ITHoSPHeRe/aSTHenoSPHeRe bounDaRY | I I -165
Anisotropy in the great Basin from Rayleigh wave Phase Velocity MapsCaroline Beghein (University of California at Los Angeles), J. Arthur Snoke (Virginia Polytechnic Institute and State University), Matthew J. Fouch (Arizona State University)
TheGreatBasinregion,Nevada,ischaracterizedbyasemi-circularshear-wavesplittingpatternaroundaweakazimuthalanisotropy zone. A variety of explanations have been proposed to explain this signal, including an upwelling, toroidal mantle flowaroundaslab,lithosphericdrip,andamegadetachment,butnoconsensushasbeenreached.
In order to obtain better constraints on the origin of this intriguing anisotropy pattern, we performed fundamental mode Rayleigh-wavedispersionmeasurementsusingdatafromtheUSArrayTransportableArray.Wetheninvertedthesemeasure-mentstoobtainazimuthallyanisotropicphasevelocitymapsatperiodsbetween16sand102s.
Atperiodsof16sand18s,whichmostlysamplethecrust,wefoundaregionoflowanisotropyincentralNevadacoincid-ing with locally reduced phase velocities, and surrounded by a semi-circular pattern of fast seismic directions. Combined with recent crustal receiver function results, these short period phase velocity maps are consistent with the presence of a semi-circu-laranisotropysignalinthelithosphereinthevicinityofalocallythickcrust.Wecalculatedthatourshortperiodphasevelocityanisotropycanonlyexplain~30%oftheSKSsplittingtimes,whichimpliesthattheoriginoftheregionalshear-wavesplittingsignal is complex and must have both lithospheric and sublithospheric origins.
Atperiodsbetween28and102s,whichsampletheuppermostmantle,wedetectedasignificantreductioninisotropicphasevelocitiesacrossthestudyregion,andfoundmoreuniformfastdirectionswithaE-Wfastaxis.Weattributedthetransitioninphasevelocitiesandanisotropytothelithosphere-asthenosphereboundaryatdepthsof~60km.Weinterpretedthelongerperiods fast seismic directions in terms of present-day asthenospheric deformation, possibly related to a combination of Juan de Fucaslabrollbackandeastward-drivenmantleflowfromthePacificasthenosphere.
References
Beghein,C.,Snoke,J.A.,andFouch,M.J.,DepthConstraintsonAzimuthalAnisotropyintheGreatBasinfromRayleighWavePhaseVelocityMaps, Earth Planet. Sci. Lett., 289,467-478,2010.
Acknowledgements:ThisresearchwaspartiallyfundedbyNSFgrantsEAR-0548288(MJFEarthScopeCAREERgrant).
azimuthally anisotropic phase velocity maps at 16 s and 38 s period. The background colors represent the isotropic phase velocity anomalies. The black lines show the fast direction of propagation for Rayleigh waves (2Ψ anisotropy). The reference phase velocity, calculated using the reference mTna model defined by beghein et al. (2010), and the average measurement uncertainty are given on top of each each map.

II-166 | IRIS CoRe PRoPoSal 2010 | Volume I I | l ITHoSPHeRe, l ITHoSPHeRe/aSTHenoSPHeRe bounDaRY
Source-Side Shear wave Splitting and Upper Mantle Flow in the Romanian Carpathians and SurroundingsR. M. Russo (University of Florida), V. I. Mocanu (University of Bucharest)
Wepresentshearwavesplittingmeasurementsfrom5earthquakesthatoccurredintheVranceaseismiczoneoftheCarpathianArc.Swavesfromtheseevents,allwithmagnitudes>5.4Mwanddeeperthan88km,wererecordedatbroadbandstationsoftheGlobal Seismic Network, and the Geoscope and Geofon Networks, and used by us to measure shear wave splitting corrected for sub-station splitting and anisotropy. In order to carry out these corrections we used published shear wave splitting parameters, thus iso-latingcontributionstoobservedsplittingfromtheVranceasourceregionanduppermantlesurroundingtheCarpathianArc.Theresulting32goodobservationsofsource-sideshearwavesplitting,alongwith54nullsplittingobservations(whichyieldtwopotentialsplittingdirections)clearlyshowthatuppermantleanisotropyisstronglyvariableintheregionofthetightlycurvedCarpathianArc:shearwavestakingofffromVranceaalongpathsthatsampletheEastandSouthernCarpathianshavefastanisotropyaxesparalleltotheseranges,whereasthoseleavingthesourceregiontotraversetheuppermantlebeneaththeTransylvanianBasin(i.e.,mantlewedgeside)trendNE-SW.ShearwavessamplingtheEastEuropeanandScythianPlatformsareseparableintotwogroups,onechar-acterizedbyfastsheartrendstotheNE-SW,andasecond,deepergroup,withtrendstoNW-SE;also,themajorityofnullsplitsoccuralongpathsleavingVranceaintheseNE-Eazimuths.Weinterprettheseresultstoindicatethepresenceofatleastthreedistinctuppermantle volumes in the Carpathians region: the upper mantle beneath the Carpathian Arc is strongly anisotropic with fabrics parallel tothelocalarcstrike;theTransylvanianBasinuppermantlefabricstrendNE-SW;andtheanisotropybeneaththewesternmostEastEuropeanPlatformmaybecharacterizedbyashallowNW-SEtrendingfabricconcentratedinthecratoniclithosphereoftheEastEuropeanPlatform,andasecond,deeperfabricwithE-Wtrendmarkingasthenosphericflowbeneaththecraton'sbase.ThismorecomplexanisotropybeneaththewesternedgeoftheEastEuropeanPlatformwouldaccountforboththevariabilityofobservedsplit-ting of waves that sample this volume, and also the strong prevalence of nulls observed along eastward-departing azimuths.
References
Russo,R.M.,andV.I.Mocanu,Source-SideShearWaveSplittingandUpperMantleFlowintheRomanianCarpathiansandSurroundings,Earth and Planet. Sci. Lett. 287,205-216,doi:10.1016/j/epsl.2009.08.028,2009.
Acknowledgements:AnearlyversionofthisworkwassupportedbyNationalScienceFoundationgrantEAR-0230336.
Source-side shear wave splitting results from all 5 study earthquakes, event locations (stars) and splits (bars) color coded to match. Gray circles are surface projections of 2 ÌŠ radius source lower focal hemispheres for reference. Splits plotted at surface projections of 200 km depth pierc-ing points along event-station path to show geometry of sampling for individual event-station pairs. Splitting delay times as per key, upper right.black bars with white bor-dered triangles are splitting from SK(K)S phases at stations in the study region (Ivan et al., 2008).

IRIS CoRe PRoPoSal 2010 | Volume I I | l ITHoSPHeRe, l ITHoSPHeRe/aSTHenoSPHeRe bounDaRY | I I -167
Source-Side Shear wave Splitting and Upper Mantle Flow in the Chile Ridge Subduction RegionR. M. Russo (University of Florida), A. Gallego (University of Florida), D. Comte (Universidad de Chile), V. I. Mocanu (University of Bucharest), R. E. Murdie (Goldfields Australia), J. C. Vandecar (DTM -Carnegie Institution of Washington)
TheactivelyspreadingChileRidgehasbeensubductingbeneathPatagonianChilesincetheMiddleMiocene.Aftersubduc-tion,continuedseparationofthefasterNazcaplatefromtheslowAntarcticplatehasopenedupagap—aslabwindow—betweenthesubductedoceaniclithospheresbeneathSouthAmerica.Weexaminedtheformoftheasthenosphericmantleflowinthevicinity of this slab window using S waves from six isolated, unusual 2007 earthquakes that occurred in the generally low-seis-micity region just north of the ridge subduction region. The S waves from these earthquakes were recorded at distant seismic stations, but were split into fast and slow orthogonally polarized waves at upper mantle depths during their passage through theslabwindowandenvirons.Weisolatedthedirectionsoffastsplitshearwavesneartheslabwindowbycorrectingforuppermantleseismicanisotropyatthedistantstations.Theresultsshowthatthegenerallytrench-paralleluppermantleflowbeneaththeNazcaplaterotatestoanENEtrendintheneighborhoodoftheslabgap,consistentwithuppermantleflowfromwesttoeast through the slab window.
References
Russo,R.M.,A.Gallego,D.Comte,V.Mocanu,R.E.Murdie,andJ.C.VanDecar,Source-sideshearwavesplittinganduppermantleflowintheChile Ridge subduction region, Geology,38,707-710,doi:10.1130/GE30920.1,2010.
Acknowledgements:ThisworkwassupportedbyU.S.NationalScienceFoundationgrantEAR-0126244andCONICYT-CHILEgrant1050367.
Tectonic and relief map of study region. Chile Ridge spreading centers (red) and trans-form-fracture zones (black) shown. black triangles=volcanoes; fZ=fault zone. Stars mark epicenters of six study earthquakes, relocated by Russo et al. (2010) colored same as source-side splitting measurements (bars; see delay time scale, upper right). Dotted circles are 200 km radius about source events; splits plot-ted in azimuth of takeoff. Dashed lines mark the boundary of the slab window, defined as the “0.5% velocity perturbation con- tour at 50, 100, and 200 km depths from the tomography of VanDecar et al. (2007). note that the north-ern slab window boundary is well resolved; the southern boundary is not.

II-168 | IRIS CoRe PRoPoSal 2010 | Volume I I | l ITHoSPHeRe, l ITHoSPHeRe/aSTHenoSPHeRe bounDaRY
An Earthscope Magnetotelluric Transect of the Southern Cascadia Subduction System, washingtonPhilip E. Wannamaker (University of Utah/EGI), Robert L. Evans (Woods Hole Oceanographic Institution)
The first slow-slip earthquake events were observed over the Southern Cascadia Subduction system and exhibit a remarkably uniform14monthperiodicity.Wecollected60widebandmagnetotelluricsoundingsinaneast-westprofiletoexaminestateofdeepcrustalanduppermantlefluidizationasitpertainstosubductionzonelockingandslow-slipnucleation.TheresponsesofthisprofilearebeingcomparedtothoseoftheearlierEMSLABprojectacrossnorthwesternOregontothesouth,whichisundergoing reanalysis. These results are new and not yet subject to formal non-linear inversion, but visual inspection reveals bothsimilaritiesandimportantdifferences.AdiagnostichighanomalyintheTMmodephaseseennearthecoastinOregonisnotvisibleintheWashingtondataandthistentativelyiscorrelatedwithreducefluid/subductedsedimentcontentandgreaterobserved plate locking for the latter area. Further inland, this phase develops more fully for both transects and is interpreted to reflectincreasedslabhydratebreakdownandfluidrelease.Theinlandresultsatlowerfrequenciesareexpectedtoyieldgeometryand physical properties of arc and back-arc melt zones of the deeper lithosphere and upper asthenosphere.
References
R.S.McGary;R.L.Evans;S.Rondenay;G.A.Abers;K.C.Creager;P.E.Wannamaker(2009),JointmagnetotelluricandseismicinvestigationoftheCascadiasubductionzonestructure:Preliminaryresultsandoutlook,EOSTransAGU.
Acknowledgements:ThisprojectisbeingsupportedunderNSF/EarthscopegrantsEAR08-44041andEAR08-43725.
figure 1. mT transect site distribution for the emSlab lincoln line (south) and the new Café-mT transect to the north. emSlab line contains 40 land sites plus seven sea-floor soundings (5 mT, 2 tipper only; see Wannamaker et al., 1989, JGR). Café line contains 60 wideband site; long-period sites are to be collected summer-fall of 2010.