
LITHIUM-ION BATTERY MODELING for ELECTRIC VEHICLES … · Abstract LITHIUM-ION BATTERY MODELING for...
86
LITHIUM-ION BATTERY MODELING for ELECTRIC VEHICLES and REGENERATIVE CELL TESTING PLATFORM by Andishe Moshirvaziri A thesis submitted in conformity with the requirements for the degree of Master of Applied Science Graduate Department of Electrical and Computer Engineering University of Toronto Copyright © 2013 by Andishe Moshirvaziri
Transcript of LITHIUM-ION BATTERY MODELING for ELECTRIC VEHICLES … · Abstract LITHIUM-ION BATTERY MODELING for...

LITHIUM-ION BATTERY MODELING for ELECTRICVEHICLES and REGENERATIVE CELL TESTING
PLATFORM
by
Andishe Moshirvaziri
A thesis submitted in conformity with the requirementsfor the degree of Master of Applied Science
Graduate Department of Electrical and Computer EngineeringUniversity of Toronto
Copyright © 2013 by Andishe Moshirvaziri

Abstract
LITHIUM-ION BATTERY MODELING for ELECTRIC VEHICLES and
REGENERATIVE CELL TESTING PLATFORM
Andishe Moshirvaziri
Master of Applied Science
Graduate Department of Electrical and Computer Engineering
University of Toronto
2013
Electric Vehicles (EVs) have gained acceptance as low or zero emission means of trans-
portation. This thesis deals with the design of a battery cell testing platform and Lithium-
Ion (Li-Ion) battery modeling for EVs. A novel regenerative cell testing platform is de-
veloped for cell cycling applications. A 300 W - 5 V cell cycler consisting of a buck and
a boost converter is designed.
Furthermore, a novel battery modeling approach is proposed to accurately predict the
battery performance by dynamically updating the model parameters based on the battery
temperature and State of Charge (SOC). The comparison between the experimental and
the model simulation results of an automotive cell under real-world drive-cycle illustrates
96.5% accuracy of the model. In addition, the model can be utilized to assess the long-
term impact of battery impedance on performance of EVs under real-world drive-cycles.
ii

Acknowledgements
First and foremost, I would like to express my sincere gratitude to my supervisor, Pro-
fessor Olivier Trescases, whose support, direction, guidance and encouragement made
it possible for this thesis to see the light of this day. His help and patience during my
research made it possible for me to push the boundaries of my own knowledge and help
gain the understanding which I currently have. His encouraging words throughout my
research motivated and kept me going which was invaluable to my thesis.
I would like to thank Roger Gerson and Paul Daniel from Brammo Inc. who not only
supported this project financially, but also provided invaluable guidance, critical data
and the required resources. Their help and support were integrals to the success of this
thesis and I highly appreciate their efforts.
I would also like to thank my brother and colleague, Mazhar Moshirvaziri, who helped
and guided me throughout my graduate degree. He has been my life long mentor and
has helped me through many challenges including my thesis. I wish him success in all
his future endeavors. I would also like to thank my friends and colleagues in the Energy
Systems group for providing me support to overcome some of the obstacles. Shahab
Poshtkouhi who on many occasions was the sounding board for my ideas. Behzad Mah-
davikhah helped me solve some problems associated to my project. I wish them both
success in pursuing their PhD studies. I am very grateful to Farhad Yahyaie and Kia
Filsoof for their support. I would also like to extend my gratitude to my undergradu-
ate student assistants, Yajneshvar Arumugam and Jackycy Liu, who assisted me in the
experimental parts of my project. Last but most importantly, I would like to thank my
family who have provided me with unconditional love and support throughout my life.
My parents who supported my ideas from the start and encouraged me to always reach
for the stars. I learned from them that hard work and patience pays off if you are focused
on your goal. My older brother, Reza, and my sister, Khazal, who were a constant voice
of support and encouragement for me. Also, my nephew, Sadra, who kept me laughing
iii

and smiling throughout my studies.
I would like to end my acknowledgement by quoting a good friend of mine, Maz Alam,
who when saw me stressed often said ”Whatever doesn’t kill you makes you stronger”. I
thank him for all the support and encouragement he provided me.
iv
Contents
1 Introduction 1
1.1 Modern Electric Vehicles . . . . . . . . . . . . . . . . . . . . . . . . . . . 1
1.1.1 Challenges in Electric Vehicles . . . . . . . . . . . . . . . . . . . . 2
1.2 Batteries . . . . . . . . . . . . . . . . . . . . . . . . . . . . . . . . . . . . 3
1.2.1 Elements and Specification of Batteries . . . . . . . . . . . . . . . 3
1.2.2 Common Battery Chemistries . . . . . . . . . . . . . . . . . . . . 5
1.2.3 Challenges of Li-Ion Battery Technology in EVs . . . . . . . . . . 8
1.3 Thesis Motivation and Objectives . . . . . . . . . . . . . . . . . . . . . . 13
2 Multi-Channel Cell Testing Platform 19
2.1 Introduction . . . . . . . . . . . . . . . . . . . . . . . . . . . . . . . . . . 19
2.2 System Design . . . . . . . . . . . . . . . . . . . . . . . . . . . . . . . . . 21
2.2.1 Cycler Board Design . . . . . . . . . . . . . . . . . . . . . . . . . 26
2.3 Controller Design . . . . . . . . . . . . . . . . . . . . . . . . . . . . . . . 27
2.4 System Implementation and Results . . . . . . . . . . . . . . . . . . . . . 32
2.5 Chapter Summary and Conclusion . . . . . . . . . . . . . . . . . . . . . 39
3 Battery Modeling 43
3.1 Introduction . . . . . . . . . . . . . . . . . . . . . . . . . . . . . . . . . . 43
3.2 Electrical Battery Modeling . . . . . . . . . . . . . . . . . . . . . . . . . 44
3.2.1 Proposed Modeling Approach . . . . . . . . . . . . . . . . . . . . 45
v

3.3 Modeling Example . . . . . . . . . . . . . . . . . . . . . . . . . . . . . . 46
3.3.1 VOC Parameter Determination . . . . . . . . . . . . . . . . . . . . 46
3.3.2 Internal Impedance Measurements . . . . . . . . . . . . . . . . . . 46
3.3.3 Resistive and Capacitive Parameter Extraction . . . . . . . . . . 48
3.3.4 Dynamic Update of Model Parameters . . . . . . . . . . . . . . . 51
3.4 Model Validation . . . . . . . . . . . . . . . . . . . . . . . . . . . . . . . 52
3.5 Chapter Summary and Conclusion . . . . . . . . . . . . . . . . . . . . . 54
4 Impact of Battery Impedance on EV Performance 58
4.1 Introduction . . . . . . . . . . . . . . . . . . . . . . . . . . . . . . . . . . 58
4.2 Demonstration of the Impact of Battery Impedance on EV Performance . 61
4.2.1 Simulation Setup . . . . . . . . . . . . . . . . . . . . . . . . . . . 61
4.2.2 Simulation Procedure and Scenarios . . . . . . . . . . . . . . . . . 64
4.2.3 Simulation Results and Discussions . . . . . . . . . . . . . . . . . 68
4.3 Chapter Summary and Conclusion . . . . . . . . . . . . . . . . . . . . . 70
5 Conclusion 74
5.1 Thesis Summary and Contribution . . . . . . . . . . . . . . . . . . . . . 74
5.2 Future Work . . . . . . . . . . . . . . . . . . . . . . . . . . . . . . . . . . 76
vi

List of Tables
1.1 Specific-Energy of Different Battery Chemistries [6] . . . . . . . . . . . . 7
2.1 Li-Ion Cell Specifications . . . . . . . . . . . . . . . . . . . . . . . . . . . 20
2.2 Cycling Plan. . . . . . . . . . . . . . . . . . . . . . . . . . . . . . . . . . 20
2.3 Experimental System Parameters . . . . . . . . . . . . . . . . . . . . . . 32
3.1 Extracted Model Parameters . . . . . . . . . . . . . . . . . . . . . . . . . 50
4.1 Empulse Specifications [18] . . . . . . . . . . . . . . . . . . . . . . . . . . 62
4.2 Delivered Energy in Simulation Scenarios . . . . . . . . . . . . . . . . . . 69
vii

List of Figures
1.1 Power demand histogram for an LEV [6]. . . . . . . . . . . . . . . . . . . 3
1.2 Electrochemical operation in a cell. . . . . . . . . . . . . . . . . . . . . . 4
1.3 Characteristic comparison of different Lithium based technologies [6]. . . 7
1.4 Electric vehicle architecture. . . . . . . . . . . . . . . . . . . . . . . . . . 11
1.5 Simple battery model used to predict dynamic voltage drops at Vbt. . . . 11
2.1 Sample current profiles for the (a) urban and (b) freeway drive-cycle. . . 21
2.2 (a) Bi-directional and (b) uni-directional inverter-based regenerative cell
cycler architectures. . . . . . . . . . . . . . . . . . . . . . . . . . . . . . . 22
2.3 Proposed cell cycler architecture. . . . . . . . . . . . . . . . . . . . . . . 22
2.4 (a) Physical structure of Li-Ion Capacitor (courtesy of JSR Micro) [9]. (b)
Ragone plot for different storage technologies [10]. . . . . . . . . . . . . . 24
2.5 Inverter P-V profile. . . . . . . . . . . . . . . . . . . . . . . . . . . . . . 25
2.6 (a) The cycler board configuration. (b) Ideal inductor current for an in-
terleaved double-phase converter. . . . . . . . . . . . . . . . . . . . . . . 26
2.7 Controller diagram of the cell cycler. . . . . . . . . . . . . . . . . . . . . 27
2.8 Operation modes of the boost converter controller. . . . . . . . . . . . . . 28
2.9 Control diagram of (a) the buck converter and the boost converter in (b)
mode 1 and (c) mode 2. . . . . . . . . . . . . . . . . . . . . . . . . . . . 29
2.10 Operation diagram. . . . . . . . . . . . . . . . . . . . . . . . . . . . . . . 30
viii

2.11 Power flow in time intervals of (a) t1-t2, (b) t2-t3, (c) t3-t4, (d) t4-t5, (e)
t5-t6 and (f) t6-t7. . . . . . . . . . . . . . . . . . . . . . . . . . . . . . . . 31
2.12 Implementation of the (a) cell cycler and (b) cycler board. . . . . . . . . 33
2.13 (a) Steady state and (b) current step response of the buck converter. (c)
Steady state response of the boost converter. . . . . . . . . . . . . . . . . 35
2.14 Experimental Vbt, Vuc and Vinv during the system operation under the
sample current profile. . . . . . . . . . . . . . . . . . . . . . . . . . . . . 36
2.15 (a) Six channel cell testing platform. (b) Front panel of the LabVIEW
program. . . . . . . . . . . . . . . . . . . . . . . . . . . . . . . . . . . . . 38
3.1 Common electrical battery model. . . . . . . . . . . . . . . . . . . . . . . 45
3.2 VOC versus SOC curve. . . . . . . . . . . . . . . . . . . . . . . . . . . . . 47
3.3 Impedance measurement setup. . . . . . . . . . . . . . . . . . . . . . . . 47
3.4 Measured Nyquist curve for cell impendence. . . . . . . . . . . . . . . . . 48
3.5 Simulated (a) Vbt for different orders and (b) simulated Ibt. . . . . . . . . 49
3.6 Simulated and experimental Nyquist curves for the cell impendence. . . . 50
3.7 Block diagram showing the update process of the model parameters. . . . 51
3.8 Simulated and experimental (a) Vbt and (b) TCell for constant discharge
current 2C (20 A). . . . . . . . . . . . . . . . . . . . . . . . . . . . . . . 53
3.9 Simulated and experimental (a) Ibt and (b) Vb for the urban drive-cycle. . 53
4.1 Discharge power limit vs. temperature. . . . . . . . . . . . . . . . . . . . 60
4.2 Empulse motorcycle. . . . . . . . . . . . . . . . . . . . . . . . . . . . . . 62
4.3 Representative cell current profile for (a) an urban and (b) a freeway drive-
cycles in the Empulse motorcycle. . . . . . . . . . . . . . . . . . . . . . . 63
4.4 Measured Nyquist curves of cell impedance for (a) type A and (b) type B
cells. . . . . . . . . . . . . . . . . . . . . . . . . . . . . . . . . . . . . . . 63
ix

4.5 Simulated battery voltage and temperature under urban drive-cycle at
ambient temperature of (a) 0C, (b) 5C, (c) 10C and (d) 30C. . . . . . 66
4.6 Simulated battery voltage and temperature under freeway drive-cycle at
ambient temperature of (a) 0C, (b) 5C, (c) 10C and (d) 30C. . . . . . 67
4.7 Control circuit for BTMS. . . . . . . . . . . . . . . . . . . . . . . . . . . 69
x

Chapter 1
Introduction
1.1 Modern Electric Vehicles
During the past few decades, the atmospheric CO2 concentration has dramatically in-
creased resulting in global warming and significant climate change [1,2]. The global price
of crude oil is predicted to significantly increase by 2035 [3]. Therefore, the ownership
cost of Internal Combustion Engine (ICE) vehicles continue to increase, which is paving
the way for alternative technologies such as EVs. EVs have gained acceptance as low
or zero emission means of transportation. The energy required by EVs can be supplied
by clean renewable energy sources in the future [4, 5]. In addition, EVs have the ability
to recover energy that otherwise would be lost during braking, known as Regenerative
(Regen) braking [6–9].
Off-grid, battery powered EVs can be categorized based on the power level [10],
1. Light electrical vehicles (LEV) such as electrical bikes, scooters and motorcycles
with a power demand of less than several kilowatts,
2. Sedan vehicles, which includes sedan hybrid electrical vehicles (HEV) and full elec-
trical vehicles up to 100 kW and
1

Chapter 1. Introduction 2
3. Heavy-duty vehicles which are used for public transportation such as buses, with a
power level over 100 kW.
Among various Energy Storage Systems (ESS) such as capacitors and flywheels, elec-
trochemical batteries are preferred in EVs due to their superior energy density [6, 11].
1.1.1 Challenges in Electric Vehicles
Currently, EVs face multiple challenges which are the prohibiting factors for mass de-
ployment and commercialization. High initial costs, limited lifetime and relatively poor
performance at low temperature are often cited as the most important issues, with the
latter three directly involving the ESS and BMS of the vehicle [12–15].
The average lifetime of batteries (typically defined by a 20% degradation in battery
capacity) in EVs is approximately 8 to 10 years [13]. In practice, the lifetime of the
battery is reduced due to the high power profile of the vehicle during acceleration and
braking, which can be much more than 10× higher than the average power. An example
of a power demand of an electric bicycle [6] in an urban driving environment is shown in
Fig. 1.1. The LEV spends a fair amount of time in low power and idle modes, however, it
experiences some high power peaks frequently. Driving behavior, recharging habits, depth
of discharge (DOD) and ambient temperature are other factors which impact the lifetime
of the batteries by varying degrees. Analyzing the effects of these factors can improve
the capability of battery models in both performance and lifetime prediction [13,16].
In this project, a platform is designed and implemented to analyze the effects of
average discharge current, ambient temperature and drive cycle dynamics. Prior to dis-
cussing the above mentioned platform and its analysis, it is essential to have an overview
of batteries, common EV battery chemistries and their associated challenges.

Chapter 1. Introduction 3
-400 -200 0 2000
0.2
0.4
0.6
0.8
1
Nu
mb
er
of
Occu
rence
s,
10
00
x
Output Power, W
Figure 1.1: Power demand histogram for an LEV [6].
1.2 Batteries
1.2.1 Elements and Specification of Batteries
A battery is an energy storage device that converts the chemical energy stored in its
active materials into electrical energy by means of electrochemical reactions. The ba-
sic electrochemical storage element is a cell. A battery consists of one or more cells,
connected in series, parallel or both, based on the desired nominal battery voltage and
capacity. A cell system can be described using three main components:
1. Anode
The chemical reaction at the anode (oxidation) releases electrons that flow to the
cathode through an external circuit. The anode material is selected based on its
efficiency, high specific capacity, conductivity, stability, ease of fabrication and low
cost.
2. Cathode
The chemical reaction at the cathode (reduction) accepts the electrons. The cath-
ode is selected based on its voltage and chemical stability over time.

Chapter 1. Introduction 4
3. Electrolyte
The electrolyte completes the cell circuit by transporting the ions. The electrolyte
can be liquid, like water, acids, alkalis or solvents with dissolved salts. The elec-
trolyte can be selected based on its high conductivity, non-reactivity with the elec-
trode materials, stability in properties at various temperatures, safety and cost.
Physically, the electrodes are electronically isolated preventing internal short-circuit
situations, however, they are surrounded by the electrolyte. In a practical cell design,
separators which are permeable to the electrolyte are used to provide mechanical separa-
tion between the electrodes [17]. The most beneficial combination of all these elements
are those which result in a cell with light weight, high voltage and high capacity [1].
When a cell is discharging, electrons extracted from oxidation at the anode electrode
flow to the cathode electrode where reduction happens. During the charging process, the
current flow is reversed [18]. The charge and discharge process is shown in Fig. 1.2.
LOAD
Cathode Anode
Discharge
-
+
+ -
I
Separator
Supply
Cathode Anode
Charge
-
+
+ -
I
Separator
Electrolyte Electrolyte
Figure 1.2: Electrochemical operation in a cell.
When chemical reactions happen in a cell, the free energy of the system decreases due
to its transformation into electrical energy. The theoretical cell voltage is a function of
the property of the materials and is the sum of the anode and cathode potentials. The
theoretical capacity is a function of the amount of active materials used in the cell.

Chapter 1. Introduction 5
1.2.2 Common Battery Chemistries
In this section, a summary of common available battery chemistries, their advantages
and disadvantages are provided.
1. Lead-Acid
The three main elements of Lead-Acid batteries are Lead, Lead Oxide and di-
luted Sulfuric Acid. Low cost and mature technology are some of the advantages,
however, self discharge, heavy weight, low specific power and energy due to the
heavy lead collectors, limited life cycle are the main disadvantages of this chem-
istry [19,20].
2. Nickel
Nickel Metal Hydride (NiMH) and Nickel Cadmium (NiCad) are the most popular
Nickel based battery technologies. NiMH batteries have advanced performance in
safety and power density. The Fluctuating price of Nickel [21,22] and its low energy
density as compared to Lithium-Ion batteries are the main poor characteristics of
this battery technology. However, NiMH is still the most commonly used battery
technology used in EVs [23]. NiCad technology has the most stable performance (its
performance is not even affected by over-charged or over-discharged over time [24]).
However, as this chemistry contains poisonous Cadmium, it is banned for industry
applications in many countries [6, 23].
3. Lithium-Ion
The common materials used for the positive electrode of Lithium-Ion (Li-Ion) bat-
teries are Cobalt Oxide, Manganese Oxide, Iron Phosphate, Nickel Manganese
Cobalt Oxide and Nickel Cobalt Aluminum Oxide. Lithium salt in organic sol-
vent and carbon are used for the negative electrode and electrolyte, respectively.
Lithium-based batteries offer higher specific energy than Lead-Acid and Nickel-
based batteries [6,23], as shown in Table 1.1. Due to the high specific energy (over

Chapter 1. Introduction 6
100 Wh/kg), recyclability and long cycle life (several thousand cycles) [25], Li-Ion
batteries units are produced in billions every year in the market of popular devices
such as laptops, cell phones and cameras [1].
There are four main Li-Ion battery chemistries [6, 23]:
(a) Lithium Cobalt
Lithium Cobalt Oxide (Li-Co Oxide) batteries provide advanced electrical
performance and more specifically, very high specific energy. However, they
suffer from poor thermal stability. This characteristic limits the applications
of this technology to few industries such as laptops, cell phones and other
personal electronic devices. As of this writing, this chemistry is not suitable
for industrial applications and electric vehicles due to safety issues [23].
(b) Lithium Manganese
Lithium Manganese Oxide (Li-Mn Oxide) offers higher safety factors and lower
cost than Lithium Cobalt, however, it has a fairly short life cycle. Therefore,
it is limited to low power technologies like electrical bicycles and scooters [23].
(c) Lithium Ferro Phosphate
Lithium Ferro Phosphate (Li-Fe Phosphate) provides a good balance in safety,
life cycle and cost. However, its energy density is lower than other lithium
chemistries [23].
(d) Lithium Nickel Manganese Cobalt Oxide
Lithium Nickel Manganese Cobalt Oxide (Li-Ni-Mn-Co Oxide) was developed
as an alternative to Li-Co Oxide to balance the cost and performance of the
battery [26].
The characteristics of common Li-Ion chemistries are illustrated in Fig. 1.3. Li-
Ni-Mn-Co Oxide battery is a suitable choice for EVs [27], as it offers an excellent
trade-off between safety, capacity and performance [26].

Chapter 1. Introduction 7
As of this writing, Li-Ion chemistry with its superior specific energy, power and
voltage range is considered the most suitable candidate among other chemistries
for EVs [10,13,28] and is the main focus of this work.
Table 1.1: Specific-Energy of Different Battery Chemistries [6]
Lead- Ni-Cd Ni-MH Li-Fe Li-Mn Li-Ni-Mn Li-Co
Acid Phosphate Oxide Co Oxide Oxide
Typical Specific 40 60 90 110 120 140 170
Energy (Wh/kg)
Specific Energy
Specific
PowerCost
Life
Span
Performance
Safety
Li Ni Mn Co Oxide
Li Mn Oxide
Li Fe Phosphate
Li Co Oxide
Figure 1.3: Characteristic comparison of different Lithium based technologies [6].

Chapter 1. Introduction 8
1.2.3 Challenges of Li-Ion Battery Technology in EVs
Li-Ion technology must be improved in terms of costs and lifetime to improve the large
scale adoption of EVs [29]. Prediction and extension of the battery pack lifetime plays
an important role in the EV market [16]. The two main challenges of Li-Ion battery
technology in EVs are:
1. Capacity Fade
Carbonaceous materials used in all Li-Ion batteries [30], are known to have dom-
inant effects in the capacity loss at high discharge rates [31]. Among the various
carbonaceous materials, natural graphite is the most attractive choice as it has a
high theoretical capacity, abundance and low cost. During the cell operation, non-
reversible chemical reactions on the surface of graphite happen among Lithium ions,
solvents and electrons. The by-products of these reactions, accumulate and form
a surface film on the carbon electrode known as Solid Electrolyte Interface (SEI).
A Battery can stop performing when the Lithium ions can no longer pass the SEI
layer due to its thickness. Therefore, lifetime and cyclability of a cell depends on
its SEI layer [30].
Capacity fade of Lithium-ion batteries depends on the various factors such as av-
erage discharge current and temperature of the cell. As demonstrated in [10, 31],
capacity fade is proportional to the average discharge rate. If a battery discharges
with a high current, the internal cell temperature increases due to the electrical
loss inside the battery. The electrical loss inside a battery is approximated as:
Ploss = Rbt × I2bt, (1.1)
where Ibt is the average battery current, Rbt is the Equivalent Series Resistance
(ESR) of the battery, and Ploss is the power loss inside the battery. The internal
cell temperature can not be directly measured as it is impractical. The difference

Chapter 1. Introduction 9
between ambient temperature and cell temperature can be as high as 60 degree
during high discharge rates. High current and high temperature can increase the
speed of chemical reactions and the formation of the SEI layer.
Ambient temperature is another important factor that affects the performance and
the lifetime of batteries. Li-Ion batteries have better performance at higher tem-
perature as the chemical reactions proceed faster. However, higher temperature
accelerates the capacity fade in Lithium-ion batteries [10].
Although the effect of average current, DOD and ambient temperature on capacity
fade of Li-Ion batteries is widely studied, there is very limited research that in-
vestigates the impact of real-world dynamic drive-cycles on capacity fade of Li-Ion
batteries, especially at low ambient temperature.

Chapter 1. Introduction 10
2. Performance
A general EV architecture consists of a battery pack, BMS, bi-directional inverter,
controller and traction motor as shown in Fig. 1.4. The battery packs deployed
for EVs consist of several battery modules connected in series, and each module
is a combination of numerous battery cells. In practice, battery cells in a module
are not identical which limits the battery performance (in this thesis, the battery
performance is defined as the calculated cumulative deliverable energy). This can
be mitigated using cell balancing techniques which are performed by the BMS. The
BMS is required for safe operation of the battery pack as well as better performance
of the EV [12, 14, 15]. The central BMS typically communicates with the inverter
using the Controller Area Network (CAN) protocol [6, 14].
During the vehicle operation, the driver indirectly controls the motor torque through
the acceleration or brake pedals. In addition, the BMS system broadcasts the al-
lowable battery current range in real time based on an internal battery model. The
inverter saturates the current in the torque control loop based on the allowable
range. When the vehicle accelerates, the requested torque and battery current (Ibt)
are positive, and the battery is discharges. During Regen braking, the requested
torque is negative, therefore, the battery charges which means the battery current
is positive.
During the vehicle operation, the main BMS utilizes a battery model to estimate
the maximum and minimum allowable current of the battery pack based on the
operating conditions. If the required battery current is outside of the allowable
range, the motor current (Imotor) is saturated to limit the battery current. The
controller sends the PWM signals to the inverter to regulate Imotor to the reference
value. In failure situations (such as short circuit situations in cell or module level)
the controller can either set the maximum allowable battery current to zero or open
the contactor directly.
Chapter 1. Introduction 11
Module
Driver
Pedal
-
Battery Pack
Ibt,maxIbt,min
Central
BMS
BMS
vcell
icell
Data
from
Modules
+
vcell
icell
BMS
Cell
+-
+-
Imotor,ref
ref
Imotor
GC1 GC2PWM
ModuleIreq
Controller
Vbt
Ibt
Traction
Motor
Inverter
Contactor
Controller
S1
S2
S1
S2
Figure 1.4: Electric vehicle architecture.
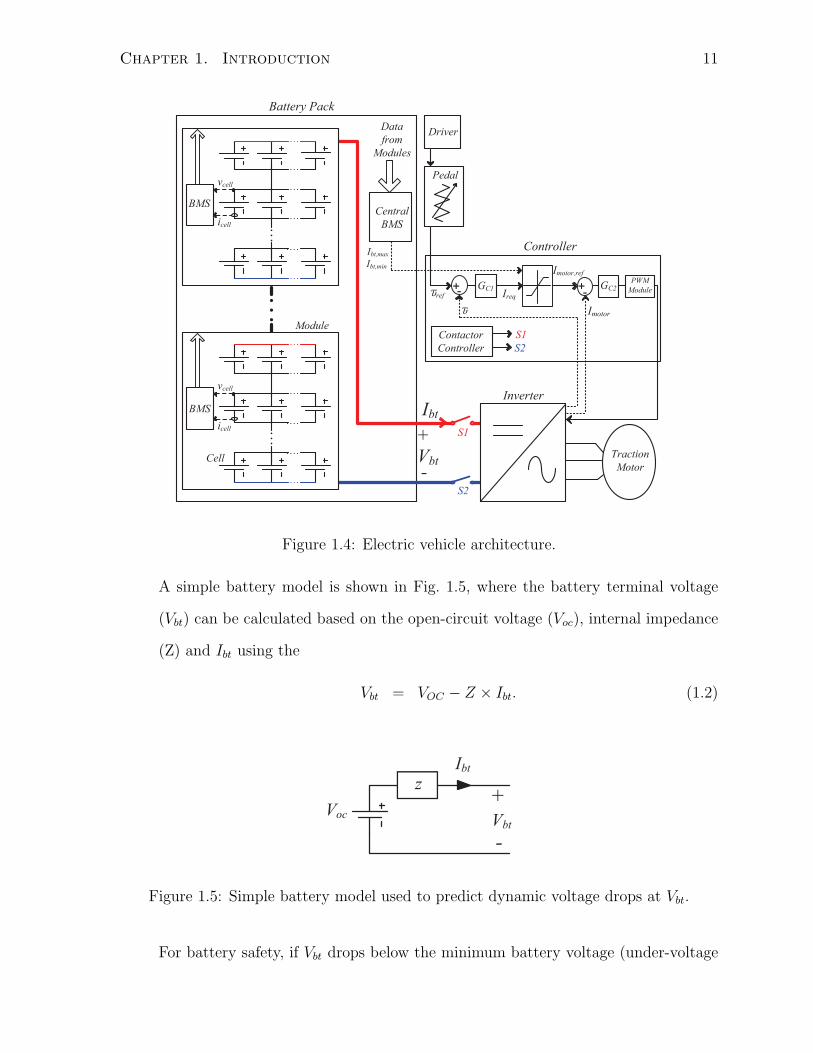
A simple battery model is shown in Fig. 1.5, where the battery terminal voltage
(Vbt) can be calculated based on the open-circuit voltage (Voc), internal impedance
(Z) and Ibt using the
Vbt = VOC − Z × Ibt. (1.2)
Ibt
Vbt
-
+Voc
z
Figure 1.5: Simple battery model used to predict dynamic voltage drops at Vbt.
For battery safety, if Vbt drops below the minimum battery voltage (under-voltage

Chapter 1. Introduction 12
situation) or rises above the maximum battery voltage (over-voltage situation),
the BMS broadcasts a zero available current and the inverter is unable to drive
the motor. An under-voltage fault may occur when the BMS overestimates the
allowable discharging current, and the battery voltage drops below the minimum
voltage. Over-voltage situation can happen when the BMS overestimates the al-
lowable charging current during the Regen braking, and the battery voltage rises
above the maximum voltage. Therefore, it is critical for the BMS to accurately
predict the allowable battery current range, which is only possible by providing the
BMS with a precise battery model.

Chapter 1. Introduction 13
1.3 Thesis Motivation and Objectives
The goal of this work is to design a cell testing platform and battery modeling for electric
vehicles. More specifically, a novel cell testing platform is designed as a powerful tool
to investigate the long-term capacity fade of Li-Ion batteries. Furthermore, a novel
battery modeling approach is proposed to accurately predict the battery performance.
The proposed model is intended to be implemented in real-time BMS systems to further
improve the vehicle performance.
Although commercialized battery cell testers can be utilized to test batteries, they are
not ideal for this work as high power automotive grade cells are used which would lead to
large amount of wasted energy. Assuming the use of a commercialized six-channel cycler,
the amount of energy wasted would be 350 kWh in one year, hence, high power cooling
systems are required. The first objective of this thesis is to design a multi-channel Li-Ion
cell testing platform having the following requirements:
• A modular architecture with fully independent channels,
• A low cost, low volume and digitally-controlled design with a switching frequency
of 200 kHz,
• A regenerative design for transmitting the battery energy to power grid during
discharging, and
• A power level of 300 W and input voltage of 5 V per channel corresponding to a
single Li-Ion cell.
Ultra-capacitors are exploited as the auxiliary storage elements in the system to max-
imize the efficiency and stability by storing the instantaneous battery current (with high
dynamics) while the average battery energy is transmitted to the power grid by the
inverter.

Chapter 1. Introduction 14
The second objective is to propose a battery modeling approach which dynamically
updates the model parameters based on battery temperature and SOC variations. The
model considers the following factors:
• State of Charge
• Cell and ambient temperature
• Self heating
• Simplicity for digital real-time implementation in an embedded system.
Furthermore, the designed battery model is used to illustrate the effects of battery
impedance on the performance of EVs under experimental drive-cycles based on real
driving conditions. This thesis is organized as follows, Chapter 2 introduces the pro-
gramable and regenerative multi-channel Li-Ion cell testing platform. A cycler with a
novel design, control strategy, implementation and experimental results are provided. In
Chapter 3, a battery modeling approach is proposed which can dynamically update the
model parameters based on battery temperature and SOC. The model parameters are
experimentally extracted for two different automotive grade cells. Utilizing the proposed
modeling approach, the impact of battery impedance on performance of EVs under real-
world drive-cycles is discussed in Chapter 4. Finally, the conclusion and future work are
covered in Chapter 5.

References
[1] B. Scrosati and J. Garche, “Lithium batteries: Status, prospects and future,” Jour-
nal of Power Sources, vol. 195, no. 9, pp. 2419 – 2430, 2010.
[2] N. Omar, P. Van den Bossche, G. Mulder, M. Daowd, J. Timmermans, J. Van Mierlo,
and S. Pauwels, “Assessment of performance of lithium iron phosphate oxide, nickel
manganese cobalt oxide and nickel cobalt aluminum oxide based cells for using in
plug-in battery electric vehicle applications,” in Vehicle Power and Propulsion Con-
ference (VPPC), 2011 IEEE, pp. 1–7, 2011.
[3] United States Energy Information Administration (EIA). Accessed in August 2012,
available at http://www.eia.gov/.
[4] X. Li, L. A. C. Lopes, and S. Williamson, “On the suitability of plug-in hybrid
electric vehicle (phev) charging infrastructures based on wind and solar energy,” in
Power Energy Society General Meeting, 2009. PES ’09. IEEE, pp. 1–8, 2009.
[5] Z. Li and A. Khaligh, “An integrated parallel synchronous rectifier and bi-directional
dc/dc converter system for solar and wind powered hybrid electric vehicle,” in In-
dustrial Electronics, 2009. IECON ’09. 35th Annual Conference of IEEE, pp. 3779–
3784, 2009.
[6] M. Moshirvaziri, “Ultracapacitor/battery hybrid energy storage systems for electric
vehicles,” Master’s thesis, University of Toronto, Canada, 2012.
15

REFERENCES 16
[7] R. H. Miller, J. J. Brockman, and A. Kusko, “Regeneration in electric vehicles,” in
Vehicular Technology Conference, 1978. 28th IEEE, vol. 28, pp. 156–156, 1978.
[8] M. Montazeri-Gh, M. Soleymani, and S. Hashemi, “Impact of traffic conditions on
the active suspension energy regeneration in hybrid electric vehicles,” Industrial
Electronics, IEEE Transactions on, vol. 60, no. 10, pp. 4546–4553, 2013.
[9] M.-J. Yang, H.-L. Jhou, B.-Y. Ma, and K.-K. Shyu, “A cost-effective method of
electric brake with energy regeneration for electric vehicles,” Industrial Electronics,
IEEE Transactions on, vol. 56, no. 6, pp. 2203–2212, 2009.
[10] E. Prada, D. Di Domenico, Y. Creff, J. Bernard, V. Sauvant-Moynot, and F. Huet,
“Physics-based modelling of lifepo4-graphite li-ion batteries for power and capacity
fade predictions: Application to calendar aging of phev and ev,” in Vehicle Power
and Propulsion Conference (VPPC), 2012 IEEE, pp. 301–308, 2012.
[11] F. Werfel, U. Floegel-Delor, T. Riedel, R. Rothfeld, D. Wippich, B. Goebel,
G. Reiner, and N. Wehlau, “A compact hts 5 kwh/250 kw flywheel energy storage
system,” Applied Superconductivity, IEEE Transactions on, vol. 17, no. 2, pp. 2138–
2141, 2007.
[12] A. Eddahech, O. Briat, and J. Vinassa, “Real-time soc and soh estimation for ev
li-ion cell using online parameters identification,” in Energy Conversion Congress
and Exposition (ECCE), 2012 IEEE, pp. 4501–4505, 2012.
[13] J. Shen, S. Dusmez, and A. Khaligh, “An advanced electro-thermal cycle-lifetime
estimation model for lifepo4 batteries,” in Transportation Electrification Conference
and Expo (ITEC), 2013 IEEE, pp. 1–6, 2013.
[14] J. Yan, C. Li, G. Xu, and Y. Xu, “A novel on-line self-learning state-of-charge
estimation of battery management system for hybrid electric vehicle,” in Intelligent
Vehicles Symposium, 2009 IEEE, pp. 1161–1166, 2009.

REFERENCES 17
[15] A. Hentunen, T. Lehmuspelto, and J. Suomela, “Electrical battery model for dy-
namic simulations of hybrid electric vehicles,” in Vehicle Power and Propulsion
Conference (VPPC), 2011 IEEE, pp. 1–6, 2011.
[16] R. Dougal, S. Liu, and R. White, “Power and life extension of battery-ultracapacitor
hybrids,” Components and Packaging Technologies, IEEE Transactions on, vol. 25,
no. 1, pp. 120–131, 2002.
[17] T. B. Reddy and D. Linden, Linden’s Handbook of Batteries, 4th Ed. 2011.
[18] W. Luo, C. Lv, L. Wang, and C. Liu, “Study on impedance model of li-ion battery,”
in Industrial Electronics and Applications (ICIEA), 2011 6th IEEE Conference on,
pp. 1943–1947, 2011.
[19] D. Edwards and C. Kinney, “Advanced lead acid battery designs for hybrid elec-
tric vehicles,” in The Sixteenth Annual Battery Conference on Applications and
Advances, pp. 207 –212, 2001.
[20] A. Cooper and P. Moseley, “Progress in the development of lead-acid batteries for
hybrid electric vehicles,” in IEEE Vehicle Power and Propulsion Conference, VPPC,
pp. 1 –6, Sept. 2006.
[21] “5 year nickel prices and price charts.” InfoMine, Commodity Prices. Accessed in
September 2013, available at http://www.infomine.com/.
[22] “1 year nickel spot chart.” KITCO, Historical Charts. Accessed in September 2013,
available at http://www.kitcometals.com/.
[23] K. Yiu, “Battery technologies for electric vehicles and other green industrial
projects,” in Power Electronics Systems and Applications (PESA), 2011 4th In-
ternational Conference on, 2011.

REFERENCES 18
[24] “Portable rechargeable batteries (secondary batteries).” Battery Association
of Japan, About Batteries. Accessed in September 2013, available at
http://www.baj.or.jp/e/knowledge/history03.html.
[25] S. G. Chalk and J. F. Miller, “Key challenges and recent progress in batteries, fuel
cells, and hydrogen storage for clean energy systems,” Journal of Power Sources,
vol. 159, no. 1, pp. 73 – 80, 2006.
[26] “Li(nmc)o2 - lithium nickel manganese cobalt dioxide.” umicore Cobalt
and Specialty Materials. Accessed in Agust 2013, available at
http://csm.umicore.com/products/rechargeableBatteriesMaterials/lithiumNmcDioxide/.
[27] “Learn about batteries.” Battery University. Accessed July 2012, available at
http://batteryuniversity.com/learn/article/types of lithium ion.
[28] A. Baba and S. Adachi, “State of charge estimation of lithium-ion battery using
kalman filters,” in Control Applications (CCA), 2012 IEEE International Conference
on, pp. 409–414, 2012.
[29] J. Miller, T. Bohn, T. Dougherty, and U. Deshpande, “Why hybridization of energy
storage is essential for future hybrid, plug-in and battery electric vehicles,” in Energy
Conversion Congress and Exposition, 2009. ECCE 2009. IEEE, pp. 2614–2620, 2009.
[30] J. S. Gnanaraj, R. W. Thompson, S. N. Iaconatti, J. F. DiCarlo, and K. M. Abra-
ham, “Formation and growth of surface films on graphitic anode materials for li-ion
batteries,” Electrochemical and Solid-State Letters, vol. 8, no. 2, pp. A128–A132,
2005.
[31] G. Ning, B. Haran, and B. N. Popov, “Capacity fade study of lithium-ion batteries
cycled at high discharge rates,” Journal of Power Sources, vol. 117, pp. 160–169,
May 2003.

Chapter 2
Multi-Channel Cell Testing Platform
2.1 Introduction
The focus of this chapter is the design of a programmable and regenerative multi-channel
Li-Ion cell testing platform as a powerful tool to investigate the long-term effects of
ambient temperature, average current and current dynamics on the lifetime of Li-Ion
batteries.
The Li-Ion cells used in this project are provided by Brammo Inc. [1]. The cell
specifications are listed in Table 2.1. The nominal cell capacity and voltage are 10 Ah
and 3.7 V, respectively. The maximum continuous discharge current can be as high as 5
C (50 A), however, the battery cell can deliver 8 C (constant discharge) for 15 seconds.
The cell capacity is rated to reduce by a maximum of 10% after 500 cycles.
The designed cell cycler platform consists of six parallel channels in order to test
the batteries in various scenarios, as shown in Table 2.2. The channels are capable of
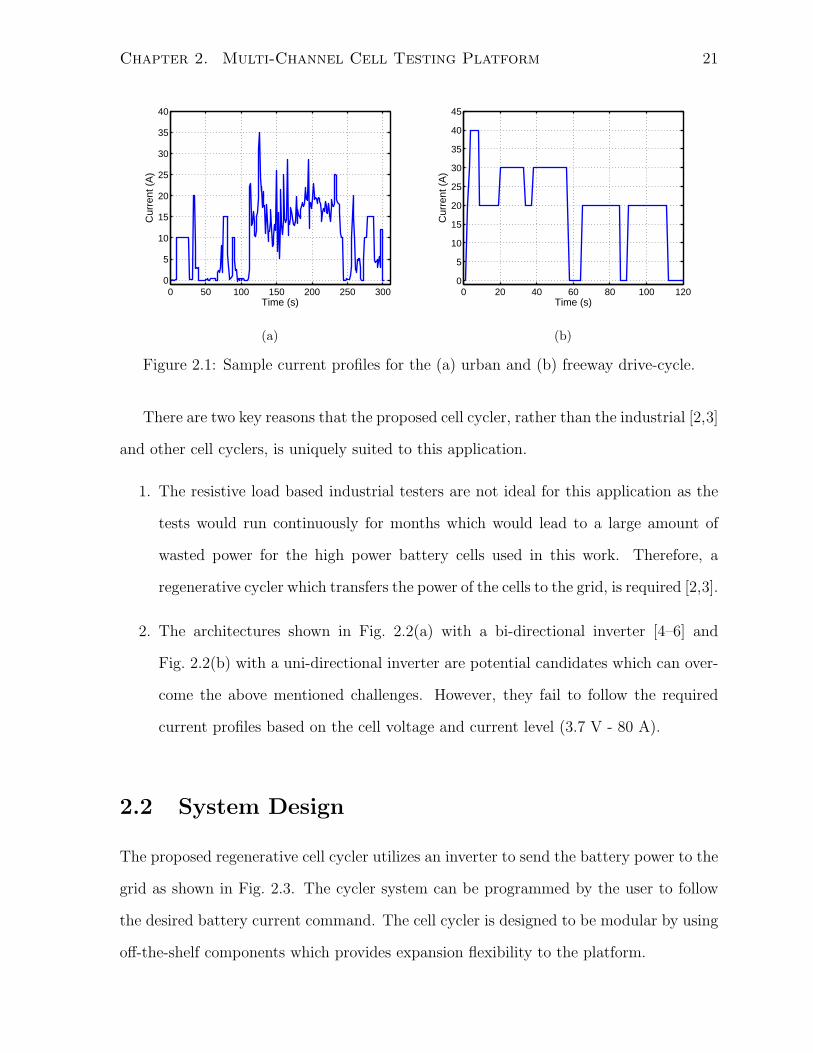
tracking dynamic currents up to 8 A/ms. Two sets of drive-cycle data, representing
urban and freeway drive-cycles, are available from a commercialized motorcycle provided
by Brammo Inc.. The current profiles of the urban and freeway drive-cycles are shown
in Fig. 2.1.
19

Chapter 2. Multi-Channel Cell Testing Platform 20
Table 2.1: Li-Ion Cell Specifications
Item Value
Rated Capacity 10− 10.5 Ah
Nominal Voltage 3.7 V
Charged Limited Voltage 4.2 V
Discharge cut− off Voltage 3.0 V
Internal Impedance 3.5±1 mΩ (at 1 kHz at 25± 5C)
Standard Charge Constant Current: 0.2 C
Constant Voltage: 4.2 V
End-of-charge Current: 500 mA
Standard Discharge Constant Current: 0.2 C
to Discharge cut-off voltage
Maximum Continuous Charge Current 1 C (10 A)
Maximum Continuous Discharge Current 5 C (50 A)
Maximum Discharge Current 8 C (80 A) for 15 seconds
Operating Temperature Charge: 0− 45C
Discharge: (−10)− 55C
Table 2.2: Cycling Plan.
Channel Discharge Ambient Average Peak Duration
Number Mode Temperature C Rate C Rate
(C) (min)
1 constant C-rate 25 1 1 60
2 constant C-rate 25 2 2 30
3 constant C-rate 15 2 2 30
4 constant C-rate 25 3.5 3.5 17
5 Urban Drive 25 1 3.5 5
6 Freeway Drive 25 2 4 2
Chapter 2. Multi-Channel Cell Testing Platform 21
0 50 100 150 200 250 3000
5
10
15
20
25
30
35
40
Cur
rent
(A
)
Time (s)
(a)
0 20 40 60 80 100 1200
5
10
15
20
25
30
35
40
45
Cur
rent
(A
)
Time (s)
(b)
Figure 2.1: Sample current profiles for the (a) urban and (b) freeway drive-cycle.
There are two key reasons that the proposed cell cycler, rather than the industrial [2,3]
and other cell cyclers, is uniquely suited to this application.
1. The resistive load based industrial testers are not ideal for this application as the
tests would run continuously for months which would lead to a large amount of
wasted power for the high power battery cells used in this work. Therefore, a
regenerative cycler which transfers the power of the cells to the grid, is required [2,3].
2. The architectures shown in Fig. 2.2(a) with a bi-directional inverter [4–6] and
Fig. 2.2(b) with a uni-directional inverter are potential candidates which can over-
come the above mentioned challenges. However, they fail to follow the required
current profiles based on the cell voltage and current level (3.7 V - 80 A).
2.2 System Design
The proposed regenerative cell cycler utilizes an inverter to send the battery power to the
grid as shown in Fig. 2.3. The cycler system can be programmed by the user to follow
the desired battery current command. The cell cycler is designed to be modular by using
off-the-shelf components which provides expansion flexibility to the platform.

Chapter 2. Multi-Channel Cell Testing Platform 22
(a) (b)
Figure 2.2: (a) Bi-directional and (b) uni-directional inverter-based regenerative cell
cycler architectures.
(a)
Figure 2.3: Proposed cell cycler architecture.
In the proposed cell cycler, the battery is connected to the main bus using a bi-
directional dc-dc converter, which in turn is connected to the inverter by a second con-
verter. The Li-Ion Capacitors (LICs) with high power density (7 kW/kg), high cycling
ability and low ESR (1 mω) are added to the system as short-term energy storage ele-
ments to stabilize the system by reducing the current stress on the inverter. The LICs
store the instantaneous battery current (with high dynamics) while the average stored
energy in LICs is transferred to the inverter through the second converter.

Chapter 2. Multi-Channel Cell Testing Platform 23
The descriptions of the components are as follows:
1. Power Supply
An off-the-shelf 6 V current-limited dc power supply is used to power the controller
module of the cycler board and to charge the battery. A diode is connected in series
with the power supply to protect it from reverse current flow. In order to minimize
the conduction loss, a diode is selected which has the minimum voltage drop over
the operating current range.
2. Lithium-Ion Capacitor
Ultra-capacitors are used as short-term energy storage for power smoothing and
stabilizing the system. Electrochemical Double-Layer Capacitors (EDLC), also
known as ultra-capacitors (u-caps), have a symmetric input and output specific
power. Their power density is ten times than that of a typical Lithium-ion battery
and their energy density is four times than that of a typical double-layer capacitor
[7, 8]. In addition, they offer higher cycle life, lower Equivalent Series Resistance
(ESR) and reduced susceptibility to high depth-of-discharge.
The new LIC technology combines the intercalation mechanism of traditional Li-
Ion batteries with the cathode of EDLCs, as shown in Fig. 2.4(a) [9]. The cathode
employs activated carbon material at which charges are stored at the interface
between the carbon and the electrolyte. The anode is generally pre-doped with
Lithium ions, resulting in a lower anode voltage, and a higher cell voltage of 3.8-4
V versus 2.5-2.7 V for EDLCs [9]. As a consequence, same capacity LICs have
2-4× higher energy density than EDLCs, as shown in Fig. 2.4(b). LICs are well
suited in the proposed battery cell cycler where relatively high energy (for power
smoothing in time-scale of minutes) and high cycle-life (for long-time operation of
the cell tester) are required. LICs with a nominal capacity of 3300 F and energy
density of 12 Wh/kg are used in the system to handle the required energy. Two

Chapter 2. Multi-Channel Cell Testing Platform 24
of these LICs are connected in series to provide the required voltage range by the
system.
(a)
0.01
0.1
1
10
100
0.1 1 10 100 1000
Spe
cific
Po
wer
(kW
/kg)
Specific Energy (Wh/kg)
ucap 2.5 V
ucap 2.7 V
Battery discharge
Battery charge
LIC 3.8 V
EDLC U-capsBattery:Discharge
Battery:Charge
High-power batteries
High-energybatteries
LICs: Used in this work
(b)
Figure 2.4: (a) Physical structure of Li-Ion Capacitor (courtesy of JSR Micro) [9]. (b)
Ragone plot for different storage technologies [10].

Chapter 2. Multi-Channel Cell Testing Platform 25
3. Inverter
An off-the-shelf 250 W grid-tied single-phase inverter is used to transfer the bat-
tery power to the grid when the battery is discharging. The inverter is originally
intended for micro wind turbine applications, where its power-voltage (P-V) profile
can be programmed based on the turbine specifications. The P-V profile can be
configured based on the slope of power versus voltage (Sp−v) and the cut-off volt-
age (Vinv,cut). The rated minimum and maximum operating input voltage of the
inverter (Vinv) are 25 V and 50 V, respectively. For achieving higher efficiency and
stability Sp−v and Vinv,cut are designed to be 25 W/V and 25 V, respectively. The
desired P-V profile along with some other examples are shown in Fig. 2.5.
20 25 30 35 40 45 500
50
100
150
200
250
Input Voltage (v)
Pow
er (
w)
Desired P−V Profile
Spv
=25 W/V
Vinv,cut
=25 V
Figure 2.5: Inverter P-V profile.

Chapter 2. Multi-Channel Cell Testing Platform 26
2.2.1 Cycler Board Design
The cycler board with its novel architecture, which acts as an interface between the
battery, inverter and the power supply, is made up of two dc-dc converters. The first
dc-dc converter connects the battery to the LICs (main bus), and controls the battery
current (Ibt). Due to the voltage range of the bus (5.7-7.6 V) and the battery (3-4.2 V),
this converter is designed as a bi-directional synchronous buck converter. The second
dc-dc converter connects the main bus to the inverter and controls the bus voltage (Vuc)
keeping it within the safe range of operation. This converter is designed as a boost
converter connecting the main bus (5.8-7.6 V) to the inverter (25-35 V).
The cycler board configuration is shown in Fig. 2.6(a) where the buck and boost
converters have two interleaved phases. The use of a two-phase interleaved architecture
offers lower output voltage ripple, and higher efficiency due to the lower conduction
losses as compared to the non-interleaved architecture [11, 12]. Ideal inductor currents
(iL) and ibt for the interleaved two-phase converter are shown in Fig. 2.6(b), where fs is
the switching frequency of the converter.
Vinv
CinVuc
Cout
-
+
VbtCout -
+
c1
c1
c2
c2
c4c3
c4c3
iL3
iL4
iL2
iL1Ibt
6 V Iinv+-
(a)
iL
t
ΔIL
1/fs
iL1
iL2
IL
1/(2fs)
Ibt
ibt ΔIbt
(b)
Figure 2.6: (a) The cycler board configuration. (b) Ideal inductor current for an inter-
leaved double-phase converter.

Chapter 2. Multi-Channel Cell Testing Platform 27
2.3 Controller Design
The digital controller of the multi-channel cell testing platform (shown in Fig. 2.7) re-
quires two levels of control due to the existence of multiple channels. The central con-
troller monitors the channels and sends the desired current references to the platform,
while the local controller which is designed and implemented for each channel, controls
the converters by sending PWM signals. The main purpose of the high-level controller
is to send the battery current references to the channels based on the cycling plan. This
controller monitors the voltage, current and temperature of the batteries to ensure the
safe operation of the system, and logs these parameters for historical analysis. The main
purpose of each local controller is to regulate the Ibt while the Vuc is maintained within
the safe range. In addition, Vinv has to be maintained above 25 V to avoid the inverter
from shutting down. This fail-safe mechanism increases the stability of the system. The
local controller is made up of two sub-controllers which control the buck and the boost
converters.
Figure 2.7: Controller diagram of the cell cycler.

Chapter 2. Multi-Channel Cell Testing Platform 28
The controller of the buck converter operates in Average Current Mode Control
(ACMC) to regulate Ibt [13–16], while the controller of the boost converter operates
in two voltage control modes. The operation modes of the boost controller are shown in
Fig. 2.8. It should be noted that the minimum operating inverter voltage is 25 V, hence,
if Vinv drops below 25 V, the inverter turns off. In the first mode, where Vuc < 7 V, the
controller regulates the Vinv to 26 V to ensure the continued operation of the inverter.
In the second mode, where Vuc > 7 V, the controller regulates Vuc to 7 V to ensure the
safe operation voltage of the LICs. When Vuc > 7, the controller regulate Vuc by sending
more power to the inverter.
7 V
Vuc
7.6 V5.7 V
Mode 2
Vuc,ref = 7 V
Mode 1
Vinv,ref = 26 V
Figure 2.8: Operation modes of the boost converter controller.

Chapter 2. Multi-Channel Cell Testing Platform 29
The controller of the bi-directional buck converter is shown in Fig. 2.9(a) where a
digital PI controller regulates the current of the phases by adjusting their duty cycles
[17–20]. The controller of the boost converter in mode 1 and 2 are shown in Fig. 2.9(b)
and (c), respectively. In mode 1, the boost controller operates in voltage-mode to regulate
the converter output voltage (Vinv) to 26 V by adjusting the PWM signals. However, in
mode 2, it operates in voltage-mode to regulate converter input voltage (Vuc). In order
to regulate Vuc, the extra power is required to be transmitted to the inverter, therefore,
inductor currents are adjusted to deliver this extra power to the inverter [21,22].
GCi
GCi
PWM
Module
DC-DC
Buck
Converter
D1
D2
c1
c2
c1
c2
+-
+-
Ibt,ref /2
IL1
IL2
(a)
GCv
GCv
PWM
Module
DC-DC
Boost
Converter
D3
D4
c3
c4
c3
c4
+-
+-
Vinv,ref = 26V
Vinv
IL1
IL2
(b)
GCi
GCi
PWM
Module
DC-DC
Boost
Converter
D3
D4
c3
c4
c3
c4
+-
+-
Vuc,ref= 7V
Vuc
IL1
IL2
+-GCvIref
(c)
Figure 2.9: Control diagram of (a) the buck converter and the boost converter in (b)
mode 1 and (c) mode 2.

Chapter 2. Multi-Channel Cell Testing Platform 30
To illustrates the cycler operation, a scenario is shown in Fig. 2.10. In the beginning,
Ibt is zero and Vuc is 5.7 (diode on), therefore, the boost converter is in mode 1, regulating
Vinv to 26 V (Fig. 2.11(a)). When Ibt is 20 A (Fig. 2.11(b)), Vuc increases but it is still
lower than 5.8 V and therefore, the diode is still on. In the above time intervals, the
power required by the inverter is supplied by the power supply.
The diode turns off when Vuc gets higher than 5.8 V (Fig. 2.11(c)), and the power
required by the inverter is only supplied by the LICs. When Vuc gets higher than 7 V
(Fig. 2.11(d)), the boost controller regulates the Vuc to 7 V (boost controller is in mode
2) by sending more power to the inverter. Therefore, the inverter voltage increases in
order to sink the required amount of power. When Ibt gets negative (Fig. 2.11(e)) the
battery starts charging and Vuc starts decreasing while the diode is still off. The diode
turns on (Fig. 2.11(f)) when Vuc drops below 5.8 V.
Ibt
Vbt
Vuc
Diode
Vinv
t
26 V
5.7 V
3.8 V
20 A
7 V
on
off
-10 A
0 A
t2 t3 t4 t5t1 t6 t7
5.8 V
30 A
Charging
Discharging
Figure 2.10: Operation diagram.

Chapter 2. Multi-Channel Cell Testing Platform 31
Vinv
Vuc
Cout
-
+
VbtCout -
+
c1
c1
c2
c2
c4c3
c4c3
iL3
iL4
iL2
iL1 Ibt
6 VIinv
Vuc = 5.7 V
Vinv = 26 V
+-
(a)
Vinv
Vuc
Cout
-
+
VbtCout -
+
c1
c1
c2
c2
c4c3
c4c3
iL3
iL4
iL2
iL1
6 V
Vuc < 5.8V
Ibt > 0
Iinv
Vinv = 26 V
+-
(b)
Vinv
CinVuc
Cout
-
+
VbtCout -
+
c1
c1
c2
c2
c4c3
c4c3
iL3
iL4
iL2
iL1
6 V
Ibt > 0
Iinv
Vinv = 26 V
Vuc < 7V
+-
(c)
Vinv
Vuc
Cout
-
+
VbtCout -
+
c1
c1
c2
c2
c4c3
c4c3
iL3
iL4
iL2
iL1
6 V
Ibt > 0
Iinv
Vinv > 26 V
Vuc = 7V
+-
(d)
Vinv
Vuc
Cout
-
+
VbtCout -
+
c1
c1
c2
c2
c4c3
c4c3
iL3
iL4
iL2
iL1 Ibt < 0
6 VIinv
Vinv = 26 V
Vuc > 6V
+-
(e)
Vinv
Vuc
Cout
-
+
VbtCout -
+
c1
c1
c2
c2
c4c3
c4c3
iL3
iL4
iL2
iL1 Ibt < 0
6 VIinv
Vinv = 26 V
Vuc = 5.7 V
+-
(f)
Figure 2.11: Power flow in time intervals of (a) t1-t2, (b) t2-t3, (c) t3-t4, (d) t4-t5, (e) t5-t6
and (f) t6-t7.

Chapter 2. Multi-Channel Cell Testing Platform 32
2.4 System Implementation and Results
The implemented cell cycler system with the cycler board and off-the-shelf components
is shown in Fig. 2.12(a). The designed 300 W (the maximum deliverable power by the
battery is 296 W (80 A - 3.7 V)) cycler board, which consists of two-phase converters
is shown in Fig. 2.12(b). Two individual microcontrollers (dsPIC30F2020) are used to
control the converters. The specifications of the converters are listed in Table 2.3.
Table 2.3: Experimental System Parameters
Buck Converter (Each Phase) Value Unit
U-Cap Voltage, Vuc 4.6-7.6 V
Battery Voltage, Vbt 3-4.2 V
Switching Frequency, fs 200 kHz
Max. Power, Pmax 150 W
Inductors, L 3.3 µH
Inductor ESR, RL 1.5 mΩ
Saturation Current, IL,sat 48 A
MOSFET on-resistance, Ron 1.7 mΩ
Boost Converter (Each Phase)
U-Cap Voltage, Vuc 4.6-7.6 V
Max. Inverter Voltage, Vinv 35 V
Switching Frequency, fs 200 kHz
Max. Power, Pmax 150 W
Inductors, L 10 µH
Inductor ESR, RL 2.6 mΩ
Saturation Current, IL,sat 18 A
MOSFET on-resistance, Ron 3.2 mΩ

Chapter 2. Multi-Channel Cell Testing Platform 33
DC Power Supply
Battery
LICs
Cycler Board
Temperature Sensor
Inverter
Breakers
Fan
Signals to NI sbRIO
(a)
Buck
Converter
Boost
Converter
Controller
Vbt Vuc Diode
Ibt
6 V
Vinv
Controller
Phase
1
Phase
2
Phase
1
Phase
2
Inductors
MosfetMosfets
(b)
Figure 2.12: Implementation of the (a) cell cycler and (b) cycler board.

Chapter 2. Multi-Channel Cell Testing Platform 34
The operation of the buck converter in steady state is illustrated in Fig. 2.13(a),
where the switching frequency is 200 kHz (to achieve high efficiency). The average value
and the peak-to-peak ripple of interleaved inductor currents (iL1, iL2) are 15 A and 2 A,
respectively. The response of the buck converter to a 40 A step (10 A/div) in battery
reference current is shown in Fig. 2.13(b). The settling time (10%-90%) of the response is
less than 5 ms, while the response overshoot is less than 5%. The steady state operation
of the boost converter in mode 1 (regulating Vinv to 26 V) is shown in Fig. 2.13(c), where
the converter is switching at 200 kHz.

Chapter 2. Multi-Channel Cell Testing Platform 35
vx1(t)
vx2(t)
iL1(t)
iL2(t)
2.0µs/div
1/fs
1/(2fs)
ΔiL1=2A
ΔiL2=2A
IL1=15A
IL2=15A
(a)
Ibt=40A
vbt(t)
vuc(t)
ibt(t) 5.0ms/div
5.0ms
800 mV
180 mV
Ibt=0A
(b)
vx1(t)
vx2(t)
vinv(t)
2.0µs/div
1/fs 1/(2fs)
Vinv=26V
(c)
Figure 2.13: (a) Steady state and (b) current step response of the buck converter. (c)
Steady state response of the boost converter.

Chapter 2. Multi-Channel Cell Testing Platform 36
The current profile scenario discussed in 2.3, is experimentally tested on the cycler
system, and the results are shown in Fig. 2.14. In the beginning, Ibt is zero and Vinv
is regulated to 26 V (boost converter is in mode 1). When Vuc gets higher than 7 V,
the boost controller regulates Vuc to 7 V (boost controller is in mode 2) by sending the
more power to the inverter. Therefore, the inverter voltage increases in order to sink
the required amount of power. When Ibt gets negative, and battery starts charging, Vuc
starts decreasing and Vuc is regulated to 26 V.
It should be noted that the cycler is designed for 300 W - 80 A , however, the
continuous discharge power of the battery is lower than 200 W (the maximum discharge
current of the battery is 50A). The measured efficiency of the cell cycler for the input
power of 160 W (4 V, 40 A) is 82.5%.
vbt(t)
ibt(t)
vuc(t)
vinv(t)
50.0 s/div
5.7V
-10A
30A
20A
0A 26V
(a)
Figure 2.14: Experimental Vbt, Vuc and Vinv during the system operation under the sample
current profile.

Chapter 2. Multi-Channel Cell Testing Platform 37
The regenerative six-channel cell testing platform is implemented as shown in Fig. 2.15(a).
The six channels operate in parallel and are individually programmed based on the spe-
cific cycling plan as shown in Table 2.2. An NI single-board RIO (sbRIO) FPGA platform
is utilized as the main controller to send the desired current profiles to the channels. The
sbRIO is controlled in real-time by a designed LabVIEW program. The front panel of
the LabVIEW program is shown in Fig 2.15(b), where the user can control the channels
and set the safety limits.

Chapter 2. Multi-Channel Cell Testing Platform 38
1
2
3
4
5
6
Cooler
sb-RIO
(a)
NI 9683
Stop
Indicators
File Name
DischargeCharge
Safety Limits
Turn on
Run
Pause
Reset
State
(b)
Figure 2.15: (a) Six channel cell testing platform. (b) Front panel of the LabVIEW
program.

Chapter 2. Multi-Channel Cell Testing Platform 39
2.5 Chapter Summary and Conclusion
In this Chapter, a regenerative multi-channel cell testing platform is proposed. This plat-
form is designed for investigating the long-term effects of temperature, average current
and dynamics of the current profile of EVs on lifetime of Li-Ion batteries. Industrial
cell testers are not ideal for this application as they usually lack one or more of the
following properties: regenerative ability and high current bandwidth. The novel archi-
tecture of the proposed cell cycler utilizes a grid-tie single phase inverter for each channel
and LICs to overcome the above mentioned challenges. In addition, the cycler system
is programmable, meaning that the users can program their desired current commands
to be sent to the system. The battery cell cycler is designed to be modular to enable
the addition of more channels by utilizing off-the-shelf components. The 300 W and 5
V cycler system is designed and implemented. The experimental results of the cycler
prove the stable closed-loop operation of the system. The cycler system has the ability
to follow the current dynamics of up to 8 A/ms.

References
[1] Brammo, Inc. Accessed in August 2013, available at
http://www.brammo.com/home/.
[2] Gaus sts power electronics. Accessed in August 2013, available at http://www.gaus-
sts.com/index.html.
[3] C8000 Battery Testing System, CADEX. Accessed in August 2013, available at
http://www.cadex.com/products/c8000-battery-testing-system.
[4] T. F. Wu, K. H. Sun, C. L. Kuo, M.-S. Yang, and R.-C. Chang, “Design and
implementation of a 5 kw bi-directional inverter with wide inductance variation,” in
Energy Conversion Congress and Exposition (ECCE), 2010 IEEE, pp. 45–52, 2010.
[5] T. F. Wu, C. H. Chang, H.-C. Wu, J.-R. Ciou, and T.-S. Lin, “Predictive digital
controlled three phase bi-directional inverter with wide inductance variation,” in
Energy Conversion Congress and Exposition (ECCE), 2010 IEEE, pp. 37–44, 2010.
[6] D. Thrimawithana, U. Madawala, and Y. Shi, “Design of a bi-directional inverter
for a wireless v2g system,” in Sustainable Energy Technologies (ICSET), 2010 IEEE
International Conference on, pp. 1–5, 2010.
[7] “48 V ultracapacitor specifications.” Maxwell Technologies Inc. datasheet, 2011.
available at http://maxwell.interconnectnet.com/.
40

REFERENCES 41
[8] “U-charge xp lithium iron magnesium phospate battery.” Valence Technology
datasheet, 2010. Available at http://www.valence.com/energy-storage/xp-12v-19v-
lithium-phosphate-battery-module.
[9] “Lithium Ion Capacitor.” JSR Micro, 2012. Available at
http://www.jsrmicro.com/index.php/EnergyAndEnvironment/LithiumIonCapacitor/.
[10] O. Laldin, M. Moshirvaziri, and O. Trescases, “Predictive algorithm for optimiz-
ing power flow in hybrid ultracapacitor/battery storage systems for light electric
vehicles,” IEEE Transactions on Power Electronics, vol. 28, no. 8, pp. 3882–3895,
2013.
[11] H. B. Shin, J. G. Park, S. K. Chung, H. W. Lee, and T. Lipo, “Generalised steady-
state analysis of multiphase interleaved boost converter with coupled inductors,”
Electric Power Applications, IEE Proceedings -, vol. 152, no. 3, pp. 584–594, 2005.
[12] R.-L. Lin, C.-C. Hsu, and S.-K. Changchien, “Interleaved four-phase buck-based
current source with center-tapped energy-recovery scheme for electrical discharge
machining,” Power Electronics, IEEE Transactions on, vol. 26, no. 1, pp. 110–118,
2011.
[13] R. Li, “Modeling average-current-mode-controlled multi-phase buck converters,” in
Power Electronics Specialists Conference, 2008. PESC 2008. IEEE, pp. 3299–3305,
2008.
[14] J. Morales, J. Leyva-Ramos, E. Carbajal, and M. Ortiz-Lopez, “Average current-
mode control scheme for a quadratic buck converter with a single switch,” Power
Electronics, IEEE Transactions on, vol. 23, no. 1, pp. 485–490, 2008.
[15] S. Kancherla and R. Tripathi, “Nonlinear average current mode control for a dc-
dc buck converter,” in Sustainable Energy Technologies, 2008. ICSET 2008. IEEE
International Conference on, pp. 831–836, 2008.

REFERENCES 42
[16] J.-J. Chen, B.-H. Hwang, C.-M. Kung, W.-Y. Tai, and Y.-S. Hwang, “A new single-
inductor quadratic buck converter using average-current-mode control without slope-
compensation,” in Industrial Electronics and Applications (ICIEA), 2010 the 5th
IEEE Conference on, pp. 1082–1087, 2010.
[17] P. Gayathiridevi, S. Vijayalakshmi, and K. Vairamani, “Discrete controller for high
frequency buck converter,” in Circuits, Power and Computing Technologies (IC-
CPCT), 2013 International Conference on, pp. 605–610, 2013.
[18] S. Mitra, L. H. Keel, and S. Bhattacharyya, “Data based design of digital pid con-
troller,” in American Control Conference, 2007. ACC ’07, pp. 226–230, 2007.
[19] L.-S. Su, “Digital controller - its design techniques,” in Instrumentation and Mea-
surement Technology Conference, 1994. IMTC/94. Conference Proceedings. 10th An-
niversary. Advanced Technologies in I amp; M., 1994 IEEE, pp. 841–844 vol.2, 1994.
[20] H. Seraji, “Design of discrete pid controllers for pole placement,” in Decision and
Control, 1984. The 23rd IEEE Conference on, vol. 23, pp. 1721–1722, 1984.
[21] C.-H. Hsu, T.-W. Chang, and C.-L. Wey, “A voltage-mode hysteretic boost dc-dc
converter with dual control modes,” in Microelectronics and Electronics (PrimeA-
sia), 2012 Asia Pacific Conference on Postgraduate Research in, pp. 67–71, 2012.
[22] C. Yao, X. Ruan, W. Cao, and P. Chen, “A two-mode control scheme with input
voltage feed-forward for two-switch buck-boost dc/dc converter,” 2013.

Chapter 3
Battery Modeling
3.1 Introduction
In this chapter, a novel approach is proposed to design a dynamic electrical battery
model for use in real-time BMS, as described in Section 1.2. The novelty within this
approach is that the model parameters are dynamically updated based on SOC and cell
temperature. Modeling of a commercially available Li-Ion battery using the proposed
approach is presented, and the model is experimentally validated.
Battery modeling plays a significant role in EV technologies. Battery models are
utilized by EV designers to optimally size the required ESS of an EV and to predict
the performance of the ESS. In addition, battery models are used as a powerful tool for
on-line self-learning performance and SOC estimation in BMS [1–6]. As EVs today use
Li-Ion batteries due to their high energy density [7, 8], accurate Li-Ion battery models
are required. It is critical for the battery models to consider thermal behavior of the
battery for lifetime and safety considerations [2, 9]. Various battery models for different
applications have been developed. Electrochemical models are used to optimize the
physical aspects of batteries and characterize power, voltage and current parameters
[10, 11]. Mathematical models [12, 13] are useful to designers for estimating battery
43

Chapter 3. Battery Modeling 44
runtime, efficiency, or capacity using mathematical methods like stochastic approaches
[1]. However, electrochemical and mathematical models are not suitable for real-time
BMS targeted application. Electrical models utilize equivalent circuit components to
predict the terminal characteristics of the batteries (their current and voltage). Also,
electrical battery models enable a systematic design approach for electric vehicles.
There exist several approaches in the literature for modeling batteries in the elec-
trical domain. In [1], an Li-Ion battery model capable of predicting runtime and I-V
performances of the battery is proposed. However, temperature variation is not taken
into account in their calculation. In [2,14], dynamic models are proposed for Li-Ion bat-
teries which consider the cell temperature. However, these models do not dynamically
update the model parameters based on cell temperature variations due to self heating. In
the following sections, the proposed battery modeling approach is discussed, a modeling
example is provided.
3.2 Electrical Battery Modeling
A common electrical and empirical battery model is shown in Fig. 3.1 [15–18]. This
model consists of three components: an open circuit voltage, VOC , a series resistance,
R0, and a cascade of RC circuits. The internal equivalent inductance of the battery
which represents the inductance of the connectors is ignored due to its negligible effect.
VOC represents the steady state terminal voltage of the battery under the open-circuit
condition and is a monotonic function of the SOC. R0 represents the electrical resistance
between the terminal contacts and the electrodes. The cascade of RC circuits arise from
two phenomena. The voltage drops on the resistors represent the required polarization
potential to activate the electrochemical reaction of the battery [15]. The capacitors
represent the structure of the battery and characterize the transient response of the
electrodes [15,16]. VOC is SOC dependent, and it has a minor dependency on temperature

Chapter 3. Battery Modeling 45
and SOC [17]. R0 is a function of temperature and the RC circuits are functions of
temperature and SOC [16,17].
R0
R1 R2 Rn
C1 C2 CnOC Vbt
-
+V
Figure 3.1: Common electrical battery model.
3.2.1 Proposed Modeling Approach
In the proposed battery modeling approach, the model parameters are dynamically up-
dated based on cell temperature and SOC variations. Therefore, the dynamic battery
behaviour may be more accurately predicted. This is because the battery impedance
is inversely proportional to its temperature. Hence, if self heating is not taken into
consideration, under estimation could be made with regards to the battery capability,
as self-heating directly increases the cell temperature enabling the battery to operation
more.
The effect of SOC variation is only taken into account to update the VOC parameter.
The RC circuits parameters are not updated due to SOC variations as these parameters
are minimally affected at frequencies of interest for EVs.
A battery model based on this approach is described below:
1. The effect of SOC on the VOC parameter may be obtained by discharging the
battery with nominal discharge current based on a given SOC interval step. Upon
applying each step, the battery is given time to rest until steady state is reached,
and afterwards VOC is measured.

Chapter 3. Battery Modeling 46
2. The internal impedance of the battery is measured at various temperatures con-
ditions. The battery internal impedance (Z) is obtained through sinusoidally per-
turbing the frequency of the discharge current while measuring the battery voltage.
3. Curve fitting methods are applied to obtain the resistive and capacitive compo-
nent values based on the measured internal impedance at the various temperature
conditions.
4. Based on the collected data, the model parameters are dynamically updated based
on self heating. A thermal model is utilized to obtain the cell temperature based
on the operating condition of the cell.
It should be noted that the battery model used in this approach is a small-signal
model, therefore, the model has limitations on current swings.
3.3 Modeling Example
In this section, the model for the Li-Ion battery discussed in Chapter 2, is derived utilizing
the proposed modeling approach.
3.3.1 VOC Parameter Determination
The obtained VOC versus SOC of the battery is shown in Fig. 3.2. The battery was
discharged with the nominal discharge current of 10 A.
3.3.2 Internal Impedance Measurements
The test setup for impedance measurement is shown in Fig. 3.3. The electrical load is
used to provide the current perturbation. The programmable function generator is used
as an interface to provide the sinusoidal reference current profile to the load. The battery
voltage and current are sampled by the oscilloscope and transmitted to the computer for

Chapter 3. Battery Modeling 47
0 20 40 60 80 1003200
3400
3600
3800
4000
4200
SOC (%)
VO
C(m
V)
Figure 3.2: VOC versus SOC curve.
digital post processing. The cooler (a chamber to maintain the temperature) was used
to regulate the battery temperature.
GPIBGPIB
GPIBOscilloscope
Electrical Load
Cooler
Function
Generator
Battery
Current
SensorBNC
Vbt Ibt
- +
Figure 3.3: Impedance measurement setup.
The Nyquist plot for the measured impedance measurements is shown in Fig. 3.4.

Chapter 3. Battery Modeling 48
The battery impedance can be defined as follows:
Z = Re[Z] + jIm[Z] (3.1)
where Re[Z] and Im[Z] are the real and imaginary parts of the impedance, respectively.
The impedance is measured within a temperature range of 5C to 20C and a frequency
range of 0.07 Hz to 7 kHz (based on the bandwidth limitation of the equipment). For
frequencies higher than 1 kHz, the imaginary part of the impedance is positive, which
shows the inductive behaviour of the terminal connectors of the battery.
From Fig. 3.4, the motivation behind considering the self heating effect to dynamically
update the model parameters is further justified. For example, the internal resistance of
the battery is almost halved from 5C to 20C at low frequencies.
5 10 15 20 25 30−2
−1
0
1
2
3
4
5
6
Re [z] (mΩ)
−Im
[z] (
mΩ
)
0.07 Hz
7000 Hz
20°C15°C10°C 5°C
Figure 3.4: Measured Nyquist curve for cell impendence.
3.3.3 Resistive and Capacitive Parameter Extraction
Using the obtained impedance plots, the resistive and capacitive parameters are extracted
through the curve fitting method (least square error [19]). It was found that for the cur-

Chapter 3. Battery Modeling 49
rent profile of interest, which is the urban drive-cycle mentioned in Chapter 2, sufficient
model accuracy is obtained with a third order model which considers R0 and three RC
circuit stages. The accuracy improvement from a third order model to a fifth order model
is only in the order of 1%. This is also apparent in Fig. 3.5(a) where the simulated battery
voltage in response to the urban drive-cycle profile (shown in Fig. 3.5(b)) are plotted for
up to fifth order battery models. Therefore, for the real-time application in the BMS
systems, a third order model is selected.
0 20 40 60 80 1003800
3850
3900
3950
4000
4050
4100
4150
4200
Time (s)
Vol
tage
(m
V)
Order 0Order 5Order 3Order 2
(a)
0 20 40 60 80 1000
5
10
15
20
25
Time (s)
Cur
rent
(A
)
(b)
Figure 3.5: Simulated (a) Vbt for different orders and (b) simulated Ibt.
The impedance of the third order model is as follows:
Z = R0 + (R1∥1
j2πfC1
) + (R2∥1
j2πfC2
) + (R3∥1
j2πfC3
). (3.2)
The resistive and capacitive values are calculated utilizing the least square error
curve fitting method [19] such that the above equation matches the measured battery
impedance shown in Fig. 3.4. The list of resistive and capacitive values at four different
temperatures are provided in Table. 3.1. As the impedance of the battery is measured at
four different temperatures (see Fig. 3.6), the resistive and capacitive values are extracted
at these temperatures. However, these parameters are extrapolated at lower and higher
temperatures that are beyond the range of the thermal chamber.

Chapter 3. Battery Modeling 50
5 10 15 20 25 30
−2
−1
0
1
2
3
4
5
6
Re [z] (mΩ)
−Im
[z] (
mΩ
)
Model at 15°CMeasured at 15°CModel at 10°CMeasured at 10°C
10°C
15°C
Figure 3.6: Simulated and experimental Nyquist curves for the cell impendence.
Table 3.1: Extracted Model Parameters
Parameter Temperature (c) Unit
5 10 15 20
R0 8.0 8.1 7.5 7.6 mΩ
R1 4.3 4.1 1.9 1.0 mΩ
R2 5.5 3.5 2.5 1.8 mΩ
R3 10.0 7.5 5.1 3.2 mΩ
c1 0.4 0.4 0.3 0.3 F
c2 4.3 4.1 4.1 4.0 F
c3 49.8 35.3 34.9 35.1 F

Chapter 3. Battery Modeling 51
3.3.4 Dynamic Update of Model Parameters
To dynamically update the model parameters a thermal battery model is required. The
thermal model predicts the cell temperature based on the its internal losses. The thermal
model can be expressed by ( 3.3),
mCpdTCell
dt=
3∑i=0
V 2i
Ri
− hConvSCell(TCell − TAmbient), (3.3)
where m is the battery mass (kg), Cp is the specific heat (J/kgK), Vi is the voltage
drop on Ri, hConv is the heat transfer coefficient (W/m2K) and SCell is the cell surface
area [20]. Having obtained the battery thermal model, the electrical model parameters
can now be dynamically updated as illustrated in Fig. 3.7.
TCell
dTcelldt
TAmbient
++
Thermal
ModelTCellBattery
Model
Vi
Ri
ViRi
Ibt
Figure 3.7: Block diagram showing the update process of the model parameters.

Chapter 3. Battery Modeling 52
3.4 Model Validation
To validate the proposed modeling approach, the battery discharge curve and the battery
behaviour under the urban drive-cycle are simulated and experimentally verified. The
cycler system discussed in Chapter 2 was utilized to perform the experimental tests.
The simulated and experimental results of the battery voltage with respect to DOD at
the discharge current of 2 C (20 A) at the room temperature (23C) is shown in Fig. 3.8.
The battery is discharged from the maximum voltage (4.2 V) to the cut-off voltage (3 V).
The battery temperature increased by 10 C, and the thermal model error is less than
3%.
The voltage response of the battery and the model to the urban drive-cycle at the
room temperature (23C)is shown in Fig. 3.9(a). The current profile of the battery is
also shown in Fig. 3.9(b).
The maximum error of the battery voltage is less than 3.5%. It should be noted that
maximum error of the experimental current is 4.7% and it is not considered in the error
calculation of the model.

Chapter 3. Battery Modeling 53
20 40 60 80 1003
3.2
3.4
3.6
3.8
4
4.2
DOD (%)
Vbt
(V
)
SimulationExperimental
(a)
20 40 60 80 10010
15
20
25
30
35
40
DOD (%)
Tce
ll (°C
)
ExperimentalSimulation
(b)
Figure 3.8: Simulated and experimental (a) Vbt and (b) TCell for constant discharge
current 2C (20 A).
0 100 200 3000
5
10
15
20
25
30
35
40
Time (s)
I bt (
A)
SimulationExperimental
(a)
0 100 200 3003.7
3.8
3.9
4
4.1
4.2
Vbt
(V
)
ExperimentalSimulation
(b)
Figure 3.9: Simulated and experimental (a) Ibt and (b) Vb for the urban drive-cycle.

Chapter 3. Battery Modeling 54
3.5 Chapter Summary and Conclusion
In this chapter, an electrical battery modelling approach is proposed, where the model
parameters are dynamically updated based on cell temperature and SOC variations. A
modelling example of a commercialized Li-Ion battery is presented. The model parame-
ters are extracted based on impedance and thermal measurements.
The accuracy of the model is verified by comparing the the simulation and experimen-
tal results under a constant and the urban drive-cycle current profiles. It is shown that
the battery temperature rises by 11C under 2 C discharge current at room temperature,
and as a result the internal impedance decreases. Therefore, the benefit of adding self
heating process to the model is further justified. Further improvement in the accuracy
of the model, by updating the model parameters based on the effect of degradation, is
considered for future work.

References
[1] M. Chen and G. Rincon-Mora, “Accurate electrical battery model capable of pre-
dicting runtime and i-v performance,” Energy Conversion, IEEE Transactions on,
pp. 504–511, 2006.
[2] O. Erdinc, B. Vural, and M. Uzunoglu, “A dynamic lithium-ion battery model con-
sidering the effects of temperature and capacity fading,” in Clean Electrical Power,
2009 International Conference on, pp. 383–386, 2009.
[3] L. Lam, P. Bauer, and E. Kelder, “A practical circuit-based model for li-ion bat-
tery cells in electric vehicle applications,” in Telecommunications Energy Conference
(INTELEC), 2011 IEEE 33rd International, pp. 1–9, 2011.
[4] J. Yan, C. Li, G. Xu, and Y. Xu, “A novel on-line self-learning state-of-charge
estimation of battery management system for hybrid electric vehicle,” in Intelligent
Vehicles Symposium, 2009 IEEE, pp. 1161–1166, 2009.
[5] A. Ostadi, M. Kazerani, and S.-K. Chen, “Optimal sizing of the energy storage sys-
tem (ess) in a battery-electric vehicle,” in Transportation Electrification Conference
and Expo (ITEC), 2013 IEEE, pp. 1–6, 2013.
[6] R. Balch, A. Burke, and A. Frank, “The affect of battery pack technology and size
choices on hybrid electric vehicle performance and fuel economy,” in Applications
and Advances, 2001. The Sixteenth Annual Battery Conference on, pp. 31–36, 2001.
55

REFERENCES 56
[7] L. Mandal and R. Cox, “A transient-based approach for estimating the electrical
parameters of a lithium-ion battery model,” in Energy Conversion Congress and
Exposition (ECCE), 2011 IEEE, pp. 2635–2640, 2011.
[8] R. Spotnitz, “Advanced ev and hev batteries,” in Vehicle Power and Propulsion,
2005 IEEE Conference, pp. 4 pp.–, 2005.
[9] C. Mi, B. Li, D. Buck, and N. Ota, “Advanced electro-thermal modeling of lithium-
ion battery system for hybrid electric vehicle applications,” in Vehicle Power and
Propulsion Conference, 2007. VPPC 2007. IEEE, pp. 107–111, 2007.
[10] P. M. Gomadam, J. W. Weidner, R. A. Dougal, and R. E. White, “Mathematical
modeling of lithium-ion and nickel battery systems,” Journal of Power Sources,
vol. 110, no. 2, pp. 267 – 284, 2002.
[11] L. Song and J. W. Evans, “Electrochemical-thermal model of lithium polymer bat-
teries,” Journal of The Electrochemical Society, vol. 147, no. 6, pp. 2086–2095, 2000.
[12] R. Rynkiewicz, “Discharge and charge modeling of lead acid batteries,” in Applied
Power Electronics Conference and Exposition, 1999. APEC ’99. Fourteenth Annual,
vol. 2, pp. 707–710, 1999.
[13] P. Pascoe and A. Anbuky, “Vrla battery discharge reserve time estimation,” Power
Electronics, IEEE Transactions on, vol. 19, no. 6, pp. 1515–1522, 2004.
[14] J. Shen, S. Dusmez, and A. Khaligh, “An advanced electro-thermal cycle-lifetime
estimation model for lifepo4 batteries,” in Transportation Electrification Conference
and Expo (ITEC), 2013 IEEE, pp. 1–6, 2013.
[15] W. Luo, C. Lv, L. Wang, and C. Liu, “Study on impedance model of li-ion battery,”
in Industrial Electronics and Applications (ICIEA), 2011 6th IEEE Conference on,
pp. 1943–1947, 2011.

REFERENCES 57
[16] A. Eddahech, O. Briat, R. Chaari, N. Bertrand, H. Henry, and J. M. Vinassa,
“Lithium-ion cell modeling from impedance spectroscopy for ev applications,” in
Energy Conversion Congress and Exposition (ECCE), 2011 IEEE, pp. 1449–1453,
2011.
[17] A. Baba and S. Adachi, “State of charge estimation of lithium-ion battery using
kalman filters,” in Control Applications (CCA), 2012 IEEE International Conference
on, pp. 409–414, 2012.
[18] A. Di Filippi, S. Stockar, S. Onori, M. Canova, and Y. Guezennec, “Model-based
life estimation of li-ion batteries in phevs using large scale vehicle simulations: An
introductory study,” in Vehicle Power and Propulsion Conference (VPPC), 2010
IEEE, pp. 1–6, 2010.
[19] lsqcurvefit, MathWorks. Accessed in September 2013, available at
http://www.mathworks.com/help/optim/ug/lsqcurvefit.html.
[20] L. Gao, S. Liu, and R. Dougal, “Dynamic lithium-ion battery model for system sim-
ulation,” Components and Packaging Technologies, IEEE Transactions on, vol. 25,
no. 3, pp. 495–505, 2002.

Chapter 4
Impact of Battery Impedance on EV
Performance
4.1 Introduction
In this Chapter, the impact of battery impedance on the EV performance is analysed. The
importance of active Battery Thermal Management Systems (BTMS) in EVs for range
extension and safety consideration is discussed. To demonstrate the impact of battery
impedance on EV performance, two Li-Ion batteries are modelled, and their performance
are analyzed based on sample drive-cycles of a commercialized electric motorcycle.
The performance of EVs is greatly dependant on the internal impedance of the battery
pack. The battery impedance affects the battery voltage based on the SOC and the
current being drawn. As discussed in Chapter 1, the inverter fails to continue operating
if the terminal voltage drops below the cut-off voltage threshold, hence, the internal
impedance can greatly affect the vehicle performance and range [1–4]. Therefore, a
battery with minimal internal impedance is desired to achieve better performance of the
vehicle.
The battery impedance is extremely sensitive of the operating temperature, which
58

Chapter 4. Impact of Battery Impedance on EV Performance 59
is monitored and controlled by the BTMS. Designing an effective BTMS for an EV is
critical as temperature directly affects both the battery lifetime as well as the vehicle
range [5–7]. It also affects the safety of EVs which is an important factor in the mass
adoption of this technology.
A BTMS consists of two parts, namely, a cooling and a heating system. At low
temperatures, the internal impedance of the battery pack is higher due to low activity
of chemical reactions and conductivity of electrolyte. This can cause the EV to start or
accelerate slowly as the current will be limited by the BMS. Therefore, pre-heating is
required to increase the battery temperature to moderate levels (above 5C) [7–9]. There
are several ways to heat the battery as listed below [4,9–12]:
1. Heating the internal core with alternative current (AC) or direct current (DC)
through battery terminals.
2. Heating internal parts of the battery modules by using air, liquid or resistive heating
systems.
3. Heating external parts of the battery modules by using air or liquid heating systems.
This method is not as efficient as the above listed methods.
At high temperatures (above 50C), the battery pack can suffer from thermal runaway, a
phenomenon where the chemical reactions lose control, resulting in a quick temperature
increase, generating heat which causes the self-destruction of the battery [13]. Hence, it
is imperative to keep the battery temperature within a moderate range by the thermal
management system [9, 13–15]. The deliverable power limit which directly defines the
vehicle range is illustrated in Fig. 4.7 as a function of temperature [5, 14].
The BTMS plays a significant role in maximizing the vehicle range and lifetime while
minimizing the cost through minimal energy usage. If Toronto is taken as a test city
where the minimum temperature can be as low as -30C on a winter night [16], two
scenarios are considered with the EV (200 kg - 9.3 kWh battery pack) parked outside

Chapter 4. Impact of Battery Impedance on EV Performance 60
Discharge
Power
Limits
Desired
Operating
Temperature
T
Sluggish
Electrochemistry and
Degradation
Safety
and
Degradation
15 C 35 C
Figure 4.1: Discharge power limit vs. temperature.
and not plugged into the grid. One is when the heater is left on during the night (6 hours)
to increase the battery lifetime by maintaining its temperature at moderate levels. If the
heater turns on for only two minutes every hour to heat the battery pack to 0C, it would
consume 9 kWh (assuming 100% energy to heat transfer efficiency). Hence, the battery
pack would then be almost depleted due to its use by the heater overnight. In the second
scenario, the heater is off during the night and the BTMS turns on the heater minutes
before the driver starts driving. This would heat up the battery quickly to the desired
starting temperature giving it significantly more range, but the battery lifetime would
be shortened due to the low battery temperature overnight. As described, a significant
trade-off between the first and second scenarios is observed. In the first scenario, the
battery lifetime is maximized but the range is severely minimized, whereas, in the second
scenario, the range is maximized but the battery lifetime is significantly minimized [3,14].
The BTMS has to find the right balance between achieving the maximum range
through either using the battery energy directly to drive the vehicle motor or using the
same energy to heat the battery to a higher temperature resulting in lower impedance.
In-depth modeling (which provides battery performance and thermal information) are
required for the BTMS to find the right balance. The focus of this chapter is to provide
an analysis which may be utilized by the BTMS to predict the performance of the vehicle
and the battery based on the behaviour of the battery impedance.

Chapter 4. Impact of Battery Impedance on EV Performance 61
4.2 Demonstration of the Impact of Battery Impedance
on EV Performance
To demonstrate the effects of battery internal impedance on the performance of EVs, two
Li-Ion batteries are modeled, and their performance are analyzed based on real drive-
cycles of a commercialized electric motorcycle. The Li-Ion batteries and sample drive-
cycles are provided by Brammo, Inc. and are based on an Empulse model motorcycle.
4.2.1 Simulation Setup
The simulation setup for this section consists of three main components, the electric
motorcycle, sample drive-cycles and Li-Ion battery cells provided by Brammo Inc. [17].
In 2010, Brammo announced the Empulse water-cooled electric motorcycles (Fig. 4.2)
offering a range of 160 km. A list of an Empulse motorcycle specification is provided
in Table. 4.1. The maximum speed and mass of the motorcycle is 169 km/h and 212
kg, respectively. The battery pack used in an Empulse model motorcycle is a series
combination of seven 14.8 V, 90 Ah BPM battery modules [17]. Each module consists of
series and parallel combinations of the 3.7 V, 10 Ah battery cells with the specification
provided in Chapter 2.
The urban and freeway drive-cycles discussed in Chapter 2 are based on drive-cycles
of an Empulse motorcycle, Fig. 4.3. The average and peak of the cell current are 1 C and
3.5 C for the sample urban drive-cycle. For the sample freeway drive-cycle, the average
and peak cell current are 2 C and 4 C, respectively.
Two Li-Ion batteries with the same chemistry and capacity but with different con-
struction types (type A and type B) are provided. The internal impedance of these bat-
teries are slightly different as they are constructed by different vendors. The impedance
Nyquist plot of the battery type A and type B are shown in Fig. 4.4(a) and Fig. 4.4(b),
respectively. As shown in Fig. 4.4, the internal resistance of the battery type A is higher

Chapter 4. Impact of Battery Impedance on EV Performance 62
Figure 4.2: Empulse motorcycle.
Table 4.1: Empulse Specifications [18]
Motorcycle Parameters Value Unit
Max. Motorcycle Speed, νmax 169 km/h
Motorcycle Mass 212.7 kg
Battery Pack Parameters Value Unit
Number of modules 7
Pack Capacity (nominal) 9.31 kWh
Pack Voltage, Vbt,nom 103.6 V
Cycle Life (20% Capacity degradation) 1500 Cycles
Drivetrain Parameters Value Unit
Motor Speed, ωmax 8500 rpm
Torque, Tmax 63 Nm
Power , Pmax 40 kW
than the battery type B at any temperature. To predict the performance of these cells,
they are modeled using the approach discussed in Chapter 3.

Chapter 4. Impact of Battery Impedance on EV Performance 63
0 50 100 150 200 250 3000
5
10
15
20
25
30
35
40C
urre
nt (
A)
Time (s)
(a)
0 20 40 60 80 100 1200
5
10
15
20
25
30
35
40
45
Cur
rent
(A
)
Time (s)
(b)
Figure 4.3: Representative cell current profile for (a) an urban and (b) a freeway drive-
cycles in the Empulse motorcycle.
5 10 15 20 25 30−2
−1
0
1
2
3
4
5
6
Re [z] (mΩ)
−Im
[z] (
mΩ
)
0.07 Hz
7000 Hz
20°C15°C10°C 5°C
(a)
5 10 15 20−2
−1
0
1
2
3
4
5
6
Re [z] (mΩ)
−Im
[z] (
mΩ
)
0.07 Hz
7000 Hz
20°C15°C10°C 5°C
(b)
Figure 4.4: Measured Nyquist curves of cell impedance for (a) type A and (b) type B
cells.

Chapter 4. Impact of Battery Impedance on EV Performance 64
4.2.2 Simulation Procedure and Scenarios
Since the electrical model for the two Li-Ion batteries and the real drive-cycles are avail-
able, the performance of the battery packs can be compared. The performance of the
battery packs is compared, based on the calculated cumulative energy that is delivered
until the minimum battery voltage (84 V) is reached. Note that beyond this limit the
performance the EV can no longer satisfy the load power and the acceleration would be
compromised in the application. Several simulation scenarios are set up to estimate the
net drive-cycle energy of the type A and type B battery packs.
The operation of each battery pack in the simulation is terminated if either Vbt drops
below the battery pack cut-off voltage (84 V), or if the calculated capacity (Ah) reaches
the nominal capacity (90 Ah). For the simulation scenarios, three assumptions are con-
sidered.
1. Each battery pack consists of identical battery cells with the same electrical, chem-
ical and thermal behaviour.
2. The battery cells used in each battery pack are assumed to be balanced, having the
same operating condition such as voltage, current and SOC.
3. The temperature of the battery pack is assumed to be the same as the battery cell
temperature. In addition, the battery cell temperature is assumed to be uniform
and the thermal effect of the cells on the neighboring cells is ignored.
The simulation scenarios are as follows:
1. Urban drive-cycle
The urban drive-cycle is extended to provide a one hour current profile with an
average current of 1 C (90 A). The performance of the battery packs under the
urban drive-cycle at ambient temperature of 0C (scenario 1) , 5C (scenario 2),
10C (scenario 3) and 30C (scenario 4) are simulated. The voltage and temperature
of the battery packs are shown in Fig. 4.5.

Chapter 4. Impact of Battery Impedance on EV Performance 65
2. Freeway drive-cycle
The freeway drive-cycle is extended to provide a 30 minute current profile with an
average current of 2C (180 A). The performance of the battery packs under the
freeway drive-cycle at ambient temperature of 0C (scenario 5) , 5C (scenario 6),
10C (scenario 7) and 30C (scenario 8) are simulated. The voltage and temperature
of the battery packs are shown in Fig. 4.6.

Chapter 4. Impact of Battery Impedance on EV Performance 66
0 10 20 30 40 50 6085
90
95
100
105
110
115
DOD (%)
Vbt
(V
)
Type AType B
0 10 20 30 40 50 600
2
4
6
8
DOD (%)
Tbt
(°C
)
Type AType B
(a)
0 20 40 60 80 10085
90
95
100
105
110
115
DOD (%)
Vbt
(V
)
Type AType B
0 20 40 60 80 1004
6
8
10
12
14
DOD (%)
Tbt
(°C
)
Type AType B
(b)
0 20 40 60 80 10085
90
95
100
105
110
115
DOD (%)
Vbt
(V
)
Type AType B
0 20 40 60 80 10010
12
14
16
18
DOD (%)
Tbt
(°C
)
Type AType B
(c)
0 20 40 60 80 10085
90
95
100
105
110
115
DOD (%)
Vbt
(V
)
Type AType B
0 20 40 60 80 10030
31
32
33
34
35
36
DOD (%)
Tbt
(°C
)
Type AType B
(d)
Figure 4.5: Simulated battery voltage and temperature under urban drive-cycle at am-
bient temperature of (a) 0C, (b) 5C, (c) 10C and (d) 30C.

Chapter 4. Impact of Battery Impedance on EV Performance 67
0 20 40 60 80 10085
90
95
100
105
110
115
DOD (%)
Vbt
(V
)
Type AType B
0 20 40 60 80 1000
5
10
15
20
DOD (%)
Tbt
(°C
)
Type AType B
(a)
0 20 40 60 80 10085
90
95
100
105
110
115
DOD (%)
Vbt
(V
)
Type AType B
0 20 40 60 80 1005
10
15
20
25
DOD (%)
Tbt
(°C
)
Type AType B
(b)
0 20 40 60 80 10085
90
95
100
105
110
115
DOD (%)
Vbt
(V
)
Type AType B
0 20 40 60 80 10010
15
20
25
DOD (%)
Tbt
(°C
)
Type AType B
(c)
0 20 40 60 80 10085
90
95
100
105
110
115
DOD (%)
Vbt
(V
)
Type AType B
0 20 40 60 80 10030
32
34
36
38
40
42
DOD (%)
Tbt
(°C
)
Type AType B
(d)
Figure 4.6: Simulated battery voltage and temperature under freeway drive-cycle at
ambient temperature of (a) 0C, (b) 5C, (c) 10C and (d) 30C.

Chapter 4. Impact of Battery Impedance on EV Performance 68
4.2.3 Simulation Results and Discussions
The delivered energy by the battery packs in the earlier mentioned scenarios are listed
in Table. 4.2. The comparison of the energy delivered by the battery packs at various
temperature illustrates the effects of ambient temperature on their performance. Higher
ambient temperature results in better performance and higher energy delivery. The lower
impedance cell (B) clearly delivers more energy then the higher impedance cell (A).
As the average current of the freeway drive-cycle is 2 times the average current of
urban drive-cycle, the temperature rise of the battery in scenario 8 is approximately 2
times the temperature rise in scenario 4, as shown in Fig. 4.5(d) and Fig. 4.6(d).
The effect of self heating is further apparent by comparing the the delivered energy of
battery type A in scenario 2 (3.89 kWh) and scenario 6 (7.271 kWh). In both scenarios,
the ambient temperature is 5C. However, the Tbt rises to 20C during the freeway drive-
cycle, which enables the battery to operate for a longer duration (see Fig. 4.5(b) and
Fig. 4.6(b)).
Based on the simulation results, it is challenging for the BTMS to find the balance
between using the battery energy directly to drive the vehicle motor or using the same
energy to heat the battery to a higher temperature resulting in lower impedance. For
example, if the vehicle with battery type B is on a highway and the ambient temperature
is 0C (scenario 5), the BTMS can turn on the pre-heating system to heat the battery
to 5C (scenario 6), enabling it to deliver 0.218 kWh more to the vehicle. However, the
heating system consumes 0.252 kWh to pre-heat the battery from 0C to 5C (assuming
100 percent energy to heat transfer efficiency). Therefore, pre-heating the battery is not
advantageous as it does not translate into increased range of the vehicle in this particular
case.
The envisioned future BTMS system with the on-line self learning ability to optimize
the vehicle lifetime and performance is shown in Fig.4.7. The optimization module sets
the desired battery pack temperature, and the thermal controller of the system manages

Chapter 4. Impact of Battery Impedance on EV Performance 69
the heater or cooler to regulate the battery temperature.
Table 4.2: Delivered Energy in Simulation Scenarios
Battery Ambient Temperature (C)
Type 0 5 10 30
Urban Drive Cycle
Delivered A 0.172 3.890 7.500 8.883
Energy(kWh) B 4.874 8.211 8.824 9.066
Freeway Drive Cycle
Delivered A 0.012 7.271 7.419 8.214
Energy (kWh) B 7.823 8.0411 8.637 8.955
Battery
Pack
Heater
Cooler
Thermal
Sensor
Battery
Model
BMS
BTMS
Ibt,maxIbt,min
Heater/Cooler
Model
Optimization
Module
Optimization
Module
Tbt,ref
Thermal
System
Controller
Battery
Parameters
Tbt
Figure 4.7: Control circuit for BTMS.

Chapter 4. Impact of Battery Impedance on EV Performance 70
4.3 Chapter Summary and Conclusion
In this Chapter, the impact of battery impedance on the performance of EVs is discussed.
Batteries with minimal internal impedance are desired for better vehicle performance.
The effects of temperature on the battery impedance and the vehicle performance are
also covered. At low temperatures, the battery has sluggish behaviour resulting in higher
battery impedance and lower vehicle range. However, at high temperatures, the battery
overheats which can shorten its lifetime. Therefore, the BTMS which controls and mon-
itors the battery temperature, plays an important role in range and lifetime extension.
To demonstrate the effect of battery impedance on the vehicle range, an analysis based
on a simulation setup is provided. The performance of two Li-Ion battery types under
sample urban and freeway drive-cycles at various ambient temperatures are evaluated.
Based on the simulation results, the battery with lower internal impedance can deliver
significantly more energy before reaching under-voltage.
When operating in cold climates, it is observed that the BTMS faces challenges to
strike the balance to achieve higher vehicle range by either using the battery energy
directly to drive the motor or using the same energy to heat the battery to a higher
temperature, resulting in higher range. Therefore, the detailed battery model provided
in this thesis can be utilized by the BTMS to find the optimum real-time operating
battery temperature for better vehicle performance.

References
[1] D. V. Do, C. Forgez, K. El-Kadri-Benkara, and G. Friedrich, “Impedance observer
for a li-ion battery using kalman filter,” Vehicular Technology, IEEE Transactions
on, vol. 58, no. 8, pp. 3930–3937, 2009.
[2] G. Liu, M. Ouyang, L. Lu, L. Xu, and J. Li, “Online monitoring of lithium-ion
battery aging effects by internal resistance estimation in electric vehicles,” in Control
Conference (CCC), 2012 31st Chinese, pp. 6851–6855, 2012.
[3] C. Mi, B. Li, D. Buck, and N. Ota, “Advanced electro-thermal modeling of lithium-
ion battery system for hybrid electric vehicle applications,” in Vehicle Power and
Propulsion Conference, 2007. VPPC 2007. IEEE, pp. 107–111, 2007.
[4] T. Mller, “Lithium ion battery automotive applications and requirements,” in Bat-
tery Conference on Applications and Advances, 2002. The Seventeenth Annual,
pp. 113–118, 2002.
[5] A. Pesaran, M. Keyser, G. Kim, S. Santhanagopalan, and k. Smith, “Tools for de-
signing thermal management of batteries in electric drive vehicles,” in Large Lithium
Ion Battery Technology and Application Symposia, Advanced Automative Battery
Conference, 2013.
[6] A. Pesaran and M. Keyser, “Thermal characteristics of selected ev and hev batter-
ies,” in Annual Battery Conference: Advances and Applications, 2001.
71

REFERENCES 72
[7] H.-S. Song, J.-B. Jeong, B.-H. Lee, D.-H. Shin, B.-H. Kim, T.-H. Kim, and H. Heo,
“Experimental study on the effects of pre-heating a battery in a low-temperature
environment,” in Vehicle Power and Propulsion Conference (VPPC), 2012 IEEE,
pp. 1198–1201, 2012.
[8] H.-S. Song, J.-B. Jeong, B.-H. Lee, D.-H. Shin, B.-H. Kim, T.-H. Kim, and H. Heo,
“Experimental study on the effects of pre-heating a battery in a low-temperature
environment,” in Vehicle Power and Propulsion Conference (VPPC), 2012 IEEE,
pp. 1198–1201, 2012.
[9] C. Alaoui, “Solid-state thermal management for lithium-ion ev batteries,” Vehicular
Technology, IEEE Transactions on, vol. 62, no. 1, pp. 98–107, 2013.
[10] A. Pesaran, A. Vlahinos, and T. Stuart, “Cooling and preheating of batteries in
hybrid electric vehicles,” in The 6th ASME-JSME Thermal Engineering Joint Con-
ference, 2003.
[11] “Nissan leaf.” Nissan, 2013 Nissan Leaf. Accessed in September 2013, available at
http://www.nissan.ca/ms/leaf20/en/index.html.
[12] “Tesla.” Tesla Motors, Tesla Module S. Accessed in September 2013, available at
http://www.teslamotors.com.
[13] C. Sen and N. Kar, “Battery pack modeling for the analysis of battery management
system of a hybrid electric vehicle,” in Vehicle Power and Propulsion Conference,
2009. VPPC ’09. IEEE, pp. 207–212, 2009.
[14] K. Qian, C. Zhou, Y. Yuan, and M. Allan, “Temperature effect on electric vehicle
battery cycle life in vehicle-to-grid applications,” in Electricity Distribution (CI-
CED), 2010 China International Conference on, pp. 1–6, 2010.

REFERENCES 73
[15] Y. Chen, L. Song, and J. Evans, “Modeling studies on battery thermal behaviour,
thermal runaway, thermal management, and energy efficiency,” in Energy Conver-
sion Engineering Conference, 1996. IECEC 96., Proceedings of the 31st Intersociety,
vol. 2, pp. 1465–1470 vol.2, 1996.
[16] “Toronto waether overview.” The Weather Network,
Statistics. Accessed in September 2013, available at
http://www.theweathernetwork.com/forecasts/statistics/cl6158350/caon0696.
[17] Brammo, Inc. Accessed in August 2013, available at
http://www.brammo.com/home/.
[18] “2013 empulse and empulse r owner’s manual.” Brammo, datasheet. Accessed in
August 2013, available at http://www.brammo.com/home/.

Chapter 5
Conclusion
5.1 Thesis Summary and Contribution
The focus of this work is on the design of a battery cell testing platform and Lithium-
Ion (Li-Ion) battery modeling for EVs. A novel regenerative and programmable cell
testing platform is developed as the suitable choice to test the automatize grade batteries
under real-world drive-cycle profiles. A novel battery modeling approach is proposed
to accurately predict the battery performance. The proposed model is intended to be
implemented in real-time BMS systems to further improve the vehicle performance. In
addition, the model is utilized to assess the long-term impact of battery impedance on
performance of EVs under real-world drive-cycles.
The novel contributions of this work include:
• Design of a novel cell cycler architecture to provide a fast, regenerative and pro-
grammable cell cycling platform utilizing inverters and LICs;
• Implementation of the proposed architecture by utilizing grid-tie inverter for power
delivery to the grid and LICs for high efficiency and system stability;
• Providing the cell cycler system with a modular design to provide expansion flexi-
74

Chapter 5. Conclusion 75
bility to the cycling platform;
• Design of a novel battery modeling approach to accurately predict the battery per-
formance by dynamically updating model parameters based on the battery tem-
perature and SOC; and
• Development of a simulation setup to quantify the impact of battery impedance on
performance of EVs under real-world drive-cycles.
The proposed 300 W - 5 V cell cycler is designed utilizing an interleaved two phase
buck and an interleaved two phase boost converters. Two- phase interleaved architecture
is used to achieve higher efficiency. The cycler system is implemented with the switching
frequency of 200 kHz which is capable tracking dynamic current of up to 8 A/ms.
Furthermore, in Chapter 3, a modelling example of a commercialized Li-Ion battery
is presented to demonstrate the proposed approach. The model parameters are extracted
based on impedance and thermal measurements while considering the self-heating of the
battery. The accuracy of the model is verified by comparisons of the simulation and
experimental results under a constant and the urban drive-cycle current profiles. It is
shown that the battery temperature rises by 11C under 2 C discharge current at room
temperature. Therefore, the benefit of including self heating process to the model is
justified.
In Chapter 4, a simulation setup with various scenarios is provided to quantitatively
demonstrate the impact of battery impedance on EV performance. Simulation evalua-
tion of the performance of two automatize grade Li-Ion batteries in various scenarios are
presented. The comparisons between battery performance in different simulation sce-
narios show the superior benefit of low battery impedance when the battery type B can
deliver 50 times more energy than battery type A under Urban drive-cycle in 0C. The
indirect effects of temperature on the vehicle performance is also observed by comparing
the performance of battery packs in various temperatures.

Chapter 5. Conclusion 76
5.2 Future Work
Based on the presented research work in this thesis, the following suggestions are provided
for further explorations:
• Using the multi-channel testing platform, the effect of ambient temperature, aver-
age current and current profiles on life time of Li-Ion batteries can be analyzed by
performing capacity measurements tests on the batteries after a certain number of
cycles.
• The battery model can be further improved by integrating the effect of degradation.
The model parameters can be measured overtime (at different number of cycles).
The model parameters can then be updated dynamically based on SOC, battery
temperature and degradation.
• The performance of the battery pack, discussed in Chapter 4, can be improved
by considering mismatches among the battery cells and the non-uniformity of the
temperature distribution in the cell, module and battery pack. However, this can
further complicate the calculations that should be done by the BTMS in real-time.