
Literature_Thesis_Report
51
A review of feed in finfish aquaculture Current and future prospects Christopher Michael White Student #: 10406689 August 31st 2013 University of Amsterdam Faculty of Science: Master Biological Sciences Track: Limnology and Oceanography Supervisor: Dr. Ir. J.M. de Goeij Examiner: Dr. H.G. van der Geest
-
Upload
christopher-white -
Category
Documents
-
view
26 -
download
2
Transcript of Literature_Thesis_Report

A review of feed in finfishaquaculture
Current and future prospects
Christopher Michael WhiteStudent #: 10406689
August 31st 2013
University of AmsterdamFaculty of Science: Master Biological Sciences
Track: Limnology and OceanographySupervisor: Dr. Ir. J.M. de GoeijExaminer: Dr. H.G. van der Geest


Contents
Abstract 1
1 Introduction to fish aquaculture and aquafeed 51.1 Growth in aquaculture and the finfish industry . . . . . . . . . . . . . 51.2 Overview of finfish farming systems . . . . . . . . . . . . . . . . . . . 61.3 Current use of fishmeal and fish oil within aquaculture . . . . . . . . 81.4 How can the industry grow with limited fishmeal and fish oil? . . . . 10
2 The real cost of fishmeal and fish oil 132.1 Feed conversion ratios . . . . . . . . . . . . . . . . . . . . . . . . . . 132.2 Fish in : fish out . . . . . . . . . . . . . . . . . . . . . . . . . . . . . 152.3 Direct consumption of pelagic fish . . . . . . . . . . . . . . . . . . . . 16
3 Alternative aquafeed considerations 173.1 Fish Physiology . . . . . . . . . . . . . . . . . . . . . . . . . . . . . . 17
4 Alternative aquafeeds available for finfish aquaculture 214.1 Non pelagic fish, marine aquafeeds . . . . . . . . . . . . . . . . . . . 21
4.1.1 Bycatch and trimmings . . . . . . . . . . . . . . . . . . . . . . 214.1.2 Krill . . . . . . . . . . . . . . . . . . . . . . . . . . . . . . . . 22
4.2 Terrestrial animals . . . . . . . . . . . . . . . . . . . . . . . . . . . . 234.2.1 Blood meal, meat and bone, and poultry byproduct . . . . . . 23
4.3 Terrestrial Crops . . . . . . . . . . . . . . . . . . . . . . . . . . . . . 244.3.1 Soy bean . . . . . . . . . . . . . . . . . . . . . . . . . . . . . . 264.3.2 Periphyton . . . . . . . . . . . . . . . . . . . . . . . . . . . . . 28
4.4 Innovative aquafeeds . . . . . . . . . . . . . . . . . . . . . . . . . . . 294.4.1 Single celled organisms (SCO) . . . . . . . . . . . . . . . . . . 294.4.2 Insects . . . . . . . . . . . . . . . . . . . . . . . . . . . . . . . 30
5 Efficiency through rearing and feeding methodology 335.1 Preventing aquafeed waste . . . . . . . . . . . . . . . . . . . . . . . . 335.2 Innovative feeding methods . . . . . . . . . . . . . . . . . . . . . . . 34
5.2.1 Polyculture . . . . . . . . . . . . . . . . . . . . . . . . . . . . 34
6 Discussion and Conclusion 37
Acknowledgments 41
i

Contents Contents
Bibliography 43
ii

Abstract
Industrial finfish aquaculture has historically been widely considered an inefficientway to grow fish that is neither sustainable nor ecologically friendly. Direct neg-ative effects of finfish aquaculture can include habitat destruction, waste disposal,exotic specie introductions, spreading of pathogens, and depletion of food stocksfor predator fish in the form of harvesting small pelagic fish for feed production.These factors present significant hurdles to overcome, yet feed presents the greatestopportunity for the industry to become more effecient. Here, I discuss the variousfeeds in use today including wild catch, bycatch, terrestrial animal rendered feed,terrestrial crops, periphyton, as well as future prospects including single celled or-ganisms and insects. By providing an overview of feed limitations, efficiency, andprospective uses, I hope to provide the reader with an overview of the current indus-try, the driving influences of a market driven economy, and the potential directionsthe industry will take in regards to feed.
1

Contents
Definitions
Aquaculture - The production of all farm raised aquatic based organisms used forfood consumption or secondary value products such as feeds, medicines, and oils.Aquafeed - Any feed product, marine based or terrestrial based that is fed to rearfish and other aquatic organisms within aquaculture. It may or may not includefishmeal or fish oil.Docosahexaenoic acid - A highly unsaturated fatty acid comprised of a 22 carbonchain.Eicosapentaenoic acid - A highly unsaturated fatty acid comprised of a 20 carbonchain.Extensive farming systems - No outside feed or nutrient input is used during theprocess of rearing fish within fish farms.Fish feed - Any feed product, marine based or terrestrial based that is fed to rearfish within aquaculture. It may or may not include fishmeal or fish oil.Fishmeal - Fish feed that is 100% in origin from wild catch fisheries and or bycatch.Fish in : Fish out - The ratio between weight of wet fish entering processing forfishmeal production and the weight of the farmed fish reared off the fishmeal.Fish oil - Fish oil that is 100% in origin from wild catch fisheries.Highly unsaturated fatty acid - comprised of 20 or more carbon atoms with morethan 4 unsaturated bonds.Intensive farming systems - A complete and external diet meeting all nutritionalneeds is provided during the process of rearing fish within fish farms.Linoleic acid - A unsaturated fatty acid comprised of a 18 carbon chain; a precursorto Docosahexaenoic and Eicosapentaenoic acid.Manufactured aquafeed - Industrially produced, often sourced from multiple rawfoods, fillers, minerals, and vitamins.Polyculture - Ecological diversification of aquaculture through the rearing of at leasttwo species within a farm that exhibit distinct ecological niches.Polyunsaturated fatty acid - comprised of a less than 20 carbon atoms with multipleunsaturated bonds.Semi-intensive farming systems - A supplementary diet containing either fertilizersor external fish feed, provided during the process of rearing fish within fish farms.Wet fish mass - The weight of fish when it is still whole before it enters into pro-cessing.
2

Contents
Abbreviations
DHA - Docosahexaenoic acidEFS - Extensive farming systemsEU - European UnionEPA - Eicosapentaenoic acidFAO - Food and Agricultural OrganizationFCR - Feed conversion ratiosFI:FO - Fish in : fish outHUFA - Highly unsaturated fatty acidIFFO - International Fishmeal and Fish Oil OrganizationIFS - Intensive farming systemsLA - linoleic acidMA - Manufactured aquafeedMBM - Meat and bone mealPBM - Poultry byproduct mealPUFA - Polyunsaturated fatty acidSCO - Single celled organismsSIFS - Semi-intensive farming systems
3


1 Introduction to fish aquacultureand aquafeed
1.1 Growth in aquaculture and the finfish industry
The aquaculture industry is growing at a rapid pace, becoming a significant contrib-utor to global seafood supply. In 2010, capture fisheries and aquaculture generated148 million tons of aquatic based organisms, valued at 217.5 billion US dollars ac-cording to the Food and Agricultural Organization of the United Nations (FAO),fisheries and aquaculture department [1]. The contribution of aquaculture to overallaquatic based food consumption has dramatically increased in recent decades, ex-periencing a 3.2% growth rate since 1961 and a 5% growth rate over the last decade[1, 45]. This has led to the aquaculture industry expanding by more than a factorof ten over the past three decades, now producing an annual 63.6 million tons ofaquatic organisms (excluding aquatic plants and non-edibles), representing roughly40% in volume to that taken in by capture fisheries (Fig. 1.1) [1].
Figure 1.1: FAO depiction of global catch of all aquatic organisms and aquacultureproduction [1]
More specifically, finfish aquaculture represents a significant portion of overall aqua-culture. The production of farmed finfish in 2010 was 39.2 million tons which ismore than half of all aquaculture production, again excluding aquatic plants andnon-edibles [1]. Since finfish aquaculture is rapidly becoming a significant portion of
5

Chapter 1 Introduction to fish aquaculture and aquafeed
global aquatic food supply, the feed that is required to sustain the industry will con-tinue to see an increase in demand. Therefore, it is important to focus on feed andinvestigate the origins, pitfalls, governance, and whether it is sustainably sourcedto see if the finfish aquaculture industry is able to continually grow. However, thefarmed finfish industry can be divided into three farming types based on differentfeed requirements and this needs to be taken into consideration when discussing theindustries prospects in regards to feed.
1.2 Overview of finfish farming systems
There are three broadly classified feeding categories that finfish aquaculture fallsunder. The first is an extensive farming system (EFS), in which no additionalfeed is provided to herbivorous, omnivorous, and detritivorous fish. The secondfishery type is semi-intensive farming system (SIFS). SIFSs like EFSs, are oftenfound on a local scale, such that they are often run by individuals or households,but differ as SIFSs typically use whatever is locally available as an additional feedsource. Direct inputs can range from local household food waste to manufacturedaquafeed. Other feed sources used such as manure, actually add nutrients to increaseprimary productivity, thereby indirectly increasing the food source for the farmedspecies [51, 17]. Lastly, intensive farming systems (IFS), are represented in largepart by consumer desired carnivorous fish such as salmon and trout in which allfeed requirements are provided from an external source.
Of the finfish sector, the majority of production is generated by EFSs and SIFSs thatraise fresh water carp within Asia. The top 10 producing countries for aquaculturerepresent over 80% of the market share both in volume and value, while Chinaalone represents 60% of global aquaculture production [1]. The production of freshwater farmed finfish stands at 33.9 million tons, or 86.5% of the finfish aquacultureindustry [1]. Marine farmed fish contribute to a much lesser extent at 3.4 milliontons, followed by brackish farmed fish at 1.9 million tons in 2010 [1]. 24.2 milliontons of fresh water carp were harvested in 2010, making it the largest contributorto the industry, representing 62% of all farmed finfish (Fig. 1.2) [1, 45].
6

1.2 Overview of finfish farming systems
Figure 1.2: FAO depiction of types of farmed finfish and relative amounts producedglobally; note the variable x-axis per figure. [1]
7

Chapter 1 Introduction to fish aquaculture and aquafeed
One can see that the industry is weighted heavily towards the production of freshwater herbivorous species. This could be considered a positive aspect of the fin-fish aquaculture industry as these fish require less feed than carnivorous fish suchas salmon and trout. However, this trend is changing as farmers try to increaseyields. Despite the fact that 50% of all carp production was non-fed in 1980, thenumber has fallen to 33.3% in 2010, as farmers attempt to increase yields by theimplementation of additional feeding practices [1]. While SIFSs are thought to yieldapproximately 0.5 − 20t/ha/yr of fish, IFSs which are completely dependent onmanufactured aquafeed (MA), are able to operate at a much larger scale, resultingin farms producing 1000t/ha/yr of fish [51, 17]. Despite the fact IFSs often requireextensive setup and costly feed input, it is easy to see how operators of EFSs andSIFSs are moving towards using more complicated feed sources with the prospectsof increase yields. As it stands, most fish feed is destined for IFSs and to a lesserextent SIFSs, although there is a shifting trend towards intensification and the useof manufactured aquafeed within SIFS [51, 17]. As this intensification occurs, it isimportant to investigate if fishmeal and fish oil production can keep up with thisgrowing demand from the farmed finfish industry.
1.3 Current use of fishmeal and fish oil withinaquaculture
In recent years, the increasing size of the finfish aquaculture industry has resultedin fishmeal and fish oil to become more scarce and more expensive as pelagic wildcaught fish processed into fishmeal and fish oil become fully exploited and in somecases over exploited. The FAO defined the state of world fisheries in 2012 as follows,
“The declining global catch over the last few years together with the increasedpercentage of over exploited fish stocks and the decreased proportion of non-fullyexploited species around the world convey a strong message; the state of world
marine fisheries is worsening and has had a negative impact on fishery production[1].”
The FAO estimated as of 2009, that the majority of the 10 top fisheries repre-senting 30% of capture fish stocks were either fully exploited or over exploited[1]. They listed the following fisheries as fully exploited; the two main stocks ofanchoveta* (Engraulis ringens) in the Southeast Pacific, Alaska pollock (Thera-gra chalcogramma), Atlantic blue whiting (Micromesistius poutassou), Atlantic her-ring* (Clupea harengus), and the Chub mackerel* (Scomber japonicus) stocks inthe Eastern Pacific and the Northwest Pacific [1]. Additionally, the FAO has listedthe Japanese anchovy* (Engraulis japonicus) and the largehead hairtail (Trichiu-rus lepturus) in the Northwest Pacific, as well as Chilean jack mackerel* (Trachurusmurphyi) in the Southeast Pacific as over exploited [1]. Many of these stocks happen
8

1.3 Current use of fishmeal and fish oil within aquaculture
to be pelagic foraging fish, and those designated with an (*) represent the very samefish targeted for capture and processing into fishmeal and fish oil [40]. The worldcatch and aquaculture usage can be seen in Fig. 1.3. The amount of sea food (ex-cluding aquatic plants) not directly consumed by people and destined for non-foodpurpose in 2010 was over 20 million tons, 15 of which went towards the productionof fishmeal and fish oil [1].
Figure 1.3: FAO depiction of world fisheries utilization in 2010 [1]
These exploitations of small pelagic fish has recently led to reductions in their avail-able catch and thus limited the production of fishmeal and fish oil. This can beobserved by the correlation between catch, production of fishmeal and fish oil, andthe rising cost of these commodities. Wild anchoveta caught off the coast of Chileand Peru reflects the strongest correlation as this fishery accounts for 40% of thetotal production of fishmeal and fish oil [41]. 12.5 million tons of anchoveta werecaught in 1994 and since then, there has been a drastic reduction in yearly catch to4.2 million tons in 2010 [1]. These reductions have largely been attributed to closureson fisheries by the Peruvian government. During the same time frame, historicalfishmeal production peaked in 1994 at 30.2 million tons (live weight equivalent),followed by reductions to 15.0 million tons in 2010 [1]. Due to the limitations ofharvesting the Peruvian anchoveta, the cost of fishmeal and fish oil have both risendramatically over recent decades. For fishmeal bought in the Netherlands and Ger-many, the cost has risen from $300 per ton in 1985 to $1,300 per ton at the beginningof 2012, while similar price hikes of $300 per ton, increased to $1,600 per ton for fishoil [1]. This is a serious concern for fish farmers as it is estimated that feed makesup 75% of all costs [45].
9

Chapter 1 Introduction to fish aquaculture and aquafeed
1.4 How can the industry grow with limited fishmealand fish oil?
If the world is to maintain current levels of per capita fish consumption, we willhave to produce an additional 23 million tons of aquatic animal food by 2030 [1].With the limited ability for the wild catch sector to increase as most wild stocksare fully exploited and in the the case of the Peruvian anchoveta, either decreasingor stabilizing to a constant level, it is clear other sources of feed will play a pivotalrole in the future of aquafeed to maintain growth. Contrary to mainstream beliefs,the incorporation of other feed sources with fishmeal and fish oil is already wellunder way and widespread throughout the farmed finfish aquaculture industry. Areview of the 2006 global aquaculture statistics by Tacon and Metian 2008, showedthat of the 25.36 million tons of aquafeed used, 20.81 million tons or 82% originatedfrom non fishmeal or fish oil sources [53]. These sources include terrestrial animalrendered meal from animal farming byproducts and comes in the form of meat andbone meal (MBM), blood meal, poultry byproduct meal (PBM), and feather meal.In addition, there are various crop based meals originating from soy beans, wheat,and corn amongst others. Oils in use to supplement fish oil originate from sunflower,linseed, canola, rapeseed, olive, and palm to name a few [41]. These new sources offeed are already having an impact as the inclusion level by percentage of fishmealand fish oil within aquafeed are on the decline for all farm raised fish (Tab. 1.1).
Table 1.1: FAO predictions for reduction of fishmeal inclusion within aquafeed overtime. [52, 1]
The limitations of fishmeal and fish oil as well as their drastic increases in prices,coupled with the growing global aquaculture industry has caused the drastic shift
10

1.4 How can the industry grow with limited fishmeal and fish oil?
towards new fish feed types, mixes, and solutions to this pressing problem. Thisraises a few questions. How do these new feed sources compare to traditional fish-meal and fish oil? What are the ecological risks and benefits and most importantly,will the industry be able to sustainably source these new feed types? The answersto these questions are vital if the finfish aquaculture industry is to maintain its pro-jected growth. It is my intention to outline the major aquafeed sources currently inuse followed by potential feeds not yet used. In regards to each feed type, I intendto summarize their scale, benefits and pitfalls, governance, and future prospectswithin the finfish aquaculture industry. My hope is that this provides insight intothe potential directions of feed use within finfish aquaculture, thereby giving differ-ent stakeholders the opportunity to steer the industry towards more efficient andsustainable practices. When considering the use of alternative feeds, it is first im-portant to understand the process of energy conversion from wild fish into fishmealand fish oil so that the merits of this feed type can be properly compared to otheraquafeed discussed later on.
11

2 The real cost of fishmeal and fishoil
There are a number of tools used by the scientific community for measuring energyconversion and efficiency of finfish aquaculture. These tools, chiefly feed conversionrates (FCRs) and fish in: fish out (FI:FO) ratios, are becoming less applicableas alternative aquafeeds are incorporated with fishmeal and fish oil. Additionally,when the conversions are broken down, one can see that the use of pelagic fish asfeeds are still highly inefficient. Other energy requirements that are not taken intoconsideration include fuels required to run fishing vessels out to catch the pelagic fish,operation of the fishmeal factories, and the transport needed to move the fish feedto the fish farm. Considering that developing countries make up 35% of fishmealand fish oil exports by quantity, and Europe conversely imports 45.9% of thesecommodities, the amount of energy used in these processes should not be ignoredwhen compared to other feed types [1, 54].
2.1 Feed conversion ratios
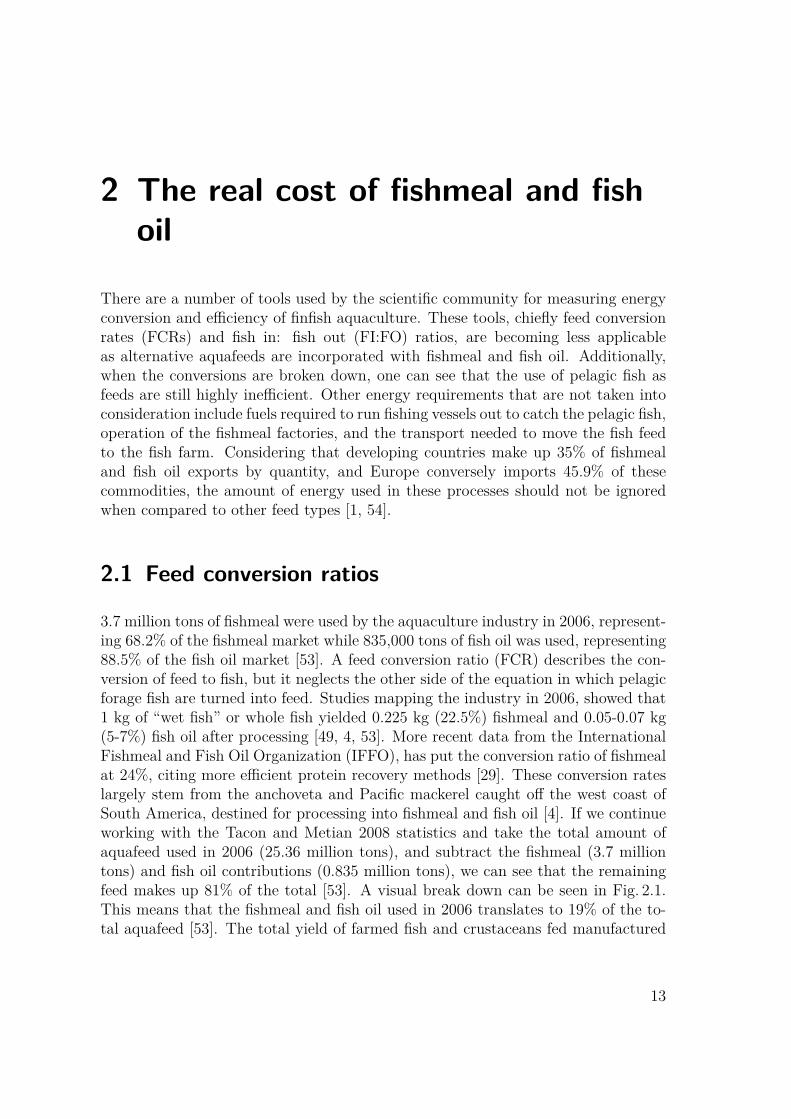
3.7 million tons of fishmeal were used by the aquaculture industry in 2006, represent-ing 68.2% of the fishmeal market while 835,000 tons of fish oil was used, representing88.5% of the fish oil market [53]. A feed conversion ratio (FCR) describes the con-version of feed to fish, but it neglects the other side of the equation in which pelagicforage fish are turned into feed. Studies mapping the industry in 2006, showed that1 kg of “wet fish” or whole fish yielded 0.225 kg (22.5%) fishmeal and 0.05-0.07 kg(5-7%) fish oil after processing [49, 4, 53]. More recent data from the InternationalFishmeal and Fish Oil Organization (IFFO), has put the conversion ratio of fishmealat 24%, citing more efficient protein recovery methods [29]. These conversion rateslargely stem from the anchoveta and Pacific mackerel caught off the west coast ofSouth America, destined for processing into fishmeal and fish oil [4]. If we continueworking with the Tacon and Metian 2008 statistics and take the total amount ofaquafeed used in 2006 (25.36 million tons), and subtract the fishmeal (3.7 milliontons) and fish oil contributions (0.835 million tons), we can see that the remainingfeed makes up 81% of the total [53]. A visual break down can be seen in Fig. 2.1.This means that the fishmeal and fish oil used in 2006 translates to 19% of the to-tal aquafeed [53]. The total yield of farmed fish and crustaceans fed manufactured
13
Chapter 2 The real cost of fishmeal and fish oil
aquafeed in 2006 was 15.07 million tons [53] Taking the manufactured aquafeed andfish yield for 2006, we can calculate an average FCR of 1.68 for fish and crustaceans.
Figure 2.1: Visual representation of 2006 aquaculture input and output. Adaptedfrom Tacon and Metian 2008, Shepard 2005, and Anon 2006. [53, 49, 4]
It should be noted that in the Tacon and Metian 2008 paper, there is no mention ofwhat an additional 8.78 million tons farmed fish and crustaceans are fed, althoughi assume aquafeed produced on a local scale with local farming practices. It doeshowever highlight the difficulties of mapping an entire input and output for any givenyear and therefore could contribute a source of error. Within the same year, therewas also 9.42 million tons fish raised from EFSs and 4.14 million tons of miscellaneousmarine crustaceans and minor cultivated species. This is important to mention assignificant yields are obtained without manufactured aquafeed shows the diversityof aquaculture around the world. One will also note I have calculated the pelagicfish not destined for compound aquafeed but harvested for use as terrestrial animalfeed and fish oil products. This FCR of 1.68, calculated from the 2006 data agreeswith the average FCR for all major species using compound aquafeed in 2006, mostranging between 1 and 2.5 [53, 18]. However, the flaw of FCRs are evident fromFigure 2.1 as they do not take into account the conversion of 16.6 mt pelagic fish usedto create a fraction of the manufactured aquafeed. Furthermore, it is impossible todeduce an overall energy conversion of manufactured aquafeed as the input requiredto make 20.81 million tons of terrestrial sourced aquafeed is diverse and difficult toquantify.
14

2.2 Fish in : fish out
This said, the average FCR for the top 10 farmed fish in 2000, which stood at 1.9 hascome down and is estimated to continue to fall in the coming years (Tab. 2.1) [40].This can be attributed in part to farming systems becoming more efficient withtheir feeding methods, continual development of feeds, and improved fish rearingmethodologies. Thus, FCRs may act as a standard to measure feed improvementsbut fail to convey overall efficiency of inputs and outputs. What one can take outof this is that there still exists a significant energy gap between input and outputfor fish raised on manufactured aquafeed.
Table 2.1: FCRs of major farmed species set to fall. Adapted from Tacon andMetian 2008, FAO 2008. [53, 18]
Fish type 2006 2015 2020Salmon 1-1.6 - 1.3Trout 0.7-2 - 1.3Tilapia 1.3-2.6 - 1.5
Chinese carp (non-filter feeders) 1.3-2.5 - 1.5Catfish 0.9-2.9 - 1.3Milkfish 2.0 1.7 -
2.2 Fish in : fish out
If one looks at the other big measurement tool used to measure efficiency withinthe industry, equally large flaws are observed. Although the methodology for fish in: fish out (FI:FO) ratios is debated in the literature, Jackson 2009, seems to haveimproved the concept by creating a more accurate FI:FO ratio through the use ofthe following equation [53, 29].FIFO Ratio = ((Level of fishmeal in the diet + level of fish oil in the diet) / (yieldof fishmeal from wild fish + yield of fish oil from wild fish)) * FCRUsing salmon as an example, Jackson 2009 calculated the FI:FO as follows. FIFOratio = ((30% + 20%) / (22.5% + 5%)) * 1.25 = 2.27:1 [29]This again provides insight as it allows us to calculate the kgs of pelagic fish requiredto produce a kg of salmon, but in an industry that is radically moving away fromusing fishmeal and fish oil as an input, it fails to address the impact of the otherfeed input. So if we look as this salmon example presented by Jackson 2009, only50% of the input is considered while leaving out the cost of the other half of nonfish sourced diet, or aquafeed. A FI:FO ratio therefore gives a better idea of the fishconversion cost, but it too fails as a true measurement standard when consideringfish raised on manufactured aquafeed as it does not take into account the 81% ofnon fishmeal and fish oil included in aquafeed for 2006. Additionally, a FCR ratiois used within the FI:FO equation which was shown previously to fall victim to the
15
Chapter 2 The real cost of fishmeal and fish oil
realized feed conversion cost, thereby compounding the error. We therefore need tobe vigilant of the inherent flaws when considering FI:FO ratios and FCRs.
2.3 Direct consumption of pelagic fish
One final consideration in regards to the production of fishmeal and fish oil foraquafeed is the other uses of pelagic forage fish that may provide a valid argu-ment for a more valuable end product. The direct consumption of pelagic fish ismore energetically efficient than eating fish raised on fishmeal and fish oil and isincreasingly competing for the pelagic fish market. Methods are being improved toallow the harvesting and use of small pelagic fish within a variety of food products.Pelagic forage fish are now incorporated within more than 19 food products includ-ing powders, fish nuggets, noodles, canned marinates, dried products and proteinconcentrates amongst others [54]. Although only 0.73% of the Peruvian anchovy wasdestined for human consumption in 2006, it is more than double what was consumedby people in 2002 [54]. This exemplifies another pressure on the market for smallpelagic fish as demand for direct consumption increases. This in conjunction withthe inefficiencies of fishmeal and fish oil provide the strong case that other aquafeedsources should be used to feed fish when possible. This however depends on theirown ecological footprint and feasibility to act as aquafeed.
16
3 Alternative aquafeedconsiderations
Replacement feeds need to meet certain criteria before they can be used as fish feedin finfish aquaculture. A feed needs to be palatable and digestible by fish, promotegrowth, and the health of the fish. It needs to be readily available and ship easily aswell as handle temporary storage. It has to have consumer acceptance and promotehuman health as fish oil and fishmeal do. Finally, it has to contribute minimallyto the environmental footprint when regarding the feed production itself as wellas the resulting effluent [41, 24]. These conditions need to be met if the aquacul-ture industry is to have any chance of locating long lasting alternative aquafeeds toreplace fishmeal and fish oil. From these challenges in particular are dietary require-ments of fish that aquafeeds have to meet. The following section briefly discussesthis challenge to provide the reader with a foundation of dietary requirements whenconsidering alternative aquafeeds.
3.1 Fish Physiology
As manufactured aquafeed increasingly becomes a synthesis of multipleingredients, the dietary components become increasingly important to understand.Fish diets are based on two major components; proteins representing roughly18-50% of the diet and lipids at roughly 10-25% of diets. Some species like talapiamay require 40-60% protein in their diets while some salmon require over 65%protein in their diets [47]. This is the reason why fish have been found to be afundamental source of dietary protein with an estimated 1.25 billion people usingfish for 25% or more of their daily protein intake world wide [54]. An overview ofthe protein content that various types of feed provide, can be seen in Tab. 3.1.More specifically, of the 20 amino acids that represent the building blocks forprotein, most fish species are unable to synthesize 10 of them and therefore requirean external source [48]. The amino acids Lysine and Methionine are typically thefirst amino acids to become limited within fish diets and are often supplemented infish feed, such as seen with most soy bean derived feed [45, 48].
17

Chapter 3 Alternative aquafeed considerations
Table 3.1: Overview of various fish feeds and relative protein content
Feed Source % Proteincontent
Reference
fishmeal/oil 65-70% [47, 27]Blood meal 90% [47]
Poultry bi-product meal 60% [27]Meat and bone meal 51-65% [47, 27]
Feather meal 83-88% [47, 27]Maize gluten 60% [27]Soy meal 44-48% [47, 27]
Soy concentrate 65-76% [47, 27]Canola meal 38% [47, 27]Wheat gluten 70-80% [27]
Rapeseed concentrate 61% [27]Periphyton meal - -
Lenseed - [47]Hemp seed >50% [37]
Algae single cell meal - -Insect meal 45-60% [16, 20]
In addition to protein, most carnivorous fish that represent the major consumptionof aquafeed in IFSs require an external source of highly unsaturated fatty acids(HUFA). HUFAs are associated with dietary health in humans and can be describedstructurally to have more than 4 double carbon bonds within a 20+ carbon chain [30,48]. Also referred to as n-3 or Omega-3 fatty acids, HUFAs include eicosapentaenoicacid (EPA), comprised of a 20 carbon chain backbone and docosahexaenoic acid(DHA) comprised of a 22 carbon chain [47]. Both of these essential fatty acidsare derived from linoleic acid (LA), an 18 carbon chain precursor polyunsaturatedfatty acid (PUFA), also referred to as n-6 or Omega-6 fatty acid. While most freshwater fish can elongate carbon chains and synthesize HUFAs, marine carnivorousfish need to consume EPA and DHA [48]. This is the fundamental reason whycarnivorous marine species require more fishmeal and or fish oil in their diets incomparison to fresh water species. It also highlights the challenge in locating theproper replacement feed that has the appropriate protein and fatty acid profile.
In addition to meeting the above requirements, it is known that there is a highvariability between common ingredients used in fish feed depending on locationsand methods for producing aquafeed [24]. Glencross, Booth, and Allan 2007, discussvariable content findings from a dozen different sources of lupin meal and proteinconcentrates and argues for better quality standards in fish feed and oil production
18

3.1 Fish Physiology
from manufacturers [24]. The following chapter discusses alternative aquafeeds ona case by case basis followed by general methodologies that can be considered tofurther increase efficiencies when using aquafeed.
19


4 Alternative aquafeeds available forfinfish aquaculture
4.1 Non pelagic fish, marine aquafeeds
4.1.1 Bycatch and trimmings
The FAO estimate that 6 million tons of trimmings from bycatch and harvestedaquatic organisms with the exception of algae is used in the production of fishmealand fish oil, making up 25% of fishmeal production in 2008 [1]. Tacon 1999, esti-mated that 2 million tons of wild caught fish scraps were used in the production offishmeal and oil [50, 40]. Thus, the estimates for fish sourced bycatch inclusion inaquafeed are between 2-6 million tons. If this is to become a tangible replacementsource of fishmeal and fish oil, processing facilities need to be in place in the areaswhere bycatch occurs in significant volumes to make it economically feasible. It isthought that the only places where bycatch and trimmings occur on a sizable scalefor processing is at West Dutch harbor and Kodiak harbor in Alaska [41].
4.1.1.1 Problems and pitfalls: Limited feed quality
Bycatch and processed trimmings often have a high bone content leading to ashcontents as high as 25% [27]. Fishmeal on the other hand has a ash content of roughly14%, so the technique of deboning needs to be applied to bycatch and trimmings,bringing the ash content down to as low as 7% [27]. This however means that lessthan the entirety of bycatch and trimmings can be used and that bycatch has to gothrough specialized processing. The problem of high ash content is also associatedwith meat and bone meal (MBM) another alternative feed source mentioned later.There are additionally two risks that need to be taken into account when consideringthe use of bycatch and trimmings in fishmeal and oil production. The first is thatbycatch and trimmings are often low in protein but high in calcium, phosphorus,and pollutants. This can lead to zinc deficiencies as well as bio accumulation of toxiccompounds such as Polychlorinated biphenyls (PCBs) and dioxins [41]. Secondly, ifwe create incentives for bycatch, it lies directly counter to efforts of limiting bycatchwithin the wild catch fishing industry.
21

Chapter 4 Alternative aquafeeds available for finfish aquaculture
4.1.1.2 Governance, solutions and future prospects: Importance ofmonitoring
The use of bycatch in fishmeal and oil production is an appropriate waste pathwayfor the waste stream of major and highly regulated fisheries, but should be closelymanaged to prevent improper incentives to encourage increased hauls of bycatch.The use of marine observers, remote monitoring devices attached to rear harvestingareas of vessels, and strong governmental policies have allowed for better oversight inboth the United States and Canada. The use of bycatch therefore has the potentialto be responsibly integrated into fisheries within these areas. These monitoring sys-tems still need to be encouraged in developing fisheries where monitoring is limited ifbycatch is to be responsibly used as an aquafeed source on a global scale. However,the current amount of usable bycatch and efforts to reduce it in the future, mean itwill be limited in its overall ability to act as a significant source of aquafeed.
4.1.2 Krill
Another marine based feed and oil source being explored is krill. 118,124 tons ofAntarctic krill (Euphausia superba) destined for feed were landed in 2007 within theSouthern Ocean [1, 41]. This has since increased to just under 200,000 tons in 2011,but remains under historic highs of close to 400,000 tons throughout the 1980’s andearly 90’s. Studies conducted on krill as an aquafeed supplement found that 20-60%protein inclusion rates led to increased salmon growth when compared to controlsbased on fishmeal diets [43]. The researchers attributed these findings to krill actingas a feed attractant. Additionally, the amino acid and fatty acid profiles of the fishwere unchanged on a diet supplemented by krill [43]. Considering fish feed, wild fishand krill represent the most natural fish diets with favorable amino acid and fattyacid profiles but are questionable in their efficiency and overall sustainability.
4.1.2.1 Problems, governance, and future prospects: Fishing down the foodchain
There are major hurdles to overcome regarding krill harvesting including the highdistribution variability, distance to harvest, perishability, and potential serious ecosys-tem impacts from harvesting from the base of the food web [41]. More importantly,the krill feed industry as it stands has limited room to grow further. The commissionfor the conservation of Antarctic marine living resources has set the catch limit in2013 at 620,000 tons [2]. As there is little known of the current scale of dependancethat the Southern Ocean marine food web has on krill, I would argue the precau-tionary approach in which krill harvest levels are maintained at a minimal level untiladditional research on the implications of increasing harvests can be obtained.
22
4.2 Terrestrial animals
4.2 Terrestrial animals
4.2.1 Blood meal, meat and bone, and poultry byproduct
The FAO estimated that the world produced 13 million tons of animal protein and10.2 million tons of animal fat from meat and bone meal (MBM), blood meal, andpoultry by-product meal (PBM) in 2008 [1]. In addition to these 3 types of mealsthere also exists feather meal, however MBM and PBM is thought to make up 80%of all animal rendered feeds [27]. The United States alone produced 2.8 million tonsof animal rendered meal and a further 900,000 tons of PBM in 2000 [27]. Althoughminimal, 5% of US production went to the pet food industry emphasizing alternativefeed pathways that the aquaculture industry has to compete with [27]. Terrestrialanimal rendered proteins are thought to have a more complete amino acid profilethan vegetable proteins and can be digestible by fish up to 80-90% [41]. The price hasalso become more affordable as an alternative feed source with prices at $0.79/kg foranimal byproduct rendered meal versus $1.13/kg of anchovy fishmeal in 2009 [41].In regards to using the entirety of an animal raised for consumption, the aquacultureindustry presents a solid solution for the use of the animal excess that would haveotherwise been thrown away. It may therefore be argued that this feed source couldbe more sustainable because it originates from a waste stream rather than grownwith the single purpose of feed for aquaculture. Conversely, terrestrial animal rearingis itself associated with a host of problems including excessive land degradation,high feed requirements, and greenhouse gas production. Providing further economicencouragement to this sector for its waste stream needs to therefore be taken intoaccount.Some studies have recommended a fish replacement diet of less than 30% MBMwhile others have been able to replace fishmeal with up to 75% PBM or MBMbefore seeing negative effects [25, 9]. In relation to each other, PBM in one studywas found to have a FCR of 2.31 when it replaced 75% of the protein within thediet of catfish, while MBM had a FCR of 3.14 when it replaced 75% of the dietaryprotein [25]. This is most likely due to the fact that MBM has a higher ash content[25]. In regards to rearing cobia, it was found that up to 50% of MBM or PBM couldbe used without a negative effect, while 15% replacement yielded optimal growth[57]. This shows us that animal rendered meals may be less effective than fishmealand fish oil diets and lead to higher FCRs when used as the main source of protein.However, at low inclusion levels, animal rendered meal promotes growth with nonegative effects and can therefore play an important role in supplementing aquafeeddiets within the finfish aquaculture sector.
4.2.1.1 Problems and pitfalls: Variable replacement trials
We need to be critical of replacement aquafeed studies as most that measure the useof animal rendered feed in the diets of fish, or crop derived feeds for that matter, also
23
Chapter 4 Alternative aquafeeds available for finfish aquaculture
include a host of other feed products. This is why “dietary protein” replacement wasspecifically mentioned above rather than feed. Often studies will supplement eitherfishmeal or fish oil with a new feed type, but not both as the other is maintainedwithin the test. Thus, by fully replacing fishmeal but still using significant fishoil for all test subjects, scientists need to be cautious of saying they can rear fishwith a 100% fishmeal or fish oil replacement diet as it can be misleading. Thisproblem is further complicated by the additional incorporation of a host of otherfood supplements including vitamins, minerals, crop derived proteins and fillers.These additions are not minimal in their contribution as they often make up 50-75%in weight of the test feeds [25, 57, 6]. This makes it extremely difficult to comparestudies when each experiment represents a fundamentally unique feed mix, especiallywhen as mentioned in chapter 3, the components themselves have been found to bevariable in content [24]. Attempts should be made by the scientific community towork off dietary templates so that stepwise improvements can be made towards theelimination of fishmeal and oil from aquafeed diets.
4.2.1.2 Governance and future prospects: Revisiting legislation
Many countries around the world already use animal rendered feed within theiraquaculture industry. Europe however, was an exception until the EU commissionlifted a ban that restricted the use of terrestrial animal rendered products as feedfor aquaculture at the beginning of this year, 2013. This allows the use of renderedanimal protein and fat as a viable source for aquafeed within the European Unionas of the 1st of June, 2013 [14]. One can therefore expect to see growth in thissector over the coming years. Despite this international development, local Euro-pean governance is also influencing the aquaculture industry and does not alwaysagree with European Union law. The UK for example, exhibits one of the highestinclusion rates of fishmeal (36%) and fish oil (28%) in its aquafeed industry [53].This is largely attributed to the strict standards that have been imposed by theUK National Salmon Farming Association as well as retailers to ensure proper nu-tritional qualities of healthy amino acids are maintained in fish for consumers [53].If animal rendered meal as well as other replacement feeds are to play a role inthe conversion of the industry, it is vital that governmental agencies on all levelscommunicate the merits and drawbacks of alternative feed sources so that they mayagree on common legislation, allowing the industry to move forward. This said, theproduction volume of animal rendered feed and lifting of bans mean they will likelycontinue to contribute a significant portion to overall aquafeed in the coming years.
4.3 Terrestrial Crops
Soy bean, corn, rapeseed, sunflower seed, flaxseed, wheat, hemp seed, and glutenhave all been used at varying degrees as a aquafeed source for finfish aquaculture [45].
24

4.3 Terrestrial Crops
Others include canola, barley, cottonseed, and lupin [41]. One of the biggest issues inusing terrestrial plant based feed is creating feed that is low in fiber and starch, highin protein content, has a desired amino acid profile, palatable for fish consumption,and easily digestible [41]. One concern regarding vegetarian sources of protein is thedifficulty to break down phytic acid, which acts as a storage molecule of phosphorusin seeds. The enzyme Phytase that most fish lack, helps to break down phytic acidand is only naturally occurring in grazing fish [45, 12]. Other important enzymesinclude endo-xylanase, responsible for the break down of fiber and carbohydratesand protease for animal rendered feed which hydrolyzes connective tissues and skin[27]. These enzymes often have to be incorporated with these aquafeeds, particularlythose of terrestrial crop origin. Therefore total digestibility of terrestrial based feedrarely exceeds 50% [12].
4.3.0.3 Problems and pitfalls: Limited land and fresh water
The major concern with using crop based feeds is the land area and fresh waterthat is required to grow them. The land use for production of major crops includedin aquafeed can be observed in Tab. 4.1. Producing food destined to feed otheranimals will never be as sustainable or efficient as consuming that food directly.Land use for feed also competes with wild life habitat, livable space, and otherproduct production such as biofuels. Additionally 70% of usable water is currentlydestined for agricultural practices where globally, 40% of the world’s population isthought to be in a severe water stressed area [23].
Table 4.1: Crop production and land area usage. [19]
Crop Land usearea (ha)
Yield(tons/ha) Production
(millionton)
Processedoil
(milliontons)
Maize 170.4 M ha 5.1847 883.4 MT 2.3 MTWheat 220 M ha 3.1948 704.1 MT glutenPalm oil ? ? ? 48.6 MTSoy Bean 103 M ha 2.5333 260.9 MT 41.6 MTBarley 48.6 M ha 2.7627 134.3 MT -
Cottonseed 35 M ha 2.1947 77.3 MT 5 MTRapeseed 33.6 M ha 1.8563 62.4 MT 22.3 MT
Sunflower seed 26 M ha 1.5434 40.2 MT 13.3 MTLinseed 2 M ha 0.7833 1.6 MT 520,929Lupin 959,099 1.1545 1.1 MT -
Hemp seed 27,038 3.2969 89,142 -
25

Chapter 4 Alternative aquafeeds available for finfish aquaculture
Furthermore, the use of crops present a unique set of challenges when replacing fishoil. Multiple experiments have been carried out in an attempt to replace fish oilswith crop based oils such as palm and rapeseed oil. The replacement of oils presenta problem as vegetable oils are high in saturated fatty acids. Although 100% oilreplacement can be achieved without visible negative effects of FCRs or fish growth,it was found that as palm oil increased in the inclusion of Atlantic salmon diets, thetotal saturated fatty acids increased linearly, replacing healthy highly unsaturatedfatty acids typically found within salmon [6]. Palm oil replacement above 50% wasfound to significantly reduce these essential fatty acids leading Bell et al. 2001, toargue the use of palm oil during the grow out stage of fish production and priorto a finishing feed [6]. Similar results were noted for the use of Rapeseed oil inAtlantic salmon [7]. It has been found that there is some evidence of fatty acidturnover and metabolism occurring in fish fed initially with vegetable oils, followedby a finishing feed of fishmeal. This supports the methodology of initially using cropbased feeds followed by fishmeal and fish oil based feeds to obtain a suitable fatty acidprofile while reducing overall fishmeal and fish oil consumption [30, 41]. It should benoted that in both of these palm and rapeseed oil substitution experiments, fishmealinclusion in the diet was maintained above 50%, highlighting the pitfall mentionedin the previous section of working with either fishmeal or fish oil, but not bothsimultaneously [6, 7].
4.3.0.4 Governance and future prospects: Widespread use
Despite the land, water and dietary problems, crop inclusion in aquafeed is stillsignificant [37, 27]. Additionally, production of these crops occurs at the base ofthe food chain and on such a large scale Tab. 4.1, that their role in the future ofaquaculture is almost guaranteed. Of crops being used and investigated, soy bean isthe most widely used within aquafeed [1]. I will therefore briefly discuss it specificallyamongst other crops within the following section. It should be noted however fromTab. 4.1, that maize, wheat, palm, and barley also have huge areas of land dedicatedto their production. These are in turn associated with massive yields and althoughnot included in aquafeed on the scale of soy bean, may never the less contribute tothe future of aquafeeds.
4.3.1 Soy bean
The world production of soybean destined for aquaculture feed was 6.8 million tonsin 2008, or 23.2% of total aquafeed by weight [1]. Chou et al. 2004, found in studieson the salt water carnivorous fish cobia, that supplementing diets with soybean over50% caused detrimental effects, but encouraged optimal fish growth when includedat 17% [13]. The inclusion rate of soybean meal varies depending on the fish type.
26
4.3 Terrestrial Crops
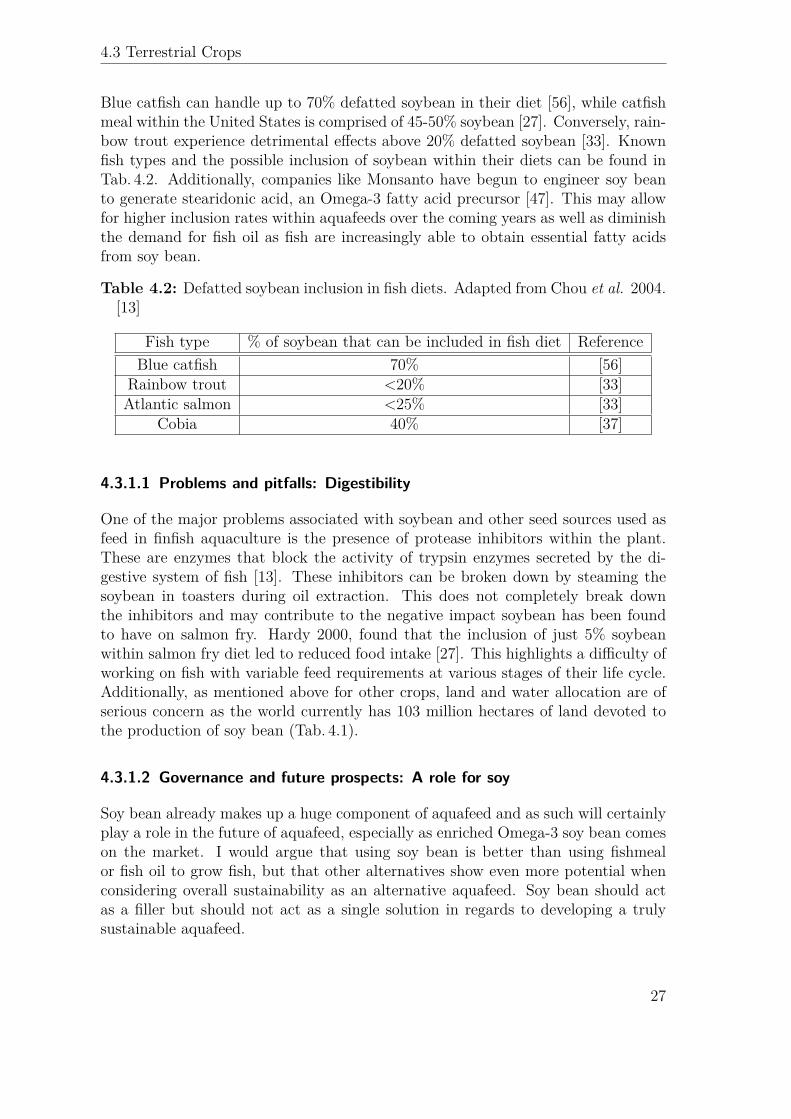
Blue catfish can handle up to 70% defatted soybean in their diet [56], while catfishmeal within the United States is comprised of 45-50% soybean [27]. Conversely, rain-bow trout experience detrimental effects above 20% defatted soybean [33]. Knownfish types and the possible inclusion of soybean within their diets can be found inTab. 4.2. Additionally, companies like Monsanto have begun to engineer soy beanto generate stearidonic acid, an Omega-3 fatty acid precursor [47]. This may allowfor higher inclusion rates within aquafeeds over the coming years as well as diminishthe demand for fish oil as fish are increasingly able to obtain essential fatty acidsfrom soy bean.
Table 4.2: Defatted soybean inclusion in fish diets. Adapted from Chou et al. 2004.[13]
Fish type % of soybean that can be included in fish diet ReferenceBlue catfish 70% [56]
Rainbow trout <20% [33]Atlantic salmon <25% [33]
Cobia 40% [37]
4.3.1.1 Problems and pitfalls: Digestibility
One of the major problems associated with soybean and other seed sources used asfeed in finfish aquaculture is the presence of protease inhibitors within the plant.These are enzymes that block the activity of trypsin enzymes secreted by the di-gestive system of fish [13]. These inhibitors can be broken down by steaming thesoybean in toasters during oil extraction. This does not completely break downthe inhibitors and may contribute to the negative impact soybean has been foundto have on salmon fry. Hardy 2000, found that the inclusion of just 5% soybeanwithin salmon fry diet led to reduced food intake [27]. This highlights a difficulty ofworking on fish with variable feed requirements at various stages of their life cycle.Additionally, as mentioned above for other crops, land and water allocation are ofserious concern as the world currently has 103 million hectares of land devoted tothe production of soy bean (Tab. 4.1).
4.3.1.2 Governance and future prospects: A role for soy
Soy bean already makes up a huge component of aquafeed and as such will certainlyplay a role in the future of aquafeed, especially as enriched Omega-3 soy bean comeson the market. I would argue that using soy bean is better than using fishmealor fish oil to grow fish, but that other alternatives show even more potential whenconsidering overall sustainability as an alternative aquafeed. Soy bean should actas a filler but should not act as a single solution in regards to developing a trulysustainable aquafeed.
27
Chapter 4 Alternative aquafeeds available for finfish aquaculture
4.3.2 Periphyton
Periphyton is the build up of aquatic plants, animals, and associated fauna onaquatic surfaces [55]. It is thought that upwards of 50% is non-algae in origin asbacteria and microbes add to this intricate community, creating a matrix high inorganic matter [55]. Periphyton can be consumed by many fish such as carp andtilapia, as well as catfish [55]. Humans have taken advantage of this by addingsubstrates to lakes and lagoons with the highest success in the form of bamboopoles over PVC piping and sugarcane, although other available surfaces can be used[55, 36]. Providing this substrate increases the surface area for periphyton growthwhich is dependent on nutrients, light, and substrate availability [55]. Generally,these structural additions are referred to as “brush parks”. The use of periphytonfor fish feed is long practiced in mostly developing nations including Bangladesh,Cambodia, China, Ecuador, India, Madagascar, and Sri Lanka [32]. Particularlysuccessful fish reared using periphyton include Labeo rohita and Tor khudree; twospecies of carp [34]. Through various studies, it was found that the use of brushparks can double the yield of fish reared in ponds with no supplemental feeding[5, 35]. However, it may take multiple days to remove a brush park during fishharvests thereby limiting the technique to smaller stakeholders operating withinEFSs and SIFSs [55]. Van Dam et al. 2003, found that brush parks on average yield5 tons/ha/yr, making them a viable opportunity for local actors [55].
4.3.2.1 Problems and pitfalls: Limited to local actors
Potential negative impacts associated with using brush parks are deforestation, eu-trophication as the brush park breaks down, and erosion if the park is built fromsurround mangroves [55]. Additionally, the literature suggests that although inclu-sion of a brush park may improve fish yields, there is not a linear relationship. Thus,brush parks will only improve a system to a point whereby adding additional bam-boo does not correlate to higher fish yields. The density at which optimum returnsoccurred for Keshavanath et al. 2004, was roughly 4 poles per m2, although theirnext treatment was 8 poles per m2 and they urge additional fine tuning within theirstudy [34]. The use of brush parks is further limited to specific species that may notbe in as high demand as carnivorous species and therefore restricted to local actors.
4.3.2.2 Governance and future prospects: A local solution
Brush parks are a prime example of implementations that local actors involved withEFSs and SIFSs can take without making major investments. Bamboo is one ofthe quickest growing species in the world and happens to grow in many parts ofAsia where EFSs and SIFSs are common. In the attempt to curb fish farmers frommoving towards the use of manufactured aquafeeds and becoming IFSs, the practiceof using bamboo to grow periphyton should be encouraged by local governments and
28
4.4 Innovative aquafeeds
stakeholders alike, so that farmers can increase yields while resisting the conversionto IFSs.
4.4 Innovative aquafeeds
4.4.1 Single celled organisms (SCO)
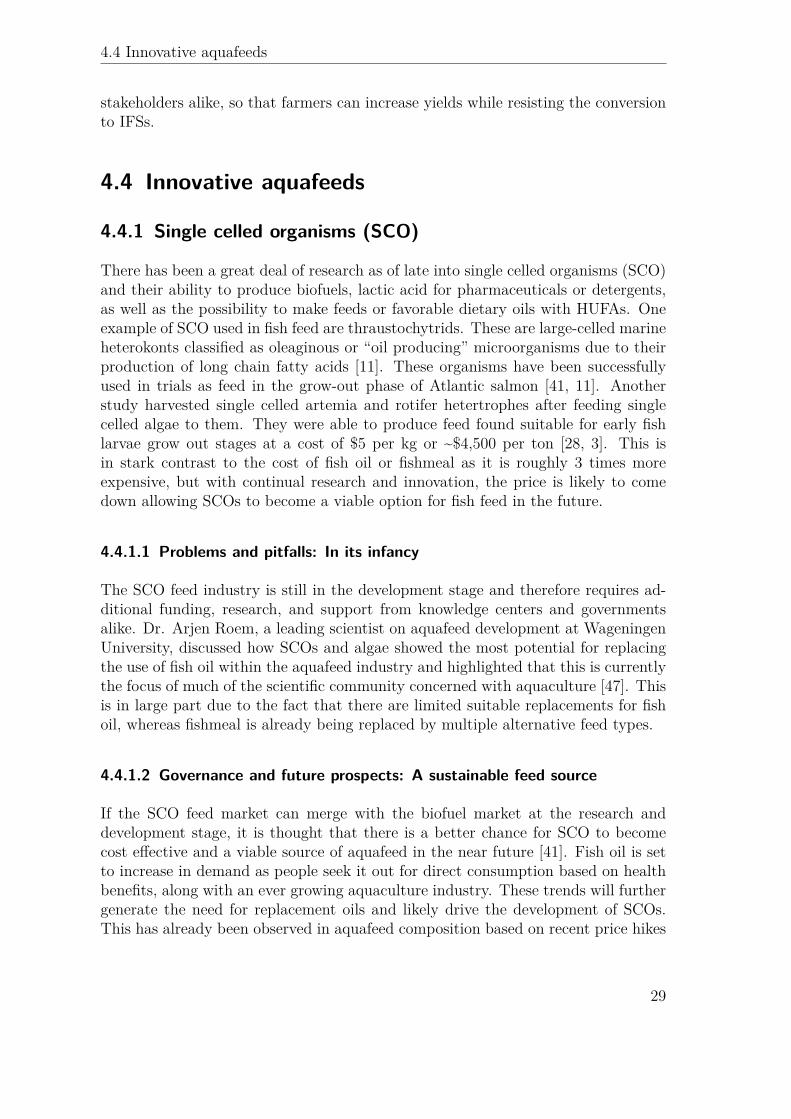
There has been a great deal of research as of late into single celled organisms (SCO)and their ability to produce biofuels, lactic acid for pharmaceuticals or detergents,as well as the possibility to make feeds or favorable dietary oils with HUFAs. Oneexample of SCO used in fish feed are thraustochytrids. These are large-celled marineheterokonts classified as oleaginous or “oil producing” microorganisms due to theirproduction of long chain fatty acids [11]. These organisms have been successfullyused in trials as feed in the grow-out phase of Atlantic salmon [41, 11]. Anotherstudy harvested single celled artemia and rotifer hetertrophes after feeding singlecelled algae to them. They were able to produce feed found suitable for early fishlarvae grow out stages at a cost of $5 per kg or ~$4,500 per ton [28, 3]. This isin stark contrast to the cost of fish oil or fishmeal as it is roughly 3 times moreexpensive, but with continual research and innovation, the price is likely to comedown allowing SCOs to become a viable option for fish feed in the future.
4.4.1.1 Problems and pitfalls: In its infancy
The SCO feed industry is still in the development stage and therefore requires ad-ditional funding, research, and support from knowledge centers and governmentsalike. Dr. Arjen Roem, a leading scientist on aquafeed development at WageningenUniversity, discussed how SCOs and algae showed the most potential for replacingthe use of fish oil within the aquafeed industry and highlighted that this is currentlythe focus of much of the scientific community concerned with aquaculture [47]. Thisis in large part due to the fact that there are limited suitable replacements for fishoil, whereas fishmeal is already being replaced by multiple alternative feed types.
4.4.1.2 Governance and future prospects: A sustainable feed source
If the SCO feed market can merge with the biofuel market at the research anddevelopment stage, it is thought that there is a better chance for SCO to becomecost effective and a viable source of aquafeed in the near future [41]. Fish oil is setto increase in demand as people seek it out for direct consumption based on healthbenefits, along with an ever growing aquaculture industry. These trends will furthergenerate the need for replacement oils and likely drive the development of SCOs.This has already been observed in aquafeed composition based on recent price hikes
29

Chapter 4 Alternative aquafeeds available for finfish aquaculture
in fishmeal and fish oil over the last two decades and with a global aquacultureindustry valued at $119 Billion in 2010, this trend will likely continue to driveinnovation in the aquafeed sector [1]. Since there is the potential to grow SCOs inmarine waters, two significant implications can be drawn. One is that SCOs requireno fresh water, a commodity already increasingly becoming scarce. The second isthat SCOs do not require terrestrial land space for growth. With SCOs rapid abilityto grow and replicate, SCOs present significant advantages when considering overallsustainability and efficiency in comparison to other aquafeeds and their success willbe dependent on bringing down the cost of production.
4.4.2 Insects
The use of defatted maggot meal was successful when fed to the catfish Clariasgariepinus. With a crude protein content of 45.6%, no significant differences werefound when substituted for fishmeal, although cod oil was included within all dietarytreatments [20]. In another study, the use of house fly larvae was studied as a feedsource within broiler chickens. It was found that Musca domestica had a dried crudeprotein content of 60%, a similar amino acid profile to fishmeal, and no differencein growth was observed when fishmeal was substituted for the insect meal in broilerdiets [16]. This has a potential significant impact on the finfish aquaculture sectoras the poultry and swine industries represent an overall significant consumption ofthe 7.74 million tons of pelagic fish not destined for aquafeed [40]. If insects can beused to replace fishmeal within these other industries, it indirectly may reduce thepressure on capture fisheries and the demand for fishmeal and fish oil. Additionally,similar protein content and nutritional profiles of insect meal in regards to fishmealwill allow for the continual development of insect use in aquafeed itself.
4.4.2.1 Problems and pitfalls: New industry
The use of insects as fish feed has huge potentials, but is currently still in its infancyin regards to use on an industrial scale. The ban on the use of animal renderedproducts as feed within the EU was lifted this year as of June 1st, 2013 as mentionedearlier [14]. The use of processed animal proteins has been banned in the EU since2001 with the outbreak of mad cow disease, but with new legislation, we will likelysee growth in this sector over the coming years. Insects do however need to beturned into meal prior to feeding to fish. It is thought this avoids the spread ofdisease, reduces bacteria as well as algae blooms, and overall decreases the chanceof fish mortality [20]. This does add to processing costs making it more expensiveto bring to market, setting it on par with other feed manufacturing processes.
30

4.4 Innovative aquafeeds
4.4.2.2 Governance and future prospects: Using waste
The amount of compostable waste exiting cities is staggering. The journal of me-chanical engineers put the amount of global food waste equivalent to 1.3 billion tonsa year from farm to fork [22]. If municipalities were able to sort their biodegradablewaste and use it as a feed source for insects, it would help to close a major energycycle as a significant waste stream becomes the input of a sustainably grown fishfeed. If food waste is to be used as a feed source within the EU, regulation oftenrequires that it is heat treated [47]. Given the fact that fish feed is changing rapidlyin composition from fishmeal and fish oil to alternative protein sources, it would beadvantages to promote this sector further as it stems from food waste while otherfishmeal sources such as crops depend on the designation and use of land and waterto grow feed.
31


5 Efficiency through rearing andfeeding methodology
Thus far, various fish feeds have been discussed to highlight the current status ofthe aquaculture feed industry, specific problems associated with each aquafeed type,and future prospects for those feeds. However, if the focus of this paper concernsefficiency of feeds, the methods in which fish are raised as well as how feed is deliveredneeds to be discussed. This may give a more complete picture of feed within thefinfish aquaculture industry and viable pathways forward towards making the finfishfeed industry more efficient.
5.1 Preventing aquafeed waste
Cho and Bureau 2001, found that feed waste within the aquaculture industry de-pends mostly on practices rather than feed itself [12]. It is thought that up to 10%of fish feed is wasted due to the fact it is not ingested by fish during feeding [48].This stems from diet selection, using accurate growth predictions, waste estimation,ration allowance, and the feeding strategy used [12]. Fish farms rely on oil and feedmanufacturer charts and scientific publications to make decisions about the amountof feed, method, and type of feed they consider to be best for their stocks. It istherefore important to continually investigate best practices and convey scientificresults to fish farmers, if progress is to be made on efficiency of feed in aquaculture[12].
Craig and Helfrich 2009, deliver specific recommendations regarding simple steps toreduce feed waste. Industrial fish feed typically comes in 50 Ibs. sacks and shouldbe stored out of the sun in the shade at cool temperatures for no more than 100days, and sacks should not be stacked more than 10 high [48]. They go further tosuggest that farmers should avoid feeding fish in stagnant water during the earlymornings when oxygen levels are lower as it is associated with decreased fish activity[48]. Additionally, they show how size and weight of fish play a role in the fishesability to digest the meal as well as the pellet size of the meal itself [38, 24, 46].These recommendations may seem trivial, but have huge implications on efficiencyof feed use and therefore important when we consider the entirety of efficiency withinaquaculture.
33
Chapter 5 Efficiency through rearing and feeding methodology
5.2 Innovative feeding methods
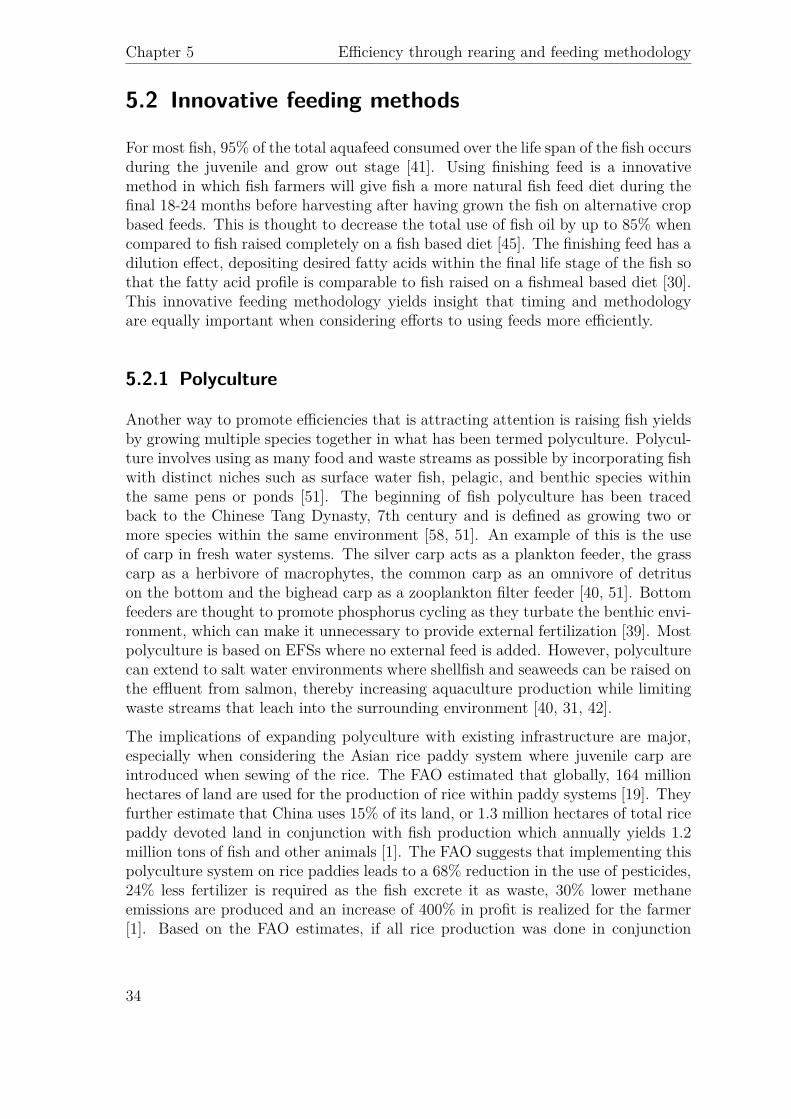
For most fish, 95% of the total aquafeed consumed over the life span of the fish occursduring the juvenile and grow out stage [41]. Using finishing feed is a innovativemethod in which fish farmers will give fish a more natural fish feed diet during thefinal 18-24 months before harvesting after having grown the fish on alternative cropbased feeds. This is thought to decrease the total use of fish oil by up to 85% whencompared to fish raised completely on a fish based diet [45]. The finishing feed has adilution effect, depositing desired fatty acids within the final life stage of the fish sothat the fatty acid profile is comparable to fish raised on a fishmeal based diet [30].This innovative feeding methodology yields insight that timing and methodologyare equally important when considering efforts to using feeds more efficiently.
5.2.1 Polyculture
Another way to promote efficiencies that is attracting attention is raising fish yieldsby growing multiple species together in what has been termed polyculture. Polycul-ture involves using as many food and waste streams as possible by incorporating fishwith distinct niches such as surface water fish, pelagic, and benthic species withinthe same pens or ponds [51]. The beginning of fish polyculture has been tracedback to the Chinese Tang Dynasty, 7th century and is defined as growing two ormore species within the same environment [58, 51]. An example of this is the useof carp in fresh water systems. The silver carp acts as a plankton feeder, the grasscarp as a herbivore of macrophytes, the common carp as an omnivore of detrituson the bottom and the bighead carp as a zooplankton filter feeder [40, 51]. Bottomfeeders are thought to promote phosphorus cycling as they turbate the benthic envi-ronment, which can make it unnecessary to provide external fertilization [39]. Mostpolyculture is based on EFSs where no external feed is added. However, polyculturecan extend to salt water environments where shellfish and seaweeds can be raised onthe effluent from salmon, thereby increasing aquaculture production while limitingwaste streams that leach into the surrounding environment [40, 31, 42].
The implications of expanding polyculture with existing infrastructure are major,especially when considering the Asian rice paddy system where juvenile carp areintroduced when sewing of the rice. The FAO estimated that globally, 164 millionhectares of land are used for the production of rice within paddy systems [19]. Theyfurther estimate that China uses 15% of its land, or 1.3 million hectares of total ricepaddy devoted land in conjunction with fish production which annually yields 1.2million tons of fish and other animals [1]. The FAO suggests that implementing thispolyculture system on rice paddies leads to a 68% reduction in the use of pesticides,24% less fertilizer is required as the fish excrete it as waste, 30% lower methaneemissions are produced and an increase of 400% in profit is realized for the farmer[1]. Based on the FAO estimates, if all rice production was done in conjunction
34
5.2 Innovative feeding methods
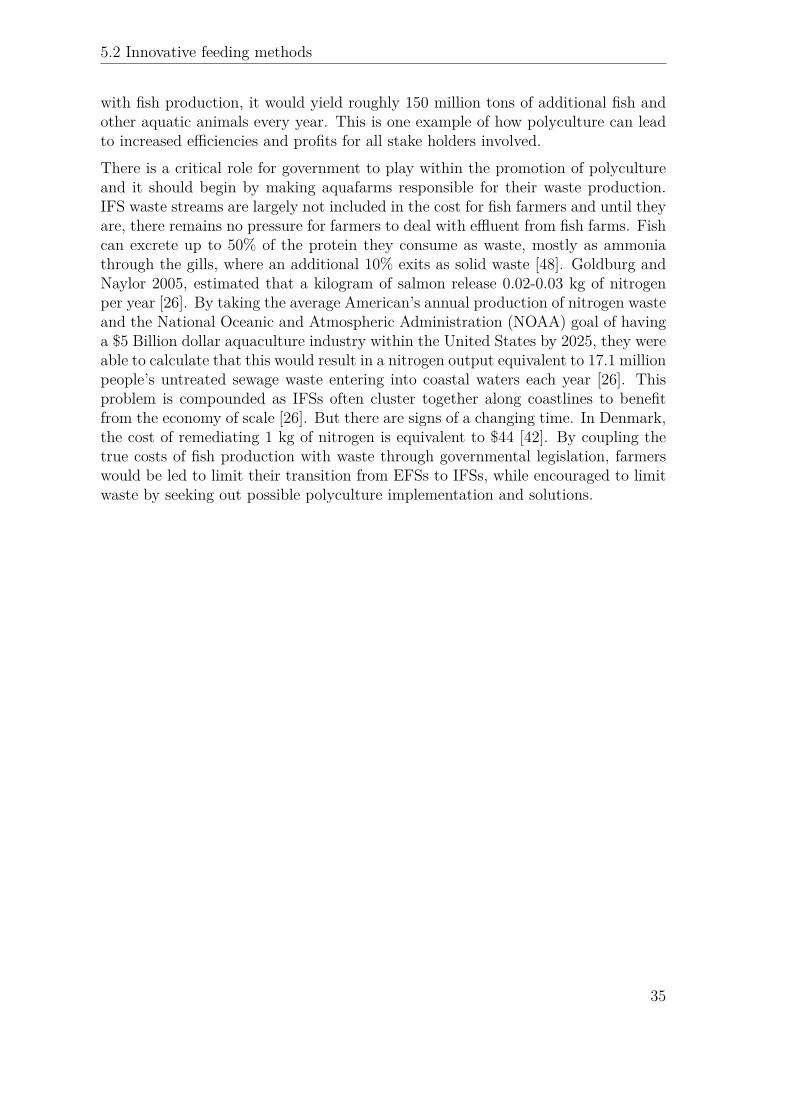
with fish production, it would yield roughly 150 million tons of additional fish andother aquatic animals every year. This is one example of how polyculture can leadto increased efficiencies and profits for all stake holders involved.There is a critical role for government to play within the promotion of polycultureand it should begin by making aquafarms responsible for their waste production.IFS waste streams are largely not included in the cost for fish farmers and until theyare, there remains no pressure for farmers to deal with effluent from fish farms. Fishcan excrete up to 50% of the protein they consume as waste, mostly as ammoniathrough the gills, where an additional 10% exits as solid waste [48]. Goldburg andNaylor 2005, estimated that a kilogram of salmon release 0.02-0.03 kg of nitrogenper year [26]. By taking the average American’s annual production of nitrogen wasteand the National Oceanic and Atmospheric Administration (NOAA) goal of havinga $5 Billion dollar aquaculture industry within the United States by 2025, they wereable to calculate that this would result in a nitrogen output equivalent to 17.1 millionpeople’s untreated sewage waste entering into coastal waters each year [26]. Thisproblem is compounded as IFSs often cluster together along coastlines to benefitfrom the economy of scale [26]. But there are signs of a changing time. In Denmark,the cost of remediating 1 kg of nitrogen is equivalent to $44 [42]. By coupling thetrue costs of fish production with waste through governmental legislation, farmerswould be led to limit their transition from EFSs to IFSs, while encouraged to limitwaste by seeking out possible polyculture implementation and solutions.
35


6 Discussion and Conclusion
The fact of the matter is that the aquaculture industry is rapidly growing andchanging, in some ways for the better and others for the worse. The global industryis shifting towards IFSs which is fundamentally the wrong direction. EFSs need tobe promoted wherever possible and government has a role to play in making surethe true costs of IFSs are realized by charging farmers for their waste. In doingso, IFSs are more likely to incorporate efficient process and methods to maintainand increase profitability wherever possible. With proper regulation, governmentalso has a responsibility to become more clear in their governance of aquaculture sothat the industry can better operate with less bureaucracy. Difficulties in legislationcan be highlighted within the US where there are no formal policies to manageaquaculture, but 32 state programs with over 1200 state laws that impact variousfacets of the industry [15]. This chocks the industry’s ability to operate and moveforward as the science recommends it to do.
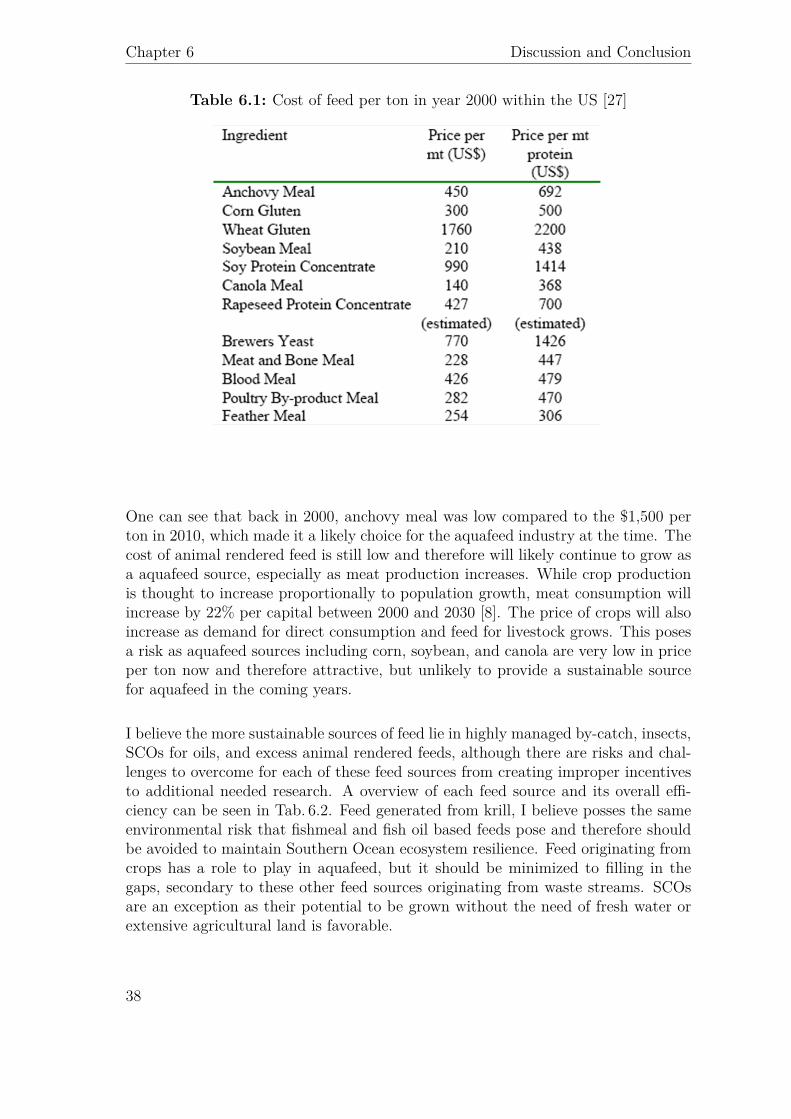
In regards specifically to feed, the industries inclusion of fishmeal and fish oil areon the decline. Fishmeal destined for salmon feed has been reduced from inclusionlevels of 45-50% 20 years ago to 10-15% today and it is thought that the industrycould become completely independent in the coming decade [47]. Fish oil is thoughtto be more critical within the diets of fish due to essential dietary componentsand therefore a harder ingredient to replace. But reductions in this too are beingobserved, from 19.7% inclusion within European aquafeed 20 years ago to less than10% today [47]. Therefore, the current challenge within the industry is the worktowards the developments of efficient and sustainable feeds, as well as oils that havethe same nutritional value as fish oil and can therefore replace it altogether. If onelooks at various aquafeed costs in the year 2000, the market is clearly driven byspecific feed sources (Tab. 6.1).
37
Chapter 6 Discussion and Conclusion
Table 6.1: Cost of feed per ton in year 2000 within the US [27]
One can see that back in 2000, anchovy meal was low compared to the $1,500 perton in 2010, which made it a likely choice for the aquafeed industry at the time. Thecost of animal rendered feed is still low and therefore will likely continue to grow asa aquafeed source, especially as meat production increases. While crop productionis thought to increase proportionally to population growth, meat consumption willincrease by 22% per capital between 2000 and 2030 [8]. The price of crops will alsoincrease as demand for direct consumption and feed for livestock grows. This posesa risk as aquafeed sources including corn, soybean, and canola are very low in priceper ton now and therefore attractive, but unlikely to provide a sustainable sourcefor aquafeed in the coming years.
I believe the more sustainable sources of feed lie in highly managed by-catch, insects,SCOs for oils, and excess animal rendered feeds, although there are risks and chal-lenges to overcome for each of these feed sources from creating improper incentivesto additional needed research. A overview of each feed source and its overall effi-ciency can be seen in Tab. 6.2. Feed generated from krill, I believe posses the sameenvironmental risk that fishmeal and fish oil based feeds pose and therefore shouldbe avoided to maintain Southern Ocean ecosystem resilience. Feed originating fromcrops has a role to play in aquafeed, but it should be minimized to filling in thegaps, secondary to these other feed sources originating from waste streams. SCOsare an exception as their potential to be grown without the need of fresh water orextensive agricultural land is favorable.
38

Discussion and Conclusion
Table 6.2: Overview of efficiency of aquafeeds
Feed type Currentuse
Level ofsustain-ability
Points to consider
Wildcatch, krill
fullyexploited
0 Inefficient, risk to ecosystem ifexpanded, could directly be
consumedTerrestrial
cropsgrowing * Extensive land and water use,
crops could directly beconsumed.
Bycatch limitedgrowth left
** Waste origin, limited byprocessing facilities, negativeincentive to increase bycatch.
Animalrendered
growing ** Waste origin, large footprint forterrestrial animals, negativeincentive to increase meat
production.Periphyton localized *** Limited to EFS and SIFS, labor
intensive, should be promotedwhen possible.
SCO futureprospec-
tive
*** Grown in salt water, no landneeded, R&D required to
develop.Insects future
prospec-tive
*** Food waste stream origin, waterneeded, R&D required to
develop.0- The least sustainable feed used to grow fish *-Potential for inclusion in aquafeedbut should be avoided when possible **-Derived from waste stream, but haspotential to create negative incentives within other industry ***-Derived fromwaste streams or requires no limiting resources with limited negative impact onother industry.
Scientists need to start standardizing their experiments to create a foundation inwhich feed substitution experiments can progress. The current incorporation ofa multitude of feed components with variable fishmeal and or fish oil slows thescientific progression, especially when it is carried out over a multitude of fish species.Every effort needs to be made to communicate with aquafeed producers, allowingfor stepwise improvements to achieve sustainably sourced aquafeeds. If one looks atthe salmon feed industry, there are three major feed manufacturers representing over90% of the salmon feed market. They include Skretting based out of the Netherlands,
39

Chapter 6 Discussion and Conclusion
Ewos based in Norway, and Biomar based in Denmark [47]. By communicatingwith these companies and organizing research to stem from a common foundation,progressive changes in farmed salmon diets will be more quickly realized.This being said, the use of fishmeal and oil in aquaculture should come to an end.The multitude of efficiently sourced aquafeeds that can be substituted for fishmealand fish oil, without negative impacts on the health and growth of fish are numerous.Additionally, while there is a current emphasis placed on feed resource sustainability,there exist minimal debate on whether pelagic fish should be redirected for directhuman consumption [54]. As techniques improve to allow more people to eat smallerpelagic forage fish, there is the opportunity to feed a larger number of people whencompared to the fish raised on fishmeal and fish oil. This idea is based on the prin-ciple of energy conservation per trophic level, and although variable, is commonlyaccepted that 10% of energy is conserved with each higher trophic level [44]. Thismeans we could potentially feed 10 times the number of people on a small pelagicfish diet when compared to salmon or other higher trophic level species.As the finfish aquaculture industry continues to be negatively observed within thepublic eye as inefficient, unsustainable, and behind the times, adopting more efficientaquafeeds could also give the industry a much needed boost in public opinion. Arecent story on the British Broadcasting Company highlights the problem as recentplans were announced to set up a salmon farm near the islands of Aran off Ireland,estimated to produce 15,000 tons of salmon per year with a standing salmon stockof 7 million fish [21]. The article discusses stiff opposition to the plans from localresidents and anglers which provides insight into how public perception is continu-ally hindering growth of the aquaculture industry. By sustainably sourcing finfishaquafeed, the industry has a real chance to address the lack of efficiencies and waste,and begin the process of being viewed in a more positive light.Lastly, significant changes within the aquaculture industry will continue to occurbased on the consumer choices and spending. By eating smaller herbivorous fish,we create the demand for change from higher trophic level carnivorous fish. Wealso have the potential to collectively demand sustainably raised carnivorous fish.As scientists, I believe our role extends beyond consumers as the task falls to us totranslate our scientific findings and get it into the hands of the consumer so thatthey have the opportunity to make informed decisions. Through communication,continual innovation, and action, the opportunity to improve the efficiency andoverall sustainability of the finfish aquaculture industry is tangibly within reach.
40

Acknowledgments
I would like to thank Dr. Jasper de Goeij from the University of Amsterdam for thesupervision of this project, providing feedback and direction throughout the process.I would additionally like to thank Dr. Harm van der Geest for his feedback momentand for taking the time to act as examiner for this project. Lastly, I would like tothank Dr Arjen Roem from Wageningen University for his time and willingness toshare his extensive insight and knowledge concerning the aquaculture industry.
41


Bibliography
[1] Fao fisheries & aquaculture department. the state of world fisheries and aqua-culture. food and agriculture organization of the united nations, 2012.
[2] Commission for the conservation of antarctic marine living resources(ccamlr). krill fisheries. po box 213, north hobart 7002, tasmania, australia.http://www.ccamlr.org/en/fisheries/krill-fisheries. accessed 5-8-2013. Online,August 2013.
[3] Naser Agh and Patrick Sorgeloos, editors. Handbook of protocols and guidelinesfor culture and enrichment of live food for use in larviculture. Artemia andAquatic Animals Research Center, 2005.
[4] Anon. Fish food in the chilean salmon: conversion rates. Association of Chileansalmon industry, 1:1–8, 2006.
[5] M. E. Azim, M. A. Wahab, A. A. van Dam., M. C. M. Beveridge, and M. C. J.Verdegem. The potential of periphyton-based culture of two indian major carps,rohu labeo rohita and gonia labeo gonius. Aquaculture research and develop-ment, 32:209–216, 2001.
[6] J. G. Bell, R. J. Henderson, D. R. Tocher, F. McGhee, J. R. Dick, A. Porter,R. P. Smullen, and J. R. Sargent. Substituting fish oil with crude palm oil inthe diet of atlantic salmon (salmo salar), affects muscle fatty acid compositionand hepatic fatty acid metabolism. The Journal of Nutrition, pages 222–230,2001.
[7] J. G. Bell, J. McEvoy, D. R. Tocher, F. McGhee, P. J. Campbell, and J. R. Sar-gent. Replacement of fish oil with rapeseed oil in diets of atlantic salmon (salmosalar), affects tissue lipid compositions and hepatocyte fatty acid metabolism.The Journal of Nutrition, pages 1535–1543, 2001.
[8] S. Bringezu, H. Schutz, M. O’ Brien, L. Kauppi, R. W. Howarth, and J. Mc-Neely. Assessing biofuels. Technical report, (UNEP) United Nations Environ-ment Programme, 2009.
[9] D. P. Bureau, A. M. Harris, and C. Y. Cho. Feather meal and bone mealsfrom different orgins as protein sources in rainbow trout, oncorhynchus mykiss.Aquaculture, 181:281–291, 2000.
[10] J. C. Callaway. Hempseed as a nutritional resource. an overview. Euphytica,140:65–72, 2004.
43

Bibliography
[11] C. G. Carter, M. P. Bransden, T. E. Lewis, and P. D. Nichols. Potential ofthraustochytrids to partially replace fish oil in atlantic salmon feeds. Marinebiotechnology, 5:480–492, 2003.
[12] C. Y. Cho and D. P. Bureau. A review of diet formulation strategies andfeeding systems to reduce excretory and feed wastes in aquaculture. AquacultureResearch, 32 (Suppl. 1):349–360, 2001.
[13] R. L. Choua, B. Y. Hera, M. S. Sua, G. Hwangb, Y. H. Wub, and H. Y. Chenb.Substituting fish meal with soybean meal in diets of juvenile cobia rachycentroncanadum. Aquaculture, 229:325–333, 2004.
[14] EU Commision. Eu commision regulation. Official journal of the EuropeanUnion, 56:1–14, 2013.
[15] M. R. DeVoe and C. E. Hodges. Responsible Marine Aquaculture. CABI Pub-lishing, 2002.
[16] M. Dordevic, B. Radenkovic-Damnjanovic, M. Vucinic, M. Baltic, R. Teodor-ovic, L. Jankovic, M. Vukasinovic, and M. Rajkovic. Eeffect of substitutionof fish meal with fresh dehydrated larvae of the house fly musca domestica,on productive performance and health of broilers. Acta Veterinaria (Beograd),54:4:357–368, 2008.
[17] P. Edwards. Environmental issues in integrated agriculture-aquaculture andwastewater-fed fish culture systems. Environment and aquaculture in developingcountries, 31:139–170, 1993.
[18] FAO. Fao fisheries department, fishery information, data and statistics unit.fishstat plus. universal software for fishery statistical time series. aquacultureproduction quantities 1950-2006., 2008.
[19] FAO. Food and agriculture organization of the united nations. faostat., 2011.
[20] E. A. Fasakin, A. M. Balogun, and O. O. Ajayi. Evaluation of full-fat and defat-ted maggot meals in the feeding of clariid catfish clarias gariepinus fingerlings.Aquaculture Research, 34:733–738, 2003.
[21] D. Fleming. Bbc. irish battle over plans for aran giant salmon farm. accessed8-6-2013. http://www.bbc.co.uk/news/world-europe-23550159. online, 8 2013.
[22] Dr. T. Fox and C. Fimeche. Global food, waste not, want not. Institute for Me-chanical Engineers, 1 Birdcage Walk, Westminster London SW1H 9JJ, January2013.
[23] G20. Sustainable agricultural productivity growth and bridging the gap forsmall-family farms; with contributions by bioversity, cgiar consortium, fao, ifad,ifpri, iica, oecd, unctad, coordination team of un high level task force on thefood security crisis, wfp, world bank, and wto. Technical report, InteragencyReport to the Mexican G20 Presidency, 2012.
44

Bibliography
[24] B.D. Glencross, M. Booth, and G.L. Allan. A feed is only as good as itsingredients - a review of ingredient evaluation strategies for aquaculture feeds.Aquaculture Nutrition, 13:17–34, 2007.
[25] A. M. Goda, E. R. El-Haroun, and M A Kabir Chowdhury. Effect of totally orpartially replacing fish meal by alternative protein sources on growth of africancatfish clarias gariepinus (burchell, 1822) reared in concrete tanks. AquacultureResearch, 38:279–287, 2007.
[26] R. Goldburg and R. Naylor. Future seascapes, fishing, and fish farming. Fron-tiers in Ecology and the Environment, 3:21–28, 2005.
[27] R. W. Hardy. New developments in aquatic feed ingredients, and potential ofenzyme supplements. Hagerman Fish Culture Experiment Station, Universityof Idaho., pages 216–226, 2000.
[28] M. Harel, W. Koven, I. Lein, Y. Bar, P. Behrens, J. Stubblefield, Y. Zohar,and A. R. Place. Advanced dha, epa, and ara enrichment materials for marineaquaculture using single cell heterotrophs. Aquaculture, 213:347–362, 2002.
[29] A. Jackson. Fish in - fish out (fifo) ratios explained. Aquaculture Europe, 34:3,2009.
[30] M. Jobling. Finishing feeds for carnivorous fish and the fatty acid dilutionmodel. Aquaculture Research, 35:706–709, 2004.
[31] T. O. Jones and G. K. Iwama. Polyculture of the pacifc oyster, crassostreagigas, with chinook salmon, oncorhynchus tshawytscha. Aquaculture, 92:313–322, 1991.
[32] J. Kapetsky. Brush park fisheries. some consideration for the management ofcoastal lagoon and estuarine fisheries. FAO fisheries technical paper, 218:18–28,1981.
[33] S. J. Kaushik, J. P. Cravedi, J. P. Lalles, J. Sumpter, B. Fauconneau, andM Laroche. Partial or total replreplace of fish meal by soybean protein ongrowth, protein utilization, potential estrogenic or antigenic effects, choles-terolemia and flesh quality in rainbow trout, oncorhynchus mykiss. Aquaculture,133:257–274, 1995.
[34] P. Keshavanath, B. Gangadhar, T. J. Ramesh, A. A. van Dam, M. C. M. Bev-eridge, and M. C. J. Verdegem. Effect of bamboo substrate and supplementalfeeding on growth and production of hybrid red tilapia fingerlings. Aquaculture,235:303–314, 2004.
[35] P. Keshavanath, B. Gangadhar, T. J. Ramesh, A.A. van Dam, M. C. M. Bev-eridge, and M. C. J. Verdegem. The effect of periphyton and supplementalfeeding on the production of the indigenous carps torkhudree and labe fimbria-tus. Aquaculture, 213:207–218, 2002.
[36] P. Keshavanath, B. Gangadhar, T. J. Ramesh, J. M. van Rooij, M. C. M.Beveridge, D. J. Baird, M. C. J. Verdegem, and A. A. van Dam. Use of artificial
45
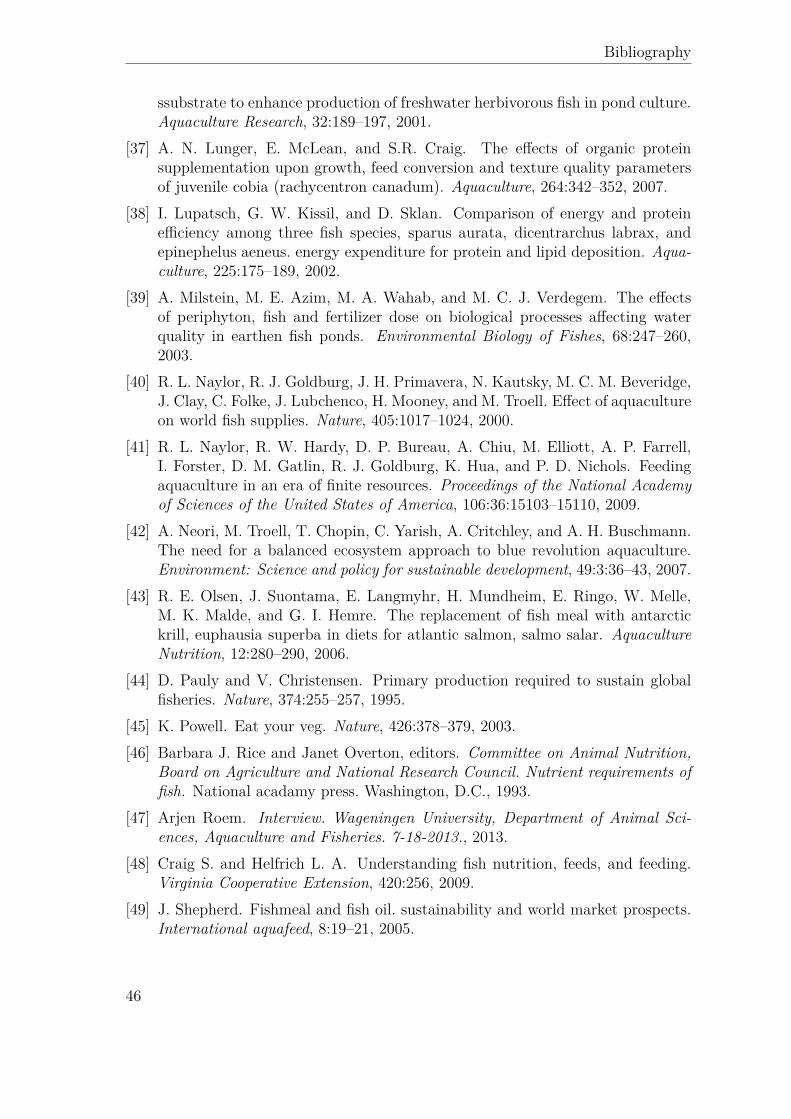
Bibliography
ssubstrate to enhance production of freshwater herbivorous fish in pond culture.Aquaculture Research, 32:189–197, 2001.
[37] A. N. Lunger, E. McLean, and S.R. Craig. The effects of organic proteinsupplementation upon growth, feed conversion and texture quality parametersof juvenile cobia (rachycentron canadum). Aquaculture, 264:342–352, 2007.
[38] I. Lupatsch, G. W. Kissil, and D. Sklan. Comparison of energy and proteinefficiency among three fish species, sparus aurata, dicentrarchus labrax, andepinephelus aeneus. energy expenditure for protein and lipid deposition. Aqua-culture, 225:175–189, 2002.
[39] A. Milstein, M. E. Azim, M. A. Wahab, and M. C. J. Verdegem. The effectsof periphyton, fish and fertilizer dose on biological processes affecting waterquality in earthen fish ponds. Environmental Biology of Fishes, 68:247–260,2003.
[40] R. L. Naylor, R. J. Goldburg, J. H. Primavera, N. Kautsky, M. C. M. Beveridge,J. Clay, C. Folke, J. Lubchenco, H. Mooney, and M. Troell. Effect of aquacultureon world fish supplies. Nature, 405:1017–1024, 2000.
[41] R. L. Naylor, R. W. Hardy, D. P. Bureau, A. Chiu, M. Elliott, A. P. Farrell,I. Forster, D. M. Gatlin, R. J. Goldburg, K. Hua, and P. D. Nichols. Feedingaquaculture in an era of finite resources. Proceedings of the National Academyof Sciences of the United States of America, 106:36:15103–15110, 2009.
[42] A. Neori, M. Troell, T. Chopin, C. Yarish, A. Critchley, and A. H. Buschmann.The need for a balanced ecosystem approach to blue revolution aquaculture.Environment: Science and policy for sustainable development, 49:3:36–43, 2007.
[43] R. E. Olsen, J. Suontama, E. Langmyhr, H. Mundheim, E. Ringo, W. Melle,M. K. Malde, and G. I. Hemre. The replacement of fish meal with antarctickrill, euphausia superba in diets for atlantic salmon, salmo salar. AquacultureNutrition, 12:280–290, 2006.
[44] D. Pauly and V. Christensen. Primary production required to sustain globalfisheries. Nature, 374:255–257, 1995.
[45] K. Powell. Eat your veg. Nature, 426:378–379, 2003.[46] Barbara J. Rice and Janet Overton, editors. Committee on Animal Nutrition,
Board on Agriculture and National Research Council. Nutrient requirements offish. National acadamy press. Washington, D.C., 1993.
[47] Arjen Roem. Interview. Wageningen University, Department of Animal Sci-ences, Aquaculture and Fisheries. 7-18-2013., 2013.
[48] Craig S. and Helfrich L. A. Understanding fish nutrition, feeds, and feeding.Virginia Cooperative Extension, 420:256, 2009.
[49] J. Shepherd. Fishmeal and fish oil. sustainability and world market prospects.International aquafeed, 8:19–21, 2005.
46
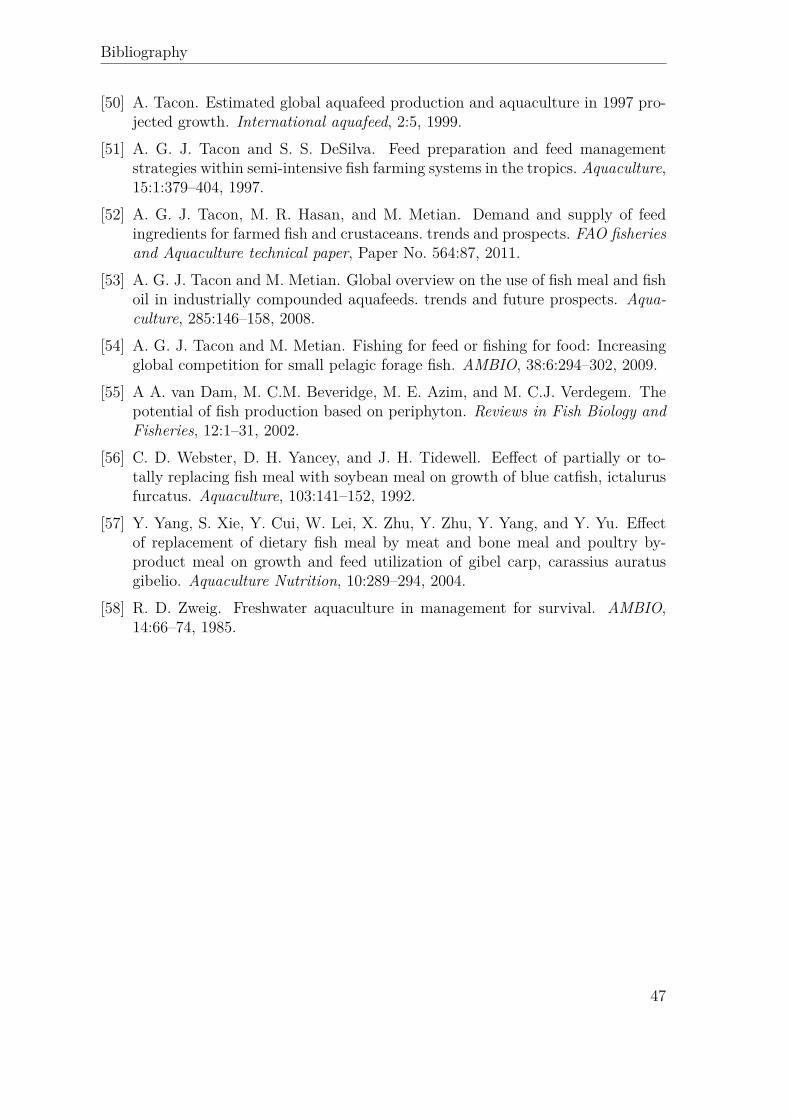
Bibliography
[50] A. Tacon. Estimated global aquafeed production and aquaculture in 1997 pro-jected growth. International aquafeed, 2:5, 1999.
[51] A. G. J. Tacon and S. S. DeSilva. Feed preparation and feed managementstrategies within semi-intensive fish farming systems in the tropics. Aquaculture,15:1:379–404, 1997.
[52] A. G. J. Tacon, M. R. Hasan, and M. Metian. Demand and supply of feedingredients for farmed fish and crustaceans. trends and prospects. FAO fisheriesand Aquaculture technical paper, Paper No. 564:87, 2011.
[53] A. G. J. Tacon and M. Metian. Global overview on the use of fish meal and fishoil in industrially compounded aquafeeds. trends and future prospects. Aqua-culture, 285:146–158, 2008.
[54] A. G. J. Tacon and M. Metian. Fishing for feed or fishing for food: Increasingglobal competition for small pelagic forage fish. AMBIO, 38:6:294–302, 2009.
[55] A A. van Dam, M. C.M. Beveridge, M. E. Azim, and M. C.J. Verdegem. Thepotential of fish production based on periphyton. Reviews in Fish Biology andFisheries, 12:1–31, 2002.
[56] C. D. Webster, D. H. Yancey, and J. H. Tidewell. Eeffect of partially or to-tally replacing fish meal with soybean meal on growth of blue catfish, ictalurusfurcatus. Aquaculture, 103:141–152, 1992.
[57] Y. Yang, S. Xie, Y. Cui, W. Lei, X. Zhu, Y. Zhu, Y. Yang, and Y. Yu. Effectof replacement of dietary fish meal by meat and bone meal and poultry by-product meal on growth and feed utilization of gibel carp, carassius auratusgibelio. Aquaculture Nutrition, 10:289–294, 2004.
[58] R. D. Zweig. Freshwater aquaculture in management for survival. AMBIO,14:66–74, 1985.
47


