Literature Review of Miscellaneous Energy Loads …€¦ · · 2014-06-11Literature Review of...
109
Literature Review of Miscellaneous Energy Loads (MELs) in Residential Buildings Submitted to: Richard Pulliam Southern California Edison 1515 Walnut Grove Ave Rosemead, CA 91770 Submitted by: Teddy Kisch, Arshak Zakarian, and Nate Dewart Energy Solutions 1610 Harrison Street Oakland, CA 94612 June 2014 CALMAC Study ID: SCE0360.01
-
Upload
truongtram -
Category
Documents
-
view
216 -
download
1
Transcript of Literature Review of Miscellaneous Energy Loads …€¦ · · 2014-06-11Literature Review of...
Literature Review of Miscellaneous Energy Loads (MELs) in Residential Buildings
Submitted to:
Richard Pulliam
Southern California Edison
1515 Walnut Grove Ave Rosemead, CA 91770
Submitted by:
Teddy Kisch, Arshak Zakarian, and Nate Dewart
Energy Solutions
1610 Harrison Street
Oakland, CA 94612
June 2014
CALMAC Study ID: SCE0360.01
2
Acknowledgements
This project was led by Southern California Edison and co-funded by Pacific Gas & Electric, San Diego Gas & Electric,
and Southern California Gas Company as part of the 2013-2014 EM&V Zero Net Energy research.
The Authors would like to thank the following persons for their contributions:
Derek Jones, Peter Turnbull, Pacific Gas & Electric; Caroline Chen, Dan Hopper, Devin Rauss, Jesse Emge, John
Morton, Richard Pulliam Southern California Edison; Lonnie Mansi, Rob Rubin, San Diego Gas & Electric; Anna
LaRue, Carrie Brown, Resource Refocus; Ken Keating, consultant to the California Public Utilities Division (CPUC),
and Cathy Fogel, CPUC for their input and guidance in developing this document.
Sameer Kwatra, American Council for an Energy Efficient Economy (ACEEE); and Jeffery Greenblatt, Lawrence
Berkeley National Laboratory (LBNL) for clarifying their methodologies used in their respective studies on energy
use of Miscellaneous Energy Loads (MELs).
3
Table of Contents Acknowledgements .................................................................................................................................................... 2
Table of Contents ....................................................................................................................................................... 3
1. Executive Summary ................................................................................................................................................ 5
2. Introduction .......................................................................................................................................................... 10
2.1 Project Scope ................................................................................................................................................ 11
3. Methodology ........................................................................................................................................................ 12
3.1 Developing a working definition of MELs ..................................................................................................... 12
3.2 Identifying unit level and aggregate level calculation methodologies ......................................................... 12
3.3 Prioritizing a subset of MELs for further review ........................................................................................... 13
3.4 Data Collection ............................................................................................................................................. 14
3.5 Classifying MEL study methodologies .......................................................................................................... 15
4. Literature Review of Selected Residential MEL Devices ....................................................................................... 18
4.1 Televisions .................................................................................................................................................... 18
4.2 Set Top Boxes ............................................................................................................................................... 22
4.3 Desktop Computers ...................................................................................................................................... 29
4.4 Notebook Computers ................................................................................................................................... 34
4.5 Microwave Ovens ......................................................................................................................................... 38
4.6 Game Consoles ............................................................................................................................................. 42
4.7 Monitors ....................................................................................................................................................... 47
4.8 DVD/Blu-Ray Players ..................................................................................................................................... 50
4.9 Network Equipment ..................................................................................................................................... 58
4.10 Compact Audio ............................................................................................................................................. 65
4.11 Audio Receivers ............................................................................................................................................ 69
4.12 Home Theater in a Box (HTIB) ...................................................................................................................... 72
5. Review of Emerging Non-Intrusive Load Monitoring Techniques ........................................................................ 76
6. Results .................................................................................................................................................................. 79
7. Summary Recommendations for Future ZNE Planning ........................................................................................ 82
7.1 Next Step Recommendations ............................................................................................................................. 82
7.2 M&E Research Roadmap Recommendations ..................................................................................................... 84
8. Works Cited .......................................................................................................................................................... 86
9. Appendix A: Supplemental Tables for Tier 1 Devices ........................................................................................... 94
4
10. Appendix B: Tables for Tier 2 Devices .............................................................................................................. 97
5
1. Executive Summary Energy consumption from Miscellaneous Energy Loads (MELs) in Residential buildings is growing faster than any
other end use category and has offset some of the efficiency gains made in lighting, HVAC, and water heating (EIA
2013). Historically, it has been difficult to develop precise estimates of MEL energy use, and the highly distributed
nature of MEL energy use makes it time-consuming and expensive to collect meaningful data across the wide
number of end uses. While there are a wide range of studies that estimate energy consumption for individual
MELs, it is difficult to evaluate their relative uncertainty without an in-depth review of study methodology. From a
ZNE planning perspective, understanding the relative confidence in MEL estimates is critical.
The purpose of this study is to evaluate the relative certainty of existing estimates by conducting a literature
review of existing MEL studies and to identify their underlying respective methodologies. Due to the limited scope
of this study, it does not include original, primary research on MEL energy use or significant manipulation of
existing study data. Based on this information, we identify best available estimates, identify gaps in existing
information, and develop recommendations for future study. In addition, this report provides an overview of
alternative methods of estimating energy use and load disaggregation techniques using Non-Intrusive Load
Monitoring (NILM), which has the potential to improve accuracy and lower the costs of estimating MEL energy use.
It is important to note that this literature review is, by nature, a backward looking study, and does not reflect the
most up-to-date usage or energy consumption of new devices coming to market; rather, it is a review of existing
estimates to clarify the uncertainty of existing data and identify best available information for existing stock.
Overall, we found that existing MEL energy estimates have a relatively high degree of uncertainty. While there
have been significant studies to characterize usage, power, and/or installed base of MELs, they typically lack the
scale and comprehensiveness to provide a high level of certainty. A major source of uncertainty is usage hours,
which are typically more variable than power or installed base estimates and have the greatest impact on Unit
Energy Consumption (UEC, measured in kWh/yr) and Annual Energy Consumption (AEC, measured in TWh/yr).
Power in each mode, although better understood, changes more rapidly than usage and is a major driver of shifting
UEC values over time. In most cases, installed base estimates have the least amount of variation. As consumer
electronics products go through varying phases of popularity, the greatest uncertainty for the installed base is
understanding how many products within the installed base are actually used and plugged in.
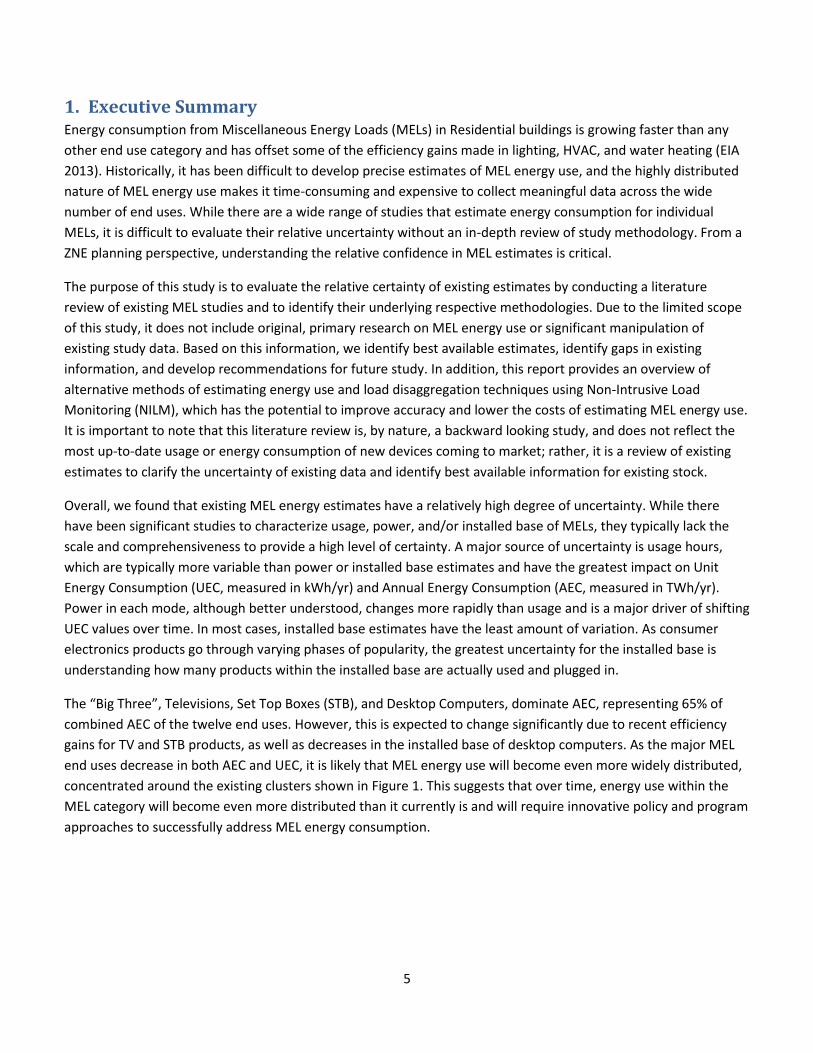
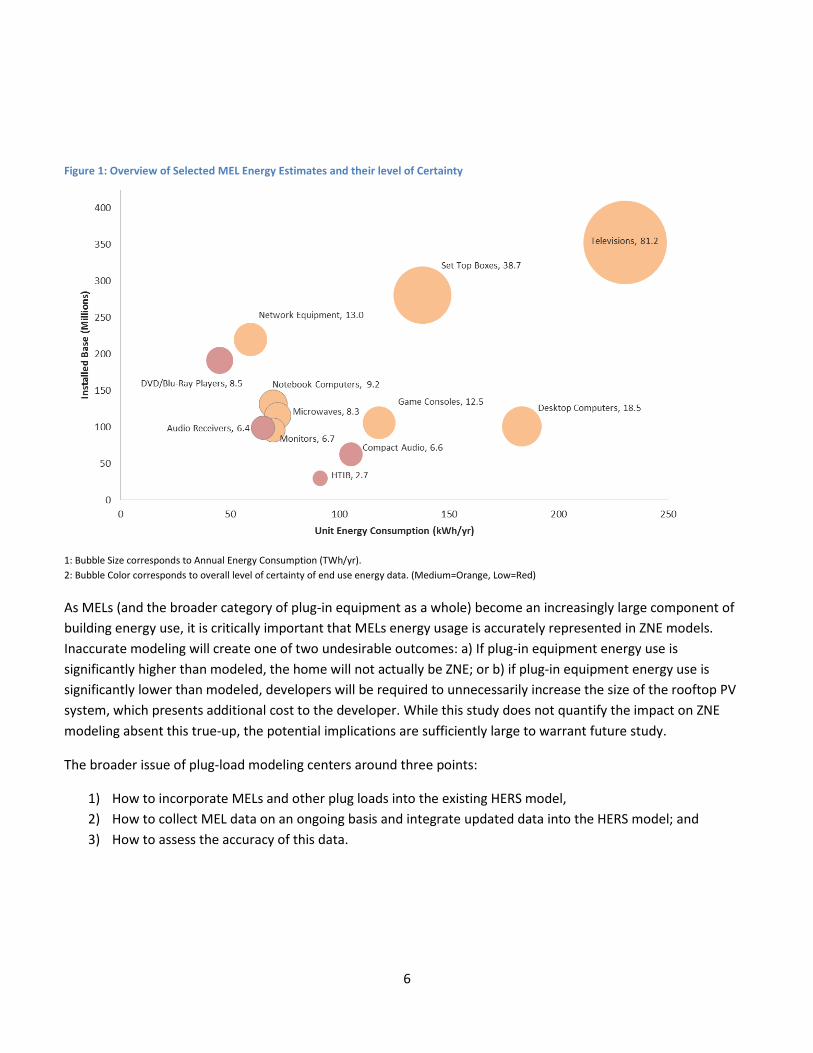
The “Big Three”, Televisions, Set Top Boxes (STB), and Desktop Computers, dominate AEC, representing 65% of
combined AEC of the twelve end uses. However, this is expected to change significantly due to recent efficiency
gains for TV and STB products, as well as decreases in the installed base of desktop computers. As the major MEL
end uses decrease in both AEC and UEC, it is likely that MEL energy use will become even more widely distributed,
concentrated around the existing clusters shown in Figure 1. This suggests that over time, energy use within the
MEL category will become even more distributed than it currently is and will require innovative policy and program
approaches to successfully address MEL energy consumption.
6
Figure 1: Overview of Selected MEL Energy Estimates and their level of Certainty
1: Bubble Size corresponds to Annual Energy Consumption (TWh/yr).
2: Bubble Color corresponds to overall level of certainty of end use energy data. (Medium=Orange, Low=Red)
As MELs (and the broader category of plug-in equipment as a whole) become an increasingly large component of
building energy use, it is critically important that MELs energy usage is accurately represented in ZNE models.
Inaccurate modeling will create one of two undesirable outcomes: a) If plug-in equipment energy use is
significantly higher than modeled, the home will not actually be ZNE; or b) if plug-in equipment energy use is
significantly lower than modeled, developers will be required to unnecessarily increase the size of the rooftop PV
system, which presents additional cost to the developer. While this study does not quantify the impact on ZNE
modeling absent this true-up, the potential implications are sufficiently large to warrant future study.
The broader issue of plug-load modeling centers around three points:
1) How to incorporate MELs and other plug loads into the existing HERS model,
2) How to collect MEL data on an ongoing basis and integrate updated data into the HERS model; and
3) How to assess the accuracy of this data.
7
We believe that this study provides a useful framework for assessing study accuracy and the start of developing
higher resolution estimates of MELs. Our recommendations focus on the first two points above1 and are separated
into “Next Steps” and “M&E Research Roadmap Recommendations”.
Next Step Recommendations
Recommendation #1: Update the HERS model to incorporate large MEL end-uses
We estimate that the twelve end uses described in detail in this report account for roughly 60-70% of household
MEL energy consumption. However, based on the 2008 Home Energy Rating System (HERS) technical manual,
miscellaneous electricity consumption is modeled as a function of square footage, and the only plug loads that are
individually modeled are refrigerator/freezers, dishwashers, clothes dryers, clothes washers, and range/ovens.2
The current ZNE modeling equation does not disaggregate within this broad MEL category, which does not allow
for developing individual MEL estimates or refining them over time as they change. We recommend that the next
version of the HERS model be updated to individually account for major MELs. At a minimum, this would include
televisions but would ideally be extended to other MELs with high AEC values and a large installed base, including,
but not limited to, desktop and notebook computers, set top boxes, network equipment, and microwaves. In
addition, we recommend that the Investor-owned Utilities (IOUs) engage Non-Intrusive Load Monitoring (NILM)
technology vendors to discuss the feasibility of modeling large, non-MEL end uses to better understand the
fractional home energy use of MELs.
Recommendation #2: Develop a Stock-Flow model to inform ZNE modeling efforts
Most MELs, especially consumer electronic (CE) devices, experience rapid product turnover and require frequent
updates to maintain accurate estimates of usage, power, and installed base. Therefore, accurate modeling of CE
devices requires an understanding of both existing stock energy use and how that stock energy use is expected to
change over time. For example, TVs have by far the highest energy consumption of all MELs, both in terms of UEC
and AEC. However, new TVs coming to market are highly efficient, and Active Mode Power for new TVs has
decreased by approximately 65% during the 2008-2013. By 2020, a significant portion of the existing TV stock will
have turned over and be composed of products purchased in 2014 or later, and therefore TV stock energy use will
be substantially smaller than it is today. To accurately model and forecast future energy use, we recommend
creating a stock-flow analysis a major MELs to model how new products coming to market will impact stock energy
use over time. This consists of identifying the following:
- How technology usage patterns change over time,
- How power draw of new products entering the market changes over time, and
1 While our recommendations our focused on improving ZNE modeling efforts, these recommendations also have implications
for utility efficiency programs. While not discussed in detail here, a number of these strategies are outlined in the Northeast Energy Efficiency Partnership’s (NEEP) 2013 Business and Consumer Electronics Strategy document. https://neep.org/Assets/uploads/files/market-strategies/BCE/2013%20BCE%20Strategy_FINAL.pdf 2 See Section 4.5.6, Equation 10 in CEC 2008. http://www.energy.ca.gov/2008publications/CEC-400-2008-012/CEC-400-2008-
012-CMF.PDF
8
- The flow of products into the home and how they affect the installed base (Do they increase the installed
base or provide a straight replacement of older products? Do certain devices replace other device types –
such as a notebook or tablet replacing a TV and/or stereo.).
This stock-flow analysis is especially important to improve energy use estimates for end uses with medium
confidence levels. For these end uses, there is a limited opportunity to improve upon existing estimates without a
large-scale, comprehensive metering assessment that provides a higher degree of data resolution (see
Recommendation #6). A stock-flow analysis can provide additional resolution for ZNE modeling without
undertaking a large-scale, comprehensive metering assessment. While we recommend this as a next step, we
believe it should also be considered as part of longer-term M&E research.
Recommendation #3: Improve existing data for MELs with low levels of confidence
For products with limited existing data on usage, power, and/or installed base, we recommend updating current
estimates to better characterize existing energy use. To improve usage and power data, we recommend obtaining
this data from large-scale metering studies instead of user surveys due to the limitations of survey data to
accurately reflect actual usage for smaller consumer electronics. For installed base and saturation data, we
recommend using saturation data from the forthcoming 2012 California Lighting and Appliance Saturation Survey
(CLASS) (KEMA 2014).
Recommendation #4: Work with ENERGY STAR and other stakeholders to improve energy
information for non-ENERGY STAR products
A major challenge in modeling MEL energy consumption is the very limited data for non-ENERGY STAR models.
Developing a better understanding of the energy use of an entire product category is a critical component of
developing a stock-flow model, as well understanding potential energy savings opportunities for future utility
programs. While ENERGY STAR typically lists energy data for qualifying products, there is very little data on non-
qualifying models entering the market. In some cases, especially Audio / Video devices, the little data that is
available is limited and often has a low level of certainty. We recommend working with EPA and other stakeholders
to identify opportunities to improve the existing knowledge base of non-qualifying products coming to market.
M&E Research Roadmap Recommendations
Recommendation #5: Support a Market Transformation (MT) approach to address MEL energy
consumption
As the ZNE Technical Feasibility Study (PG&E 2012) highlights, reducing plug load energy consumption is a critical
component to achieving ZNE goals. The unique challenge with plug loads, and MELs in particular, is that with the
exception of a few large end uses such as TVs, Set Top Boxes, and Desktop and Notebook Computers, MEL energy
use is highly distributed. As these three major end uses decrease in their UEC and/or installed base, MEL energy
use will become even more broadly dispersed. This wide distribution across devices and minimal per-unit energy
savings limits the effectiveness of traditional utility program mechanisms and is a key challenge for ZNE buildings.
Due to the limited per-unit savings, an incentive-based, resource-acquisition program for MELs may have limited
success if not coupled with a broader, market transformation approach.

9
We recommend supporting a market transformation (MT) approach which attempts to create large-scale changes
in aggregate. Although most MELs have low energy consumption, many MELs, particularly CE devices, have high
sales volumes and therefore significant change can be achieved by addressing the market as a whole. This includes,
but is not limited to:
- Collaborating with utilities, efficiency organizations, and other stakeholders to improve the collective
understanding of MEL energy use (see Recommendation #6)
- Participating in the ENERGY STAR specification revision process to update existing product specifications.
- Engaging manufacturers to identify efficiency opportunities in product design.
- Engaging retailers by offering incentives to stock and sell high efficiency products
- Improving energy labeling for CE devices (see Recommendation #7)
This MT approach is focused on achieving change at a national level, and therefore we recommend that the IOUs
partner with other utilities and efficiency organizations to achieve economies of scale in addressing MEL energy
use.
Recommendation #6: Consider conducting a large-scale, multi-year comprehensive metering study to
improve plug load energy data within California
The Northwest Energy Efficiency Alliance (NEEA) is currently conducting a large-scale, multi-year metering study
which measures home energy use for 100 homes throughout the Northwest. This study meters the vast majority of
end-uses within the home, covering an estimated 80% of total load. This study will provide valuable information on
usage patterns and device power consumption, and preliminary findings were recently released in late April 2014.3
We are not aware of any existing metering studies within California that measure end use usage and power at this
level of granularity, scale or monitoring duration.4 We recommend that the IOUs consider conducting a study
similar to NEEA’s within California. However, we recommend that the IOUs review the NEEA study reports and
lessons learned prior to considering a similar effort in California. NEEA’s study began in March 2012, and therefore
implementing a similar study in 2016-17 could provide valuable information on how energy consumption within
the home has changed over time.5
Recommendation #7: Encourage policies to promote the measurement of power data for CE devices
through minimum efficiency standards and labeling.
Most MEL products do not have any labeling or energy consumption measurement requirements, and it is
therefore difficult to quantify the energy consumption of small MELs entering the market. This lack of energy
information is key barrier in successfully achieving market transformation of MELs. We recommend that the IOUs
continue to advocate for CE labeling policies and minimum efficiency standards for MELs, particularly consumer
electronics products.
3 The values from the NEEA study are not included in this study due to the timing of its release in late April.
http://neea.org/docs/default-source/reports/residential-building-stock-assessment--metering-study.pdf?sfvrsn=6 4 Although the CLASS study (KEMA 2014) does provide information on device saturation, it does not include long-term
metering data on usage and power draw. 5 This primarily relates to CE devices which are expected to have minimal geographic variation in power or usage.
10
2. Introduction
Energy consumption from Miscellaneous Energy Loads (MELs) is growing faster than any other end use category,
and has offset some of the efficiency gains made in lighting, HVAC, and water heating (EIA 2013). MEL load growth
is largely due to the introduction of new electrical devices in households, with little coverage by efficiency
standards (EIA 2013). A recent study on the technical feasibility of achieving Zero Net Energy (ZNE) Buildings in
California noted that “as more permanent subcomponents of a building continue to improve in efficiency
(envelope, HVAC, and lighting) the remaining plug loads6 are becoming a larger and larger portion of the overall
load. In this ‘stress test’ of Zero Net Energy design objectives, reducing the plug loads often proved critical to
meeting the overall energy use targets” (PG&E 2012: 51, emphasis added). While decreasing MEL energy use is
critical to achieving California’s ZNE goals and energy reduction targets, the energy use of MELs is not well
understood. Key uncertainties include accurately modeling device usage, power draw (both present and future),
and the continued growth in the number of plug load devices in homes. This lack of understanding makes MEL
energy consumption far more uncertain than more traditional end-uses such as HVAC, lighting, and appliances, and
poses significant cost and risk when modeling and sizing of ZNE buildings.
Historically, it has been difficult to develop precise estimates of MEL energy use due to a lack of comprehensive
and current data. The highly distributed nature of MEL energy use makes it time consuming and expensive to
collect meaningful data across the wide number of end uses. In addition, consumer electronics, an important
subset of MELs, are rapidly changing both in functionality and energy consumption, and data collected can become
quickly outdated. A number of recent studies (ACEEE 2013, Fraunhofer 2011, LBNL 2011, and TIAX 2007) used best
available data to characterize energy use both at a unit-level and an aggregate, national level for the most common
and energy intensive MELs. However, because the literature on MEL energy consumption is so limited, even the
best available information may have significant uncertainty or limited applicability to the current stock. This lack of
certainty in MEL data poses a significant challenge for ZNE planning, and without a detailed review of the primary
data underlying each MEL estimate, it is difficult to reliably incorporate this information into the ZNE modeling
process. For example, the current California Home Energy Rating System (HERS) model—the primary source for
measuring residential ZNE compliance—could be improved to more accurately scale MEL energy use based on
building square footage. A mechanism to account for future MEL codes and standards in the HERS model is also
needed.7
The purpose of this study is to conduct a literature review of existing MEL studies in residential buildings8 and
identify the underlying methodologies used to determine MEL estimates. Based on this information, we develop
best available energy estimates, identify gaps in existing information, and develop recommendations for future
6 While the ZNE Technical Feasibility Study uses the terms ‘Plug Loads’ and ‘MEL’ interchangeably, we utilize the term MEL
because it more accurately represents the subset of plug in equipment composed primarily of smaller end uses, and excludes larger plug-in equipment such as large appliances (with some notable exceptions, such as televisions). A detailed definition of the term ‘MEL’ is presented in the methodology section. 7 The California Energy Commission has identified this as a need for the next version of the HERS model.
8 Unless specifically noted as single-family or multi-family residential, all estimates are assumed to be drawn from
representative samples of the entire residential sector as a whole.
11
study. In addition, we provide an overview of existing load disaggregation techniques using Non-Intrusive Load
Monitoring (NILM), which have the potential to improve the accuracy and lower the costs of estimating end use
energy consumption. It is important to note that this literature review is, by nature, a backward looking study, and
does not reflect the most up-to-date usage or energy consumption of new devices coming to market; rather, it is a
review of existing estimates to clarify the uncertainty of existing data and identify best available information for
existing stock.
2.1 Project Scope This study consists of four components:
a) Developing and prioritizing an initial list of MELs for review, based on energy consumption, relative
uncertainty, and interest from IOU stakeholders.
b) For each selected MEL, conducting a literature review of all recent studies estimating energy
consumption, including a review of their original data sources. This review evaluates both the study
methodology and estimates of the power, usage, and installed base of each MEL.
c) Completing a comparative analysis of MEL data sources to identify best estimates of MEL energy
consumption, gaps in existing information, and recommendations for further study.
d) Conducting a literature review of existing Non-Intrusive Load Monitoring (NILM) methods and
identifying their relative cost, accuracy, and applicability for future estimates of residential MEL energy
consumption.
Due to the limited scope of this study, it does not include original, primary research on MEL energy use or
significant manipulation of existing study data.9 In addition, although the study does discuss how individual MEL
energy use is expected to change over time and identify recommendations for further study, it does not include
quantitative forecasting of future MEL energy use.
9 In a limited number of cases, we extrapolate on existing primary data to develop new estimates. For example, if a study
identifies average daily usage, we multiply the number by 365 to develop an annual usage estimate if it is clear that this can be confidently extrapolated into an annual usage estimate. However, we do not make estimates if we are not confident that our extrapolation is an accurate reflection of the primary data.
12
3. Methodology
3.1 Developing a working definition of MELs There is not a universally accepted definition of MELs, and definitions of MELs have changed over time.10 Our
definition of MEL is adopted from the ACEEE report Miscellaneous Energy Loads in Buildings (ACEEE 2013). ACEEE
2013 outlines ‘critical building functions’ (e.g., providing shelter, lighting, comfortable heating, cooling and
ventilation) and ‘principal building activity’ (e.g., the primary purpose of a bank is to provide financial services, a
home is to provide shelter and sustenance). All other devices that are introduced which do not serve the building’s
critical functions or principal activity can be classified as MELs. For example, a stove does not serve a critical
building function, but cooking food is a principal activity of the home, and therefore a stove is not an MEL.
However, supplemental cooking devices, such as a microwave or toaster, may be considered an MEL, since they
are not a primary cooking device found within the home (ACEEE 2013). It is important to note that while there is
general agreement on the definition for single function MELs such as Irons, Toasters, Coffee Machines, products
with distinct subcategories, such as Imaging Equipment or Set Top Boxes, may have different definitions and
different methods of splitting out associated subcategories. For example, some studies may include DVD Players
and Blu-Ray players in one estimate while others create distinct estimates for each. Where applicable, we attempt
to clarify definitions or subcategories to indicate that numbers cannot be compared directly.
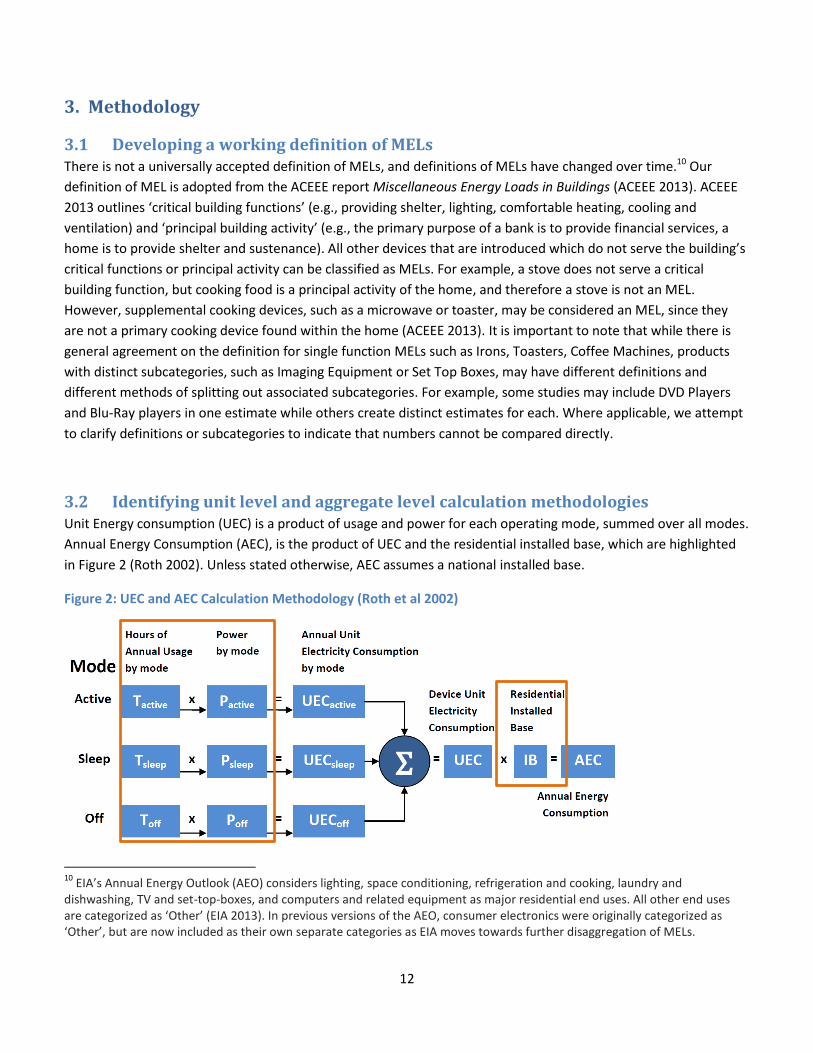
3.2 Identifying unit level and aggregate level calculation methodologies Unit Energy consumption (UEC) is a product of usage and power for each operating mode, summed over all modes.
Annual Energy Consumption (AEC), is the product of UEC and the residential installed base, which are highlighted
in Figure 2 (Roth 2002). Unless stated otherwise, AEC assumes a national installed base.
Figure 2: UEC and AEC Calculation Methodology (Roth et al 2002)
10
EIA’s Annual Energy Outlook (AEO) considers lighting, space conditioning, refrigeration and cooking, laundry and dishwashing, TV and set-top-boxes, and computers and related equipment as major residential end uses. All other end uses are categorized as ‘Other’ (EIA 2013). In previous versions of the AEO, consumer electronics were originally categorized as ‘Other’, but are now included as their own separate categories as EIA moves towards further disaggregation of MELs.
13
While numerous studies provide UEC and AEC estimates for a wide variety of MELs, most MELs have significant
uncertainty for usage, power, or installed base due to the lack of robust or updated data. In some cases, the
variance between individual estimates of usage, power, and installed base may be masked when they are rolled up
and compared as a UEC or AEC value. We address this ambiguity by comparing usage, power, and installed base on
an individual basis instead of as a rolled up UEC or AEC value.
3.3 Prioritizing a subset of MELs for further review The broader residential MEL end use category is comprised of hundreds of devices. Each of these products has
varying degrees of household penetration and UEC. For example, cordless phones have high saturation but
relatively low UEC. Wine chillers may have low saturation but a high UEC. For the purposes of this study, we
prioritized products by their AEC because ZNE modeling focuses on device saturation in an average home.
However, we adopted UEC as a secondary filter because products with high UEC values are typically the best
candidates for utility efficiency programs.
We prioritized MELs by evaluating four recent reports on MEL: ACEEE 2013, Fraunhofer 2011, LBNL 2011, and TIAX
2007, which collectively provide energy estimates for roughly 60 distinct end uses. Based on this list of products,
we ranked each MEL by national AEC (TWh/year), as well as a secondary ranking UEC (kWh/yr). End uses were then
divided into two tiers, primary and secondary, to prioritize end uses. After ranking end uses by AEC, they were
prioritized based on the likelihood of significant growth in terms of UEC or saturation. For example, some of the
smaller consumer electronic devices, such as notebook computers and network equipment, were prioritized as
part of Tier 1 due to their potential for significant future load growth. Conversely, devices with resistive heating
elements, such as portable space heaters, irons, and toasters, were de-prioritized because it is unlikely that their
usage, power, or installed base will change significantly, and they are less of a concern for ZNE modeling purposes.
The finalized list of Tier 1 and Tier 2 products are listed in in the table below.

14
Table 1: Tier 1 and Tier 2 MELs ranked by Annual Energy Consumption (AEC) and Unit Energy Consumption (UEC)
1: Estimates based on an average of ACEEE 2013, LBNL 2011, Fraunhofer 2011, and TIAX 2007.
3.4 Data Collection For each MEL selected for further study, we identified all publically available, recent studies that estimated MEL
energy use. Although the term ‘recent’ is relative to each end use based on its effective useful life and the degree
of recent technological change, our goal was to capture all key sources for stock estimates within the last six
years.11 However, we attempted to include studies prior to 2008 if we considered them especially important, or if a
more recent study had cited them as a source of their data. For example, we included TIAX 2007 and TIAX 2006
because they are widely cited in MEL literature.
Across the twenty MEL categories selected, we reviewed over 120 distinct sources and identified the underlying
study methodology and drivers of MEL energy consumption.12 For each study, we identified all key sources that
were used to develop the UEC and AEC estimates and reviewed these referenced studies. If publically available, we
obtained the referenced studies and reviewed their respective methodologies to understand how they developed
their UEC and AEC estimates. To the extent possible, we repeated this process until we arrived at primary data or
references that were not publically available. Charting this network of studies, we developed a tree of data
dependency to identify the linkages in developing study estimates. For example, Fraunhofer 2011’s estimate for
Audio Receivers usage is based on Foster-Porter et al 2006. Foster-Porter et al 2006 is an original metering study,
11
Tablets and mobile phones have achieved widespread adoption in recent years, and therefore their energy use is likely underrepresented in Table 1. 12
Many of the studies referenced include estimates for multiple MELs, and therefore the sum of total studies referenced per end use category is significantly greater than 120.
List # Plug Load ApplianceAverage of Previous
AEC Estimates
(TWh/yr)
Average of Previous
UEC Estimates
(kWh/yr)Tier 1 1 Televisions 72.2 213
2 Set top boxes 28.0 152
3 Desktop Computers 28.8 220
4 Microwaves 14.7 158
5 Monitors 11.2 69
6 DVD/Blu-Ray Players 8.5 45
7 Video Game Consoles 8.0 135
8 Audio Receivers 6.4 65
9 Compact Audio 6.3 93
10 Notebooks (portable PCs) 4.5 48
11 Home Theater in a box 2.5 90
12 Network Equipment 2.2 53
Tier 2 13 Portable Space Heaters 10.0 500
14 Cordless Phones 7.3 28
15 Air Cleaners 6.0 300
16 Iron 5.6 53
17 Toasters 5.4 32
18 Portable Vacuum Cleaners 5.2 55
19 Mobile Phones / Tablets 1.0 5
20 Printer and MFDs 1.8 12

15
and the creator of original data. In this instance, we review both Fraunhofer and Foster-Porter’s study
methodologies to determine how they derive their estimates.
3.5 Classifying MEL study methodologies For each source, we identified key components of the study methodology which are most likely to influence
estimates of MEL usage, power draw, and installed base. These include:
- Study Type
- Study Year
- Sample Size
- Monitoring Duration (if a metering study)
For the purposes of this study, we divided study types into the following categories using the following definitions:
User Survey: A study which solicits user feedback in the form of a survey (via phone, e-mail, mail, in-home, in-
store, etc.) to develop their estimates.
Metering: A study which conducts in-situ metering measurements of stock equipment. This method does not
typically follow specified test methods used in manufacturer or independent test labs for ENERGY STAR
qualification.
Dataset: A study which analyzes a dataset, such as ENERGY STAR or manufacturer test data. This method typically
follows specified test methods used in manufacturer or independent test labs for ENERGY STAR qualification.
Market Research: A study which is based on historic sales transaction data or the forecast of future sales.
Literature Review: A study whose primary purpose is to review existing estimates and does not consist of its own
primary research.
Other: All other sources which do not fall into the categories above.
In addition, each study type may be classified as “modified” or “unmodified”. An unmodified reference is a direct
pass through of numbers, while a modified reference cites a previous source and then builds on that estimate to
develop its own value. For example, ACEEE 2013’s UEC estimate for TVs is a literature review of LBNL 2011,
Fraunhofer 2011, and TIAX 2007. However, it modifies their values by averaging three UEC values together. In this
case, we characterize ACEEE 2013’s UEC estimate as a “Literature Review – Modified”. In addition, we sought to
identify product-specific differences in samples which might influence estimates between the studies, such as TV
screen size. Based on the criteria above, each study was given a qualitative ranking of Low, Medium or High, based
on the study’s relevance, sampling methodology, sample size, and overall applicability to the current stock.13 This
ranking considers study publication date, the rate of technological change that has occurred since the publication
date, and the relative accuracy we would expect based on the specific study type. For example, the most accurate
13
ACEEE 2013 developed a ranking criteria of end uses by Level of Agreement: High: Two or more sources within close range; Medium: Two or more sources with wide range; and Low: Only one source of information. Our ranking does not focus on level of agreement, but rather on the confidence of the study results based on underlying study methodology.
16
method of determining device usage and power is through an extensive metering study with both a large sample
size and long duration. The next best method is a large survey or metering study with a smaller sample size or
duration. Based on this evaluation, we identify the most applicable sources and recommended values for usage,
power, and installed base for each end use. We integrate these various values to develop new UEC and AEC
estimates.
How to interpret summary tables presented in this report
Each table provides a summary of the basic information of the study, which includes:
- Key sources
- Method in which data was collected
- Study sample size and/or metering duration
- Results presented in that study
- Overall applicability to the current stock
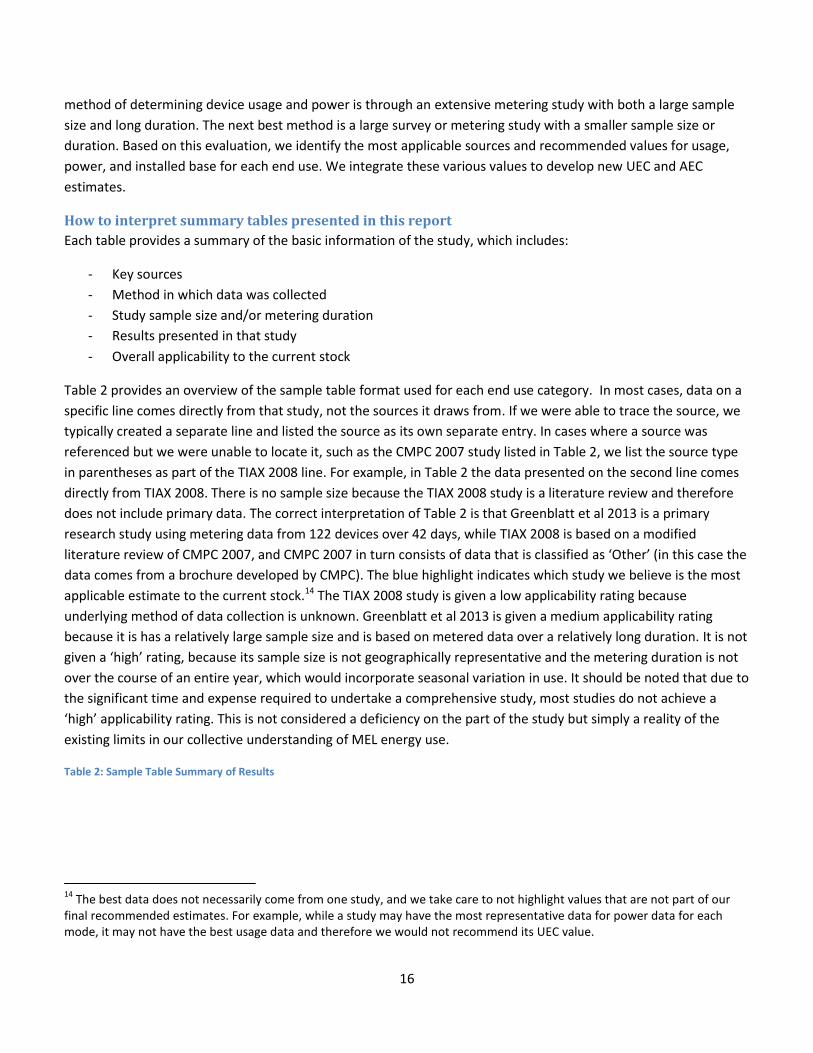
Table 2 provides an overview of the sample table format used for each end use category. In most cases, data on a
specific line comes directly from that study, not the sources it draws from. If we were able to trace the source, we
typically created a separate line and listed the source as its own separate entry. In cases where a source was
referenced but we were unable to locate it, such as the CMPC 2007 study listed in Table 2, we list the source type
in parentheses as part of the TIAX 2008 line. For example, in Table 2 the data presented on the second line comes
directly from TIAX 2008. There is no sample size because the TIAX 2008 study is a literature review and therefore
does not include primary data. The correct interpretation of Table 2 is that Greenblatt et al 2013 is a primary
research study using metering data from 122 devices over 42 days, while TIAX 2008 is based on a modified
literature review of CMPC 2007, and CMPC 2007 in turn consists of data that is classified as ‘Other’ (in this case the
data comes from a brochure developed by CMPC). The blue highlight indicates which study we believe is the most
applicable estimate to the current stock.14 The TIAX 2008 study is given a low applicability rating because
underlying method of data collection is unknown. Greenblatt et al 2013 is given a medium applicability rating
because it is has a relatively large sample size and is based on metered data over a relatively long duration. It is not
given a ‘high’ rating, because its sample size is not geographically representative and the metering duration is not
over the course of an entire year, which would incorporate seasonal variation in use. It should be noted that due to
the significant time and expense required to undertake a comprehensive study, most studies do not achieve a
‘high’ applicability rating. This is not considered a deficiency on the part of the study but simply a reality of the
existing limits in our collective understanding of MEL energy use.
Table 2: Sample Table Summary of Results
14
The best data does not necessarily come from one study, and we take care to not highlight values that are not part of our final recommended estimates. For example, while a study may have the most representative data for power data for each mode, it may not have the best usage data and therefore we would not recommend its UEC value.
17
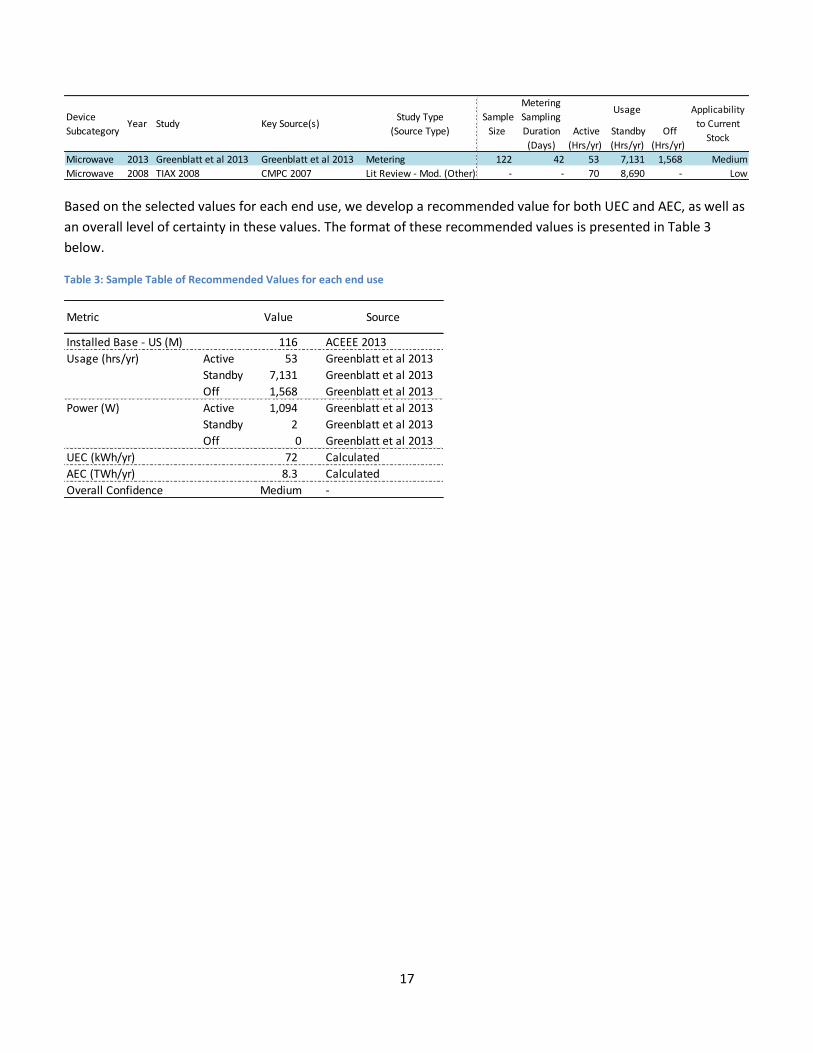
Based on the selected values for each end use, we develop a recommended value for both UEC and AEC, as well as
an overall level of certainty in these values. The format of these recommended values is presented in Table 3
below.
Table 3: Sample Table of Recommended Values for each end use
Active
(Hrs/yr)
Standby
(Hrs/yr)
Off
(Hrs/yr)
Microwave 2013 Greenblatt et al 2013 Greenblatt et al 2013 Metering 122 42 53 7,131 1,568 Medium
Microwave 2008 TIAX 2008 CMPC 2007 Lit Review - Mod. (Other) - - 70 8,690 - Low
Device
SubcategoryYear Study Key Source(s)
Study Type
(Source Type)
Sample
Size
Metering
Sampling
Duration
(Days)
Usage Applicability
to Current
Stock
Metric Value Source
Installed Base - US (M) 116 ACEEE 2013
Usage (hrs/yr) Active 53 Greenblatt et al 2013
Standby 7,131 Greenblatt et al 2013
Off 1,568 Greenblatt et al 2013
Power (W) Active 1,094 Greenblatt et al 2013
Standby 2 Greenblatt et al 2013
Off 0 Greenblatt et al 2013
UEC (kWh/yr) 72 Calculated
AEC (TWh/yr) 8.3 Calculated
Overall Confidence Medium -
18
4. Literature Review of Selected Residential MEL Devices This section provides an in-depth review of the twelve Tier 1 MELs selected in this study. Summary Tables of Tier 2
devices are included in the Appendix. Each section consists of an overview of device usage, power, and installed
base estimates provided in summary tables, as well as recommended values based on the strength of their
underlying study methodology and its overall applicability to the current stock. We provide a roll-up of these
recommended values into new UEC and AEC estimates. Finally, we discuss gaps in existing information,
opportunities for further research, and implications for ZNE planning.
4.1 Televisions Overview: Televisions are one of the most widely studied MELs both in terms of existing stock and new products
coming to market. New products are regulated under California’s Appliance Efficiency Standard (Title 20) and are
part of an ongoing Federal Appliance Standards Rulemaking. ENERGY STAR has developed six versions of its TV
specification and the Federal Trade Commission mandates Energy Guide labeling. Traditionally, TVs have had two
operating modes, Active and Standby.15 Television energy consumption occurs almost entirely in Active Mode, and
therefore most studies focus on active mode power.
Usage
Overview: TV usage estimates vary substantially, ranging from 1,387-2,467 hours per year in Active Mode—a 1.8
factor difference between the minimum and maximum value. The Table below summarizes the studies reviewed
for TV usage estimates. Of these thirteen studies, two distinguish between digital and analog televisions (TIAX 2007
and TIAX 2008); the others address the entire market as a whole. While these values reflect average usage across
all TVs within a house, many of these individual studies also provide usage estimates for individual TVs within the
house (primary and non-primary TVs).
Across the studies, much of the variation in usage results can be attributed to differences in study methodology. In
this case, provided there is a sufficiently large sample size for metering studies, metering is preferred to survey
data due to common survey limitations, including social desirability bias, memory recall and multi-tasking (DOE
2012).
15
An increasing number of TVs have integrated network connectivity while in Standby mode.

19
Table 4: Key Sources for Television Usage estimates
Recommended Values: Based on our review, the most applicable study is DOE 2012, which is based on Nielsen
usage data and cites a value of 2,008 hours per year in active mode. This Nielsen data was part of DOE’s usage
analysis conducted for its proposed Television rulemaking.16 Data was taken from a Nielsen household survey data
in which metering devices were placed on each television within a participating household for four years (DOE
2012). This is an estimated average for all TVs in the house; whereas primary TV usage (2,557 hrs/yr) is
significantly higher and non-primary TV usage (913 hrs/yr) is significantly lower. Although there are many recent
studies which estimate usage hours with phone or in-home surveys, DOE 2012 is the most applicable due to its
large sample size and the use of metering data over an extended period of time (four years).
Applicability to Current Stock: Due to its comprehensiveness, we have high confidence in DOE 2012’s applicability
to the current TV stock.
Power
Overview: Active mode power estimates range from 75 to 192W. However, studies after 2010 show more
agreement, ranging from 91 to 127 W, or a 1.4 factor difference. The four recent metering studies, Greenblatt et al
2013, NEEA 2013, NEEA 2012 and Bensch et al 2010, show relative agreement in Active Mode Power, and the
variance among them may be attributed to differences in stock vintage, screen size and display type.17 There is
significant uncertainty in the accuracy of Active Mode Power draw due to the rapid transition from CRTs to flat
screen technologies such as plasma and LCD. While screen size has significantly increased, energy intensity (Watts
per square inch) has rapidly declined since 2008.
Recommended Values: For Active Mode Power, we recommend using NEEA 2012 due to its large sample size and
recent study date. However, this study does not have values for Standby Power. For Standby Mode, we
recommend Greenblatt et al 2013 due to its recent data and significant sample size.
16
Notice of Proposed Rulemaking. For more information on the TV NOPR, see: http://www1.eere.energy.gov/buildings/appliance_standards/product.aspx/productid/34 17
Bensch et al 2010 appears to be considerably lower due to the smaller average screen size of TV models tested.
Active
(Hrs/yr)
Standby
(Hrs/yr)
TVs 2013 ACEEE 2013 Fraunhofer 2011 Lit Review - Umod. - 1,392 7,368 Medium
TVs 2013 EIA 2013 Unknown Lit Review - Mod. - - 1,460 7,300 Medium
TVs 2013 NEEA 2013 NEEA 2013 Survey 537 - 2,467 6,293 Medium
TVs 2012 NEEA 2012 NEEA 2012 Survey 1,343 - 1,967 6,793 Medium
TVs 2012 Nielsen 2012a Nielsen 2012a Survey 4,540 - 1,862 6,898 High
TVs 2012 DOE 2012 Nielsen 2012b, EIA 2009 Lit. Review Mod. (Metering) 20,950 1460 2,008 6,753 High
TVs 2011 Fraunhofer 2011 Fraunhofer 2011 Survey 1,000 - 1,392 7,368 Medium
TVs 2010 Bensch et al 2010 Bensch et al 2010 Metering 108 27 1,278 7,483 Medium
TVs - Digital 2008 Tiax 2008 Tiax 2007 Lit. Review - Mod. - - 1,900 6,860 Medium
TVs - Analog 2008 Tiax 2008 Tiax 2007 Lit. Review - Mod. - - 1,900 6,860 Medium
TVs - Digital 2007 Tiax 2007 Tiax 2007 Survey 2,000 - 2,120 6,640 Medium
TVs - Analog 2007 Tiax 2007 Tiax 2007 Survey 2,000 - 1,882 6,878 Medium
TVs 2006 Foster Porter et al 2006 Foster Porter et al 2006 Metering 107 7 1,578 7,182 Low
TVs - Analog 1999 Rosen and Meier 1999 Nielsen 1998, Media Dynamics 1998 (Survey) - Mod. Unknown Unknown 1,443 7,317 Low
Device
SubcategoryYear Study Key Source(s) Study Type (Source Type)
Sample
Size
Metering
Sampling
Duration
(Days)
Usage Applicability
to Current
Stock
20
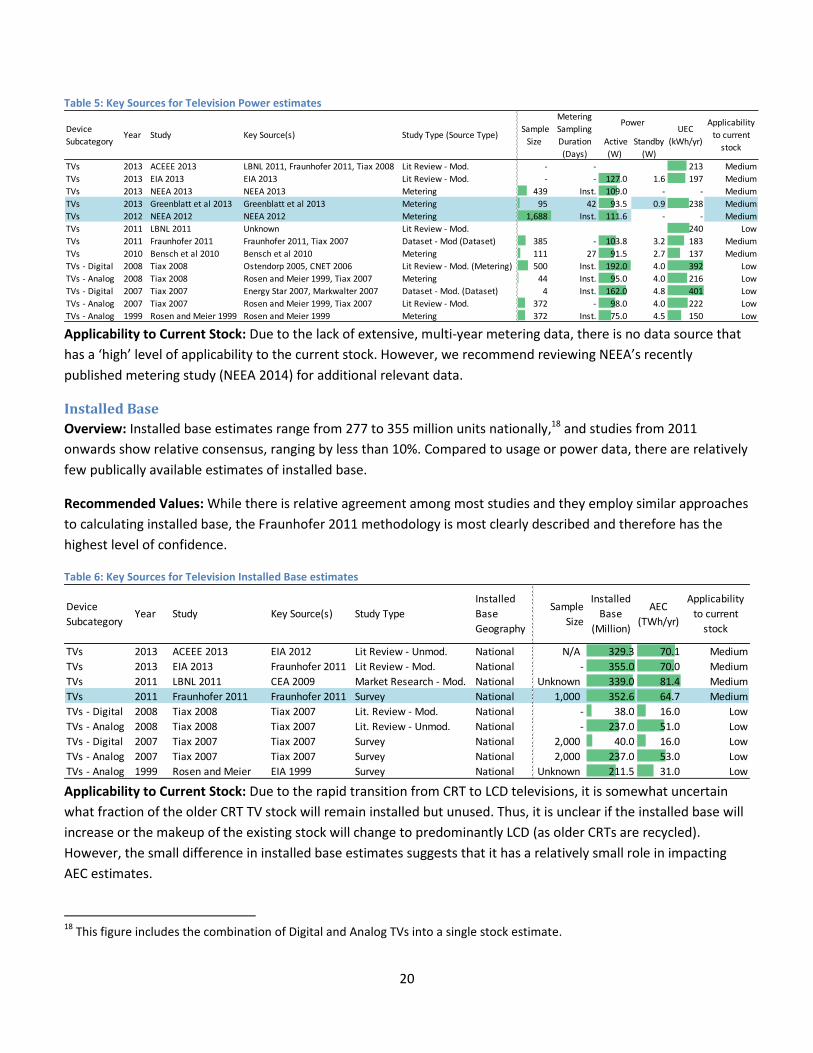
Table 5: Key Sources for Television Power estimates
Applicability to Current Stock: Due to the lack of extensive, multi-year metering data, there is no data source that
has a ‘high’ level of applicability to the current stock. However, we recommend reviewing NEEA’s recently
published metering study (NEEA 2014) for additional relevant data.
Installed Base
Overview: Installed base estimates range from 277 to 355 million units nationally,18 and studies from 2011
onwards show relative consensus, ranging by less than 10%. Compared to usage or power data, there are relatively
few publically available estimates of installed base.
Recommended Values: While there is relative agreement among most studies and they employ similar approaches
to calculating installed base, the Fraunhofer 2011 methodology is most clearly described and therefore has the
highest level of confidence.
Table 6: Key Sources for Television Installed Base estimates
Applicability to Current Stock: Due to the rapid transition from CRT to LCD televisions, it is somewhat uncertain
what fraction of the older CRT TV stock will remain installed but unused. Thus, it is unclear if the installed base will
increase or the makeup of the existing stock will change to predominantly LCD (as older CRTs are recycled).
However, the small difference in installed base estimates suggests that it has a relatively small role in impacting
AEC estimates.
18
This figure includes the combination of Digital and Analog TVs into a single stock estimate.
Active
(W)
Standby
(W)
TVs 2013 ACEEE 2013 LBNL 2011, Fraunhofer 2011, Tiax 2008 Lit Review - Mod. - - 213 Medium
TVs 2013 EIA 2013 EIA 2013 Lit Review - Mod. - - 127.0 1.6 197 Medium
TVs 2013 NEEA 2013 NEEA 2013 Metering 439 Inst. 109.0 - - Medium
TVs 2013 Greenblatt et al 2013 Greenblatt et al 2013 Metering 95 42 93.5 0.9 238 Medium
TVs 2012 NEEA 2012 NEEA 2012 Metering 1,688 Inst. 111.6 - - Medium
TVs 2011 LBNL 2011 Unknown Lit Review - Mod. 240 Low
TVs 2011 Fraunhofer 2011 Fraunhofer 2011, Tiax 2007 Dataset - Mod (Dataset) 385 - 103.8 3.2 183 Medium
TVs 2010 Bensch et al 2010 Bensch et al 2010 Metering 111 27 91.5 2.7 137 Medium
TVs - Digital 2008 Tiax 2008 Ostendorp 2005, CNET 2006 Lit Review - Mod. (Metering) 500 Inst. 192.0 4.0 392 Low
TVs - Analog 2008 Tiax 2008 Rosen and Meier 1999, Tiax 2007 Metering 44 Inst. 95.0 4.0 216 Low
TVs - Digital 2007 Tiax 2007 Energy Star 2007, Markwalter 2007 Dataset - Mod. (Dataset) 4 Inst. 162.0 4.8 401 Low
TVs - Analog 2007 Tiax 2007 Rosen and Meier 1999, Tiax 2007 Lit Review - Mod. 372 - 98.0 4.0 222 Low
TVs - Analog 1999 Rosen and Meier 1999 Rosen and Meier 1999 Metering 372 Inst. 75.0 4.5 150 Low
Key Source(s) Study Type (Source Type) Sample
Size
Metering
Sampling
Duration
(Days)
Applicability
to current
stock
StudyDevice
SubcategoryYear
PowerUEC
(kWh/yr)
TVs 2013 ACEEE 2013 EIA 2012 Lit Review - Unmod. National N/A 329.3 70.1 Medium
TVs 2013 EIA 2013 Fraunhofer 2011 Lit Review - Mod. National - 355.0 70.0 Medium
TVs 2011 LBNL 2011 CEA 2009 Market Research - Mod. National Unknown 339.0 81.4 Medium
TVs 2011 Fraunhofer 2011 Fraunhofer 2011 Survey National 1,000 352.6 64.7 Medium
TVs - Digital 2008 Tiax 2008 Tiax 2007 Lit. Review - Mod. National - 38.0 16.0 Low
TVs - Analog 2008 Tiax 2008 Tiax 2007 Lit. Review - Unmod. National - 237.0 51.0 Low
TVs - Digital 2007 Tiax 2007 Tiax 2007 Survey National 2,000 40.0 16.0 Low
TVs - Analog 2007 Tiax 2007 Tiax 2007 Survey National 2,000 237.0 53.0 Low
TVs - Analog 1999 Rosen and Meier EIA 1999 Survey National Unknown 211.5 31.0 Low
AEC
(TWh/yr)Key Source(s) Study Type
Installed
Base
Geography
Sample
Size
Installed
Base
(Million)
Year Study
Applicability
to current
stock
Device
Subcategory
21
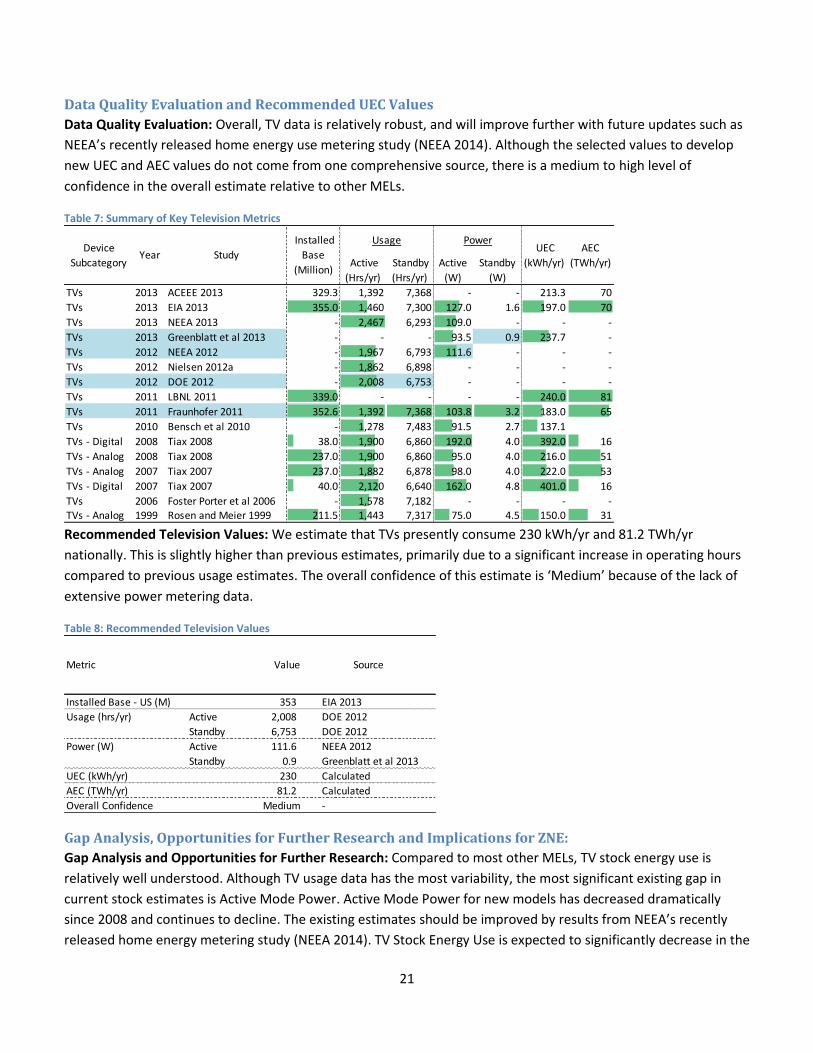
Data Quality Evaluation and Recommended UEC Values
Data Quality Evaluation: Overall, TV data is relatively robust, and will improve further with future updates such as
NEEA’s recently released home energy use metering study (NEEA 2014). Although the selected values to develop
new UEC and AEC values do not come from one comprehensive source, there is a medium to high level of
confidence in the overall estimate relative to other MELs.
Table 7: Summary of Key Television Metrics
Recommended Television Values: We estimate that TVs presently consume 230 kWh/yr and 81.2 TWh/yr
nationally. This is slightly higher than previous estimates, primarily due to a significant increase in operating hours
compared to previous usage estimates. The overall confidence of this estimate is ‘Medium’ because of the lack of
extensive power metering data.
Table 8: Recommended Television Values
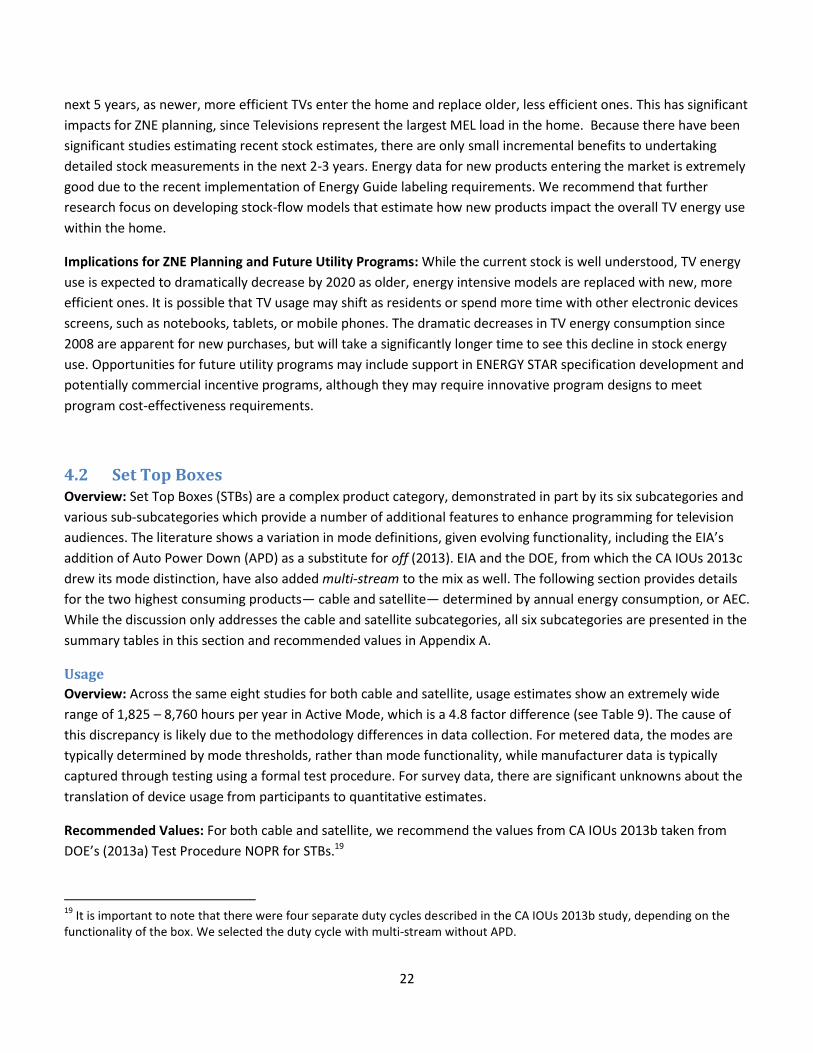
Gap Analysis, Opportunities for Further Research and Implications for ZNE:
Gap Analysis and Opportunities for Further Research: Compared to most other MELs, TV stock energy use is
relatively well understood. Although TV usage data has the most variability, the most significant existing gap in
current stock estimates is Active Mode Power. Active Mode Power for new models has decreased dramatically
since 2008 and continues to decline. The existing estimates should be improved by results from NEEA’s recently
released home energy metering study (NEEA 2014). TV Stock Energy Use is expected to significantly decrease in the
Active
(Hrs/yr)
Standby
(Hrs/yr)
Active
(W)
Standby
(W)
TVs 2013 ACEEE 2013 329.3 1,392 7,368 - - 213.3 70
TVs 2013 EIA 2013 355.0 1,460 7,300 127.0 1.6 197.0 70
TVs 2013 NEEA 2013 - 2,467 6,293 109.0 - - -
TVs 2013 Greenblatt et al 2013 - - - 93.5 0.9 237.7 -
TVs 2012 NEEA 2012 - 1,967 6,793 111.6 - - -
TVs 2012 Nielsen 2012a - 1,862 6,898 - - - -
TVs 2012 DOE 2012 - 2,008 6,753 - - - -
TVs 2011 LBNL 2011 339.0 - - - - 240.0 81
TVs 2011 Fraunhofer 2011 352.6 1,392 7,368 103.8 3.2 183.0 65
TVs 2010 Bensch et al 2010 - 1,278 7,483 91.5 2.7 137.1
TVs - Digital 2008 Tiax 2008 38.0 1,900 6,860 192.0 4.0 392.0 16
TVs - Analog 2008 Tiax 2008 237.0 1,900 6,860 95.0 4.0 216.0 51
TVs - Analog 2007 Tiax 2007 237.0 1,882 6,878 98.0 4.0 222.0 53
TVs - Digital 2007 Tiax 2007 40.0 2,120 6,640 162.0 4.8 401.0 16
TVs 2006 Foster Porter et al 2006 - 1,578 7,182 - - - -TVs - Analog 1999 Rosen and Meier 1999 211.5 1,443 7,317 75.0 4.5 150.0 31
Installed
Base
(Million)
Year Study
Usage Power UEC
(kWh/yr)
AEC
(TWh/yr)
Device
Subcategory
Installed Base - US (M) 353 EIA 2013
Usage (hrs/yr) Active 2,008 DOE 2012
Standby 6,753 DOE 2012
Power (W) Active 111.6 NEEA 2012
Standby 0.9 Greenblatt et al 2013
UEC (kWh/yr) 230 Calculated
AEC (TWh/yr) 81.2 Calculated
Overall Confidence Medium -
Metric Value Source
22
next 5 years, as newer, more efficient TVs enter the home and replace older, less efficient ones. This has significant
impacts for ZNE planning, since Televisions represent the largest MEL load in the home. Because there have been
significant studies estimating recent stock estimates, there are only small incremental benefits to undertaking
detailed stock measurements in the next 2-3 years. Energy data for new products entering the market is extremely
good due to the recent implementation of Energy Guide labeling requirements. We recommend that further
research focus on developing stock-flow models that estimate how new products impact the overall TV energy use
within the home.
Implications for ZNE Planning and Future Utility Programs: While the current stock is well understood, TV energy
use is expected to dramatically decrease by 2020 as older, energy intensive models are replaced with new, more
efficient ones. It is possible that TV usage may shift as residents or spend more time with other electronic devices
screens, such as notebooks, tablets, or mobile phones. The dramatic decreases in TV energy consumption since
2008 are apparent for new purchases, but will take a significantly longer time to see this decline in stock energy
use. Opportunities for future utility programs may include support in ENERGY STAR specification development and
potentially commercial incentive programs, although they may require innovative program designs to meet
program cost-effectiveness requirements.
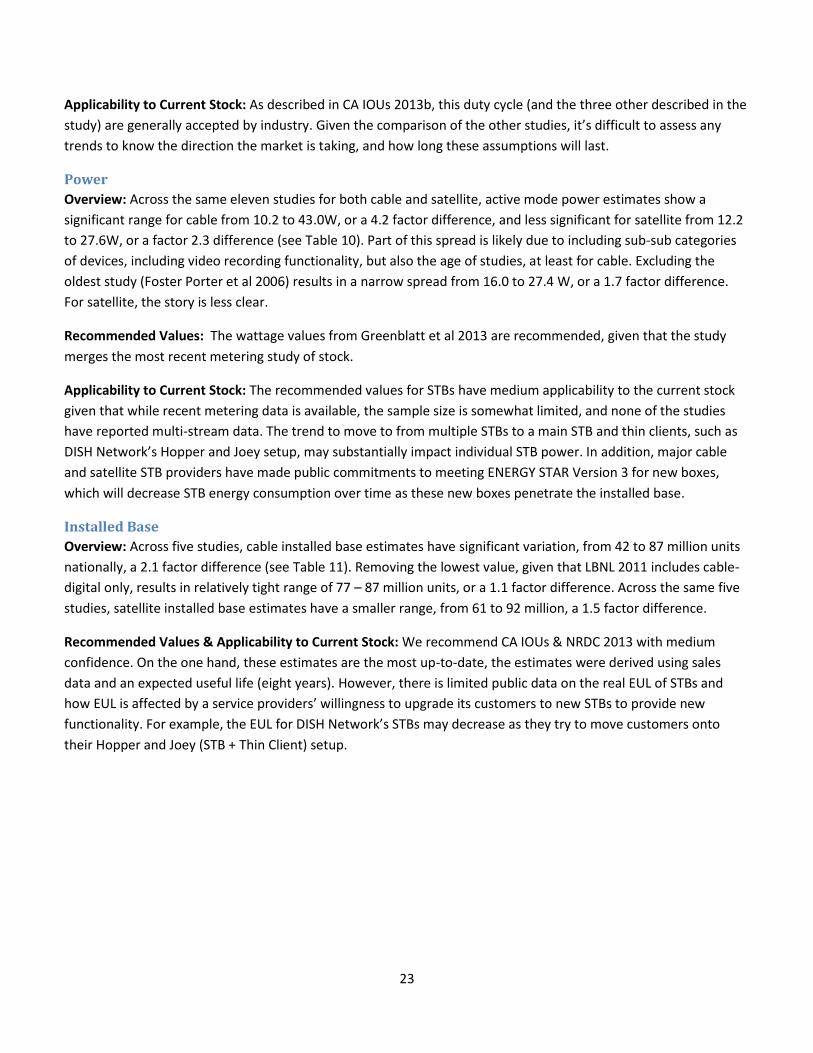
4.2 Set Top Boxes Overview: Set Top Boxes (STBs) are a complex product category, demonstrated in part by its six subcategories and
various sub-subcategories which provide a number of additional features to enhance programming for television
audiences. The literature shows a variation in mode definitions, given evolving functionality, including the EIA’s
addition of Auto Power Down (APD) as a substitute for off (2013). EIA and the DOE, from which the CA IOUs 2013c
drew its mode distinction, have also added multi-stream to the mix as well. The following section provides details
for the two highest consuming products— cable and satellite— determined by annual energy consumption, or AEC.
While the discussion only addresses the cable and satellite subcategories, all six subcategories are presented in the
summary tables in this section and recommended values in Appendix A.
Usage
Overview: Across the same eight studies for both cable and satellite, usage estimates show an extremely wide
range of 1,825 – 8,760 hours per year in Active Mode, which is a 4.8 factor difference (see Table 9). The cause of
this discrepancy is likely due to the methodology differences in data collection. For metered data, the modes are
typically determined by mode thresholds, rather than mode functionality, while manufacturer data is typically
captured through testing using a formal test procedure. For survey data, there are significant unknowns about the
translation of device usage from participants to quantitative estimates.
Recommended Values: For both cable and satellite, we recommend the values from CA IOUs 2013b taken from
DOE’s (2013a) Test Procedure NOPR for STBs.19
19
It is important to note that there were four separate duty cycles described in the CA IOUs 2013b study, depending on the functionality of the box. We selected the duty cycle with multi-stream without APD.
23
Applicability to Current Stock: As described in CA IOUs 2013b, this duty cycle (and the three other described in the
study) are generally accepted by industry. Given the comparison of the other studies, it’s difficult to assess any
trends to know the direction the market is taking, and how long these assumptions will last.
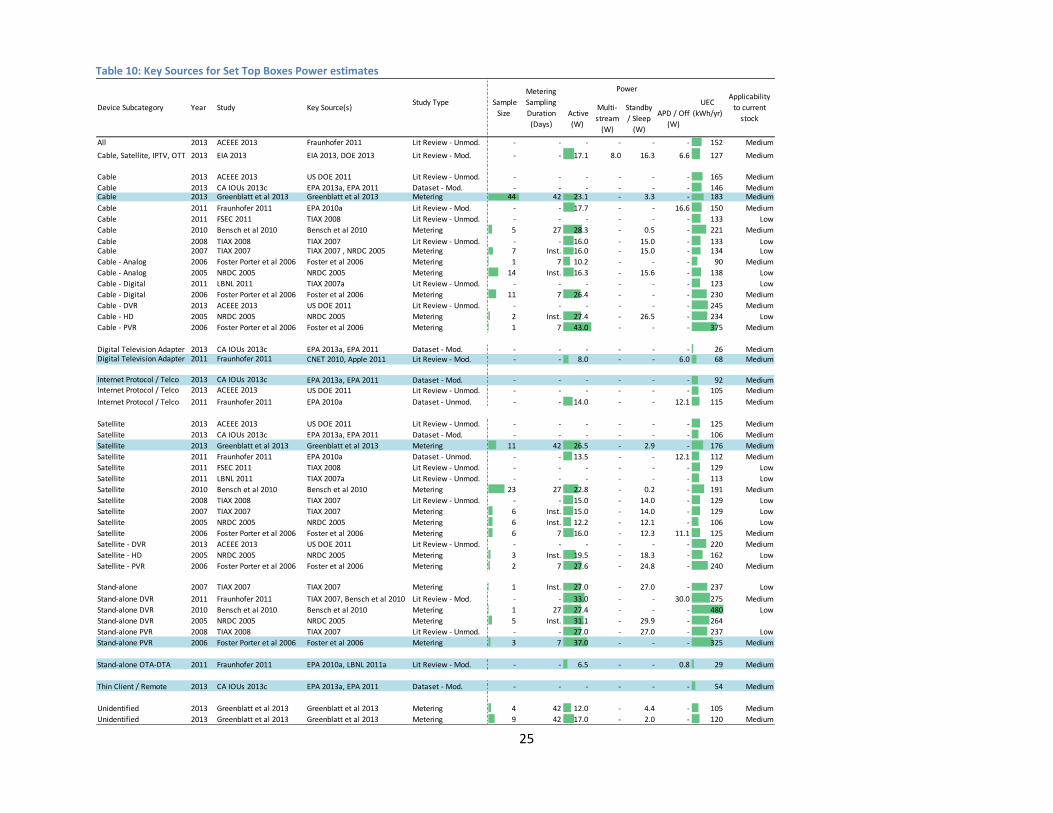
Power
Overview: Across the same eleven studies for both cable and satellite, active mode power estimates show a
significant range for cable from 10.2 to 43.0W, or a 4.2 factor difference, and less significant for satellite from 12.2
to 27.6W, or a factor 2.3 difference (see Table 10). Part of this spread is likely due to including sub-sub categories
of devices, including video recording functionality, but also the age of studies, at least for cable. Excluding the
oldest study (Foster Porter et al 2006) results in a narrow spread from 16.0 to 27.4 W, or a 1.7 factor difference.
For satellite, the story is less clear.
Recommended Values: The wattage values from Greenblatt et al 2013 are recommended, given that the study
merges the most recent metering study of stock.
Applicability to Current Stock: The recommended values for STBs have medium applicability to the current stock
given that while recent metering data is available, the sample size is somewhat limited, and none of the studies
have reported multi-stream data. The trend to move to from multiple STBs to a main STB and thin clients, such as
DISH Network’s Hopper and Joey setup, may substantially impact individual STB power. In addition, major cable
and satellite STB providers have made public commitments to meeting ENERGY STAR Version 3 for new boxes,
which will decrease STB energy consumption over time as these new boxes penetrate the installed base.
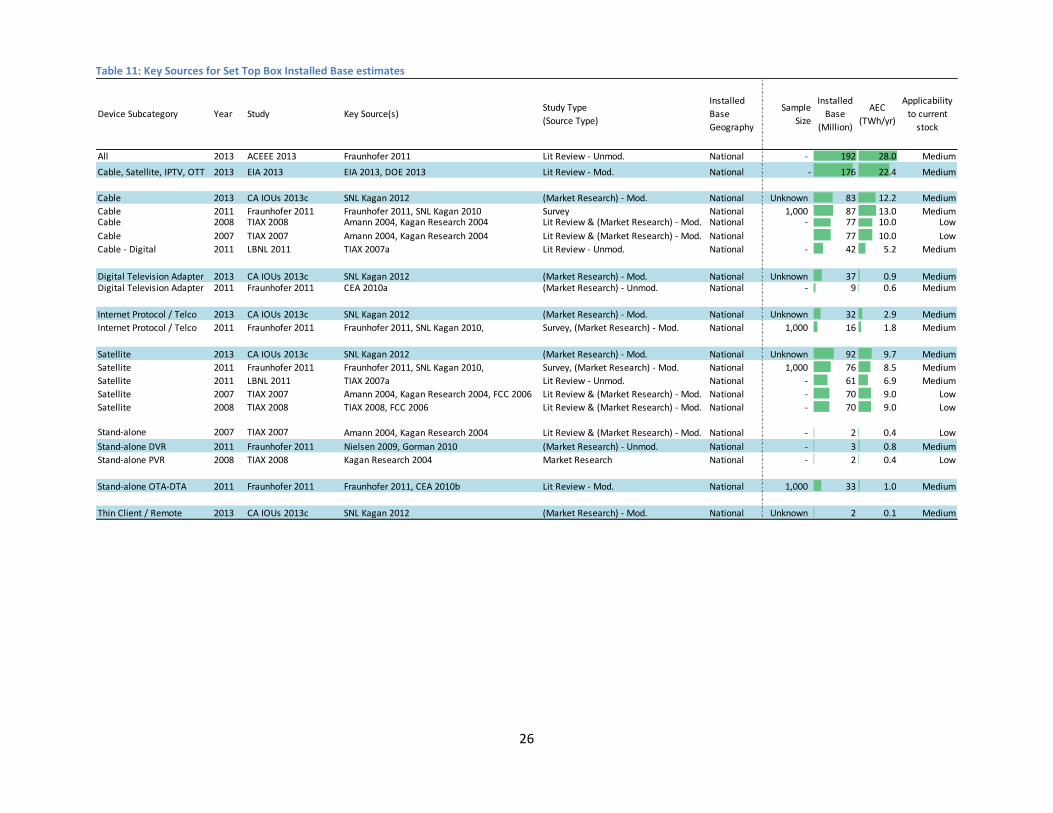
Installed Base
Overview: Across five studies, cable installed base estimates have significant variation, from 42 to 87 million units
nationally, a 2.1 factor difference (see Table 11). Removing the lowest value, given that LBNL 2011 includes cable-
digital only, results in relatively tight range of 77 – 87 million units, or a 1.1 factor difference. Across the same five
studies, satellite installed base estimates have a smaller range, from 61 to 92 million, a 1.5 factor difference.
Recommended Values & Applicability to Current Stock: We recommend CA IOUs & NRDC 2013 with medium
confidence. On the one hand, these estimates are the most up-to-date, the estimates were derived using sales
data and an expected useful life (eight years). However, there is limited public data on the real EUL of STBs and
how EUL is affected by a service providers’ willingness to upgrade its customers to new STBs to provide new
functionality. For example, the EUL for DISH Network’s STBs may decrease as they try to move customers onto
their Hopper and Joey (STB + Thin Client) setup.
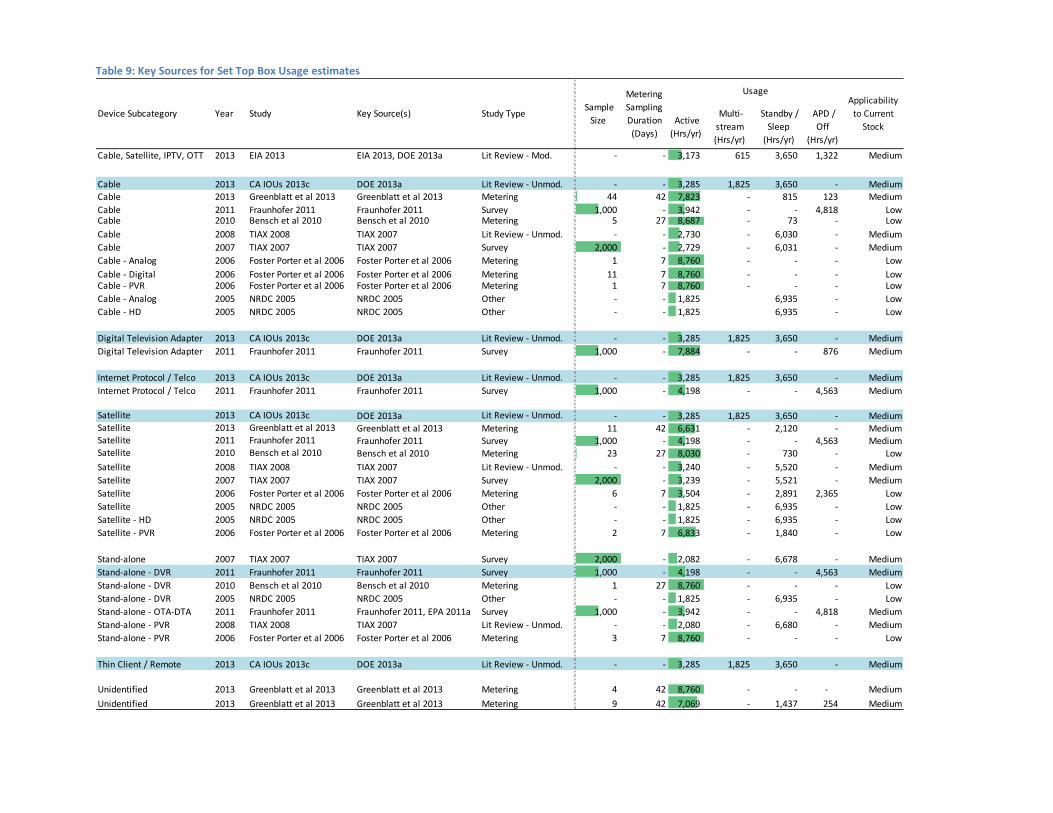
Table 9: Key Sources for Set Top Box Usage estimates
Active
(Hrs/yr)
Multi-
stream
(Hrs/yr)
Standby /
Sleep
(Hrs/yr)
APD /
Off
(Hrs/yr)
Cable, Satellite, IPTV, OTT 2013 EIA 2013 EIA 2013, DOE 2013a Lit Review - Mod. - - 3,173 615 3,650 1,322 Medium
Cable 2013 CA IOUs 2013c DOE 2013a Lit Review - Unmod. - - 3,285 1,825 3,650 - Medium
Cable 2013 Greenblatt et al 2013 Greenblatt et al 2013 Metering 44 42 7,823 - 815 123 Medium
Cable 2011 Fraunhofer 2011 Fraunhofer 2011 Survey 1,000 - 3,942 - - 4,818 LowCable 2010 Bensch et al 2010 Bensch et al 2010 Metering 5 27 8,687 - 73 - Low
Cable 2008 TIAX 2008 TIAX 2007 Lit Review - Unmod. - - 2,730 - 6,030 - Medium
Cable 2007 TIAX 2007 TIAX 2007 Survey 2,000 - 2,729 - 6,031 - Medium
Cable - Analog 2006 Foster Porter et al 2006 Foster Porter et al 2006 Metering 1 7 8,760 - - - Low
Cable - Digital 2006 Foster Porter et al 2006 Foster Porter et al 2006 Metering 11 7 8,760 - - - LowCable - PVR 2006 Foster Porter et al 2006 Foster Porter et al 2006 Metering 1 7 8,760 - - - Low
Cable - Analog 2005 NRDC 2005 NRDC 2005 Other - - 1,825 6,935 - Low
Cable - HD 2005 NRDC 2005 NRDC 2005 Other - - 1,825 6,935 - Low
Digital Television Adapter 2013 CA IOUs 2013c DOE 2013a Lit Review - Unmod. - - 3,285 1,825 3,650 - Medium
Digital Television Adapter 2011 Fraunhofer 2011 Fraunhofer 2011 Survey 1,000 - 7,884 - - 876 Medium
Internet Protocol / Telco 2013 CA IOUs 2013c DOE 2013a Lit Review - Unmod. - - 3,285 1,825 3,650 - Medium
Internet Protocol / Telco 2011 Fraunhofer 2011 Fraunhofer 2011 Survey 1,000 - 4,198 - - 4,563 Medium
Satellite 2013 CA IOUs 2013c DOE 2013a Lit Review - Unmod. - - 3,285 1,825 3,650 - MediumSatellite 2013 Greenblatt et al 2013 Greenblatt et al 2013 Metering 11 42 6,631 - 2,120 - MediumSatellite 2011 Fraunhofer 2011 Fraunhofer 2011 Survey 1,000 - 4,198 - - 4,563 MediumSatellite 2010 Bensch et al 2010 Bensch et al 2010 Metering 23 27 8,030 - 730 - Low
Satellite 2008 TIAX 2008 TIAX 2007 Lit Review - Unmod. - - 3,240 - 5,520 - Medium
Satellite 2007 TIAX 2007 TIAX 2007 Survey 2,000 - 3,239 - 5,521 - Medium
Satellite 2006 Foster Porter et al 2006 Foster Porter et al 2006 Metering 6 7 3,504 - 2,891 2,365 Low
Satellite 2005 NRDC 2005 NRDC 2005 Other - - 1,825 - 6,935 - Low
Satellite - HD 2005 NRDC 2005 NRDC 2005 Other - - 1,825 - 6,935 - Low
Satellite - PVR 2006 Foster Porter et al 2006 Foster Porter et al 2006 Metering 2 7 6,833 - 1,840 - Low
Stand-alone 2007 TIAX 2007 TIAX 2007 Survey 2,000 - 2,082 - 6,678 - Medium
Stand-alone - DVR 2011 Fraunhofer 2011 Fraunhofer 2011 Survey 1,000 - 4,198 - - 4,563 Medium
Stand-alone - DVR 2010 Bensch et al 2010 Bensch et al 2010 Metering 1 27 8,760 - - - Low
Stand-alone - DVR 2005 NRDC 2005 NRDC 2005 Other - - 1,825 - 6,935 - Low
Stand-alone - OTA-DTA 2011 Fraunhofer 2011 Fraunhofer 2011, EPA 2011a Survey 1,000 - 3,942 - - 4,818 Medium
Stand-alone - PVR 2008 TIAX 2008 TIAX 2007 Lit Review - Unmod. - - 2,080 - 6,680 - Medium
Stand-alone - PVR 2006 Foster Porter et al 2006 Foster Porter et al 2006 Metering 3 7 8,760 - - - Low
Thin Client / Remote 2013 CA IOUs 2013c DOE 2013a Lit Review - Unmod. - - 3,285 1,825 3,650 - Medium
Unidentified 2013 Greenblatt et al 2013 Greenblatt et al 2013 Metering 4 42 8,760 - - - Medium
Unidentified 2013 Greenblatt et al 2013 Greenblatt et al 2013 Metering 9 42 7,069 - 1,437 254 Medium
Sample
Size
Metering
Sampling
Duration
(Days)
UsageApplicability
to Current
Stock
Device Subcategory Year Study Key Source(s) Study Type
25
Table 10: Key Sources for Set Top Boxes Power estimates
Active
(W)
Multi-
stream
(W)
Standby
/ Sleep
(W)
APD / Off
(W)
All 2013 ACEEE 2013 Fraunhofer 2011 Lit Review - Unmod. - - - - - - 152 Medium
Cable, Satellite, IPTV, OTT 2013 EIA 2013 EIA 2013, DOE 2013 Lit Review - Mod. - - 17.1 8.0 16.3 6.6 127 Medium
Cable 2013 ACEEE 2013 US DOE 2011 Lit Review - Unmod. - - - - - - 165 Medium
Cable 2013 CA IOUs 2013c EPA 2013a, EPA 2011 Dataset - Mod. - - - - - - 146 MediumCable 2013 Greenblatt et al 2013 Greenblatt et al 2013 Metering 44 42 23.1 - 3.3 - 183 Medium
Cable 2011 Fraunhofer 2011 EPA 2010a Lit Review - Mod. - - 17.7 - - 16.6 150 Medium
Cable 2011 FSEC 2011 TIAX 2008 Lit Review - Unmod. - - - - - - 133 Low
Cable 2010 Bensch et al 2010 Bensch et al 2010 Metering 5 27 28.3 - 0.5 - 221 Medium
Cable 2008 TIAX 2008 TIAX 2007 Lit Review - Unmod. - - 16.0 - 15.0 - 133 LowCable 2007 TIAX 2007 TIAX 2007 , NRDC 2005 Metering 7 Inst. 16.0 - 15.0 - 134 Low
Cable - Analog 2006 Foster Porter et al 2006 Foster et al 2006 Metering 1 7 10.2 - - - 90 Medium
Cable - Analog 2005 NRDC 2005 NRDC 2005 Metering 14 Inst. 16.3 - 15.6 - 138 Low
Cable - Digital 2011 LBNL 2011 TIAX 2007a Lit Review - Unmod. - - - - - - 123 Low
Cable - Digital 2006 Foster Porter et al 2006 Foster et al 2006 Metering 11 7 26.4 - - - 230 Medium
Cable - DVR 2013 ACEEE 2013 US DOE 2011 Lit Review - Unmod. - - - - - - 245 Medium
Cable - HD 2005 NRDC 2005 NRDC 2005 Metering 2 Inst. 27.4 - 26.5 - 234 Low
Cable - PVR 2006 Foster Porter et al 2006 Foster et al 2006 Metering 1 7 43.0 - - - 375 Medium
Digital Television Adapter 2013 CA IOUs 2013c EPA 2013a, EPA 2011 Dataset - Mod. - - - - - - 26 MediumDigital Television Adapter 2011 Fraunhofer 2011 CNET 2010, Apple 2011 Lit Review - Mod. - - 8.0 - - 6.0 68 Medium
Internet Protocol / Telco 2013 CA IOUs 2013c EPA 2013a, EPA 2011 Dataset - Mod. - - - - - - 92 MediumInternet Protocol / Telco 2013 ACEEE 2013 US DOE 2011 Lit Review - Unmod. - - - - - - 105 Medium
Internet Protocol / Telco 2011 Fraunhofer 2011 EPA 2010a Dataset - Unmod. - - 14.0 - - 12.1 115 Medium
Satellite 2013 ACEEE 2013 US DOE 2011 Lit Review - Unmod. - - - - - - 125 Medium
Satellite 2013 CA IOUs 2013c EPA 2013a, EPA 2011 Dataset - Mod. - - - - - - 106 Medium
Satellite 2013 Greenblatt et al 2013 Greenblatt et al 2013 Metering 11 42 26.5 - 2.9 - 176 Medium
Satellite 2011 Fraunhofer 2011 EPA 2010a Dataset - Unmod. - - 13.5 - - 12.1 112 Medium
Satellite 2011 FSEC 2011 TIAX 2008 Lit Review - Unmod. - - - - - - 129 Low
Satellite 2011 LBNL 2011 TIAX 2007a Lit Review - Unmod. - - - - - - 113 Low
Satellite 2010 Bensch et al 2010 Bensch et al 2010 Metering 23 27 22.8 - 0.2 - 191 Medium
Satellite 2008 TIAX 2008 TIAX 2007 Lit Review - Unmod. - - 15.0 - 14.0 - 129 Low
Satellite 2007 TIAX 2007 TIAX 2007 Metering 6 Inst. 15.0 - 14.0 - 129 Low
Satellite 2005 NRDC 2005 NRDC 2005 Metering 6 Inst. 12.2 - 12.1 - 106 Low
Satellite 2006 Foster Porter et al 2006 Foster et al 2006 Metering 6 7 16.0 - 12.3 11.1 125 Medium
Satellite - DVR 2013 ACEEE 2013 US DOE 2011 Lit Review - Unmod. - - - - - - 220 Medium
Satellite - HD 2005 NRDC 2005 NRDC 2005 Metering 3 Inst. 19.5 - 18.3 - 162 Low
Satellite - PVR 2006 Foster Porter et al 2006 Foster et al 2006 Metering 2 7 27.6 - 24.8 - 240 Medium
Stand-alone 2007 TIAX 2007 TIAX 2007 Metering 1 Inst. 27.0 - 27.0 - 237 Low
Stand-alone DVR 2011 Fraunhofer 2011 TIAX 2007, Bensch et al 2010 Lit Review - Mod. - - 33.0 - - 30.0 275 Medium
Stand-alone DVR 2010 Bensch et al 2010 Bensch et al 2010 Metering 1 27 27.4 - - - 480 Low
Stand-alone DVR 2005 NRDC 2005 NRDC 2005 Metering 5 Inst. 31.1 - 29.9 - 264
Stand-alone PVR 2008 TIAX 2008 TIAX 2007 Lit Review - Unmod. - - 27.0 - 27.0 - 237 Low
Stand-alone PVR 2006 Foster Porter et al 2006 Foster et al 2006 Metering 3 7 37.0 - - - 325 Medium
Stand-alone OTA-DTA 2011 Fraunhofer 2011 EPA 2010a, LBNL 2011a Lit Review - Mod. - - 6.5 - - 0.8 29 Medium
Thin Client / Remote 2013 CA IOUs 2013c EPA 2013a, EPA 2011 Dataset - Mod. - - - - - - 54 Medium
Unidentified 2013 Greenblatt et al 2013 Greenblatt et al 2013 Metering 4 42 12.0 - 4.4 - 105 Medium
Unidentified 2013 Greenblatt et al 2013 Greenblatt et al 2013 Metering 9 42 17.0 - 2.0 - 120 Medium
Applicability
to current
stock
Sample
Size
Metering
Sampling
Duration
(Days)
Device Subcategory Year Study Key Source(s)Study Type UEC
(kWh/yr)
Power
26
Table 11: Key Sources for Set Top Box Installed Base estimates
All 2013 ACEEE 2013 Fraunhofer 2011 Lit Review - Unmod. National - 192 28.0 Medium
Cable, Satellite, IPTV, OTT 2013 EIA 2013 EIA 2013, DOE 2013 Lit Review - Mod. National - 176 22.4 Medium
Cable 2013 CA IOUs 2013c SNL Kagan 2012 (Market Research) - Mod. National Unknown 83 12.2 Medium
Cable 2011 Fraunhofer 2011 Fraunhofer 2011, SNL Kagan 2010 Survey National 1,000 87 13.0 MediumCable 2008 TIAX 2008 Amann 2004, Kagan Research 2004 Lit Review & (Market Research) - Mod. National - 77 10.0 Low
Cable 2007 TIAX 2007 Amann 2004, Kagan Research 2004 Lit Review & (Market Research) - Mod. National 77 10.0 Low
Cable - Digital 2011 LBNL 2011 TIAX 2007a Lit Review - Unmod. National - 42 5.2 Medium
Digital Television Adapter 2013 CA IOUs 2013c SNL Kagan 2012 (Market Research) - Mod. National Unknown 37 0.9 MediumDigital Television Adapter 2011 Fraunhofer 2011 CEA 2010a (Market Research) - Unmod. National - 9 0.6 Medium
Internet Protocol / Telco 2013 CA IOUs 2013c SNL Kagan 2012 (Market Research) - Mod. National Unknown 32 2.9 Medium
Internet Protocol / Telco 2011 Fraunhofer 2011 Fraunhofer 2011, SNL Kagan 2010, Survey, (Market Research) - Mod. National 1,000 16 1.8 Medium
Satellite 2013 CA IOUs 2013c SNL Kagan 2012 (Market Research) - Mod. National Unknown 92 9.7 Medium
Satellite 2011 Fraunhofer 2011 Fraunhofer 2011, SNL Kagan 2010, Survey, (Market Research) - Mod. National 1,000 76 8.5 Medium
Satellite 2011 LBNL 2011 TIAX 2007a Lit Review - Unmod. National - 61 6.9 Medium
Satellite 2007 TIAX 2007 Amann 2004, Kagan Research 2004, FCC 2006 Lit Review & (Market Research) - Mod. National - 70 9.0 Low
Satellite 2008 TIAX 2008 TIAX 2008, FCC 2006 Lit Review & (Market Research) - Mod. National - 70 9.0 Low
Stand-alone 2007 TIAX 2007 Amann 2004, Kagan Research 2004 Lit Review & (Market Research) - Mod. National - 2 0.4 Low
Stand-alone DVR 2011 Fraunhofer 2011 Nielsen 2009, Gorman 2010 (Market Research) - Unmod. National - 3 0.8 Medium
Stand-alone PVR 2008 TIAX 2008 Kagan Research 2004 Market Research National - 2 0.4 Low
Stand-alone OTA-DTA 2011 Fraunhofer 2011 Fraunhofer 2011, CEA 2010b Lit Review - Mod. National 1,000 33 1.0 Medium
Thin Client / Remote 2013 CA IOUs 2013c SNL Kagan 2012 (Market Research) - Mod. National Unknown 2 0.1 Medium
Applicability
to current
stock
Device Subcategory Year Study Key Source(s)Study Type
(Source Type)
Installed
Base
Geography
Sample
Size
Installed
Base
(Million)
AEC
(TWh/yr)
27
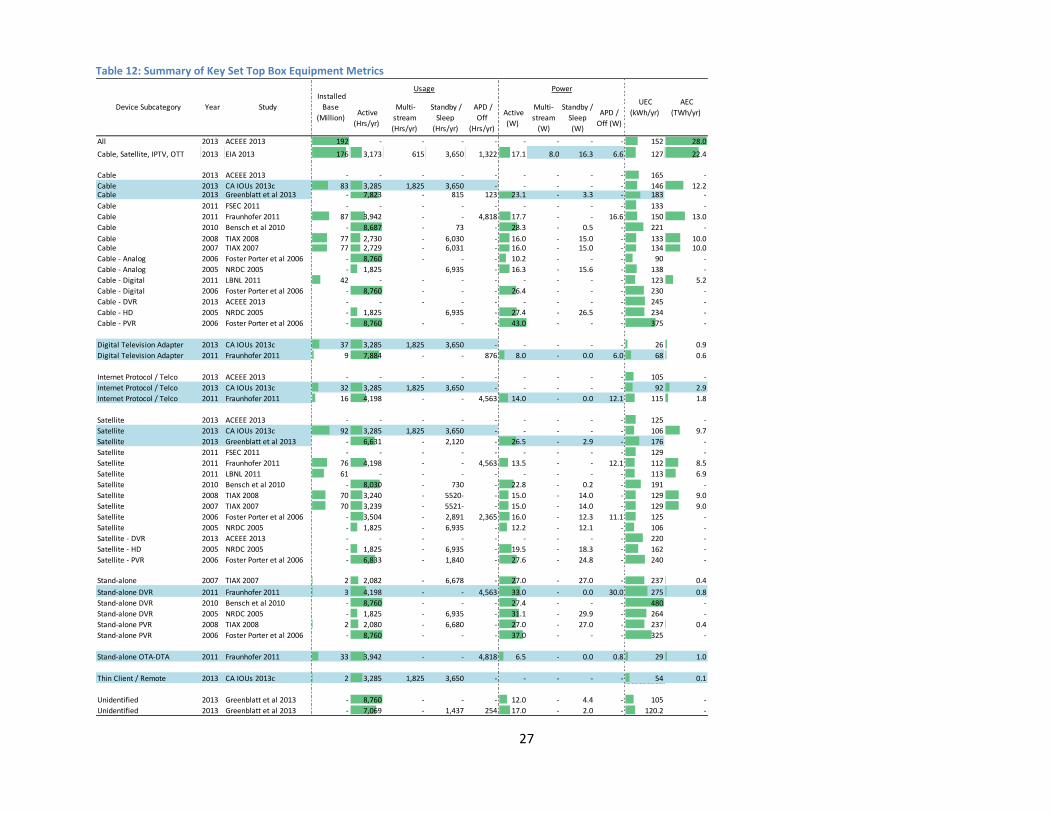
Table 12: Summary of Key Set Top Box Equipment Metrics
Active
(Hrs/yr)
Multi-
stream
(Hrs/yr)
Standby /
Sleep
(Hrs/yr)
APD /
Off
(Hrs/yr)
Active
(W)
Multi-
stream
(W)
Standby /
Sleep
(W)
APD /
Off (W)
All 2013 ACEEE 2013 192 - - - - - - - - 152 28.0
Cable, Satellite, IPTV, OTT 2013 EIA 2013 176 3,173 615 3,650 1,322 17.1 8.0 16.3 6.6 127 22.4
Cable 2013 ACEEE 2013 - - - - - - - - - 165 -
Cable 2013 CA IOUs 2013c 83 3,285 1,825 3,650 - - - - - 146 12.2 Cable 2013 Greenblatt et al 2013 - 7,823 - 815 123 23.1 - 3.3 - 183 -
Cable 2011 FSEC 2011 - - - - - - - - - 133 -
Cable 2011 Fraunhofer 2011 87 3,942 - - 4,818 17.7 - - 16.6 150 13.0
Cable 2010 Bensch et al 2010 - 8,687 - 73 - 28.3 - 0.5 - 221 -
Cable 2008 TIAX 2008 77 2,730 - 6,030 - 16.0 - 15.0 - 133 10.0 Cable 2007 TIAX 2007 77 2,729 - 6,031 - 16.0 - 15.0 - 134 10.0
Cable - Analog 2006 Foster Porter et al 2006 - 8,760 - - - 10.2 - - - 90 -
Cable - Analog 2005 NRDC 2005 - 1,825 6,935 - 16.3 - 15.6 - 138 -
Cable - Digital 2011 LBNL 2011 42 - - - - - - - - 123 5.2
Cable - Digital 2006 Foster Porter et al 2006 - 8,760 - - - 26.4 - - - 230 -
Cable - DVR 2013 ACEEE 2013 - - - - - - - - - 245 -
Cable - HD 2005 NRDC 2005 - 1,825 6,935 - 27.4 - 26.5 - 234 -
Cable - PVR 2006 Foster Porter et al 2006 - 8,760 - - - 43.0 - - - 375 -
Digital Television Adapter 2013 CA IOUs 2013c 37 3,285 1,825 3,650 - - - - - 26 0.9
Digital Television Adapter 2011 Fraunhofer 2011 9 7,884 - - 876 8.0 - 0.0 6.0 68 0.6
Internet Protocol / Telco 2013 ACEEE 2013 - - - - - - - - - 105 -
Internet Protocol / Telco 2013 CA IOUs 2013c 32 3,285 1,825 3,650 - - - - - 92 2.9
Internet Protocol / Telco 2011 Fraunhofer 2011 16 4,198 - - 4,563 14.0 - 0.0 12.1 115 1.8
Satellite 2013 ACEEE 2013 - - - - - - - - - 125 -
Satellite 2013 CA IOUs 2013c 92 3,285 1,825 3,650 - - - - - 106 9.7
Satellite 2013 Greenblatt et al 2013 - 6,631 - 2,120 - 26.5 - 2.9 - 176 -
Satellite 2011 FSEC 2011 - - - - - - - - - 129 -
Satellite 2011 Fraunhofer 2011 76 4,198 - - 4,563 13.5 - - 12.1 112 8.5
Satellite 2011 LBNL 2011 61 - - - - - - - - 113 6.9
Satellite 2010 Bensch et al 2010 - 8,030 - 730 - 22.8 - 0.2 - 191 -
Satellite 2008 TIAX 2008 70 3,240 - 5520- - 15.0 - 14.0 - 129 9.0
Satellite 2007 TIAX 2007 70 3,239 - 5521- - 15.0 - 14.0 - 129 9.0
Satellite 2006 Foster Porter et al 2006 - 3,504 - 2,891 2,365 16.0 - 12.3 11.1 125 -
Satellite 2005 NRDC 2005 - 1,825 - 6,935 - 12.2 - 12.1 - 106 -
Satellite - DVR 2013 ACEEE 2013 - - - - - - - - - 220 -
Satellite - HD 2005 NRDC 2005 - 1,825 - 6,935 - 19.5 - 18.3 - 162 -
Satellite - PVR 2006 Foster Porter et al 2006 - 6,833 - 1,840 - 27.6 - 24.8 - 240 -
Stand-alone 2007 TIAX 2007 2 2,082 - 6,678 - 27.0 - 27.0 - 237 0.4
Stand-alone DVR 2011 Fraunhofer 2011 3 4,198 - - 4,563 33.0 - 0.0 30.0 275 0.8
Stand-alone DVR 2010 Bensch et al 2010 - 8,760 - - - 27.4 - - - 480 -
Stand-alone DVR 2005 NRDC 2005 - 1,825 - 6,935 - 31.1 - 29.9 - 264 -
Stand-alone PVR 2008 TIAX 2008 2 2,080 - 6,680 - 27.0 - 27.0 - 237 0.4
Stand-alone PVR 2006 Foster Porter et al 2006 - 8,760 - - - 37.0 - - - 325 -
Stand-alone OTA-DTA 2011 Fraunhofer 2011 33 3,942 - - 4,818 6.5 - 0.0 0.8 29 1.0
Thin Client / Remote 2013 CA IOUs 2013c 2 3,285 1,825 3,650 - - - - - 54 0.1
Unidentified 2013 Greenblatt et al 2013 - 8,760 - - - 12.0 - 4.4 - 105 -
Unidentified 2013 Greenblatt et al 2013 - 7,069 - 1,437 254 17.0 - 2.0 - 120.2 -
UEC
(kWh/yr)
AEC
(TWh/yr) Device Subcategory Year Study
Installed
Base
(Million)
Usage Power

28
Data Quality Evaluation and Recommended UEC Values
Data Quality Evaluation: Overall, the current studies for Set Top Boxes provide a decent summary of the key
metrics, but as discussed, the ever-changing nature of the product make for some uncertainties. There will likely
continue to be changes in device usage, wattage and sales, similar to Game Consoles, and it is unlikely these
current values will maintain their accuracy for a sustained period.
Recommended UEC and AEC Values: We estimate that cable and satellite boxes currently consume 183 and 176
kWh/yr (Greenblatt et al 2013), and 15 and 16 TWh/yr, respectively. Collectively, we estimate that on average,
STBs consume 138 kWh/yr and collectively consume 38.7 TWh/yr across the entire installed base. This value was
developed by taking a weighted average of UECs across the installed base for each STB technology, and is
presented in Table 13 below. However, STB energy use is highly dependent on technology type, and we
recommend using data for individual STB technologies when applicable. Refer to Appendix A for the tables of all
STB subcategories.
Table 13: Recommended UEC and AEC values for Set Top Boxes
Gap Analysis, Opportunities for Further Research, and Implications for ZNE:
Gap Analysis and Opportunities for Further Research: The existing STB research is quite extensive for some
product subcategories, especially the higher energy consumption ones. At the same time, however, changes in the
market necessitate constant monitoring given the rapid market evolution of this technology class. Similar to
desktop and notebook computers, using internet connectivity to update data could prove highly beneficial to
understanding product usage, behavior and opportunities for improvement. For stock estimates, traditional survey
methods should be sufficient. Moreover, perhaps an increased role from service providers could assist in the
tracking of product stock and useful life, given the vast majority of products are not owned by customers.
Implications for ZNE Planning and Future Utility Efficiency Programs: For the purposes of ZNE planning in 2020, it
is important to model the energy consumption of new STB models and configurations coming onto the market
since they will likely be part of the stock in 2020. Potential utility programs include engaging STB vendors to make
changes to their existing and future models, and is a program design currently being trial by SCE with select
providers.
All
Metric Value Source
Installed Base - US (M) 281 Sum of Sources
Usage (hrs/yr) Active 3,372 Weighted Avg.
Multistream 1,591 Weighted Avg.
Standby / Sleep 3,182 Weighted Avg.
APD / Off 615 Weighted Avg.Power (W) Active 19 Weighted Avg.
Multistream 8.0 EIA 2013
Standby / Sleep 16.3 EIA 2013
APD / Off 6.6 EIA 2013
UEC (kWh/yr) 138 Calculated
AEC (TWh/yr) 38.7 Calculated
Overall Confidence Medium -

29
4.3 Desktop Computers Overview: Desktops have undergone significant changes over the past decade and are in another transition period
characterized by reduced sales and a form factor shift towards integrated desktops. In addition, industry and
ENERGY STAR have developed more nuanced mode definitions making it somewhat difficult to compare existing
wattage measurements with previous studies. While the new mode definitions better represent actual usage, it
can be difficult to capture this in metering data. Metering data is limited in its accuracy as modes are typically
determined by thresholds (resulting in two distinct modes) rather than by mode functionality or captured through
testing using a formal test procedure (resulting in four distinct modes for computers). The latest update to mode
definitions from EPA (2013b) seems to be partly a semantic one, but also reflects technological advances in
usability, with improved faster response times to user input (e.g., replacing the term hibernation). There is also a
common practice of documenting products across both sectors (residential and commercial), which makes
isolating the residential data somewhat challenging. Nevertheless, we are able to reasonably characterize the
energy use of residential desktop computers using the available data.
Usage
Overview: Desktop computer usage estimates vary considerably across the fourteen studies surveyed, ranging
from 2,794 – 4,088 hours per year in Active Mode, or a 1.46 factor difference (see Table 14). A few key
complications with comparing the studies usage are the difference in mode definitions, the challenges in
differentiating the various modes during metering, and the recent shift in definitions through the ENERGY STAR 6.0
specification development process. Of these twelve studies, one study (CA IOUs & NRDC 2013) distinguishes
between conventional desktops and integrated desktops (see the Table 4 below) while the remainder address the
entire market as a whole.
Recommended Values: We recommend using Microsoft 2008 for usage data across all operating modes. While
over half a decade old, Microsoft 2008 draws from a very large sample size as part of its Customer Experience
Improvement Program. It is also the primary source for residential usage that ENERGY STAR used to derive
estimates for its new blended residential/commercial mode weightings (EPA 2013b). It is an especially strong
method for data collection because it captures the usage through well-defined modal functionality that are the
same across all PC’s (with Windows operating systems) rather than through metering wattage thresholds which
are typically limited to a bi-modal delineation than multi-modal, and can apply differently to each unit tested.
Applicability to Current Stock: While this study’s age appears to be one limitation, it is also not yet clear how
usage has shifted since 2008. On the one hand, it is possible that device usage has declined given the increased
saturation of tablets and notebooks. However, overall usage of desktops could have increased, given greater
saturation of internet usage, e.g., social media, media streaming. The other limitation to the Microsoft 2008 study
is that it excludes non-Windows units. Given the limitations of the other studies and that the most recent ENERGY
STAR specification uses these to derive its 2013 estimates, we recommend this assessment as the best device
usage values for desktops.
30
Power
Overview: Active mode power estimates range across the 14 studies reviewed from 42 to 70W, or a 1.80 factor
difference (see Table 15). However the lower end values, derived from metering (CA IOUs & NRDC 2013), were
limited to products being sold on the market versus the stock. Removing this outlier, the range is only 1.32 factor
difference. The granularity of detail provided by CA IOUs & NRDC 2013 suggests there is further opportunity for
power management shifting from high power long-idle to standby (39.8 watts for 438 hours per year). Overall,
there appears to be a slight downward trend of active mode power, which seems to follow market efficiency
improvements over time, perhaps due to the shift toward integrated desktops as well as overall efficiency
improvements in the conventional form factor.
Recommended Values: CA IOUs & NRDC 2013 is the only wattage testing performed using the latest ENERGY STAR
6.0 test procedure which outlines the latest industry thinking on mode definitions. We therefore recommend using
these values for Long Idle, Standby and Sleep, despite the limitation of the sample not fully reflecting current stock,
as mentioned above. For Active/Short Idle, we recommend using Greenblatt et al 2013 given that it has the most
recent metering data for current stock.
Applicability to Current Stock: The recommended values for desktops have medium applicability to the current
stock given that the metering data sample size for active mode is somewhat limited and the other mode wattage is
taken from an even smaller sample of metering data, and is intended to estimate sales, not stock.
Installed Base
Overview: Installed base estimates have a significant range from 41 to 138 million units nationally,20 but can be
explained by the fact that the high end includes commercial sales data (ACEEE 2013), and the low end is derived
through sales multiplied by expected useful life rather than a traditional survey data (CA IOUs & NRDC 2013). There
is some uncertainty in using expected useful life because there can be significant variability between units.
Recommended Values: We believe Fraunhofer 2011 is the best value due to its recent publish date, use of primary
survey data, and large sample size.
Applicability to Current Stock: Due to the recent shift in consumer preferences towards mobility – notebooks and
tablets – it is likely that the value from Fraunhofer overstates existing stock. One important consideration this
study does account for is ensuring the stock is clearly defined in the survey as products that have been plugged in
during the past month. It also points out that a similar study was conducted with inquiring about all units owned,
resulting in about 20% higher estimate.
20
This figure includes the combination of Conventional and Integrated Desktops into a single stock estimate for CA IOUs & NRDC 2013.
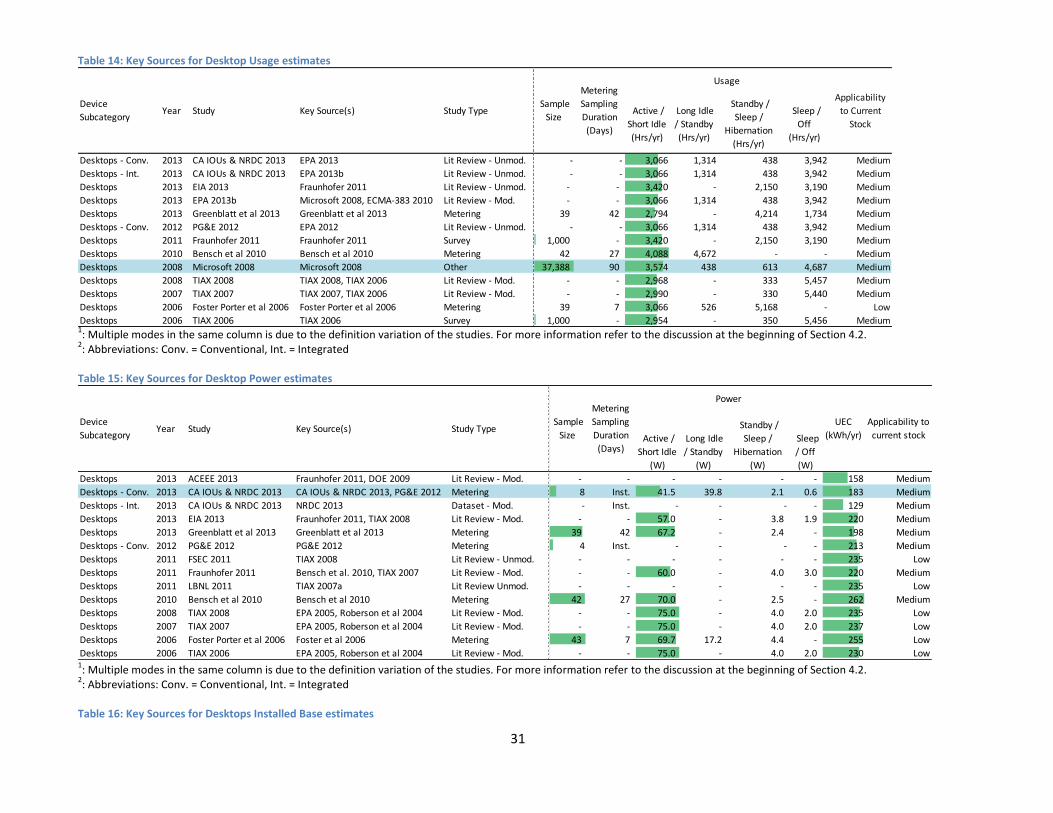
31
Table 14: Key Sources for Desktop Usage estimates
1: Multiple modes in the same column is due to the definition variation of the studies. For more information refer to the discussion at the beginning of Section 4.2.
2: Abbreviations: Conv. = Conventional, Int. = Integrated
Table 15: Key Sources for Desktop Power estimates
1: Multiple modes in the same column is due to the definition variation of the studies. For more information refer to the discussion at the beginning of Section 4.2.
2: Abbreviations: Conv. = Conventional, Int. = Integrated
Table 16: Key Sources for Desktops Installed Base estimates
Active /
Short Idle
(Hrs/yr)
Long Idle
/ Standby
(Hrs/yr)
Standby /
Sleep /
Hibernation
(Hrs/yr)
Sleep /
Off
(Hrs/yr)
Desktops - Conv. 2013 CA IOUs & NRDC 2013 EPA 2013 Lit Review - Unmod. - - 3,066 1,314 438 3,942 Medium
Desktops - Int. 2013 CA IOUs & NRDC 2013 EPA 2013b Lit Review - Unmod. - - 3,066 1,314 438 3,942 Medium
Desktops 2013 EIA 2013 Fraunhofer 2011 Lit Review - Unmod. - - 3,420 - 2,150 3,190 Medium
Desktops 2013 EPA 2013b Microsoft 2008, ECMA-383 2010 Lit Review - Mod. - - 3,066 1,314 438 3,942 Medium
Desktops 2013 Greenblatt et al 2013 Greenblatt et al 2013 Metering 39 42 2,794 - 4,214 1,734 Medium
Desktops - Conv. 2012 PG&E 2012 EPA 2012 Lit Review - Unmod. - - 3,066 1,314 438 3,942 Medium
Desktops 2011 Fraunhofer 2011 Fraunhofer 2011 Survey 1,000 - 3,420 - 2,150 3,190 Medium
Desktops 2010 Bensch et al 2010 Bensch et al 2010 Metering 42 27 4,088 4,672 - - Medium
Desktops 2008 Microsoft 2008 Microsoft 2008 Other 37,388 90 3,574 438 613 4,687 Medium
Desktops 2008 TIAX 2008 TIAX 2008, TIAX 2006 Lit Review - Mod. - - 2,968 - 333 5,457 Medium
Desktops 2007 TIAX 2007 TIAX 2007, TIAX 2006 Lit Review - Mod. - - 2,990 - 330 5,440 Medium
Desktops 2006 Foster Porter et al 2006 Foster Porter et al 2006 Metering 39 7 3,066 526 5,168 - Low
Desktops 2006 TIAX 2006 TIAX 2006 Survey 1,000 - 2,954 - 350 5,456 Medium
Device
SubcategoryYear Study Key Source(s) Study Type
Sample
Size
Metering
Sampling
Duration
(Days)
Usage
Applicability
to Current
Stock
Active /
Short Idle
(W)
Long Idle
/ Standby
(W)
Standby /
Sleep /
Hibernation
(W)
Sleep
/ Off
(W)
Desktops 2013 ACEEE 2013 Fraunhofer 2011, DOE 2009 Lit Review - Mod. - - - - - - 158 Medium
Desktops - Conv. 2013 CA IOUs & NRDC 2013 CA IOUs & NRDC 2013, PG&E 2012 Metering 8 Inst. 41.5 39.8 2.1 0.6 183 Medium
Desktops - Int. 2013 CA IOUs & NRDC 2013 NRDC 2013 Dataset - Mod. - Inst. - - - - 129 Medium
Desktops 2013 EIA 2013 Fraunhofer 2011, TIAX 2008 Lit Review - Mod. - - 57.0 - 3.8 1.9 220 Medium
Desktops 2013 Greenblatt et al 2013 Greenblatt et al 2013 Metering 39 42 67.2 - 2.4 - 198 Medium
Desktops - Conv. 2012 PG&E 2012 PG&E 2012 Metering 4 Inst. - - - - 213 Medium
Desktops 2011 FSEC 2011 TIAX 2008 Lit Review - Unmod. - - - - - - 235 Low
Desktops 2011 Fraunhofer 2011 Bensch et al. 2010, TIAX 2007 Lit Review - Mod. - - 60.0 - 4.0 3.0 220 Medium
Desktops 2011 LBNL 2011 TIAX 2007a Lit Review Unmod. - - - - - - 235 Low
Desktops 2010 Bensch et al 2010 Bensch et al 2010 Metering 42 27 70.0 - 2.5 - 262 Medium
Desktops 2008 TIAX 2008 EPA 2005, Roberson et al 2004 Lit Review - Mod. - - 75.0 - 4.0 2.0 235 Low
Desktops 2007 TIAX 2007 EPA 2005, Roberson et al 2004 Lit Review - Mod. - - 75.0 - 4.0 2.0 237 Low
Desktops 2006 Foster Porter et al 2006 Foster et al 2006 Metering 43 7 69.7 17.2 4.4 - 255 Low
Desktops 2006 TIAX 2006 EPA 2005, Roberson et al 2004 Lit Review - Mod. - - 75.0 - 4.0 2.0 230 Low
StudyDevice
SubcategoryYear Key Source(s) Study Type
Sample
Size
Metering
Sampling
Duration
(Days)
Applicability to
current stock
UEC
(kWh/yr)
Power
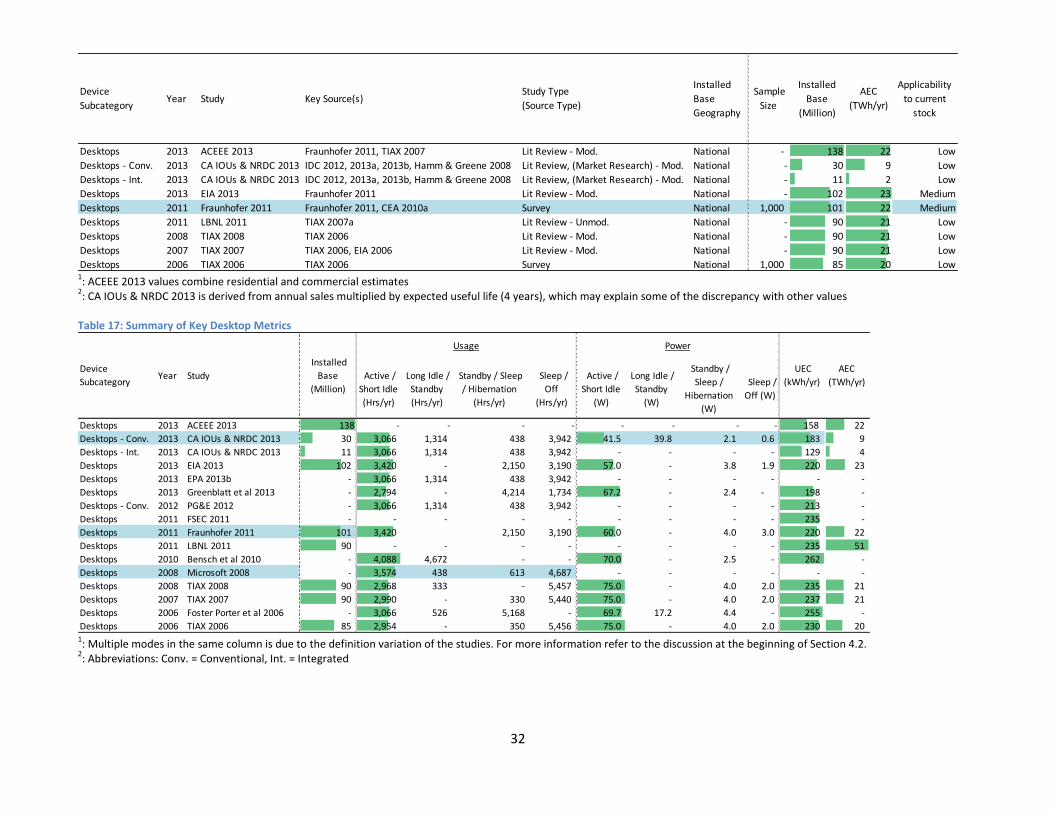
32
1: ACEEE 2013 values combine residential and commercial estimates
2: CA IOUs & NRDC 2013 is derived from annual sales multiplied by expected useful life (4 years), which may explain some of the discrepancy with other values
Table 17: Summary of Key Desktop Metrics
1: Multiple modes in the same column is due to the definition variation of the studies. For more information refer to the discussion at the beginning of Section 4.2.
2: Abbreviations: Conv. = Conventional, Int. = Integrated
Desktops 2013 ACEEE 2013 Fraunhofer 2011, TIAX 2007 Lit Review - Mod. National - 138 22 Low
Desktops - Conv. 2013 CA IOUs & NRDC 2013 IDC 2012, 2013a, 2013b, Hamm & Greene 2008 Lit Review, (Market Research) - Mod. National - 30 9 Low
Desktops - Int. 2013 CA IOUs & NRDC 2013 IDC 2012, 2013a, 2013b, Hamm & Greene 2008 Lit Review, (Market Research) - Mod. National - 11 2 Low
Desktops 2013 EIA 2013 Fraunhofer 2011 Lit Review - Mod. National - 102 23 Medium
Desktops 2011 Fraunhofer 2011 Fraunhofer 2011, CEA 2010a Survey National 1,000 101 22 Medium
Desktops 2011 LBNL 2011 TIAX 2007a Lit Review - Unmod. National - 90 21 Low
Desktops 2008 TIAX 2008 TIAX 2006 Lit Review - Mod. National - 90 21 Low
Desktops 2007 TIAX 2007 TIAX 2006, EIA 2006 Lit Review - Mod. National - 90 21 Low
Desktops 2006 TIAX 2006 TIAX 2006 Survey National 1,000 85 20 Low
Installed
Base
Geography
Device
SubcategoryYear Study Key Source(s)
Study Type
(Source Type)
Sample
Size
Installed
Base
(Million)
AEC
(TWh/yr)
Applicability
to current
stock
Active /
Short Idle
(Hrs/yr)
Long Idle /
Standby
(Hrs/yr)
Standby / Sleep
/ Hibernation
(Hrs/yr)
Sleep /
Off
(Hrs/yr)
Active /
Short Idle
(W)
Long Idle /
Standby
(W)
Standby /
Sleep /
Hibernation
(W)
Sleep /
Off (W)
Desktops 2013 ACEEE 2013 138 - - - - - - - - 158 22
Desktops - Conv. 2013 CA IOUs & NRDC 2013 30 3,066 1,314 438 3,942 41.5 39.8 2.1 0.6 183 9
Desktops - Int. 2013 CA IOUs & NRDC 2013 11 3,066 1,314 438 3,942 - - - - 129 4
Desktops 2013 EIA 2013 102 3,420 - 2,150 3,190 57.0 - 3.8 1.9 220 23
Desktops 2013 EPA 2013b - 3,066 1,314 438 3,942 - - - - - -
Desktops 2013 Greenblatt et al 2013 - 2,794 - 4,214 1,734 67.2 - 2.4 - 198 -
Desktops - Conv. 2012 PG&E 2012 - 3,066 1,314 438 3,942 - - - - 213 -
Desktops 2011 FSEC 2011 - - - - - - - - - 235 -
Desktops 2011 Fraunhofer 2011 101 3,420 2,150 3,190 60.0 - 4.0 3.0 220 22
Desktops 2011 LBNL 2011 90 - - - - - - - - 235 51
Desktops 2010 Bensch et al 2010 - 4,088 4,672 - - 70.0 - 2.5 - 262 -
Desktops 2008 Microsoft 2008 - 3,574 438 613 4,687 - - - - - -
Desktops 2008 TIAX 2008 90 2,968 333 - 5,457 75.0 - 4.0 2.0 235 21
Desktops 2007 TIAX 2007 90 2,990 - 330 5,440 75.0 - 4.0 2.0 237 21
Desktops 2006 Foster Porter et al 2006 - 3,066 526 5,168 - 69.7 17.2 4.4 - 255 -
Desktops 2006 TIAX 2006 85 2,954 - 350 5,456 75.0 - 4.0 2.0 230 20
AEC
(TWh/yr)
Device
SubcategoryYear Study
Installed
Base
(Million)
Usage Power
UEC
(kWh/yr)
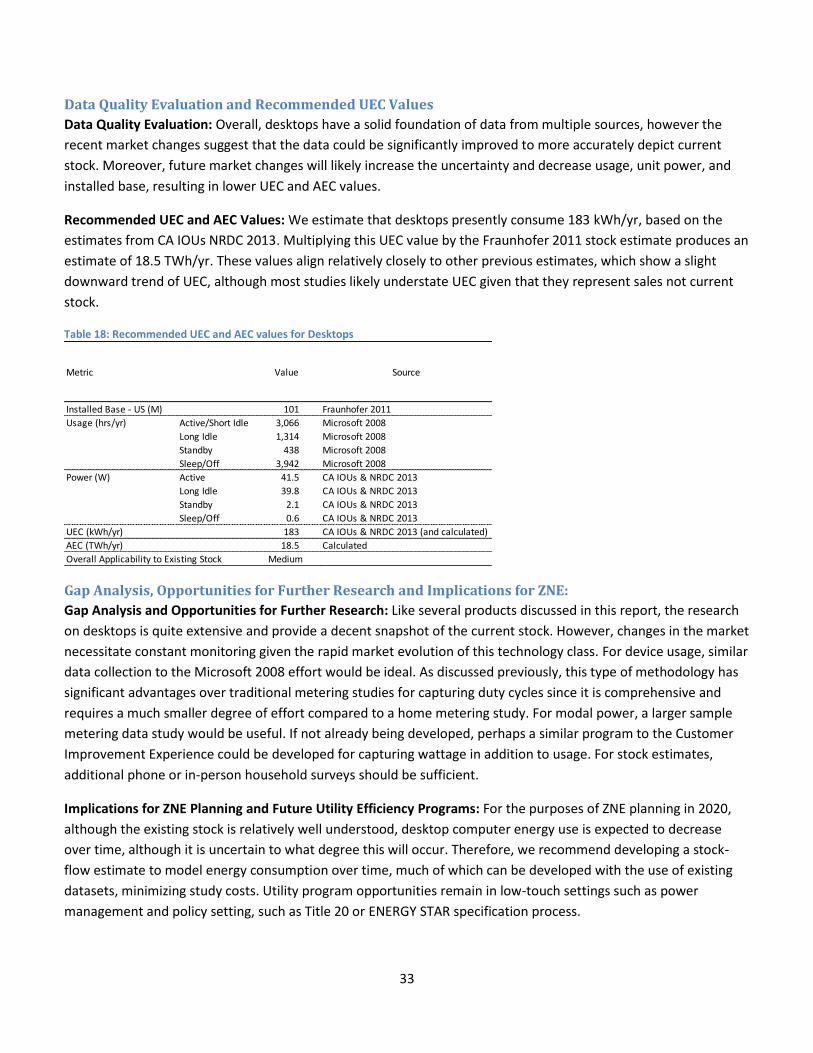
33
Data Quality Evaluation and Recommended UEC Values
Data Quality Evaluation: Overall, desktops have a solid foundation of data from multiple sources, however the
recent market changes suggest that the data could be significantly improved to more accurately depict current
stock. Moreover, future market changes will likely increase the uncertainty and decrease usage, unit power, and
installed base, resulting in lower UEC and AEC values.
Recommended UEC and AEC Values: We estimate that desktops presently consume 183 kWh/yr, based on the
estimates from CA IOUs NRDC 2013. Multiplying this UEC value by the Fraunhofer 2011 stock estimate produces an
estimate of 18.5 TWh/yr. These values align relatively closely to other previous estimates, which show a slight
downward trend of UEC, although most studies likely understate UEC given that they represent sales not current
stock.
Table 18: Recommended UEC and AEC values for Desktops
Gap Analysis, Opportunities for Further Research and Implications for ZNE:
Gap Analysis and Opportunities for Further Research: Like several products discussed in this report, the research
on desktops is quite extensive and provide a decent snapshot of the current stock. However, changes in the market
necessitate constant monitoring given the rapid market evolution of this technology class. For device usage, similar
data collection to the Microsoft 2008 effort would be ideal. As discussed previously, this type of methodology has
significant advantages over traditional metering studies for capturing duty cycles since it is comprehensive and
requires a much smaller degree of effort compared to a home metering study. For modal power, a larger sample
metering data study would be useful. If not already being developed, perhaps a similar program to the Customer
Improvement Experience could be developed for capturing wattage in addition to usage. For stock estimates,
additional phone or in-person household surveys should be sufficient.
Implications for ZNE Planning and Future Utility Efficiency Programs: For the purposes of ZNE planning in 2020,
although the existing stock is relatively well understood, desktop computer energy use is expected to decrease
over time, although it is uncertain to what degree this will occur. Therefore, we recommend developing a stock-
flow estimate to model energy consumption over time, much of which can be developed with the use of existing
datasets, minimizing study costs. Utility program opportunities remain in low-touch settings such as power
management and policy setting, such as Title 20 or ENERGY STAR specification process.
Metric Value Source
Installed Base - US (M) 101 Fraunhofer 2011
Usage (hrs/yr) Active/Short Idle 3,066 Microsoft 2008
Long Idle 1,314 Microsoft 2008
Standby 438 Microsoft 2008
Sleep/Off 3,942 Microsoft 2008
Power (W) Active 41.5 CA IOUs & NRDC 2013
Long Idle 39.8 CA IOUs & NRDC 2013
Standby 2.1 CA IOUs & NRDC 2013
Sleep/Off 0.6 CA IOUs & NRDC 2013
UEC (kWh/yr) 183 CA IOUs & NRDC 2013 (and calculated)
AEC (TWh/yr) 18.5 Calculated
Overall Applicability to Existing Stock Medium
34
4.4 Notebook Computers Overview: Like desktops, notebooks have undergone significant changes over the past decade and are in another
transition period characterized by reported reduced sales (not documented in the literature). There is limited data
from previous notebook metering studies because of the challenges associated with metering portable equipment.
In addition, industry and ENERGY STAR has recently developed more nuanced mode definitions making it difficult
to compare existing data wattage measurements with previous ones. In-home metering data is limited in its
accuracy as modes are typically determined by power measurement thresholds (resulting in two distinct modes)
rather than by mode functionality, typically captured through testing using a formal test procedure (resulting four
distinct computer modes). The latest update to mode definitions from EPA (2013b) seems to be partly a semantic
one, but also reflects technological advances, with improved faster response times to user input (e.g., replacing the
term hibernation). There is also a common practice of documenting products across both sectors (residential and
commercial), which makes isolating the residential data somewhat challenging. Nevertheless, we are able to
reasonably characterize the notebook market using the available data.
Usage
Overview: Across eight studies, notebooks usage estimates vary considerably, ranging from 1,367 – 3,796 hours
per year in Active Mode, or a 2.8 factor difference. A few key complications with comparing the studies’ usage are
the difference in mode definitions, the challenges in differentiating the various modes during metering, and the
recent shift in definitions through the ENERGY STAR 6.0 specification development process.
Recommended Values: While almost six years old, Microsoft 2008 draws from a very large sample size as part of
its Customer Experience Improvement Program. It is also the primary source for residential usage that ENERGY
STAR used to derive estimates for its new blended residential/commercial mode weightings (EPA 2013b). It is
includes an especially strong method for data collection because it captures the usage through well-defined modal
functionality that are the same across all PCs (with Windows operating systems) rather than through metering
wattage thresholds which are typically limited to a bi-modal delineation than multi-modal, and can apply
differently to each unit tested.
Applicability to Current Stock: This study’s age is one obvious limitation, but it’s not clear yet how notebook usage
has shifted since 2008. On the one hand, it’s possible that device usage has declined given the increased saturation
of tablets. On the other hand, overall usage of notebooks could have increased, given greater saturation of
internet usage, e.g., social media, media streaming. The other limitation is that the notebooks monitored exclude
non-Windows units.21 Given the limitations of the other studies and that the most recent ENERGY STAR
specification uses these to derive its 2013 estimates, we recommend this assessment as the best device usage
values for notebooks.
Power
Overview: Across eight studies, active mode power estimates range from 18 to 40W, or a 2.2 factor difference,
with limited metering data available. With the exception of Greenblatt et al 2013, there appears to be a slight
21
In 2013, this represented 5% of the market globally (CA IOUs & NRDC 2013), although this is likely higher in the U.S.
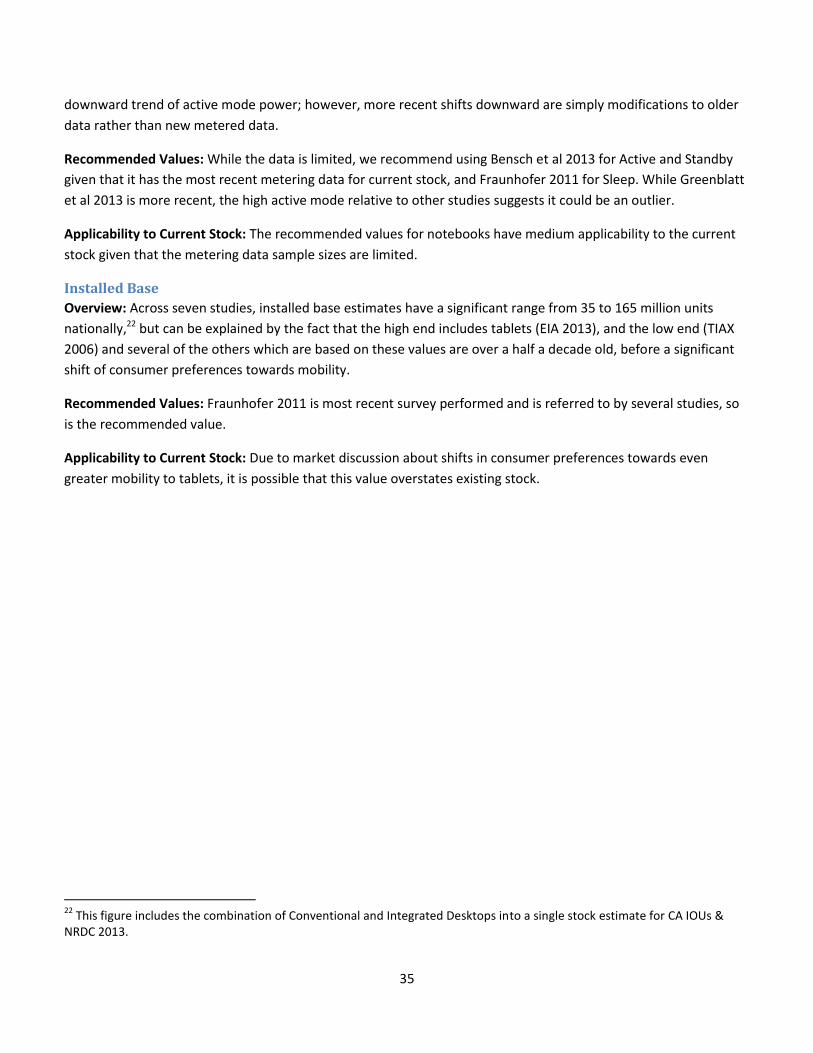
35
downward trend of active mode power; however, more recent shifts downward are simply modifications to older
data rather than new metered data.
Recommended Values: While the data is limited, we recommend using Bensch et al 2013 for Active and Standby
given that it has the most recent metering data for current stock, and Fraunhofer 2011 for Sleep. While Greenblatt
et al 2013 is more recent, the high active mode relative to other studies suggests it could be an outlier.
Applicability to Current Stock: The recommended values for notebooks have medium applicability to the current
stock given that the metering data sample sizes are limited.
Installed Base
Overview: Across seven studies, installed base estimates have a significant range from 35 to 165 million units
nationally,22 but can be explained by the fact that the high end includes tablets (EIA 2013), and the low end (TIAX
2006) and several of the others which are based on these values are over a half a decade old, before a significant
shift of consumer preferences towards mobility.
Recommended Values: Fraunhofer 2011 is most recent survey performed and is referred to by several studies, so
is the recommended value.
Applicability to Current Stock: Due to market discussion about shifts in consumer preferences towards even
greater mobility to tablets, it is possible that this value overstates existing stock.
22
This figure includes the combination of Conventional and Integrated Desktops into a single stock estimate for CA IOUs & NRDC 2013.
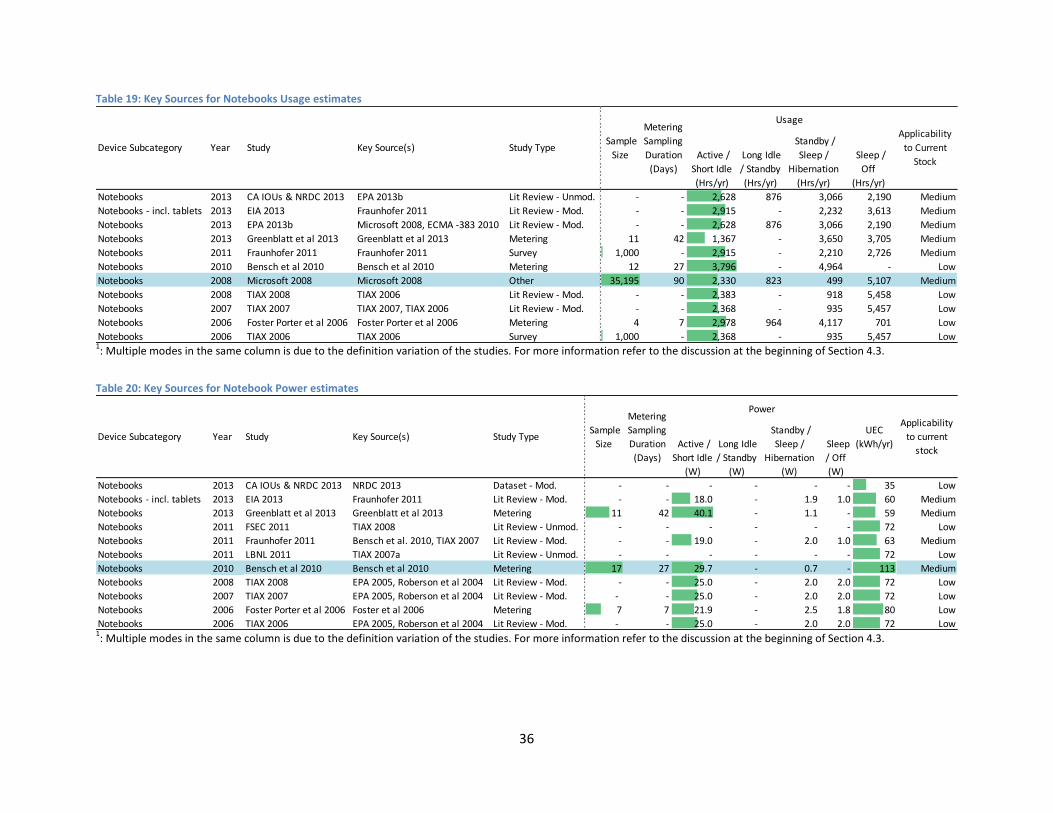
36
Table 19: Key Sources for Notebooks Usage estimates
1: Multiple modes in the same column is due to the definition variation of the studies. For more information refer to the discussion at the beginning of Section 4.3.
Table 20: Key Sources for Notebook Power estimates
1: Multiple modes in the same column is due to the definition variation of the studies. For more information refer to the discussion at the beginning of Section 4.3.
Active /
Short Idle
(Hrs/yr)
Long Idle
/ Standby
(Hrs/yr)
Standby /
Sleep /
Hibernation
(Hrs/yr)
Sleep /
Off
(Hrs/yr)
Notebooks 2013 CA IOUs & NRDC 2013 EPA 2013b Lit Review - Unmod. - - 2,628 876 3,066 2,190 Medium
Notebooks - incl. tablets 2013 EIA 2013 Fraunhofer 2011 Lit Review - Mod. - - 2,915 - 2,232 3,613 Medium
Notebooks 2013 EPA 2013b Microsoft 2008, ECMA -383 2010 Lit Review - Mod. - - 2,628 876 3,066 2,190 Medium
Notebooks 2013 Greenblatt et al 2013 Greenblatt et al 2013 Metering 11 42 1,367 - 3,650 3,705 Medium
Notebooks 2011 Fraunhofer 2011 Fraunhofer 2011 Survey 1,000 - 2,915 - 2,210 2,726 Medium
Notebooks 2010 Bensch et al 2010 Bensch et al 2010 Metering 12 27 3,796 - 4,964 - Low
Notebooks 2008 Microsoft 2008 Microsoft 2008 Other 35,195 90 2,330 823 499 5,107 Medium
Notebooks 2008 TIAX 2008 TIAX 2006 Lit Review - Mod. - - 2,383 - 918 5,458 Low
Notebooks 2007 TIAX 2007 TIAX 2007, TIAX 2006 Lit Review - Mod. - - 2,368 - 935 5,457 Low
Notebooks 2006 Foster Porter et al 2006 Foster Porter et al 2006 Metering 4 7 2,978 964 4,117 701 Low
Notebooks 2006 TIAX 2006 TIAX 2006 Survey 1,000 - 2,368 - 935 5,457 Low
Device Subcategory Year Study Key Source(s) Study Type Sample
Size
Metering
Sampling
Duration
(Days)
Usage
Applicability
to Current
Stock
Active /
Short Idle
(W)
Long Idle
/ Standby
(W)
Standby /
Sleep /
Hibernation
(W)
Sleep
/ Off
(W)
Notebooks 2013 CA IOUs & NRDC 2013 NRDC 2013 Dataset - Mod. - - - - - - 35 Low
Notebooks - incl. tablets 2013 EIA 2013 Fraunhofer 2011 Lit Review - Mod. - - 18.0 - 1.9 1.0 60 Medium
Notebooks 2013 Greenblatt et al 2013 Greenblatt et al 2013 Metering 11 42 40.1 - 1.1 - 59 Medium
Notebooks 2011 FSEC 2011 TIAX 2008 Lit Review - Unmod. - - - - - - 72 Low
Notebooks 2011 Fraunhofer 2011 Bensch et al. 2010, TIAX 2007 Lit Review - Mod. - - 19.0 - 2.0 1.0 63 Medium
Notebooks 2011 LBNL 2011 TIAX 2007a Lit Review - Unmod. - - - - - - 72 Low
Notebooks 2010 Bensch et al 2010 Bensch et al 2010 Metering 17 27 29.7 - 0.7 - 113 Medium
Notebooks 2008 TIAX 2008 EPA 2005, Roberson et al 2004 Lit Review - Mod. - - 25.0 - 2.0 2.0 72 Low
Notebooks 2007 TIAX 2007 EPA 2005, Roberson et al 2004 Lit Review - Mod. - - 25.0 - 2.0 2.0 72 Low
Notebooks 2006 Foster Porter et al 2006 Foster et al 2006 Metering 7 7 21.9 - 2.5 1.8 80 Low
Notebooks 2006 TIAX 2006 EPA 2005, Roberson et al 2004 Lit Review - Mod. - - 25.0 - 2.0 2.0 72 Low
Key Source(s) Study Type Sample
Size
Metering
Sampling
Duration
(Days)
Applicability
to current
stock
UEC
(kWh/yr)
Power
StudyDevice Subcategory Year

37
Table 21: Key Sources for Notebook Installed Base estimates
Table 22: Summary of Key Notebook Metrics
1: Multiple modes in the same column is due to the definition variation of the studies. For more information refer to the discussion at the beginning of Section 4.3.
Notebooks 2013 CA IOUs & NRDC 2013 IDC 2012, 2013a, 2013b, Hamm & Greene 2008 Lit Review, (Market Research) - Mod. National - 72 2.0 Low
Notebooks - incl. tablets 2013 EIA 2013 Fraunhofer 2011, DisplaySearch 2013 Lit Review - Mod. National - 165 9.8 Medium
Notebooks 2011 Fraunhofer 2011 CEA 2010 Survey National 1,000 132 8.3 Medium
Notebooks 2011 LBNL 2011 TIAX 2007a Lit Review - Mod. National - 39 4.2 Medium
Notebooks 2008 TIAX 2008 TIAX 2007 Lit Review - Unmod. National - 39 2.8 Low
Notebooks 2007 TIAX 2007 TIAX 2006, EIA 2006 Lit Review - Mod. National - 39 2.8 Low
Notebooks 2006 TIAX 2006 TIAX 2006, Scherf 2004 Survey & Lit Review - Mod. National 1,000 35 2.6 Low
Sample
Size
Installed
Base
(Million)
AEC
(TWh/yr)
Applicability
to current
stock
Installed
Base
Geography
Device Subcategory Year Study Key Source(s)Study Type
(Source Type)
Active /
Short
Idle
(Hrs/yr)
Long Idle /
Standby
(Hrs/yr)
Standby / Sleep
/ Hibernation
(Hrs/yr)
Sleep /
Off
(Hrs/yr)
Active /
Short Idle
(W)
Long Idle
/ Standby
(W)
Standby /
Sleep /
Hibernation
(W)
Sleep
/ Off
(W)
Notebooks 2013 CA IOUs & NRDC 2013 72 2,628 876 3,066 2,190 - - - - 35 2.0
Notebooks - incl. tablets 2013 EIA 2013 165 2,915 - 2,232 3,613 18.0 - 1.9 1.0 60 9.8
Notebooks 2013 EPA 2013b - 2,628 876 3,066 2,190 - - - - - -
Notebooks 2013 Greenblatt et al 2013 - 1,367 - 3,650 3,705 40.1 - 1.1 - 59 -
Notebooks 2011 FSEC 2011 - - - - - - - - - 72 -
Notebooks 2011 Fraunhofer 2011 132 2,915 - 2,210 2,726 19.0 - 2.0 1.0 63 8.3
Notebooks 2011 LBNL 2011 39 - - - - - - - - 72 4.2
Notebooks 2010 Bensch et al 2010 - 3,796 - 4,964 - 29.7 - 0.7 - 113 -
Notebooks 2008 Microsoft 2008 - 2,330 823 499 5,107 - - - - - -
Notebooks 2007 TIAX 2007 39 2,368 - 935 5,457 25.0 - 2.0 2.0 72 2.8
Notebooks 2006 Foster Porter et al 2006 - 2,978 964 4,117 701 21.9 - 2.5 1.8 80 -
Notebooks 2006 TIAX 2006 35 2,368 - 935 5,457 25.0 - 2.0 2.0 72 2.6
Notebooks 2006 TIAX 2008 39 2,383 - 918 5,458 25.0 - 2.0 2.0 72 2.8
AEC
(TWh/yr)Device Subcategory Year Study
Installed
Base
(Million)
Usage Power
UEC
(kWh/yr)
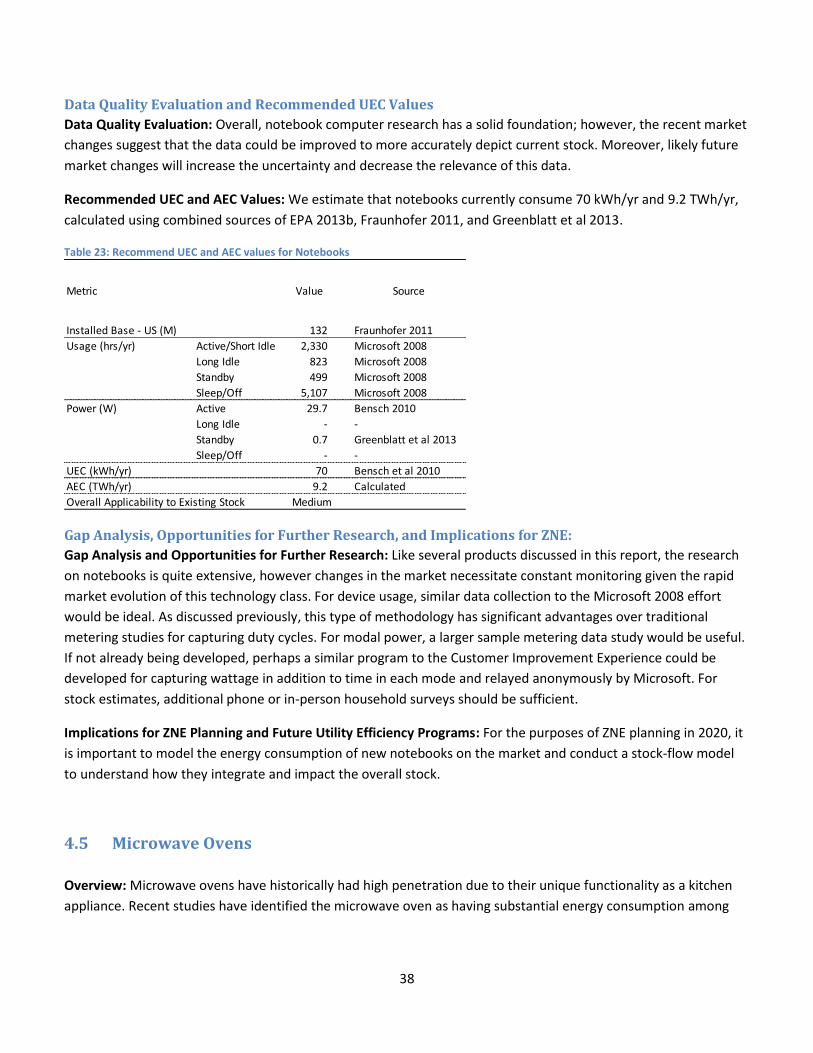
38
Data Quality Evaluation and Recommended UEC Values
Data Quality Evaluation: Overall, notebook computer research has a solid foundation; however, the recent market
changes suggest that the data could be improved to more accurately depict current stock. Moreover, likely future
market changes will increase the uncertainty and decrease the relevance of this data.
Recommended UEC and AEC Values: We estimate that notebooks currently consume 70 kWh/yr and 9.2 TWh/yr,
calculated using combined sources of EPA 2013b, Fraunhofer 2011, and Greenblatt et al 2013.
Table 23: Recommend UEC and AEC values for Notebooks
Gap Analysis, Opportunities for Further Research, and Implications for ZNE:
Gap Analysis and Opportunities for Further Research: Like several products discussed in this report, the research
on notebooks is quite extensive, however changes in the market necessitate constant monitoring given the rapid
market evolution of this technology class. For device usage, similar data collection to the Microsoft 2008 effort
would be ideal. As discussed previously, this type of methodology has significant advantages over traditional
metering studies for capturing duty cycles. For modal power, a larger sample metering data study would be useful.
If not already being developed, perhaps a similar program to the Customer Improvement Experience could be
developed for capturing wattage in addition to time in each mode and relayed anonymously by Microsoft. For
stock estimates, additional phone or in-person household surveys should be sufficient.
Implications for ZNE Planning and Future Utility Efficiency Programs: For the purposes of ZNE planning in 2020, it
is important to model the energy consumption of new notebooks on the market and conduct a stock-flow model
to understand how they integrate and impact the overall stock.
4.5 Microwave Ovens
Overview: Microwave ovens have historically had high penetration due to their unique functionality as a kitchen
appliance. Recent studies have identified the microwave oven as having substantial energy consumption among
Metric Value Source
Installed Base - US (M) 132 Fraunhofer 2011
Usage (hrs/yr) Active/Short Idle 2,330 Microsoft 2008
Long Idle 823 Microsoft 2008
Standby 499 Microsoft 2008
Sleep/Off 5,107 Microsoft 2008
Power (W) Active 29.7 Bensch 2010
Long Idle - -
Standby 0.7 Greenblatt et al 2013
Sleep/Off - -
UEC (kWh/yr) 70 Bensch et al 2010
AEC (TWh/yr) 9.2 Calculated
Overall Applicability to Existing Stock Medium
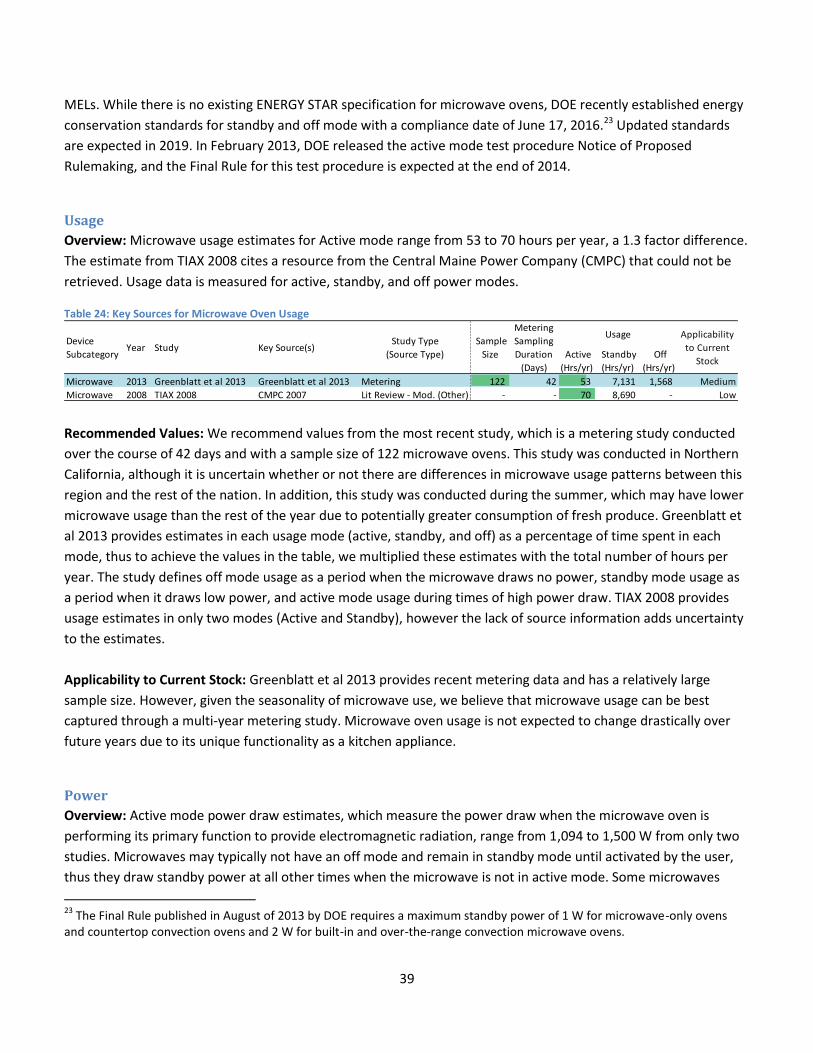
39
MELs. While there is no existing ENERGY STAR specification for microwave ovens, DOE recently established energy
conservation standards for standby and off mode with a compliance date of June 17, 2016.23 Updated standards
are expected in 2019. In February 2013, DOE released the active mode test procedure Notice of Proposed
Rulemaking, and the Final Rule for this test procedure is expected at the end of 2014.
Usage
Overview: Microwave usage estimates for Active mode range from 53 to 70 hours per year, a 1.3 factor difference.
The estimate from TIAX 2008 cites a resource from the Central Maine Power Company (CMPC) that could not be
retrieved. Usage data is measured for active, standby, and off power modes.
Table 24: Key Sources for Microwave Oven Usage
Recommended Values: We recommend values from the most recent study, which is a metering study conducted
over the course of 42 days and with a sample size of 122 microwave ovens. This study was conducted in Northern
California, although it is uncertain whether or not there are differences in microwave usage patterns between this
region and the rest of the nation. In addition, this study was conducted during the summer, which may have lower
microwave usage than the rest of the year due to potentially greater consumption of fresh produce. Greenblatt et
al 2013 provides estimates in each usage mode (active, standby, and off) as a percentage of time spent in each
mode, thus to achieve the values in the table, we multiplied these estimates with the total number of hours per
year. The study defines off mode usage as a period when the microwave draws no power, standby mode usage as
a period when it draws low power, and active mode usage during times of high power draw. TIAX 2008 provides
usage estimates in only two modes (Active and Standby), however the lack of source information adds uncertainty
to the estimates.
Applicability to Current Stock: Greenblatt et al 2013 provides recent metering data and has a relatively large
sample size. However, given the seasonality of microwave use, we believe that microwave usage can be best
captured through a multi-year metering study. Microwave oven usage is not expected to change drastically over
future years due to its unique functionality as a kitchen appliance.
Power
Overview: Active mode power draw estimates, which measure the power draw when the microwave oven is
performing its primary function to provide electromagnetic radiation, range from 1,094 to 1,500 W from only two
studies. Microwaves may typically not have an off mode and remain in standby mode until activated by the user,
thus they draw standby power at all other times when the microwave is not in active mode. Some microwaves
23
The Final Rule published in August of 2013 by DOE requires a maximum standby power of 1 W for microwave-only ovens and countertop convection ovens and 2 W for built-in and over-the-range convection microwave ovens.
Active
(Hrs/yr)
Standby
(Hrs/yr)
Off
(Hrs/yr)
Microwave 2013 Greenblatt et al 2013 Greenblatt et al 2013 Metering 122 42 53 7,131 1,568 Medium
Microwave 2008 TIAX 2008 CMPC 2007 Lit Review - Mod. (Other) - - 70 8,690 - Low
Device
SubcategoryYear Study Key Source(s)
Study Type
(Source Type)
Sample
Size
Metering
Sampling
Duration
(Days)
Usage Applicability
to Current
Stock

40
allow users to actively select the power level most appropriate for their use, which directly impacts active mode
power draw. DOE standards for microwave ovens in standby and off mode allow a maximum standby power draw
of only 1 W and will go into effect in June 2016. This is expected to substantially decrease the power draw in
standby mode over the next decade as new products meeting this requirement begin to penetrate the existing
stock.
Table 25: Key Sources for Microwave Oven Power Estimates
Recommended Values: We recommend using the power estimates from Greenblatt et al 2013 due to its large
sample size and extensive metering duration. The duration of the metering study is also large enough to capture
the variability in active mode power levels that end users have the capability to alter. Based on the definition of off
mode provided in the study, we assumed off mode power draw to be 0 W even though an estimate for this mode
was not explicitly stated
Applicability to Current Stock: We believe these estimates to have medium applicability to the current stock.
Active Mode power draw estimates for existing stock are not expected to change significantly until Federal or state
standards regulate active mode power draw. Federal rulemakings for standby mode power draw may decrease the
standby power draw. However, this may be limited, since the standby power estimate of 1.9 W is already close to
the adopted standard of 1 W. This slight decrease will result in roughly 10% overall energy savings.24
Installed Base
Overview: Based on two studies, installed base estimates range from 110 to 116 million microwave ovens across
the United States. The most recent source is based on the Residential Energy Consumption Survey (RECS)
conducted by the EIA in 2009. The previous installed base estimate is based on market research from Appliance
Magazine. Both are credible sources of installed base information.
Table 26: Key Sources for Microwave Oven Installed Base Estimates
Recommended Values: We recommend the installed base estimate from ACEEE 2013, which cites the 2009 RECS
survey. This survey collected data from 12,083 households nationally which are meant to represent housing units
across the United States. The estimate from TIAX 2008 which cites market research from 2005 may slightly
24
Based on the estimate of 7,131 hours in standby mode, a decrease of 0.9 W corresponds to a decrease of 6.4 kWh/yr.
Active
(W)
Standby
(W)
Off
(W)
Microwave 2013 Greenblatt et al 2013 Greenblatt et al 2013 Metering 122 42 1094.3 1.9 0.0 71 Medium
Microwave 2013 ACEEE 2013 Parekh and Wang 2012, TIAX 2008 Lit Review - Mod. - - - - - 121 Low
Microwave 2012 Parekh and Wang Parekh and Wang 2012 Survey 720 - - - - 111 Low
Microwave 2008 Tiax 2008 ADL 1998 Lit. Review - Mod. - - 1500.0 3.0 131 Medium
StudyDevice
SubcategoryYear Key Source(s)
Study Type
(Source Type)
Sample
Size
Metering
Sampling
Duration
(Days)
Applicability
to current
stock
PowerUEC
(kWh/yr)
Microwave 2013 ACEEE 2013 EIA 2009 Lit Review - Unmod. (Survey) National - 116.0 15.0 High
Microwave 2008 TIAX 2008 Appliance Magazine 2005a, 2005b Market Research National - 110.0 14.4 Medium
Sample
Size
Installed
Base
(Million)
AEC
(TWh/yr)
Applicability
to current
stock
Installed
Base
Geography
Device
SubcategoryYear Study Key Source(s) Study Type
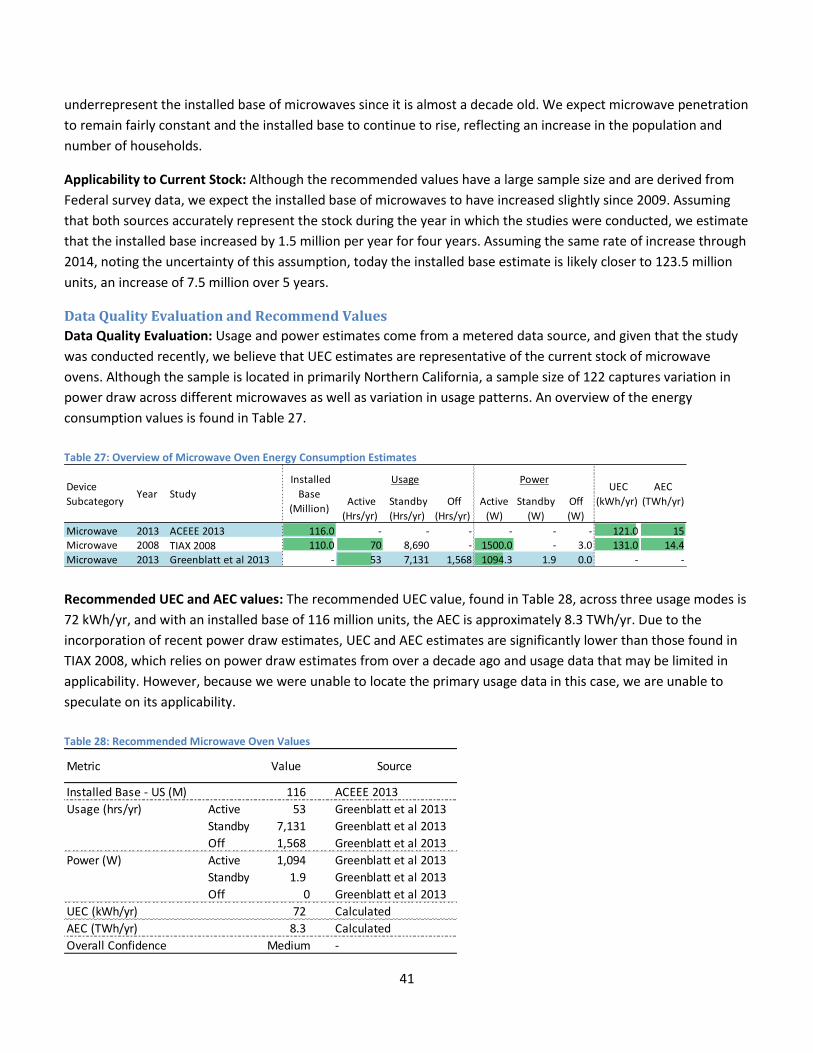
41
underrepresent the installed base of microwaves since it is almost a decade old. We expect microwave penetration
to remain fairly constant and the installed base to continue to rise, reflecting an increase in the population and
number of households.
Applicability to Current Stock: Although the recommended values have a large sample size and are derived from
Federal survey data, we expect the installed base of microwaves to have increased slightly since 2009. Assuming
that both sources accurately represent the stock during the year in which the studies were conducted, we estimate
that the installed base increased by 1.5 million per year for four years. Assuming the same rate of increase through
2014, noting the uncertainty of this assumption, today the installed base estimate is likely closer to 123.5 million
units, an increase of 7.5 million over 5 years.
Data Quality Evaluation and Recommend Values
Data Quality Evaluation: Usage and power estimates come from a metered data source, and given that the study
was conducted recently, we believe that UEC estimates are representative of the current stock of microwave
ovens. Although the sample is located in primarily Northern California, a sample size of 122 captures variation in
power draw across different microwaves as well as variation in usage patterns. An overview of the energy
consumption values is found in Table 27.
Table 27: Overview of Microwave Oven Energy Consumption Estimates
Recommended UEC and AEC values: The recommended UEC value, found in Table 28, across three usage modes is
72 kWh/yr, and with an installed base of 116 million units, the AEC is approximately 8.3 TWh/yr. Due to the
incorporation of recent power draw estimates, UEC and AEC estimates are significantly lower than those found in
TIAX 2008, which relies on power draw estimates from over a decade ago and usage data that may be limited in
applicability. However, because we were unable to locate the primary usage data in this case, we are unable to
speculate on its applicability.
Table 28: Recommended Microwave Oven Values
Active
(Hrs/yr)
Standby
(Hrs/yr)
Off
(Hrs/yr)
Active
(W)
Standby
(W)
Off
(W)
Microwave 2013 ACEEE 2013 116.0 - - - - - - 121.0 15
Microwave 2008 TIAX 2008 110.0 70 8,690 - 1500.0 - 3.0 131.0 14.4
Microwave 2013 Greenblatt et al 2013 - 53 7,131 1,568 1094.3 1.9 0.0 - -
AEC
(TWh/yr)
Device
SubcategoryYear Study
Installed
Base
(Million)
Usage Power UEC
(kWh/yr)
Metric Value Source
Installed Base - US (M) 116 ACEEE 2013
Usage (hrs/yr) Active 53 Greenblatt et al 2013
Standby 7,131 Greenblatt et al 2013
Off 1,568 Greenblatt et al 2013
Power (W) Active 1,094 Greenblatt et al 2013
Standby 1.9 Greenblatt et al 2013
Off 0 Greenblatt et al 2013
UEC (kWh/yr) 72 Calculated
AEC (TWh/yr) 8.3 Calculated
Overall Confidence Medium -
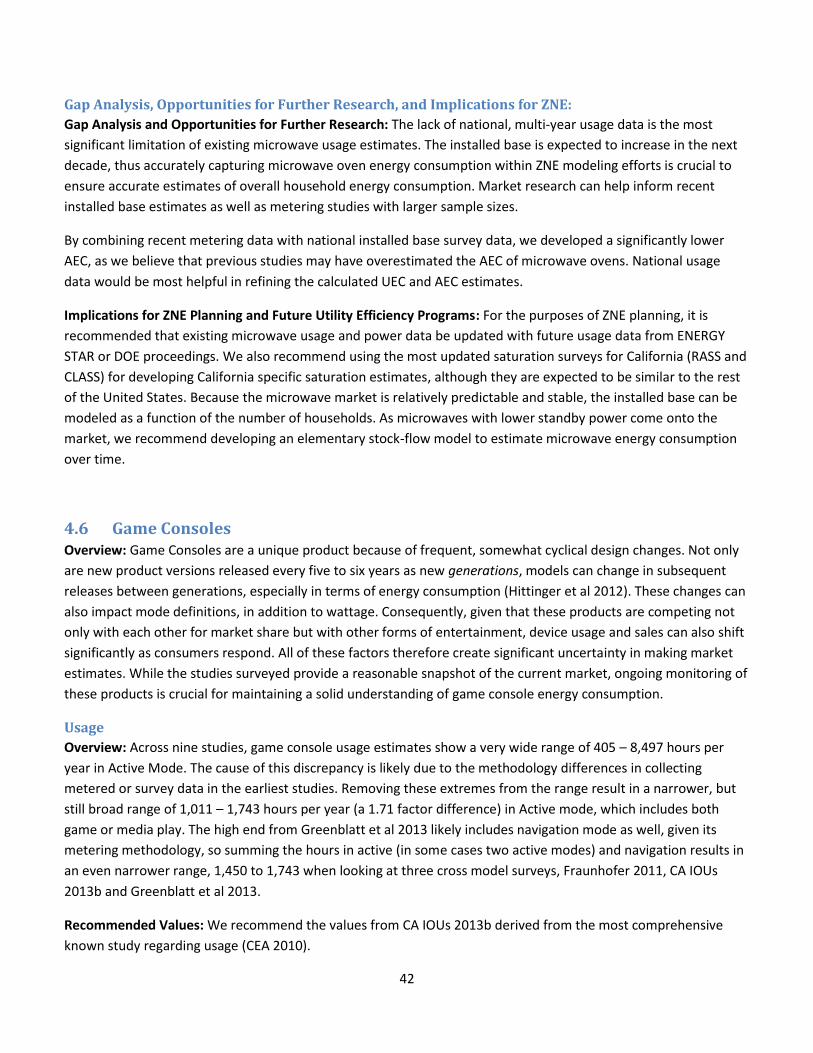
42
Gap Analysis, Opportunities for Further Research, and Implications for ZNE:
Gap Analysis and Opportunities for Further Research: The lack of national, multi-year usage data is the most
significant limitation of existing microwave usage estimates. The installed base is expected to increase in the next
decade, thus accurately capturing microwave oven energy consumption within ZNE modeling efforts is crucial to
ensure accurate estimates of overall household energy consumption. Market research can help inform recent
installed base estimates as well as metering studies with larger sample sizes.
By combining recent metering data with national installed base survey data, we developed a significantly lower
AEC, as we believe that previous studies may have overestimated the AEC of microwave ovens. National usage
data would be most helpful in refining the calculated UEC and AEC estimates.
Implications for ZNE Planning and Future Utility Efficiency Programs: For the purposes of ZNE planning, it is
recommended that existing microwave usage and power data be updated with future usage data from ENERGY
STAR or DOE proceedings. We also recommend using the most updated saturation surveys for California (RASS and
CLASS) for developing California specific saturation estimates, although they are expected to be similar to the rest
of the United States. Because the microwave market is relatively predictable and stable, the installed base can be
modeled as a function of the number of households. As microwaves with lower standby power come onto the
market, we recommend developing an elementary stock-flow model to estimate microwave energy consumption
over time.
4.6 Game Consoles Overview: Game Consoles are a unique product because of frequent, somewhat cyclical design changes. Not only
are new product versions released every five to six years as new generations, models can change in subsequent
releases between generations, especially in terms of energy consumption (Hittinger et al 2012). These changes can
also impact mode definitions, in addition to wattage. Consequently, given that these products are competing not
only with each other for market share but with other forms of entertainment, device usage and sales can also shift
significantly as consumers respond. All of these factors therefore create significant uncertainty in making market
estimates. While the studies surveyed provide a reasonable snapshot of the current market, ongoing monitoring of
these products is crucial for maintaining a solid understanding of game console energy consumption.
Usage
Overview: Across nine studies, game console usage estimates show a very wide range of 405 – 8,497 hours per
year in Active Mode. The cause of this discrepancy is likely due to the methodology differences in collecting
metered or survey data in the earliest studies. Removing these extremes from the range result in a narrower, but
still broad range of 1,011 – 1,743 hours per year (a 1.71 factor difference) in Active mode, which includes both
game or media play. The high end from Greenblatt et al 2013 likely includes navigation mode as well, given its
metering methodology, so summing the hours in active (in some cases two active modes) and navigation results in
an even narrower range, 1,450 to 1,743 when looking at three cross model surveys, Fraunhofer 2011, CA IOUs
2013b and Greenblatt et al 2013.
Recommended Values: We recommend the values from CA IOUs 2013b derived from the most comprehensive
known study regarding usage (CEA 2010).
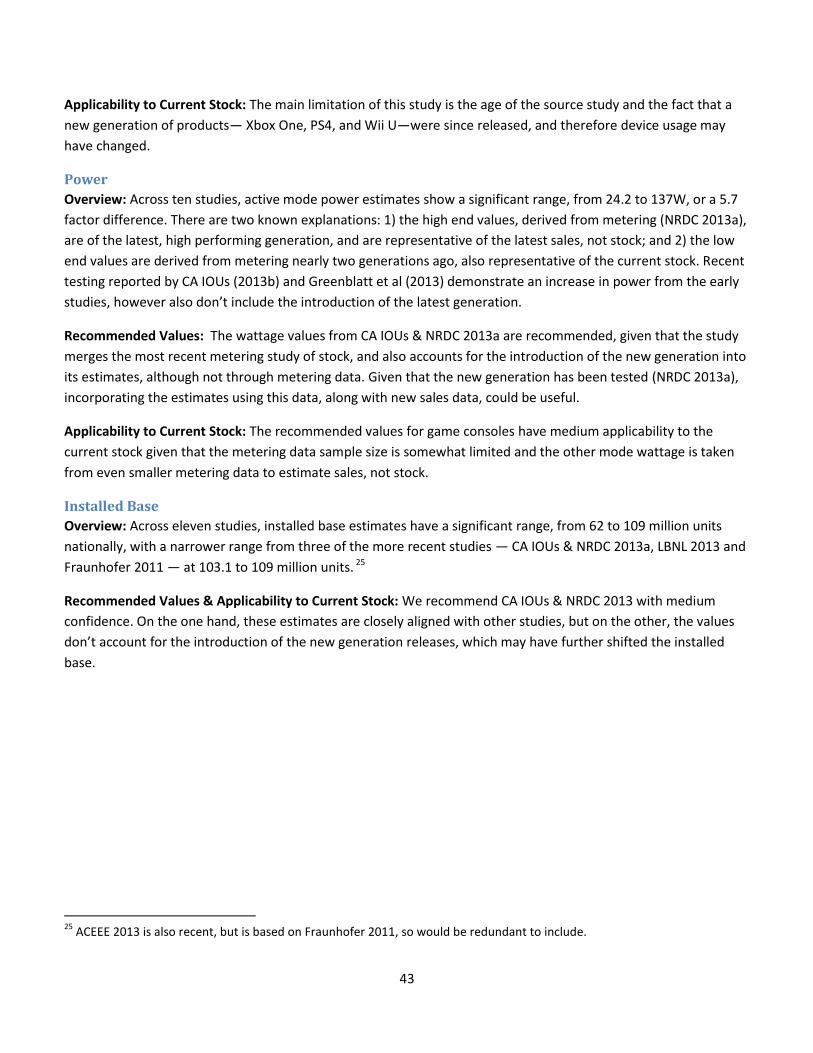
43
Applicability to Current Stock: The main limitation of this study is the age of the source study and the fact that a
new generation of products— Xbox One, PS4, and Wii U—were since released, and therefore device usage may
have changed.
Power
Overview: Across ten studies, active mode power estimates show a significant range, from 24.2 to 137W, or a 5.7
factor difference. There are two known explanations: 1) the high end values, derived from metering (NRDC 2013a),
are of the latest, high performing generation, and are representative of the latest sales, not stock; and 2) the low
end values are derived from metering nearly two generations ago, also representative of the current stock. Recent
testing reported by CA IOUs (2013b) and Greenblatt et al (2013) demonstrate an increase in power from the early
studies, however also don’t include the introduction of the latest generation.
Recommended Values: The wattage values from CA IOUs & NRDC 2013a are recommended, given that the study
merges the most recent metering study of stock, and also accounts for the introduction of the new generation into
its estimates, although not through metering data. Given that the new generation has been tested (NRDC 2013a),
incorporating the estimates using this data, along with new sales data, could be useful.
Applicability to Current Stock: The recommended values for game consoles have medium applicability to the
current stock given that the metering data sample size is somewhat limited and the other mode wattage is taken
from even smaller metering data to estimate sales, not stock.
Installed Base
Overview: Across eleven studies, installed base estimates have a significant range, from 62 to 109 million units
nationally, with a narrower range from three of the more recent studies — CA IOUs & NRDC 2013a, LBNL 2013 and
Fraunhofer 2011 — at 103.1 to 109 million units. 25
Recommended Values & Applicability to Current Stock: We recommend CA IOUs & NRDC 2013 with medium
confidence. On the one hand, these estimates are closely aligned with other studies, but on the other, the values
don’t account for the introduction of the new generation releases, which may have further shifted the installed
base.
25
ACEEE 2013 is also recent, but is based on Fraunhofer 2011, so would be redundant to include.
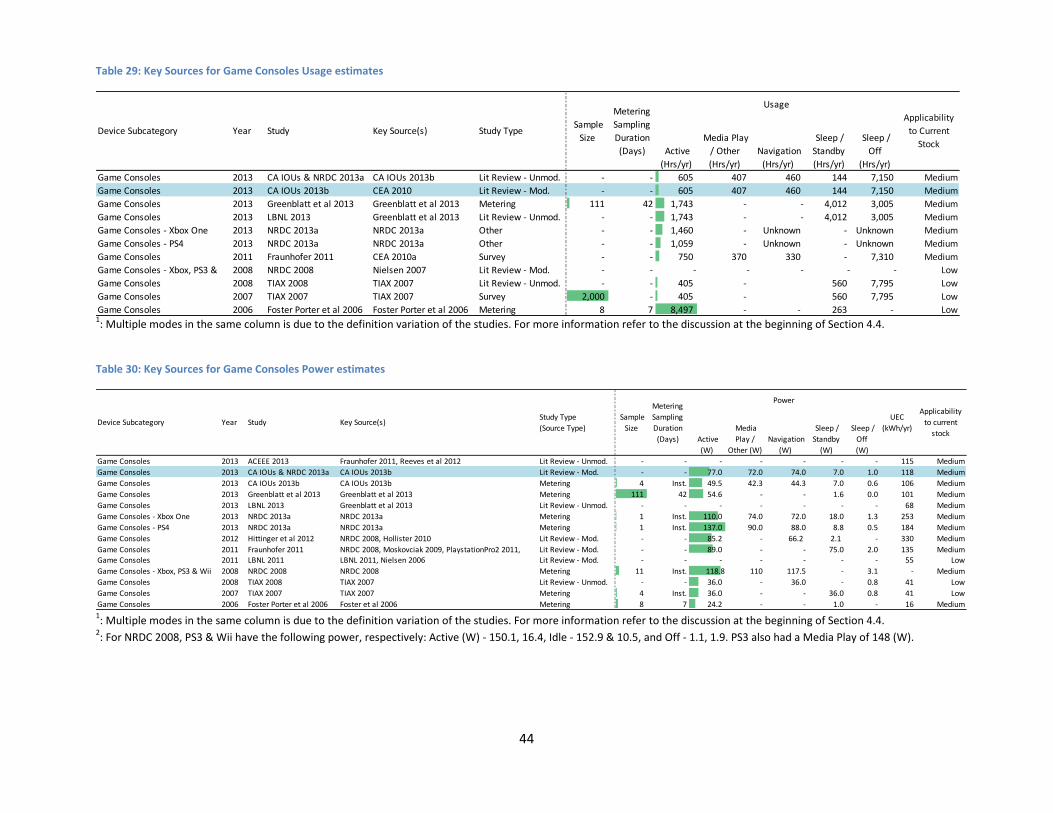
44
Table 29: Key Sources for Game Consoles Usage estimates
1: Multiple modes in the same column is due to the definition variation of the studies. For more information refer to the discussion at the beginning of Section 4.4.
Table 30: Key Sources for Game Consoles Power estimates
1: Multiple modes in the same column is due to the definition variation of the studies. For more information refer to the discussion at the beginning of Section 4.4.
2: For NRDC 2008, PS3 & Wii have the following power, respectively: Active (W) - 150.1, 16.4, Idle - 152.9 & 10.5, and Off - 1.1, 1.9. PS3 also had a Media Play of 148 (W).
Active
(Hrs/yr)
Media Play
/ Other
(Hrs/yr)
Navigation
(Hrs/yr)
Sleep /
Standby
(Hrs/yr)
Sleep /
Off
(Hrs/yr)
Game Consoles 2013 CA IOUs & NRDC 2013a CA IOUs 2013b Lit Review - Unmod. - - 605 407 460 144 7,150 Medium
Game Consoles 2013 CA IOUs 2013b CEA 2010 Lit Review - Mod. - - 605 407 460 144 7,150 Medium
Game Consoles 2013 Greenblatt et al 2013 Greenblatt et al 2013 Metering 111 42 1,743 - - 4,012 3,005 Medium
Game Consoles 2013 LBNL 2013 Greenblatt et al 2013 Lit Review - Unmod. - - 1,743 - - 4,012 3,005 Medium
Game Consoles - Xbox One 2013 NRDC 2013a NRDC 2013a Other - - 1,460 - Unknown - Unknown Medium
Game Consoles - PS4 2013 NRDC 2013a NRDC 2013a Other - - 1,059 - Unknown - Unknown Medium
Game Consoles 2011 Fraunhofer 2011 CEA 2010a Survey - - 750 370 330 - 7,310 Medium
Game Consoles - Xbox, PS3 & 2008 NRDC 2008 Nielsen 2007 Lit Review - Mod. - - - - - - - Low
Game Consoles 2008 TIAX 2008 TIAX 2007 Lit Review - Unmod. - - 405 - 560 7,795 Low
Game Consoles 2007 TIAX 2007 TIAX 2007 Survey 2,000 - 405 - 560 7,795 Low
Game Consoles 2006 Foster Porter et al 2006 Foster Porter et al 2006 Metering 8 7 8,497 - - 263 - Low
Device Subcategory Year Study Key Source(s) Study Type Sample
Size
Metering
Sampling
Duration
(Days)
Usage
Applicability
to Current
Stock
Active
(W)
Media
Play /
Other (W)
Navigation
(W)
Sleep /
Standby
(W)
Sleep /
Off
(W)
Game Consoles 2013 ACEEE 2013 Fraunhofer 2011, Reeves et al 2012 Lit Review - Unmod. - - - - - - - 115 Medium
Game Consoles 2013 CA IOUs & NRDC 2013a CA IOUs 2013b Lit Review - Mod. - - 77.0 72.0 74.0 7.0 1.0 118 Medium
Game Consoles 2013 CA IOUs 2013b CA IOUs 2013b Metering 4 Inst. 49.5 42.3 44.3 7.0 0.6 106 Medium
Game Consoles 2013 Greenblatt et al 2013 Greenblatt et al 2013 Metering 111 42 54.6 - - 1.6 0.0 101 Medium
Game Consoles 2013 LBNL 2013 Greenblatt et al 2013 Lit Review - Unmod. - - - - - - - 68 Medium
Game Consoles - Xbox One 2013 NRDC 2013a NRDC 2013a Metering 1 Inst. 110.0 74.0 72.0 18.0 1.3 253 Medium
Game Consoles - PS4 2013 NRDC 2013a NRDC 2013a Metering 1 Inst. 137.0 90.0 88.0 8.8 0.5 184 Medium
Game Consoles 2012 Hittinger et al 2012 NRDC 2008, Hollister 2010 Lit Review - Mod. - - 85.2 - 66.2 2.1 - 330 Medium
Game Consoles 2011 Fraunhofer 2011 NRDC 2008, Moskovciak 2009, PlaystationPro2 2011, Lit Review - Mod. - - 89.0 - - 75.0 2.0 135 MediumGame Consoles 2011 LBNL 2011 LBNL 2011, Nielsen 2006 Lit Review - Mod. - - - - - - - 55 Low
Game Consoles - Xbox, PS3 & Wii 2008 NRDC 2008 NRDC 2008 Metering 11 Inst. 118.8 110 117.5 - 3.1 - Medium
Game Consoles 2008 TIAX 2008 TIAX 2007 Lit Review - Unmod. - - 36.0 - 36.0 - 0.8 41 Low
Game Consoles 2007 TIAX 2007 TIAX 2007 Metering 4 Inst. 36.0 - - 36.0 0.8 41 Low
Game Consoles 2006 Foster Porter et al 2006 Foster et al 2006 Metering 8 7 24.2 - - 1.0 - 16 Medium
a: multiple mode titles in the same column is due to the definition variation of the studies. More information about each study and their definition can be found in the supporting documentation
Key Source(s)Study Type
(Source Type)
Sample
Size
Metering
Sampling
Duration
(Days)
Applicability
to current
stock
UEC
(kWh/yr)
Power
StudyDevice Subcategory Year
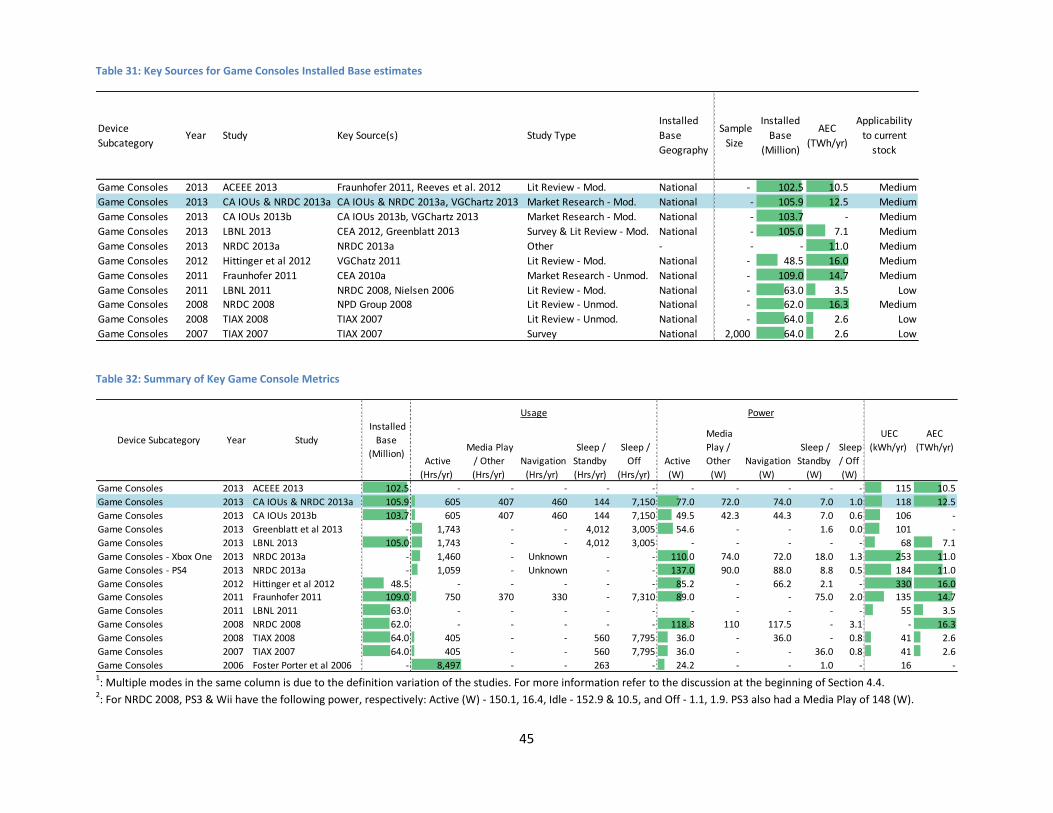
45
Table 31: Key Sources for Game Consoles Installed Base estimates
Table 32: Summary of Key Game Console Metrics
1: Multiple modes in the same column is due to the definition variation of the studies. For more information refer to the discussion at the beginning of Section 4.4.
2: For NRDC 2008, PS3 & Wii have the following power, respectively: Active (W) - 150.1, 16.4, Idle - 152.9 & 10.5, and Off - 1.1, 1.9. PS3 also had a Media Play of 148 (W).
Game Consoles 2013 ACEEE 2013 Fraunhofer 2011, Reeves et al. 2012 Lit Review - Mod. National - 102.5 10.5 Medium
Game Consoles 2013 CA IOUs & NRDC 2013a CA IOUs & NRDC 2013a, VGChartz 2013 Market Research - Mod. National - 105.9 12.5 Medium
Game Consoles 2013 CA IOUs 2013b CA IOUs 2013b, VGChartz 2013 Market Research - Mod. National - 103.7 - Medium
Game Consoles 2013 LBNL 2013 CEA 2012, Greenblatt 2013 Survey & Lit Review - Mod. National - 105.0 7.1 Medium
Game Consoles 2013 NRDC 2013a NRDC 2013a Other - - - 11.0 Medium
Game Consoles 2012 Hittinger et al 2012 VGChatz 2011 Lit Review - Mod. National - 48.5 16.0 Medium
Game Consoles 2011 Fraunhofer 2011 CEA 2010a Market Research - Unmod. National - 109.0 14.7 Medium
Game Consoles 2011 LBNL 2011 NRDC 2008, Nielsen 2006 Lit Review - Mod. National - 63.0 3.5 Low
Game Consoles 2008 NRDC 2008 NPD Group 2008 Lit Review - Unmod. National - 62.0 16.3 Medium
Game Consoles 2008 TIAX 2008 TIAX 2007 Lit Review - Unmod. National - 64.0 2.6 Low
Game Consoles 2007 TIAX 2007 TIAX 2007 Survey National 2,000 64.0 2.6 Low
Sample
Size
Installed
Base
(Million)
AEC
(TWh/yr)
Applicability
to current
stock
Installed
Base
Geography
Device
SubcategoryYear Study Key Source(s) Study Type
Active
(Hrs/yr)
Media Play
/ Other
(Hrs/yr)
Navigation
(Hrs/yr)
Sleep /
Standby
(Hrs/yr)
Sleep /
Off
(Hrs/yr)
Active
(W)
Media
Play /
Other
(W)
Navigation
(W)
Sleep /
Standby
(W)
Sleep
/ Off
(W)
Game Consoles 2013 ACEEE 2013 102.5 - - - - - - - - - - 115 10.5
Game Consoles 2013 CA IOUs & NRDC 2013a 105.9 605 407 460 144 7,150 77.0 72.0 74.0 7.0 1.0 118 12.5
Game Consoles 2013 CA IOUs 2013b 103.7 605 407 460 144 7,150 49.5 42.3 44.3 7.0 0.6 106 -
Game Consoles 2013 Greenblatt et al 2013 - 1,743 - - 4,012 3,005 54.6 - - 1.6 0.0 101 -
Game Consoles 2013 LBNL 2013 105.0 1,743 - - 4,012 3,005 - - - - - 68 7.1
Game Consoles - Xbox One 2013 NRDC 2013a - 1,460 - Unknown - - 110.0 74.0 72.0 18.0 1.3 253 11.0
Game Consoles - PS4 2013 NRDC 2013a - 1,059 - Unknown - - 137.0 90.0 88.0 8.8 0.5 184 11.0
Game Consoles 2012 Hittinger et al 2012 48.5 - - - - - 85.2 - 66.2 2.1 - 330 16.0
Game Consoles 2011 Fraunhofer 2011 109.0 750 370 330 - 7,310 89.0 - - 75.0 2.0 135 14.7
Game Consoles 2011 LBNL 2011 63.0 - - - - - - - - - - 55 3.5
Game Consoles 2008 NRDC 2008 62.0 - - - - - 118.8 110 117.5 - 3.1 - 16.3
Game Consoles 2008 TIAX 2008 64.0 405 - - 560 7,795 36.0 - 36.0 - 0.8 41 2.6
Game Consoles 2007 TIAX 2007 64.0 405 - - 560 7,795 36.0 - - 36.0 0.8 41 2.6
Game Consoles 2006 Foster Porter et al 2006 - 8,497 - - 263 - 24.2 - - 1.0 - 16 -
AEC
(TWh/yr)Device Subcategory Year Study
Installed
Base
(Million)
Usage Power
UEC
(kWh/yr)
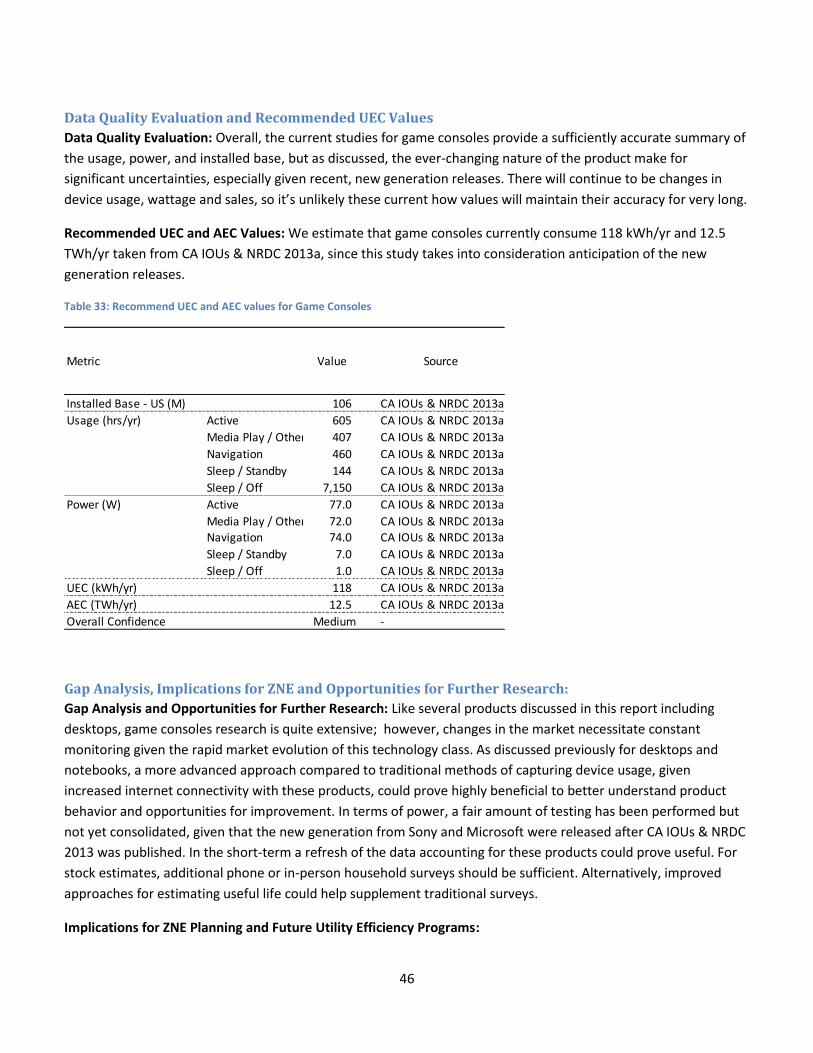
46
Data Quality Evaluation and Recommended UEC Values
Data Quality Evaluation: Overall, the current studies for game consoles provide a sufficiently accurate summary of
the usage, power, and installed base, but as discussed, the ever-changing nature of the product make for
significant uncertainties, especially given recent, new generation releases. There will continue to be changes in
device usage, wattage and sales, so it’s unlikely these current how values will maintain their accuracy for very long.
Recommended UEC and AEC Values: We estimate that game consoles currently consume 118 kWh/yr and 12.5
TWh/yr taken from CA IOUs & NRDC 2013a, since this study takes into consideration anticipation of the new
generation releases.
Table 33: Recommend UEC and AEC values for Game Consoles
Gap Analysis, Implications for ZNE and Opportunities for Further Research:
Gap Analysis and Opportunities for Further Research: Like several products discussed in this report including
desktops, game consoles research is quite extensive; however, changes in the market necessitate constant
monitoring given the rapid market evolution of this technology class. As discussed previously for desktops and
notebooks, a more advanced approach compared to traditional methods of capturing device usage, given
increased internet connectivity with these products, could prove highly beneficial to better understand product
behavior and opportunities for improvement. In terms of power, a fair amount of testing has been performed but
not yet consolidated, given that the new generation from Sony and Microsoft were released after CA IOUs & NRDC
2013 was published. In the short-term a refresh of the data accounting for these products could prove useful. For
stock estimates, additional phone or in-person household surveys should be sufficient. Alternatively, improved
approaches for estimating useful life could help supplement traditional surveys.
Implications for ZNE Planning and Future Utility Efficiency Programs:
Metric Value Source
Installed Base - US (M) 106 CA IOUs & NRDC 2013a
Usage (hrs/yr) Active 605 CA IOUs & NRDC 2013a
Media Play / Other 407 CA IOUs & NRDC 2013a
Navigation 460 CA IOUs & NRDC 2013a
Sleep / Standby 144 CA IOUs & NRDC 2013a
Sleep / Off 7,150 CA IOUs & NRDC 2013a
Power (W) Active 77.0 CA IOUs & NRDC 2013a
Media Play / Other 72.0 CA IOUs & NRDC 2013aNavigation 74.0 CA IOUs & NRDC 2013a
Sleep / Standby 7.0 CA IOUs & NRDC 2013a
Sleep / Off 1.0 CA IOUs & NRDC 2013a
UEC (kWh/yr) 118 CA IOUs & NRDC 2013a
AEC (TWh/yr) 12.5 CA IOUs & NRDC 2013a
Overall Confidence Medium -
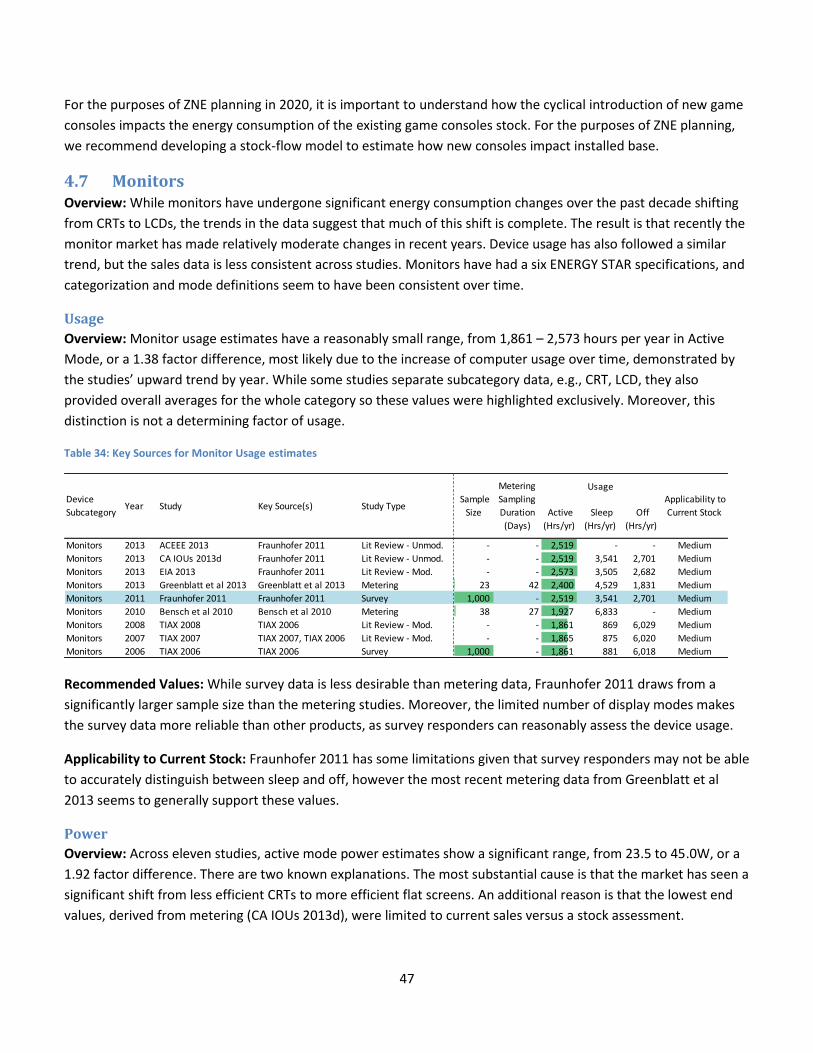
47
For the purposes of ZNE planning in 2020, it is important to understand how the cyclical introduction of new game
consoles impacts the energy consumption of the existing game consoles stock. For the purposes of ZNE planning,
we recommend developing a stock-flow model to estimate how new consoles impact installed base.
4.7 Monitors Overview: While monitors have undergone significant energy consumption changes over the past decade shifting
from CRTs to LCDs, the trends in the data suggest that much of this shift is complete. The result is that recently the
monitor market has made relatively moderate changes in recent years. Device usage has also followed a similar
trend, but the sales data is less consistent across studies. Monitors have had a six ENERGY STAR specifications, and
categorization and mode definitions seem to have been consistent over time.
Usage
Overview: Monitor usage estimates have a reasonably small range, from 1,861 – 2,573 hours per year in Active
Mode, or a 1.38 factor difference, most likely due to the increase of computer usage over time, demonstrated by
the studies’ upward trend by year. While some studies separate subcategory data, e.g., CRT, LCD, they also
provided overall averages for the whole category so these values were highlighted exclusively. Moreover, this
distinction is not a determining factor of usage.
Table 34: Key Sources for Monitor Usage estimates
Recommended Values: While survey data is less desirable than metering data, Fraunhofer 2011 draws from a
significantly larger sample size than the metering studies. Moreover, the limited number of display modes makes
the survey data more reliable than other products, as survey responders can reasonably assess the device usage.
Applicability to Current Stock: Fraunhofer 2011 has some limitations given that survey responders may not be able
to accurately distinguish between sleep and off, however the most recent metering data from Greenblatt et al
2013 seems to generally support these values.
Power
Overview: Across eleven studies, active mode power estimates show a significant range, from 23.5 to 45.0W, or a
1.92 factor difference. There are two known explanations. The most substantial cause is that the market has seen a
significant shift from less efficient CRTs to more efficient flat screens. An additional reason is that the lowest end
values, derived from metering (CA IOUs 2013d), were limited to current sales versus a stock assessment.
Active
(Hrs/yr)
Sleep
(Hrs/yr)
Off
(Hrs/yr)
Monitors 2013 ACEEE 2013 Fraunhofer 2011 Lit Review - Unmod. - - 2,519 - - Medium
Monitors 2013 CA IOUs 2013d Fraunhofer 2011 Lit Review - Unmod. - - 2,519 3,541 2,701 Medium
Monitors 2013 EIA 2013 Fraunhofer 2011 Lit Review - Mod. - - 2,573 3,505 2,682 Medium
Monitors 2013 Greenblatt et al 2013 Greenblatt et al 2013 Metering 23 42 2,400 4,529 1,831 Medium
Monitors 2011 Fraunhofer 2011 Fraunhofer 2011 Survey 1,000 - 2,519 3,541 2,701 Medium
Monitors 2010 Bensch et al 2010 Bensch et al 2010 Metering 38 27 1,927 6,833 - Medium
Monitors 2008 TIAX 2008 TIAX 2006 Lit Review - Mod. - - 1,861 869 6,029 Medium
Monitors 2007 TIAX 2007 TIAX 2007, TIAX 2006 Lit Review - Mod. - - 1,865 875 6,020 Medium
Monitors 2006 TIAX 2006 TIAX 2006 Survey 1,000 - 1,861 881 6,018 Medium
Metering
Sampling
Duration
(Days)
Usage Applicability to
Current Stock
Sample
Size
Device
SubcategoryYear Study Key Source(s) Study Type

48
Recommended Values: Greenblatt et al 2013 is the most recent metering study of stock, so is the recommended
value for active and sleep. Given that it does not meter off mode, we recommend using metering data from CA
IOUs 2013d for Off Mode, despite the fact that the study reflects sales instead of stock.
Table 35: Key Sources for Monitor Power estimates
Applicability to Current Stock: The recommended values for monitors have medium applicability to the current
stock given that the metering data sample size is somewhat limited and the other mode wattage is taken from
even smaller metering data to estimate sales, not stock.
Installed Base
Overview: Across eight studies, Installed Base estimates have a very large range, from 65 to 150 million units
nationally,26 but the range can be explained by the fact that the high end includes commercial sales data and the
low end is derived through sales multiplied by useful life rather than a traditional survey data. Sales may have
dropped recently given the decline in desktop computer sales as well, but this is unlikely to be a main cause for the
discrepancy even when comparing the recommended value of 96 million to the low end. It is uncertain how the
shift towards multiple screens for computer usage or the replacement of TVs with internet connected monitors will
impact the installed base of the monitor market.
Recommended Values: Although sales may have since changed, Fraunhofer 2011 is the most recent survey
performed and is referred to by several studies, so it is the recommended value.
26
This figure includes the combination of Conventional and Integrated Desktops into a single stock estimate for CA IOUs & NRDC 2013.
Active
(W)
Sleep
(W)
Off
(W)
Monitors 2013 ACEEE 2013 Fraunhofer 2011 Lit Review - Mod. - - - - - 69 Medium
Monitors 2013 CA IOUs 2013d CA IOUs 2013d Metering 6 Inst. 23.5 0.3 0.2 61 Medium
Monitors 2013 EIA 2013 Fraunhofer 2011 Lit Review - Mod. - - 34.0 1.1 0.8 99 Medium
Monitors 2013 Greenblatt et al 2013 Greenblatt et al 2013 Metering 23 42 26.0 1.0 - 67 Medium
Monitors 2011 FSEC 2011 TIAX 2008 Lit Review - Unmod. - - - - - 85 Low
Monitors 2011 Fraunhofer 2011 TIAX 2007 Lit Review - Mod. - - 36.0 1.1 0.6 97 Low
Monitors 2011 LBNL 2011 TIAX 2007a Lit Review - Unmod. - - - - - 96 Low
Monitors 2010 Bensch et al 2010 Bensch et al 2010 Metering 26 27 31.0 0.8 - 70 Medium
Monitors 2008 TIAX 2008 TIAX 2007, Roberson et al 2004 Lit Review - Unmod. - - 42.0 1.0 1.0 85 Low
Monitors 2007 TIAX 2007 ENERGY STAR 2005a, Roberson et al 2004 Lit Review - Mod. - - 42.0 1.0 1.0 85 Low
Monitors 2006 TIAX 2006 ENERGY STAR 2005a, Roberson et al 2004 Dataset & Lit Review - Mod. - - 45.0 2.0 1.0 78 Low
Key Source(s) Study Type Sample
Size
Metering
Sampling
Duration
(Days)
Applicability
to current
stock
UEC
(kWh/yr)
Power
Device
SubcategoryYear Study

49
Table 36: Key Sources for Monitor Installed Base estimates
Applicability to Current Stock: Given the large sample size, the installed base estimate is considered to be
relatively good. It is uncertain to what degree this figure considers older monitors that are no longer used but are
considered part of the installed base.
Data Quality Evaluation and Recommended UEC Values
Data Quality Evaluation: Overall, the current data for monitors is reasonably robust. There may continue to be
changes in device usage, wattage and installed base, so there is some uncertainty about how long the values
maintain their accuracy.
Table 37: Summary of Key Monitor Metrics
Recommended UEC and AEC Values: We estimate that monitors currently consume 70 kWh/yr and 6.7 TWh/yr
based on calculations using combined sources. The UEC value aligns with the most recent metered data given that
device usage is quite similar in both Fraunhofer 2011 and Greenblatt et al 2013. The AEC is significantly different
than the survey estimates given that the UEC is derived from a heavily CRT saturated market.
Monitors 2013 ACEEE 2013 Fraunhofer 2011 Lit Review - Unmod. National - 111 13.0 Medium
Monitors 2013 CA IOUs 2013d IHS 2012 (Market Research) - Mod National - 65 3.4 Medium
Monitors 2013 EIA 2013 Fraunhofer 2011 Lit Review - Mod. National - 130 12.8 Medium
Monitors 2011 Fraunhofer 2011 Fraunhofer 2011 Survey National 1,000 96 12.7 Medium
Monitors 2011 LBNL 2011 TIAX 2007a Lit Review - Unmod. National - 150 14.4 Low
Monitors 2008 TIAX 2008 TIAX 2007 Lit Review - Unmod. National - 90 7.7 Low
Monitors 2007 TIAX 2007 TIAX 2006 Lit Review - Mod. National - 90 7.6 Low
Monitors 2006 TIAX 2006 TIAX 2006 Survey National 1,000 85 7.7 Low
Sample
Size
Installed
Base
(Million)
AEC
(TWh/yr)
Applicability
to current
stock
Installed
Base
Geography
Device
SubcategoryYear Study Key Source(s)
Study Type
(Source Type)
Active
(Hrs/yr)
Sleep
(Hrs/yr)
Off
(Hrs/yr)
Active
(W)
Sleep
(W)
Off
(W)
Monitors 2013 ACEEE 2013 111 2,519 - - - - - 69 13.0
Monitors 2013 CA IOUs 2013d 65 2,519 3541 2701 23.5 0.3 0.2 61 3.4
Monitors 2013 EIA 2013 130 2,573 3505 2682 34.0 1.1 0.8 99 12.8
Monitors 2013 Greenblatt et al 2013 - 2,400 4529 1831 26.0 1.0 - 67 -
Monitors 2011 FSEC 2011 - - - - - - - 85 -
Monitors 2011 Fraunhofer 2011 96 2,519 3541 2701 36.0 1.1 0.6 97 12.7
Monitors 2011 LBNL 2011 150 - - - - - - 96 14.4
Monitors 2010 Bensch et al 2010 - 1,927 6833 - 31.0 0.8 - 70 -
Monitors 2008 TIAX 2008 90 1,861 869 6029 42.0 1.0 1.0 85 7.7
Monitors 2007 TIAX 2007 90 1,865 875 6020 42.0 1.0 1.0 85 7.6
Monitors 2006 TIAX 2006 85 1,861 881 6018 45.0 2.0 1.0 78 7.7
AEC
(TWh/yr)
Device
SubcategoryYear Study
Installed
Base
(Million)
Usage Power
UEC
(kWh/yr)
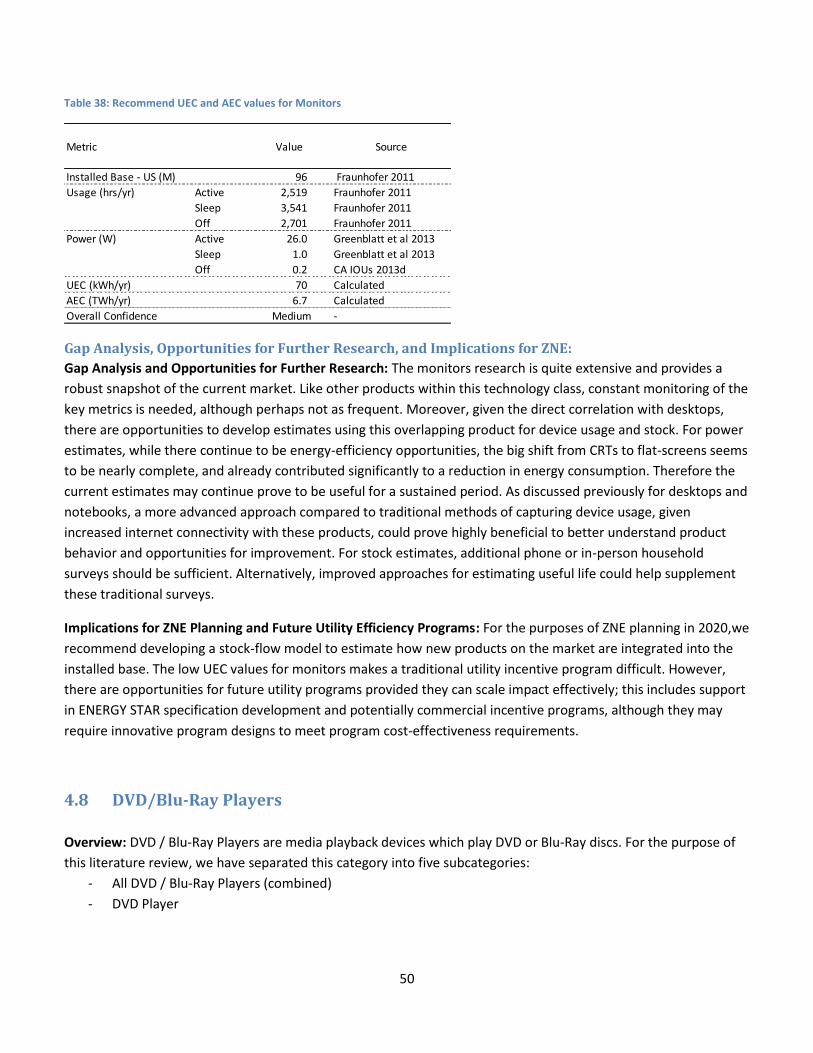
50
Table 38: Recommend UEC and AEC values for Monitors
Gap Analysis, Opportunities for Further Research, and Implications for ZNE:
Gap Analysis and Opportunities for Further Research: The monitors research is quite extensive and provides a
robust snapshot of the current market. Like other products within this technology class, constant monitoring of the
key metrics is needed, although perhaps not as frequent. Moreover, given the direct correlation with desktops,
there are opportunities to develop estimates using this overlapping product for device usage and stock. For power
estimates, while there continue to be energy-efficiency opportunities, the big shift from CRTs to flat-screens seems
to be nearly complete, and already contributed significantly to a reduction in energy consumption. Therefore the
current estimates may continue prove to be useful for a sustained period. As discussed previously for desktops and
notebooks, a more advanced approach compared to traditional methods of capturing device usage, given
increased internet connectivity with these products, could prove highly beneficial to better understand product
behavior and opportunities for improvement. For stock estimates, additional phone or in-person household
surveys should be sufficient. Alternatively, improved approaches for estimating useful life could help supplement
these traditional surveys.
Implications for ZNE Planning and Future Utility Efficiency Programs: For the purposes of ZNE planning in 2020,we
recommend developing a stock-flow model to estimate how new products on the market are integrated into the
installed base. The low UEC values for monitors makes a traditional utility incentive program difficult. However,
there are opportunities for future utility programs provided they can scale impact effectively; this includes support
in ENERGY STAR specification development and potentially commercial incentive programs, although they may
require innovative program designs to meet program cost-effectiveness requirements.
4.8 DVD/Blu-Ray Players
Overview: DVD / Blu-Ray Players are media playback devices which play DVD or Blu-Ray discs. For the purpose of
this literature review, we have separated this category into five subcategories:
- All DVD / Blu-Ray Players (combined)
- DVD Player
Metric Value Source
Installed Base - US (M) 96 Fraunhofer 2011
Usage (hrs/yr) Active 2,519 Fraunhofer 2011
Sleep 3,541 Fraunhofer 2011
Off 2,701 Fraunhofer 2011
Power (W) Active 26.0 Greenblatt et al 2013
Sleep 1.0 Greenblatt et al 2013
Off 0.2 CA IOUs 2013d
UEC (kWh/yr) 70 Calculated
AEC (TWh/yr) 6.7 Calculated
Overall Confidence Medium -
51
- DVD Recorder
- DVD / VCR Combo27
- Blu-Ray Player
Since the DVD / Blu-Ray format war28 in 2008, there has been an increase in Blu-Ray Players in the market
(Fraunhofer 2011). However, this category has been fundamentally changed with the rise of streaming content,
which may substantially decrease DVD/Blu-Ray usage. Standby Mode power draw is regulated under Title 20. DVD
/ Blu-Ray players are included under the ENERGY STAR Audio / Video specifications, with power requirements for
Active, Idle, and Standby Mode.
In addition, ENERGY STAR’s modal distinction makes it somewhat difficult to compare existing wattage
measurements with metering studies. While the ENERGY STAR method better represent actual usage, it can be
difficult to capture this in metering data. Metering data is limited in its accuracy as modes are typically determined
by thresholds (resulting in two distinct modes) rather than by mode functionality or captured through testing using
a formal test procedure.
Usage
Overview: There are four key studies which have estimated DVD / Blu-Ray Player usage since 2007. Combined
Active/Idle and Idle usage ranges from 910 – 8,432 hours. Excluding the high end from Bensch et al 2010, which
appears to be an outlier due to constant usage, the range is 910-2,993, or a 3.3 factor difference. Where possible,
we prioritized metering studies due to the limitations of survey data for products with low consumer mindshare
and its significant potential for under-reporting in Idle mode for products without an Auto Power Down (APD)
function.
Recommended Values: For DVD players, DVD / VCR Combos, and Blu-Ray players, we recommend using
Greenblatt et al 2013 due to its use of metering data.29 For DVD Recorders, we recommend using Fraunhofer 2011.
Applicability to current stock: The wide variance in usage estimates suggests there is low applicability to given
stock. While Greenblatt et al is based on metering data, it is a fairly small sample size and has a limited metering
duration, and therefore cannot account for seasonal variations in usage.
Power
Overview: Although Active Mode Power draw is relatively low for DVD Players, it accounts for the majority of
overall energy consumption. DVD Player Active Mode Power values range from 10.4-13 W, a 1.3 factor difference
(see Table 40). DVD Recorder Active Power values ranged from 11 to 20 W, a 1.9 factor difference. Active Mode for
Blu-Ray players ranged from 30.0-31.8 W, a 1.1 factor difference.
27
Because DVD / VCR Combo devices are expected to substantially decrease their usage and installed base in the future, we have excluded them from the discussion. However, they are included in the summary tables. 28
For more information on the ‘Format Wars’, see http://en.wikipedia.org/wiki/High_definition_optical_disc_format_war 29
Because Greenblatt et al combines Active and Idle modes, we recommend their study as one single value for both units. For a usage estimate of Idle Mode by itself, we recommend Fraunhofer 2011.
52
Recommended Values:
Similar to the usage values, we recommend using Greenblatt et al for DVD players, DVD/VCR Combos, and Blu-Ray
players. Due to the lack of robust metering data for DVD Recorders, we recommend Fraunhofer 2011.
Applicability to Current Stock: The use of metering and the recent data suggest that Greenblatt et al 2013 has
medium applicability to the current stock. Although the power data is relatively uniform for most categories, the
limited sample size is some cause for uncertainty. ENERGY STAR’s APD requirements took effect in 2010 as part of
the Version 2.0 specification30, and so it is likely that the existing installed base consists of both products with and
without APD enabled. As of 2012, both DVD and Blu-Ray players had ENERGY STAR market penetration of 61%,31
further suggesting that the current installed base is comprised of products both with and without APD.
Installed Base
Overview: The installed base ranges from 120-236 million units, a factor of 2.0 (see Table 41).32 It is uncertain how
the installed base will change over time. There is a potential for an increase in Blu-Ray player sales as consumers
transition from the DVD format, however it also possible that the prevalence of high-speed internet connections
and streamed content significantly decreases the stock of these players over time.
Recommended Values: We recommend using ACEEE 2013 for the entire product category, and Fraunhofer 2011
for the individual subcategories.
Applicability to Current Stock: We believe these values have medium applicability in that they are based on a 2011
survey and likely accurately capture ownership. However, it is uncertain how many of these devices are actively
being used as consumers increasingly opt to use streaming media, the use of which is likely to increase over time.
30
http://www.energystar.gov/ia/partners/product_specs/program_reqs/AV_V2_Specification.pdf 31
http://www.energystar.gov/ia/partners/downloads/unit_shipment_data/2012_USD_Summary_Report.pdf?d47b-7eee 32
The 236 million is derived by summing all units accounted for in the Fraunhofer 2011 study.

53
Table 39: Key Sources for DVD / Blu-Ray Player Usage Estimates
Active / Idle
(Hrs/yr)
Idle
(Hrs/yr)
Sleep
(Hrs/yr)
Off
(Hrs/yr)
DVD Player 2013 Greenblatt et al 2013 Greenblatt et al 2013 Metering 35 42 2,059 - 1,848 4,853 Medium
DVD Player 2011 Fraunhofer 2011 Fraunhofer 2011 Survey 1,000 - 210 700 7,850 - Low
DVD Player 2010 Bensch et al 2010 Bensch et al 2010 Metering 37 27 2,993 - - - Low
Stand-alone DVD 2008 TIAX 2008 TIAX 2007 Lit Review - Unmod. - - 270 900 - 7,590 Low
Stand-alone DVD 2007 TIAX 2007 TIAX 2007 Survey 2,000 - 270 900 - 7,590 Low
DVD Recorder 2011 Fraunhofer 2011 Fraunhofer 2011 Survey 1,000 - 410 900 7,450 - Low
DVD Recorder 2010 Bensch et al 2010 Bensch et al 2010 Metering 1 27 8,432 - - - Low
DVD Recorder 2008 TIAX 2008 TIAX 2007 Lit Review - Unmod. - - 270 900 - 7,590 Low
DVD Recorder 2007 TIAX 2007 TIAX 2007 Survey 2,000 - 270 900 - 7,590 Low
DVD/VCR Combo 2013 Greenblatt et al 2013 Greenblatt et al 2013 Metering 17 42 6,386 - 613 1,761 Medium
DVD/VCR Combo 2011 Fraunhofer 2011 Fraunhofer 2011 Survey 1,000 - 300 900 7,560 - Low
DVD/VCR Combo 2010 Bensch et al 2010 Bensch et al 2010 Metering 12 27 402 - - - Low
DVD/VCR Combo 2008 TIAX 2008 TIAX 2007 Lit Review - Unmod. - - 425 900 - 7,435 Low
DVD/VCR Combo 2007 TIAX 2007 TIAX 2007 Survey 2,000 - 420 900 - 7,440 Low
Blu-Ray Player 2013 Greenblatt et al 2013 Greenblatt et al 2013 Metering 23 42 1,226 - 1,191 6,342 Medium
Blu-Ray Player 2011 Fraunhofer 2011 Fraunhofer 2011 Survey 1,000 - 300 30 8,430 - Low
Device Subcategory Year Study Key Source(s) Study Type Sample
Size
Metering
Sampling
Duration
(Days)
Usage Applicability
to Current
Stock
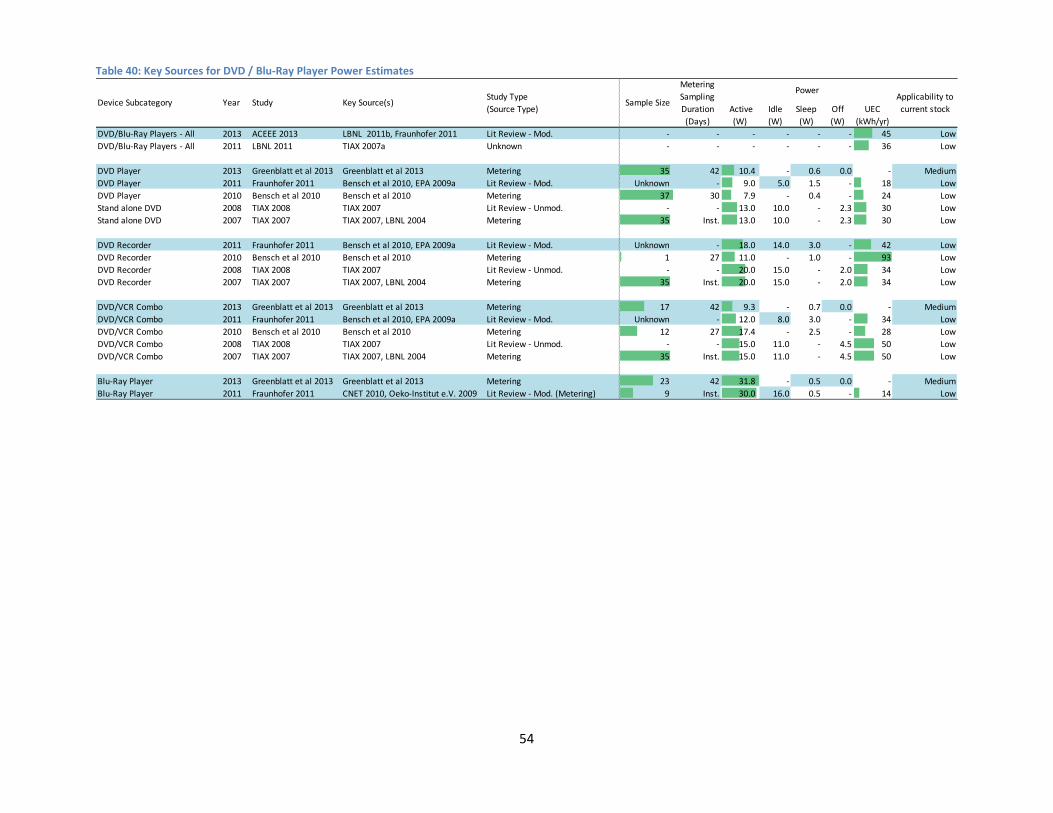
54
Table 40: Key Sources for DVD / Blu-Ray Player Power Estimates
Active
(W)
Idle
(W)
Sleep
(W)
Off
(W)
UEC
(kWh/yr)
DVD/Blu-Ray Players - All 2013 ACEEE 2013 LBNL 2011b, Fraunhofer 2011 Lit Review - Mod. - - - - - - 45 Low
DVD/Blu-Ray Players - All 2011 LBNL 2011 TIAX 2007a Unknown - - - - - - 36 Low
DVD Player 2013 Greenblatt et al 2013 Greenblatt et al 2013 Metering 35 42 10.4 - 0.6 0.0 - Medium
DVD Player 2011 Fraunhofer 2011 Bensch et al 2010, EPA 2009a Lit Review - Mod. Unknown - 9.0 5.0 1.5 - 18 Low
DVD Player 2010 Bensch et al 2010 Bensch et al 2010 Metering 37 30 7.9 - 0.4 - 24 Low
Stand alone DVD 2008 TIAX 2008 TIAX 2007 Lit Review - Unmod. - - 13.0 10.0 - 2.3 30 Low
Stand alone DVD 2007 TIAX 2007 TIAX 2007, LBNL 2004 Metering 35 Inst. 13.0 10.0 - 2.3 30 Low
DVD Recorder 2011 Fraunhofer 2011 Bensch et al 2010, EPA 2009a Lit Review - Mod. Unknown - 18.0 14.0 3.0 - 42 Low
DVD Recorder 2010 Bensch et al 2010 Bensch et al 2010 Metering 1 27 11.0 - 1.0 - 93 Low
DVD Recorder 2008 TIAX 2008 TIAX 2007 Lit Review - Unmod. - - 20.0 15.0 - 2.0 34 Low
DVD Recorder 2007 TIAX 2007 TIAX 2007, LBNL 2004 Metering 35 Inst. 20.0 15.0 - 2.0 34 Low
DVD/VCR Combo 2013 Greenblatt et al 2013 Greenblatt et al 2013 Metering 17 42 9.3 - 0.7 0.0 - Medium
DVD/VCR Combo 2011 Fraunhofer 2011 Bensch et al 2010, EPA 2009a Lit Review - Mod. Unknown - 12.0 8.0 3.0 - 34 Low
DVD/VCR Combo 2010 Bensch et al 2010 Bensch et al 2010 Metering 12 27 17.4 - 2.5 - 28 Low
DVD/VCR Combo 2008 TIAX 2008 TIAX 2007 Lit Review - Unmod. - - 15.0 11.0 - 4.5 50 Low
DVD/VCR Combo 2007 TIAX 2007 TIAX 2007, LBNL 2004 Metering 35 Inst. 15.0 11.0 - 4.5 50 Low
Blu-Ray Player 2013 Greenblatt et al 2013 Greenblatt et al 2013 Metering 23 42 31.8 - 0.5 0.0 - Medium
Blu-Ray Player 2011 Fraunhofer 2011 CNET 2010, Oeko-Institut e.V. 2009 Lit Review - Mod. (Metering) 9 Inst. 30.0 16.0 0.5 - 14 Low
Key Source(s)Study Type
(Source Type) Sample Size
Metering
Sampling
Duration
(Days)
PowerApplicability to
current stockStudyDevice Subcategory Year
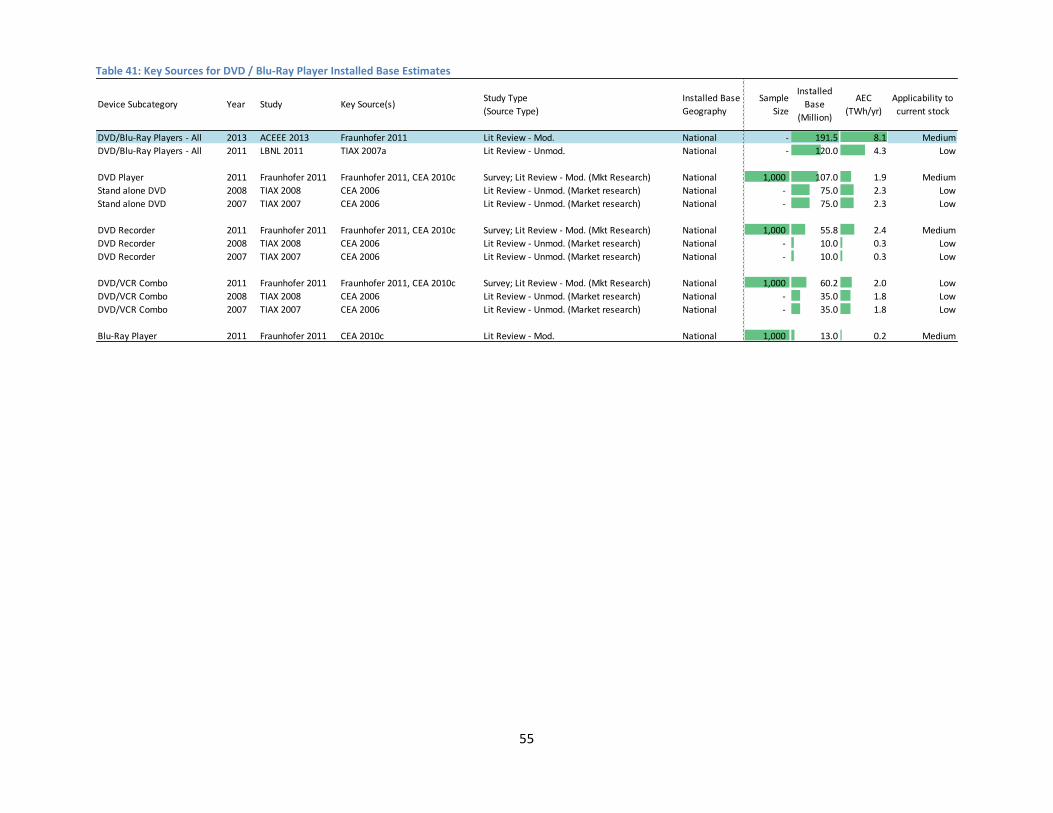
55
Table 41: Key Sources for DVD / Blu-Ray Player Installed Base Estimates
DVD/Blu-Ray Players - All 2013 ACEEE 2013 Fraunhofer 2011 Lit Review - Mod. National - 191.5 8.1 Medium
DVD/Blu-Ray Players - All 2011 LBNL 2011 TIAX 2007a Lit Review - Unmod. National - 120.0 4.3 Low
DVD Player 2011 Fraunhofer 2011 Fraunhofer 2011, CEA 2010c Survey; Lit Review - Mod. (Mkt Research) National 1,000 107.0 1.9 Medium
Stand alone DVD 2008 TIAX 2008 CEA 2006 Lit Review - Unmod. (Market research) National - 75.0 2.3 Low
Stand alone DVD 2007 TIAX 2007 CEA 2006 Lit Review - Unmod. (Market research) National - 75.0 2.3 Low
DVD Recorder 2011 Fraunhofer 2011 Fraunhofer 2011, CEA 2010c Survey; Lit Review - Mod. (Mkt Research) National 1,000 55.8 2.4 Medium
DVD Recorder 2008 TIAX 2008 CEA 2006 Lit Review - Unmod. (Market research) National - 10.0 0.3 Low
DVD Recorder 2007 TIAX 2007 CEA 2006 Lit Review - Unmod. (Market research) National - 10.0 0.3 Low
DVD/VCR Combo 2011 Fraunhofer 2011 Fraunhofer 2011, CEA 2010c Survey; Lit Review - Mod. (Mkt Research) National 1,000 60.2 2.0 Low
DVD/VCR Combo 2008 TIAX 2008 CEA 2006 Lit Review - Unmod. (Market research) National - 35.0 1.8 Low
DVD/VCR Combo 2007 TIAX 2007 CEA 2006 Lit Review - Unmod. (Market research) National - 35.0 1.8 Low
Blu-Ray Player 2011 Fraunhofer 2011 CEA 2010c Lit Review - Mod. National 1,000 13.0 0.2 Medium
Installed Base
Geography
Sample
Size
Installed
Base
(Million)
AEC
(TWh/yr)
Applicability to
current stock
Study Type
(Source Type)Device Subcategory Year Study Key Source(s)
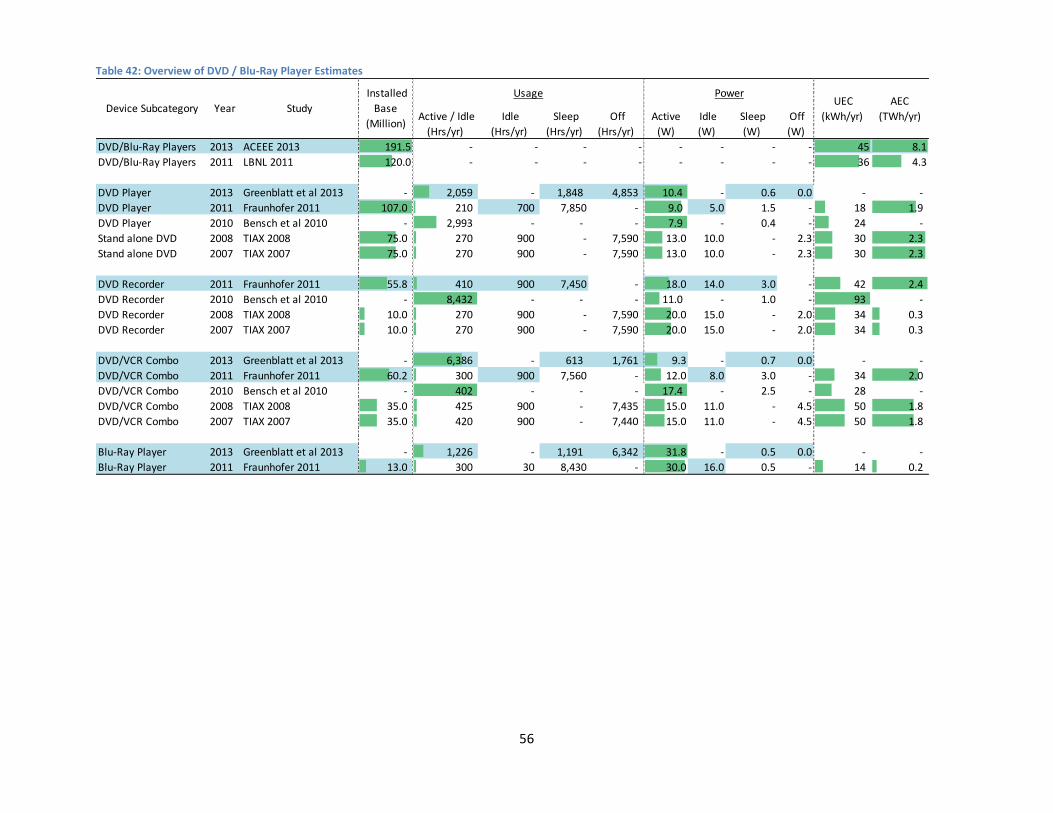
56
Table 42: Overview of DVD / Blu-Ray Player Estimates
Active / Idle
(Hrs/yr)
Idle
(Hrs/yr)
Sleep
(Hrs/yr)
Off
(Hrs/yr)
Active
(W)
Idle
(W)
Sleep
(W)
Off
(W)
DVD/Blu-Ray Players 2013 ACEEE 2013 191.5 - - - - - - - - 45 8.1
DVD/Blu-Ray Players 2011 LBNL 2011 120.0 - - - - - - - - 36 4.3
DVD Player 2013 Greenblatt et al 2013 - 2,059 - 1,848 4,853 10.4 - 0.6 0.0 - -
DVD Player 2011 Fraunhofer 2011 107.0 210 700 7,850 - 9.0 5.0 1.5 - 18 1.9
DVD Player 2010 Bensch et al 2010 - 2,993 - - - 7.9 - 0.4 - 24 -
Stand alone DVD 2008 TIAX 2008 75.0 270 900 - 7,590 13.0 10.0 - 2.3 30 2.3
Stand alone DVD 2007 TIAX 2007 75.0 270 900 - 7,590 13.0 10.0 - 2.3 30 2.3
DVD Recorder 2011 Fraunhofer 2011 55.8 410 900 7,450 - 18.0 14.0 3.0 - 42 2.4
DVD Recorder 2010 Bensch et al 2010 - 8,432 - - - 11.0 - 1.0 - 93 -
DVD Recorder 2008 TIAX 2008 10.0 270 900 - 7,590 20.0 15.0 - 2.0 34 0.3
DVD Recorder 2007 TIAX 2007 10.0 270 900 - 7,590 20.0 15.0 - 2.0 34 0.3
DVD/VCR Combo 2013 Greenblatt et al 2013 - 6,386 - 613 1,761 9.3 - 0.7 0.0 - -
DVD/VCR Combo 2011 Fraunhofer 2011 60.2 300 900 7,560 - 12.0 8.0 3.0 - 34 2.0
DVD/VCR Combo 2010 Bensch et al 2010 - 402 - - - 17.4 - 2.5 - 28 -
DVD/VCR Combo 2008 TIAX 2008 35.0 425 900 - 7,435 15.0 11.0 - 4.5 50 1.8
DVD/VCR Combo 2007 TIAX 2007 35.0 420 900 - 7,440 15.0 11.0 - 4.5 50 1.8
Blu-Ray Player 2013 Greenblatt et al 2013 - 1,226 - 1,191 6,342 31.8 - 0.5 0.0 - -
Blu-Ray Player 2011 Fraunhofer 2011 13.0 300 30 8,430 - 30.0 16.0 0.5 - 14 0.2
UEC
(kWh/yr)
AEC
(TWh/yr)Device Subcategory Year Study
Installed
Base
(Million)
Usage Power

57
Data Quality Evaluation
Data Quality Evaluation:
Overall, usage data for all DVD and Blu-Ray Players is highly variable, resulting in low confidence of the end use
estimates. This is primarily due to the differences in mode definitions that makes it difficult to combine survey and
metering data.
Recommended Values:
We recommend using ACEEE 2013 for the entire DVD/Blu-Ray player category, since there are no other existing
recent studies which provide a value for the entire product categories. Table 43: Overview of DVD / Blu-Ray Player Estimates
Table 44: Overview of DVD Player Estimates
DVD/Blu-Ray Players - All
Metric Value Source
Installed Base - US (M) 191.5 ACEEE 2013
Usage (hrs/yr) Active -
Idle -
Sleep -
Off -
Active -
Idle -
Sleep -
Off -
UEC (kWh/yr) 45 ACEEE 2013
AEC (TWh/yr) 8.1 ACEEE 2013
Overall Confidence Low -
DVD Player
Metric Value Source
Installed Base - US (M) 107 Fraunhofer 2011
Usage (hrs/yr) Active/Idle 2,059 Greenblatt et al 2013
Idle -
Sleep 1,848 Greenblatt et al 2013
Off 4,853 Greenblatt et al 2013
Power (W) Active 10.4 Greenblatt et al 2013
Idle 5.0 Fraunhofer 2011
Sleep 0.6 Greenblatt et al 2013
Off 0.0 Greenblatt et al 2013
UEC (kWh/yr) 23 Calculated
AEC (TWh/yr) 2.4 Calculated
Overall Confidence Low -
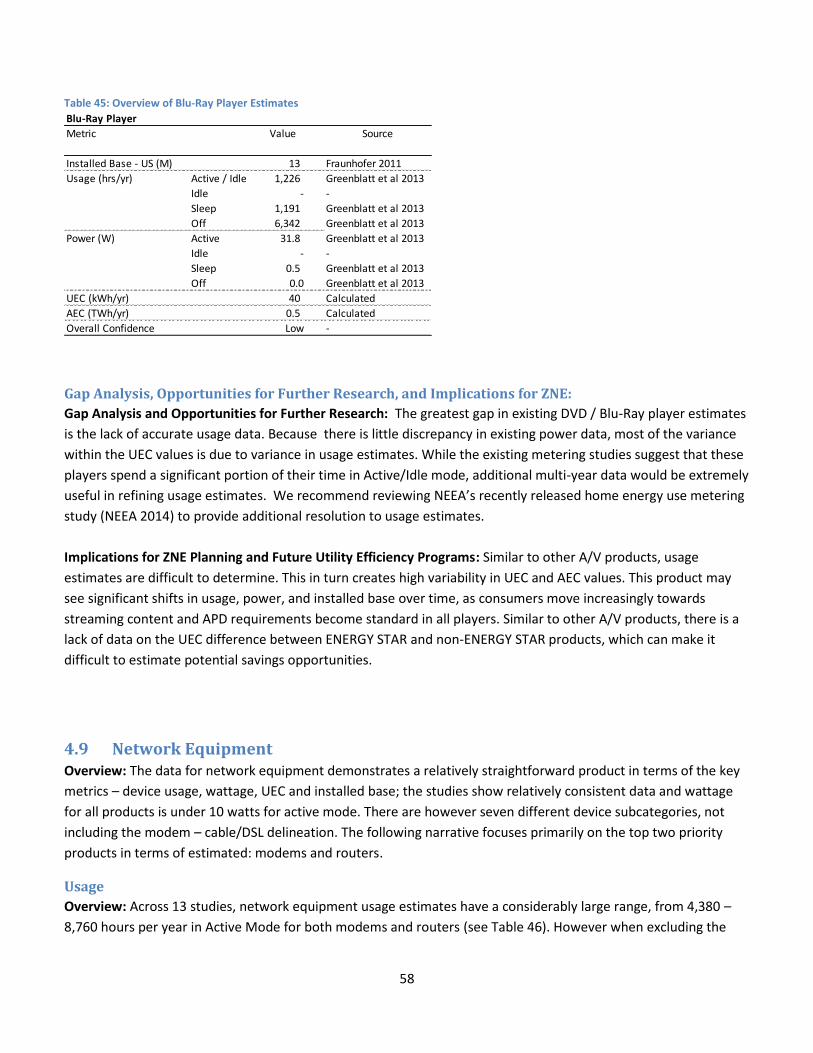
58
Table 45: Overview of Blu-Ray Player Estimates
Gap Analysis, Opportunities for Further Research, and Implications for ZNE:
Gap Analysis and Opportunities for Further Research: The greatest gap in existing DVD / Blu-Ray player estimates
is the lack of accurate usage data. Because there is little discrepancy in existing power data, most of the variance
within the UEC values is due to variance in usage estimates. While the existing metering studies suggest that these
players spend a significant portion of their time in Active/Idle mode, additional multi-year data would be extremely
useful in refining usage estimates. We recommend reviewing NEEA’s recently released home energy use metering
study (NEEA 2014) to provide additional resolution to usage estimates.
Implications for ZNE Planning and Future Utility Efficiency Programs: Similar to other A/V products, usage
estimates are difficult to determine. This in turn creates high variability in UEC and AEC values. This product may
see significant shifts in usage, power, and installed base over time, as consumers move increasingly towards
streaming content and APD requirements become standard in all players. Similar to other A/V products, there is a
lack of data on the UEC difference between ENERGY STAR and non-ENERGY STAR products, which can make it
difficult to estimate potential savings opportunities.
4.9 Network Equipment Overview: The data for network equipment demonstrates a relatively straightforward product in terms of the key
metrics – device usage, wattage, UEC and installed base; the studies show relatively consistent data and wattage
for all products is under 10 watts for active mode. There are however seven different device subcategories, not
including the modem – cable/DSL delineation. The following narrative focuses primarily on the top two priority
products in terms of estimated: modems and routers.
Usage
Overview: Across 13 studies, network equipment usage estimates have a considerably large range, from 4,380 –
8,760 hours per year in Active Mode for both modems and routers (see Table 46). However when excluding the
Blu-Ray Player
Metric Value Source
Installed Base - US (M) 13 Fraunhofer 2011
Usage (hrs/yr) Active / Idle 1,226 Greenblatt et al 2013
Idle - -
Sleep 1,191 Greenblatt et al 2013
Off 6,342 Greenblatt et al 2013
Power (W) Active 31.8 Greenblatt et al 2013
Idle - -
Sleep 0.5 Greenblatt et al 2013
Off 0.0 Greenblatt et al 2013
UEC (kWh/yr) 40 Calculated
AEC (TWh/yr) 0.5 Calculated
Overall Confidence Low -
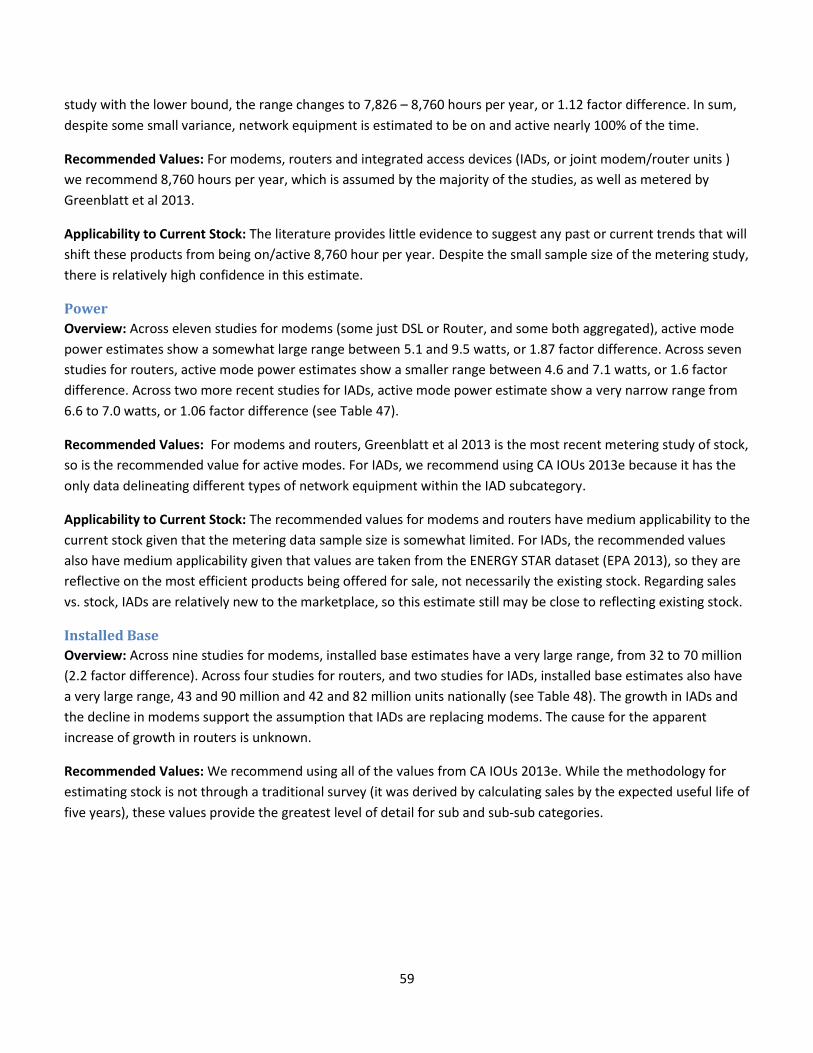
59
study with the lower bound, the range changes to 7,826 – 8,760 hours per year, or 1.12 factor difference. In sum,
despite some small variance, network equipment is estimated to be on and active nearly 100% of the time.
Recommended Values: For modems, routers and integrated access devices (IADs, or joint modem/router units )
we recommend 8,760 hours per year, which is assumed by the majority of the studies, as well as metered by
Greenblatt et al 2013.
Applicability to Current Stock: The literature provides little evidence to suggest any past or current trends that will
shift these products from being on/active 8,760 hour per year. Despite the small sample size of the metering study,
there is relatively high confidence in this estimate.
Power
Overview: Across eleven studies for modems (some just DSL or Router, and some both aggregated), active mode
power estimates show a somewhat large range between 5.1 and 9.5 watts, or 1.87 factor difference. Across seven
studies for routers, active mode power estimates show a smaller range between 4.6 and 7.1 watts, or 1.6 factor
difference. Across two more recent studies for IADs, active mode power estimate show a very narrow range from
6.6 to 7.0 watts, or 1.06 factor difference (see Table 47).
Recommended Values: For modems and routers, Greenblatt et al 2013 is the most recent metering study of stock,
so is the recommended value for active modes. For IADs, we recommend using CA IOUs 2013e because it has the
only data delineating different types of network equipment within the IAD subcategory.
Applicability to Current Stock: The recommended values for modems and routers have medium applicability to the
current stock given that the metering data sample size is somewhat limited. For IADs, the recommended values
also have medium applicability given that values are taken from the ENERGY STAR dataset (EPA 2013), so they are
reflective on the most efficient products being offered for sale, not necessarily the existing stock. Regarding sales
vs. stock, IADs are relatively new to the marketplace, so this estimate still may be close to reflecting existing stock.
Installed Base
Overview: Across nine studies for modems, installed base estimates have a very large range, from 32 to 70 million
(2.2 factor difference). Across four studies for routers, and two studies for IADs, installed base estimates also have
a very large range, 43 and 90 million and 42 and 82 million units nationally (see Table 48). The growth in IADs and
the decline in modems support the assumption that IADs are replacing modems. The cause for the apparent
increase of growth in routers is unknown.
Recommended Values: We recommend using all of the values from CA IOUs 2013e. While the methodology for
estimating stock is not through a traditional survey (it was derived by calculating sales by the expected useful life of
five years), these values provide the greatest level of detail for sub and sub-sub categories.
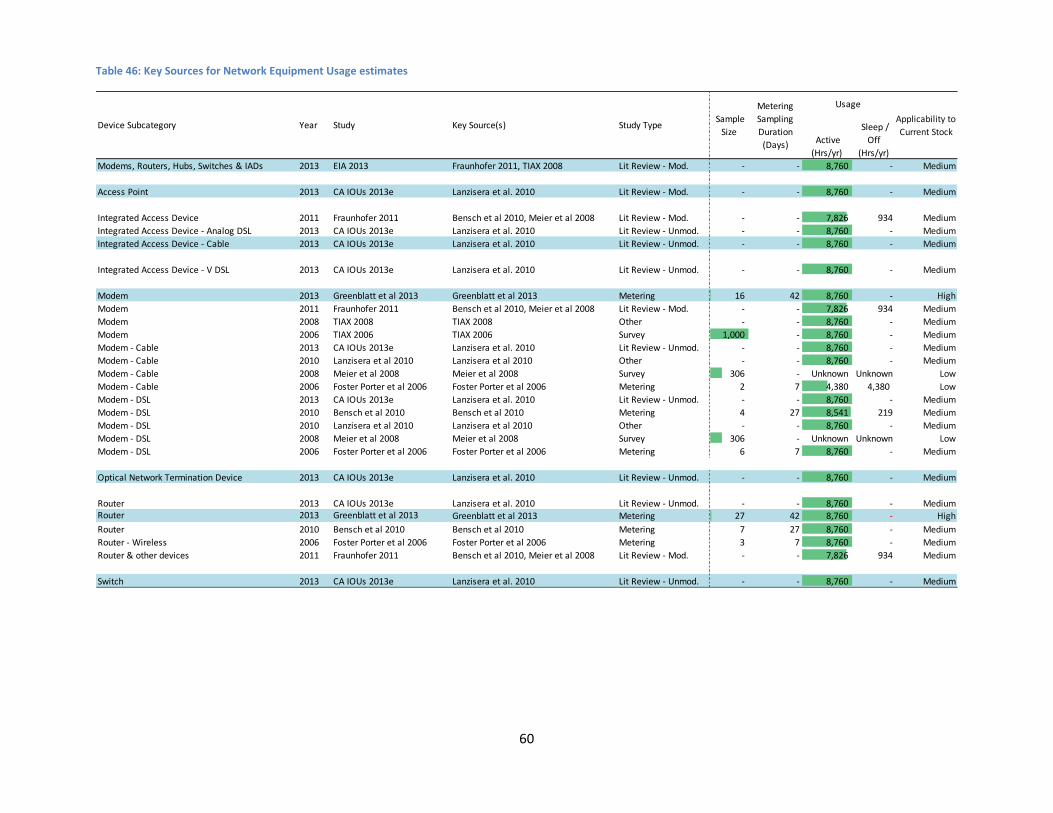
60
Table 46: Key Sources for Network Equipment Usage estimates
Active
(Hrs/yr)
Sleep /
Off
(Hrs/yr)
Modems, Routers, Hubs, Switches & IADs 2013 EIA 2013 Fraunhofer 2011, TIAX 2008 Lit Review - Mod. - - 8,760 - Medium
Access Point 2013 CA IOUs 2013e Lanzisera et al. 2010 Lit Review - Mod. - - 8,760 - Medium
Integrated Access Device 2011 Fraunhofer 2011 Bensch et al 2010, Meier et al 2008 Lit Review - Mod. - - 7,826 934 Medium
Integrated Access Device - Analog DSL 2013 CA IOUs 2013e Lanzisera et al. 2010 Lit Review - Unmod. - - 8,760 - Medium
Integrated Access Device - Cable 2013 CA IOUs 2013e Lanzisera et al. 2010 Lit Review - Unmod. - - 8,760 - Medium
Integrated Access Device - V DSL 2013 CA IOUs 2013e Lanzisera et al. 2010 Lit Review - Unmod. - - 8,760 - Medium
Modem 2013 Greenblatt et al 2013 Greenblatt et al 2013 Metering 16 42 8,760 - High
Modem 2011 Fraunhofer 2011 Bensch et al 2010, Meier et al 2008 Lit Review - Mod. - - 7,826 934 Medium
Modem 2008 TIAX 2008 TIAX 2008 Other - - 8,760 - Medium
Modem 2006 TIAX 2006 TIAX 2006 Survey 1,000 - 8,760 - Medium
Modem - Cable 2013 CA IOUs 2013e Lanzisera et al. 2010 Lit Review - Unmod. - - 8,760 - Medium
Modem - Cable 2010 Lanzisera et al 2010 Lanzisera et al 2010 Other - - 8,760 - Medium
Modem - Cable 2008 Meier et al 2008 Meier et al 2008 Survey 306 - Unknown Unknown Low
Modem - Cable 2006 Foster Porter et al 2006 Foster Porter et al 2006 Metering 2 7 4,380 4,380 Low
Modem - DSL 2013 CA IOUs 2013e Lanzisera et al. 2010 Lit Review - Unmod. - - 8,760 - Medium
Modem - DSL 2010 Bensch et al 2010 Bensch et al 2010 Metering 4 27 8,541 219 Medium
Modem - DSL 2010 Lanzisera et al 2010 Lanzisera et al 2010 Other - - 8,760 - Medium
Modem - DSL 2008 Meier et al 2008 Meier et al 2008 Survey 306 - Unknown Unknown Low
Modem - DSL 2006 Foster Porter et al 2006 Foster Porter et al 2006 Metering 6 7 8,760 - Medium
Optical Network Termination Device 2013 CA IOUs 2013e Lanzisera et al. 2010 Lit Review - Unmod. - - 8,760 - Medium
Router 2013 CA IOUs 2013e Lanzisera et al. 2010 Lit Review - Unmod. - - 8,760 - MediumRouter 2013 Greenblatt et al 2013 Greenblatt et al 2013 Metering 27 42 8,760 - High
Router 2010 Bensch et al 2010 Bensch et al 2010 Metering 7 27 8,760 - Medium
Router - Wireless 2006 Foster Porter et al 2006 Foster Porter et al 2006 Metering 3 7 8,760 - Medium
Router & other devices 2011 Fraunhofer 2011 Bensch et al 2010, Meier et al 2008 Lit Review - Mod. - - 7,826 934 Medium
Switch 2013 CA IOUs 2013e Lanzisera et al. 2010 Lit Review - Unmod. - - 8,760 - Medium
Device Subcategory Year Study Key Source(s) Study Type Sample
Size
Metering
Sampling
Duration
(Days)
Usage
Applicability to
Current Stock
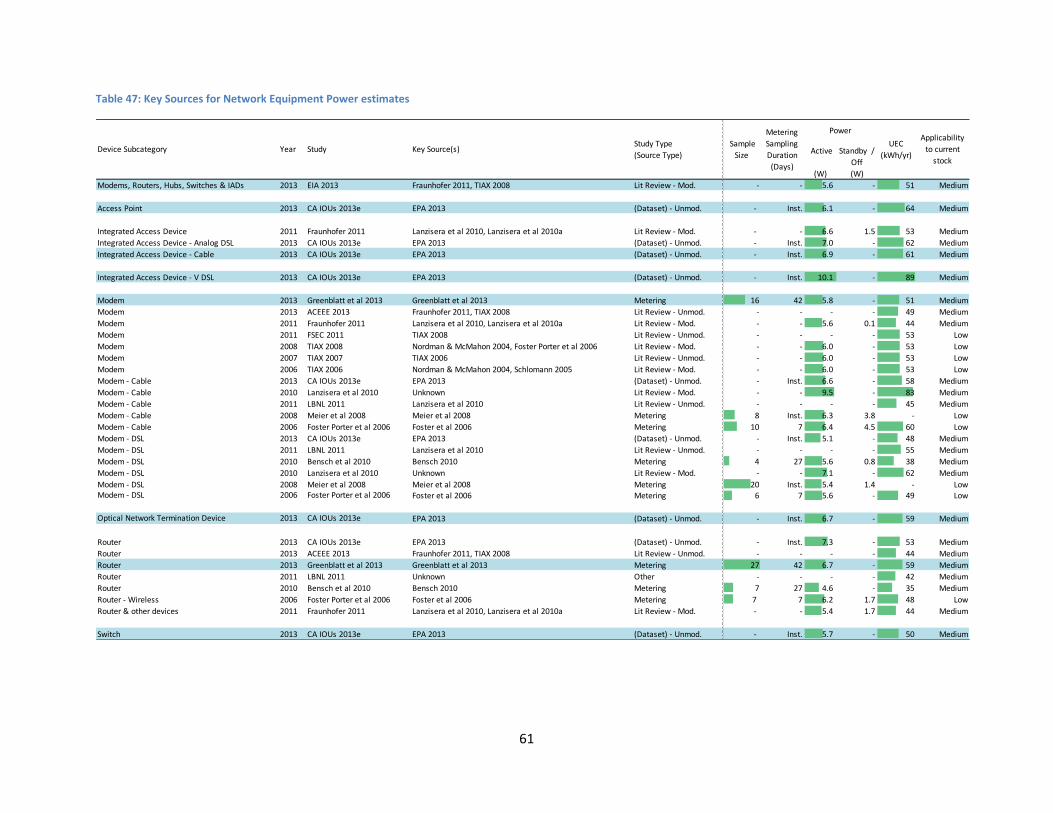
61
Table 47: Key Sources for Network Equipment Power estimates
Active
(W)
Standby /
Off
(W)
Modems, Routers, Hubs, Switches & IADs 2013 EIA 2013 Fraunhofer 2011, TIAX 2008 Lit Review - Mod. - - 5.6 - 51 Medium
Access Point 2013 CA IOUs 2013e EPA 2013 (Dataset) - Unmod. - Inst. 6.1 - 64 Medium
Integrated Access Device 2011 Fraunhofer 2011 Lanzisera et al 2010, Lanzisera et al 2010a Lit Review - Mod. - - 6.6 1.5 53 Medium
Integrated Access Device - Analog DSL 2013 CA IOUs 2013e EPA 2013 (Dataset) - Unmod. - Inst. 7.0 - 62 Medium
Integrated Access Device - Cable 2013 CA IOUs 2013e EPA 2013 (Dataset) - Unmod. - Inst. 6.9 - 61 Medium
Integrated Access Device - V DSL 2013 CA IOUs 2013e EPA 2013 (Dataset) - Unmod. - Inst. 10.1 - 89 Medium
Modem 2013 Greenblatt et al 2013 Greenblatt et al 2013 Metering 16 42 5.8 - 51 Medium
Modem 2013 ACEEE 2013 Fraunhofer 2011, TIAX 2008 Lit Review - Unmod. - - - - 49 Medium
Modem 2011 Fraunhofer 2011 Lanzisera et al 2010, Lanzisera et al 2010a Lit Review - Mod. - - 5.6 0.1 44 Medium
Modem 2011 FSEC 2011 TIAX 2008 Lit Review - Unmod. - - - - 53 Low
Modem 2008 TIAX 2008 Nordman & McMahon 2004, Foster Porter et al 2006 Lit Review - Mod. - - 6.0 - 53 Low
Modem 2007 TIAX 2007 TIAX 2006 Lit Review - Unmod. - - 6.0 - 53 Low
Modem 2006 TIAX 2006 Nordman & McMahon 2004, Schlomann 2005 Lit Review - Mod. - - 6.0 - 53 Low
Modem - Cable 2013 CA IOUs 2013e EPA 2013 (Dataset) - Unmod. - Inst. 6.6 - 58 Medium
Modem - Cable 2010 Lanzisera et al 2010 Unknown Lit Review - Mod. - - 9.5 - 83 Medium
Modem - Cable 2011 LBNL 2011 Lanzisera et al 2010 Lit Review - Unmod. - - - - 45 Medium
Modem - Cable 2008 Meier et al 2008 Meier et al 2008 Metering 8 Inst. 6.3 3.8 - Low
Modem - Cable 2006 Foster Porter et al 2006 Foster et al 2006 Metering 10 7 6.4 4.5 60 Low
Modem - DSL 2013 CA IOUs 2013e EPA 2013 (Dataset) - Unmod. - Inst. 5.1 - 48 Medium
Modem - DSL 2011 LBNL 2011 Lanzisera et al 2010 Lit Review - Unmod. - - - - 55 Medium
Modem - DSL 2010 Bensch et al 2010 Bensch 2010 Metering 4 27 5.6 0.8 38 Medium
Modem - DSL 2010 Lanzisera et al 2010 Unknown Lit Review - Mod. - - 7.1 - 62 Medium
Modem - DSL 2008 Meier et al 2008 Meier et al 2008 Metering 20 Inst. 5.4 1.4 - LowModem - DSL 2006 Foster Porter et al 2006 Foster et al 2006 Metering 6 7 5.6 - 49 Low
Optical Network Termination Device 2013 CA IOUs 2013e EPA 2013 (Dataset) - Unmod. - Inst. 6.7 - 59 Medium
Router 2013 CA IOUs 2013e EPA 2013 (Dataset) - Unmod. - Inst. 7.3 - 53 Medium
Router 2013 ACEEE 2013 Fraunhofer 2011, TIAX 2008 Lit Review - Unmod. - - - - 44 Medium
Router 2013 Greenblatt et al 2013 Greenblatt et al 2013 Metering 27 42 6.7 - 59 Medium
Router 2011 LBNL 2011 Unknown Other - - - - 42 Medium
Router 2010 Bensch et al 2010 Bensch 2010 Metering 7 27 4.6 - 35 Medium
Router - Wireless 2006 Foster Porter et al 2006 Foster et al 2006 Metering 7 7 6.2 1.7 48 Low
Router & other devices 2011 Fraunhofer 2011 Lanzisera et al 2010, Lanzisera et al 2010a Lit Review - Mod. - - 5.4 1.7 44 Medium
Switch 2013 CA IOUs 2013e EPA 2013 (Dataset) - Unmod. - Inst. 5.7 - 50 Medium
Key Source(s)Study Type
(Source Type)
Sample
Size
Metering
Sampling
Duration
(Days)
Applicability
to current
stock
UEC
(kWh/yr)
Power
StudyDevice Subcategory Year
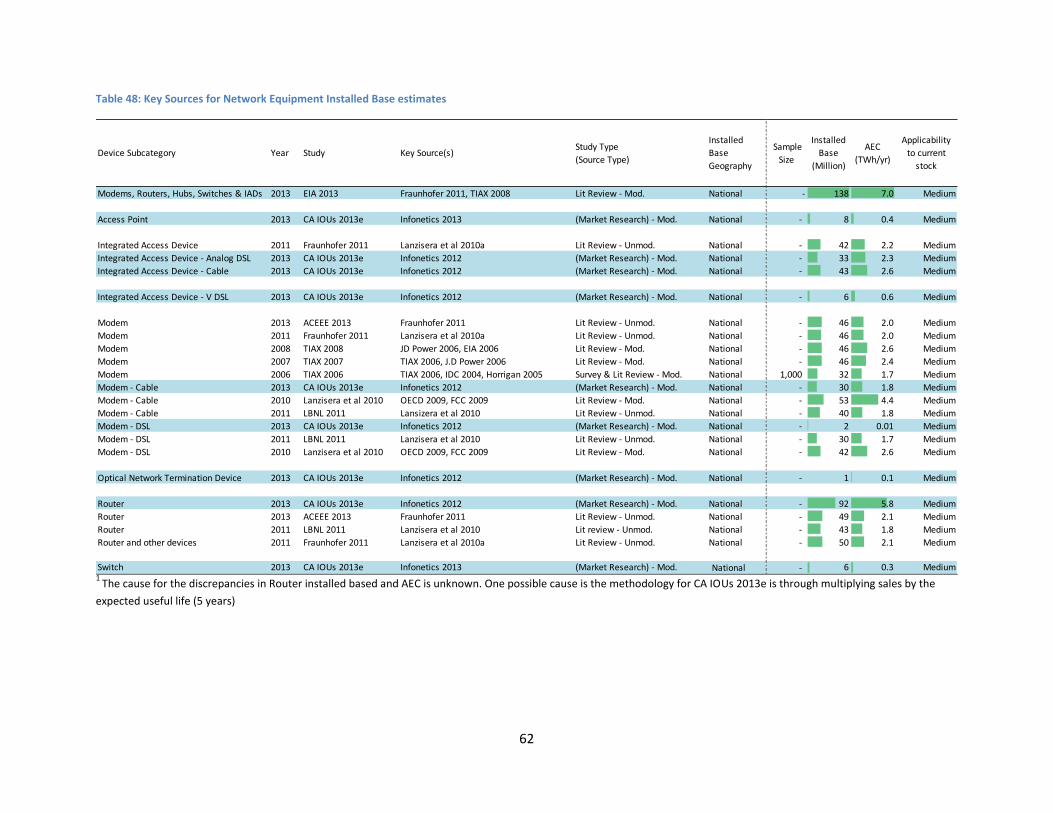
62
Table 48: Key Sources for Network Equipment Installed Base estimates
1
The cause for the discrepancies in Router installed based and AEC is unknown. One possible cause is the methodology for CA IOUs 2013e is through multiplying sales by the
expected useful life (5 years)
Modems, Routers, Hubs, Switches & IADs 2013 EIA 2013 Fraunhofer 2011, TIAX 2008 Lit Review - Mod. National - 138 7.0 Medium
Access Point 2013 CA IOUs 2013e Infonetics 2013 (Market Research) - Mod. National - 8 0.4 Medium
Integrated Access Device 2011 Fraunhofer 2011 Lanzisera et al 2010a Lit Review - Unmod. National - 42 2.2 Medium
Integrated Access Device - Analog DSL 2013 CA IOUs 2013e Infonetics 2012 (Market Research) - Mod. National - 33 2.3 Medium
Integrated Access Device - Cable 2013 CA IOUs 2013e Infonetics 2012 (Market Research) - Mod. National - 43 2.6 Medium
Integrated Access Device - V DSL 2013 CA IOUs 2013e Infonetics 2012 (Market Research) - Mod. National - 6 0.6 Medium
Modem 2013 ACEEE 2013 Fraunhofer 2011 Lit Review - Unmod. National - 46 2.0 Medium
Modem 2011 Fraunhofer 2011 Lanzisera et al 2010a Lit Review - Unmod. National - 46 2.0 Medium
Modem 2008 TIAX 2008 JD Power 2006, EIA 2006 Lit Review - Mod. National - 46 2.6 Medium
Modem 2007 TIAX 2007 TIAX 2006, J.D Power 2006 Lit Review - Mod. National - 46 2.4 Medium
Modem 2006 TIAX 2006 TIAX 2006, IDC 2004, Horrigan 2005 Survey & Lit Review - Mod. National 1,000 32 1.7 Medium
Modem - Cable 2013 CA IOUs 2013e Infonetics 2012 (Market Research) - Mod. National - 30 1.8 Medium
Modem - Cable 2010 Lanzisera et al 2010 OECD 2009, FCC 2009 Lit Review - Mod. National - 53 4.4 Medium
Modem - Cable 2011 LBNL 2011 Lansizera et al 2010 Lit Review - Unmod. National - 40 1.8 Medium
Modem - DSL 2013 CA IOUs 2013e Infonetics 2012 (Market Research) - Mod. National - 2 0.01 Medium
Modem - DSL 2011 LBNL 2011 Lanzisera et al 2010 Lit Review - Unmod. National - 30 1.7 Medium
Modem - DSL 2010 Lanzisera et al 2010 OECD 2009, FCC 2009 Lit Review - Mod. National - 42 2.6 Medium
Optical Network Termination Device 2013 CA IOUs 2013e Infonetics 2012 (Market Research) - Mod. National - 1 0.1 Medium
Router 2013 CA IOUs 2013e Infonetics 2012 (Market Research) - Mod. National - 92 5.8 Medium
Router 2013 ACEEE 2013 Fraunhofer 2011 Lit Review - Unmod. National - 49 2.1 Medium
Router 2011 LBNL 2011 Lanzisera et al 2010 Lit review - Unmod. National - 43 1.8 Medium
Router and other devices 2011 Fraunhofer 2011 Lanzisera et al 2010a Lit Review - Unmod. National - 50 2.1 Medium
Switch 2013 CA IOUs 2013e Infonetics 2013 (Market Research) - Mod. National - 6 0.3 Medium
Sample
Size
Installed
Base
(Million)
AEC
(TWh/yr)
Applicability
to current
stock
Installed
Base
Geography
Device Subcategory Year Study Key Source(s)Study Type
(Source Type)
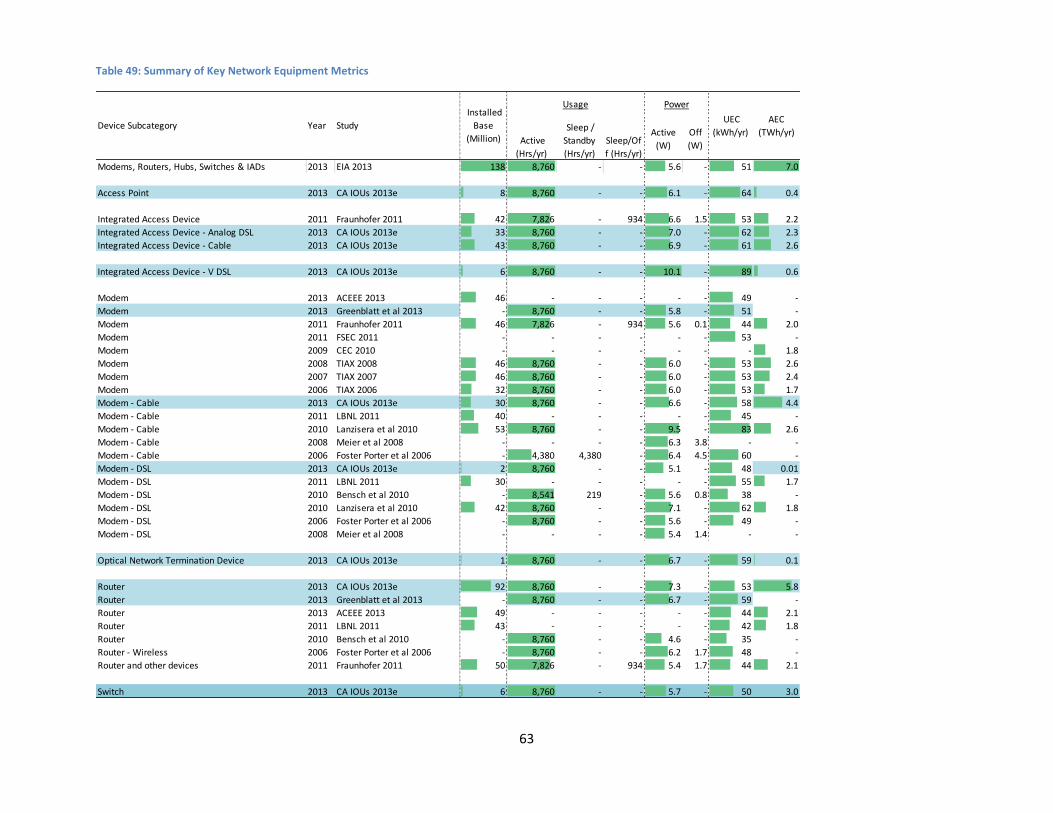
63
Table 49: Summary of Key Network Equipment Metrics
Active
(Hrs/yr)
Sleep /
Standby
(Hrs/yr)
Sleep/Of
f (Hrs/yr)
Active
(W)
Off
(W)
Modems, Routers, Hubs, Switches & IADs 2013 EIA 2013 138 8,760 - - 5.6 - 51 7.0
Access Point 2013 CA IOUs 2013e 8 8,760 - - 6.1 - 64 0.4
Integrated Access Device 2011 Fraunhofer 2011 42 7,826 - 934 6.6 1.5 53 2.2
Integrated Access Device - Analog DSL 2013 CA IOUs 2013e 33 8,760 - - 7.0 - 62 2.3
Integrated Access Device - Cable 2013 CA IOUs 2013e 43 8,760 - - 6.9 - 61 2.6
Integrated Access Device - V DSL 2013 CA IOUs 2013e 6 8,760 - - 10.1 - 89 0.6
Modem 2013 ACEEE 2013 46 - - - - - 49 -
Modem 2013 Greenblatt et al 2013 - 8,760 - - 5.8 - 51 -
Modem 2011 Fraunhofer 2011 46 7,826 - 934 5.6 0.1 44 2.0
Modem 2011 FSEC 2011 - - - - - - 53 -
Modem 2009 CEC 2010 - - - - - - - 1.8
Modem 2008 TIAX 2008 46 8,760 - - 6.0 - 53 2.6
Modem 2007 TIAX 2007 46 8,760 - - 6.0 - 53 2.4
Modem 2006 TIAX 2006 32 8,760 - - 6.0 - 53 1.7
Modem - Cable 2013 CA IOUs 2013e 30 8,760 - - 6.6 - 58 4.4
Modem - Cable 2011 LBNL 2011 40 - - - - - 45 -
Modem - Cable 2010 Lanzisera et al 2010 53 8,760 - - 9.5 - 83 2.6
Modem - Cable 2008 Meier et al 2008 - - - - 6.3 3.8 - -
Modem - Cable 2006 Foster Porter et al 2006 - 4,380 4,380 - 6.4 4.5 60 -
Modem - DSL 2013 CA IOUs 2013e 2 8,760 - - 5.1 - 48 0.01
Modem - DSL 2011 LBNL 2011 30 - - - - - 55 1.7
Modem - DSL 2010 Bensch et al 2010 - 8,541 219 - 5.6 0.8 38 -
Modem - DSL 2010 Lanzisera et al 2010 42 8,760 - - 7.1 - 62 1.8
Modem - DSL 2006 Foster Porter et al 2006 - 8,760 - - 5.6 - 49 -
Modem - DSL 2008 Meier et al 2008 - - - - 5.4 1.4 - -
Optical Network Termination Device 2013 CA IOUs 2013e 1 8,760 - - 6.7 - 59 0.1
Router 2013 CA IOUs 2013e 92 8,760 - - 7.3 - 53 5.8
Router 2013 Greenblatt et al 2013 - 8,760 - - 6.7 - 59 -
Router 2013 ACEEE 2013 49 - - - - - 44 2.1
Router 2011 LBNL 2011 43 - - - - - 42 1.8
Router 2010 Bensch et al 2010 - 8,760 - - 4.6 - 35 -
Router - Wireless 2006 Foster Porter et al 2006 - 8,760 - - 6.2 1.7 48 -
Router and other devices 2011 Fraunhofer 2011 50 7,826 - 934 5.4 1.7 44 2.1
Switch 2013 CA IOUs 2013e 6 8,760 - - 5.7 - 50 3.0
AEC
(TWh/yr)Device Subcategory Year Study
Installed
Base
(Million)
Usage Power
UEC
(kWh/yr)
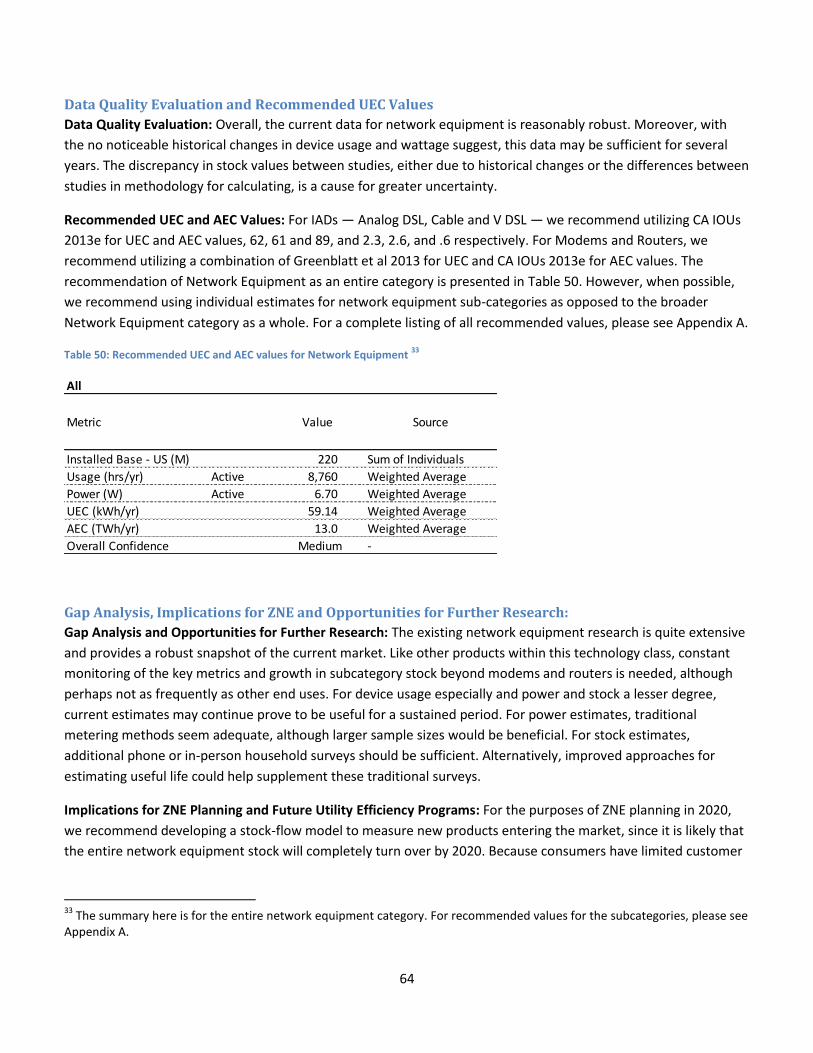
64
Data Quality Evaluation and Recommended UEC Values
Data Quality Evaluation: Overall, the current data for network equipment is reasonably robust. Moreover, with
the no noticeable historical changes in device usage and wattage suggest, this data may be sufficient for several
years. The discrepancy in stock values between studies, either due to historical changes or the differences between
studies in methodology for calculating, is a cause for greater uncertainty.
Recommended UEC and AEC Values: For IADs — Analog DSL, Cable and V DSL — we recommend utilizing CA IOUs
2013e for UEC and AEC values, 62, 61 and 89, and 2.3, 2.6, and .6 respectively. For Modems and Routers, we
recommend utilizing a combination of Greenblatt et al 2013 for UEC and CA IOUs 2013e for AEC values. The
recommendation of Network Equipment as an entire category is presented in Table 50. However, when possible,
we recommend using individual estimates for network equipment sub-categories as opposed to the broader
Network Equipment category as a whole. For a complete listing of all recommended values, please see Appendix A.
Table 50: Recommended UEC and AEC values for Network Equipment 33
Gap Analysis, Implications for ZNE and Opportunities for Further Research:
Gap Analysis and Opportunities for Further Research: The existing network equipment research is quite extensive
and provides a robust snapshot of the current market. Like other products within this technology class, constant
monitoring of the key metrics and growth in subcategory stock beyond modems and routers is needed, although
perhaps not as frequently as other end uses. For device usage especially and power and stock a lesser degree,
current estimates may continue prove to be useful for a sustained period. For power estimates, traditional
metering methods seem adequate, although larger sample sizes would be beneficial. For stock estimates,
additional phone or in-person household surveys should be sufficient. Alternatively, improved approaches for
estimating useful life could help supplement these traditional surveys.
Implications for ZNE Planning and Future Utility Efficiency Programs: For the purposes of ZNE planning in 2020,
we recommend developing a stock-flow model to measure new products entering the market, since it is likely that
the entire network equipment stock will completely turn over by 2020. Because consumers have limited customer
33
The summary here is for the entire network equipment category. For recommended values for the subcategories, please see Appendix A.
All
Metric Value Source
Installed Base - US (M) 220 Sum of Individuals
Usage (hrs/yr) Active 8,760 Weighted Average
Power (W) Active 6.70 Weighted Average
UEC (kWh/yr) 59.14 Weighted Average
AEC (TWh/yr) 13.0 Weighted Average
Overall Confidence Medium -
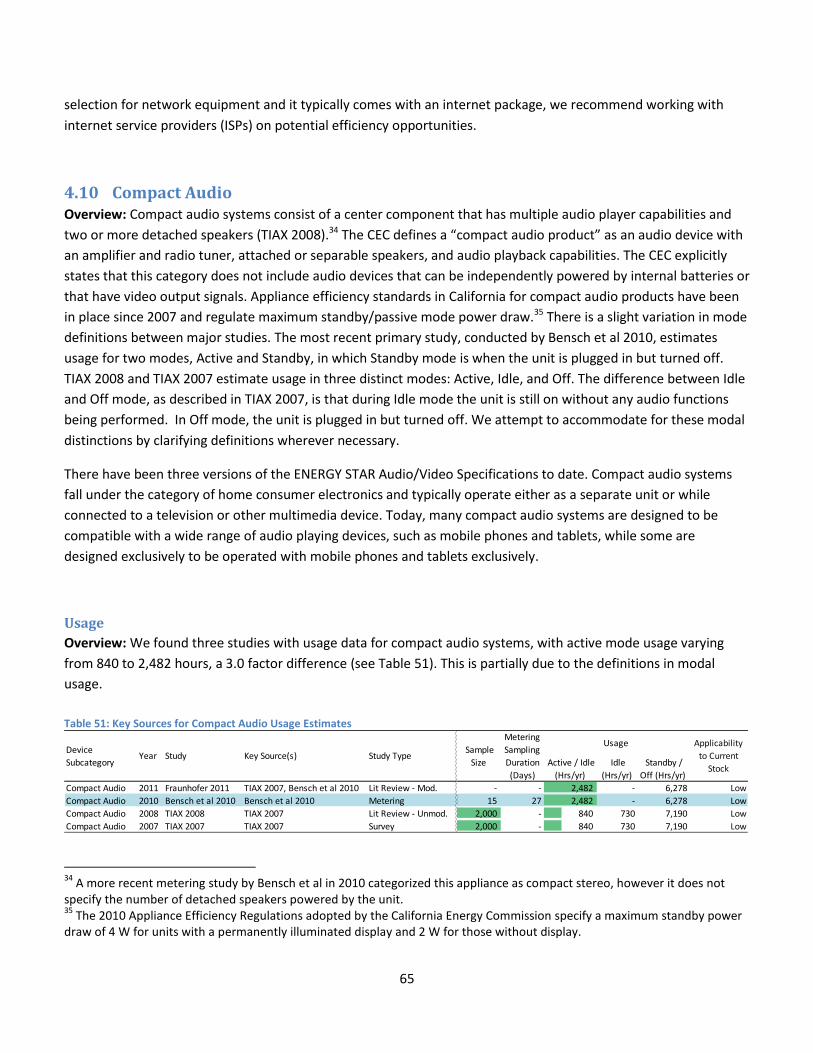
65
selection for network equipment and it typically comes with an internet package, we recommend working with
internet service providers (ISPs) on potential efficiency opportunities.
4.10 Compact Audio Overview: Compact audio systems consist of a center component that has multiple audio player capabilities and
two or more detached speakers (TIAX 2008).34 The CEC defines a “compact audio product” as an audio device with
an amplifier and radio tuner, attached or separable speakers, and audio playback capabilities. The CEC explicitly
states that this category does not include audio devices that can be independently powered by internal batteries or
that have video output signals. Appliance efficiency standards in California for compact audio products have been
in place since 2007 and regulate maximum standby/passive mode power draw.35 There is a slight variation in mode
definitions between major studies. The most recent primary study, conducted by Bensch et al 2010, estimates
usage for two modes, Active and Standby, in which Standby mode is when the unit is plugged in but turned off.
TIAX 2008 and TIAX 2007 estimate usage in three distinct modes: Active, Idle, and Off. The difference between Idle
and Off mode, as described in TIAX 2007, is that during Idle mode the unit is still on without any audio functions
being performed. In Off mode, the unit is plugged in but turned off. We attempt to accommodate for these modal
distinctions by clarifying definitions wherever necessary.
There have been three versions of the ENERGY STAR Audio/Video Specifications to date. Compact audio systems
fall under the category of home consumer electronics and typically operate either as a separate unit or while
connected to a television or other multimedia device. Today, many compact audio systems are designed to be
compatible with a wide range of audio playing devices, such as mobile phones and tablets, while some are
designed exclusively to be operated with mobile phones and tablets exclusively.
Usage
Overview: We found three studies with usage data for compact audio systems, with active mode usage varying
from 840 to 2,482 hours, a 3.0 factor difference (see Table 51). This is partially due to the definitions in modal
usage.
Table 51: Key Sources for Compact Audio Usage Estimates
34
A more recent metering study by Bensch et al in 2010 categorized this appliance as compact stereo, however it does not specify the number of detached speakers powered by the unit. 35
The 2010 Appliance Efficiency Regulations adopted by the California Energy Commission specify a maximum standby power draw of 4 W for units with a permanently illuminated display and 2 W for those without display.
Active / Idle
(Hrs/yr)
Idle
(Hrs/yr)
Standby /
Off (Hrs/yr)
Compact Audio 2011 Fraunhofer 2011 TIAX 2007, Bensch et al 2010 Lit Review - Mod. - - 2,482 - 6,278 Low
Compact Audio 2010 Bensch et al 2010 Bensch et al 2010 Metering 15 27 2,482 - 6,278 Low
Compact Audio 2008 TIAX 2008 TIAX 2007 Lit Review - Unmod. 2,000 - 840 730 7,190 Low
Compact Audio 2007 TIAX 2007 TIAX 2007 Survey 2,000 - 840 730 7,190 Low
Device
SubcategoryYear Study Key Source(s) Study Type
Sample
Size
Metering
Sampling
Duration
(Days)
Usage Applicability
to Current
Stock
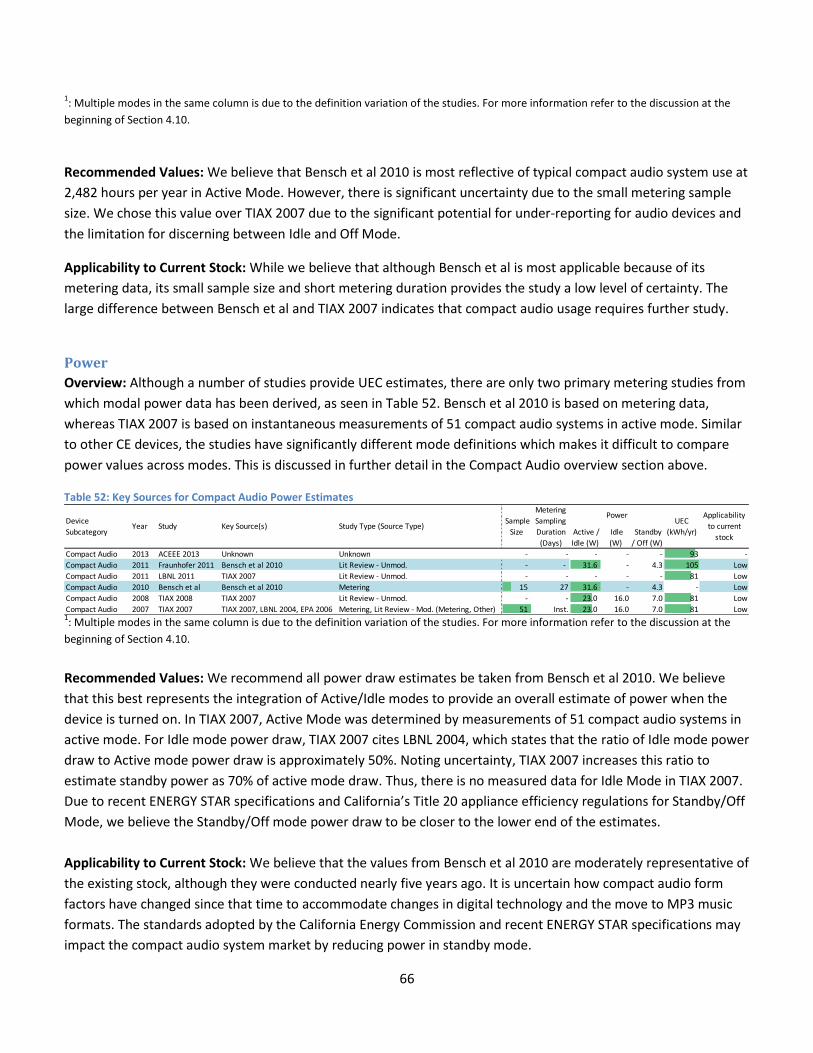
66
1: Multiple modes in the same column is due to the definition variation of the studies. For more information refer to the discussion at the
beginning of Section 4.10.
Recommended Values: We believe that Bensch et al 2010 is most reflective of typical compact audio system use at
2,482 hours per year in Active Mode. However, there is significant uncertainty due to the small metering sample
size. We chose this value over TIAX 2007 due to the significant potential for under-reporting for audio devices and
the limitation for discerning between Idle and Off Mode.
Applicability to Current Stock: While we believe that although Bensch et al is most applicable because of its
metering data, its small sample size and short metering duration provides the study a low level of certainty. The
large difference between Bensch et al and TIAX 2007 indicates that compact audio usage requires further study.
Power
Overview: Although a number of studies provide UEC estimates, there are only two primary metering studies from
which modal power data has been derived, as seen in Table 52. Bensch et al 2010 is based on metering data,
whereas TIAX 2007 is based on instantaneous measurements of 51 compact audio systems in active mode. Similar
to other CE devices, the studies have significantly different mode definitions which makes it difficult to compare
power values across modes. This is discussed in further detail in the Compact Audio overview section above.
Table 52: Key Sources for Compact Audio Power Estimates
1: Multiple modes in the same column is due to the definition variation of the studies. For more information refer to the discussion at the
beginning of Section 4.10.
Recommended Values: We recommend all power draw estimates be taken from Bensch et al 2010. We believe
that this best represents the integration of Active/Idle modes to provide an overall estimate of power when the
device is turned on. In TIAX 2007, Active Mode was determined by measurements of 51 compact audio systems in
active mode. For Idle mode power draw, TIAX 2007 cites LBNL 2004, which states that the ratio of Idle mode power
draw to Active mode power draw is approximately 50%. Noting uncertainty, TIAX 2007 increases this ratio to
estimate standby power as 70% of active mode draw. Thus, there is no measured data for Idle Mode in TIAX 2007.
Due to recent ENERGY STAR specifications and California’s Title 20 appliance efficiency regulations for Standby/Off
Mode, we believe the Standby/Off mode power draw to be closer to the lower end of the estimates.
Applicability to Current Stock: We believe that the values from Bensch et al 2010 are moderately representative of
the existing stock, although they were conducted nearly five years ago. It is uncertain how compact audio form
factors have changed since that time to accommodate changes in digital technology and the move to MP3 music
formats. The standards adopted by the California Energy Commission and recent ENERGY STAR specifications may
impact the compact audio system market by reducing power in standby mode.
Active /
Idle (W)
Idle
(W)
Standby
/ Off (W)
Compact Audio 2013 ACEEE 2013 Unknown Unknown - - - - - 93 -
Compact Audio 2011 Fraunhofer 2011 Bensch et al 2010 Lit Review - Unmod. - - 31.6 - 4.3 105 Low
Compact Audio 2011 LBNL 2011 TIAX 2007 Lit Review - Unmod. - - - - - 81 Low
Compact Audio 2010 Bensch et al Bensch et al 2010 Metering 15 27 31.6 - 4.3 - Low
Compact Audio 2008 TIAX 2008 TIAX 2007 Lit Review - Unmod. - - 23.0 16.0 7.0 81 Low
Compact Audio 2007 TIAX 2007 TIAX 2007, LBNL 2004, EPA 2006 Metering, Lit Review - Mod. (Metering, Other) 51 Inst. 23.0 16.0 7.0 81 Low
Key Source(s) Study Type (Source Type) Sample
Size
Metering
Sampling
Duration
(Days)
Applicability
to current
stock
UEC
(kWh/yr)
Power
StudyDevice
SubcategoryYear
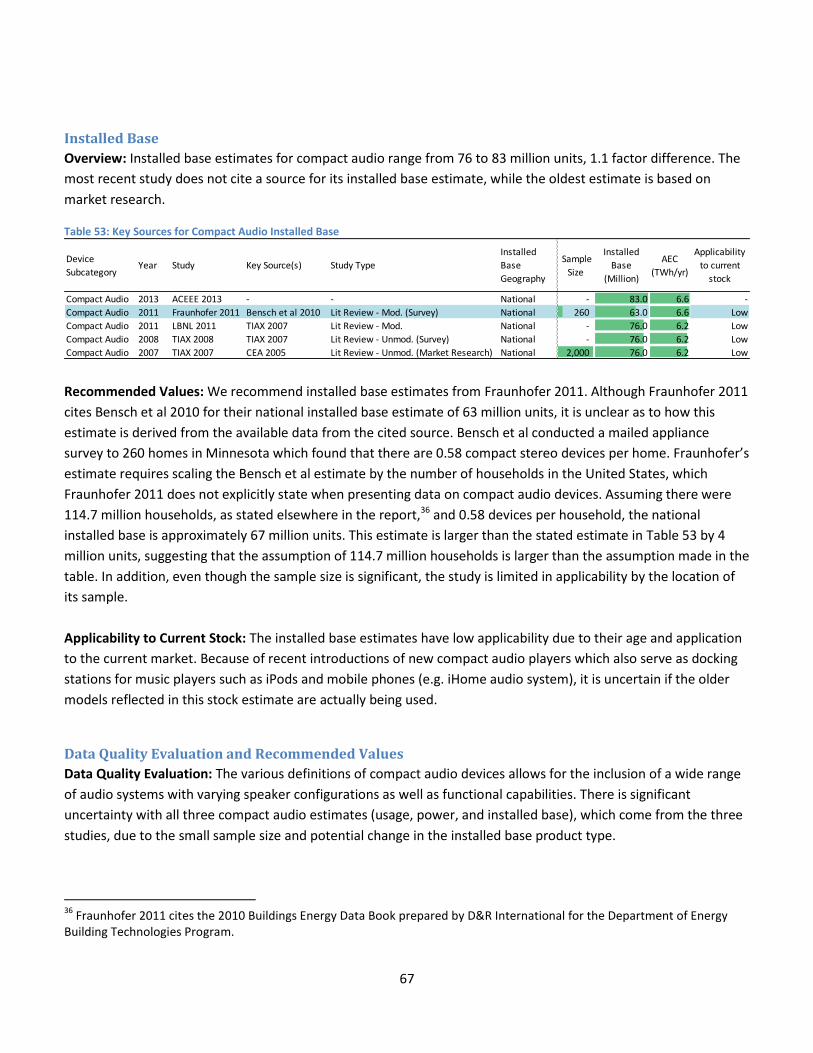
67
Installed Base
Overview: Installed base estimates for compact audio range from 76 to 83 million units, 1.1 factor difference. The
most recent study does not cite a source for its installed base estimate, while the oldest estimate is based on
market research.
Table 53: Key Sources for Compact Audio Installed Base
Recommended Values: We recommend installed base estimates from Fraunhofer 2011. Although Fraunhofer 2011
cites Bensch et al 2010 for their national installed base estimate of 63 million units, it is unclear as to how this
estimate is derived from the available data from the cited source. Bensch et al conducted a mailed appliance
survey to 260 homes in Minnesota which found that there are 0.58 compact stereo devices per home. Fraunhofer’s
estimate requires scaling the Bensch et al estimate by the number of households in the United States, which
Fraunhofer 2011 does not explicitly state when presenting data on compact audio devices. Assuming there were
114.7 million households, as stated elsewhere in the report,36 and 0.58 devices per household, the national
installed base is approximately 67 million units. This estimate is larger than the stated estimate in Table 53 by 4
million units, suggesting that the assumption of 114.7 million households is larger than the assumption made in the
table. In addition, even though the sample size is significant, the study is limited in applicability by the location of
its sample.
Applicability to Current Stock: The installed base estimates have low applicability due to their age and application
to the current market. Because of recent introductions of new compact audio players which also serve as docking
stations for music players such as iPods and mobile phones (e.g. iHome audio system), it is uncertain if the older
models reflected in this stock estimate are actually being used.
Data Quality Evaluation and Recommended Values
Data Quality Evaluation: The various definitions of compact audio devices allows for the inclusion of a wide range
of audio systems with varying speaker configurations as well as functional capabilities. There is significant
uncertainty with all three compact audio estimates (usage, power, and installed base), which come from the three
studies, due to the small sample size and potential change in the installed base product type.
36
Fraunhofer 2011 cites the 2010 Buildings Energy Data Book prepared by D&R International for the Department of Energy Building Technologies Program.
Compact Audio 2013 ACEEE 2013 - - National - 83.0 6.6 -
Compact Audio 2011 Fraunhofer 2011 Bensch et al 2010 Lit Review - Mod. (Survey) National 260 63.0 6.6 Low
Compact Audio 2011 LBNL 2011 TIAX 2007 Lit Review - Mod. National - 76.0 6.2 Low
Compact Audio 2008 TIAX 2008 TIAX 2007 Lit Review - Unmod. (Survey) National - 76.0 6.2 Low
Compact Audio 2007 TIAX 2007 CEA 2005 Lit Review - Unmod. (Market Research) National 2,000 76.0 6.2 Low
Sample
Size
Installed
Base
(Million)
AEC
(TWh/yr)
Applicability
to current
stock
Installed
Base
Geography
Device
SubcategoryYear Study Key Source(s) Study Type
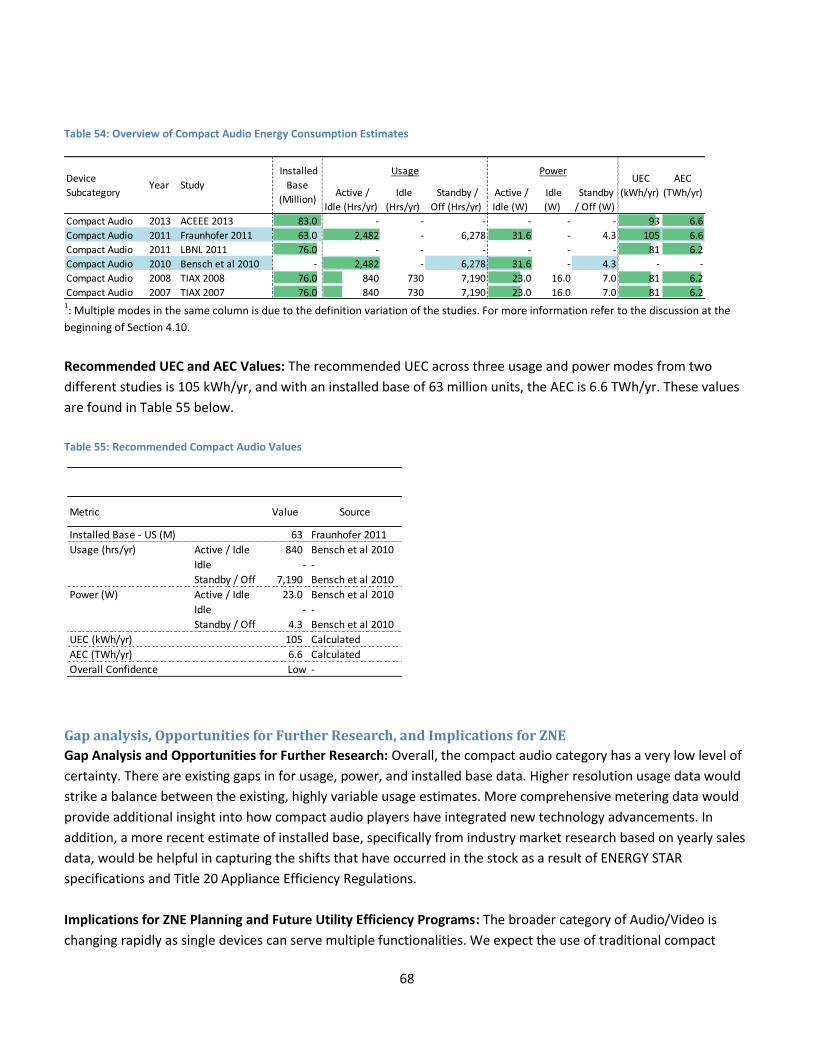
68
Table 54: Overview of Compact Audio Energy Consumption Estimates
1: Multiple modes in the same column is due to the definition variation of the studies. For more information refer to the discussion at the
beginning of Section 4.10.
Recommended UEC and AEC Values: The recommended UEC across three usage and power modes from two
different studies is 105 kWh/yr, and with an installed base of 63 million units, the AEC is 6.6 TWh/yr. These values
are found in Table 55 below.
Table 55: Recommended Compact Audio Values
Gap analysis, Opportunities for Further Research, and Implications for ZNE
Gap Analysis and Opportunities for Further Research: Overall, the compact audio category has a very low level of
certainty. There are existing gaps in for usage, power, and installed base data. Higher resolution usage data would
strike a balance between the existing, highly variable usage estimates. More comprehensive metering data would
provide additional insight into how compact audio players have integrated new technology advancements. In
addition, a more recent estimate of installed base, specifically from industry market research based on yearly sales
data, would be helpful in capturing the shifts that have occurred in the stock as a result of ENERGY STAR
specifications and Title 20 Appliance Efficiency Regulations.
Implications for ZNE Planning and Future Utility Efficiency Programs: The broader category of Audio/Video is
changing rapidly as single devices can serve multiple functionalities. We expect the use of traditional compact
Active /
Idle (Hrs/yr)
Idle
(Hrs/yr)
Standby /
Off (Hrs/yr)
Active /
Idle (W)
Idle
(W)
Standby
/ Off (W)
Compact Audio 2013 ACEEE 2013 83.0 - - - - - - 93 6.6
Compact Audio 2011 Fraunhofer 2011 63.0 2,482 - 6,278 31.6 - 4.3 105 6.6
Compact Audio 2011 LBNL 2011 76.0 - - - - - - 81 6.2
Compact Audio 2010 Bensch et al 2010 - 2,482 - 6,278 31.6 - 4.3 - -
Compact Audio 2008 TIAX 2008 76.0 840 730 7,190 23.0 16.0 7.0 81 6.2
Compact Audio 2007 TIAX 2007 76.0 840 730 7,190 23.0 16.0 7.0 81 6.2
AEC
(TWh/yr)
Device
SubcategoryYear Study
Installed
Base
(Million)
Usage Power UEC
(kWh/yr)
Metric Value Source
Installed Base - US (M) 63 Fraunhofer 2011
Usage (hrs/yr) Active / Idle 840 Bensch et al 2010
Idle - -
Standby / Off 7,190 Bensch et al 2010
Power (W) Active / Idle 23.0 Bensch et al 2010
Idle - -
Standby / Off 4.3 Bensch et al 2010
UEC (kWh/yr) 105 Calculated
AEC (TWh/yr) 6.6 Calculated
Overall Confidence Low -
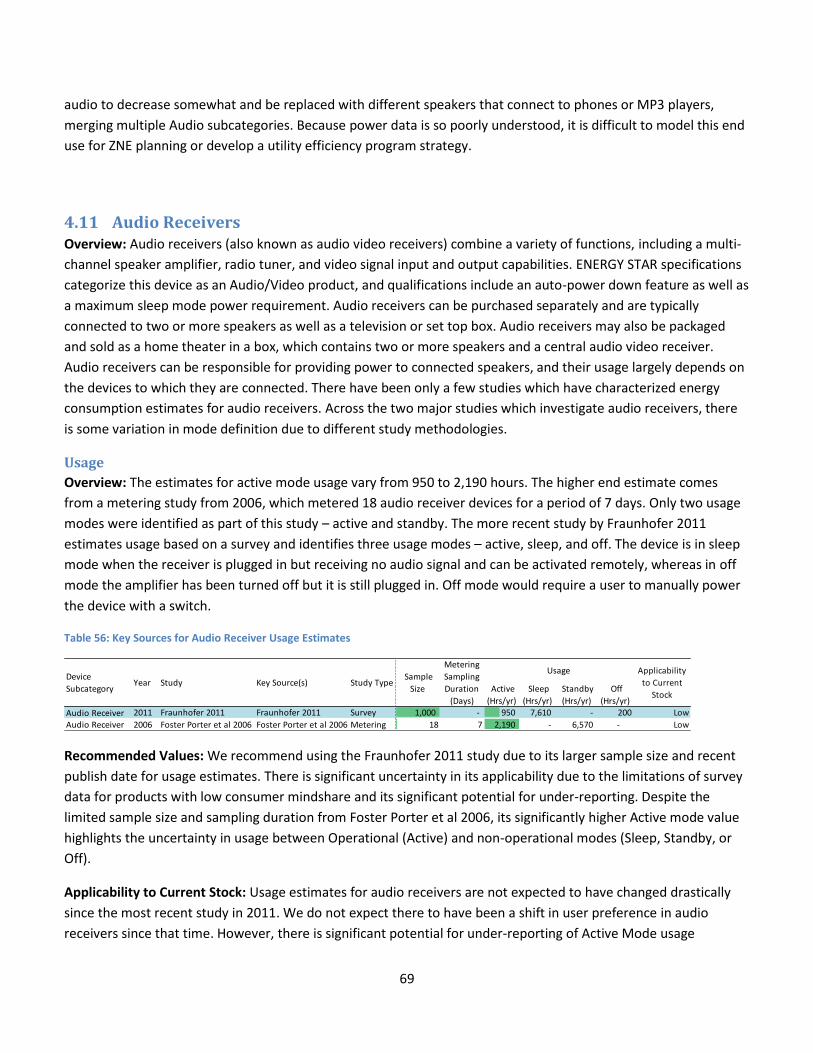
69
audio to decrease somewhat and be replaced with different speakers that connect to phones or MP3 players,
merging multiple Audio subcategories. Because power data is so poorly understood, it is difficult to model this end
use for ZNE planning or develop a utility efficiency program strategy.
4.11 Audio Receivers Overview: Audio receivers (also known as audio video receivers) combine a variety of functions, including a multi-
channel speaker amplifier, radio tuner, and video signal input and output capabilities. ENERGY STAR specifications
categorize this device as an Audio/Video product, and qualifications include an auto-power down feature as well as
a maximum sleep mode power requirement. Audio receivers can be purchased separately and are typically
connected to two or more speakers as well as a television or set top box. Audio receivers may also be packaged
and sold as a home theater in a box, which contains two or more speakers and a central audio video receiver.
Audio receivers can be responsible for providing power to connected speakers, and their usage largely depends on
the devices to which they are connected. There have been only a few studies which have characterized energy
consumption estimates for audio receivers. Across the two major studies which investigate audio receivers, there
is some variation in mode definition due to different study methodologies.
Usage
Overview: The estimates for active mode usage vary from 950 to 2,190 hours. The higher end estimate comes
from a metering study from 2006, which metered 18 audio receiver devices for a period of 7 days. Only two usage
modes were identified as part of this study – active and standby. The more recent study by Fraunhofer 2011
estimates usage based on a survey and identifies three usage modes – active, sleep, and off. The device is in sleep
mode when the receiver is plugged in but receiving no audio signal and can be activated remotely, whereas in off
mode the amplifier has been turned off but it is still plugged in. Off mode would require a user to manually power
the device with a switch.
Table 56: Key Sources for Audio Receiver Usage Estimates
Recommended Values: We recommend using the Fraunhofer 2011 study due to its larger sample size and recent
publish date for usage estimates. There is significant uncertainty in its applicability due to the limitations of survey
data for products with low consumer mindshare and its significant potential for under-reporting. Despite the
limited sample size and sampling duration from Foster Porter et al 2006, its significantly higher Active mode value
highlights the uncertainty in usage between Operational (Active) and non-operational modes (Sleep, Standby, or
Off).
Applicability to Current Stock: Usage estimates for audio receivers are not expected to have changed drastically
since the most recent study in 2011. We do not expect there to have been a shift in user preference in audio
receivers since that time. However, there is significant potential for under-reporting of Active Mode usage
Active
(Hrs/yr)
Sleep
(Hrs/yr)
Standby
(Hrs/yr)
Off
(Hrs/yr)
Audio Receiver 2011 Fraunhofer 2011 Fraunhofer 2011 Survey 1,000 - 950 7,610 - 200 Low
Audio Receiver 2006 Foster Porter et al 2006 Foster Porter et al 2006 Metering 18 7 2,190 - 6,570 - Low
Device
SubcategoryYear Study Key Source(s) Study Type
Sample
Size
Metering
Sampling
Duration
(Days)
Usage Applicability
to Current
Stock
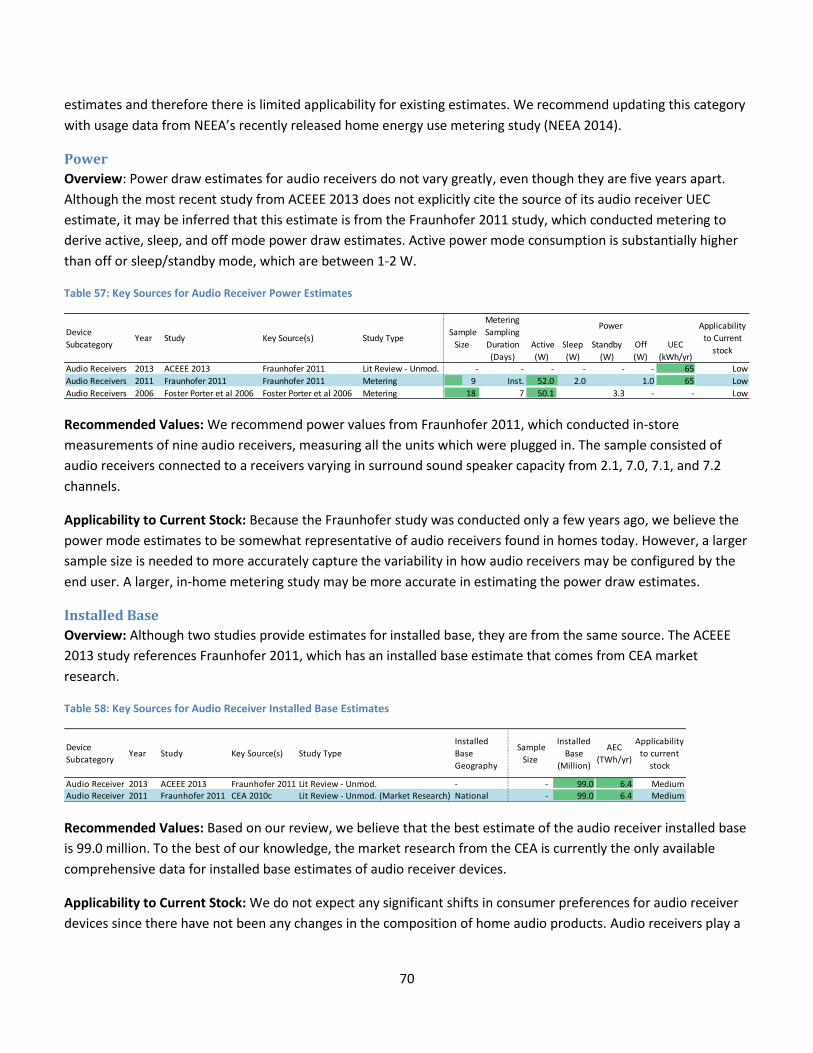
70
estimates and therefore there is limited applicability for existing estimates. We recommend updating this category
with usage data from NEEA’s recently released home energy use metering study (NEEA 2014).
Power
Overview: Power draw estimates for audio receivers do not vary greatly, even though they are five years apart.
Although the most recent study from ACEEE 2013 does not explicitly cite the source of its audio receiver UEC
estimate, it may be inferred that this estimate is from the Fraunhofer 2011 study, which conducted metering to
derive active, sleep, and off mode power draw estimates. Active power mode consumption is substantially higher
than off or sleep/standby mode, which are between 1-2 W.
Table 57: Key Sources for Audio Receiver Power Estimates
Recommended Values: We recommend power values from Fraunhofer 2011, which conducted in-store
measurements of nine audio receivers, measuring all the units which were plugged in. The sample consisted of
audio receivers connected to a receivers varying in surround sound speaker capacity from 2.1, 7.0, 7.1, and 7.2
channels.
Applicability to Current Stock: Because the Fraunhofer study was conducted only a few years ago, we believe the
power mode estimates to be somewhat representative of audio receivers found in homes today. However, a larger
sample size is needed to more accurately capture the variability in how audio receivers may be configured by the
end user. A larger, in-home metering study may be more accurate in estimating the power draw estimates.
Installed Base
Overview: Although two studies provide estimates for installed base, they are from the same source. The ACEEE
2013 study references Fraunhofer 2011, which has an installed base estimate that comes from CEA market
research.
Table 58: Key Sources for Audio Receiver Installed Base Estimates
Recommended Values: Based on our review, we believe that the best estimate of the audio receiver installed base
is 99.0 million. To the best of our knowledge, the market research from the CEA is currently the only available
comprehensive data for installed base estimates of audio receiver devices.
Applicability to Current Stock: We do not expect any significant shifts in consumer preferences for audio receiver
devices since there have not been any changes in the composition of home audio products. Audio receivers play a
Active
(W)
Sleep
(W)
Standby
(W)
Off
(W)
UEC
(kWh/yr)
Audio Receivers 2013 ACEEE 2013 Fraunhofer 2011 Lit Review - Unmod. - - - - - - 65 Low
Audio Receivers 2011 Fraunhofer 2011 Fraunhofer 2011 Metering 9 Inst. 52.0 2.0 1.0 65 Low
Audio Receivers 2006 Foster Porter et al 2006 Foster Porter et al 2006 Metering 18 7 50.1 3.3 - - Low
Key Source(s) Study Type Sample
Size
Metering
Sampling
Duration
(Days)
Power Applicability
to Current
stock
StudyDevice
SubcategoryYear
Audio Receiver 2013 ACEEE 2013 Fraunhofer 2011 Lit Review - Unmod. - - 99.0 6.4 Medium
Audio Receiver 2011 Fraunhofer 2011 CEA 2010c Lit Review - Unmod. (Market Research) National - 99.0 6.4 Medium
Installed
Base
Geography
Device
SubcategoryYear Study Key Source(s) Study Type
Sample
Size
Installed
Base
(Million)
AEC
(TWh/yr)
Applicability
to current
stock
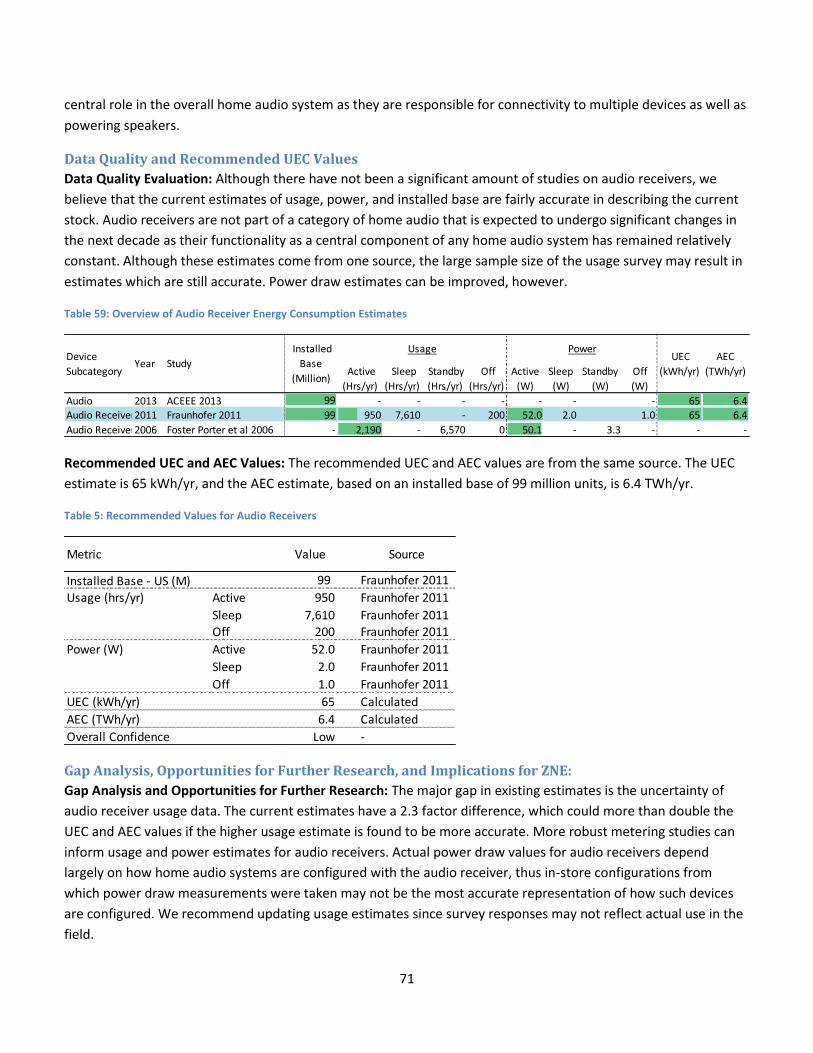
71
central role in the overall home audio system as they are responsible for connectivity to multiple devices as well as
powering speakers.
Data Quality and Recommended UEC Values
Data Quality Evaluation: Although there have not been a significant amount of studies on audio receivers, we
believe that the current estimates of usage, power, and installed base are fairly accurate in describing the current
stock. Audio receivers are not part of a category of home audio that is expected to undergo significant changes in
the next decade as their functionality as a central component of any home audio system has remained relatively
constant. Although these estimates come from one source, the large sample size of the usage survey may result in
estimates which are still accurate. Power draw estimates can be improved, however.
Table 59: Overview of Audio Receiver Energy Consumption Estimates
Recommended UEC and AEC Values: The recommended UEC and AEC values are from the same source. The UEC
estimate is 65 kWh/yr, and the AEC estimate, based on an installed base of 99 million units, is 6.4 TWh/yr.
Table 5: Recommended Values for Audio Receivers
Gap Analysis, Opportunities for Further Research, and Implications for ZNE:
Gap Analysis and Opportunities for Further Research: The major gap in existing estimates is the uncertainty of
audio receiver usage data. The current estimates have a 2.3 factor difference, which could more than double the
UEC and AEC values if the higher usage estimate is found to be more accurate. More robust metering studies can
inform usage and power estimates for audio receivers. Actual power draw values for audio receivers depend
largely on how home audio systems are configured with the audio receiver, thus in-store configurations from
which power draw measurements were taken may not be the most accurate representation of how such devices
are configured. We recommend updating usage estimates since survey responses may not reflect actual use in the
field.
Active
(Hrs/yr)
Sleep
(Hrs/yr)
Standby
(Hrs/yr)
Off
(Hrs/yr)
Active
(W)
Sleep
(W)
Standby
(W)
Off
(W)
Audio 2013 ACEEE 2013 99 - - - - - - - 65 6.4
Audio Receivers2011 Fraunhofer 2011 99 950 7,610 - 200 52.0 2.0 1.0 65 6.4
Audio Receivers2006 Foster Porter et al 2006 - 2,190 - 6,570 0 50.1 - 3.3 - - -
AEC
(TWh/yr)
Device
SubcategoryYear Study
Installed
Base
(Million)
Usage Power UEC
(kWh/yr)
Metric Value Source
Installed Base - US (M) 99 Fraunhofer 2011
Usage (hrs/yr) Active 950 Fraunhofer 2011
Sleep 7,610 Fraunhofer 2011Off 200 Fraunhofer 2011
Power (W) Active 52.0 Fraunhofer 2011
Sleep 2.0 Fraunhofer 2011
Off 1.0 Fraunhofer 2011
UEC (kWh/yr) 65 Calculated
AEC (TWh/yr) 6.4 Calculated
Overall Confidence Low -
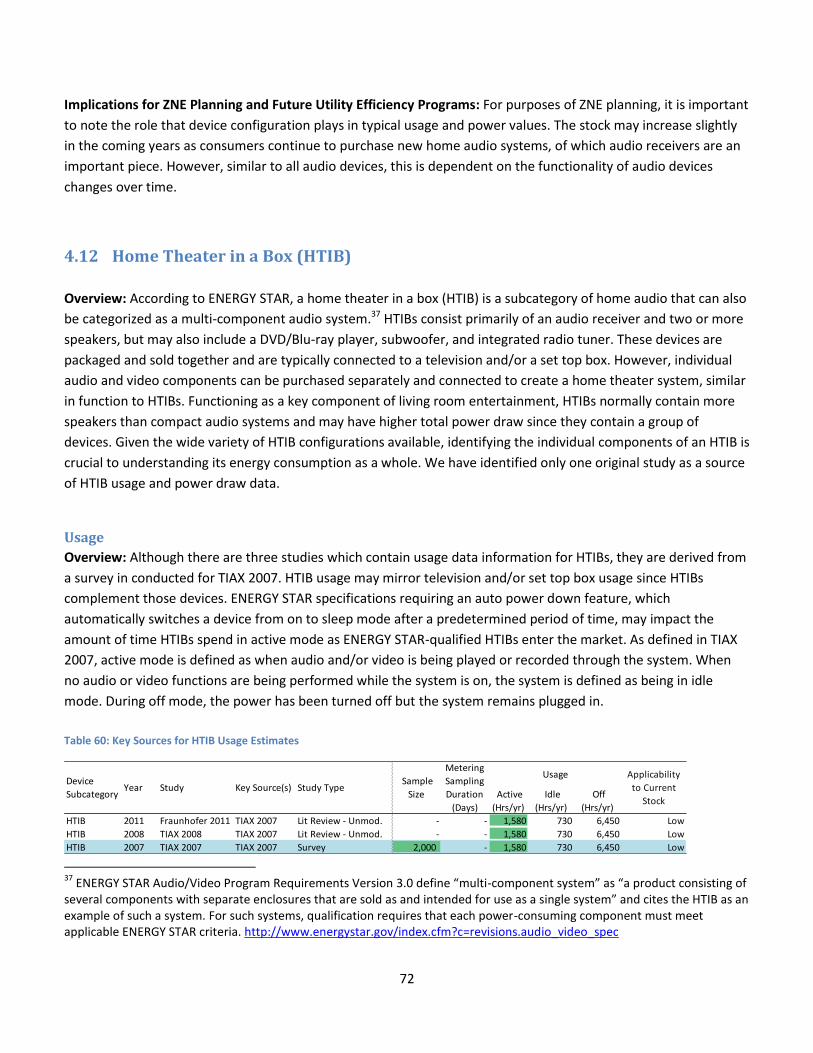
72
Implications for ZNE Planning and Future Utility Efficiency Programs: For purposes of ZNE planning, it is important
to note the role that device configuration plays in typical usage and power values. The stock may increase slightly
in the coming years as consumers continue to purchase new home audio systems, of which audio receivers are an
important piece. However, similar to all audio devices, this is dependent on the functionality of audio devices
changes over time.
4.12 Home Theater in a Box (HTIB)
Overview: According to ENERGY STAR, a home theater in a box (HTIB) is a subcategory of home audio that can also
be categorized as a multi-component audio system.37 HTIBs consist primarily of an audio receiver and two or more
speakers, but may also include a DVD/Blu-ray player, subwoofer, and integrated radio tuner. These devices are
packaged and sold together and are typically connected to a television and/or a set top box. However, individual
audio and video components can be purchased separately and connected to create a home theater system, similar
in function to HTIBs. Functioning as a key component of living room entertainment, HTIBs normally contain more
speakers than compact audio systems and may have higher total power draw since they contain a group of
devices. Given the wide variety of HTIB configurations available, identifying the individual components of an HTIB is
crucial to understanding its energy consumption as a whole. We have identified only one original study as a source
of HTIB usage and power draw data.
Usage
Overview: Although there are three studies which contain usage data information for HTIBs, they are derived from
a survey in conducted for TIAX 2007. HTIB usage may mirror television and/or set top box usage since HTIBs
complement those devices. ENERGY STAR specifications requiring an auto power down feature, which
automatically switches a device from on to sleep mode after a predetermined period of time, may impact the
amount of time HTIBs spend in active mode as ENERGY STAR-qualified HTIBs enter the market. As defined in TIAX
2007, active mode is defined as when audio and/or video is being played or recorded through the system. When
no audio or video functions are being performed while the system is on, the system is defined as being in idle
mode. During off mode, the power has been turned off but the system remains plugged in.
Table 60: Key Sources for HTIB Usage Estimates
37
ENERGY STAR Audio/Video Program Requirements Version 3.0 define “multi-component system” as “a product consisting of several components with separate enclosures that are sold as and intended for use as a single system” and cites the HTIB as an example of such a system. For such systems, qualification requires that each power-consuming component must meet applicable ENERGY STAR criteria. http://www.energystar.gov/index.cfm?c=revisions.audio_video_spec
Active
(Hrs/yr)
Idle
(Hrs/yr)
Off
(Hrs/yr)
HTIB 2011 Fraunhofer 2011 TIAX 2007 Lit Review - Unmod. - - 1,580 730 6,450 Low
HTIB 2008 TIAX 2008 TIAX 2007 Lit Review - Unmod. - - 1,580 730 6,450 Low
HTIB 2007 TIAX 2007 TIAX 2007 Survey 2,000 - 1,580 730 6,450 Low
Device
SubcategoryYear Study Key Source(s) Study Type
Sample
Size
Metering
Sampling
Duration
(Days)
Usage Applicability
to Current
Stock

73
Recommended Values: We recommend estimates from TIAX 2007 in Table 60, which are derived from a national
survey with a sample size of 2,000. The other two studies cite this source for HTIB usage and do not modify the
estimates. Active mode usage hours are somewhat similar to that of televisions, supporting the claim that HTIBs
may typically be operated simultaneously with televisions as part of a home theater entertainment system.
Applicability to current stock: The recommended values have low applicability because there are significant
limitations of survey data for products with low consumer mindshare and the significant potential for under-
reporting. End users may not be actively aware of the time their HTIB system spends in idle versus off mode, thus
their responses on the survey may not accurately reflect the time spent in each mode. In addition, ENERGY STAR
specifications may already have impacted the time a system spends in idle mode as defined by TIAX 2007 since the
auto power down feature switches a system to sleep mode38 after a predetermined amount of time. A metering
study would provide more accurate usage estimates as it may be possible to capture differences between idle and
off mode usage.
Power
Overview: HTIBs generally have higher power draw than compact audio systems, given that they are composed of
a group of devices which may include a DVD/Blu-ray player. It is important to identify exactly which devices
operate simultaneously as an HTIB system in order to accurately estimate the total power draw from such a
system, as active mode power draw can vary greatly depending on the number of devices operating. Based on
metering, TIAX 2007 provides power estimates in active, idle, and off modes.
Table 61: Key Sources for HTIB Power Estimates
Recommended Values: We recommend estimates from TIAX 2007 in Table 61 as the other sources simple cite its
power draw estimates across the three different modes. As part of the TIAX 2007 study, CEA collected active mode
power draw data on best-selling HTIB units at that time. The number of speakers in this sample of 13 HTIBs ranged
from two to six, and nine of the HTIBs contained a DVD player as part of the system. For the units with DVD
players, power draw estimates were taken while the DVD was playing. For idle mode, TIAX 2007 cites Rosen and
Meier 1999, which estimates that idle mode power draw for “a receiver based component stereo system” was
approximately 4 W less than active mode power draw.
Applicability to Current Stock: We believe the power draw estimates to have low applicability due to the age and
challenge in estimating energy consumption of the entire HTIB system. Sleep mode requirements for multi-
38
Sleep mode requirements for ENERGY STAR include a maximum 1 W power allowance, which is similar to off mode power draw estimates in Table 60. This implies that the current stock may spend less time in idle mode.
Active
(W)
Idle
(W)
Off
(W)
UEC
(kWh/yr)
HTIB 2013 ACEEE 2013 - - - - - - - 90 Low
HTIB 2011 Fraunhofer 2011 TIAX 2007 Lit Review - Mod. - - 37.0 33.0 1.3 91 Low
HTIB 2008 TIAX 2008 TIAX 2007 Lit Review - Mod. 13 Inst. 38.0 34.0 0.6 89 Low
HTIB 2007 TIAX 2007 TIAX 2007, Rosen and Meier 1999 Metering (Metering) 13 Inst. 37.0 33.0 1.3 89 Low
Key Source(s)Study Type
(Source Type)
Sample
Size
Metering
Sampling
Duration
(Days)
Power Applicability
to current
stock
StudyDevice
SubcategoryYear
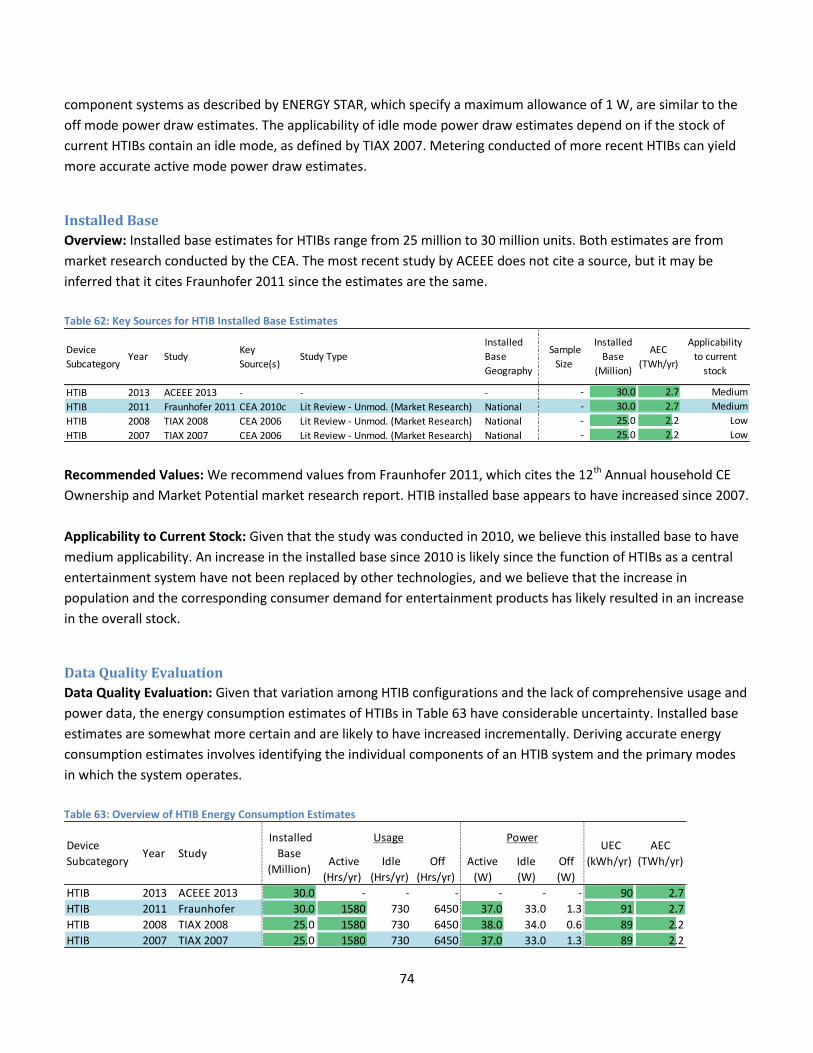
74
component systems as described by ENERGY STAR, which specify a maximum allowance of 1 W, are similar to the
off mode power draw estimates. The applicability of idle mode power draw estimates depend on if the stock of
current HTIBs contain an idle mode, as defined by TIAX 2007. Metering conducted of more recent HTIBs can yield
more accurate active mode power draw estimates.
Installed Base
Overview: Installed base estimates for HTIBs range from 25 million to 30 million units. Both estimates are from
market research conducted by the CEA. The most recent study by ACEEE does not cite a source, but it may be
inferred that it cites Fraunhofer 2011 since the estimates are the same.
Table 62: Key Sources for HTIB Installed Base Estimates
Recommended Values: We recommend values from Fraunhofer 2011, which cites the 12th Annual household CE
Ownership and Market Potential market research report. HTIB installed base appears to have increased since 2007.
Applicability to Current Stock: Given that the study was conducted in 2010, we believe this installed base to have
medium applicability. An increase in the installed base since 2010 is likely since the function of HTIBs as a central
entertainment system have not been replaced by other technologies, and we believe that the increase in
population and the corresponding consumer demand for entertainment products has likely resulted in an increase
in the overall stock.
Data Quality Evaluation
Data Quality Evaluation: Given that variation among HTIB configurations and the lack of comprehensive usage and
power data, the energy consumption estimates of HTIBs in Table 63 have considerable uncertainty. Installed base
estimates are somewhat more certain and are likely to have increased incrementally. Deriving accurate energy
consumption estimates involves identifying the individual components of an HTIB system and the primary modes
in which the system operates.
Table 63: Overview of HTIB Energy Consumption Estimates
HTIB 2013 ACEEE 2013 - - - - 30.0 2.7 Medium
HTIB 2011 Fraunhofer 2011 CEA 2010c Lit Review - Unmod. (Market Research) National - 30.0 2.7 Medium
HTIB 2008 TIAX 2008 CEA 2006 Lit Review - Unmod. (Market Research) National - 25.0 2.2 Low
HTIB 2007 TIAX 2007 CEA 2006 Lit Review - Unmod. (Market Research) National - 25.0 2.2 Low
Sample
Size
Installed
Base
(Million)
AEC
(TWh/yr)
Applicability
to current
stock
Installed
Base
Geography
Device
SubcategoryYear Study
Key
Source(s)Study Type
Active
(Hrs/yr)
Idle
(Hrs/yr)
Off
(Hrs/yr)
Active
(W)
Idle
(W)
Off
(W)
HTIB 2013 ACEEE 2013 30.0 - - - - - - 90 2.7
HTIB 2011 Fraunhofer 30.0 1580 730 6450 37.0 33.0 1.3 91 2.7
HTIB 2008 TIAX 2008 25.0 1580 730 6450 38.0 34.0 0.6 89 2.2
HTIB 2007 TIAX 2007 25.0 1580 730 6450 37.0 33.0 1.3 89 2.2
AEC
(TWh/yr)
Device
SubcategoryYear Study
Installed
Base
(Million)
Usage Power UEC
(kWh/yr)
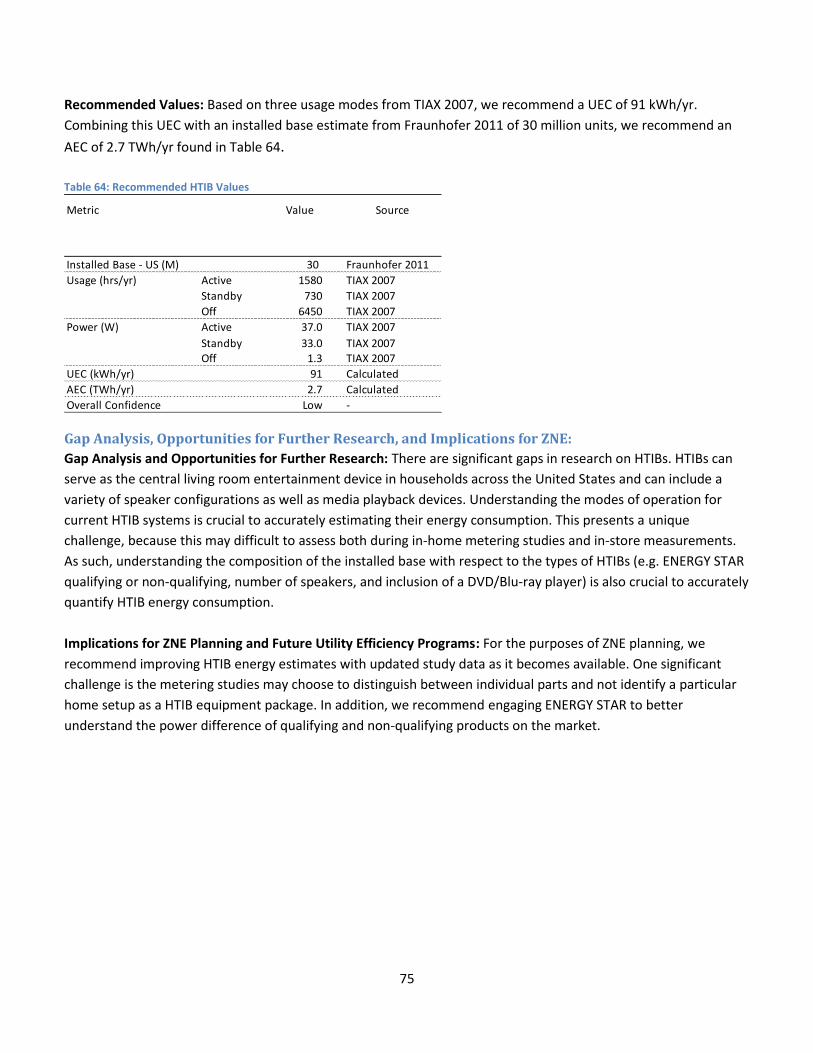
75
Recommended Values: Based on three usage modes from TIAX 2007, we recommend a UEC of 91 kWh/yr.
Combining this UEC with an installed base estimate from Fraunhofer 2011 of 30 million units, we recommend an
AEC of 2.7 TWh/yr found in Table 64.
Table 64: Recommended HTIB Values
Gap Analysis, Opportunities for Further Research, and Implications for ZNE:
Gap Analysis and Opportunities for Further Research: There are significant gaps in research on HTIBs. HTIBs can
serve as the central living room entertainment device in households across the United States and can include a
variety of speaker configurations as well as media playback devices. Understanding the modes of operation for
current HTIB systems is crucial to accurately estimating their energy consumption. This presents a unique
challenge, because this may difficult to assess both during in-home metering studies and in-store measurements.
As such, understanding the composition of the installed base with respect to the types of HTIBs (e.g. ENERGY STAR
qualifying or non-qualifying, number of speakers, and inclusion of a DVD/Blu-ray player) is also crucial to accurately
quantify HTIB energy consumption.
Implications for ZNE Planning and Future Utility Efficiency Programs: For the purposes of ZNE planning, we
recommend improving HTIB energy estimates with updated study data as it becomes available. One significant
challenge is the metering studies may choose to distinguish between individual parts and not identify a particular
home setup as a HTIB equipment package. In addition, we recommend engaging ENERGY STAR to better
understand the power difference of qualifying and non-qualifying products on the market.
Metric Value Source
Installed Base - US (M) 30 Fraunhofer 2011
Usage (hrs/yr) Active 1580 TIAX 2007
Standby 730 TIAX 2007
Off 6450 TIAX 2007
Power (W) Active 37.0 TIAX 2007
Standby 33.0 TIAX 2007
Off 1.3 TIAX 2007
UEC (kWh/yr) 91 Calculated
AEC (TWh/yr) 2.7 Calculated
Overall Confidence Low -
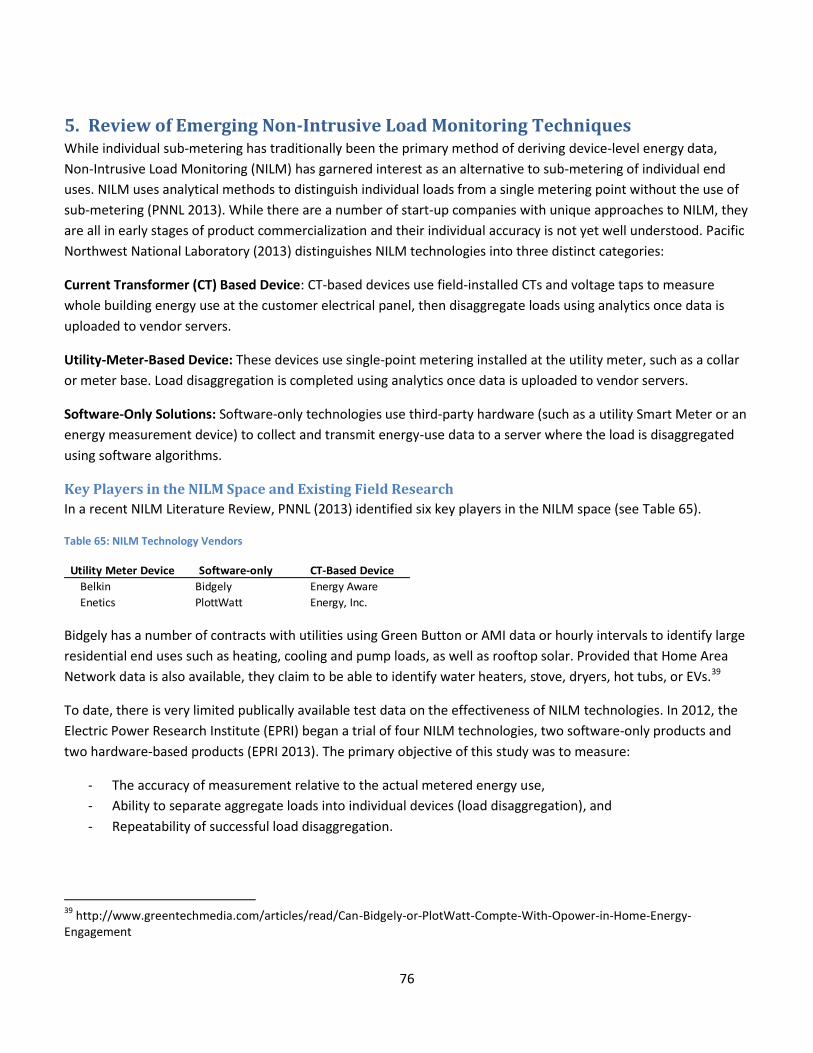
76
5. Review of Emerging Non-Intrusive Load Monitoring Techniques While individual sub-metering has traditionally been the primary method of deriving device-level energy data,
Non-Intrusive Load Monitoring (NILM) has garnered interest as an alternative to sub-metering of individual end
uses. NILM uses analytical methods to distinguish individual loads from a single metering point without the use of
sub-metering (PNNL 2013). While there are a number of start-up companies with unique approaches to NILM, they
are all in early stages of product commercialization and their individual accuracy is not yet well understood. Pacific
Northwest National Laboratory (2013) distinguishes NILM technologies into three distinct categories:
Current Transformer (CT) Based Device: CT-based devices use field-installed CTs and voltage taps to measure
whole building energy use at the customer electrical panel, then disaggregate loads using analytics once data is
uploaded to vendor servers.
Utility-Meter-Based Device: These devices use single-point metering installed at the utility meter, such as a collar
or meter base. Load disaggregation is completed using analytics once data is uploaded to vendor servers.
Software-Only Solutions: Software-only technologies use third-party hardware (such as a utility Smart Meter or an
energy measurement device) to collect and transmit energy-use data to a server where the load is disaggregated
using software algorithms.
Key Players in the NILM Space and Existing Field Research
In a recent NILM Literature Review, PNNL (2013) identified six key players in the NILM space (see Table 65).
Table 65: NILM Technology Vendors
Bidgely has a number of contracts with utilities using Green Button or AMI data or hourly intervals to identify large
residential end uses such as heating, cooling and pump loads, as well as rooftop solar. Provided that Home Area
Network data is also available, they claim to be able to identify water heaters, stove, dryers, hot tubs, or EVs.39
To date, there is very limited publically available test data on the effectiveness of NILM technologies. In 2012, the
Electric Power Research Institute (EPRI) began a trial of four NILM technologies, two software-only products and
two hardware-based products (EPRI 2013). The primary objective of this study was to measure:
- The accuracy of measurement relative to the actual metered energy use,
- Ability to separate aggregate loads into individual devices (load disaggregation), and
- Repeatability of successful load disaggregation.
39
http://www.greentechmedia.com/articles/read/Can-Bidgely-or-PlotWatt-Compte-With-Opower-in-Home-Energy-Engagement
Utility Meter Device Software-only CT-Based Device
Belkin Bidgely Energy Aware
Enetics PlottWatt Energy, Inc.
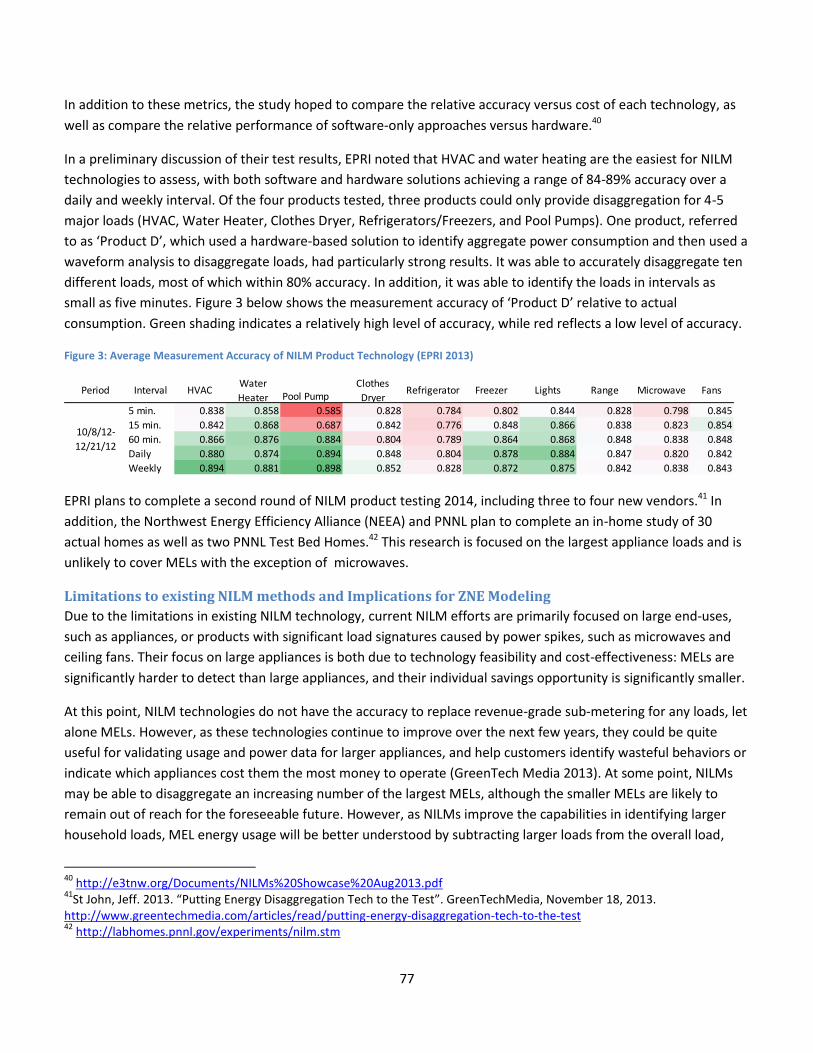
77
In addition to these metrics, the study hoped to compare the relative accuracy versus cost of each technology, as
well as compare the relative performance of software-only approaches versus hardware.40
In a preliminary discussion of their test results, EPRI noted that HVAC and water heating are the easiest for NILM
technologies to assess, with both software and hardware solutions achieving a range of 84-89% accuracy over a
daily and weekly interval. Of the four products tested, three products could only provide disaggregation for 4-5
major loads (HVAC, Water Heater, Clothes Dryer, Refrigerators/Freezers, and Pool Pumps). One product, referred
to as ‘Product D’, which used a hardware-based solution to identify aggregate power consumption and then used a
waveform analysis to disaggregate loads, had particularly strong results. It was able to accurately disaggregate ten
different loads, most of which within 80% accuracy. In addition, it was able to identify the loads in intervals as
small as five minutes. Figure 3 below shows the measurement accuracy of ‘Product D’ relative to actual
consumption. Green shading indicates a relatively high level of accuracy, while red reflects a low level of accuracy.
Figure 3: Average Measurement Accuracy of NILM Product Technology (EPRI 2013)
EPRI plans to complete a second round of NILM product testing 2014, including three to four new vendors.41 In
addition, the Northwest Energy Efficiency Alliance (NEEA) and PNNL plan to complete an in-home study of 30
actual homes as well as two PNNL Test Bed Homes.42 This research is focused on the largest appliance loads and is
unlikely to cover MELs with the exception of microwaves.
Limitations to existing NILM methods and Implications for ZNE Modeling
Due to the limitations in existing NILM technology, current NILM efforts are primarily focused on large end-uses,
such as appliances, or products with significant load signatures caused by power spikes, such as microwaves and
ceiling fans. Their focus on large appliances is both due to technology feasibility and cost-effectiveness: MELs are
significantly harder to detect than large appliances, and their individual savings opportunity is significantly smaller.
At this point, NILM technologies do not have the accuracy to replace revenue-grade sub-metering for any loads, let
alone MELs. However, as these technologies continue to improve over the next few years, they could be quite
useful for validating usage and power data for larger appliances, and help customers identify wasteful behaviors or
indicate which appliances cost them the most money to operate (GreenTech Media 2013). At some point, NILMs
may be able to disaggregate an increasing number of the largest MELs, although the smaller MELs are likely to
remain out of reach for the foreseeable future. However, as NILMs improve the capabilities in identifying larger
household loads, MEL energy usage will be better understood by subtracting larger loads from the overall load,
40
http://e3tnw.org/Documents/NILMs%20Showcase%20Aug2013.pdf 41
St John, Jeff. 2013. “Putting Energy Disaggregation Tech to the Test”. GreenTechMedia, November 18, 2013. http://www.greentechmedia.com/articles/read/putting-energy-disaggregation-tech-to-the-test 42
http://labhomes.pnnl.gov/experiments/nilm.stm
Period Interval HVACWater
Heater Pool PumpClothes
DryerRefrigerator Freezer Lights Range Microwave Fans
5 min. 0.838 0.858 0.585 0.828 0.784 0.802 0.844 0.828 0.798 0.845
15 min. 0.842 0.868 0.687 0.842 0.776 0.848 0.866 0.838 0.823 0.854
60 min. 0.866 0.876 0.884 0.804 0.789 0.864 0.868 0.848 0.838 0.848
Daily 0.880 0.874 0.894 0.848 0.804 0.878 0.884 0.847 0.820 0.842
Weekly 0.894 0.881 0.898 0.852 0.828 0.872 0.875 0.842 0.838 0.843
10/8/12-
12/21/12

78
which nets the MEL load. This added resolution can provide a significant improvement to existing ZNE modeling
methods for MELs, which currently account for MELs by calculating energy use as a function of square footage
without accounting for changes over time.
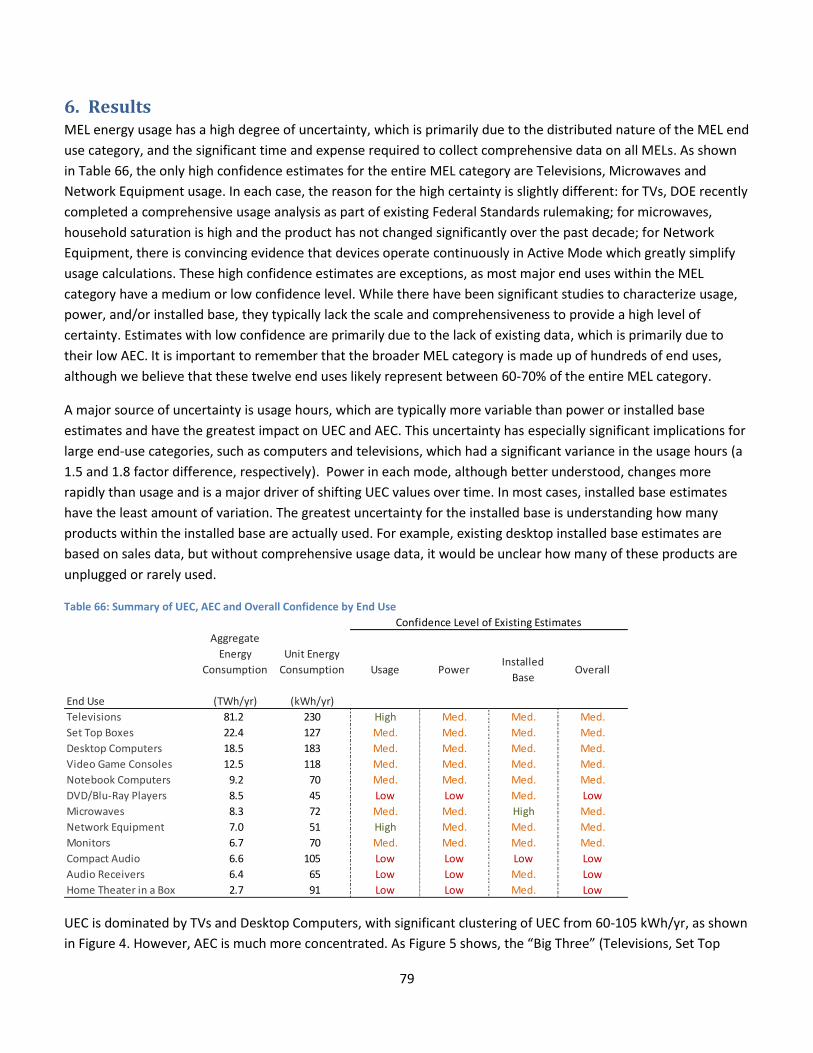
79
6. Results MEL energy usage has a high degree of uncertainty, which is primarily due to the distributed nature of the MEL end
use category, and the significant time and expense required to collect comprehensive data on all MELs. As shown
in Table 66, the only high confidence estimates for the entire MEL category are Televisions, Microwaves and
Network Equipment usage. In each case, the reason for the high certainty is slightly different: for TVs, DOE recently
completed a comprehensive usage analysis as part of existing Federal Standards rulemaking; for microwaves,
household saturation is high and the product has not changed significantly over the past decade; for Network
Equipment, there is convincing evidence that devices operate continuously in Active Mode which greatly simplify
usage calculations. These high confidence estimates are exceptions, as most major end uses within the MEL
category have a medium or low confidence level. While there have been significant studies to characterize usage,
power, and/or installed base, they typically lack the scale and comprehensiveness to provide a high level of
certainty. Estimates with low confidence are primarily due to the lack of existing data, which is primarily due to
their low AEC. It is important to remember that the broader MEL category is made up of hundreds of end uses,
although we believe that these twelve end uses likely represent between 60-70% of the entire MEL category.
A major source of uncertainty is usage hours, which are typically more variable than power or installed base
estimates and have the greatest impact on UEC and AEC. This uncertainty has especially significant implications for
large end-use categories, such as computers and televisions, which had a significant variance in the usage hours (a
1.5 and 1.8 factor difference, respectively). Power in each mode, although better understood, changes more
rapidly than usage and is a major driver of shifting UEC values over time. In most cases, installed base estimates
have the least amount of variation. The greatest uncertainty for the installed base is understanding how many
products within the installed base are actually used. For example, existing desktop installed base estimates are
based on sales data, but without comprehensive usage data, it would be unclear how many of these products are
unplugged or rarely used.
Table 66: Summary of UEC, AEC and Overall Confidence by End Use
UEC is dominated by TVs and Desktop Computers, with significant clustering of UEC from 60-105 kWh/yr, as shown
in Figure 4. However, AEC is much more concentrated. As Figure 5 shows, the “Big Three” (Televisions, Set Top
End Use
Aggregate
Energy
Consumption
(TWh/yr)
Unit Energy
Consumption
(kWh/yr)
Usage PowerInstalled
BaseOverall
Televisions 81.2 230 High Med. Med. Med.
Set Top Boxes 22.4 127 Med. Med. Med. Med.
Desktop Computers 18.5 183 Med. Med. Med. Med.
Video Game Consoles 12.5 118 Med. Med. Med. Med.
Notebook Computers 9.2 70 Med. Med. Med. Med.
DVD/Blu-Ray Players 8.5 45 Low Low Med. Low
Microwaves 8.3 72 Med. Med. High Med.
Network Equipment 7.0 51 High Med. Med. Med.
Monitors 6.7 70 Med. Med. Med. Med.
Compact Audio 6.6 105 Low Low Low Low
Audio Receivers 6.4 65 Low Low Med. Low
Home Theater in a Box 2.7 91 Low Low Med. Low
Confidence Level of Existing Estimates
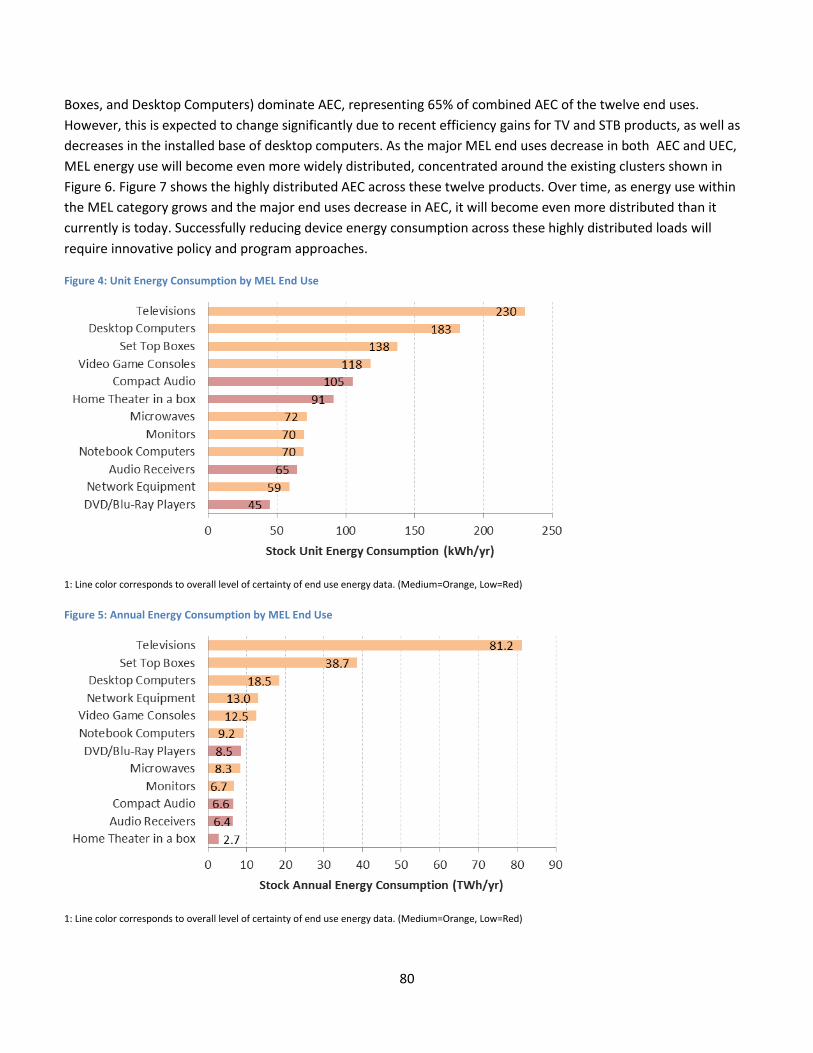
80
Boxes, and Desktop Computers) dominate AEC, representing 65% of combined AEC of the twelve end uses.
However, this is expected to change significantly due to recent efficiency gains for TV and STB products, as well as
decreases in the installed base of desktop computers. As the major MEL end uses decrease in both AEC and UEC,
MEL energy use will become even more widely distributed, concentrated around the existing clusters shown in
Figure 6. Figure 7 shows the highly distributed AEC across these twelve products. Over time, as energy use within
the MEL category grows and the major end uses decrease in AEC, it will become even more distributed than it
currently is today. Successfully reducing device energy consumption across these highly distributed loads will
require innovative policy and program approaches.
Figure 4: Unit Energy Consumption by MEL End Use
1: Line color corresponds to overall level of certainty of end use energy data. (Medium=Orange, Low=Red)
Figure 5: Annual Energy Consumption by MEL End Use
1: Line color corresponds to overall level of certainty of end use energy data. (Medium=Orange, Low=Red)

81
Figure 6: Overview of Selected MEL Energy Estimates and their level of Certainty
1: Bubble Size corresponds to Annual Energy Consumption (TWh/yr).
2: Bubble Color corresponds to overall level of certainty of end use energy data. Medium=Orange, Low=Red)
Figure 7: Distribution of Annual Energy Consumption (AEC) among the twelve end uses
1: While these twelve end uses represent the majority of MEL energy consumption, there are many other MELs which are not included in this chart. Including
more MELs would reduce the individual share of each end use.
82
7. Summary Recommendations for Future ZNE Planning As MELs (and the broader category of plug-in equipment as a whole) become an increasingly large component of
building energy use, it is critically important that MELs energy usage is accurately represented in ZNE models.
Inaccurate modeling will create one of two undesirable outcomes: a) If plug-in equipment energy use is
significantly higher than modeled, the home will not actually be ZNE; or b) if plug-in equipment energy use is
significantly lower than modeled, developers will be required to unnecessarily increase the size of the rooftop PV
system, which presents additional cost to the developer.43
The broader issue of plug-load modeling centers around three points:
4) How to incorporate MELs and other plug loads into the existing HERS model,
5) How to collect MEL data on an ongoing basis and integrate updated data into the HERS model; and
6) How to assess the accuracy of this data.
We believe that this study provides a useful framework for assessing study accuracy and the start of developing
higher resolution estimates of MELs. Our recommendations focus on the first two points above44 and are
separated into ‘Next Steps’ and ‘M&E Research Roadmap Recommendations’.
7.1 Next Step Recommendations
Recommendation #1: Update the HERS model to incorporate large MEL end-uses
We estimate that the twelve end uses described in detail in this report account for roughly 60-70% of household
MEL energy consumption. However, based on the 2008 Home Energy Rating System (HERS) technical manual,
miscellaneous electricity consumption is modeled as a function of square footage, and the only plug loads that are
individually modeled are refrigerator/freezers, dishwashers, clothes dryers, clothes washers, and range/ovens.45
The current ZNE modeling equation does not disaggregate within this broad MEL category, which does not allow
for developing individual MEL estimates or refining them over time as they change. We recommend that the next
version of the HERS model be updated to individually account for major MELs. At a minimum, this would include
televisions but would ideally be extended to other MELs with high AEC values and a large installed base, including,
but not limited to, desktop and notebook computers, set top boxes, network equipment, and microwaves. In
addition, we recommend that the Investor-owned Utilities (IOUs) engage Non-Intrusive Load Monitoring (NILM)
technology vendors to discuss the feasibility of modeling large, non-MEL end uses to better understand the
fractional home energy use of MELs.
43
While this study does not quantify the impact of ZNE modeling absent this true-up, the potential implications are sufficiently large to warrant future study. 44
While our recommendations our focused on improving ZNE modeling efforts, these recommendations also have implications for utility efficiency programs. While not discussed in detail here, a number of these strategies are outlined in the Northeast Energy Efficiency Partnership’s (NEEP) 2013 Business and Consumer Electronics Strategy document. https://neep.org/Assets/uploads/files/market-strategies/BCE/2013%20BCE%20Strategy_FINAL.pdf 45
See Section 4.5.6, Equation 10 in CEC 2008. http://www.energy.ca.gov/2008publications/CEC-400-2008-012/CEC-400-2008-012-CMF.PDF
83
Recommendation #2: Develop a Stock-Flow model to inform ZNE modeling efforts
Most MELs, especially consumer electronic (CE) devices, experience rapid product turnover and require frequent
updates to maintain accurate estimates of usage, power, and installed base. Therefore, accurate modeling of CE
devices requires an understanding of both existing stock energy use and how that stock energy use is expected to
change over time. For example, TVs have by far the highest energy consumption of all MELs, both in terms of UEC
and AEC. However, new TVs coming to market are highly efficient, and Active Mode Power for new TVs has
decreased by approximately 65% during the 2008-2013. By 2020, a significant portion of the existing TV stock will
have turned over and be composed of products purchased in 2014 or later, and therefore TV stock energy use will
be substantially smaller than it is today. To accurately model and forecast future energy use, we recommend
creating a stock-flow analysis a major MELs to model how new products coming to market will impact stock energy
use over time. This consists of identifying the following:
- How technology usage patterns change over time,
- How power draw of new products entering the market changes over time, and
- The flow of products into the home and how they affect the installed base (Do they increase the installed
base or provide a straight replacement of older products? Do certain devices replace other device types –
such as a notebook or tablet replacing a TV and/or stereo.).
This stock-flow analysis is especially important to improve energy use estimates for end uses with medium
confidence levels. For these end uses, there is a limited opportunity to improve upon existing estimates without a
large-scale, comprehensive metering assessment that provides a higher degree of data resolution (see
Recommendation #6). A stock-flow analysis can provide additional resolution for ZNE modeling without
undertaking a large-scale, comprehensive metering assessment. While we recommend this as a next step, we
believe it should also be considered as part of longer-term M&E research.
Recommendation #3: Improve existing data for MELs with low levels of confidence
For products with limited existing data on usage, power, and/or installed base, we recommend updating current
estimates to better characterize existing energy use. To improve usage and power data, we recommend obtaining
this data from large-scale metering studies instead of user surveys due to the limitations of survey data to
accurately reflect actual usage for smaller consumer electronics. For installed base and saturation data, we
recommend using saturation data from the forthcoming 2012 California Lighting and Appliance Saturation Survey
(CLASS) (KEMA 2014).
Recommendation #4: Work with ENERGY STAR and other stakeholders to improve energy
information for non-ENERGY STAR products
A major challenge in modeling MEL energy consumption is the very limited data for non-ENERGY STAR models.
Developing a better understanding of the energy use of an entire product category is a critical component of
developing a stock-flow model, as well understanding potential energy savings opportunities for future utility
programs. While ENERGY STAR typically lists energy data for qualifying products, there is very little data on non-
qualifying models entering the market. In some cases, especially Audio / Video devices, the little data that is
available is limited and often has a low level of certainty. We recommend working with EPA and other stakeholders
to identify opportunities to improve the existing knowledge base of non-qualifying products coming to market.
84
7.2 M&E Research Roadmap Recommendations
Recommendation #5: Support a Market Transformation (MT) approach to address MEL energy
consumption
As the ZNE Technical Feasibility Study (PG&E 2012) highlights, reducing plug load energy consumption is a critical
component to achieving ZNE goals. The unique challenge with plug loads, and MELs in particular, is that with the
exception of a few large end uses such as TVs, Set Top Boxes, and Desktop and Notebook Computers, MEL energy
use is highly distributed. As these three major end uses decrease in their UEC and/or installed base, MEL energy
use will become even more broadly dispersed. This wide distribution across devices and minimal per-unit energy
savings limits the effectiveness of traditional utility program mechanisms and is a key challenge for ZNE buildings.
Due to the limited per-unit savings, an incentive-based, resource-acquisition program for MELs may have limited
success if not coupled with a broader, market transformation approach.
We recommend supporting a market transformation (MT) approach which attempts to create large-scale changes
in aggregate. Although most MELs have low energy consumption, many MELs, particularly CE devices, have high
sales volumes and therefore significant change can be achieved by addressing the market as a whole. This includes,
but is not limited to:
- Collaborating with utilities, efficiency organizations, and other stakeholders to improve the collective
understanding of MEL energy use (see Recommendation #6)
- Participating in the ENERGY STAR specification revision process to update existing product specifications.
- Engaging manufacturers to identify efficiency opportunities in product design.
- Engaging retailers by offering incentives to stock and sell high efficiency products
- Improving energy labeling for CE devices (see Recommendation #7)
This MT approach is focused on achieving change at a national level, and therefore we recommend that the IOUs
partner with other utilities and efficiency organizations to achieve economies of scale in addressing MEL energy
use.
Recommendation #6: Consider conducting a large-scale, multi-year comprehensive metering study to
improve plug load energy data within California
The Northwest Energy Efficiency Alliance (NEEA) is currently conducting a large-scale, multi-year metering study
which measures home energy use for 100 homes throughout the Northwest. This study meters the vast majority of
end-uses within the home, covering an estimated 80% of total load. This study will provide valuable information on
usage patterns and device power consumption, and preliminary findings were recently released in late April
2014.46 We are not aware of any existing metering studies within California that measure end use usage and power
at this level of granularity, scale or monitoring duration.47 We recommend that the IOUs consider conducting a
study similar to NEEA’s within California. However, we recommend that the IOUs review the NEEA study reports
46
The values from the NEEA study are not included in this study due to the timing of its release in late April. http://neea.org/docs/default-source/reports/residential-building-stock-assessment--metering-study.pdf?sfvrsn=6 47
Although the CLASS study (KEMA 2014) does provide information on device saturation, it does not include long-term metering data on usage and power draw.
85
and lessons learned prior to considering a similar effort in California. NEEA’s study began in March 2012, and
therefore implementing a similar study in 2016-17 could provide valuable information on how energy consumption
within the home has changed over time.48
Recommendation #7: Encourage policies to promote the measurement of power data for CE devices
through minimum efficiency standards and labeling.
Most MEL products do not have any labeling or energy consumption measurement requirements, and it is
therefore difficult to quantify the energy consumption of small MELs entering the market. This lack of energy
information is key barrier in successfully achieving market transformation of MELs. We recommend that the IOUs
continue to advocate for CE labeling policies and minimum efficiency standards for MELs, particularly consumer
electronics products.
48
This primarily relates to CE devices which are expected to have minimal geographic variation in power or usage.
86
8. Works Cited
[ACEEE] American Council for an Energy Efficient Economy. 2013. Prepared by S. Kwatra, J. Amann, H. Sachs. Miscellaneous
Energy Loads in Buildings. http://www.aceee.org/research-report/a133
[ADL] Arthur D. Little, Inc. 1998. Electricity Consumption by Small End Uses in Residential Buildings. Final report to Office of
Building Equipment, U.S. Department of Energy. August.
http://www.descoenergy.com/pdf/pdfnew/Residential%20Energy%20Uses%20of%20Devices.pdf
Amann, J. 2004. Set-top Boxes: Opportunities and Issues in Setting Efficiency Standards. ACEEE Report Number A041, 2004.
APP. 2010. Alignment of National Standby Power Approaches Project: 2009/2010 Data Outcomes. Prepared for Department of
Climate Change and Energy Efficiency. June.
Appliance Magazine. The Life Expectancy/Replacement Picture. September 2005.
Appliance Magazine. 2005. The Saturation Picture. September 2005.
Baliga, J.; R. Ayre; K, Hinton; W. Sorin & R. Tucker. 2009. Energy Consumption in Optical IP Networks. IEEE Journal of Lightwave
Technology. Vol 27(13): July 2009, pp 2391-2403.
Bensch, I.; S. Pigg; K. Koski; R. Belshe. 2010. Electricity Savings Opportunities for Home Electronics and Other Plug-In Devices in
Minnesota Homes. Energy Center of Wisconsin. May 2010. http://www.ecw.org/resource_detail.php?resultid=430
Bolla, R.., Buschi, K. Christensen, F. Cucchietti, F. Davoli, and S. Singh. 2010. "The potential impact of green technologies in
next-generation wireline networks - is there room for energy saving optimization?" IEEE Communication Magazine
(COMMAG), Special Topic in "Green Communications." Nov.
[CA IOUs & NRDC] California Investor-Owned Utilities (Southern California Edison, Pacific Gas and Electric Company, San Diego
Gas and Electric Company, Southern California Gas Company) and Natural Resources Defense Council. 2013. Codes
and Standards Enhancement (CASE) Initiative: Computers. Prepared by Energy Solutions, Ecova and NRDC. August 6,
2013.
[CA IOUs & NRDC] California Investor Owned Utilities (Southern California Edison, Pacific Gas and Electric Company, San Diego
Gas and Electric Company, Southern California Gas Company) and Natural Resources Defense Council. 2013a. “Game
Consoles: Response to California Energy Commission 2013 Pre-Rulemaking Appliance Efficiency Invitation to Submit
Proposals” Docket Number 12-AAER-2A; Consumer Electronics.
[CA IOUs] California Investor-Owned Utilities (Southern California Edison, Pacific Gas and Electric Company, San Diego Gas and
Electric Company, Southern California Gas Company). 2013a. Codes and Standards Enhancement (CASE) Initiative:
Computers. Prepared by Energy Solutions and Ecova. August 6, 2013.
[CA IOUs] California Investor Owned Utilities (Southern California Edison, Pacific Gas and Electric Company, San Diego Gas and
Electric Company, Southern California Gas Company). 2013b. “Game Consoles: Response to California Energy
Commission 2013 Pre-Rulemaking Appliance Efficiency Invitation to Participate.” Docket Number 12-AAER-2A;
Consumer Electronics.
87
[CA IOUs] California Investor Owned Utilities (Southern California Edison, Pacific Gas and Electric Company, San Diego Gas and
Electric Company, Southern California Gas Company). 2013c. “Set Top Boxes: Response to California Energy
Commission 2013 Pre-Rulemaking Appliance Efficiency Invitation to Participate.” Docket Number 12-AAER-2A;
Consumer Electronics.
[CA IOUs] California Investor Owned Utilities (Southern California Edison, Pacific Gas and Electric Company, San Diego Gas and
Electric Company, Southern California Gas Company). 2013d. “Monitors: Response to California Energy Commission
2013 Pre-Rulemaking Appliance Efficiency Invitation to Participate.” Docket Number 12-AAER-2A; Consumer
Electronics.
[CA IOUs] California Investor Owned Utilities (Southern California Edison, Pacific Gas and Electric Company, San Diego Gas and
Electric Company, Southern California Gas Company). 2013e. “Small Network Equipment: Response to California
Energy Commission 2013 Pre-Rulemaking Appliance Efficiency Invitation to Participate.” Docket Number 12-AAER-2A;
Consumer Electronics.
[CEA] Consumer Electronics Association. 2005. CE Ownership and Market Potential. May 2005
[CEA] Consumer Electronics Association. 2005. U.S. Consumer Electronics Sales and Forecasts. January 2005.
[CEA] Consumer Electronics Association. 2006. U.S. Consumer Electronics Sales & Forecasts 2002-2007. July.
[CEA] Consumer Electronics Association. 2009. 11th Annual Household CE ownership and market potential." CEA Market
Research Report. Consumer Electronics Association. May
[CEA] Consumer Electronics Association. 2010. U.S. consumer electronics sales & forecasts 2005-2010. Consumer Electronics
Association. January.
[CEA] Consumer Electronics Association. 2010. Consumer Electronics Association Gaming and Energy Study. Sept.
[CEA] Consumer Electronics Association. 2010. U.S. consumer electronics sales & forecasts 2006-2011. Consumer Electronics
Association. July
[CEA] Consumer Electronics Association. 2010. 12th Annual Household CE Ownership and Market Potential. CEA Market
Research Report. May
[CEC] California Energy Commission. 2010. 2009 California Residential Appliance Saturation Study. Prepared by KEMA.
http://www.energy.ca.gov/appliances/rass/
[CEC] California Energy Commission. 2008. Home Energy System Technical Manual.
http://www.energy.ca.gov/2008publications/CEC-400-2008-012/CEC-400-2008-012-CMF.PDF
[CEC] California Energy Commission. 2011. Office Plug Load Field Monitoring Report. Pier Final Project Report. Prepared for
California Energy Commission Public Interest Research Program. Prepared by Ecos.
Chetty, M.; A. Bernheim Brush; B. Meyers; and P. Johns. 2009. “It’s Not Easy Being Green: Understanding Home Computer
Power Management.” Paper presented at CHI 2009 Conference in Boston, MA, 4-9 April.
http://research.microsoft.com/pubs/79362/chihomepowermanagementchetty.pdf
Cheung, Hoi Ying., Alan Meier, and Richard Brown. 2011. Energy savings assessment for digital-to-analog converter boxes.
Lawrence Berkeley National Laboratory. Prepared for U.S. Department of Energy. March
88
[CPMC] Central Maine Power Company. 2007. The Energy Guide
CNET. 2010. Is your Blu-ray player's 'Quick Start' mode an energy hog? April 2010. By Matthew Moskovciak.
http://news.cnet.com/8301-17938_105-20002809-1.html
CTIA - The Wireless Association. 2006. Wireless Quick Facts. September.
Da Silva, D.; P. Riviere; Y. Cho; and J. Adnot. 2010. Standby and Off-mode Energy Losses in New Appliances Measured in Shops.
Supported Centre for Energy and Processes.. http://www.selina-
project.eu/files/Measurements%20of%20standby%20energy%20losses%20in%20new%20equipment.pdf
[DOE]. Department of Energy. 2009. Energy Savings Potential and RD&D Opportunity for Commercial Building Appliances. Final
Report. Prepared by Navigant Consulting. Submitted to U.S. Department of Energy Efficiency and Renewable Energy
Building Technologies Program. December.
[DOE] Department of Energy. 2012. Television Usage Analysis: Energy Efficiency Program for Consumer Products. March 2012.
http://www1.eere.energy.gov/buildings/appliance_standards/pdfs/tv_tpnopr_usageanalysis.pdf
[DOE] Department of Energy. 2013. Final Rule: Energy Conservation Standards for Standby Mode and Off Mode Microwave
Ovens. June 2013. http://www1.eere.energy.gov/buildings/appliance_standards/rulemaking.aspx/ruleid/37
[DOE] U.S. Department of Energy. 2013a. Notice of Data Availability, Energy Conservation Standards for Set-Top Boxes,
Docket: EERE–2010–BT–NOA-0067.
http://www1.eere.energy.gov/buildings/appliance_standards/rulemaking.aspx/ruleid/33.
Dong, L.; G. Block; and S. Mandel; International Journal of Behavioral Nutrition and Physical Activity. 2004. Activities
Contributing to Total Energy Expenditure in the United States: Results from the NHAPS Study.
http://www.ijbnpa.org/content/1/1/4
[EIA] Energy Information Administration. 1999. 1997 Residential Energy Consumption Survey. Washington, D.C.
[EIA] Energy Information Administration. 2002. "2001 RECS TVs Per Household".
http://www.eia.doe.gov/emeu/recs/recs2001_hc/hc5-4a_housingunits2001.html
[EIA] Energy Information Administration. 2006. Annual Energy Outlook 2006 with Projections to 2030. Report # DOE/EIA-
0383(2006)
[EIA] Energy Information Administration. 2009. Residential Energy Consumption Survey. Washington, D.C.
[EIA] Energy Information Administration. Analysis and Representation of Miscellaneous Electric Loads in NEMS. Prepared by
Navigant and SAIC. December 2013.
ENERGY STAR. 2007. Data-set used to Determine Draft 2 Version 3.0 Specification Levels".
http://www.energystar.gov/products/specs/telephony_specification_version_3_0_pd
EPA. 2005. ENERGY STAR Computer Specification Data, Spreadsheet "Computer Spec Data 12_28_05.xls December 28.
EPA. 2005a. ENERGY STAR Monitors Product List. November 29.
EPA. 2006. ENERGY STAR Program Requirements for Consumer Audio and DVD products.
http://www.energystar.gov/ia/partners/product_specs/eligibility/audio_dvd_elig.pdf
89
EPA. 2009. Final Computer Specification, Version 5.0, Final Data Set
EPA. 2009a. Draft 2 Version 2.0 Audio/Video DVD/DB Data Analysis.
http://www.energystar.gov/ia/partners/prod_development/revisions/downloads/audio_video/D2_V2.0_DVD-
BD_Data_Analysis.pdf
EPA. 2010. ENERGY STAR Computer - Desktops & Integrated Computers Voltage 115 List - Current as of February 16, 2010.
Feb.
EPA. 2010a. ENERGY STAR set top box data analysis. Environmental Protection Agency. Mar.
http://www.energystar.gov/ia/partners/prod_development/revisions/downloads/settop_boxes/D1_V3_Data_Analysi
s.xls.
EPA. 2010b. ENERGY STAR Computer - Notebooks 115 List - Current as of March, 2010. Mar.
EPA. 2011. ENERGY STAR® Version 2.0 Set-top Boxes & Cable Boxes: August 2011 Qualified Product List.
http://www.energystar.gov/index.cfm?fuseaction=products_for_partners.showSetTopBoxes.
EPA 2012. ENERGY STAR Program Requirements. Product Specification for Computers. Draft 3 Test Method. Rev. Nov 2012.
http://energystar.gov/products/specs/node/143.
EPA. 2013. ENERGY STAR® Small Network Equipment, Draft 3 Dataset.
https://www.energystar.gov/products/specs/sites/products/files/Copy%20of%20ES_SNE_Version1%200_Draft%203_
Dataset.xlsx.
EPA. 2013a. ENERGY STAR® Version 3.0 Set-top Boxes & Cable Boxes: April 2013 Qualified Product List.
http://downloads.energystar.gov/bi/qplist/Set_Top_Boxes_Product_List.xls.
EPA. 2013b. ENERGY STAR Program Requirements. Product Specification for Computers. Version 6.0 Draft 3.
http://energystar.gov/products/specs/node/143.
[EPRI] Electric Power Research Institute. 2013. "Non-Intrusive Load Monitoring". Emerging Technologies Showcase Webinar.
August 14, 2013. http://e3tnw.org/Documents/NILMs%20Showcase%20Aug2013.pdf
[FCC] Federal Communications Commission. 2009 “High-Speed Services for Internet Access: Status as of June 30, 2008”.
Industry Analysis and Technology Division, Wireline Competition Bureau, Federal Communications Commission. July
2009.
Florida Solar Energy Center. 2011. Updated Miscellaneous Electricity Loads and Appliance Energy Usage Profiles for Use in
Home Energy Ratings, the Building America Benchmark Procedures and Related Calculations. Submitted to U.S.
Department of Energy. Authored by Danny Parker, Philip Fairey, Florida Solar Energy Center, and Robert Hendron,
NREL. June.
Foster Porter, S.; L. Moorefield; P. May-Ostendorp. 2006. Final Field Research Report. Prepared for California Energy
Commission under PIER Contract # 500-04-030. http://www.energy.ca.gov/2011publications/CEC-500-2011-010/CEC-
500-2011-010.pdf
Fraunhofer Institute for Sustainable Energy Systems. 2011. Energy Consumption of Consumer Electronics in U.S. Homes in
2010. Final report to the Consumer Electronics Association (CEA). December 2011. By B. Urban, V. Tiefenbeck and K.
Roth. Energy Consumption of Consumer Electronics in U.S. Homes 2010.
90
http://www.ce.org/CorporateSite/media/Government-Media/Green/Energy-Consumption-of-CE-in-U-S-Homes-in-
2010.pdf
Gorman, B. 2010. Tivo loses 96,000 subscribers in most recent quarter. TV by the numbers. May.
http://tvbythenumbers.zap2it.com/2008/05/28/quarterly-net-new-tivo-subscribers-2001-april-2008/3945/
Greenblatt, J.; S. Pratt, H. Willem, E. Claybaugh, L. Desroches, B. Beraki, M. Nagaraju, S. Price and S. Young. 2013. Final Field
data collection of miscellaneous electrical loads in Northern California: Initial results. Lawrence Berkeley National
Laboratory. February.
Hamm, S.; and J. Greene. 2008. That Computer Is So You. January 2, 2008. Accessed May 2nd, 2013.
http://www.businessweek.com/magazine/content/08_02/b4066000313325.htm
Hittinger, E.; K. Mullins; I. Azevedo. 2012. "Electricity Consumption and Energy Savings Potential of Video Game Consoles in
the United States." Energy Efficiency 1-15. Digital Object Identifier: 10.1007/s12053-012051-012-9152-z. Date of
Publication: March 31, 2012.
Islam, R., et al. 2010. Power Reduction Schemes in Next Generation Intel® ATOM™ Processor Based SoC for Handheld
Applications. Proceedings of the 2010 IEEE Symposium on VLSI Circuits, June.
iSuppli. 2005. Computer Monitor Historical and Projected Sales and Inventory Data. Provided by P. Semenza to TIAX LLC. Oct.
High-Speed Internet Overtakes Dial-Up in Market Share as Bundling Makes Services More Affordable. J.D. Power and
Associates Press Release. September 20.
Kagan Research. 2004. The digital Set-top Box Outlook: Trends and Market Projections," Kagan Research, Analyst Report,
September.
KEMA. 2014. DRAFT Final Report WO21: Residential On-site Study: California Lighting and Appliance Saturation Study (CLASS
2012). Prepared by KEMA for the California Public Utilities Commission, Energy Division. January 31, 2014.
KEMA. 2010. 2009 California Statewide Residential Appliance Saturation Study. Prepared for California Energy Commission.
http://websafe.kemainc.com/RASS2009/Default.aspx
Langille, Gart, 2011. Personal interview regarding Satellite STB market penetration. EchoStar Technologies, LLC. Nov.
Lanzisera, S.; Nordman, B.; and Brown, R. 2010. Data Network Equipment Energy Use and Savings Potential in Buildings.
Proceedings of the ACEEE Summer Study on Energy Efficiency in Buildings, August.
Lanzisera, S.; and Nordman, B. 2010. EEDN Task 2.2.23: Network equipment scoping report. Lawrence Berkeley National
Laboratory. March.
[LBNL] Lawrence Berkeley National Laboratory. 2001. Energy Use of Set-top Boxes and Telephony Products in the U.S. June
2001. By Rosen, Meier, and Zandelin. http://www.herterenergy.com/pdfs/Publications/LBL45305.pdf
[LBNL] Lawrence Berkeley National Laboratory. 2004. Developing and Testing Low Power Mode Measurement Methods.
Prepared for CEC PIER Program. September. By Nordman and McMahon http://www.energy.ca.gov/reports/2004-10-
13_500-04-057.PDF
91
[LBNL] Lawrence Berkeley National Laboratory. 2004. Energy Consumption of Home Information Technology. By B. Nordman
and A. Meier. July.
[LBNL] Lawrence Berkeley National Laboratory. 2011. Max Tech and Beyond: Cumulative (30 year) Technical Energy Savings
Potential Estimates.
[LBNL] Lawrence Berkeley National Laboratory. 2011. Cheung, Hoi Ying, Alan Meier, and Richard Brown. Energy savings
assessment for digital-to-analog converter boxes. Prepared for U.S. Department of Energy.
[LBNL] Lawrence Berkeley National Laboratory. 2012. Survey of Microwave Ovens in U.S. Homes. By Williams, Hung-Chia,
Beraki, Desroches, Young et al. http://eetd.lbl.gov/publications/surveys-of-microwave-ovens-in-us-home
[LBNL] Lawrence Berkeley National Laboratory. 2013. Video game console usage and national energy consumption. Results
from a field-metering study. Authored by L. Desroches, J. Greenblatt, S. Pratt, H. Willem, E. Claybaugh, B. Beraki, M.
Nagaraju, S. Price, S. Young. Sally Donovan, Consultant, Melbourne, Australia. 06-27-13.
http://escholarship.org/uc/item/2k74d6km
[MTP] Market Transformation Programme. 2006. United Kingdom
McAllister and Farrell. 2004. Power in a Portable World: Usage Patterns and Efficiency Opportunities for Consumer Battery
Chargers. 2004 ACEEE Summer Study on EE in Buildings.
http://www.eceee.org/library/conference_proceedings/ACEEE_buildings/2004/Panel_11/p11_10/paper
Media Dynamics. 1998. TV Dimensions '98. New York.
Meier, A., B. Nordman, J. Busch, and C. Payne. 2008. "Low-power mode energy consumption of California home." CEC-500-
2008-035. Lawrence Berkeley National Laboratory. Sept. http://www.energy.ca.gov/2008publications/CEC-500-2008-
035/CEC-500-2008-035.PDF
Microsoft. 2008. Microsoft Power Transition Report; Microsoft Windows.
[NEEA] Northwest Energy Efficiency Alliance. 2014. Residential Building Stock Assessment: Metering Study. Report #E14-283.
Prepared by Ecotope; Ben Larson, Lucinda Gilman, Robert Davis, Michael Logsdon, Jeffrey Uslan, Ben Hannas, David
Baylon, Poppy Storm, Virginia Mugford, and Nick Kvaltine. http://neea.org/docs/default-source/reports/residential-
building-stock-assessment--metering-study.pdf?sfvrsn=6
[NEEA] Northwest Energy Efficiency Alliance. 2013. Residential Building Stock Assessment Multi-Family Characteristics and
Energy Use. Report #13-263. Prepared by Ecotope; David Baylon, Poppy Storm, Benjamin Hannas, Kevin Geraghy,
Virginia Mugford. http://neea.org/docs/default-source/reports/residential-building-stock-assessment--multi-family-
characteristics-and-energy-use.pdf?sfvrsn=4
[NEMS] National Energy Modeling System developed by the EIA. http://www.eia.gov/oiaf/aeo/overview/
Nielsen. 1998. Report on Television. New York.
Nielsen. 2007. The State of the Console: Video Game Console Usage, Fourth Quarter 2006. Nielsen Wireless and Interactive
Services. http://dataforbreakfast.com/wpcontent/uploads/2007/08/nielsen_report_state_console_03507.pdf
Nielsen. 2009. How DVRs are changing the television landscape. Apr.
http://tvbythenumbers.zap2it.com/2008/05/28/quarterly-net-new-tivo-subscribers-2001-april-2008/3945/
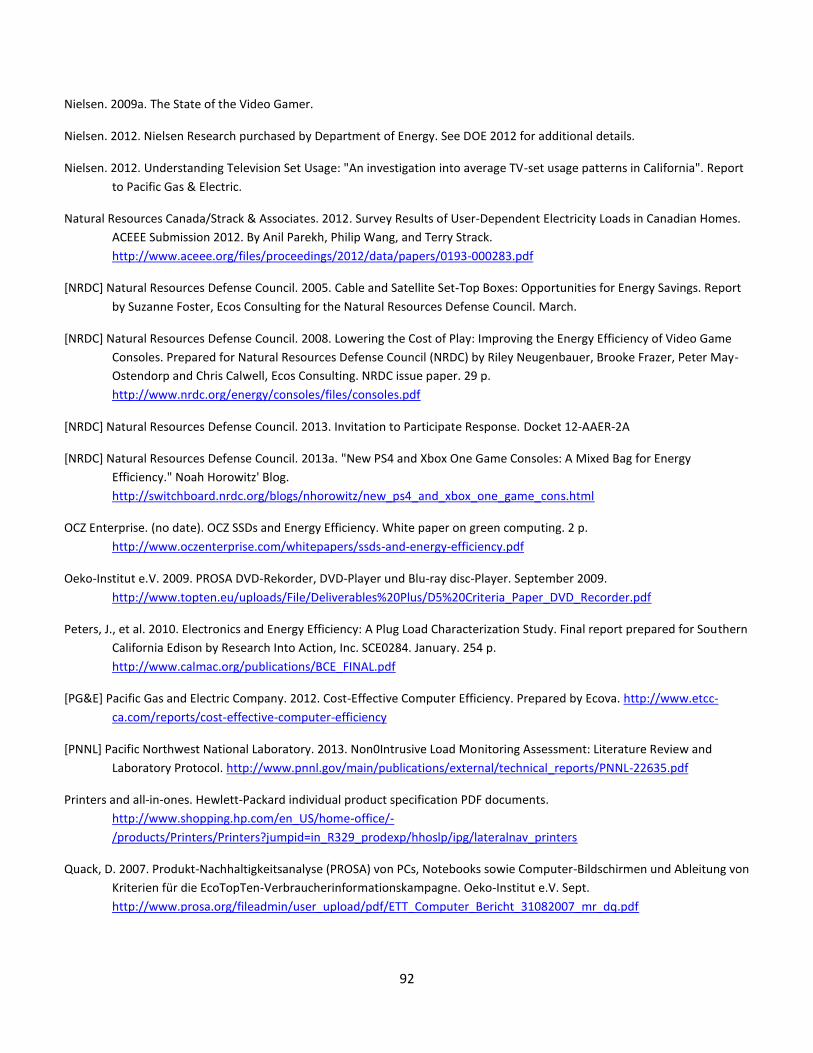
92
Nielsen. 2009a. The State of the Video Gamer.
Nielsen. 2012. Nielsen Research purchased by Department of Energy. See DOE 2012 for additional details.
Nielsen. 2012. Understanding Television Set Usage: "An investigation into average TV-set usage patterns in California". Report
to Pacific Gas & Electric.
Natural Resources Canada/Strack & Associates. 2012. Survey Results of User-Dependent Electricity Loads in Canadian Homes.
ACEEE Submission 2012. By Anil Parekh, Philip Wang, and Terry Strack.
http://www.aceee.org/files/proceedings/2012/data/papers/0193-000283.pdf
[NRDC] Natural Resources Defense Council. 2005. Cable and Satellite Set-Top Boxes: Opportunities for Energy Savings. Report
by Suzanne Foster, Ecos Consulting for the Natural Resources Defense Council. March.
[NRDC] Natural Resources Defense Council. 2008. Lowering the Cost of Play: Improving the Energy Efficiency of Video Game
Consoles. Prepared for Natural Resources Defense Council (NRDC) by Riley Neugenbauer, Brooke Frazer, Peter May-
Ostendorp and Chris Calwell, Ecos Consulting. NRDC issue paper. 29 p.
http://www.nrdc.org/energy/consoles/files/consoles.pdf
[NRDC] Natural Resources Defense Council. 2013. Invitation to Participate Response. Docket 12-AAER-2A
[NRDC] Natural Resources Defense Council. 2013a. "New PS4 and Xbox One Game Consoles: A Mixed Bag for Energy
Efficiency." Noah Horowitz' Blog.
http://switchboard.nrdc.org/blogs/nhorowitz/new_ps4_and_xbox_one_game_cons.html
OCZ Enterprise. (no date). OCZ SSDs and Energy Efficiency. White paper on green computing. 2 p.
http://www.oczenterprise.com/whitepapers/ssds-and-energy-efficiency.pdf
Oeko-Institut e.V. 2009. PROSA DVD-Rekorder, DVD-Player und Blu-ray disc-Player. September 2009.
http://www.topten.eu/uploads/File/Deliverables%20Plus/D5%20Criteria_Paper_DVD_Recorder.pdf
Peters, J., et al. 2010. Electronics and Energy Efficiency: A Plug Load Characterization Study. Final report prepared for Southern
California Edison by Research Into Action, Inc. SCE0284. January. 254 p.
http://www.calmac.org/publications/BCE_FINAL.pdf
[PG&E] Pacific Gas and Electric Company. 2012. Cost-Effective Computer Efficiency. Prepared by Ecova. http://www.etcc-
ca.com/reports/cost-effective-computer-efficiency
[PNNL] Pacific Northwest National Laboratory. 2013. Non0Intrusive Load Monitoring Assessment: Literature Review and
Laboratory Protocol. http://www.pnnl.gov/main/publications/external/technical_reports/PNNL-22635.pdf
Printers and all-in-ones. Hewlett-Packard individual product specification PDF documents.
http://www.shopping.hp.com/en_US/home-office/-
/products/Printers/Printers?jumpid=in_R329_prodexp/hhoslp/ipg/lateralnav_printers
Quack, D. 2007. Produkt-Nachhaltigkeitsanalyse (PROSA) von PCs, Notebooks sowie Computer-Bildschirmen und Ableitung von
Kriterien für die EcoTopTen-Verbraucherinformationskampagne. Oeko-Institut e.V. Sept.
http://www.prosa.org/fileadmin/user_upload/pdf/ETT_Computer_Bericht_31082007_mr_dq.pdf
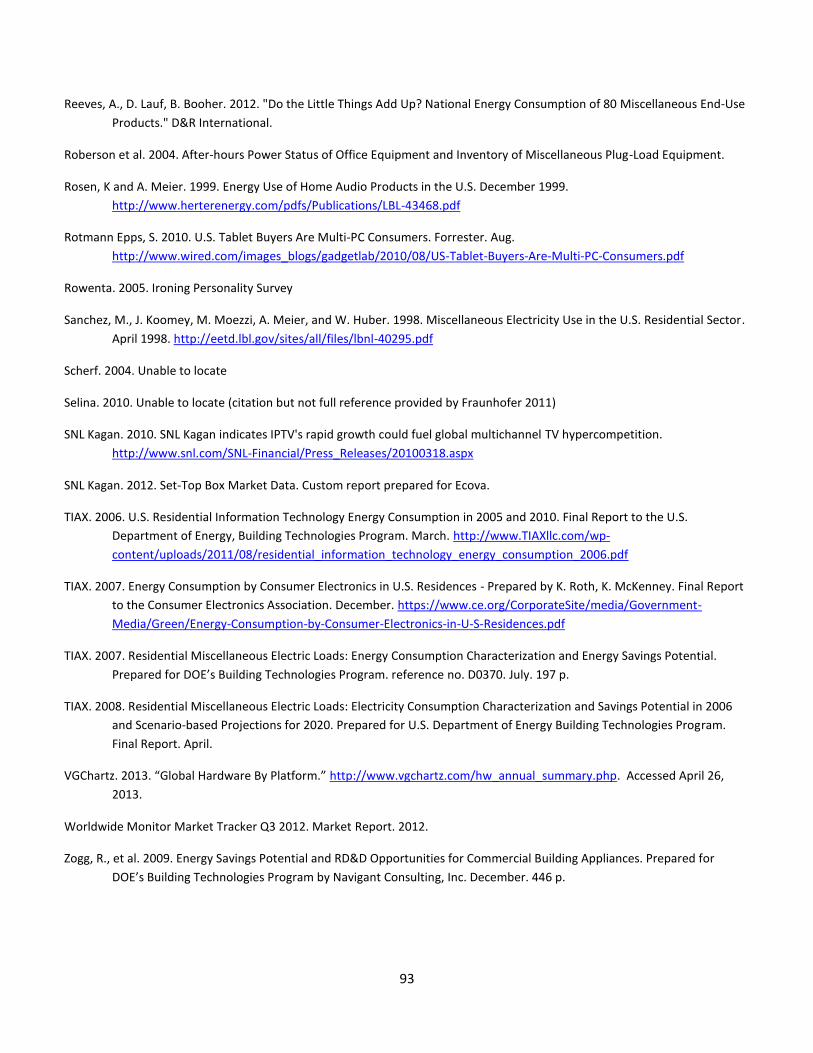
93
Reeves, A., D. Lauf, B. Booher. 2012. "Do the Little Things Add Up? National Energy Consumption of 80 Miscellaneous End-Use
Products." D&R International.
Roberson et al. 2004. After-hours Power Status of Office Equipment and Inventory of Miscellaneous Plug-Load Equipment.
Rosen, K and A. Meier. 1999. Energy Use of Home Audio Products in the U.S. December 1999.
http://www.herterenergy.com/pdfs/Publications/LBL-43468.pdf
Rotmann Epps, S. 2010. U.S. Tablet Buyers Are Multi-PC Consumers. Forrester. Aug.
http://www.wired.com/images_blogs/gadgetlab/2010/08/US-Tablet-Buyers-Are-Multi-PC-Consumers.pdf
Rowenta. 2005. Ironing Personality Survey
Sanchez, M., J. Koomey, M. Moezzi, A. Meier, and W. Huber. 1998. Miscellaneous Electricity Use in the U.S. Residential Sector.
April 1998. http://eetd.lbl.gov/sites/all/files/lbnl-40295.pdf
Scherf. 2004. Unable to locate
Selina. 2010. Unable to locate (citation but not full reference provided by Fraunhofer 2011)
SNL Kagan. 2010. SNL Kagan indicates IPTV's rapid growth could fuel global multichannel TV hypercompetition.
http://www.snl.com/SNL-Financial/Press_Releases/20100318.aspx
SNL Kagan. 2012. Set-Top Box Market Data. Custom report prepared for Ecova.
TIAX. 2006. U.S. Residential Information Technology Energy Consumption in 2005 and 2010. Final Report to the U.S.
Department of Energy, Building Technologies Program. March. http://www.TIAXllc.com/wp-
content/uploads/2011/08/residential_information_technology_energy_consumption_2006.pdf
TIAX. 2007. Energy Consumption by Consumer Electronics in U.S. Residences - Prepared by K. Roth, K. McKenney. Final Report
to the Consumer Electronics Association. December. https://www.ce.org/CorporateSite/media/Government-
Media/Green/Energy-Consumption-by-Consumer-Electronics-in-U-S-Residences.pdf
TIAX. 2007. Residential Miscellaneous Electric Loads: Energy Consumption Characterization and Energy Savings Potential.
Prepared for DOE’s Building Technologies Program. reference no. D0370. July. 197 p.
TIAX. 2008. Residential Miscellaneous Electric Loads: Electricity Consumption Characterization and Savings Potential in 2006
and Scenario-based Projections for 2020. Prepared for U.S. Department of Energy Building Technologies Program.
Final Report. April.
VGChartz. 2013. “Global Hardware By Platform.” http://www.vgchartz.com/hw_annual_summary.php. Accessed April 26,
2013.
Worldwide Monitor Market Tracker Q3 2012. Market Report. 2012.
Zogg, R., et al. 2009. Energy Savings Potential and RD&D Opportunities for Commercial Building Appliances. Prepared for
DOE’s Building Technologies Program by Navigant Consulting, Inc. December. 446 p.
94
9. Appendix A: Supplemental Tables for Tier 1 Devices
Network Equipment
All
Metric Value Source
Installed Base - US (M) 138 EIA 2013
Usage (hrs/yr) Active 8,760 EIA 2013
Power (W) Active 5.6 EIA 2013
UEC (kWh/yr) 51 EIA 2013
AEC (TWh/yr) 7.0 EIA 2013
Overall Confidence Medium -
Access Point Integrated Access Device - Analog DSL
Metric Value Source Metric Value Source
Installed Base - US (M) 8 CA IOUs 2013e Installed 33 CA IOUs 2013e
Usage (hrs/yr) Active 8,760 CA IOUs 2013e Usage (hrs/yr)Active 8,760 CA IOUs 2013e
Power (W) Active 6.1 CA IOUs 2013e Power (W)Active 7.0 CA IOUs 2013e
UEC (kWh/yr) 64 CA IOUs 2013e UEC (kWh/yr) 62 CA IOUs 2013e
AEC (TWh/yr) 0.4 CA IOUs 2013e AEC (TWh/yr) 2.3 CA IOUs 2013e
Overall Confidence Medium - Overall Confidence Medium -
Integrated Access Device - Cable Integrated Access Device - V DSL
Metric Value Source Metric Value Source
Installed Base - US (M) 43 CA IOUs 2013e Installed 6 CA IOUs 2013e
Usage (hrs/yr) Active 8,760 CA IOUs 2013e Usage (hrs/yr)Active 8,760 CA IOUs 2013e
Power (W) Active 6.9 CA IOUs 2013e Power (W)Active 10.1 CA IOUs 2013e
UEC (kWh/yr) 61 CA IOUs 2013e UEC (kWh/yr) 89 CA IOUs 2013e
AEC (TWh/yr) 2.6 CA IOUs 2013e AEC (TWh/yr) 0.6 CA IOUs 2013e
Overall Confidence Medium - Overall Confidence Medium -
Modem Optical Network Termination Device
Metric Value Source Metric Value Source
Installed Base - US (M) 32 CA IOUs 2013e Installed 1 CA IOUs 2013e
Usage (hrs/yr) Active 8,760 CA IOUs 2013e Usage (hrs/yr)Active 8,760 CA IOUs 2013e
Power (W) Active 5.8 Greenblatt et al Power (W)Active 6.7 CA IOUs 2013e
UEC (kWh/yr) 51 Greenblatt et al UEC (kWh/yr) 59 CA IOUs 2013e
AEC (TWh/yr) 4.4 CA IOUs 2013e AEC (TWh/yr) 0.1 CA IOUs 2013e
Overall Confidence Medium - Overall Confidence Medium -
Router Switch
Metric Value Source Metric Value Source
Installed Base - US (M) 92 CA IOUs 2013e Installed 6 CA IOUs 2013e
Usage (hrs/yr) Active 8,760 Greenblatt et al 2013 Usage (hrs/yr)Active 8,760 CA IOUs 2013e
Power (W) Active 6.7 Greenblatt et al 2013 Power (W)Active 5.7 CA IOUs 2013e
UEC (kWh/yr) 59 Greenblatt et al 2013 UEC (kWh/yr) 50 CA IOUs 2013e
AEC (TWh/yr) 5.8 CA IOUs 2013e AEC (TWh/yr) 3.0 CA IOUs 2013e
Overall Confidence Medium - Overall Confidence Medium -
95
Set Top Boxes
Cable, Satellite, IPTV, OTT Cable
Metric Value Source Metric Value Source
Installed Base - US (M) 176 EIA 2013 Installed Base - US (M) 83 CA IOUs 2013c
Usage (hrs/yr) Active 3,173 EIA 2013 Usage (hrs/yr) Active 3,285 CA IOUs 2013c
Multistream 615 EIA 2013 Multistream 1,825 CA IOUs 2013c
Standby / Sleep 3,650 EIA 2013 Standby / Sleep 3,650 CA IOUs 2013c
APD / Off 1,322 EIA 2013 APD / Off - CA IOUs 2013cPower (W) Active 17.1 EIA 2013 Power (W) Active 23.1 Greenblatt et al 2013
Multistream 8.0 EIA 2013 Multistream - -
Standby / Sleep 16.3 EIA 2013 Standby / Sleep 3.3 Greenblatt et al 2013
APD / Off 6.6 EIA 2013 APD / Off - -
UEC (kWh/yr) 127 EIA 2013 UEC (kWh/yr) 183 Greenblatt et al 2013
AEC (TWh/yr) 22.4 EIA 2013 AEC (TWh/yr) 15.3 Calculated
Overall Confidence Medium - Overall Confidence Medium -
Digital Television Adapter Internet Protocol
Metric Value Source Metric Value Source
Installed Base - US (M) 37 CA IOUs 2013c Installed Base - US (M) 32 CA IOUs 2013c
Usage (hrs/yr) Active 3,285 CA IOUs 2013c Usage (hrs/yr) Active 3,285 CA IOUs 2013c
Multistream 1,825 CA IOUs 2013c Multistream 1,825 CA IOUs 2013c
Standby / Sleep 3,650 CA IOUs 2013c Standby / Sleep 3,650 CA IOUs 2013c
APD / Off - - APD / Off - -
Power (W) Active 8 Fraunhofer 2011 Power (W) Active 14.0 Fraunhofer 2011
Multistream - - Multistream - -
Standby / Sleep - - Standby / Sleep - -
APD / Off 6 Fraunhofer 2011 APD / Off 12.1 Fraunhofer 2011
UEC (kWh/yr) 68 Fraunhofer 2011 UEC (kWh/yr) 92 -
AEC (TWh/yr) 2.5 Calculated AEC (TWh/yr) 2.9 -
Overall Confidence Medium - Overall Confidence Medium -
Satellite Stand-alone DVR
Metric Value Source Metric Value Source
Installed Base - US (M) 92 CA IOUs 2013c Installed Base - US (M) 3 EIA 2013
Usage (hrs/yr) Active 3,285 CA IOUs 2013c Usage (hrs/yr) Active 4,198 Fraunhofer 2011
Multistream 1,825 CA IOUs 2013c Multistream - -
Standby / Sleep 3,650 CA IOUs 2013c Standby / Sleep - -
APD / Off - - APD / Off 4,563 Fraunhofer 2011
Power (W) Active 26.5 Greenblatt et al 2013 Power (W) Active 33.0 Fraunhofer 2011
Multistream - - Multistream - -
Standby / Sleep 2.9 Greenblatt et al 2013 Standby / Sleep - -
APD / Off - - APD / Off 30.0 Fraunhofer 2011
UEC (kWh/yr) 176 Greenblatt et al 2013 UEC (kWh/yr) 275 Fraunhofer 2011
AEC (TWh/yr) 16.1 Calculated AEC (TWh/yr) 0.8 Fraunhofer 2011
Overall Confidence Medium - Overall Confidence Medium -
Stand-alone - OTA-DTA Thin Client / Remote
Metric Value Source Metric Value Source
Installed Base - US (M) 33 Fraunhofer 2011 Installed Base - US (M) 2 CA IOUs 2013c
Usage (hrs/yr) Active 3,942 Fraunhofer 2011 Usage (hrs/yr) Active 3,285 CA IOUs 2013c
Multistream - - Multistream 1,825 CA IOUs 2013c
Standby / Sleep - - Standby / Sleep 3,650 CA IOUs 2013c
APD / Off 4,818 Fraunhofer 2011 APD / Off - -
Power (W) Active 6.5 Fraunhofer 2011 Power (W) Active - -
Multistream - - Multistream - -
Standby / Sleep - - Standby / Sleep - -
APD / Off 0.8 Fraunhofer 2011 APD / Off - -
UEC (kWh/yr) 29 Fraunhofer 2011 UEC (kWh/yr) 54 -
AEC (TWh/yr) 1.0 Fraunhofer 2011 AEC (TWh/yr) 0.1 -
Overall Confidence Medium - Overall Confidence Medium -
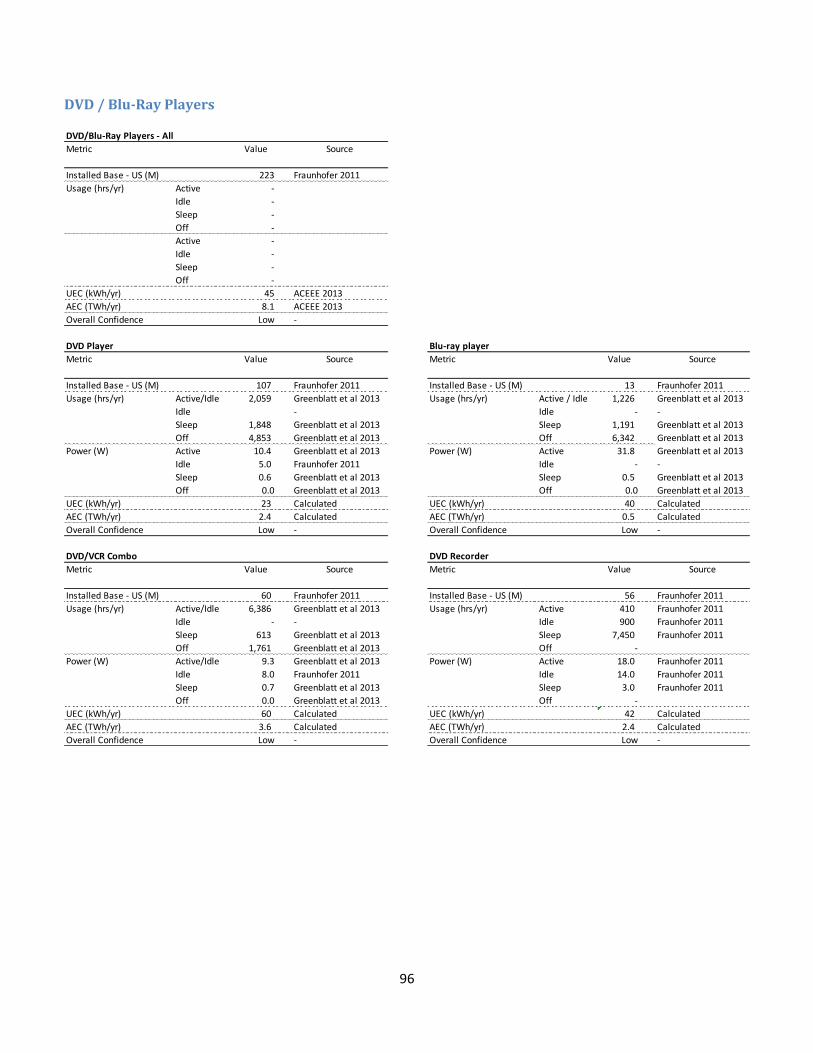
96
DVD / Blu-Ray Players
DVD/Blu-Ray Players - All
Metric Value Source
Installed Base - US (M) 223 Fraunhofer 2011
Usage (hrs/yr) Active -
Idle -
Sleep -
Off -
Active -
Idle -
Sleep -
Off -
UEC (kWh/yr) 45 ACEEE 2013
AEC (TWh/yr) 8.1 ACEEE 2013
Overall Confidence Low -
DVD Player Blu-ray player
Metric Value Source Metric Value Source
Installed Base - US (M) 107 Fraunhofer 2011 Installed Base - US (M) 13 Fraunhofer 2011
Usage (hrs/yr) Active/Idle 2,059 Greenblatt et al 2013 Usage (hrs/yr) Active / Idle 1,226 Greenblatt et al 2013
Idle - Idle - -
Sleep 1,848 Greenblatt et al 2013 Sleep 1,191 Greenblatt et al 2013
Off 4,853 Greenblatt et al 2013 Off 6,342 Greenblatt et al 2013
Power (W) Active 10.4 Greenblatt et al 2013 Power (W) Active 31.8 Greenblatt et al 2013
Idle 5.0 Fraunhofer 2011 Idle - -
Sleep 0.6 Greenblatt et al 2013 Sleep 0.5 Greenblatt et al 2013
Off 0.0 Greenblatt et al 2013 Off 0.0 Greenblatt et al 2013
UEC (kWh/yr) 23 Calculated UEC (kWh/yr) 40 Calculated
AEC (TWh/yr) 2.4 Calculated AEC (TWh/yr) 0.5 Calculated
Overall Confidence Low - Overall Confidence Low -
DVD/VCR Combo DVD Recorder
Metric Value Source Metric Value Source
Installed Base - US (M) 60 Fraunhofer 2011 Installed Base - US (M) 56 Fraunhofer 2011
Usage (hrs/yr) Active/Idle 6,386 Greenblatt et al 2013 Usage (hrs/yr) Active 410 Fraunhofer 2011
Idle - - Idle 900 Fraunhofer 2011
Sleep 613 Greenblatt et al 2013 Sleep 7,450 Fraunhofer 2011
Off 1,761 Greenblatt et al 2013 Off -
Power (W) Active/Idle 9.3 Greenblatt et al 2013 Power (W) Active 18.0 Fraunhofer 2011
Idle 8.0 Fraunhofer 2011 Idle 14.0 Fraunhofer 2011
Sleep 0.7 Greenblatt et al 2013 Sleep 3.0 Fraunhofer 2011
Off 0.0 Greenblatt et al 2013 Off -
UEC (kWh/yr) 60 Calculated UEC (kWh/yr) 42 Calculated
AEC (TWh/yr) 3.6 Calculated AEC (TWh/yr) 2.4 Calculated
Overall Confidence Low - Overall Confidence Low -
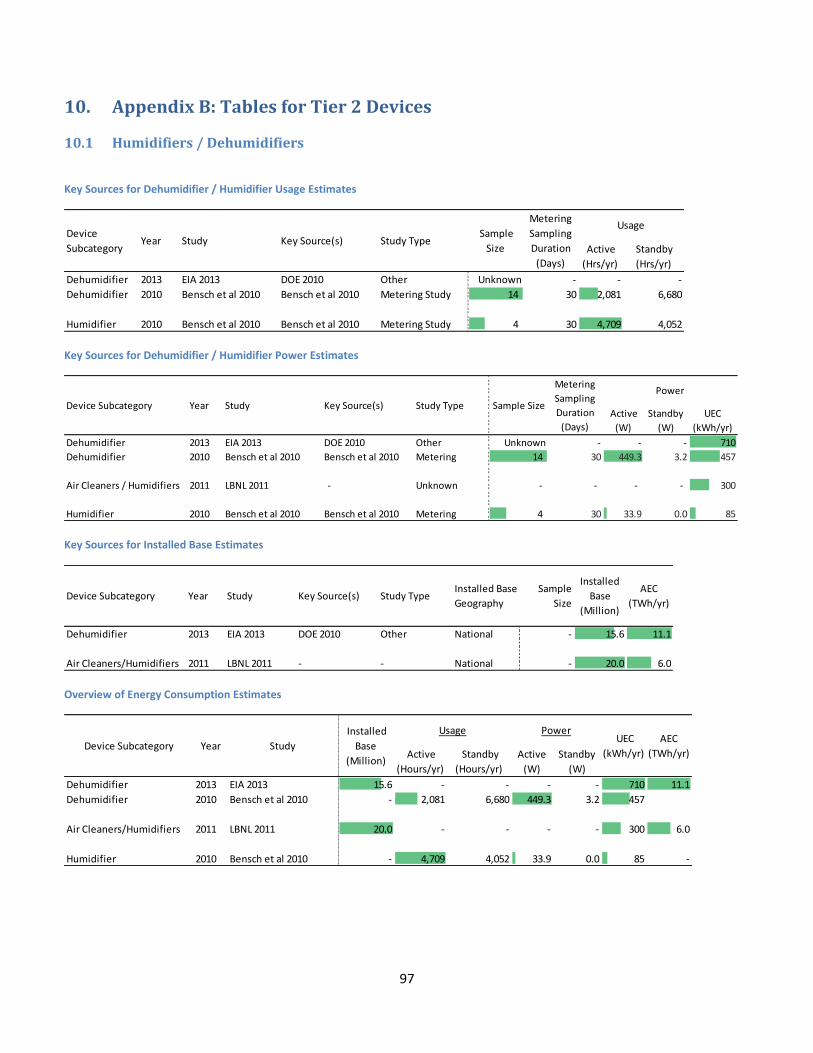
97
10. Appendix B: Tables for Tier 2 Devices
10.1 Humidifiers / Dehumidifiers
Key Sources for Dehumidifier / Humidifier Usage Estimates
Key Sources for Dehumidifier / Humidifier Power Estimates
Key Sources for Installed Base Estimates
Overview of Energy Consumption Estimates
Active
(Hrs/yr)
Standby
(Hrs/yr)
Dehumidifier 2013 EIA 2013 DOE 2010 Other Unknown - - -
Dehumidifier 2010 Bensch et al 2010 Bensch et al 2010 Metering Study 14 30 2,081 6,680
Humidifier 2010 Bensch et al 2010 Bensch et al 2010 Metering Study 4 30 4,709 4,052
Device
SubcategoryYear Study Key Source(s) Study Type
Sample
Size
Metering
Sampling
Duration
(Days)
Usage
Active
(W)
Standby
(W)
UEC
(kWh/yr)
Dehumidifier 2013 EIA 2013 DOE 2010 Other Unknown - - - 710
Dehumidifier 2010 Bensch et al 2010 Bensch et al 2010 Metering 14 30 449.3 3.2 457
Air Cleaners / Humidifiers 2011 LBNL 2011 - Unknown - - - - 300
Humidifier 2010 Bensch et al 2010 Bensch et al 2010 Metering 4 30 33.9 0.0 85
Key Source(s) Study Type Sample Size
Metering
Sampling
Duration
(Days)
Power
StudyDevice Subcategory Year
Dehumidifier 2013 EIA 2013 DOE 2010 Other National - 15.6 11.1
Air Cleaners/Humidifiers 2011 LBNL 2011 - - National - 20.0 6.0
Sample
Size
Installed
Base
(Million)
AEC
(TWh/yr)
Installed Base
GeographyDevice Subcategory Year Study Key Source(s) Study Type
Active
(Hours/yr)
Standby
(Hours/yr)
Active
(W)
Standby
(W)
Dehumidifier 2013 EIA 2013 15.6 - - - - 710 11.1
Dehumidifier 2010 Bensch et al 2010 - 2,081 6,680 449.3 3.2 457
Air Cleaners/Humidifiers 2011 LBNL 2011 20.0 - - - - 300 6.0
Humidifier 2010 Bensch et al 2010 - 4,709 4,052 33.9 0.0 85 -
AEC
(TWh/yr)Device Subcategory Year Study
Installed
Base
(Million)
Usage Power UEC
(kWh/yr)

98
10.2 Clothes Irons
Key Sources for Clothes Iron Usage Estimates
Key Sources for Clothes Iron Power Estimates
Key Sources for Clothes Iron Installed Base Estimates
Overview of Clothes Iron Energy Consumption Estimates
Active
(Hrs/yr) Off
Clothes Iron 2008 TIAX 2008 Rowenta 2005 Lit Review - Unmod. (Survey) 4,000 - 39 8,721
Metering
Sampling
Duration
(Days)
UsageDevice
SubcategoryYear Study Key Source(s) Study Type
Sample
Size
Active
(W) Off (W)
UEC
(kWh/yr)
Clothes Iron 2008 TIAX 2008 TIAX 2008 Survey 13 Inst. 1,350.0 0.0 39
Clothes Iron 2010 Bensch et al 2010 Bensch et al 2010 Metering 1 30 - - 31
PowerDevice
SubcategoryYear Study Key Source(s)
Metering
Sampling
Duration
(Days)
Study Type
(Source
Type)
Sample
Size
Clothes Iron 2008 TIAX 2008 Appliance Magazine 2005a Market Research National Unknown 106.0 5.6
AEC
(TWh/yr)
Installed
Base
(Million)
Device
SubcategoryYear Study Key Source(s)
Sample
Size Study Type
Installed Base
Geography
Active
(Hours/year)
Off
(Hours/year)
Active
(W)Off (W)
Clothes Iron 2008 TIAX 2008 106.0 39 8,721 1350.0 0.0 39.0 5.6
Clothes Iron 2010 Bensch et al 2010 - - - - - 31.0 -
Usage Power UEC
(kWh/yr)
AEC
(TWh/yr)
Installed
Base
(Million)
StudyDevice
SubcategoryYear
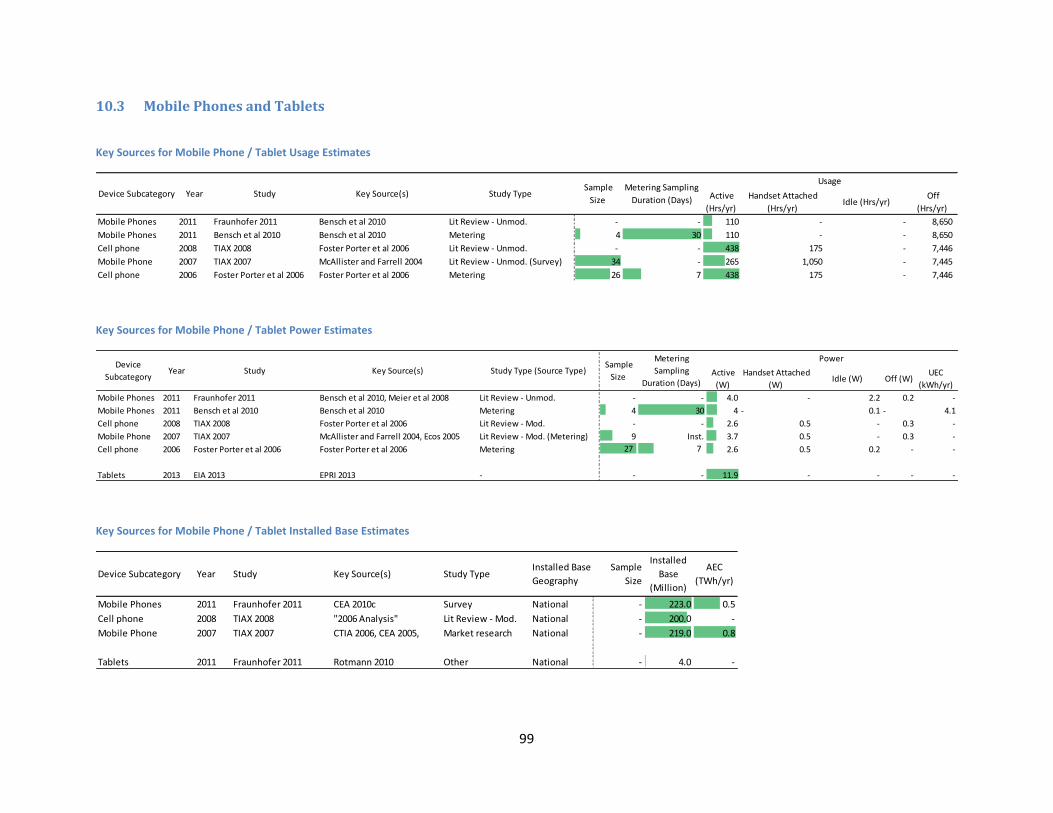
99
10.3 Mobile Phones and Tablets
Key Sources for Mobile Phone / Tablet Usage Estimates
Key Sources for Mobile Phone / Tablet Power Estimates
Key Sources for Mobile Phone / Tablet Installed Base Estimates
Active
(Hrs/yr)
Handset Attached
(Hrs/yr) Idle (Hrs/yr)
Off
(Hrs/yr)
Mobile Phones 2011 Fraunhofer 2011 Bensch et al 2010 Lit Review - Unmod. - - 110 - - 8,650
Mobile Phones 2011 Bensch et al 2010 Bensch et al 2010 Metering 4 30 110 - - 8,650
Cell phone 2008 TIAX 2008 Foster Porter et al 2006 Lit Review - Unmod. - - 438 175 - 7,446
Mobile Phone 2007 TIAX 2007 McAllister and Farrell 2004 Lit Review - Unmod. (Survey) 34 - 265 1,050 - 7,445
Cell phone 2006 Foster Porter et al 2006 Foster Porter et al 2006 Metering 26 7 438 175 - 7,446
Device Subcategory Year Study Key Source(s) Study Type Sample
Size
Metering Sampling
Duration (Days)
Usage
Active
(W)
Handset Attached
(W) Idle (W) Off (W)
UEC
(kWh/yr)
Mobile Phones 2011 Fraunhofer 2011 Bensch et al 2010, Meier et al 2008 Lit Review - Unmod. - - 4.0 - 2.2 0.2 -
Mobile Phones 2011 Bensch et al 2010 Bensch et al 2010 Metering 4 30 4 - 0.1 - 4.1
Cell phone 2008 TIAX 2008 Foster Porter et al 2006 Lit Review - Mod. - - 2.6 0.5 - 0.3 -
Mobile Phone 2007 TIAX 2007 McAllister and Farrell 2004, Ecos 2005 Lit Review - Mod. (Metering) 9 Inst. 3.7 0.5 - 0.3 -
Cell phone 2006 Foster Porter et al 2006 Foster Porter et al 2006 Metering 27 7 2.6 0.5 0.2 - -
Tablets 2013 EIA 2013 EPRI 2013 - - - 11.9 - - - -
StudyDevice
SubcategoryYear Key Source(s) Study Type (Source Type)
Sample
Size
Metering
Sampling
Duration (Days)
Power
Mobile Phones 2011 Fraunhofer 2011 CEA 2010c Survey National - 223.0 0.5
Cell phone 2008 TIAX 2008 "2006 Analysis" Lit Review - Mod. National - 200.0 -
Mobile Phone 2007 TIAX 2007 CTIA 2006, CEA 2005, Market research National - 219.0 0.8
Tablets 2011 Fraunhofer 2011 Rotmann 2010 Other National - 4.0 -
Installed Base
GeographyDevice Subcategory Year Study Key Source(s) Study Type
Sample
Size
Installed
Base
(Million)
AEC
(TWh/yr)
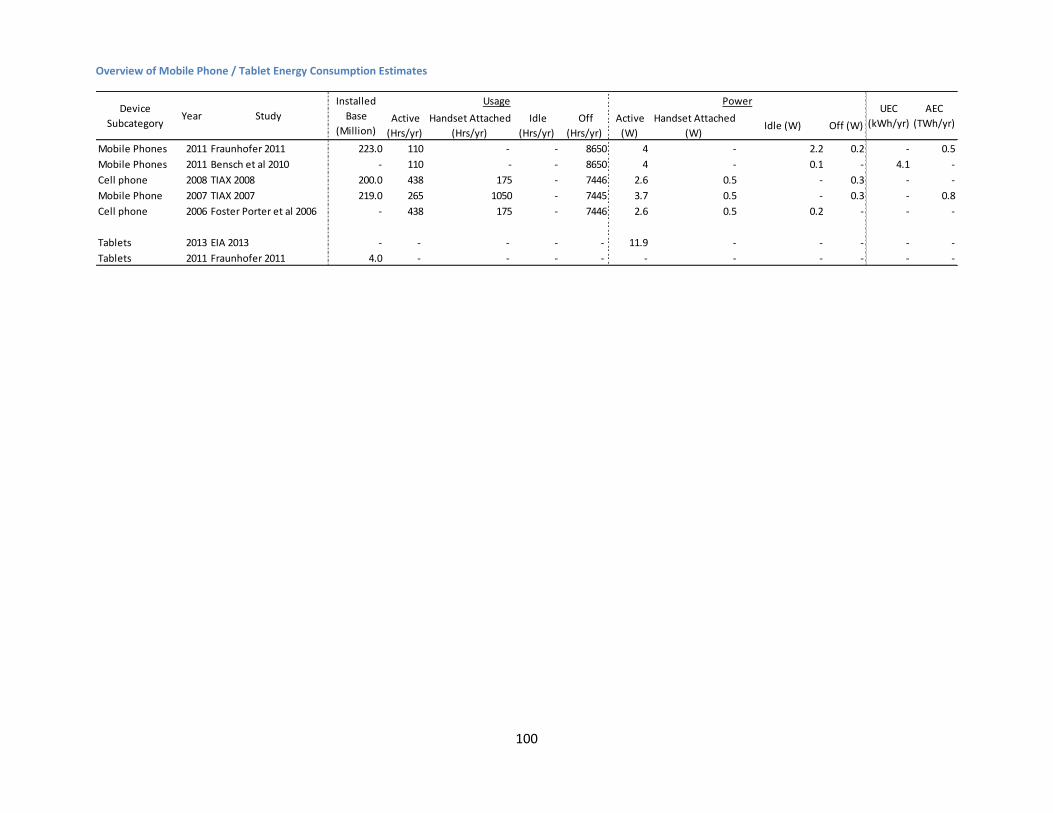
100
Overview of Mobile Phone / Tablet Energy Consumption Estimates
Active
(Hrs/yr)
Handset Attached
(Hrs/yr)
Idle
(Hrs/yr)
Off
(Hrs/yr)
Active
(W)
Handset Attached
(W) Idle (W) Off (W)
Mobile Phones 2011 Fraunhofer 2011 223.0 110 - - 8650 4 - 2.2 0.2 - 0.5
Mobile Phones 2011 Bensch et al 2010 - 110 - - 8650 4 - 0.1 - 4.1 -
Cell phone 2008 TIAX 2008 200.0 438 175 - 7446 2.6 0.5 - 0.3 - -
Mobile Phone 2007 TIAX 2007 219.0 265 1050 - 7445 3.7 0.5 - 0.3 - 0.8
Cell phone 2006 Foster Porter et al 2006 - 438 175 - 7446 2.6 0.5 0.2 - - -
Tablets 2013 EIA 2013 - - - - - 11.9 - - - - -
Tablets 2011 Fraunhofer 2011 4.0 - - - - - - - - - -
AEC
(TWh/yr)
Device
SubcategoryYear Study
Installed
Base
(Million)
Usage PowerUEC
(kWh/yr)
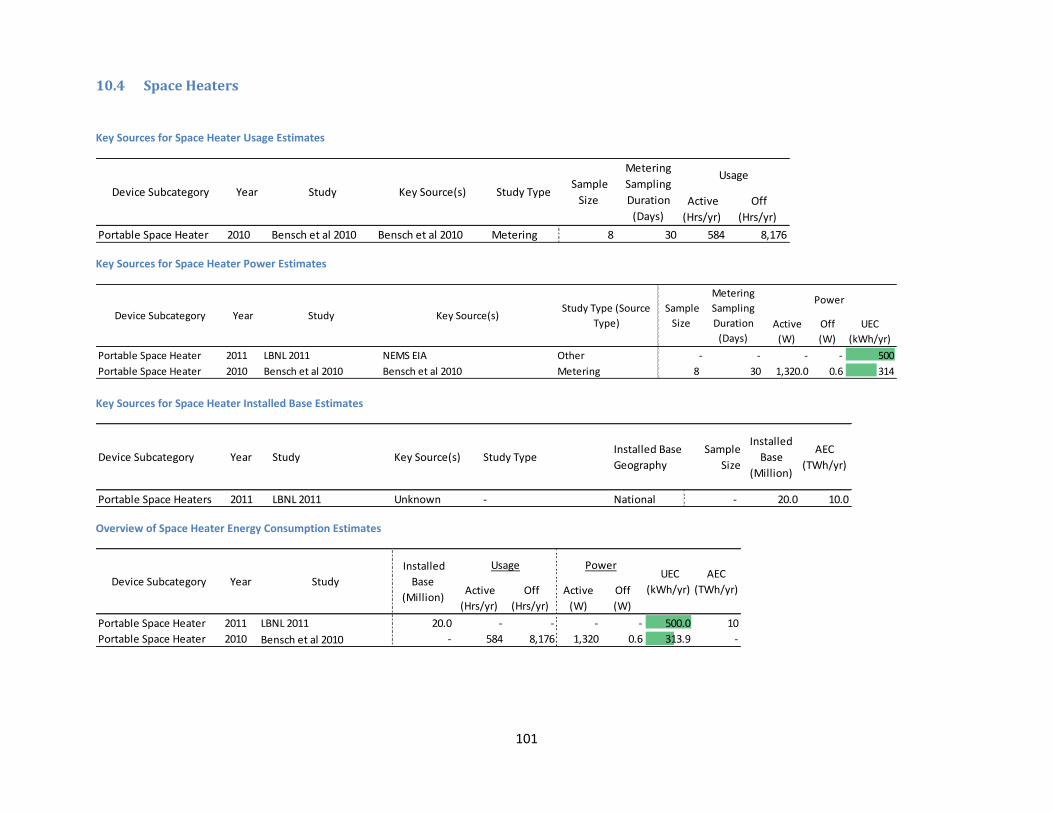
101
10.4 Space Heaters
Key Sources for Space Heater Usage Estimates
Key Sources for Space Heater Power Estimates
Key Sources for Space Heater Installed Base Estimates
Overview of Space Heater Energy Consumption Estimates
Active
(Hrs/yr)
Off
(Hrs/yr)
Portable Space Heater 2010 Bensch et al 2010 Bensch et al 2010 Metering 8 30 584 8,176
Device Subcategory Year Study Key Source(s) Study Type Sample
Size
Metering
Sampling
Duration
(Days)
Usage
Active
(W)
Off
(W)
UEC
(kWh/yr)
Portable Space Heater 2011 LBNL 2011 NEMS EIA Other - - - - 500
Portable Space Heater 2010 Bensch et al 2010 Bensch et al 2010 Metering 8 30 1,320.0 0.6 314
Key Source(s)Study Type (Source
Type)
Sample
Size
Metering
Sampling
Duration
(Days)
Power
StudyDevice Subcategory Year
Portable Space Heaters 2011 LBNL 2011 Unknown - National - 20.0 10.0
Sample
Size
Installed
Base
(Million)
AEC
(TWh/yr)
Installed Base
GeographyDevice Subcategory Year Study Key Source(s) Study Type
Active
(Hrs/yr)
Off
(Hrs/yr)
Active
(W)
Off
(W)
Portable Space Heater 2011 LBNL 2011 20.0 - - - - 500.0 10
Portable Space Heater 2010 Bensch et al 2010 - 584 8,176 1,320 0.6 313.9 -
AEC
(TWh/yr)Device Subcategory Year Study
Installed
Base
(Million)
Usage Power UEC
(kWh/yr)

102
10.5 Vacuum Cleaners Key Sources for Vacuum Cleaner Usage Estimates
Key Sources for Vacuum Cleaner Power Estimates
Key Sources for Vacuum Cleaner Installed Base Estimates
Overview of Vacuum Cleaner Energy Consumption Estimates
Active
(Hrs/yr)
Off
(Hrs/yr)
Portable Vacuum Cleaners 2010 Bensch et al 2010 Bensch et al 2010 Metering 3 30 37 8,724
Portable Vacuum Cleaners 2008 TIAX 2008 MTP 2006, Dong et al 2004 Lit Review - Mod. (Survey) - - 39 8,721
Device Subcategory Year Study Key Source(s) Study Type Sample
Size
Metering
Sampling
Duration
(Days)
Usage
Active
(W) Off (W)
UEC
(kWh/yr)
Portable Vacuum Cleaners 2013 ACEEE 2013 Bensch et al 2010 Lit. Review - Mod. - - - - 55
Portable Vacuum Cleaners 2011 LBNL 2011 TIAX 2007a Survey - - - - 40
Portable Vacuum Cleaners 2010 Bensch et al 2010 Bensch et al 2010 Metering 3 30 542.4 - 55
Portable Vacuum Cleaners 2008 TIAX 2008 TIAX 2008 Survey 64 Inst. 1,080.0 - 42
StudyDevice Subcategory Year Key Source(s)Study Type
(Source Type)
Sample
Size
Metering
Sampling
Duration
(Days)
Power
Portable Vacuum Cleaners 2013 ACEEE 2013 - - National - 113.0 6.2
Portable Vacuum Cleaners 2011 LBNL 2011 - - National - 115.0 4.6
Portable Vacuum Cleaners 2008 TIAX 2008 Appliance Magazine 2005a, 2005b Market Research National - 113.0 4.7
Installed Base
GeographyDevice Subcategory Year Study Key Source(s) Study Type
Sample
Size
Installed
Base
(Million)
AEC
(TWh/yr)
Active
(Hours/year)
Off
(Hours/year)
Active
(W)
Off
(W)
Portable Vacuum Cleaners 2013 ACEEE 2013 113.0 - - - - 55 6.2
Portable Vacuum Cleaners 2011 LBNL 2011 115.0 - - - - 40 4.6
Portable Vacuum Cleaners 2010 Bensch et al 2010 - 37 8,724 524.4 - 55 -
Portable Vacuum Cleaners 2008 TIAX 2008 113.0 39 8,721 1,080.0 - 42 4.7
AEC
(TWh/yr)Device Subcategory Year Study
Installed
Base
(Million)
Usage Power UEC
(kWh/yr)
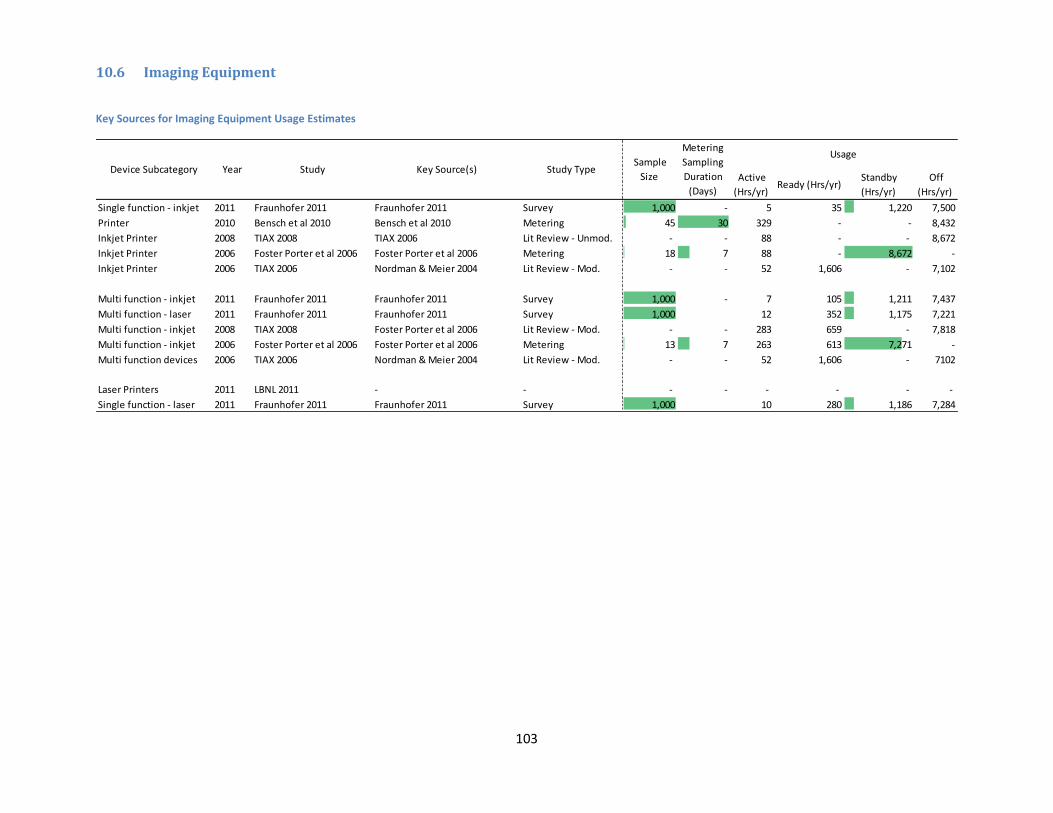
103
10.6 Imaging Equipment
Key Sources for Imaging Equipment Usage Estimates
Active
(Hrs/yr) Ready (Hrs/yr)
Standby
(Hrs/yr)
Off
(Hrs/yr)
Single function - inkjet 2011 Fraunhofer 2011 Fraunhofer 2011 Survey 1,000 - 5 35 1,220 7,500
Printer 2010 Bensch et al 2010 Bensch et al 2010 Metering 45 30 329 - - 8,432
Inkjet Printer 2008 TIAX 2008 TIAX 2006 Lit Review - Unmod. - - 88 - - 8,672
Inkjet Printer 2006 Foster Porter et al 2006 Foster Porter et al 2006 Metering 18 7 88 - 8,672 -
Inkjet Printer 2006 TIAX 2006 Nordman & Meier 2004 Lit Review - Mod. - - 52 1,606 - 7,102
Multi function - inkjet 2011 Fraunhofer 2011 Fraunhofer 2011 Survey 1,000 - 7 105 1,211 7,437
Multi function - laser 2011 Fraunhofer 2011 Fraunhofer 2011 Survey 1,000 12 352 1,175 7,221
Multi function - inkjet 2008 TIAX 2008 Foster Porter et al 2006 Lit Review - Mod. - - 283 659 - 7,818
Multi function - inkjet 2006 Foster Porter et al 2006 Foster Porter et al 2006 Metering 13 7 263 613 7,271 -
Multi function devices 2006 TIAX 2006 Nordman & Meier 2004 Lit Review - Mod. - - 52 1,606 - 7102
Laser Printers 2011 LBNL 2011 - - - - - - - -
Single function - laser 2011 Fraunhofer 2011 Fraunhofer 2011 Survey 1,000 10 280 1,186 7,284
Device Subcategory Year Study Key Source(s) Study Type Sample
Size
Metering
Sampling
Duration
(Days)
Usage
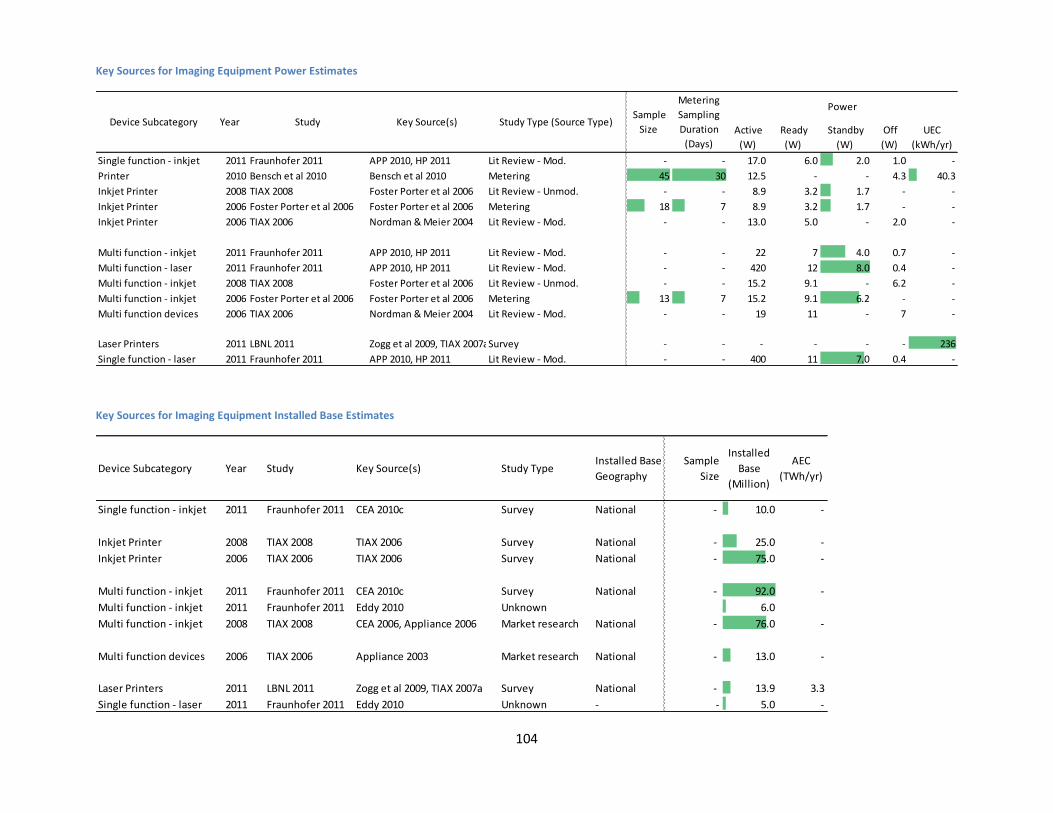
104
Key Sources for Imaging Equipment Power Estimates
Key Sources for Imaging Equipment Installed Base Estimates
Active
(W)
Ready
(W)
Standby
(W)
Off
(W)
UEC
(kWh/yr)
Single function - inkjet 2011 Fraunhofer 2011 APP 2010, HP 2011 Lit Review - Mod. - - 17.0 6.0 2.0 1.0 -
Printer 2010 Bensch et al 2010 Bensch et al 2010 Metering 45 30 12.5 - - 4.3 40.3
Inkjet Printer 2008 TIAX 2008 Foster Porter et al 2006 Lit Review - Unmod. - - 8.9 3.2 1.7 - -
Inkjet Printer 2006 Foster Porter et al 2006 Foster Porter et al 2006 Metering 18 7 8.9 3.2 1.7 - -
Inkjet Printer 2006 TIAX 2006 Nordman & Meier 2004 Lit Review - Mod. - - 13.0 5.0 - 2.0 -
Multi function - inkjet 2011 Fraunhofer 2011 APP 2010, HP 2011 Lit Review - Mod. - - 22 7 4.0 0.7 -
Multi function - laser 2011 Fraunhofer 2011 APP 2010, HP 2011 Lit Review - Mod. - - 420 12 8.0 0.4 -
Multi function - inkjet 2008 TIAX 2008 Foster Porter et al 2006 Lit Review - Unmod. - - 15.2 9.1 - 6.2 -
Multi function - inkjet 2006 Foster Porter et al 2006 Foster Porter et al 2006 Metering 13 7 15.2 9.1 6.2 - -
Multi function devices 2006 TIAX 2006 Nordman & Meier 2004 Lit Review - Mod. - - 19 11 - 7 -
Laser Printers 2011 LBNL 2011 Zogg et al 2009, TIAX 2007aSurvey - - - - - - 236
Single function - laser 2011 Fraunhofer 2011 APP 2010, HP 2011 Lit Review - Mod. - - 400 11 7.0 0.4 -
StudyDevice Subcategory Year Key Source(s) Study Type (Source Type) Sample
Size
Metering
Sampling
Duration
(Days)
Power
Single function - inkjet 2011 Fraunhofer 2011 CEA 2010c Survey National - 10.0 -
Inkjet Printer 2008 TIAX 2008 TIAX 2006 Survey National - 25.0 -
Inkjet Printer 2006 TIAX 2006 TIAX 2006 Survey National - 75.0 -
Multi function - inkjet 2011 Fraunhofer 2011 CEA 2010c Survey National - 92.0 -
Multi function - inkjet 2011 Fraunhofer 2011 Eddy 2010 Unknown 6.0
Multi function - inkjet 2008 TIAX 2008 CEA 2006, Appliance 2006 Market research National - 76.0 -
Multi function devices 2006 TIAX 2006 Appliance 2003 Market research National - 13.0 -
Laser Printers 2011 LBNL 2011 Zogg et al 2009, TIAX 2007a Survey National - 13.9 3.3
Single function - laser 2011 Fraunhofer 2011 Eddy 2010 Unknown - - 5.0 -
Installed Base
GeographyDevice Subcategory Year Study Key Source(s) Study Type
Sample
Size
Installed
Base
(Million)
AEC
(TWh/yr)
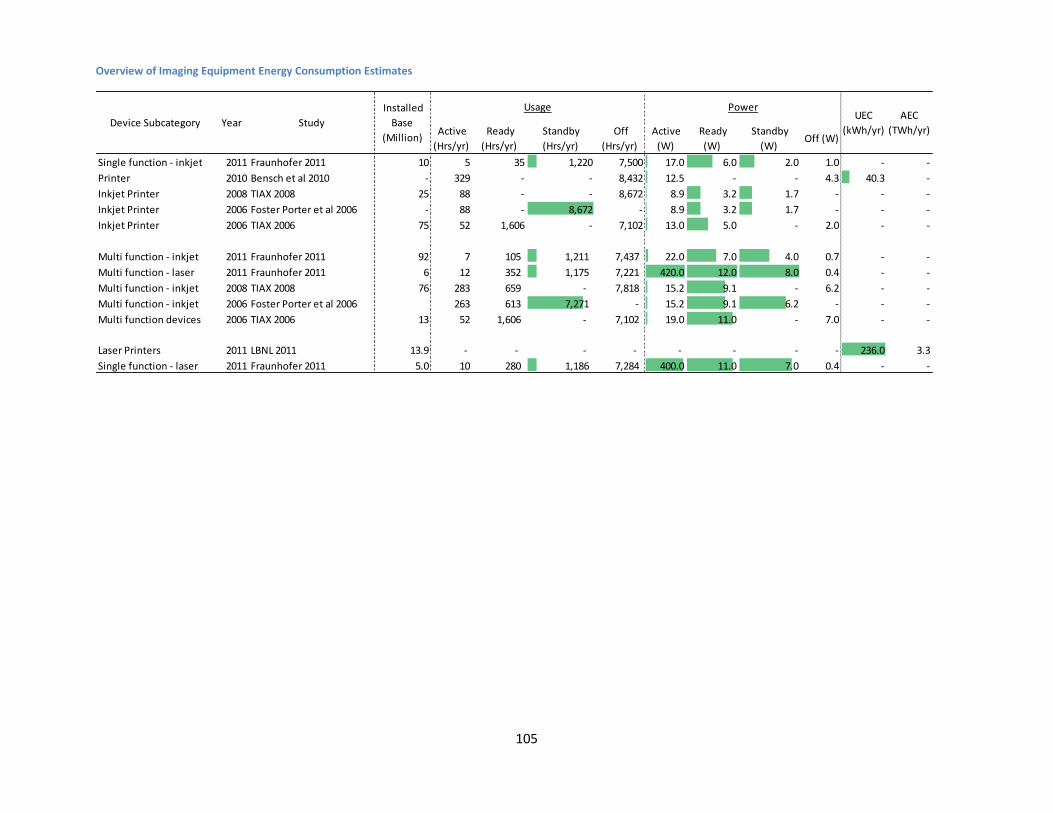
105
Overview of Imaging Equipment Energy Consumption Estimates
Active
(Hrs/yr)
Ready
(Hrs/yr)
Standby
(Hrs/yr)
Off
(Hrs/yr)
Active
(W)
Ready
(W)
Standby
(W) Off (W)
Single function - inkjet 2011 Fraunhofer 2011 10 5 35 1,220 7,500 17.0 6.0 2.0 1.0 - -
Printer 2010 Bensch et al 2010 - 329 - - 8,432 12.5 - - 4.3 40.3 -
Inkjet Printer 2008 TIAX 2008 25 88 - - 8,672 8.9 3.2 1.7 - - -
Inkjet Printer 2006 Foster Porter et al 2006 - 88 - 8,672 - 8.9 3.2 1.7 - - -
Inkjet Printer 2006 TIAX 2006 75 52 1,606 - 7,102 13.0 5.0 - 2.0 - -
Multi function - inkjet 2011 Fraunhofer 2011 92 7 105 1,211 7,437 22.0 7.0 4.0 0.7 - -
Multi function - laser 2011 Fraunhofer 2011 6 12 352 1,175 7,221 420.0 12.0 8.0 0.4 - -
Multi function - inkjet 2008 TIAX 2008 76 283 659 - 7,818 15.2 9.1 - 6.2 - -
Multi function - inkjet 2006 Foster Porter et al 2006 263 613 7,271 - 15.2 9.1 6.2 - - -
Multi function devices 2006 TIAX 2006 13 52 1,606 - 7,102 19.0 11.0 - 7.0 - -
Laser Printers 2011 LBNL 2011 13.9 - - - - - - - - 236.0 3.3
Single function - laser 2011 Fraunhofer 2011 5.0 10 280 1,186 7,284 400.0 11.0 7.0 0.4 - -
AEC
(TWh/yr)Device Subcategory Year Study
Installed
Base
(Million)
Usage PowerUEC
(kWh/yr)
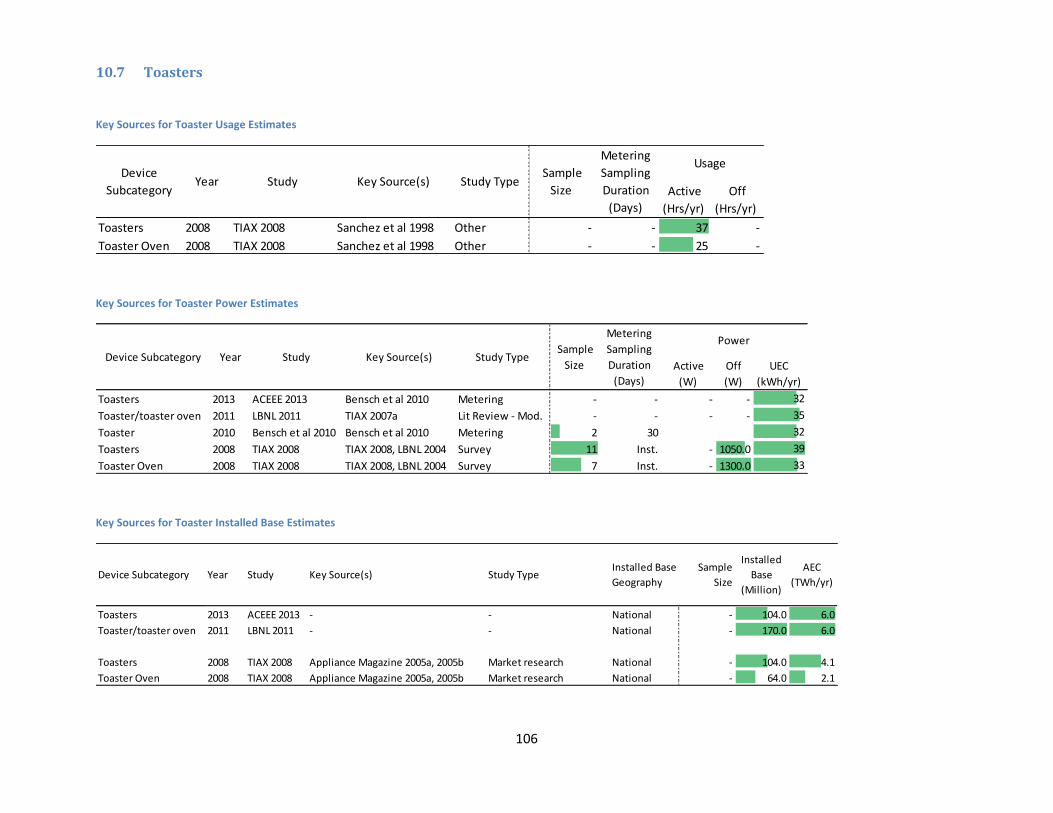
106
10.7 Toasters
Key Sources for Toaster Usage Estimates
Key Sources for Toaster Power Estimates
Key Sources for Toaster Installed Base Estimates
Active
(Hrs/yr)
Off
(Hrs/yr)
Toasters 2008 TIAX 2008 Sanchez et al 1998 Other - - 37 -
Toaster Oven 2008 TIAX 2008 Sanchez et al 1998 Other - - 25 -
Device
SubcategoryYear Study Key Source(s) Study Type
Sample
Size
Metering
Sampling
Duration
(Days)
Usage
Active
(W)
Off
(W)
UEC
(kWh/yr)
Toasters 2013 ACEEE 2013 Bensch et al 2010 Metering - - - - 32
Toaster/toaster oven 2011 LBNL 2011 TIAX 2007a Lit Review - Mod. - - - - 35
Toaster 2010 Bensch et al 2010 Bensch et al 2010 Metering 2 30 32
Toasters 2008 TIAX 2008 TIAX 2008, LBNL 2004 Survey 11 Inst. - 1050.0 39
Toaster Oven 2008 TIAX 2008 TIAX 2008, LBNL 2004 Survey 7 Inst. - 1300.0 33
StudyDevice Subcategory Year Key Source(s) Study Type Sample
Size
Metering
Sampling
Duration
(Days)
Power
Toasters 2013 ACEEE 2013 - - National - 104.0 6.0
Toaster/toaster oven 2011 LBNL 2011 - - National - 170.0 6.0
Toasters 2008 TIAX 2008 Appliance Magazine 2005a, 2005b Market research National - 104.0 4.1
Toaster Oven 2008 TIAX 2008 Appliance Magazine 2005a, 2005b Market research National - 64.0 2.1
Installed Base
GeographyDevice Subcategory Year Study Key Source(s) Study Type
Sample
Size
Installed
Base
(Million)
AEC
(TWh/yr)
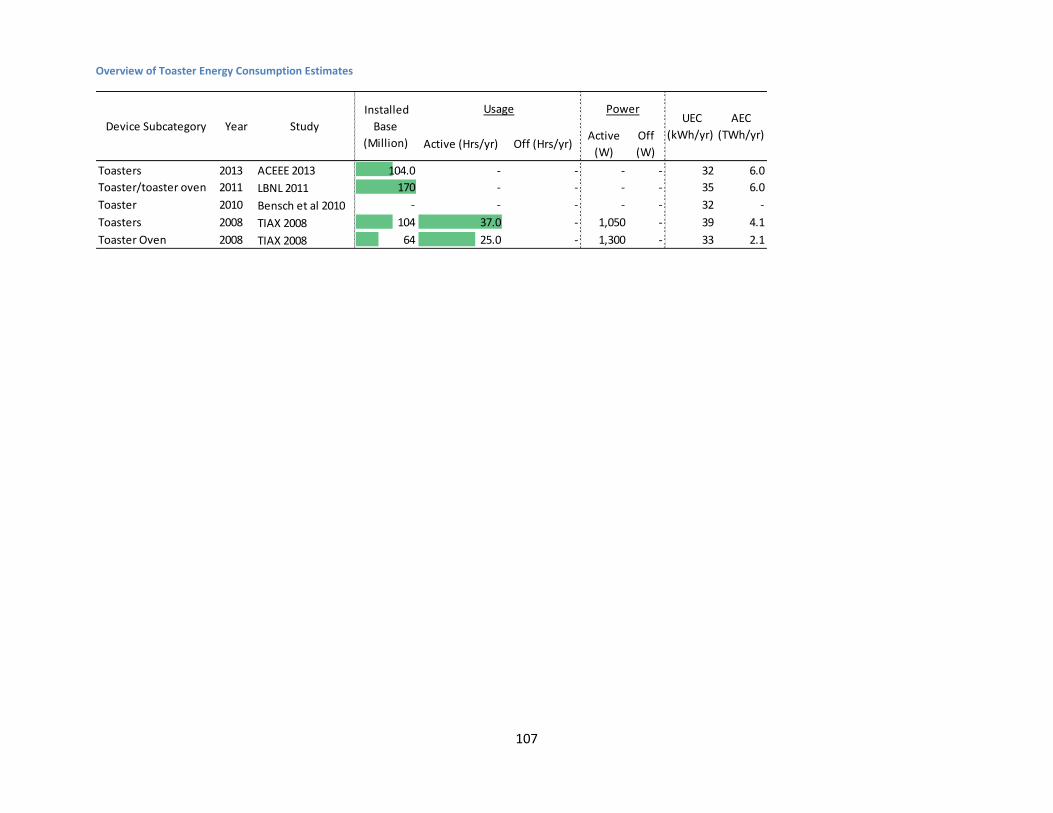
107
Overview of Toaster Energy Consumption Estimates
Active (Hrs/yr) Off (Hrs/yr) Active
(W)
Off
(W)
Toasters 2013 ACEEE 2013 104.0 - - - - 32 6.0
Toaster/toaster oven 2011 LBNL 2011 170 - - - - 35 6.0
Toaster 2010 Bensch et al 2010 - - - - - 32 -
Toasters 2008 TIAX 2008 104 37.0 - 1,050 - 39 4.1
Toaster Oven 2008 TIAX 2008 64 25.0 - 1,300 - 33 2.1
AEC
(TWh/yr)Device Subcategory Year Study
Installed
Base
(Million)
Usage Power UEC
(kWh/yr)
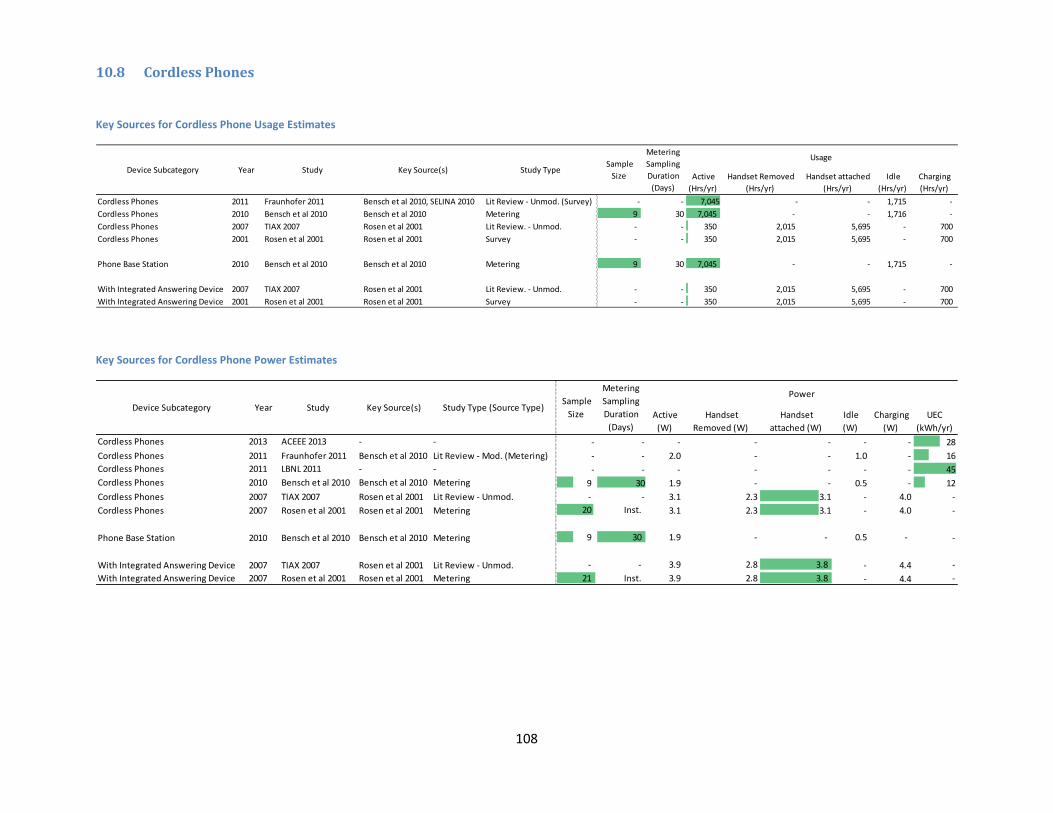
108
10.8 Cordless Phones
Key Sources for Cordless Phone Usage Estimates
Key Sources for Cordless Phone Power Estimates
Active
(Hrs/yr)
Handset Removed
(Hrs/yr)
Handset attached
(Hrs/yr)
Idle
(Hrs/yr)
Charging
(Hrs/yr)
Cordless Phones 2011 Fraunhofer 2011 Bensch et al 2010, SELINA 2010 Lit Review - Unmod. (Survey) - - 7,045 - - 1,715 -
Cordless Phones 2010 Bensch et al 2010 Bensch et al 2010 Metering 9 30 7,045 - - 1,716 -
Cordless Phones 2007 TIAX 2007 Rosen et al 2001 Lit Review. - Unmod. - - 350 2,015 5,695 - 700
Cordless Phones 2001 Rosen et al 2001 Rosen et al 2001 Survey - - 350 2,015 5,695 - 700
Phone Base Station 2010 Bensch et al 2010 Bensch et al 2010 Metering 9 30 7,045 - - 1,715 -
With Integrated Answering Device 2007 TIAX 2007 Rosen et al 2001 Lit Review. - Unmod. - - 350 2,015 5,695 - 700
With Integrated Answering Device 2001 Rosen et al 2001 Rosen et al 2001 Survey - - 350 2,015 5,695 - 700
Device Subcategory Year Study Key Source(s) Study Type Sample
Size
Metering
Sampling
Duration
(Days)
Usage
Active
(W)
Handset
Removed (W)
Handset
attached (W)
Idle
(W)
Charging
(W)
UEC
(kWh/yr)
Cordless Phones 2013 ACEEE 2013 - - - - - - - - - 28
Cordless Phones 2011 Fraunhofer 2011 Bensch et al 2010 Lit Review - Mod. (Metering) - - 2.0 - - 1.0 - 16
Cordless Phones 2011 LBNL 2011 - - - - - - - - - 45
Cordless Phones 2010 Bensch et al 2010 Bensch et al 2010 Metering 9 30 1.9 - - 0.5 - 12
Cordless Phones 2007 TIAX 2007 Rosen et al 2001 Lit Review - Unmod. - - 3.1 2.3 3.1 - 4.0 -
Cordless Phones 2007 Rosen et al 2001 Rosen et al 2001 Metering 20 Inst. 3.1 2.3 3.1 - 4.0 -
Phone Base Station 2010 Bensch et al 2010 Bensch et al 2010 Metering 9 30 1.9 - - 0.5 - -
With Integrated Answering Device 2007 TIAX 2007 Rosen et al 2001 Lit Review - Unmod. - - 3.9 2.8 3.8 - 4.4 -
With Integrated Answering Device 2007 Rosen et al 2001 Rosen et al 2001 Metering 21 Inst. 3.9 2.8 3.8 - 4.4 -
Key Source(s) Study Type (Source Type) Sample
Size
Metering
Sampling
Duration
(Days)
Power
StudyDevice Subcategory Year

109
Key Sources for Cordless Phone Installed Base Estimates
Overview of Energy Consumption Estimates
Cordless Phones 2013 ACEEE 2013 - - National - 170.0 12.9
Cordless Phones 2011 Fraunhofer 2011 Bensch et al 2010 Lit Review - Mod. (Metering) National - 137.0 2.2
Cordless Phones 2011 LBNL 2011 - - National - 200.0 9.0
Cordless Phones 2007 TIAX 2007 CEA 2005a Market Research - - 122.0 3.8
With Integrated Answering Device 2007 TIAX 2007 CEA 2005a Market Research - - 57.0 1.2
Sample
Size
Installed
Base
(Million)
AEC
(TWh/yr)
Installed Base
GeographyDevice Subcategory Year Study Key Source(s) Study Type
Active
(Hrs/yr)
Handset
Removed (Hrs/yr)
Handset attached
(Hrs/yr)
Idle
(Hrs/yr)
Charging
(Hrs/yr)
Active
(W)
Handset
Removed (W)
Handset attached
(W)
Idle
(W)
Charging
(W)
Cordless Phones 2013 ACEEE 2013 170.0 - - - - - - - - - - 28 12.9
Cordless Phones 2011 LBNL 2011 200.0 - - - - - - - - - - 45 9.0
Cordless Phones 2011 Fraunhofer 2011 137.0 7,045 - - 1,715 - 2.0 - - 1.0 - 16 2.2
Cordless Phones 2010 Bensch et al 2010 - 7,045 - - 1,716 1.9 - - 0.5 - 12 -
Cordless Phones 2007 TIAX 2007 122.0 350 2,015 5,695 - 700 3.1 2.3 3.1 - 4.0 - 3.8
Cordless Phones 2001 Rosen et al 2001 - 350 2,015 5,695 - 700 3.1 2.3 3.1 - 4.0 - -
Phone Base Station 2010 Bensch et al 2010 - 7,045 - - 1715 - 1.9 - - 0.5 - - -
With Integrated Answering Device 2007 TIAX 2007 57.0 350 2,015 5,695 - 700 3.9 2.8 3.8 - 4.4 - 1.2
With Integrated Answering Device 2001 Rosen et al 2001 - 350 2,015 5,695 - 700 3.9 2.8 3.8 - 4.4 - -
AEC
(TWh/yr)Device Subcategory Year Study
Installed
Base
(Million)
Usage PowerUEC
(kWh/yr)