Listing Statement 15th July 2013 - Rich
82
Home Afrika Limited Incorporated in Kenya under the Companies Act (Chapter 486, Laws of Kenya) (Registration Number C. 8/2011) Listing Statement 15th July 2013 In respect of The Listing by Introduction on the Growth Enterprise Market Segment of the Nairobi Securities Exchange of up to 405,255,320 Issued Ordinary Shares of KES 1 each of Home Afrika Limited at a listing price of KES 12 per Ordinary Share
Transcript of Listing Statement 15th July 2013 - Rich

Home Afrika LimitedIncorporated in Kenya under the Companies Act (Chapter 486, Laws of Kenya)
(Registration Number C. 8/2011)
Listing Statement 15th July 2013
In respect of
The Listing by Introduction on the Growth Enterprise Market Segment of the Nairobi Securities Exchange of up to 405,255,320 Issued Ordinary Shares of KES 1 each of Home Afrika Limited at a listing price of KES 12 per Ordinary Share

Listing Statement 15th July 2013 1
C o n t e n t s
1. IMPORTANT NOTICE 52. CHAIRMAN’S STATEMENT 73. CORPORATE INFORMATION 84. GLOSSARY OF DEFINITIONS AND ABBREVIATIONS 105. KEY FEATURES OF THE LISTING 115.1. THE LISTING 115.2. TRANSACTION OVERVIEW 115.3. BASIS FOR SETTING LISTING PRICE 115.4. THE COMPANY 115.5. BUSINESS PROSPECTS 125.6. KEY INVESTMENT CONSIDERATIONS 125.6.1. Increasing demand for housing 125.6.2. Government devolution 125.6.3. Regional growth prospects 125.6.4. Real Estate Investment Trusts (REITs) 125.6.5. Experienced Board 125.7. REASONS FOR THE LISTING 135.8. KEY LISTING STATISTICS 135.9. TRANSACTION TIMETABLE 135.10. EXPENSES OF THE OFFER 135.11. LOCK-IN PERIOD FOR EXISTING SHAREHOLDERS 135.12. DIVIDEND POLICY 13
6. KENYAN ECONOMIC OVERVIEW 156.1. ECONOMIC OVERVIEW 156.2. KENYAN SECTOR ANALYSIS 156.2.1. Agricultural 156.2.2. Financial Intermediation 166.2.3. Manufacturing 166.2.4. Electricity and Water 166.2.5. Hotels and Restaurants 166.2.6. Transport and Communication 166.2.7. Construction 166.2.8. Inflation 176.2.9. Interest Rates 176.2.10. Exchange Rates 18
7. KENYAN EQUITY MARKET OVERVIEW 197.1. RECENT DEVELOPMENT AT THE NAIROBI SECURITIES EXCHANGE 19
8. OVERVIEW OF THE HOUSING AND REAL ESTATE SECTOR 20 8.1. DEMAND/ SUPPLY FOR HOUSING 208.2. ECONOMY 208.3. GROWING MIDDLE INCOME CLASS PUTTING PRESSURE ON THE RESIDENTIAL SEGMENT 208.4. REMITTANCE FROM ABROAD 218.5. EAST AFRICAN COMMUNITY HUB 228.6. MARKET STATUS 228.7. PROPERTY MARKET TRENDS 228.8. RECENT DEVELOPMENTS IN THE HOUSING SECTOR 228.9. MARKET OUTLOOK 238.9.1. Residential Market 238.9.2. Retail Market 238.9.3. Office Market 238.9.4. Industrial Market 238.10. HOUSING MARKET PROJECTIONS 24
9. INFORMATION ON THE COMPANY 259.1. HISTORY AND BACKGROUND OF HOME AFRIKA 259.2. KEY MILESTONES 259.3. OPERATIONAL OVERVIEW 259.4. HOME AFRIKA LIMITED AND ITS SUBSIDIARIES 259.4.1. Completed Projects 25

Listing Statement 15th July 20132
9.4.2. Current Projects 259.4.3. New Projects 269.5. ORGANIZATION STRUCTURE 279.6. EMPLOYEES 279.6.1. Home Afrika Limited 279.6.2. Home Afrika Communities Limited 279.6.3. Mitini Scapes 279.6.4. Morningside Management Limited 279.7. SENIOR MANAGEMENT 289.8. BOARD OF DIRECTORS 299.9. COMPETENCE AND SUITABILITY OF DIRECTORS AND MANAGEMENT 319.10. SHAREHOLDING AND CORPORATE GOVERNANCE 319.10.1. Shareholders 319.10.2. Corporate Governance Practices 329.10.3. Composition of the Board of Directors 339.10.4. Remuneration of the Directors 339.10.5. Responsibilities of the Board 339.10.6. Board Committees 34
9.10.7. Other Important Information 35
10. OPERATIONAL AND FINANCIAL REVIEW 3610.1. CONSOLIDATED STATEMENTS OF COMPREHENSIVE INCOME 3610.2. CONSOLIDATED STATEMENTS OF FINANCIAL POSITION 3710.3. CONSOLIDATED STATEMENTS OF CASH FLOWS 38
11. RISK FACTORS 3911.1. CORE RISKS OF THE GROUP 3911.1.1. Political Risk 3911.2. RISK FACTORS RELATING TO THE BUSINESS 3911.2.1. Strategic Risk 3911.3. MARKET RISK 3911.3.1. Competition Risk 3911.3.2. Liquidity Risk 3911.3.3. Credit Risk 4011.3.4. Operational risk 4011.3.5. Legal risk 4011.3.6. Information risk 4011.3.7. Reputation risk 4011.4. RESPONSIBILITY FOR RISK MANAGEMENT 4111.5. RISK FACTORS RELATING TO THIS LISTING 41
12. STATUTORY AND GENERAL INFORMATION 4212.1. GENERAL AND LEGAL INFORMATION 4212.1.1. Principal Objects 4212.1.2. Articles Of Association 4212.1.3. Corporate Information 4312.2. OTHER IMPORTANT INFORMATION 4412.2.1. Capital Changes in the last five (5) years 4412.2.2. The Company’s Subsidiaries 4512.2.3. Properties 4612.2.4. Insurance 4712.2.5. Material Contracts 4712.2.6. Material Borrowings 4712.2.7. LITIGATION/DISPUTES 4812.2.8. DOCUMENTS FOR INSPECTION 48
13. DIRECTORS’ STATEMENT 4914. APPENDICES 50APPENDIX 1: LEGAL OPINION 50APPENDIX 2: ACCOUNTANTS REPORT 55

Listing Statement 15th July 2013 3
Nominated Advisor
Reporting Accountants
Legal Advisors
Registrar
Media & Public Relations

Listing Statement 15th July 20134
V i s i o n
“To be the leader in the provision of
dignified planned communities across
Africa.”
Listing Statement 15th July 2013 5
This Listing Statement includes particulars given in compli-ance with the requirements of the Companies Act (Cap.486), the requirements of the Capital Markets Act (Cap. 485A), The Capital Markets (Securities) (Public Offers, Listing and Disclosures) Regulations 2002 and , the rules and regula-tions made thereunder, as well as the Rules of the Nairobi Securities Exchange.
This Listing Statement is issued by Home Afrika Limited (“HAL” or “Home Afrika” or “the Issuer” or “the Compa-ny”) and has been prepared in compliance with The Capital Markets (Securities) (Public Offers, Listing and Disclosures) Regulations 2002 in connection with the proposed listing of the whole of its existing issued share capital (“Shares”) on the Official List of the Nairobi Securities Exchange by way of Introduction (“Introduction”) in the Growth Enter-prise Market Segment (“GEMS”) of the Nairobi Securities Exchange (“NSE”). This follows approval of the listing by the shareholders through a shareholders resolution dated 27 April 2013.
Application has been made to the Nairobi Securities Ex-change (“NSE”) and approval has been granted for the list-ing of the Shares of the Company on the NSE. Subject to compliance with the NSE Listing Rules, the NSE will admit the Shares of the Company for listing under the security code “HAFR” in the GEMS. As a matter of policy, the NSE and the Capital Markets Authority assumes no responsibil-ity for the correctness of any statements or opinions made, or reports contained in this Listing Statement, as the case may been. Approval of the Listing is not to be taken as an indication of the merits of the Company or of the Shares.
Should any doubt arise as to the meaning of the contents of this Listing Statement or as to what action to take, please consult your investment bank, financial advisor, stockbro-ker or other professional advisor, duly authorized under the Capital Markets Act, who specializes in advisory on the ac-quisition of shares and other securities.
The Directors of the Issuer, whose names appear on page 8 of this Listing Statement, accept responsibility for the in-formation contained in this document. To the best of the knowledge and belief of the Directors (who have taken all reasonable care to ensure that such is the case), the infor-mation contained in this document is in accordance with facts and does not omit anything likely to affect the import
of such information.
A copy of this Listing Statement together with the doc-uments required by Section 43 of the Companies Act (Cap.486) to be attached hereto, have been delivered to the Registrar of Companies in Nairobi for registration.
Shares of HAL will be available to the general public through the secondary trading on the NSE. Upon listing, the sale or transfer of Shares will be subject to the rules of the NSE and the CDSC (as defined below). The register will be main-tained by Co-operative Bank of Kenya Limited – Share Reg-istrar Services (the “Registrar”). There are currently no other restrictions on the sale or transfer of Shares under Kenyan law by Kenyan residents.
This Listing Statement does not constitute an offer or invi-tation to any person to subscribe for or purchase any new shares in Home Afrika and is not marketing any new shares of the company. Neither this Listing Statement nor any oth-er information supplied in connection with the Introduction is intended to provide a complete basis of any credit or other evaluation, nor should it be considered as a recom-mendation by Home Afrika, that any recipient of this Listing Statement (or any other information supplied in connection with the Introduction) should purchase any shares of the company.
Legal Advisor’s OpinionMboya Wangong’u & Waiyaki Advocates, the Legal Advi-sors, have given and not withdrawn their written consent to the inclusion in this Listing Statement of their Legal Opinion (attached as Appendix 1), and the references to their names in the form and context in which they appear, and have au-thorized the contents of the said Legal Opinion.
The Statutory, Legal and General Information section of this Listing Statement lists material contracts which arose in the ordinary course of business in which the Issuer is currently involved.
Reporting Accountant’s OpinionThis Listing Statement contains statements from PKF, the Reporting Accountants, which constitutes statements made by an expert in terms of Section 42(1) of the Com-panies Act. The Reporting Accountants have given and not withdrawn their consent to the issue of the said statements
1 . I m p o r t a n t N o t i c e
THIS DOCUMENT CONTAINS IMPORTANT DECISION MAKING INFORMATION FOR CONSIDERATION AND REQUIRES CAREFUL ATTENTION AS IT INCLUDES WITHIN IT, LEGAL, MARKET AND HISTORIC, CURRENT AND FUTURE FINANCIAL INFORMATION.

Listing Statement 15th July 20136
in the form and context in which they are included in this List-ing Statement.
Forward-looking statementThis Listing Statement contains “forward-looking statements” relating to the Company’s business. These forward-looking statements can be identified by the use of forward-looking terminology such as “believes”, “expects”, “may”, “is ex-pected to”, “will”, “will continue”, “should”, “would be”, “seeks” or “anticipates” or similar expressions, or the nega-tive thereof, or other variations thereof, or comparable termi-nology or by discussions of strategy, plans or intentions.
These statements reflect the current views of the Company with respect to future events and are subject to certain risks, uncertainties and assumptions. Many factors could cause the
actual results, performance or achievements of the Compa-ny to be materially different from the future results, perfor-mance or achievements that may be expressed or implied by such forward-looking statements. Some of these factors are discussed in more detail under “Risk Factors” and “Business Overview”. Should one or more of these risks or uncertainties materialize, or should underlying assumptions prove incor-rect, actual results may vary materially from those described in this Listing Statement as anticipated, believed, estimated or expected.
This Listing Statement is dated: 15th, July 2013
1 . I m p o r t a n t N o t i c e (Continues)

Listing Statement 15th July 2013 7
2. Chairman’s Statement
Dear Shareholder,
Home Afrika is a leading real estate company in Kenya founded 5 years ago. The company has a unity of purpose of 128 Share-holders to address the housing needs in Africa. Home Afrika Limited is committed to creating sustainable communities across Africa where people live in decent, planned and affordable homes through mass housing programs.The integrated communities concept includes residential, economic, social, leisure and environmental aspects of develop-ment. We shall partner African governments and international organizations that share a similar vision to address the housing needs in Africa.
Home Afrika’s development approach is to undertake projects in all the counties in Kenya and also expand to other countries in Africa.
As part of our strategy to achieve the above vision, Home Afrika’s shareholders and board of directors have resolved to list through GEMS and realize the following objectives:- a) Avail Home Afrika’s shared vision and success by providing an opportunity for others to own shares in the company b) Provide the shareholders an opportunity to realize the full price discovery of their investments c) Provide the shareholders an opportunity to trade off some of their shares d) Enable Home Afrika to raise funds for development e) Advance the status and corporate profile of Home Afrika as the leading real estate company in Kenya
Yours Faithfully,
Arch. Lee G. Karuri – OGW Chairman Home Afrika Ltd.

Listing Statement 15th July 20138
3. Corporate Information
CONTACT INFORMATION FOR THE COMPANY
Home Afrika LimitedMorningside Office Park, Ngong Road
P.O. Box 6254 – 00100 NairobiTel:+254 (020) 2772000
Gerald ChegeChief Executive OfficerHome Afrika LimitedEmail: [email protected]
Simon GichiniFinance ManagerHome Afrika LimitedEmail: [email protected]
CURRENT DIRECTORS OF THE COMPANY
Name Position Nationality Address
Lee G. Karuri Chairman (Non-Executive) Kenyan P.O. Box 55459 – 00200 Nairobi
Dr. Mbira Gikonyo Vice Chairman (Non-Executive) Kenyan P.O. Box 6254 – 00100 Nairobi
Eng. Mbugua Kamau Treasurer (Non-Executive) Kenyan P.O. Box 248 – 00606 Nairobi
Lucy Maina Director ( Non-Executive) Kenyan P.O. Box 14642 – 00800 Nairobi
Dan Awendo Director (Non-Executive) Kenyan P.O. Box 6254 – 00100 Nairobi
Nyagah Kithinji Director (Non-Executive) Kenyan P.O. Box 1992 – 00100 Nairobi
Gilbert Kibe Director (Non-Executive) Kenyan P.O. Box 61 – 502 Nairobi
Mbugua Gecaga Director (Non-Executive) Kenyan P.O. Box 15645 – 00100 Nairobi
Ken Wathome Director (Non-Executive) Kenyan P.O. Box 211 – 00202 Nairobi
Jane Adam Director (Non-Executive) Kenyan P.O. Box 56277 – 00200 Nairobi
OTHER CORPORATE INFORMATION
Company Secretary Esther Ndegi NjiruCertified Public SecretaryP O Box 2050 – 00200Nairobi, Kenya
Registered Office Morningside Office Park, 5th Floor Penthouse 1, Ngong RoadP.O. Box 6254 – 00100Nairobi, Kenya
Financial Calendar Financial Year – 31st December
Auditors PKF KenyaCertified Public AccountantsP.O. Box 14077-00800Nairobi, Kenya
Legal Advisors Mboya Wangong’u & Waiyaki AdvocatesLex ChambersMaji Mazuri RoadOff James Gichuru Road, LavingtonP. O. Box 74041-00200

Listing Statement 15th July 2013 9
Muriu Mungai & Company AdvocatesMMC ArchesSpring ValleyP.O Box 75362-00200Nairobi, Kenya
Principal Banker Kenya Commercial BankSarit Centre BranchP.O. Box 14959-00800Nairobi, Kenya
Subsidiaries of the company The Company’s subsidiaries as at the date of publication of this Listing Statement com-prise of Morningside Management Limited (Ngong Road) (50%), Home Afrika Communi-ties Limited (Kiambu) (60%), Suburban Limited (50%), Mitini Scapes Development Limited (Kiambu) (100%), Kikwetu Development Limited (Athi River) (60%), Lakeview Heights De-velopment Limited (Kisumu) (60%), and Llango Development Limited (Kwale) (60%).
TRANSACTION ADVISORS AND AGENTS
NOMINATED ADVISOR LEGAL ADVISOR
NIC Capital LimitedNIC HouseMasaba RoadP.O. Box 44599-00100Nairobi, KenyaTel: +254 20 2888000 / 4948000Fax: +254 20 2888505Contact: Eldad WairegiEmail: [email protected]
Mboya Wangong’u & Waiyaki AdvocatesLex ChambersMaji Mazuri RoadOff James Gichuru Road, LavingtonP. O. Box 74041-00200Nairobi, KenyaTel: +254 20 4348356 - 59Fax: +254 20 4348351Contact: Godwin Wangong’uEmail: [email protected]
REPORTING ACCOUNTANT REGISTRAR
PKF LimitedKalamu HouseGrevillea Grove Off BrooksideP.O. Box 14077 - 00800Nairobi, KenyaTel: +254 20 4270000 Fax: +254 20 4447233Contact: Mike Kimundu Email: [email protected]
Co-operative Bank of Kenya Limited – Share Registrar ServicesCo-operative Bank House, 13th FloorHaile Selassie AvenueP.O. Box 48231-00100Nairobi, KenyaTel: +254 20 3276234Fax: +254 20 2249484Contact: Julia KinanduEmail: [email protected]
PUBLIC RELATIONS AND MEDIA ADVISORS
Redhouse Public Relations14 Riverside 2nd Floor Riverside Drive P.O BOX 40287-00100Nairobi, Kenya Tel: +254 20 4205000Contact: Kenneth Kyaka Email: [email protected]
3. Corporate Information (Continues)
Listing Statement 15th July 201310
4. Glossary of Definit ions and Abbreviat ions
Unless otherwise stated and as the context allows, the words in the first column have the meaning stated opposite them in the second column, throughout this Listing Statement, its appendices and enclosures. Words in the singular include the plural and vice versa, words signifying one gender include the other gender and references to a person include references to juristic persons and associations of persons.
Subject Definition
Admission The admission of the Shares to GEMS becoming effective in accordance with the NSE Rules
Articles The Articles of Association of Home Afrika Limited
Board The Board of Directors of the Company;
Bps Represents movement in interest rates whereby 1% change = 100 basis points, and 0.01% = 1 basis point
CAGR Compounded Annual Growth Rate
Capital Markets Legislation Means (a) the Capital Markets Act, Chapter 485A of the Laws of Kenya and all subsidiary legislation and rules and guidelines pro-mulgated thereunder (b) the rules of the NSE (c) Companies Act and (d) any law applicable to capital markets in Kenya
CDS The Central Depository System, a computer system operated by CDSC in accordance with the Central Depositories Act, 2000 that facilitates holding of securities in electronic accounts thereby facilitating faster and easier processing of transactions at the NSE
CDS Account A securities account opened with CDSC for the purpose of recording the deposit of and dealings in immobilized or dematerialized securities
CDSC The Central Depository and Settlement Corporation Limited a company incorporated in Kenya
CMA The Capital Markets Authority in Kenya, a statutory body incorporated under the Capital Markets Act and includes anybody replac-ing it or any of its functions
Company or Issuer Home Afrika Limited
Companies Act The Companies Act (Chapter 486 of the Laws of Kenya)
Directors or the Board Directors of the Company whose names appear on page 10 of this Listing Statement
DPS Dividend per Share
EPS Earnings per Share
ETF Exchange Traded Fund
EPZ Export Processing Zone
Existing Shares The Issued and fully paid Ordinary Shares of the Company as at the date of this Listing
Executive Director A member of the Board of Directors who is an employee of the Company
GDP Gross Domestic Product
GEMS Growth Enterprise Market Segment
IAS or IFRS International Accounting Standards (also referred to as International Financial Reporting Standards)
ICT Information and Communication Technology
Issuer the Company
KSHS, Kshs or KES Kenya Shillings or the currency of the Republic of Kenya
Listing Admission of the Shares to the GEMS
Home Afrika or HAL the Issuer
NACHU National Cooperative Housing Union
NAV Net Asset Value
NSE The Nairobi Securities Exchange
NGO Non Governmental Organization
NLC National Land Commission
Non-Executive Director A member of the Board of Directors of the Company who is not an employee
Listing Price KES 12 per share
PE Price-Earnings Ratio
Par Value Nominal value of the Company’s shares, which for the time being is KES 1 per share
RBA Retirements Benefits Authority
Registrar Co-operative Bank Limited – Share Registrar Services, the share registrar appointed in connection with the Listing whose name and address appears on page 10 (Corporate Information) of this Listing Statement
SACCO Savings and Credit Cooperative Society
Shares Ordinary shares of KES 1/- each in the issued share capital of the Company
Listing Statement 15th July 2013 11
5. Key Features of the List ing
This Section contains a summary of the Listing of Shares. This Listing Statement should be read in full along with oth-er documents available for inspection for full appreciation of the subject matter.
5.1. The ListingHome Afrika is pleased to be joining the Nairobi Securities Exchange (NSE). With the consideration that raising of cap-ital is not an immediate reason for the Company to list at the NSE, Home Afrika has opted to list by way of introduc-tion on the Growth Enterprise Market Segment (GEMS) of the NSE. Listing will provide a broader base of shareholders and added liquidity for existing shareholders.
Home Afrika is an industry pioneer by being not only the first company to be listed on the GEMS, but also the first real estate company to be listed on the NSE.
5.2. Transaction Overview
Transaction: Listing by Introduction on GEMS seg-ment of NSE.
Issuer: Home Afrika Limited.
Shares: 405,255,320 ordinary shares each of KES 1/- each comprising the issued and fully paid up share capital of the Issuer.
Status: Upon listing, freely transferable ordi-nary shares ranking pari passu with each other.
Trades: Shares will be fully dematerialized and uploaded into the CDS prior to trading.
Compliance: The Listing is subject to the require-ments of the Articles, The Companies Act, The Capital Markets Act, the Nairobi Securities Exchange Listing Manual and the Central Depositories Act.
Price per Share: KES 12 per share.
Nominated Advisor:
NIC Capital Limited.
Market Segment: GEMS.
Expected Listing Date:
15th July, 2013
Governing Law: Kenyan Law.
5.3. Basis for setting listing price The listing price has been determined by the Company in consultation with the Nominated Advisor on the basis of three valuation techniques, Free Cash Flow to Firm (FCFF), Economic Value Added (EVA) and Comparable Company Analysis (CCA). In addition, the listing price has also tak-en into consideration the current macro-economic outlook and historical and projected financial performance of the Company.
The listing price has therefore been determined on the fol-lowing basis:-• Share prices of comparable companies in Kenya and
other developing countries; further looking at the rela-tive market capitalization; return on average equity and implied land values, among other real estate valuation techniques. By applying this methodology a valuation range was arrived at for the Company.
• Kenyaandtheregion’smacro-economicoutlook.• The historical and projected financial performance of
the Company.• TheFreeCashFlowto theFirm (FCFF)by taking into
account the earnings before interest and taxes, net out and reinvestment needs and arriving at an estimate of the free cash flow to the firm.
• TheEconomicValueAdded(EVA)methodologytode-termine the true economic profit of the Company and further assess the amount by which earnings exceed or fall short of the required minimum rate of return for shareholders.
Furthermore, individual Discounted Cash Flow valuations were carried out of the various special purpose vehicles, thereafter taking into account HAL’s interest in each and consolidating the same.
5.4. The CompanyHome Afrika Limited was incorporated in Kenya on 17th July 2008 under the Companies Act as a private limited company with a share capital of KES 100,000 divided into 1,000 shares of KES 100 each. Initially, a decision was made that three holding companies should be incorporated to hold shares in the Company, in trust for the people who had paid for shares in the Company. Home Afrika Continental Limited (HACL), Home Afrika Investments Limited (HAIL) and Home Afrika Holdings Limited (HAHL) were therefore incorporated for this purpose.
However, in a general meeting held on 30th April, 2011, shareholders resolved that the company be converted into a public company, the authorized share capital be in-

Listing Statement 15th July 201312
5. Key Features of the List ing (Continues)
creased from KES 100,000.00 to KES 500,000,000 and that the holding companies be collapsed. As a result, Home Af-rika is now a public limited company owned by 128 founder shareholders with a mandate to undertake real estate proj-ects in Africa.
By way of a shareholders resolution dated 28th July 2012, the shareholders of the Company resolved to split the then KES 100.0 ordinary shares in the Company into 50,000,000 shares of KES 10.00 each, out of which 40,525,532 shares have been issued and fully paid up. A further split was car-ried out following a shareholders resolution dated 26th January 2013 resulting in the current 500,000,000 ordinary shares of KES 1.00 each, out of which 405,255,320 shares have been issued and fully paid up.
The subsidiaries of the Company (set up as special purpos-es vehicles for housing developments) comprise of Sub-urban Limited (Ngong Road), Morningside Management Limited (Ngong Road), Home Afrika Communities Limited (Kiambu) Mitini Scapes Development Limited (Kiambu), Kik-wetu Development Limited (Athi River), Lakeview Heights Development Limited (Kisumu) and Llango Development Limited (Kwale).
5.5. Business ProspectsHome Afrika seeks to provide quality, sustainable and af-fordable housing in Africa and the areas of growth include undertaking a mix of commercial, residential and land sub-division projects within Kenya. The devolved government system in Kenya has opened up opportunities for county development thereby presenting Home Afrika with an op-portunity for growth. Home Afrika is also focused on mov-ing into regional countries including Tanzania, Uganda, South Sudan, Ethiopia and Rwanda through its “Go Africa” strategy.
Home Afrika is focused on listing on the newly developed segment on the Nairobi Securities Exchange - the Growth Enterprise Market Segment (GEMS).. The GEMS market al-lows small and medium sized companies to raise substantial initial and ongoing capital, while benefiting from increased profile and liquidity within a regulatory environment de-signed specifically for the needs of such companies.
Home Afrika is currently involved in three projects valued at over KES 10.0bn and is focusing on undertaking seven to ten projects as part of its five year strategic plan. This am-bitious growth plan seeks to push Home Afrika to achieve its strategic objective of attaining a project turnover of USD 1.0bn within the next five (5) years.
5.6. Key Investment Considerations 5.6.1. Increasing demand for housing• The demand for affordable housing is significantly in-
creasing worldwide with 5 million new units required per year according to UN Habitat. In Kenya, the housing demand (Continues) to increase particularly in the ur-ban areas. According to the Ministry of Finance, current demand is estimated at 200,000 units per annum with supply estimated at 35,000 units in urban areas in the country. With such a massive supply gap, the private sector is expected to play a critical role in meeting the shortage.
• Increase in population especially in the urban andperi-urban areas pushes up the demand for housing units and hence there is currently more pressure to supply affordable housing units for this populace. A high proportion of the Kenyan population lies within the low and middle income class and this trend is expected to continue rising.
5.6.2. Government devolution• The devolved government system prescribed in the
new constitution will create more opportunities for HAL to take part in real estate development in the counties.
5.6.3. Regional growth prospects• TheregionalintegrationoftheEastAfricanCommuni-
ty as a trading block presents an attractive investment opportunity for HAL to tap into housing development opportunities in the region.
• ThroughtheCompany’s“GoAfrica”strategy,HomeAf-rika will be seeking to take advantage of the regional economic growth by expanding into Tanzania, Uganda, Southern Sudan, Ethiopia and Rwanda.
5.6.4. Real Estate Investment Trusts (REITs)• TheintroductionofRealEstateInvestmentTrusts(REITs)
in Kenya will structure the flow of capital into commer-cial real estate, thereby harnessing capital for growth and development. REITs will enable corporations to invest in real estate while reducing corporate income taxes.
• REITswillfurtherhelpindividualinvestorsenjoytheben-efit of owning an interest in the real estate market and have the benefits of fast and easy liquidation of invest-ments. In summary, REITs will further stimulate growth in the real estate space.

Listing Statement 15th July 2013 13
5.6.5. Experienced Board• The Home Afrika Limited Board comprises members
who have extensive experience in various industries cutting across finance, real estate, medicine, investment and banking sectors and therefore are very vital in for-mulating company strategies for superior growth.
5.7. Reasons for the ListingThe primary purpose of the Listing is to offer Home Afri-ka and its shareholders the benefits of being listed on the stock market i.e. liquidity, price discovery and branding ad-vantage. 5.8. Key Listing Statistics
Details Statistics
Listing price per share KES 12
Par value of each share before the share split
KES 10/-
Share split ratio 10:1
Par value of each share after the share split
KES 1/-
Total number of issued shares before the share split
40,525,532
Total number of issued shares after the share split
405,255,320
Net profit for the twelve (12) months ended 31 December 2012
KES 167,679,951
Dividend declared and to be paid for the twelve (12) months ended 31 De-cember 2012
KES 38,847,000
Dividend per share (“DPS”) for the twelve (12) month period ended 31 December 2012 before share split
KES 0.96
Dividend per share (“DPS”) for the twelve (12) month period ended 31 December 2012 after share split
KES 0.10
Earnings per share (“EPS”) for the twelve (12) months ended 31 Decem-ber 2012 before share split
KES 4.14
Earnings per share (“EPS”) for the twelve (12) months ended 31 Decem-ber 2012 after share split
KES 0.41
5.9. Transaction Timetable
Quarterly General Meeting 27th April, 2013
Board Approval of Listing and Share Split
28th May, 2013
Approvals from the NSE 04th July, 2013
Deadline for uploading the shares into CDS
05th July, 2013
Dispatch of Listing Statement to shareholders
11th July, 2013
Listing and Commencement of Trad-ing at the NSE
15th July, 2013
5.10. Expenses of the OfferThe expenses of the Listing which will fall under the account of the Company are estimated at KES 9,205,892.
Professional fees and related costs *KES
Nominated Advisor 4,640,000
Reporting Accountants 650,000
Legal Advisors 1,102,000
Registrars** Nil/ Waived
Media & PR 2,088,000
NSE listing fees 145,892
Miscellaneous Expenses (Printing) 580,000
Total 9,205,892
* These figures are inclusive of VAT (where applicable) and may be subject to change. The expenses of the Offer amount to 0.19% of the Offer amount or KES 12 per Offer Share.**Co-operative Bank Share Registrars have waived the list-ing fee but will be billing Home Afrika registration fees of KES 180,000 on an annual basis in addition to other relevant fees including AGM attendance, commissions on dividend processing and bonus/ rights issues.
5.11. Lock-In Period for Existing ShareholdersNone of the existing shareholders beneficially owns a 3% interest in the voting power of the Issuer and have there-fore not undertaken a lock-in period. However, as a sign of commitment to the growth of the company and confidence in the long-term fundamentals of HAL, Home Afrika shall strive to ensure the continued retention of suitably qualified management on and after the Listing. In particular, HAL will endeavor to ensure the retention of members of the senior
5. Key Features of the List ing (Continues)

Listing Statement 15th July 201314
management team for a period of at least 12 months fol-lowing the Listing (except where such staff will be relieved of their duties following the commission of a grievous of-fence deemed inappropriate, or as adversely affecting the integrity of the company in its status as a listed company).
5.12. Dividend PolicyEach of the companies within HAL has a policy to pay divi-dends when permitted by law and subject to consideration of its investment requirements, financial condition includ-ing its level of indebtedness and liquidity requirements, and its results of operations.
As a holding company, HAL’s ability to pay dividends de-
pends on the dividends it receives from its subsidiaries and affiliates.
As with its individual subsidiaries, HAL will follow a policy of paying dividends whenever permitted by its results of oper-ations, financial position, investment and liquidity require-ments, legal reserves and minimum capital requirements.
The declaration, amount and payment of dividends is de-termined, subject to the limitations set forth above, by ma-jority vote of the Shareholders at an annual general meet-ing of the Company and generally, but not necessarily, on the recommendation of the board of directors.
5. Key Features of the List ing (Continues)

Listing Statement 15th July 2013 15
6.1. Economic Overview Kenya’s economy expanded by 4.7% in Q3 of 2012 com-pared to the 4.0% growth recorded in the same quarter of 2011. The expansion was more robust in comparison to the preceding quarters of 2012 primarily due to strong perfor-mances in the Agriculture and Forestry, Fishing, Manufac-turing, Transport and Communication industries and a turn-around in the performance of the Electricity industry. On the other hand, Construction, Hotels and Restaurants and Mining and Quarrying experienced decelerated growths over the same period. Wholesale and retail trade regis-tered strong growth despite deceleration compared to the corresponding quarter of 2011. Seasonally adjusted Gross Domestic Product, which compares consecutive quarters, expanded by 2.2% in Q3 of 2012, which was significantly better than the 0.5% recorded in the Q2 of 2012.
Q3 2012 was characterized by low inflation rates, high inter-est rates and stable exchange rates of the shilling against major world and regional currencies. Inflation averaged at 6.4% during the review period from a high of 16.5% experi-enced during Q3 of 2011. The ease in the inflationary pres-sure was mainly on account of lower food and fuel prices.
During Q3 the exchange rate averaged at KSh 84.60, KSh 106.3 and KSh 108.37 against the US Dollar, Euro and 100 Japanese Yen, respectively. Regionally, the Kenya Shilling exchanged at Tanzania Shilling 18.63 and Uganda Shilling 29.62 while the South African Rand averaged at KSh 10.2. During Q3 of 2011, the exchanges rates were KSh 94.6, KSh 133.5 and KSh 122.9 against the US Dollar, Euro and 100 Japanese Yen, respectively. High interest rates that pre-vailed during Q3 were on account of the Central Bank’s sustenance of a tight monetary policy stance. Expansion in broad money supply slowed to 13.6% during Q3 com-pared to a growth of 18.0% during a similar period of 2011. Weighted interest rates on commercial banks loans and ad-vances rose significantly from an average of 14.4% during Q3 of 2011 to 20.0% in the corresponding period of 2012.
Economic activity in Q1 2013 remained subdued on the back of the intense electioneering period witnessed mostly in the months of January 2013 and February 2013. Conse-quently, this held back private sector credit growth as well as delayed investments across the different sectors of the economy. Overall inflation remained benign closing the month of March 2013 at 4.1%. Although the short term rates edged higher with 91 day T-bill, 182 day T-bill and 364 day T-bill rates rising by 2.4%, 2.7% and 1.0% to close the Q1 2013 at 10.5%, 10.8% and 12.7% respectively, we consider this trend to be temporary owing to the consistency of the
monetary policy that the Central Bank of Kenya (CBK) has adopted.
The Kenya Shilling weakened in the early part of Q1 2013 against all the major currencies. However, following the peaceful election polls and reduced risk of economic sanc-tions, the Kenya Shilling quickly regained its position to close Q1 2013 at KES/USD 85.6, KES/GBP 129.6, KES/YEN (100) 90.9 and KES /ZAR 9.3 respectively.
Overall, the Kenyan economy is expected to grow at a rate of 5.5% in 2013 on the back of a stable macro-economic environment, supportive monetary policy and favorable weather. The downside risks to the growth forecast will be the twin deficits of current account and the budget.
Source: Kenya National Bureau of Statistics, World Bank
6.2. Kenyan Sector Analysis6.2.1. AgriculturalAgriculture sector started the year with poor prospects af-ter a number of parts of the country suffered severe frost during the first quarter which negatively impacted on pro-duction of tea and other vulnerable crops, while the delay in the onset of long rains led to suppressed agricultural ac-tivities. Consequently, the sector only managed a moderate growth of around 2.0% during the first half of 2012. During Q3 of 2012, however, the sector’s performance improved substantially to 6.9% compared to a paltry growth of 0.2% in the same quarter of 2011.
The remarkable growth was largely supported by improved and well spread rains during the second and third quarters of the year. Negative effects of maize disease, mainly ex-perienced in parts of the South Rift, were sufficiently offset by good rains in most parts of the country. Consequently, production of key crops including maize, beans, sugar cane and fruits increased significantly. However, production of cut flowers and vegetables declined during the review pe-riod. Over the same period, milk intake to the formal milk sector also declined.
6. Kenyan Economic Overview

Listing Statement 15th July 201316
6.2.2. Financial IntermediationThe sector overcame the bottlenecks of high interest rates to attain one of the most impressive growths during Q3 of 2012. The financial intermediation sector grew by 6.8% during the reference period which was slightly lower than the 7.6% the sector reached in Q3 of 2011.
The net foreign assets of the banking system increased from a revised figure of KSh 331.7bn in June 2012 to KSh 352.0bn in September 2012 while domestic credit increased by 4.5% from KSh 1,550.5bn in June 2012 to KSh 1,660.1bn in Sep-tember 2012. Consequently, extended broad money supply M3 increased from KSh 1,970.5bn to KSh 2,060.6bn over the same period. Stock market performance rallied strongly in September 2012, with gains in the Nairobi Securities Ex-change 20 Share and Nairobi All Share Index. The NSE 20 share index rose from 3,704 points in June to 3,972 points in September 2012.
6.2.3. ManufacturingDuring Q3 of 2012, the sector is estimated to have expand-ed by 4.8% compared to a growth 2.3% during the same quarter of 2011. The growth in the sector was largely sup-ported by strong expansion in the manufacture of foods mainly buoyed by a rebound in processing of sugar which expanded by 48.7% during Q3 of 2012 compared to a con-traction of 38.2% in a similar quarter of 2011. Other food products whose processing increased significantly include beer, wheat flour and maize meal which grew by 17.1%, 16.3% and 9.3% respectively. However, soft drinks and dairy products declined considerably by 10.9% and 10.4% re-spectively. Manufacture of motor vehicle tyres, laundry and toilet soaps recorded the highest growths in the non-food category over the same period.
6.2.4. Electricity and WaterElectricity and water supply recorded 13.7% growth in Q3 of 2012 compared to a contraction of 11.1 % over a similar pe-riod in 2011. The turnaround was primarily due to high lev-els of rainfall experienced in the water catchment regions for electricity generation. Hydro electricity generation ex-panded dramatically by 39.0% during Q3 2012 compared to the corresponding quarter of 2011. However, generation of power through geo-thermal and thermal sources declined by 2.3% and 25.2% respectively. Consequently, contribution to the Gross Domestic Product of the resulting production mix of electricity was much higher due to reduced thermal generation which requires more expensive intermediate inputs compared to hydro power generation. Electricity production increased to 511.3 million KWh during Q3 com-pared to 489.9 million KWh in the same period of 2011.
6.2.5. Hotels and RestaurantsThe sector’s growth slowed to 1.1% during Q3 of 2012 from 2.1% in the same quarter of 2011. This slowdown was pri-marily on account of terrorism threats posed by the political instability in Somalia and a decline in the economic fortunes of major tourist sources like the USA and European coun-tries. As a consequence, tourist arrivals through Jomo Ken-yatta and Moi International Airports declined from 383,110 visitors in Q3 of 2011 to 342,135 visitors during Q3 of 2012.
6.2.6. Transport and CommunicationThe sector is estimated to have grown by 5.2% during Q3 2012 compared to a growth of 3.9% in the same period of 2011. The growth was mainly supported by strong expan-sion in the communication sub-sector which accounted for 54.5% of the total growth in the industry. The sub-sector expanded by 5.9% during the reference period, while land transport and storage activities grew by 4.5% in the same period.
Consumption of light diesel and jet fuel, which reflect the activities of commercial transport, recorded mixed perfor-mances. Consumption of light diesel increased by 5.0% in Q3 of 2012 compared to the same quarter of 2011 while that of jet fuel decreased by 2.1% over the same period. Port activities expanded, as reflected in the increased vol-ume of cargo handled, despite a contraction of 24.1% in exports tonnage during the review period. Import tonnage increased by 11.4% thereby offsetting the impact of the de-cline in export tonnage to result in a growth of 6.1% of vol-ume of cargo handled at the port during Q3 of 2012 com-pared to the same quarter of 2011.
6.2.7. ConstructionThe construction industry is estimated to have expanded by 0.6% during Q3 of 2012 compared to a growth of 3.6% in a similar period of 2011. The considerable slowdown in the activities of this sector was mirrored in the production and consumption of cement whose growths slowed to 0.6% and 1.5% during Q3 compared to expansions of 8.9% and 7.7% respectively over a similar period in 2011. This slowdown is attributable to the prevailing high interest rates. Kenyan Macroeconomic Overview
The movements in interest rates, exchange rates and in-flation are summarized below. The data has been sourced from the Central Bank of Kenya as well as from the Kenya National Bureau of Statistics.
6. Kenyan Economic Overview (Continues)
Listing Statement 15th July 2013 17
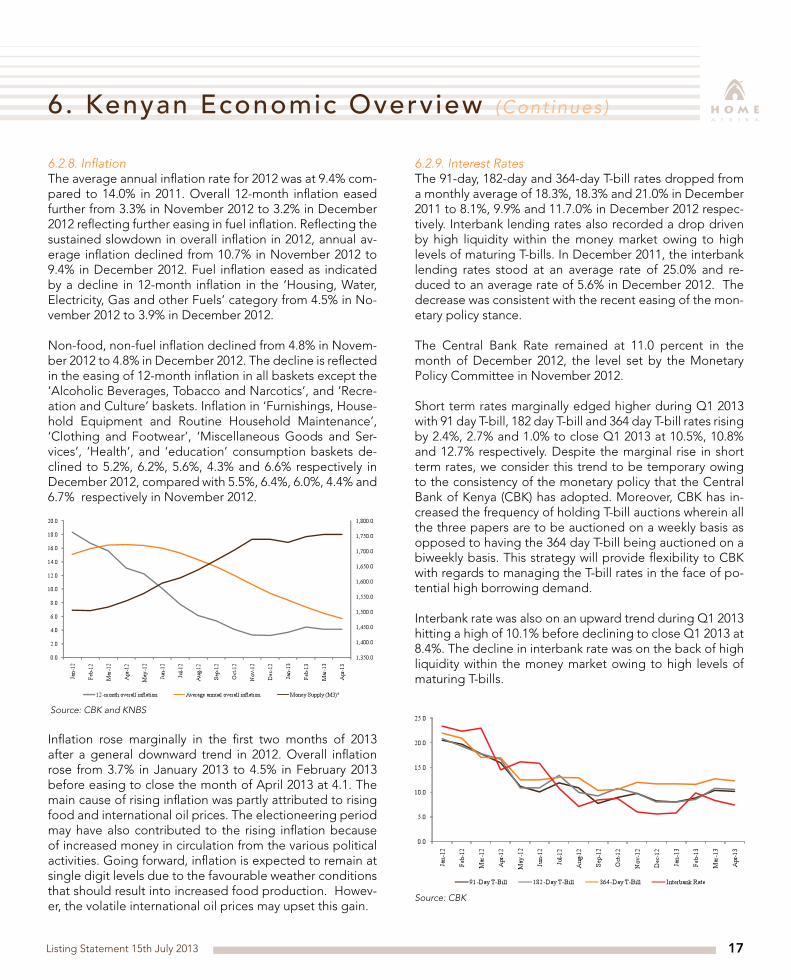
6.2.8. InflationThe average annual inflation rate for 2012 was at 9.4% com-pared to 14.0% in 2011. Overall 12-month inflation eased further from 3.3% in November 2012 to 3.2% in December 2012 reflecting further easing in fuel inflation. Reflecting the sustained slowdown in overall inflation in 2012, annual av-erage inflation declined from 10.7% in November 2012 to 9.4% in December 2012. Fuel inflation eased as indicated by a decline in 12-month inflation in the ‘Housing, Water, Electricity, Gas and other Fuels’ category from 4.5% in No-vember 2012 to 3.9% in December 2012.
Non-food, non-fuel inflation declined from 4.8% in Novem-ber 2012 to 4.8% in December 2012. The decline is reflected in the easing of 12-month inflation in all baskets except the ‘Alcoholic Beverages, Tobacco and Narcotics’, and ‘Recre-ation and Culture’ baskets. Inflation in ‘Furnishings, House-hold Equipment and Routine Household Maintenance’, ‘Clothing and Footwear’, ‘Miscellaneous Goods and Ser-vices’, ‘Health’, and ‘education’ consumption baskets de-clined to 5.2%, 6.2%, 5.6%, 4.3% and 6.6% respectively in December 2012, compared with 5.5%, 6.4%, 6.0%, 4.4% and 6.7% respectively in November 2012.
Source: CBK and KNBS
Inflation rose marginally in the first two months of 2013 after a general downward trend in 2012. Overall inflation rose from 3.7% in January 2013 to 4.5% in February 2013 before easing to close the month of April 2013 at 4.1. The main cause of rising inflation was partly attributed to rising food and international oil prices. The electioneering period may have also contributed to the rising inflation because of increased money in circulation from the various political activities. Going forward, inflation is expected to remain at single digit levels due to the favourable weather conditions that should result into increased food production. Howev-er, the volatile international oil prices may upset this gain.
6.2.9. Interest RatesThe 91-day, 182-day and 364-day T-bill rates dropped from a monthly average of 18.3%, 18.3% and 21.0% in December 2011 to 8.1%, 9.9% and 11.7.0% in December 2012 respec-tively. Interbank lending rates also recorded a drop driven by high liquidity within the money market owing to high levels of maturing T-bills. In December 2011, the interbank lending rates stood at an average rate of 25.0% and re-duced to an average rate of 5.6% in December 2012. The decrease was consistent with the recent easing of the mon-etary policy stance.
The Central Bank Rate remained at 11.0 percent in the month of December 2012, the level set by the Monetary Policy Committee in November 2012.
Short term rates marginally edged higher during Q1 2013 with 91 day T-bill, 182 day T-bill and 364 day T-bill rates rising by 2.4%, 2.7% and 1.0% to close Q1 2013 at 10.5%, 10.8% and 12.7% respectively. Despite the marginal rise in short term rates, we consider this trend to be temporary owing to the consistency of the monetary policy that the Central Bank of Kenya (CBK) has adopted. Moreover, CBK has in-creased the frequency of holding T-bill auctions wherein all the three papers are to be auctioned on a weekly basis as opposed to having the 364 day T-bill being auctioned on a biweekly basis. This strategy will provide flexibility to CBK with regards to managing the T-bill rates in the face of po-tential high borrowing demand.
Interbank rate was also on an upward trend during Q1 2013 hitting a high of 10.1% before declining to close Q1 2013 at 8.4%. The decline in interbank rate was on the back of high liquidity within the money market owing to high levels of maturing T-bills.
Source: CBK
6. Kenyan Economic Overview (Continues)

Listing Statement 15th July 201318
6.2.10. Exchange RatesThe Kenya Shilling was relatively stable against the US dol-lar, the British pound and EAC national currencies in De-cember 2012. The stability was attributed to prudent man-agement of domestic liquidity and by extension Monetary Policy. The Kenya Shilling however, depicted mixed perfor-mance against the Pound Sterling and the Japanese Yen.
The Kenyan Shilling over the course of 2012, however, gained 0.5% against the Euro and 10.3% against the Japa-nese Yen. The currency gained by 10.7% against the Ugan-dan Shilling over the course of 2012.
The Kenya Shilling came under pressure at the beginning of the year 2013 when the Monetary Policy committee re-duced the CBR rate from 11.0% to 9.5%. Coupled with in-creased liquidity in the money market, and flight from the Kenya Shilling ahead of the General Elections, the Kenya Shilling depreciated to low levels of KES 87.6 against the US Dollar in February 2013.
CBK, however, supported the local currency through mop-ping up of excess liquidity by selling US Dollars. The Kenya Shilling was also boosted by the peaceful General Elections in March 2013. The Kenya Shilling recovered to the Janu-ary 2013 opening level of about 86.0 against the Dollar, but depreciated against both the Sterling Pound and Euro by 7.2% and 4.5% respectively in Q1 2013.
The official foreign reserves declined to below 4 months of import cover from late January 2013 mainly as a result of CBK’s support for the local currency. This position coupled with the widening current account deficit leaves the local currency vulnerable to exchange rate shocks. However CBK
is keen to support the shilling and thus we do not expect it to depreciate drastically.
Regionally, the Kenyan Shilling gained 9.3% against the South African Rand to an average of KES 9.25 in March 2013. Against the Ugandan Shillings, the Kenyan Shilling gained by 3.2% to exchange UGS 30.30 but lost 2.3% to trade at 19.10 to the Tanzania shilling.
Currency Jan 2012
Mar 2012
Jun 2012
Oct 2012
Dec 2012
Mar 2013
KES/USD 84.59 83.06 84.23 85.18 86.03 85.64
KES/GBP 133.17 132.75 131.42 136.95 139.02 129.61
KES/EUR 111.61 110.86 105.96 110.37 113.56 109.56
K E S / J P Y (100)
111.25 101.34 106.15 106.99 99.90 85.75
USH/KES 27.49 30.28 29.38 30.41 31.26 31.16
TSH/KES 18.92 19.14 18.71 18.63 18.42 19.42
Source: Central Bank of Kenya.
6. Kenyan Economic Overview (Continues)

Listing Statement 15th July 2013 19
Activity at the NSE remained strong during Q1 2013 despite the high political activities. Most stocks rallied on the back of a peaceful election process which improved investors’ confidence. The momentum however slowed down soon after the elections due to profit taking. Additionally, the election petition at the Supreme Court challenging the out-come of Presidential results created uncertainty and led to a wait-and-see stance.
The NSE 20 Share Index rose by 18.2% while the NASI rose by 24.6% during Q1 2013. Volume traded over the period was equally high as compared to those traded in Q1 2012. The drive to make Nairobi as the financial hub for East and Central Africa has elevated the NSE and seen increased at-tention from foreign investment firms seeking to tap into the region’s growth.
Source: NSE
7.1. Recent Development at the Nairobi Securities Ex-changeIn October 2011, the Nairobi Stock Exchange changed its name to the Nairobi Securities Exchange paving the way for introduction of a wider range of products. The name change, which was the first since the exchange was estab-lished as a voluntary association of stockbrokers in 1954, was one of the steps that were to be completed as part of a demutualization process. The name change will widen the
NSE’s scope beyond a “stock” exchange to a “securities” market where other products such as futures, derivatives and Real Estate Investment Trusts (REITs) are traded. Fur-thermore, in November 2011, the NSE launched the FTSE NSE Kenya Index Series which comprises of the FTSE NSE Kenya 15 Index and the FTSE NSE Kenya 25 Index. The in-dices were designed to be used as the basis for the creation of structured products, ETFs and index tracking funds.
In 2011, the market deepened as Transcentury Limited and British-American Investment Company Limited listed by way of introduction and through an initial public offer respectively. In addition to these events, the NSE part-nered with the FTSE to launch two new indices namely the FTSE-NSE 15 and the FTSE-NSE 25. These two indices are market-weighted indices and are meant to assist investors in designing Exchange Traded Funds (ETF’s). The market deepened even further in 2012 with the listing by introduc-tion of Longhorn Publishers Limited.
During the same year, the NSE also carried out the reclas-sification of companies within its index. The equities have been classified under ten different sectors while the debt securities including preference shares have been grouped into three categories. The reclassification will go a long way in bringing the NSE closer to international best prac-tice and will enable domestic and international investors to compare company and sector performance more easily.In 2013, the NSE launched the Growth Enterprise Market Segment (GEMS) of the exchange. The segment will enable Small and Medium Size Enterprises raise capital while at the same time increasing the number of listed companies at the NSE.
Going forward, the introduction of Real Estate Investment Trusts (REITs) is set to be implemented by the end of 2013. These will allow companies to list securities that will sell like stock on the securities exchange and at the same time investing in real estate directly, either through properties or mortgages. The predicted economic growth in Kenya is looking to lift property pric¬es higher, and with the demand for housing in the middle and lower end of the property market considerably high, REITs are expected to perform quite well.
7. Kenyan Equity Market Overview

Listing Statement 15th July 201320
The housing sector in Kenya is characterized by inadequate affordable and decent housing. Low-level urban home ownership is estimated at 16 percent with the presence of expansive slums and informal settlements. It is estimated that out of a total 200,000 housing units required annually in urban areas, only 35,000 units are produced. The shortage of housing for low-income households is particularly acute in urban areas, with only 20 per cent of houses produced catering for this group. Some of the challenges that have contributed to this acute shortage are further discussed be-low.
Investment in the housing sector has also been minimal and sporadic. This is as a result of lack of an enabling environ-ment for private sector participation in the housing deliv-ery process particularly for lower middle and low-income groups; low government funding; high cost of finance; lack of serviced land; high cost of building and construction ma-terials; inappropriate building and construction technolo-gies; limited research on low cost building materials and construction technologies; stringent planning regulations and standards and high cost of infrastructure.
8.1. Demand/ Supply for housingThe Kenyan urban housing sector is characterized by in-adequate affordable and decent rental housing options, low-level of home ownership (about 16%), extensive and inappropriate dwelling units including slums and squatter settlements. It is estimated that while a total of 200,000 housing units are required annually in the urban areas to ca-ter for the backlog, only about 35,000 units are developed every year.
The low and middle income class forms a high proportion of the Kenyan population and the trend is expected to contin-ue increasing. Increase in population especially in the urban and peri-urban areas pushes up the demand for housing units and hence more pressure is currently on the supply of affordable housing units for this populace. However, due to the fact that the supply of houses mainly depends on land, the challenge has always been the cost of land and its availability. The price of land in urban areas has contin-ued to increase over the years beyond the reach of many Kenyans. This is a major obstacle towards affordable hous-ing developments. Due to the continued improvements in infrastructure by the GoK especially on roads, electric-ity and water, accessibility to the central business district will be easier and hence reduce congestion in CBD and its proximity. This will lead to establishment of further property developments in the Nairobi metropolitan areas including Kitengela, Ruiru, Thika and Kiambu.
The above projections create a great opportunity for in-vesting in housing in Kenya with the demand for housing expected to increase further due to various contributing factors.
8.2. EconomyThe Monetary Policy Committee (MPC) lowered further the CBR to 11.0% in the months of November and December 2012 from 13.0% in October 2012 on account of sustained decline in inflationary pressures, short term money market rates and stability of the exchange rates. Nevertheless, mortgage lending is still accessible to only a minority main-ly due to high interest rates experienced throughout the year. A recent report titled “2012 Yearbook: Housing Fi-nance in Africa” indicates that only 1.1% of the top 60.0% of income earners in Kenya have a mortgage while 3.4% have loans for home construction. This is against a backdrop of high financial inclusion estimated at 76.0% of urban persons aged 15 years and above having a bank account with a for-mal financial institution.
The Retirement Benefits Authority (RBA) allows pension contributions of up to 60.0% to be used to secure a mort-gage. Kenya also has an emerging housing micro finance sector through SACCOs and NGOs catering for the lower end of the pyramid. According to the above report, these avenues have the potential to leverage assets worth KES 290.0bn and increase access for lower earning people who have accumulated substantial pension. The biggest players in this sector are Jamii Bora and NACHU who are currently developing several low cost housing estates in various parts of the country.
Furthermore, the commissioning of the National Land Commission is expected to spur further activity in the real estate sector.
8.3. Growing Middle Income Class Putting Pressure on the Residential SegmentOver the last seven years, a number of Kenyans have joined the middle income class due to improved economic activi-ties that have opened up new job opportunities. The num-bers of Kenyans who have joined the middle income class have increased from 2.9 million as at 2006 to 5.2 million as at July 2012. The wage bills have also grown over the pe-riod thus leaving the middle income class with reasonable disposal income to invest in capital goods such as housing.
The growth in the middle income class on the back of im-proved economic conditions has resulted in increased de-mand of residential housing that so far outstretches the
8. Overview of the Housing and Real Estate Sector

Listing Statement 15th July 2013 21
current market supply. Consequently, residential property mostly in the middle and upper income category has seen a price surge. The sales prices have grown by an estimated 50.0% since 2006, a clear indication of inadequate supply within the prop-erty market.Figure 1: Hass Composite Sales Index
Source: Hass Consultants
8.4. Remittance from abroadRemittances from abroad have grown by over 100.0% since 2006 to USD 891.1 million as at end of 2011 and USD 1,170.9 mil-lion as at December 2012. The growth in diaspora remittance has been driven by good economic prospects in developed economies as well as availability of investment opportunities in Kenya. Part of this remittance has remained invested in the property market. This trend is expected to continue in future creating more demand within the housing sub-sector.Figure 2: Remittances from abroad
Note:* refers to remittances for the period ending February 2013
Source: CBK
8. Overview of the Housing and Real Estate Sector(Continues)
2006 2007 2008 2009 2010 2011 2012*
Kenyan Population (million) 36.1 37.2 38.3 38.6 39.8 41.6 43.0
% of Middle Income 8.0% 10.0% 10.0% 10.0% 11.0% 12.0% 12.0%
No. of Middle Income Class (million) 2.9 3.7 3.8 3.9 4.4 5.0 5.2
*CIA Estimates as at July 2012Source: KNBS, CIA World Factbook and NIC Capital Estimates

Listing Statement 15th July 201322
8.5. East African Community HubThe East African Community is one of the fastest growing regions in the world. Over the last decade, the region has experienced average growth of 5.8%, the second-highest of any economic block in the world, just below ASEAN (which grew at 6.1%). The EAC’s growth has been fueled by rapidly growing trade between the EAC countries, which tripled in value over the last decade and could further increase. The EAC has also experienced unprecedented demographic growth, with a population growth of more than 30% over the last decade, from 110 million people in 2002 to 145 mil-lion people in 2012. By 2030, the five EAC countries will be home to an important market with a population of about 200 million.
The growth of the East African Community will also augur well for Kenya with Nairobi as the preferred central hub for the other member countries. This will lead to international corporates with interest in the East African market setting up shops in Kenya. This would at the same time create new opportunities for both Kenyans and other East Africans, leading to further demand for housing as more people look to settle in Nairobi and its neighboring towns.
8.6. Market StatusProperty values have increased by 3.14 times since 2000. The Hass Composite Sales index shows a property price rise of 1.3% in the first quarter of 2012 and a 0.9% rise in the last year.
The annual average is representative of the average price of all properties offered for sale in Kenya. The average val-ue for a property has increased from KES 7.1 million in De-cember 2000 to KES 22.5 million in June 2012. The average value for a 4-6 bedroom property is currently KES 31.4 mil-lion while the average value for a 1-3 bedroom property is currently KES 11.1 million.
The Mix by Year is a measure of the percentage that each type of property represents in the market. In 2001, Apart-ments took up 23.5% of the market, Town Houses 24.5% of the market and Stand Alone Houses 52% of the market.
In 2012 however, Apartments took up 43.6% of the market, Town Houses 26.9% of the market and Stand Alone Houses 29.5% of the market.Source: HassConsult
8.7. Property Market TrendsDemand for housing, particularly in urban areas, has contin-ued to rise without requisite movement on the supply side.
This has pushed prices up making the houses affordable to very few. Scarcity of well-located land in the city of Nairo-bi for example, has directed housing development along Mombasa and Kangundo Roads where land is still available at relatively lower prices.
In the process, the redevelopment option has been pur-sued by various developers. There is heightened activity in the development of apartments, to meet the ever increas-ing demand, in hitherto single family residential neighbour-hoods of Kilimani, Kileleshwa and Lavington, with a view to minimize the costs of running single family residential homes (security/ gardener/ ground maintenance/ garbage collection/ utility bills etc). Source: National Housing Corporation
8.8. Recent developments in the housing sectorThe Government of Kenya is strategic in ensuring that the vision of “an adequately and decently-housed nation in a sustainable environment” is realized. The GoK has a mix-ture of various initiatives in place to facilitate the production of 200,000 housing units annually by 2012 in order to fill the huge housing gap in the country including:• Implementation, review, monitoring and evaluation of
the National Housing Policy to facilitate provision of ad-equate shelter and a healthy living environment at an affordable cost to all social economic groups in order to foster sustainable human settlements.
• Implementationof incentivesandmarket re-engineer-ing measures to attract private sector investment in the housing sector in favour of low income groups.
• Promotionof lowcosthousingbuildingmaterialsandappropriate construction technologies.
• Conducting a housing survey to provide data and in-form investment in housing.
• Coordinationofstakeholdersinthehousingandhumansettlements sector at local, national, regional and inter-national level to inform housing policy.
• Improvement of landlord-tenancy relations to createconfidence in the housing market.
• Facilitatingprovisionofhousinginfrastructuretoopenup new areas for housing.
• ProvisionofloanfacilitiestoCivilServantsforpurchaseor construction of residential houses.
• Developinghousingunitsforsaleandforrentalbycivilservants.
• Inculcatingamaintenanceculturetoprolongtheeco-nomic lives of the developed housing stock.
• Provision of effective and efficient services in estatemanagement.
8. Overview of the Housing and Real Estate Sector(Continues)

Listing Statement 15th July 2013 23
8.9. Market Outlook8.9.1. Residential MarketHigh levels of inflation and interest rates in 2011 and 2012 had a severe negative impact on house prices, especially for those with variable interest rate mortgages. Borrowers who had taken out loans at the edge of their affordability found they were unable to manage the increased monthly costs with interest rates going up as high as 30.0%. Howev-er, the sector is slowly recovering following the reduction of interest rates to between 15.0%-20.0%. The financiers man-aged the situation by restructuring the loan terms instead of increasing the monthly repayments thereby maintaining a low level of non-performing loans.
Underlying demand for development land is still very high despite the skyrocketing land prices. The sector has also received a boost with the commencement of infrastructure construction of Tatu City, the proposed satellite city in Ken-ya which is set to continue following a court ruling against a winding up call. Demand for high end residential Town Houses and Stand Alone Houses on large acreages within the preferred suburbs continues to grow with asking rents reaching as high as USD 5,900 for a six bed-roomed house on 3 acres in Karen. Part of this demand is attributed to the expatriate community. The sector is expected to recover with interest rates slowly dropping and a relatively stable economy, together with the successful general election.
8.9.2. Retail MarketThe fourth quarter of 2012 continued to see a proliferation of decentralized urban shopping malls in major cities and towns. Buoyed by an expanding middle class, improved in-frastructure and an enduring property boom, supermarkets have continued to grow their market share and penetration outside the capital city as they become the preferred shop-ping outlets for many middle and high-income consum-ers in towns. Several supermarkets opened new branches across the country including Naivas at the Greenhouse on Ngong road, Nairobi and Nakumatt at Oasis Mall in Malin-di. Oasis Mall achieved a pre-let rate of over 85.0% with the line shop tenants beginning their fit-outs from 01 December 2012 with a trading date of 01 February 2013. Mtwapa Mall anchored by Tuskys, the first and only contemporary retail centre in this area opened its doors in June 2012 and has transformed the retail atmosphere in the neighbourhood.
Marketing and letting have been intensified for proposed retail centers across the country. Garden City Mall on Thika
Road and Two Rivers in Runda, Nairobi, continued to record strong interest from both local and international retailers who are seeking entry into the expanding local retail scene. Pre-letting of Garden City Mall stood at approximately 50.0% as at December 2012.
8.9.3. Office MarketThe office market continued to witness high take up of new developments especially in Westlands and Waiyaki Way in Nairobi. Delta Corner and Skypark Towers which were com-pleted in the 4th quarter supplying approximately 32,000 square metres achieved 100.0% take up by year end. Sky-park achieved about 90.0% letting before completion. De-mand for office space along Mombasa Road which is tra-ditionally a quasi-industrial node remained low during the quarter with most projects struggling to achieve 100.0% occupancy long after completion. UpperHill area record-ed limited supply of space in 2012, although most of the projects in this locality are due for delivery in 2013/2014. Parklands area is a new hot spot for commercial develop-ments as it has witnessed numerous changes of user from residential to commercial. High construction and financing costs continued to eat into the rental yields and may have adverse effects on the sector if the present market param-eters persist. Office sales were low and far between in the market in 2012. The last quarter of 2012 recorded sale pric-es for office premises ranging between USD 1,400 to USD 2,000 per square metre depending mainly on size and loca-tion. Average asking rents for new projects ranged between USD 11-13 per square meter per month exclusive of service charge and value added tax during the same period.
8.9.4. Industrial MarketThe industrial market which has largely been owner occu-pied in the past is set to witness a major boost following the recent launch of the 5,000 acre Konza Technopolis. Accord-ing to the Government, phase 1 of the proposed Technop-olis dubbed “The African Silicon Savannah” has attracted major local service industry players, boosting its chances of success as foreign firms also line up for space in the project.
The flagship project under the Vision 2030 economic blue-print is set to position Kenya as the ICT powerhouse in Eastern Africa. It will house an international financial centre, a convention centre and a light electronic manufacturing plant. The city will be part of the Special Economic Zones that will replace the EPZs and is anticipated to create some 200,000 jobs.
8. Overview of the Housing and Real Estate Sector(Continues)

Listing Statement 15th July 201324
Table 2: Rental Prices and Yields
Prime Rents Prime Yield
Residential US$4,400 per month* 6%
Retail US$31.0 per sq m per month
10%
Offices US$15.0 per sq m per month
9%
Industrial US$4 per sq m per month 12%
*4 bedroom executive house – prime location
Source: Knight Frank LLP
8.10. Housing market projectionsWith increased investment from private sector and different incentives put in place by the government, it is estimated that a total of 4.3 million housing units will be produced
between 2008 and 2030. Of these, 2.2 million units repre-senting 52% of the total will be for low income urban house-holds.
Source: Ministry of Housing
8. Overview of the Housing and Real Estate Sector(Continues)

Listing Statement 15th July 2013 25
9. Information on the Company
9.1. History and Background of Home AfrikaHome Afrika Limited was incorporated on July 17, 2008 with Certificate Number C.157971 which was changed to C. 8/2011 following its conversion into a public company. It was initially established as a private company owned by Home Afrika Continental Limited and Home Afrika Invest-ments Limited holding fifty percent (50%) each.
The main objective for which the Company was incorporat-ed was for property development and management. The Company also has the power to establish and invest in sub-sidiaries for purposes of furthering its business objective, in line with the Company’s present business. In line with its business, the Company either directly or through its various subsidiaries owns several properties further outlined in sec-tion 9.4 of this Listing Statement.
9.2. Key Milestones
9.3. Operational OverviewHome Afrika Limited is a Public Company formed in 2008 that aims to grow to be the largest Real Estate Developer in Africa. Home Afrika seeks to provide quality, sustainable and affordable housing around Africa. Home Afrika Limited has 128 founder shareholder members that have contrib-uted to the phenomenal growth of the Company. Chaired by Arch. Lee G. Karuri OGW, the Board of Directors is com-mitted and devoted to ensuring that Home Afrika Limited enhances stakeholder value by laying strategies for growth.
The areas of growth for HAL include undertaking property development and management within Kenya. The devolved government system in Kenya has opened up opportunities for county development and HAL’s “Go County” Strategy. Another critical growth area for Home Afrika Ltd that will see it moving into regional countries of Tanzania, Uganda,
Southern Sudan, Ethiopia and Rwanda is through its “Go Africa” Strategy.
The Company is focused on listing on the newly developed segment on the Nairobi Securities Exchange the Growth Enterprise Market Segment (GEMS). The GEMS market allows small and medium sized Companies to raise sub-stantial initial and ongoing capital, while benefiting from in-crease profile and liquidity within a regulatory environment designed specifically to the Company’s needs.
Home Afrika Limited is currently involved in three (3) proj-ects valued at over KES 10.0bn and is focusing on under-taking seven (7) to ten (10) projects as part of its 5 year Strategic Plan. This remarkable growth plan seeks to push Home Afrika to achieve its strategic objective of attaining a project turnover of USD 1.0bn within the next five (5) years.
9.4. Home Afrika Limited and its Subsidiaries9.4.1. Completed Projects9.4.1.1. Morningside Office ParkMorningside Office Park is Home Afrika’s premier project. A signature development on Ngong Road, it was designed as a preferred business address for professionals and medium sized businesses seeking office space within easy access to the Central Business District.
The Office Park is a modern, uniquely designed and envi-ronmentally friendly building. Established through a Joint Venture (JV) company known as Suburban Limited, the proj-ect is complete and is professionally managed by Morning-side Office Park Limited which is the management compa-ny owned by the buyers. Morningside Office Park Limited has 36 office suites and offers basement parking, roof top gardens and conference facilities to its buyers.
9.4.2. Current Projects9.4.2.1. Migaa - KiambuMigaa is a master piece development that provides the ul-timate backdrop for an extra ordinary and affordable life with its theme ‘Explore Life’. Migaa provides an astounding array of amenities such as an 18 hole golf course, over four thousand homes, hotels, schools, a world class hospital, rec-reational facilities as well as a commercial center and office park. Set on a sprawling 774 acres in the Kiambu County, Migaa is set around new infrastructure developments in the area, including by-passes, highways, and in close proximity to JKIA and Westlands.
Established through a joint venture company Home Afrika Communities, the project has achieved one of the highest

Listing Statement 15th July 201326
9. Information on the Company (Continues)
capital gains in the region, and is highly rated by the bank-ing industry due to its consistency in achieving its financial goals.
With the Infrastructural development well under course, Mi-gaa will provide an impressive menu of amenities including the afore mentioned 18-hole Golf Course, various sporting and recreational facilities, hospitality services, commercial nodes , shopping centers and restaurants in addition to ed-ucation, medical and communal facilities.
Migaa is being developed by a Special Purpose Vehicle (SPV), Home Afrika Communities Ltd in which Home Afrika has 60% shareholding. The Project is in progress and is ex-pected to be complete in the next 5 years.
9.4.2.2. Mitini Scapes – in MigaaMitini Scapes was incorporated in April 2011 with the pur-pose of developing over two hundred and fifty homes in Migaa on 14.4 acres in three phases; each phase being completed within a calendar year. This residential devel-opment consists of various house types including Duplex Apartments, Value Cottages, Superior Value Cottages as well as Studio Apartments. With phase one of construction ongoing, Mitini Scapes homes are nearly complete, with show houses that were completed at the end of June 2013. Mitini Scapes will be surrounded by a signature collection of amenities including golf, sporting and recreational facil-ities, hospitality services, education and medical facilities.
9.4.3. New Projects9.4.3.1. Kikwetu – Machakos CountyThe Site Kikwetu will be set on 1,000 acres in Machakos Ranch, lo-cated off Nairobi-Mombasa highway, approximately 60km from Nairobi. The site is located in an area that enjoys ex-cellent connectivity with all modes of transport including highways, bypasses, rail and air. The plot stretches all the way to the railway line and there is a seasonal stream flow-ing into it. The site lies along the railway line, 20km from proposed Konza ICT City and the development shall estab-lish a commuter train station for its residents’ transport. The site shall have access to a nearby planned conservancy.
The Development Concept The Proposed development for the 1,000 acres will be mostly residential for low to middle income earners. The complete development shall have a population of 60,000-100,000.
The objective of this project is to roll out a mixed use devel-
opment to provide affordable and quality housing for the low to middle income earners. These shall vary from low cost houses to middle income apartments and stand- alone town houses. The concept includes:
i. Home Afrika aims to construct 10,000 housing units within 5 years; this shall be by leveraging existing con-struction technology to enhance construction speed.
ii. Home Afrika plans to roll out its flagship product, a pro-totype house which shall sell to the public at approxi-mately one million shillings taking into account the cost of land, design, statutory costs, infrastructure, legal fees and take into consideration a developer’s profit.
9.4.3.2. Lakeview Heights – Kisumu CountyThe Site Riat Hills is a scenic 87 acre plot in 2 parcels of land situat-ed along the Kisumu-Kakamega Road and just 10 minutes drive from the city centre. Only 3 Km away from the airport, the area has excellent views of Kisumu Airport, Kisumu City and Lake Victoria. The site is located in an area that enjoys excellent connectivity with all modes of transport - High-ways, Bypasses, Waterways and the Airport and is only a 2 hour drive to Uganda. Riat Hills lies on a gentle sloping terrain with volcanic soil and loose rocks reminiscent of Kitisuru and New Muthaiga in Nairobi and Champagne Ridge in Olepolos. It is cool compared to the high tem-peratures around the city centre Kisumu is and will benefit from planned investments and increased activity by NGO’s.
The Development Concept Lakeview Heights is 87 (+/-) acres of prime property, located on Riat Hills, Kisumu County. The development strategy is 50-50; 50% of the land sold as serviced plots and 50% to be developed. Proposed development for the land will be mostly residential for middle to upper income earners. The projected period for complete development and sale is 36 Months.
9.4.3.3. Llango – Kwale CountyThe Site A 44 acre block (2 parcels) with a 250m frontage to the Indi-an Ocean, 2km off Mombasa-Lunga Lunga highway it is lo-cated 0.5km north of Maweni Beach Cottages and only 4km from Tiwi Beach Resort. This is a prime location with the construction of Dongo Kundu bypass road joining Momba-sa-Nairobi and Mombasa Lunga Lunga highways. This area has great opportunity for growth from investor interest ow-ing to its strategic location between Mombasa and Diani. The Project has great potential from neighboring develop-ments ranging from tourist hotels, cottages, and holiday homes.

Listing Statement 15th July 2013 27
The Development Concept The development strategy is 50-50; 50% of the land sold as serviced plots and 50% of it is to be developed. Proposed devel-opment for the land will be mostly residential for middle to upper income earners.
9.5. Organization Structure
9.6. EmployeesAs at 31 December 2012, the Group had a total workforce of 37 employees. The breakdown by subsidiary is shown below:
9.6.1. Home Afrika Limited
Permanent Temporary
Personnel 11 0
9.6.2. Home Afrika Communities Limited
Permanent Temporary
Personnel 20 0
9.6.3. Mitini Scapes
Permanent Temporary
Personnel 4 0
9.6.4. Morningside Management Limited
Permanent Temporary
Personnel 2 0
9. Information on the Company (Continues)

Listing Statement 15th July 201328
9.7. Senior Management
Home Afrika Limited Management Team
Gerald ChegeAge: 44Chief Executive Officer
Mr. Gerald Chege is the Chief Executive Officer of HAL and is a highly experienced oper-ational executive with over 15 years of hands on experience. He holds an Executive MBA from Columbia Business School in Finance and Marketing and further degrees in Bachelor of Science in Agricultural Economics and Engineering and a Telco Engineer certification. He has worked for MCI-WorldCom- a facility based provider of ICT in New York as Implementation Management Engineering Director covering global and government institutional accounts and focusing on technical support, customer retention, revenue realization and aggregation.
Mr. Chege has also worked as the Chief Finance Officer and President for Shasini Enterprise LLC a real estate development concern in areas of investment and asset management, fo-cusing on market strategy for real estate investments, business development and enterprise growth.
Mr. Chege has also worked as the Chief Finance Officer and President for Shasini Enterprise LLC a real estate development concern in areas of investment and asset management, fo-cusing on market strategy for real estate investments, business development and enterprise growth.
His other areas of focus include organization critical business requirement such as risk man-agement, due diligence and analysis of investment opportunities, real asset management, brand development, corporate strategy, business compliance and corporate governance. He has substantial knowledge in international business best practice and use of technology and market information to innovate.
Mr. Chege has recently worked for Star Tech Africa as the Chief Strategist and CEO, man-dated to build the business through sourcing of finance and ensuring service delivery for the Kenya office, eventually covering the entire Africa Region.
Simon Kabachia GichiniAge:31Finance Manager
Simon is a graduate of Moi University with a Bachelors degree in Business Management spe-cializing in Finance and Banking. Mr. Gichini is a CPA (K) and registered member with ICPAK. Simon is currently pursuing a Masters in Strategic Management at the University of Nairobi. He has over five years experience having worked for various audit firms including JW Muigai & Associates, Kangethe & Associates and is experienced in Audit, Tax and Financial Report-ing. His responsibility at Home Afrika Limited including the subsidiary level is to ensure that the financial activities are utilized in the most efficient manner, ensuring profitability, growth and goodwill of Home Afrika Limited.
Ruth Wanjiru WanyoikeAge:25HR/ Administration Man-ager
Ruth is the Human Resource & Administration Manager at Home Afrika. She is a graduate of Daystar University with a Bachelor of Arts degree with a Double Major in Psychology and So-cial Work. Ms. Wanyoike also holds a Higher Diploma in Human Resource Management from the Institute of Human Resource Management. She has over four years of experience hav-ing worked in several sectors, acquiring immense knowledge in human relations and man-agement of staff. Ruth’s areas of specialization include human resource management with a strong emphasis on recruiting and performance management. Ms. Wanyoike manages all Home Afrika’s and Subsidiary Companies’ corporate events, public relations and shareholder relations for and behalf of Home Afrika Ltd and the subsidiaries. Her responsibility is to en-sure proper allocation of human capital in Home Afrika Ltd and its subsidiaries and develop and implement policy and procedures in the organization. Her responsibility also includes attending to board matters and ensuring smooth implementation of key action items from the CEO’s Office.
9. Information on the Company (Continues)

Listing Statement 15th July 2013 29
Stephen Kagume KibiruAge: 28Project Manager
Steve is the Project Manager at Home Afrika. He is a graduate of Jomo Kenyatta University of Agriculture and Technology with a Bachelors of Science degree in Construction Manage-ment, a member of the Chartered Institute of Banking as well as a Member of the Archi-tectural Association of Kenya. Mr. Kagume is creative, practical and well informed having worked in both construction and architectural firms for over 3 years. Mr. Kagume’s areas of specialization include construction technology, structural design and project management. His responsibility is to ensure that prospective projects meet the legal, technical and financial due diligence requirements of each project.
Paul Kanyi Age:29IT Manager
Paul is a graduate of Makerere University with a Bachelors of Science degree specializing in Computer Science. Mr. Kanyi is also a Certified Microsoft Professional. Paul is currently pur-suing a Masters of Science in Project Management at the Jomo Kenyatta University of Kenya. He has three years experience and has worked at Kenya Airports Authority and Makerere Community Church. His responsibility at Home Afrika Limited as well as at subsidiary level is to ensure streamlined operations of IT Systems and the development and maintenance of IT systems across the board. His responsibility for the alignment of IT systems is critical in achieving business objectives.
9.8. Board of DirectorsSummary profiles of the Company’s directors:
Home Afrika Limited Board of Directors
Lee KaruriAge: 49Chairman (Non-Executive, Non-Independent)
Mr. Lee Karuri has been an architect for over 20 years. He obtained his Bachelor of Architec-ture from the University of Nairobi in 1989, and thereafter registered as an Architect by the Board of Registration of Architects and Quantity Surveyors in 1993.
He has previously served as Chairman of the Kenya Private Sector Alliance (KEPSA), honored by the state with the Order of the Grand Worrier (OGW) in 2004 for national services.
He has previously served as Chairman of the Kenya Private Sector Alliance (KEPSA), honored by the state with the Order of the Grand Worrier (OGW) in 2004 for national services.
Dr. Mbira GikonyoAge: 50Vice Chairman(Non-Executive, Non-Independent)
Dr. Mbira Gikonyo is the Vice Chairman of HAL and is also a consultant specialist medical practitioner specializing in Ear Nose and Throat (ENT) medicine. In addition to Head and Neck Surgery. He is also the founder and Director of Danica Hearing Centre, a state of the art hearing centre specializing in neuro-otology.
Dr. Mbira served as a research officer in KEMRI in 1993, HASS Group in South Africa as their Chief Medical Director, Magnatone Inc, Phonak AG, Switzerland and Fercom in Denmark.
Eng. Mbugua KamauAge:51Director(Non-Executive, Independent)
Eng. Mbugua Kamau is the Treasurer at Home Afrika Ltd and he brings to the Board skills in Strategic Management, Project Management and Business development.
Mr Mbugua holds a Bachelor of Science Degree in Civil Engineering, and an MBA from East-ern and Southern Africa Management Institute. He has previously served as the Managing Director of Transfleet (EPZ) Ltd, Business Development Manager of Mugoya Group, worked for Sir Alex Gibb and Partners as well as Steel Structures Limited.
Dan AwendoAge:41Director(Non-Executive, Independent)
Mr. Dan Awendo is the Chief Executive Officer of InvesteQ CAPITAL Limited. He brings his extensive experience in Finance to the board and he sits on the Finance & Admin Committee.
Mr. Awendo is a Certified Public Accountant Finalist-C.P.A (K). He holds a Diploma from the institute of Data Processing Management (I.D.P.M) and has previously held position of Senior Consultant in Dominion Consultants Group and Group Accountant and General Manager of Loita Holdings Corporation Group.
9. Information on the Company (Continues)

Listing Statement 15th July 201330
Nyagah KithinjiAge: 53Director(Non-Executive, Independent)
Mr. Nyagah Kithinji is a partner in Costwise Associates, a Quantity Surveying and Project Management Consultancy Firm. He serves in the Business Development Committee and he oversees and evaluates prospective projects for HAL.
He holds a Bachelor of Arts degree in Building Economics, a Masters in Building Manage-ment, an LLB from UNISA and is pursuing Masters of Science in Construction Law and Arbi-tration at Robert Gordon University in Scotland as well as a Post Graduated Diploma in Law at Kenya School of law. He is a Registered Quantity Surveyor with the Board of Registration of Architects and Quantity Surveyors. He practices Quantity Surveying, Project Management, Contract Administration and Arbitration.
Lucy MainaAge: 48Director(Executive, Independent)
Miss Lucy Maina is an Executive Director of Home Afrika Ltd She is the founder and Executive Director of Angel Capital Limited. In addition, Lucy is the senior property manager of Consol-idated Bitumen’s Limited, a private Real Estate Company which oversees over 40 rental units
Lucy holds a BA in Economics from the College of Wooster, Ohio, USA, and has insightful familiarity with the real estate sector in Kenya. She serves as a member of the Foundation & Investors club for Home Afrika Limited
Mbugua GecagaAge: 44Director(Non-Executive, Independent)
Mr. Mbugua Gecaga is currently a Director at Mbambu Communications, Clomia Pty Ltd. Zimbawe and Kiota Consultants. He has over 15 years experience in the Brand and Marketing profession.
Mr. Gecaga holds a Bachelor (Hons) Marketing and a MBA from Henley Management Col-lege. He previously worked with British American Tobacco in Kenya, Uganda, Ethiopia and Zimbabwe. He serves in the Business Development Committee for Home Afrika Limited.
Mr. Gilbert KibeAge: 48Director(Non-Executive, Indepen-dent)
Mr. Gilbert Kibe is the Managing Director at Bahati Ridge Development, an integrated res-idential, commercial, educational, medical and recreational project in Thika as well as the Chief Executive Officer of Nairobi Flight Training Institution.
Mr. Kibe is a trained pilot by profession and holds a Bachelor in Aviation Management and an MBA from Moi University. He has previously served as the Chairman of EAGLE Aviation Limited, Director of Kenya Civil Aviation Authority and CEO of National Flight Ltd.
Mr. Ken WathomeAge: 51 Director(Non-Executive, Independent)
Mr. Ken Wathome is a registered and practicing valuer by training, a visionary resourceful business and professional executive with strong interpersonal skills. He has served in several boards and managerial positions in international companies, in a leadership position for key corporate initiatives.
He holds a Bachelor of Arts in Land Economics (Hons) from University of Nairobi and is a registered and practicing valuer. He has a certificate of corporate governance from common wealth Association for Corporate Governance. He serves as the Vice Chair of Kikwetu project in Athi River in the HAL Board.
Mrs. Jane Adam Age: 53Director(Non-Executive, Independent)
Mrs. Jane Adam is the Managing Director and Founder of Travel Collections. Travel Collec-tions is a travel agency focused on medical tourism. Jane Adam is also the Executive Director and founding partner at Nature Expeditions, a leading indigenous and Tour operator com-pany in Kenya.
Mrs. Adams holds a Bachelor of Science in Hospitality and Tourism Management and a Di-ploma in Hotel Management from Kenya Utalii College. Jane has worked in the tours and hospitality industry for over 15 years having worked at various travel agencies. She is a found-er member of Kenya Association of Women in Tourism and serves as the Chair of the Home Afrika Foundation which oversees the community social responsibility projects including the Home Afrika Investors Club.
9. Information on the Company (Continues)

Listing Statement 15th July 2013 31
No director has a direct interest in the shareholding of the Company in excess of 5% of the Company’s total shareholding. There has been no change in the directors’ shareholding between the end of the previous financial year and the date of pub-lication of this Listing Statement.
There has been no change in the controlling shareholders and trading objectives of the company during the previous three financial years. Furthermore, there are no experts employed on a contingent basis.
9.9. Competence and Suitability of Directors and ManagementAs at the date of the application and for a period of at least two years prior to the date of the application, no director or senior manager of HAL has:• Hadanypetitionunderbankruptcylawspendingorthreatenedagainstthedirectors(forindividuals),orseniormanagers,
or any winding-up petition pending or threatened against it (for corporate bodies).• Hadanycriminalproceedingsinwhichthedirectororseniormanagerwasconvictedoffraudoranycriminaloffenceor
action either within or outside Kenya.• Beenthesubjectofanyrulingofacourtofcompetentjurisdictionoranygovernmentalbodythatpermanentlyortem-
porarily prohibits such director or senior manager from acting as an investment adviser or as a director or employee of a stockbroker, dealer or any financial institution or engaging in any type or business practice or activity.
9.10. Shareholding and Corporate Governance9.10.1. ShareholdersThe following were the subscribers of the Memorandum and Articles of Association of the Company at incorporation:
• LeeGitutoKaruri• GeoffreyMbuguaKamau• SusanKasinga• LucyWanjikuMaina• Dr.BenjaminMbiraGikonyo
There has been no change in the controlling shareholders and trading objectives of the company during the previous three financial years. Furthermore, there are no experts employed on a contingent basis, who own any amount of shares in the com-pany or its subsidiaries which is material, or who have a material, direct or indirect economic interest in Home Afrika.
The following are the current shareholders holding in excess of 1.00% of the Company’s total shareholding:
Shareholders Number of Shares % shareholdings
1. Home Afrika Continental Ltd.** 24,000,000 5.92%
2. Home Afrika Investments Ltd.** 20,384,000 5.03%
3. Seyani Brothers & Co. Ltd 10,000,000 2.47%
4. Stimela Co-operative Saving & Credit Society 10,000,000 2.47%
5. YCEO Holdings Limited 10,000,000 2.47%
6. Lee & Consolata Gituto Karuri 10,000,000 2.47%
7. Nyagah Boore & Lillian Wanjiku Kithinji 10,000,000 2.47%
8. Global Equity Ventures Ltd 10,000,000 2.47%
9. Lilian Nduta Githungo 10,000,000 2.47%
10. Patrick Ng’ang’a 10,000,000 2.47%
11. Hansan Investment Ltd 10,000,000 2.47%
12. Wakini Ltd 6,000,000 1.48%
9. Information on the Company (Continues)

Listing Statement 15th July 201332
13. Red Anchor Ltd 6,000,000 1.48%
14. Paul Munyua Ng’ang’a 6,000,000 1.48%
15. Dale Farm & Investments 6,000,000 1.48%
16. Dominic Mbugua Kimani 6,000,000 1.48%
17. Mbugua & Nancy Wanjiku Kamau 6,000,000 1.48%
18. Patrick Devine 6,000,000 1.48%
19. Bucknall Bruton Ltd 6,000,000 1.48%
TOTAL 182,384,000 45.00%Source: Home Afrika Limited
**Home Afrika Continental Limited and Home Afrika Investments Limited each hold shares in the Group in trust for nine (9) and ten (10) individuals respectively.
Category Number of Shares Number of Shareholders %
Less than 100,000 0 0 0.0%
100,000 – 1,000,000 986,660 2 0.2%
More than 1,000,000 404,268,660 111 99.8%
Total 405,255,320 113 100.0%
9.10.2. Corporate Governance PracticesGovernance is the means by which the affairs of an institution are directed and managed thereby promoting corporate ac-countability and business aptness to achieve an optimal shareholder value, whilst simultaneously taking into consideration the interests of other stakeholders. It is premised on the principles of integrity, accountability, prudence and openness.
The Board of directors of Home Afrika Limited is at the core of Home Afrika’s system of corporate governance and is ultimately accountable and responsible for the performance and affairs of the Company. Good corporate governance is regarded as critical to the success of the business of the Company and the board is unreservedly committed to applying the fundamental principles of good governance – transparency, integrity, accountability and responsibility - in all dealings by, in respect of and on behalf of the company.
The Company currently has four Board Committees, the Business Development Committee, Finance, Administration and Human Resource Committee, Project Co-ordination Committee and the Audit, Risk, Legal, Compliance and Nominations Committee.
The board accordingly embraces the principles of good governance as set out in a number of governance frameworks includ-ing the Principles for Corporate Governance in Kenya. The board develops and maintains reporting and meeting procedures for itself and its committees. Regular board meetings are held once a month eleven times in a year beginning in January and special meetings as necessary. Board meetings take place at the company’s offices unless otherwise decided by the board.
The Board may form committees of its members and may delegate any of its powers to any such committee. The frequency of the committee meetings are determined by the individual committee, as stated in the terms of reference for each committee.
The quorum necessary for the transaction of the business of the board is five directors present either personally or by alternate.
9. Information on the Company (Continues)
Listing Statement 15th July 2013 33
9.10.3. Composition of the Board of DirectorsThe Board includes a fair balance between executive and non-executive directors so that no individual or company of individuals’ interests will dominate the board’s decision making process. The following issues are considered in de-termining the board’s composition:
• Attainingadesirableratioofandbalancebetweenthenumber of executive and non-executive directors.
• Ensuringthattheboardcollectivelycontainstheskills,experience and mix of personalities appropriate to the strategic direction of the Company and necessary to se-cure its sound performance.
• Experience, knowledge, skills and personal attributesof current and prospective directors in relation to the needs of the Board as a whole.Succession planning.
The Finance, Administration & Human Resource Commit-tee, in line with its terms of reference, from time to time reviews the general composition of the board and makes appropriate recommendations on the appointment of new executive or non-executive directors.
Irrespective of a director’s special expertise or knowledge and regardless of whether a director is an executive or non-executive director, all members of the Board recognize that they are collectively responsible to shareholders for the performance of the Company. The termination of an employment contract of an execu-tive director will result ipso facto in the termination of their membership of the Board, unless the Board determines otherwise.
9.10.4. Remuneration of the DirectorsThe Finance, Administration & Human Resource Commit-tee is responsible for reviewing non-executive directors’ remuneration and recommending the necessary changes from time to time. In making these recommendations, due consideration must be given to the board’s expectations from directors in terms of time commitments, degree of re-sponsibility and financial condition of the Company.
The committee may request management or external con-sultants to provide necessary information upon which the board may make its determination.
Directors’ remuneration is presented for approval at the An-nual General Meeting.
In determining the compensation for non-executive direc-tors, the Finance, Administration & Human Resource Com-
mittee shall consider the following:• The levelof feescurrentlyearnedbydirectors in their
professional capacity.• The number of hours spent by directors in preparing
for and attending meetings, as well as travel to meeting venues.
• Currentmarketratesapplicabletoorganizationsofsim-ilar size and in the same industry.
• Thecomplexityofthecompany’soperationsandtheex-tent to which directors have to incur additional cost in research on industry developments and other company related matters.
• Thenumberofmeetingsinayear.
The remuneration recommended by the Finance, Admin-istration & Human Resource Committee shall apply to all directors and no director should be involved in fixing their own individual remuneration.
9.10.5. Responsibilities of the BoardThe Board should specifically exercise leadership, enter-prise, integrity and judgment in directing the affairs of the Company in order to achieve continuing prosperity for the Company and its shareholders, and shall at all times act in the best interests of the Company in a manner based on transparency, integrity, accountability and responsibility.
The Board must specifically:• DefineandchartouttheCompany’svision,missionand
values and has ultimate responsibility for the attainment of the Company’s values.
• Determinethebusinessstrategiesandplansthatunder-pin the corporate strategy.
• Discuss and approve strategic plans and annual bud-gets.
• RetainfullandeffectivecontrolovertheCompany,andmonitor management’s implementation of the strategic plans and financial objectives as defined by the board.
• Definelevelsofmateriality,reservingspecificpowerstoitself and delegating other matters with the necessary written authority to management.
• Continuallymonitortheexerciseofdelegatedpowerbymanagement.
• Ensure that a comprehensive system of policies andprocedures is in place, and that appropriate gover-nance structures exist to ensure the smooth, efficient and prudent stewardship of the Company.
• Ensure that thebusinessof theCompany ismanagedwith a view to ensuring that the Company is ethical in all its dealings and exercises corporate social responsibility.
9. Information on the Company (Continues)
Listing Statement 15th July 201334
• Ensure compliance by the Company with all relevantlaws and regulations, audit and accounting principles, and such other principles as may be established by the board from time to time.
• Identify key risks,opportunities and strengths relatingto the Company.
• EnsurethattheCompany’sorganizationalstructureandcapability are appropriate for implementing the chosen strategies.
• Determinemonitoringcriteriatobeusedbytheboard.• Setpolicieson internal control andobtain regularas-
surance that the system is functioning effectively and is effective in managing risks.
• Nominate board members who will add value to theboard processes and arrange for their induction.
• Appointthemanagingdirector,seniorstaff,externalau-ditors and other consultants.
• Discuss, agree and approve annual accounts and re-ports.
• Communicatekeypoliciesandstrategyissuestoseniormanagement.
• Identifyallstakeholdersandensureeffectivecommuni-cation with shareholders and stakeholders.
9.10.6. Board CommitteesThe Board has established the following four committees, whose mandates and terms of reference are spelt out as follows:
9.10.6.1. Business Development CommitteeThe Business Development Committee is a standing com-mittee of the board and its purpose is to assist the board of Home Afrika Ltd. to come up with viable projects that fulfill financial, legal and technical due diligence. The Committee also spearheads the implementation of the “Go County” and “Go Afrika” strategies for and on behalf of Home Afri-ka Ltd. A key function for the Business Development Com-mittee is to develop innovative marketing and branding approaches for all products of Home Afrika Ltd.The composition of the committee is as follows:1. Gilbert Kibe - Chair 2. Nyagah Kithinji – Vice Chair
3. Mbugua Gecaga – Member 4. Dan Chege – Member 5. Capt. Joe Gathecha – Member
9.10.6.2. Finance, Administration and Human Resource CommitteeThe Finance & Administration Committee is a standing Committee of the Board and its purpose is to assist the Board of Home Afrika Ltd in financial risk management, policy formulation and reviewing and approving major fi-nancial transactions. The Committee has been proactive in sourcing funds for the various projects under Home Afrika Limited. The Finance Committee has restructured the Cap-ital Structure of Home Afrika Limited and ensures that the shareholders get a return on their investment. The composition of the committee is as follows:1. Eng. Mbugua Kamau - Chair 2. Dan Awendo – Vice Chair 3. Susan Kasinga – Member 4. Boniface Kamau – Member 5. Dr. Mbira Gikonyo – Member 6. Nyagah Kithinji – Co-opted Member
9.10.6.3. Audit, Risk, Legal, Compliance and Nomina-tions CommitteeThe Audit, Risk, Legal, Compliance and Nominations Com-mittee is a standing Committee of the Board and its pur-pose is to assist the Board of Home Afrika Ltd. to assess the integrity of financial statements, the effectiveness of financial reporting, conduct risk management assessment, provide legal advice to the board, propose new nominees for the board as and when required and to assess the per-formance and effectiveness of directors in the Company.The composition of the committee is as follows:1. Peter Kanaiya - Chair 2. Gerald Muli – Vice chair3. Dr. Njoroge Keige – Member4. Rose Nkonge – Member 5. Muciimi Mbaka – Member 6. Ken Kanyarati – Member 7. Nazima Malik– Member
9. Information on the Company (Continues)

Listing Statement 15th July 2013 35
9.10.7. Other Important Information9.10.7.1. Director emoluments and benefitsThe aggregate directors’ emoluments and benefits for the years ended 31 December 2012, 2011 and 2010 are as follows:
2012KES ‘000
2011KES ‘000
2010KES ‘000
Directors’ fees 10,260 10,260 10,260
Total 10,260 10,260 10,260Source: Home Afrika Limited
There are no arrangements whereby any of the Directors have or have agreed to waive future emoluments and there has been no arrangement for the waiver of emoluments during the past financial year.
There will be no variation to directors’ emoluments and benefits as a consequence of the Listing.
9.10.7.2. Director Service contract arrangementsThere are presently no existing or proposed directors’ service contracts.
9. Information on the Company (Continues)

Listing Statement 15th July 201336
The Operating and Financial Review below is to be read together with this Listing Statement as a whole, including, in partic-ular, the risk factors discussed in the section “Risk Factors” set out in section 11 and the audited financial statements of HAL for the fiscal years ended 31 December, 2009, 2010, 2011 and 2012.
The Group has experienced remarkable growth in revenue in the periods 2009 to 2012. Revenue and profit before tax grew at a CAGR of 558.1% and 370.0% respectively, over the last four years. Revenues grew 61.2% from KES 520.5mn in 2011 to KES 839.1mn in 2012. Profit after tax on the other hand grew 183.6% from a loss of KES 200.5mn in 2011 to profits of KES 167.7mn in 2012. This outstanding performance was mainly attributable to high demand for land and houses which led to huge plot sales at high premiums and management fees over the last four years. Furthermore, excellent finance planning and continuous upgrading of projects with high emphasis on quality assurance contributed to the impressive performance. Home Afrika is looking to attain cumulative turnover of USD 1.0bn by 2017.
10.1. Consolidated Statements of Comprehensive IncomeConsolidated Statement of Comprehensive Income
31 December Year End (KES “000”) 2012 2011 2010 2009 Turnover 839,116 520,477 56,547 2,944 Cost of Sales (331,897) (491,794) (23,309) - 507,219 28,683 33,238 2,944 Expenses Other operating income 5,083 1,709 17,042 8,496 Selling and distribution (42,427) (103,255) (5,189) (8)Administrative Costs (110,572) (113,248) (16,357) (22,011)Other Operating Expenses (21,578) (20,714) (4,512) (2,523)Operating Profit 337,725 (206,824) 24,223 (13,101) Finance Costs (79,876) (78,275) - - Profit Before Tax 257,850 (285,098) 24,223 (13,101) Tax Charge (90,170) 84,643 (9,161) (1,047)Net Profit for the period 167,680 (200,455) 15,062 (14,149)
10. Operational and Financial Review

Listing Statement 15th July 2013 37
10.2. Consolidated Statements of Financial PositionConsolidated Statement of Financial Position
31 December Year End (KES “000”) 2012 2011 2010 2009 Assets Non-Current Assets Property, Plant and Equipment 895,745 770,256 57,414 1,256 Intangible assets 237 473 - - Goodwill on consolidation 74,284 74,284 74,284 - Deposit for shares - - - 75,000 Financial assets 2 - - 49,334 Deferred tax 12,458 86,186 1,305 - 982,726 931,199 133,003 125,590 Current Assets Inventories 1,271,606 1,332,691 632,289 - Trade and other receivables 114,326 50,798 69,042 463 Cash and cash equivalents 153,079 63,590 154,210 38,351 Tax Recoverable - 9,865 - - 1,539,012 1,456,944 855,541 38,814 Total Assets 2,521,736 2,388,143 988,544 164,404 Equities and Liabilities Equity Share Capital 405,255 204 100 100 Share Premium 68,842 456,718 354,471 176,692 Accumulated deficit (84,332) (140,078) (3,901) (14,149) Shareholders’ Funds 389,765 316,844 350,670 162,643 Non controlling interests (20,426) (93,514) 4,864 - 369,339 223,331 355,534 162,643 Liabilities Non-Current Liabilities Preference share capital 150,000 150,000 150,000 -Deposit for shares 50,749 - - - Borrowings 39,865 36,964 159,162 - 240,613 186,964 309,162 - Current Liabilities Tax Payable 5,382 3 10,160 555 Deposits Payable 441 441 441 400 Borrowings 157,247 521,384 159,162 - Trade and other Payables 1,748,716 1,456,021 154,085 807 1,911,783 1,977,848 323,848 1,761 Total Equity and Liabilities 2,521,736 2,388,143 988,544 164,404
10. Operational and Financial Review (Continues)

Listing Statement 15th July 201338
10.3. Consolidated Statements of Cash FlowsConsolidated Statement of Cash Flow
31 December Year End (KES “000”) 2012 2011 2010 2009 Cash Flow from Operating Activities Cash (used)/ generated from operations 632,985 400,830 (538,216) 645 Interest Paid (78,471) (62,743) - -Tax Paid (1,198) (20,260) (860) (493)Net Cash (used) generated from operations 553,316 317,827 (539,077) 152 Cash Flow used in Investing Activities Purchase of Property, Plant and Equipment (133,865) (717,616) (58,140) (1,660)Purchase of intangible assets - (709) - -Disposal of Property and Equipment 981 550 - - Interest Received 1,218 1,053 16,873 3,286 Financial assets (2) - 49,334 (49,334) Deposit for shares - - 716 (75,000)Net Cash used in Investing Activities (131,668) (716,722) (8,782) (122,708) Cash Flow generated from Financing Activities Net movement in bank loan (372,770) 240,024 318,324 - Net movement in finance lease 10,134 - - - Proceeds from shareholders loan 1,400 - - -Preference share capital - - 150,000 - Dividends Paid (38,847) (34,140) - - Proceeds from issue of share capital 0 40 50 100 Proceeds from share premium 17,175 102,352 177,779 160,807 Proceeds from deposits for shares 50,749 - - - Net Cash (used in)/ from financing activities (332,159) (308,275) 646,153 160,907Increase/ (decrease) in Cash and Cash Equivalents 89,489 (90,620) 115,859 38,351 Movement in Cash and Cash Equivalents At Start of Period 63,590 154,210 38,351 - Increase/ (decrease) in Cash and Cash Equivalents 89,489 (90,620) 115,859 38,351 At End of Period 153,079 63,590 154,210 38,351
10. Operational and Financial Review (Continues)

Listing Statement 15th July 2013 39
HAL operates in a complex environment with ever increas-ing competition, greater accountability and higher quality standards of service delivery, which are placing more pres-sure on resources. The group’s activities expose it to a va-riety of financial risks, including credit and liquidity risk, as well as the effects of changes in foreign currency exchange rates and interest rates. All of these factors are contingen-cies which may or may not occur and the group is not in a position to express a view on the likelihood of any such contingency occurring.The implementation of a robust and transparent risk man-agement program becomes increasingly important in or-der for the Group to adapt and meet these challenges in a structured way to continually align its priorities and objec-tives against a background of changing risk and uncertainty.The risk management framework seeks to align business opportunities and the taking of risks to the ever present challenges of the Group in achieving its mission and core objectives. It encompasses the whole spectrum of risk rang-ing from the high level enterprise-wide strategic business risks to individual departmental/section operational risks.
The benefits of implementing a risk management frame-work include the following:• Demonstrating due diligence in planning and day to
day management activities• Promotingproactiveratherthanreactivemanagement
with the early identification and treatment of risks• ImprovingthefocusontheGroup’skeystrategicgoals
leading to:− A more sound basis for strategic planning as key el-
ements of risk have been identified.− More effective allocation of resources to key services
and areas of high risk improving service delivery.− An improved level of accountability and responsibil-
ity.− Better informed decisions about opportunities and
new initiatives/projects.− Avoidance of taking unnecessary opportunistic risks. − An acceptance of the changing patterns of risk and
opportunity in an increasingly competitive environ-ment.
Factors which the group believes may be material for the purpose of assessing the market risks associated with an investment in HAL are described below. The group believes that the factors described represent the principal risks in-herent in investing in HAL. Prospective investors should also internalize the detailed information set out elsewhere in this Listing Statement (including any documents avail-able for inspection) and make individual assessments prior
to making any investment decision.
11.1. Core Risks of the Group11.1.1. Political RiskThe group will be operating in Africa and thus will derive all its revenue from the region. All e group assets and employ-ees will be located in the region. The region is politically young, and has been subject to various forms of political unrest since independence. Kenya, in particular, under-went recent turbulence since the 2007 general elections, although the political situation has been relatively calm since peaceful conclusion of general elections in March 2013 which resulted in the formation of a new government. The challenges for the new government include delivering of the new constitution as well as focusing on the Vision 2030 blueprint as a strategy to transform the country into a middle income economy. National security also remains a fundamental issue that the new government must resolve following unexplained killings and attacks in several parts of the country. 11.2. Risk Factors Relating to the Business11.2.1. Strategic RiskStrategic risks are risks arising from formulation and imple-mentation of strategic and business plans that are inappro-priate and inconsistent with internal factors and the exter-nal environment which may in turn affect earnings, capital fund or viability of the business. To mitigate strategic risks, the board of directors and senior management carefully formulate strategic and business plans, supportive of cor-porate governance, in addition to putting in place internal infrastructure appropriate for implementation of the strate-gic plans.
11.3. Market Risk11.3.1. Competition RiskIntense competition in the real estate sector could impact adversely on growth and profitability of the Group. In the final analysis, the Group may be unable to meet the share-holders expectations. The Group intends to minimize mate-rial adverse effects from severe competition by:• Providingqualityservicestoitscustomerspremisedon
customer equity (value, price and brand equity).• Developingprojectsthataremarketoriented.• Maintainingawellmotivatedworkforceandagents.• Recruitinggoodstaffandcontinuoustrainingandde-
velopment of its workforce.
11.3.2. Liquidity RiskLiquidity risk is the likelihood that an organization will be unable to meet its payment obligations when they fall due.
11. Risk Factors

Listing Statement 15th July 201340
The Group does not have access to a diverse funding base and funds are raised mainly from its shareholders, banks and its own internal resources. The group’s approach to managing liquidity therefore, is to ensure as far as possible that it will always have sufficient liquidity to meet its liabili-ties when they fall due under both normal and stressed con-ditions without the need to incur unacceptable losses, or at the risk of damaging its reputation. The group implements the following core liquidity management strategies:• Theboardhasadoptedariskmanagementframework
for the management of the group’s short, medium and long-term liquidity requirements, thereby ensuring that all financial liabilities are settled as they fall due.
• Continuouslyreviewingforecastsandactualcashflows.• Maintainingbankingfacilitiestocoveranyshortfalls.• Endeavouringtomaintainastablefundingbasebyen-
suring that shareholders’ funds are adequate and that some percentage of earnings is ploughed back into the business.
• Developingpoliciesthatwillensurethatthegroup’sas-sets and liabilities are properly matched.
• Continually assessing liquidity risk by identifying andmonitoring changes in funding required to meet busi-ness goals and targets set in terms of the overall group strategy.
11.3.3. Credit RiskCredit risk arises from the probability that debtors will de-fault on their contractual obligations resulting in financial loss to the Group. Credit risk mainly arises from financial assets and is managed on a group-wide basis. The group does not grade the credit quality of financial assets that are neither past due nor impaired.
Credit risk on financial assets with banking institutions is managed by dealing with institutions with good credit rat-ings and placing limits on deposits that can be held with each institution.
Credit risk on trade receivables is managed by ensuring that credit is extended to customers with an established credit history. The credit history is determined by taking into ac-count the financial position, past experience and other rel-evant factors. Credit is managed by setting the credit limit and the credit period for each customer. The utilization of the credit limits and the credit period is monitored by man-agement on a monthly basis.
11.3.4. Operational riskOperational risk is associated with human error, an inade-
quate information system, technology failures, breach in internal controls, fraud, inadequate training, unforeseen catastrophes and other operational problems that may be encountered within the operating system. Operational risk will exist as long as the group is in operation, but manage-ment has ensured that an effective, integrated operational risk management framework is in place. This includes the following:• Eachdepartmenthasdefinedrolesandresponsibilities
with regard to operational risk management.• Keyrisksareidentified,assessed,controlledandreport-
ed on a continuous basis using appropriate tools and methodologies.
• Operational systemsandproceduresaresubjected toindependent reviews.
• Appropriate insurancetocoverriskssuchasfire, theftand burglary is undertaken with reputable insurance companies.
• A comprehensive system of internal controls is main-tained and systems and procedures to monitor transac-tions are established.
11.3.5. Legal riskInsurance, particularly third party liability insurance, often involves legal contests on the amount of claims payable. At any particular time, there are likely to be various pending litigation issues and the management of these depends on a number of considerations.
The group has set up management structures and policies which permit analysis and assessment of all legal risks and provides for possible losses in order to minimize any ad-verse effects on financial performance.
11.3.6. Information riskInformation risk raises the possibility of harm being caused to a business as a result of a loss of confidentiality, integrity or availability of information. The value add of information technology to the group’s business processes does at the same time increase the level of information risk through in-terception, system failure and inadvertent relay of data to unauthorized persons.
The board of directors regularly evaluates the effectiveness of its information security processes.
11.3.7. Reputation riskReputational risk is the potential that negative publicity regarding an institution’s business practices, whether true or false, will cause a decline in the customer base, costly litigations or revenue reductions. This risk may result from
11. Risk Factors(Continues)

Listing Statement 15th July 2013 41
an institutions’ failure to effectively manage any or all of the other risk types. The ultimate accountability for reputational risk management rests with the board. The board of direc-tors addresses explicitly reputational risk as a distinct and controllable risk to HAL’s safety and soundness through a versatile risk management framework for reputational risk.
11.4. Responsibility for risk managementThe ultimate responsibility for risk management in an or-ganization rests in the hands of the board of directors. Ac-cording to the Institute of Risk Management, the Board of Directors should:• Beawareofthemostsignificantrisksfacingtheorgani-
zation.• Knowthepossibleeffectsonshareholdervalueofdevi-
ations to expected performance ranges.• Ensureappropriatelevelsofriskawarenessthroughout
the organization.• Beawareofhowtheorganizationwillmanageacrisis.
• Knowthe importanceofshareholderconfidence inanorganization.
• Knowhowtomanagecommunicationwiththeinvestorcommunity where applicable.
• Be assured that the risk management processes areworking effectively.
• Publish a clear risk management policy covering theunderlying risk management philosophy and the objec-tives of the policy.
11.5. Risk Factors Relating to this ListingHAL is not in a position to predict whether investor inter-est in HAL after Listing will lead to the development of an active trading market on the NSE or otherwise or how liquid and vibrant the GEMS market might be. The Listing price for the Group’s shares has been determined by HAL in consultation with the Transaction Advisors and may not be indicative of prices that will prevail in the open market following this Listing.
11. Risk Factors (Continues)

Listing Statement 15th July 201342
12.1. General And Legal InformationHome Afrika Limited (hereinafter referred to as “Home Afri-ka” or “the Group”) was incorporated on July 17, 2008 with Certificate Number C.157971. The Group was initially es-tablished as a private company but was later converted into a public company with certificate number C. 8/2011.
12.1.1. Principal ObjectsThe main object for which the Group was incorporated is that of property development and management. The Group also has the power to establish and invest in sub-sidiaries for purposes of furthering its business objective, in line with the Group’s present business.
Home Afrika is a real estate company whose goal is the provision of quality housing not only for Kenya, but for the African Continent in general. To this end, the Group aims at providing affordable low cost housing in Africa as a profit-able and sustainable business.
To achieve this objective, the Group is currently involved in several high, middle and low income real estate devel-opments, the intention being that the Group runs a prof-itable business which will have the technical and financial capacity in the near future to undertake low income hous-ing projects. The Group is therefore currently involved in medium-scale, highly lucrative developments, with the plan being to focus on the growth of the Group.
12.1.2. Articles Of AssociationThe key provisions of the Articles of Association are as fol-lows:
a) The Company is a Public Company. There is therefore no restriction on the number of shareholders, transfer-ability of shares or public offers.
b) Any branch or kind of business which the Company is authorized to undertake may be undertaken by the di-rectors at such time or times as they deem fit.
c) The Company may exercise the powers of paying com-missions conferred by section 55 of the Companies Act (Chapter 486, Laws of Kenya) provided that the com-mission paid or agreed to be paid shall not exceed 10% of the price at which the shares in respect of which the commission is paid, are issued.
d) Preference shares may be issued with the sanction of a special resolution upon the terms that they are or, are at the option of the Company are liable to be redeemed
on such terms and in such manner as the Company may by special resolution determine.
e) The rights conferred upon the holders of the shares of any class issued with preferred or other rights shall not, unless otherwise expressly provided by the terms of the issue of the shares of that class, be deemed to be varied by the creation or issue of further shares ranking pari passu therewith.
f) Where the directors propose to issue any shares, they shall first offer them to the members (other than pref-erence shareholders not specifically entitled to them under the terms of issue of their preference shares) in proportion as nearly as may be to the number of shares held by them.
g) Notwithstanding the pre-emptive rights above, the di-rectors may allot and issue to the Trustees of any Em-ployee Share Option Plan (ESOP).
h) The Company shall have a first and paramount lien on every share (not being a fully paid share) for all mon-eys in respect of that share and the Company shall also have a first and paramount lien on all shares (including paid up shares) standing registered in the name of any person for all moneys presently payable by him or his estate to the Company.
i) Pursuant to and subject to the Central Depositories Act, 2000, title to immobilized and dematerialized shares will be evidenced otherwise than by a certificate and title to such shares shall be transferred by means of book-entry transfer in accordance with the provisions of the Central Depositories Act, 2000.
j) Quorum for general meetings is fifty members present by person or by proxy or represented in accordance with article 89, together holding in aggregate not less than 20% of the issued share capital of the Company.
k) At any general meeting, a resolution put to the vote shall be decided on a show of hands unless a poll is demanded by either the chairman, ten members pres-ent in person or by proxy or by any member present in person or by proxy and representing not less than one-tenth of the total voting rights of all the members having the right to vote at the meeting.
l) The Company may sell any shares or stock of a member or any share or stock to which a person is entitled by transmission if:
12. Statutory and General Information

Listing Statement 15th July 2013 43
i. For a period of six years no cheques or warrant sent by the Company has been cashed.
ii. No communication has been received from the mem-ber or any other person entitled and during such period at least three (3) dividends in respect of the shares or stock have been declared payable by the Company.
iii. The Company has at the expiration of the said six year period by advertisement in a newspaper of national cir-culation given notice of its intention to sell such shares or stocks and has not during the six years preceding and six months after the advertisement received any in-formation reasonably satisfactory to the Directors as to either the actual whereabouts or the actual existence of the member or entitled person.
iv. The Company (if being then listed on a Securities Ex-change) has given notice to the Security Exchange on which it is listed of its intention to make the sale.
m) The number of directors shall not be less than seven (7) or more than ten (10) in number unless and until other-wise determined by a special resolution.
n) At the first Annual General Meeting after the initial public offering all the Directors other than the manag-ing director and any other director being at the time at the employ of the Company or any of its subsidiaries shall retire from office. At the annual general meeting in every subsequent year one third of the Directors other than the managing director and any other director be-ing at the time at the employ of the Company or any of its subsidiaries, for the time being, if their number is not three or a multiple of three, then the number nearest to, but not less than one third shall retire from office.
o) A director who retires from office is eligible for re-elec-tion.
p) The following matters are reserved for the general meeting:
i. A material modification to the investment policy of the Company.
ii. Decisions concerning the dividend policy of the Com-pany.
iii. Any material change in the nature of the Company’s business.
iv. The granting of any loans by the Company to a Director or any person.
q) Quorum necessary for directors’ meetings shall be a majority in number of the Directors for the time present either personally or by alternate.
r) The directors may with the approval of the general meeting by special resolution establish one or more Employee Share Option schemes (ESOP) and/or Em-ployee Share Purchase Schemes (ESPS).
s) The Directors may exercise all the powers of the Com-pany to borrow or raise money and to mortgage or charge its undertaking, property and uncalled capital and to issue debentures, debenture stock, legal and equitable mortgages and charges and other securities whether outright or as security (principal or collateral) for any debt, liability or obligation of the Company or of any third party.
t) The Directors, other than those whose remuneration is determined by agreement between them and the Com-pany, shall be entitled to such remuneration for their services as the Company may, from time to time, in gen-eral meeting determine.
u) A Director may not, without the consent of the gener-al meeting, contract with and be interested in any way, whether directly or indirectly, in any actual or proposed contract or arrangement with the Company, either as vendor, purchaser or otherwise.
v) The office of Director shall be vacated if the Director:
i. Ceases to be or is prohibited from being a Director by virtue of any provision of The Companies Act.
ii. Becomes bankrupt or makes any arrangement with his creditors generally.
iii. Becomes incapable by reason of mental disorder of ex-ercising his functions as Director.
iv. Resigns his office by notice in writing to the Company.v. Is absent either in person or by his alternate, without
the previous sanction of the Directors, for a period of more than six months from meetings of the directors held during such period and the Directors resolve that his office be vacated accordingly.
12.1.3. Corporate InformationIncorporation July 17, 2008
Registered Office Morningside office Park, Ngong Road Nairobi P.O. Box 75362-00200 Nairobi
12. Statutory and General Information (Continues)

Listing Statement 15th July 201344
As at June 10, 2013, the authorized share capital of the Company was Kenya Shillings Five Hundred Million (KShs. 500,000,000/=) divided into Five Hundred Million (500,000,000) ordinary shares of Kenya Shillings One (Kshs. 1/=) each.
The issued share capital of the Company was Four Hundred and Five Million, Two Hundred and Fifty Five Thousand Three Hundred and Twenty (Kshs. 405,255,320/=) divided into Four Hundred and Five Million, Two Hundred and Fifty Five Thousand Three Hundred and Twenty shares of Kenya Shillings One (Kshs. 1/=) each held by a total of 113 share-holders.
Shareholders The following are the current shareholders holding in ex-cess of 1.00% of the Company’s total shareholding:
Shareholders Number of Shares
% share-holdings
1. Home Afrika Continental Ltd.**
24,000,000 5.92%
2. Home Afrika Investments Ltd.**
20,384,000 5.03%
3. Seyani Brothers & Co. Ltd 10,000,000 2.47%
4. Stimela Co-operative Saving & Credit Society
10,000,000 2.47%
5. YCEO Holdings Limited 10,000,000 2.47%
6. Lee & Consolata Gituto Karuri 10,000,000 2.47%
7. Nyagah Boore & Lillian Wanji-ku Kithinji
10,000,000 2.47%
8. Global Equity Ventures Ltd 10,000,000 2.47%
9. Lilian Nduta Githungo 10,000,000 2.47%
10. Patrick Ng’ang’a 10,000,000 2.47%
11. Hansan Investment Ltd 10,000,000 2.47%
12. Wakini Ltd 6,000,000 1.48%
13. Red Anchor Ltd 6,000,000 1.48%
14. Paul Munyua Ng’ang’a 6,000,000 1.48%
15. Dale Farm & Investments 6,000,000 1.48%
16. Dominic Mbugua Kimani 6,000,000 1.48%
17. Mbugua & Nancy Wanjiku Ka-mau
6,000,000 1.48%
18. Patrick Devine 6,000,000 1.48%
19. Bucknall Bruton Ltd 6,000,000 1.48%
TOTAL 182,384,000 45.00%
Source: Home Afrika Limited**Home Afrika Continental Limited and Home Afrika Investments Limited each
hold shares in the Group in trust for nine (9) and ten (10) individuals respectively.
Directors The Directors of the Company are:a) Lee Gituto Karurib) Geoffrey Mbugua Kamauc) Lucy Wanjiku Mainad) Benjamin Mbira Gikonyoe) Nyagah Kithinjif) Dan Awendog) Gilbert Kibeh) Mbugua Gecagai) Jane Wambui Adamj) Kenneth Wathome Mwatu
Company Secretary Ms. Esther Ndegi NjiruCertified Company SecretaryNumber 1444P.O. Box 2050-00200Nairobi
Lawyers Muriu Mungai & Company AdvocatesMMC ArchesSpring ValleyP.O Box 75362-00200Nairobi, Kenya
Auditors: PKF Accountants & Business Advisers Kalamu House, Grevillea Grove Westlands, Nairobi
12.2. Other Important Information12.2.1. Capital Changes in the last five (5) yearsHome Afrika has undertaken the following material chang-es in the last five years:a) In July 2011, the Company was converted from a private
to a public company.b) In May 2011, there was an increase in Nominal Capital
from Kenya Shillings One Hundred Thousand (KShs. 100,000/=) to Kenya Shillings One Hundred and Sixty Four Thousand (Kshs. 164,000/=).
c) In December 2011, there was another increase in Nom-inal Capital from Kenya Shillings One Hundred and Six-ty Four Thousand (Kshs. 164,000/=) to Kenya Shillings Three Hundred Thousand (KShs. 300,000/=).
d) In October 2012, there was a further increase in Nominal Capital from Kenya Shillings Three Hundred Thousand (KShs. 300,000/=) to the current share capital of Kenya Shillings Five Hundred Million (KShs. 500,000,000/=).
12. Statutory and General Information (Continues)

Listing Statement 15th July 2013 45
e) In October 2012, there was also a Share Split where each share worth Kenya Shillings One Hundred (KShs. 100/=) was split into ten shares of Kenya Shillings Ten (Kshs. 10/=) each.
f) As part of the reorganization in 2012, 91 share transfers forms for a total of 1,280 shares in the Company were executed and stamped. The Company is in the process of finalizing execution and stamping of 29 share trans-fers for an aggregate of 72,386,750 shares in the Com-pany from Home Afrika International and Home Afrika Continental to the beneficial shareholders. The total number of beneficial shareholders is 130.
g) On December 31, 2012, the directors resolved to cap-italize shareholders contributions amounting to Kshs 472,632,000. This was on the authorization of a share-holders resolution dated April 30, 2011. A return of al-lotments dated December 31, 2012 indicates allotments made to the shareholders of 40,467,945 shares to 104 shareholders including Home Afrika Continental and Home Afrika Investments for the shareholders whose share transfer are not complete.
h) The Company in an Extra Ordinary General Meeting held on January 26, 2013 resolved to split the share cap-ital of the company ten times from a par value of Kshs 10 to Kshs 1.
12.2.2. The Company’s SubsidiariesThe Company undertakes its businesses either directly or through its several subsidiaries which are:
12.2.2.1. Lakeview Heights Development LimitedIncorporated on 24th October 2012 under company num-ber CPR/2012/87391 with a share capital of Kenya Shillings One Hundred Thousand (KShs. 100,000) divided into One Thousand (1,000) shares of Kenya Shillings One Hundred (KShs.100/=) each. The shareholders at incorporation are as follows:• HomeAfrikaLimited –999shares• StephenMallowah- -1share(asnominee)
12.2.2.2. Lango Allied Investment LimitedIncorporated on the 6th December 2012 under Company Number CPR/2012/90531 with a share capital of Kenya Shil-lings One Hundred Thousand (KShs. 100,000) divided into One Thousand (1,000) shares of Kenya Shillings One Hun-dred (KShs.100/=) each. The shareholders at incorporation are as follows:• HomeAfrikaLimited –999shares• KetanShah- -1share(asnominee)
12.2.2.3. Lango Development CompanyIncorporated on 7th November 2012 under company num-ber CPR/2012/88442 and having a share capital of Kenya Shillings One Hundred Thousand (KShs 100,000) divided into One Thousand (1,000) shares of Kenya Shillings One Hundred (KShs. 100/=) each. The shareholders at incorpo-ration are as follows:• HomeAfrikaLimited–999shares• KetanShah- -1share(asnominee)
12.2.2.4. Lango Management Company Limited Incorporated on 7th November 2012 under certificate of incorporation number CPR/2012/88444 with a share capital of Kenya Shillings One Hundred Thousand (KShs. 100,000) divided into One Thousand (1,000) shares of Kenya Shillings One Hundred (KShs.100/=) each. The shareholders at incor-poration are as follows:• LangoDevelopmentLimited–999shares• KetanShah- -1share(asnominee)
12.2.2.5. Lakeview Management LimitedThe share capital of the Lakeview Management Limited is Kenya Shillings One Hundred Thousand (KShs 100,000) di-vided into One Thousand (1,000) shares of Kenya Shillings One Hundred (KShs.100/=) each. The shareholders at incor-poration are as follows:• HomeAfrikaLimited–999shares• KetanShah- -1share(asnominee)
12.2.2.6. Lakeview Holding LimitedIncorporated on 7th November 2012 under company num-ber CPR/2012/88440 with a share capital of Kenya Shillings One Hundred Thousand (KShs. 100,000) divided into One Thousand (1,000) shares of Kenya Shillings One Hundred (KShs.100/=) each. The shareholders at incorporation are as follows:• HomeAfrikaLimited–999shares• StephenMallowah- -1share(asnominee)
12.2.2.7. Home Afrika Communities LimitedIncorporated on July 14, 2010 with certificate number CPR/2010/27181. As at January 2012, the authorized and share capital was 1,000 shares of Kshs 100 each held by Home Africa with 600 shares (60%) Tulip Trustee Company Ltd with 200 shares and Linyanti Ltd with 200 shares.
12.2.2.8. Home Afrika Property Exchange LimitedAs at December 2011, the authorized and issued share cap-ital was 1,000 shares of Kshs 100 each held by Home Africa (999 shares) and Benjamin Mbira (1 share).
12. Statutory and General Information (Continues)

Listing Statement 15th July 201346
12.2.2.9. Suburban LimitedIncorporated on April 7, 2009 with certificate number CPR/2009/989. As at January 2012, the authorized and share capital was 1,000 shares of Kshs 100 each held by Home Af-rica (500 shares) Morningside Development Ltd (300 shares) and InvesteQ Capital Ltd (200 shares).
12.2.2.10. Mitini Scopes Development LimitedIncorporated on April 15, 2011 with certificate number CPR/2011/45777. As at September 2012, the authorized and issued share capital was 100 shares of Kshs 1,000 each held by Home Africa (99 shares) and Boniface Kamau (1 share as nominee).
12.2.2.11. Morningside Management Limited
Incorporated on December 21, 2010 with certificate num-ber CPR/2010/37373. As at December 2011, the authorized and share capital was 1,000 shares of Kshs 100 each held by Morningside Properties Limited (999 shares) and Benjamin Mbira (1 share as nominee).
12.2.2.12. Kikwetu Development LimitedIncorporated on October 25, 2012 with certificate number CPR/2012/87144. The shareholders at incorporation were as follows:• HomeAfrikaLimited–1share• BenjaminMbiraGikonyo–1share(asnominee)
12.2.3. PropertiesThe following is a summary of the Company’s properties.
12. Statutory and General Information (Continues)
Property Details Owned by Encumbrances
L.R. Number 2/704 – Morningside Office Park Limited (Main Title)
Morningside Properties Limited (leasehold for a term of 99 years from 1/07/2005)
There is documentation (executed offer letter) indicating that this title was to be charged to I&M Bank for KShs. 45,000,000 but the charge has not yet been created over the property.
Unit Number 2, 5th Floor Morning Side Office Park on L.R. No. 2/704 together with 8 parking bays
Home Afrika Limited (for a term of 99 years from 1/07/2005)
There is documentation (executed offer letter) indicating that this title was to be charged to I&M Bank for KShs. 45,000,000 but the charge has not yet been created over the property.
Unit F, 1st Floor, Morning Side Office park on L.R. No. 2/704 together with 8 parking bays
Home Afrika Limited (for a term of 99 years from 1/07/2005)
N/A
L.R Number 29509 Kiambu (main Title) Home Afrika Communi-ties Limited (leasehold for a term of 99 years from 1/10/2011)
N/A
Units HC01, CC01, F01,F02, F03, F04, F05, F06, F07 and F08 all situated on L.R. No. 29059 Kiambu
Home Afrika Communities Limited (for a term of 95 years from 1/10/2011)
Charge dated 9th September 2012 over all these units in favor of Equity Bank Limited for KShs. 100,000,000/=
Unit PDS S03 erected on L.R. No. 29059 Kiambu
Mitini Scapes Develop-ment Limited (leasehold for a term of 95 years from 1/10/2011)
No charges/mortgages

Listing Statement 15th July 2013 47
12.2.4. InsuranceThe following is a list of insurance policies entered into by the Company and/or its subsidiaries:
Policy Num-ber
Insurer Insured Subject Premium Renewal
JP12CP0005 Heritage Insurance Company
Suburban Limited
All risks policy - Offices at L.R. No.2/704 Ngong Road Morn-ingside office park 5th Floor penthouse 1
Kshs. 6,753/= Policy valid until 28/02/2013
JP09CP0009 Heritage Insurance company
Home Afrika Limited
All risk policy covering –Public Liability and work Injury Bene-fits,
Kshs. 391,749/= Policy valid until 04/03/2013
070044705 Chartis Insurance Home Afrika Communities Limited
Combined policy – general liability, Buildings, Office con-tents, Burglary
Kshs. 178,126/= (total premium)
Policy valid until 31st July 2013
JP11A00001 Heritage Insurance Suburban Limited/ Morningside Office Park Limited/I&M Bank Limited
Fire Material Damage – L.R. No. 2/704 Morningside Office Park, Ngong Road, Nairobi
Kshs. 1,270,171/=
Policy valid until 01/01/2013
12.2.5. Material Contracts12.2.5.1. Agreement for Finance Sourcing with the Mortgage CompanyThis is an agreement entered into between Kikwetu Development Limited and The Mortgage Company under which the Com-pany is contracting the services of The Mortgage Company in procuring financing for the Company in relation to the purchase of 1,000 acres of land in Stoney Athi and the subsequent development.
12. Statutory and General Information (Continues)
12.2.5.2. LicensingThe single Business Permit issued by the Nairobi City Coun-cil in respect of its offices at Morning side Office Park on Ngong Road, Nairobi authorizes the Company to conduct House Development business, and is valid for the year 2013.
12.2.6. Material Borrowings12.2.6.1. Term Loan Facility from I&M BankA term loan for Kenya Shillings Forty Five Million supported by a guarantee issued by Lee Gituto Karuri, Geoffrey Mbu-gua Kamau, Dan Ochieng Awendo, Susan Kasinga, Lucy Wanjiku Maina, Benjamin Mbira Gikonyo, Nazima Malik, Steve Mallowa and Nyagah Boore Kithinji.
12.2.6.2. Facility letter from Equity BankThe loan facility offered to Home Afrika Communities Lim-ited is dated 3rd August 2011 and is for an amount of Kshs. 100, 000, 000. The principal was to be repaid in two install-ments of Kshs. 50,000,000 at the end of the 6th month and the remaining principal at the end of the 12th month. The first principal repayment was payable on 18th March 2013
and was fully paid on time.
This facility was to be secured by:• First legal chargeover thepropertyNo.HC01,CC01,
PDS F01,F02,F03,F04, F05,F06, F07, and F08, all being portions to be carved out of Title IR No. 133694 (LR No. 29059) to be registered an stamped in favor of Equity Bank Ltd for 100,000,000.
• CorporateguaranteesbyHomeAfrikaLtd,TulipCom-pany Ltd and Linyanti Ltd for Kshs. 100,000,000 in favor of the Bank.
12.2.7. LITIGATION/DISPUTESThe Company only has one ongoing dispute with Frontier Finance Limited in which the latter claims certain amounts from the Company in respect of services provided to the Company in sourcing financing in favor of the Company from Kenya Commercial Bank. The Company’s position is that as the agreement provided for the payment of the fees as a percentage of the actual disbursed amount, and given that no disbursement occurred, they do not accept the re-quest for fund placement.

Listing Statement 15th July 201348
12. Statutory and General Information (Continues)
12.2.8. DOCUMENTS FOR INSPECTIONCopies of the following key documents among others will be available for inspection at the Company’s Virtual Data Room up until the date of the close of the offer:a) This Listing Statement.b) The Company’s Memorandum of Articles of Associa-
tion.c) The Certificate of Incorporation. d) The Board of Directors Resolution approving the offer.e) Copies of material contracts listed in this Listing State-
ment.f) The Shareholders Resolution approving the offer.g) The audited annual reports for the financial years ended
2010, 2011 and 2012.

Listing Statement 15th July 2013 49
13. Directors’ Statement
We hereby declare that to the best of our knowledge, information and belief, (having taken all reasonable care to ensure that such is the case) all information contained in this Listing Statement and the statements contained in the reports herein are correct, and neither the Board of Directors’ minutes, audit reports nor any other internal documents contain information, which could distort the interpretation of the report or affect the import of such information.
The Board of Directors of the Group confirm that in their opinion the working capital available to the Company and its subsid-iaries is sufficient for its present requirements.
There have been no audited or interim financial statements of the Group that have been published subsequent to 31 Decem-ber 2012 to the date of this Prospectus. The Directors of the Group are not aware of any significant changes in the financial or trading position of the Company that has occurred since the financial year ended 31 December 2012. The issued capital of the Group is adequate for the purposes of the Company and of its subsidiaries for the foreseeable future.
Signed……………………………….Lee KaruriChairman
Signed……………………………….Dr. Mbira GikonyoVice Chairman
Signed……………………………….Gerald ChegeChief Executive Officer
Signed……………………………….Eng. Mbugua KamauDirector
Signed……………………………….Dan AwendoDirector
Signed……………………………….Nyagah KithinjiDirector
Signed……………………………….Lucy MainaDirector
Signed……………………………….Mbugua GecagaDirector
Signed……………………………….Gilbert KibeDirector
Signed……………………………….Ken WathomeDirector
Signed……………………………….Jane AdamDirector

Listing Statement 15th July 201350
GODWIN WANGONG’U GLADYS MBOYA PETER M. WAIYAKI DAVID MWAURA
VAT NUMBER 0140284H PIN NUMBER P051163306K
July 15, 2013 The Directors Home Afrika Limited Morningside Office Park Ngong Road P. O. Box 6254 - 00100, Nairobi. Dear Sirs, RE: LEGAL OPINION IN RESPECT OF LISTING BY INTRODUCTION We act as legal advisers to Home Afrika Limited (“the Company”) in relation to the proposed listing of its shares in the Growth Enterprise Market Segment of the Nairobi Securities Exchange (“the Listing”). We are Advocates of the High Court of Kenya, practicing and qualified as such to practice in Kenya, and to advise upon the laws of Kenya. This legal opinion (“this Opinion”) is given in relation to the Listing. We have acted as the Legal Advisors in the Listing and have issued this Opinion for inclusion in the Listing Statement. 1. PRELIMINARY MATTERS 1.1. Unless (a) otherwise stated; or (b) the context otherwise requires, words and
terms defined in the Listing Statement bear the same meanings in this Opinion. 1.2. This Opinion is limited to Kenyan Law as applied in the Courts of Kenya and as
of the date of this Opinion and to matters of fact prevailing as of the date of this Opinion.
2. ASSUMPTIONS AND DOCUMENTS REVIEWED 2.1. For the purposes of this Opinion, we have made the following assumptions:
Tel: +254 20 4348356-59 +254 714 611 954 +254 739 631 261
Fax: +254 20 4348 351 [email protected]
www.lexgroupafrica.com
Lex Chambers, Maji Mazuri Road, off James Gichuru Road, Lavington, P. O. Box 74041 – 00200, Nairobi, Kenya. Dropping Zone No. 214, Revlon Professional Plaza.
Our Ref: H094/002/M/2013/W Your Ref: TBA
ADVOCATES COMMISSIONERS FOR OATHS
NOTARIES PUBLIC COMPANY SECRETARIES
PATENT & TRADEMARK AGENTS
GODWIN WANGONG’U GLADYS MBOYA PETER M. WAIYAKI DAVID MWAURA
VAT NUMBER 0140284H PIN NUMBER P051163306K
Legal Opinion
July 15, 2013The DirectorsHome Afrika LimitedMorningside Office ParkNgong RoadP. O. Box 6254 - 00100,Nairobi.
Dear Sirs,
RE: LEGAL OPINION IN RESPECT OF LISTING BY INTRODUCTIONWe act as legal advisers to Home Afrika Limited (“the Company”) in relation to the proposed listing of its shares in the Growth Enterprise Market Segment of the Nairobi Securities Exchange (“the Listing”).
We are Advocates of the High Court of Kenya, practicing and qualified as such to practice in Kenya, and to advise upon the laws of Kenya.
This legal opinion (“this Opinion”) is given in relation to the Listing.
We have acted as the Legal Advisors in the Listing and have issued this Opinion for inclusion in the Listing Statement.
1. PRELIMINARY MATTERS
1.1. Unless (a) otherwise stated; or (b) the context otherwise requires, words and terms defined in the Listing Statement bear the same meanings in this Opinion.

Listing Statement 15th July 2013 51
GODWIN WANGONG’U GLADYS MBOYA PETER M. WAIYAKI DAVID MWAURA
VAT NUMBER 0140284H PIN NUMBER P051163306K
Legal Opinion (Continues)
1.2. This Opinion is limited to Kenyan Law as applied in the Courts of Kenya and as of the date of this Opinion and to matters of fact prevailing as of the date of this Opinion.
2. ASSUMPTIONS AND DOCUMENTS REVIEWED2.1. For the purposes of this Opinion, we have made the following assumptions:
2.1.1. all information contained in the Listing Statement and all information provided to us by the Company, and its officers and advisers is true, accurate and up to date.
2.1.2. the authenticity and completeness of all documents submitted to us as originals or copies, the genuineness of all signatures, the conformity to originals of all copies, and the accuracy of any translations.
2.1.3. That representations made to us by officers and agents of the Company are true in all material respects.
2.2. For the purposes of this Opinion, we have examined originals or copies certified to our satisfaction of the following documents:
2.2.1. Memorandum and Articles of Association in force as at the date of this Opinion.
2.2.2. The Company’s annual returns for the last three years.
2.2.3. The Company’s statutory books;
2.2.4. Documents filed by the Company with the Registrar of Companies;
2.2.5. Title documents of immoveable property in the name of the Company;
2.2.6. Details of contracts and disputes to which the Company is a party;
2.2.7. Audited accounts of the Company for the last three years;
2.2.8. Such other records and documents as we have considered necessary or appropriate for the purposes of this Opinion in respect of the Company and its subsidiaries.
3. OPINIONBased upon and subject to (1) the foregoing; (2) the reservations set out below; and (3) to any matters not disclosed to us, we are of the opinion that:
3.1. STATUS OF THE COMPANY
3.1.1. The Company is a public limited liability company, duly registered under the Companies Act (Cap 486 of the Laws of Kenya) and bearing Registration Number C. 8/2011.
3.1.2. The disclosure made in the Listing Statement listing the shareholders of the Company is correct.
Listing Statement 15th July 201352
3.1.3. The Registered Office of the Company is Morningside office Park, Ngong Road, P.O. Box 75362-00200, Nairobi.
3.1.4. The Company has the power and authority to list in the Nairobi Securities Exchange by way of introduction hav-ing obtained the consent fo the Board of Directors, the shareholders and the Nairobi Securities Exchange.
3.1.5. The Company has, at the date hereof, a Board of Directors consisting of the following individuals:• Lee Gituto Karuri;• Geoffrey Mbugua Kamau;• Lucy Wanjiku Maina;• Benjamin Mbira Gikonyo;• Nyagah Boore Kithinji;• Dan Ochieng Awendo;• Jane Wambui Adam;• Kenneth Wathome Mwatu;• Gilbert Macharia Kibe; and• Mbugua Gecaga.
3.1.6. The Company Secretary of the Company is Ms. Esther Ndegi Njiru, Certified Company Secretary Number 1444, P.O. Box 2050-00200, Nairobi.
3.1.7. The Company maintains its statutory books at the offices of its Company Secretary.
3.2. LICENSES AND CONSENTSAll authorizations, approvals, consents, licenses, exemptions, filings or registrations of or with any governmental or public bodies or authorities of or in Kenya required in connection with the business of the Company have been ob-tained in proper form, and are in full force and effect.
3.3. SHARE CAPITAL
3.3.1. The authorised share capital of the Company is Kenya Shillings Five Hundred Million (KShs. 500,000,000/=) divid-ed into Five Hundred Million (500,000,000) ordinary shares of Kenya Shillings One (Kshs. 1/=) each.
3.3.2. The issued share capital of the Company is Kenya Shillings Four Hundred and Five Million, Two Hundred and Fifty Five Thousand, Three Hundred and Twenty (Kshs. 405,255,320/=) divided into Four Hundred and Five Million, Two Hundred and Fifty Five Thousand, Three Hundred and Twenty ordinary shares of Kenya Shillings One (Kshs. 1/=) each.
3.3.3. The existing capital of the Company is in conformity with applicable laws and has received all necessary authori-zations. There are no proposed changes to the existing capital of the Company.
3.4. OWNERSHIP OF ASSETS
3.4.1. The Company owns the following properties either directly or through its subsidiaries:
GODWIN WANGONG’U GLADYS MBOYA PETER M. WAIYAKI DAVID MWAURA
VAT NUMBER 0140284H PIN NUMBER P051163306K
Legal Opinion (Continues)

Listing Statement 15th July 2013 53
GODWIN WANGONG’U GLADYS MBOYA PETER M. WAIYAKI DAVID MWAURA
VAT NUMBER 0140284H PIN NUMBER P051163306K
Legal Opinion (Continues)
• L.R. Number 2/704 – Morningside Office Park Limited; • Unit Number 2, 5th Floor Morning Side Office Park on L.R. No. 2/704 together with 8 parking bays;• Unit F, 1st Floor, Morning Side Office park on L.R. No. 2/704 together with 8 parking bays;• L.R Number 29509 Kiambu;• Units HC01, CC01, F01,F02, F03, F04, F05, F06, F07 and F08 all situated on L.R. No. 29059 Kiambu; and• Unit PDS S03 erected on L.R. No. 29059 Kiambu.3.4.2. There are encumbrances against some of the titles above securing a total of Kenya Shillings One Hundred and Forty Five Million (KShs. 145,000,000/=) in favour of two licensed commercial banks in Kenya.
3.5. SUBSIDIARIESThe following companies are subsidiaries of the Company:• Suburban Limited;• Home Afrika Communities Limited;• Home Afrika Property Exchange Limited;• Mitini Scapes Development Limited;• Kikwetu Development Limited;• Lakeview Heights Development Limited;• Lakeview Management Limited;• Lakeview Holding Limited;• Lango Allied Investment Limited;• Lango Development Company; and• Lango Management Company Limited.
3.6. MATERIAL LITIGATIONThe Company is not a party to, and has not been threatened with, any material litigation that has not been disclosed in the Listing Statement.
3.7. MATERIAL CONTRACTS
3.7.1. Save for contracts entered into in the ordinary course of business, the Company has not entered in to any material contracts which are not disclosed in the Listing Statement.
3.7.2. As at the date of this Listing Statement, the Company is not in breach of any material contractual obligations except where disclosed in the Listing Statement.
3.7.3. Excepting contracts with advisers engaged by the Company for the Listing, there are no contracts with any bank, securities exchange, investment banks, brokers or any other person in respect to the Listing.
3.8. MATERIAL BORROWINGS
3.8.1. The Company and its subsidiaries have existing bank facilities with two licensed commercial banks in Kenya for a total sum not exceeding Kenya Shillings One Hundred and Fourty Five Million (KShs. 145,000,000/=) secured by en-cumbrances on immoveable property owned by the Companyand its subsidiaries.

Listing Statement 15th July 201354
3.8.2. The borrowing powers of the Company and its subsidiaries have not been exceeded.
4. CONSENTWe consent to the inclusion of our legal opinion in the Listing Statement to be issued for the Listing in the form and context in which it appears. We confirm that we have given and as at the date of issue of the Listing Statement have
not withdrawn our consent to its issue and the inclusion of our legal opinion herein.
5. RESERVATIONS
5.1. We express no opinion as to any document other than the material documents expressly referred to above.
5.2. We express no opinion as to any law other than Kenyan law in force, and as interpreted, at the date of this Opinion.
5.3. We express no opinion as to any matter not stated herein.
Yours Faithfully,MBOYA WANGONG’U & WAIYAKI
GODWIN WANGONG’[email protected]/cg
GODWIN WANGONG’U GLADYS MBOYA PETER M. WAIYAKI DAVID MWAURA
VAT NUMBER 0140284H PIN NUMBER P051163306K
Legal Opinion (Continues)

Listing Statement 15th July 2013 55
Reporting accountant’s report For the four years to 31 December 2012
Introduction
We are pleased to present the audited consolidated finan-cial statements for Home Afrika Limited set out on pages 3 to 31 for the four years to 31 December 2012 in accordance with the requirements of Section 6 and Part A of the Third Schedule to the Capital Markets (Securities) (Public Offers, Listing and Disclosures) Regulations, 2002.
The directors of the group are responsible for the prepara-tion of the Listing Statement and all the information con-tained therein and for the financial statements and financial information to which our Accountants’ Report relates. Our responsibility is to review and compile the financial infor-mation set out in our report from the financial statements.
Other than as stated in our Accountant’s Report, we have not audited any other information relating to the group.
The financial statements of the group have received un-qualified audit reports throughout the period covered by our Accountant’s Report.
The financial information set out in this report is compiled by reference to the audited financial statements of the group for the four years to 31 December 2012 in accordance with the International Standard on Related Services (ISRS) 4410 on Engagements to Compile Financial Statements. REVIEW PROCEDURES We have carried out a review of the audited financial state-ments of the group for the four years to 31 December 2012. Our review was carried out in accordance with the Inter-national Standard on Review Engagement (ISRE) 2400 on Engagements to Review Financial Statements. This Stan-dard requires that we plan and perform the review to obtain moderate assurance as to whether the financial statements are free from material misstatement. A review is limited pri-marily to enquiries of the management, previous auditors and analytical procedures applied to financial data, and thus provides less assurance than an audit. We have made enquiries of the management about the operations of the group and its accounting practices and principles. We have not made enquires from the previous auditors; Baker Tilly Merali’s and Deloitte & Touche. We have audited the financial statements for the years ended 31 December 2012. Our audit was conducted in ac-cordance with International Standards on Auditing. These
standards require that we comply with ethical requirements, plan and perform the audit to obtain reasonable assurance as to whether the financial statements are free from material misstatement. An audit involves performing procedures to obtain audit evidence about the amounts and disclosures in the financial statements. We believe that the audit evidence we have obtained is sufficient and appropriate to provide a basis for our audit opinion. We have not performed an audit for the three years to 31 December 2011 and accord-ingly, we do not express an audit opinion on those periods except insofar as the results to1 December 2011 are part of the comparative information provided for the financial year for the year ended 31 December 2012. Where necessary we have adjusted the financial statement to conform with changes in accounting policies applied in the latest year.
OPINION Based on our review, nothing has come to our attention that causes us to believe that the audited consolidated financial statements of Home Afrika Limited for the four years to 31 December 2012 do not give a true and fair view in accordance with International Financial Reporting Stan-dards. CONSENT We consent to the inclusion of this report in the Listing Statement to be issued on or about 15th July 2013 in the form and context in which it appears.
Certified Public Accountants PIN NO. P051130467R
NAIROBI ___________________________2013

Listing Statement 15th July 201356
Reporting accountant’s report For the four years to 31 December 2012 (Continues)
Notes
The principal accounting policies adopted in the prepara-tion of these financial statements are set out below. These policies have been consistently applied to all the years pre-sented, unless otherwise stated.
a) Basis of preparation The consolidated financial statements have been prepared under the historical cost convention, except as indicated otherwise below and are in accordance with International Financial Reporting Standards (IFRS).
(i) New and amended standards adopted by the group
The group has applied the amendments to lAS 1 Presenta-tion of Items of Other Comprehensive Income in advance of the effective date. The amendments introduce new terminology for the statement of comprehensive income and income statement. Under the amendments to lAS 1, the ‘statement of comprehensive income’ is renamed the ‘statement of profit or loss and other comprehensive in-come’ and the ‘income statement’ is renamed the ‘state-ment of profit or loss’. The effective date is for annual peri-ods beginning on or after 1 July 2012. (ii) New standards, amendments and interpretations issued
but not effective for the financial year beginning 1 Jan-uary 2012 and not adopted in advance of the effective date.
International Financial Reporting Standard 10 (IFRS 10) on ‘Consolidated Financial Statements’ builds on existing prin-ciples by identifying the concept of control as the determin-ing factor in whether an entity should be included within the consolidated financial statements of the parent group. The standard provides additional guidance to assist in the determination of control where this is difficult to assess. Adoption is mandatory from 1 January 2013 although early adoption is permissible. The group has assessed the impact of implementing IFRS 10 and expects no significant change in the method of accounting. International Financial Reporting Standard 11 (IFRS 11) on ‘Joint Arrangements’ outlines the accounting treatments for entities that jointly control an arrangement. The stan-dard replaces the current IAS 31 on Joint Ventures. Adop-tion is mandatory from 1 January 2013 although early adop-tion is permissible.
The group has not assessed the potential impact of IFRS
11 on its consolidated financial statements. International Fi-nancial Reporting Standard 12 (IFRS 12) on ‘Disclosures of Interests in Other Entities’ enhances the disclosure require-ments about an entity’s interests in subsidiaries, joint ar-rangements, associates and unconsolidated ‘structured en-tities’. Adoption is mandatory from 1 January 2013 although early adoption is permissible.
The group has not assessed the potential impact of IFRS 12 on its consolidated financial statements. IFRS 9, ‘Finan-cial instruments’, addresses the classification, measure-ment and recognition of financial assets and financial liabil-ities.
IFRS 9 requires financial assets to be classified into two prin-cipal measurement categories: those measured as at fair value and those measured at amortised cost. The group is yet to assess. IFRS 9’s full impact and intends to adopt IFRS 9 no later than the accounting period beginning on or after 1 January 2015.
Amendments to IFRS 7 and IAS 32: The amendments to IAS 32 clarify existing application issues relating to the offsest of financial assets and financial liabilities requirements. Spe-cifically, the amendments clarify the meaning of ‘currently has a legally enforceable right of set-off and simultaneous realization and settlement. The amendments to IFRS 7 require entities to disclose infor-mation about rights of offset and related arrangements for financial instruments under an enforceable master netting agreement or similar arrangement. The amendments to IFRS 7 are effective for annual peri-ods beginning on or after 1 January 2013. with retrospec-tive disclosures for all comparative periods. However, the amendments to IAS 32 are not effective until annual periods beginning on or after 1 January 2014, with retrospective ap-plication required. The group has not assessed the potential impact of IFRS 7 and IAS 32 on its consolidated financial statements. There are no other IFRSs or IFRIC interpretations that are not yet effective that would be expected to have a material impact on the group.
b) Revenue recognition Revenue comprises the fair value of the consideration re-ceived or receivable for the sale of goods and/or perfor-

Listing Statement 15th July 2013 57
Reporting accountant’s report For the four years to 31 December 2012 (Continues)
Notes (Continues)
mance of services, in the ordinary course of business and is stated net of Value Added Tax (VAT), rebates and dis-counts.
The group recognises revenue when the amount of reve-nue can be reliably measured, it is probable that future eco-nomic benefits will flow to the entity and when the specific criteria have been met for each of the group’s activities as described below. The amount of revenue is not considered to be reliably measured until all contingencies relating to the sale have been resolved. The group bases its estimates on historical results, taking into consideration the type of customer, type of transaction and specifics of and specifics of each arrangement. i) Revenue from sale of land is recognised upon the exe-
cution and transfer of land title deedsto the buyer.ii) Revenue from sale of office space is recognised upon
the transfer to the buyers the significant risks and re-wards of ownership of the office space, the entity re-tains neither continuing managerial involvement to the degree usually associated with ownership nor effective control over the office space sold.
iii) Interest income is recognised on a time proportion ba-sis using the effective interest method.
iv) Dividend income is recognised if declared before the financial statements are authorised for issue.
v) Rental income is accrued by reference to time on a straight line basis over the lease term
c) Investment in subsidiaries/consolidation Subsidiaries are all entities (including special purpose en-tities) over which the group has the power to govern the financial and operating policies generally accompanying a shareholding of more than one half of the voting rights. The existence and effect of potential voting rights that are currently exercisable or convertible are considered when assessing whether the group controls another entity.
The group also assesses the existence of control where it does not have more than 50% of the voting rights power but is able to govern the financial and operating policies of a subsidiary.Control may arise in circumstances where the size of the group’s voting rights relative to the size and dispersion of holdings of other shareholders give the group the power to govern the financial and operating policies. Inter-group transactions, balances, income and expenses on transactions between group companies are eliminated.
Profits and losses resulting from inter-group transactions that are recognised in assets are also eliminated. Account-ing policies of subsidiaries have been changed where nec-essary to ensure consistency with the policies adopted by the group.
d) Property and equipment All property and equipment is initially recorded at cost and thereafter stated at historicalcost less depreciation. Historical cost comprises expendi-ture initially incurred to bring the asset to its location and condition ready for its intended use. Subsequent costs are included in the asset’s carrying amount or recognised as a separate asset, as appropriate, only when it is probable that future economic benefits asso-ciated with the item will flow to the group and the cost can be reliably measured. The carrying amount of the replaced part is derecognised. All other repairs and maintenance are charged to profit or loss during the financial year in which they are incurred.
Depreciation on all other assets is calculated on the reduc-ing balance basis method to write down the cost of each asset, or the revalued amount, to its residual value over its estimated useful life using the following annual rates: Rate % Buildings 2.5% (Straight line) Motor vehicles 25.0% Furniture and fittings 30.0% Office equipment 12.5% Computer equipment 12.5% The assets’ residual values and useful lives are reviewed, and adjusted if appropriate, at the end of each reporting period.
An asset’s carrying amount is written down immediately to its recoverable amount if the asset’s carrying amount is greater than its estimated recoverable amount. Gains and losses on disposal of property, plant and equipment are determined by comparing the proceeds with the carrying amount and are taken into account in determining operat-ing profit/loss.
e) Intangible assets Intangible assets with finite useful lives that are acquired separately are carried at cost less accumulated amortisa-

Listing Statement 15th July 201358
tion and accumulated impairment losses. Amortisation is recognised on a straight-line basis over their estimated use-ful lives. The estimated useful life and amortization method are reviewed at the end of each reporting period, with the effect of any changes in estimate being accounted for on a prospective basis. Intangible assets with indefinite useful lives that are acquired separately are carried at cost less ac-cumulated impairment losses.
f) Financial instruments Financial assets and financial liabilities are recognised when the group becomes a party to the contractual provisions of the instrument. Management determines all classification of financial assets at initial recognition. • Financialassets Financial assets are initially recognised at fair value plus transaction costs for all financial assets not carried at fair val-ue through profit or loss.
The company’s financial assets fall into the following cate-gories: • Available-for-sale: financial assets that are held for an
indefinite period of time, which may be sold in response to needs for liquidity or changes in interest rate. Such assets are classified as non-current assets except where the management intends to dispose the assets within 12 months of the reporting date. Subsequent to initial recognition, they are carried at fair value with gains or losses are recognised in other comprehensive in-come, net of deferred tax *(where applicable).
Interest on available-for-sale securities is calculated using the effective interest method and is recognised in profit or loss as part of other income. Dividends on available-for-sale equity instruments are also recognised in profit or loss as part of other income when the group’s right to receive pay-ments is established. • Loansandreceivables:financialassetswithfixedorde-
terminable payments that are not quoted in an active market. Such assets are classified as current assets where maturities are within 12 months of the reporting date. All assets with maturities greater than 12 months after the reporting date are classified as non-current assets. Sub-sequent to initial recognition, they are carried at amor-tised cost using the effective interest method. Changes in the carrying amount are recognised in profit or loss. Purchases and sales of financial assets are recognised on the trade date i.e. the date on which the company
commits to purchase or sell the asset.
Financial assets are derecognised when the rights to re-ceive cash flows from the assets have expired or have been transferred and the company has transferred substantially all risks and rewards of ownership.
A financial asset is impaired if its carrying amount is great-er than its estimated recoverable amount. Impairment of financial assets is recognised in the statement of compre-hensive income under administrative expenses when there is objective evidence that the company will not be able to collect all amounts due per the original terms of the con-tract. Significant financial difficulties of the issuer, probabil-ity that the issuer will enter bankruptcy or financial reorgan-isation, default in payments and a prolonged decline in fair value of the asset are considered indicators that the asset is impaired.
The amount of the impairment loss is calculated as the dif-ference between the assets carrying amount and the pres-ent values of expected future cash flows, discounted at the financial instrument’s effective interest rate. Subsequent recoveries of amounts previously written off/impaired are credited to profit or loss/other comprehensive income in the year in which they occur. Unquoted investments are classified as ‘available-for-sale’ financial instruments. Where fair values cannot be reliably measured these investments are carried at cost less provision for impairment. Cash in hand and balances with financial institutions, trade and other receivables and tax recoverable and are classified as loans and receivables and are carried at amortised cost.
Management classify the fair values of financial assets based on the qualitative characteristics of the fair valuation as at the financial year end. The three hierarchy levels used by management are:• Level 1: where fair values are based on non-adjusted
quoted prices in active markets for identical financial assets.
• Level2:wherefairvaluesarebasedonadjustedquotedprices and observable prices of similar financial assets.
• Level3:wherefairvaluesarenotbasedonobservablemarket data.
• Financialliabilities
Reporting accountant’s report For the four years to 31 December 2012 (Continues)
Notes (Continues)

Listing Statement 15th July 2013 59
Financial liabilities measured at amortised cost : These in-clude borrowings, currenttax and trade and other payables. These are initially measured at fair value and subsequent-ly measured at amortised cost, using the effective interest rate method. Borrowings are initially recognised at fair value, net of trans-action costs incurred and are subsequently stated at am-ortised cost. Any difference between the proceeds (net of transaction costs) and the redemption value is recognised as interest expense in profit or loss under finance costs. All financial liabilities are classified as current liabilities un-less the company has an unconditional right to defer settle-ment of the liability for at least 12 months after the reporting date.
Financial liabilities are derecognised when, and only when, the company’s obligations aredischarged, cancelled or ex-pired.
g) Inventories Inventories comprise of land and units held for sale and is stated at the lower of cost and net realisable value. Cost is determined by the first-in-first-out (FIFO) basis and compris-es all costs attributable to purchase of the land. Where the land is held for trading, the land is reclassified from finance lease to inventory. The risks and rewards of ownership of the land are transferred buyers on conclusion of sale.
h) Cash and cash equivalents For the purposes of the cash flow statement, cash and cash equivalents comprise cash in hand and deposits held at call with banks.
i) Share capital Ordinary shares are classified as equity. Mandatorily re-deemable preference shares are classified as liabilities. j) Dividends Proposed dividends are disclosed as a separate compo-nent of equity until declared.
Dividends are recognised as a liabilities in the period in which they are approved by the group’s shareholders. k) Taxation Current tax Current tax is provided on the results for the year, adjusted
in accordance with tax legislation.Deferred tax Deferred tax is provided using the liability method for all temporary timing differences arising between the tax bases of assets and liabilities and their carrying values for financial reporting purposes. Currently enacted tax rates are used to determine deferred tax. Deferred tax assets are recognised only to the extent that it is probable that future taxable profits will be availableagainst which temporary timing dif-ferences can be utilised.
l) Accounting for leases The group as lessee Leases of assets where the group assumes substantially all the risks and rewards of ownership, are classified as finance leases.
Assets held under finance leases are initially recognised as assets of the Group at their fair value at the inception of the lease or, if lower, at the present value of the minimum lease payments. The corresponding liability to the lessor is included in the consolidated statement of financial position as a finance lease obligation.
Lease payments are apportioned between finance expens-es and reduction of the lease obligation so as to achieve a constant rate of interest on the remaining balance of the liability.
Finance expenses are recognised immediately in profit or loss, unless they are directly attributable to qualifying as-sets, in which case they are capitalised in accordance with the Contingent rentals are recognised as expenses in the periods in which they are incurred. Such property, plant and equipment is depreciated over its useful life.
m) Retirement benefit obligations The group and its employees contribute to the National So-cial Security Fund (NSSF), a statutory defined contribution scheme registered under the NSSF Act. The group’s contri-butions to the defined contribution scheme are charged to profit or loss in the year to which they relate. n) Comparatives Where necessary, comparatives figures have been adjust-ed to conform with changes in presentation in the current year.
Reporting accountant’s report For the four years to 31 December 2012 (Continues)
Notes (Continues)

Listing Statement 15th July 201360
2012 2011 2010 2009 Notes Shs Shs Shs Shs Revenue 1 839,116,340 520,476,605 56,547,000 2,944,438 Cost of sales (331,897,043) (491,793,544) (23,309,000) - Gross profit 507,219,297 28,683,061 33,238,000 2,944,438 Other operating income 2 5,083,007 1,709,441 17,042,322 8,495,962
Selling and distribution (42,427,279) (103,254,922) (5,188,969) (7,470) Administrative expenses (110,572,075) (113,247,681) (16,356,579) (22,011,113)
Other operating expenses (21,577,619) (20,713,448) (4,512,308) (2,523,260) Operating profit/(loss) 3 337,725,331 (206,823,549) 24,222,466 (13,101,443)Finance costs 5 (79,875,635) (78,274,462) - - Profit/(loss) before tax 257,849,696 (285,098,011) 24,222,466 (13,101,443) Tax (charge)/credit 6 (90,169,745) 84,643,400 (9,160,791) (1,047,359) Profit for the year 167,679,951 (200,454,611) 15,061,675 (14,148,802) Total comprehensive income/(loss) for the year/period 167,679,951 (200,454,611) 15,061,675 (14,148,802) Profit/(loss) attributable to: - Owners of the parent 94,592,746 (136,177,332) 10,248,175 (14,148,802)-Non-controlling interest 73,087,205 (64,277,279) 4,813,500 - 167,679,951 (200,454,611) 15,061,675 (14,148,802)Earnings/(loss) per share - basic 11 4.67 (89,590.35) 10,248.18 (14,148.80)
Reporting accountant’s report For the four years to 31 December 2012 (Continues)
Consolidated Statement Of Profit or Loss and other Comprehensive Income

Listing Statement 15th July 2013 61
As at 31 December 2012 2011 2010 2009
Notes Shs Shs Shs Shs
CAPITAL EMPLOYED
Share capital 7 405,255,320 204,000 100,000 100,000
Share premium 8 68,842,038 456,718,358 354,470,857 176,691,715
Accumulated deficit (84,332,213) (140,077,959) (3,900,627) (14,148,802)
Shareholders’ funds 389,765,145 316,844,399 350,670,230 162,642,913
Non-controlling interest (20,426,174) (93,513,779) 4,863,500 -
-
369,338,971 223,330,620 355,533,730 162,642,913
Non-current liabilities
Preference share capital 9 150,000,000 150,000,000 150,000,000 -
Deposit for shares 23(iii) 50,748,500 - - -
Borrowings 10 39,864,777 36,964,286 159,162,000 -
240,613,277 186,964,286 309,162,000 -
609,952,248 410,294,906 664,695,730 162,642,913
REPRESENTED BY
Non-current assets
Property and equipment 13 895,744,891 770,256,338 57,414,083 1,255,470
Intangible asset 14 236,503 472,770 - -
Goodwill on consolidation 15 74,284,247 74,284,247 74,284,247 -
Deposit for shares 16 - - - 75,000,000
Financial asset 17 2,000 - - 49,334,247
Deferred tax 12 12,458,034 86,185,796 1,304,679 -
982,725,675 931,199,151 133,003,009 125,589,717
Current assets
Inventories 18 1,271,606,432 1,332,691,238 632,289,000 -
Trade and other receivables 19 114,326,433 50,797,669 69,041,788 463,143
Cash and cash equivalents 20 153,078,889 63,589,864 154,210,003 38,351,034
Tax recoverable - 9,862,431 - -
1,539,011,754 1,456,941,202 855,540,791 38,814,177
Current liabilities
Deposits payable 440,659 440,659 440,659 400,000
Trade and other payables 21 1,748,715,788 1,456,021,170 154,085,354 806,536
Borrowings 10 157,247,262 521,383,618 159,162,000 -
Tax payable 5,381,472 - 10,160,057 554,445
1,911,785,181 1,977,845,447 323,848,070 1,760,981
Net current (liabilities)/assets (372,773,427) (520,904,245) 531,692,721 37,053,196
609,952,248 410,294,906 664,695,730 162,642,913
Reporting accountant’s report For the four years to 31 December 2012 (Continues)
Consolidated Statement of Financial Position

Listing Statement 15th July 201362
Ordinary Non Share Share Accumulated controlling capital premium deficit interest Total Shs Shs Shs Shs ShsPeriod ended 31 December 2009 At start of period - - - - - Total comprehensive loss for the period - - (14,148,802) - (14,148,802) Transactions with owners: Issue of shares 100,000 - - - 100,000 Share premium - Issue for cash - 160,806,622 - - 160,806,622 - Issued to promoters - 15,885,093 - - 15,885,093 At end of period 100,000 176,691,715 (14,148,802) - 162,642,913 Year ended 31 December 2010 At start of year 100,000 176,691,715 (14,148,802) - 162,642,913 Total comprehensive income for the year - - 10,248,175 4,813,500 15,061,675 Transactions with owners: Issue of shares - 180,651,245 - 50,000 180,701,245 Share premium paid - (2,872,103) - - (2,872,103) At the end of year 100,000 354,470,857 (3,900,627) 4,863,500 355,533,730
Reporting accountant’s report For the four years to 31 December 2012 (Continues)
Consolidated Statement of Changes in Equity

Listing Statement 15th July 2013 63
Reporting accountant’s report For the four years to 31 December 2012 (Continues)
Consolidated Statement of Changes in Equity (Continued)
Ordinary Non Share Share Accumulated controlling capital premium deficit interest Total Shs Shs Shs Shs ShsYear ended 31 December 2011 At start of year 100,000 354,470,857 (3,900,627) 4,863,500 355,533,730 Total comprehensive loss for the year - - (136,177,332) (64,277,279) (200,454,611) Dividends paid to minority interest - - - (34,140,000) (34,140,000) Transactions with owners: Share capitalised 104,000 (104,000) Issue of ordinary share capital - 102,351,501 - 40,000 102,391,501 At end of year 204,000 456,718,358 (140,077,959) (93,513,779) 223,330,620 Year ended 31 December 2012 At start of year 204,000 456,718,358 (140,077,959) (93,513,779) 223,330,620 Total comprehensive income for the year - - 94,592,746 73,087,205 167,679,951 Transactions with owners: Issue of shares - 17,175,000 - 400 17,175,400 Transfer from share premium account 405,051,320 (405,051,320) - - -Dividends: - Final for 2011(paid) - (9,850,000) - (9,850,000) - Interim for 2012 - - (28,997,000) - (28,997,000) At end of year 405,255,320 68,842,038 (84,332,213) (20,426,174) 369,338,971
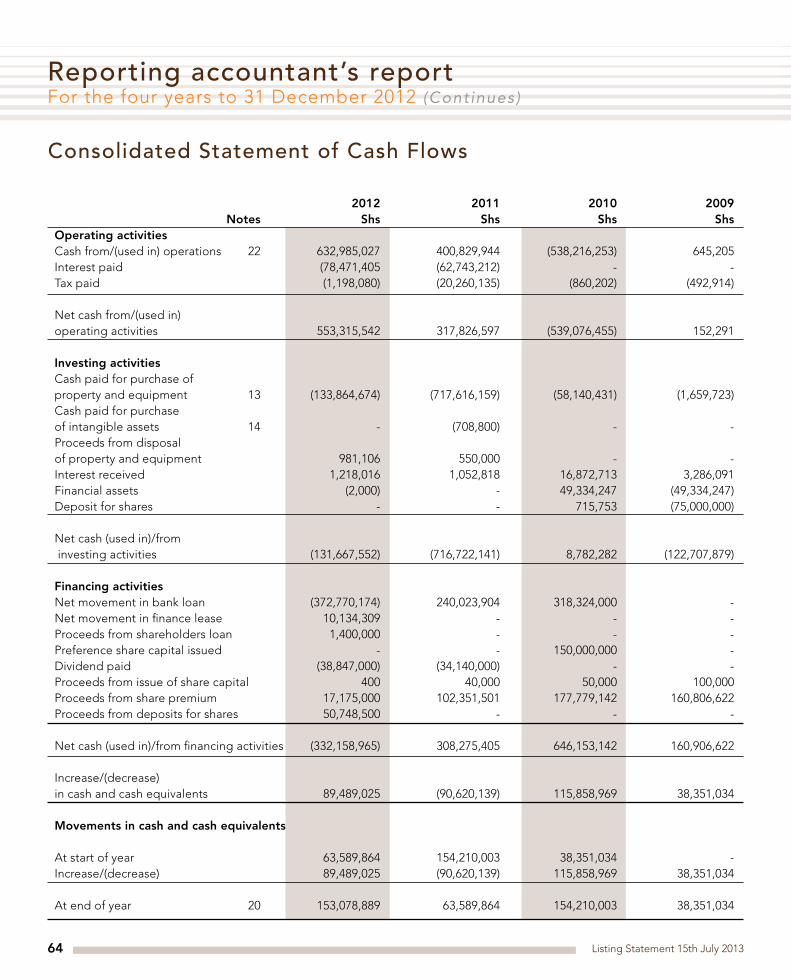
Listing Statement 15th July 201364
2012 2011 2010 2009 Notes Shs Shs Shs ShsOperating activities Cash from/(used in) operations 22 632,985,027 400,829,944 (538,216,253) 645,205 Interest paid (78,471,405 (62,743,212) - -Tax paid (1,198,080) (20,260,135) (860,202) (492,914) Net cash from/(used in) operating activities 553,315,542 317,826,597 (539,076,455) 152,291 Investing activities Cash paid for purchase of property and equipment 13 (133,864,674) (717,616,159) (58,140,431) (1,659,723)Cash paid for purchase of intangible assets 14 - (708,800) - -Proceeds from disposal of property and equipment 981,106 550,000 - -Interest received 1,218,016 1,052,818 16,872,713 3,286,091 Financial assets (2,000) - 49,334,247 (49,334,247)Deposit for shares - - 715,753 (75,000,000) Net cash (used in)/from investing activities (131,667,552) (716,722,141) 8,782,282 (122,707,879) Financing activities Net movement in bank loan (372,770,174) 240,023,904 318,324,000 -Net movement in finance lease 10,134,309 - - -Proceeds from shareholders loan 1,400,000 - - -Preference share capital issued - - 150,000,000 -Dividend paid (38,847,000) (34,140,000) - -Proceeds from issue of share capital 400 40,000 50,000 100,000 Proceeds from share premium 17,175,000 102,351,501 177,779,142 160,806,622 Proceeds from deposits for shares 50,748,500 - - - Net cash (used in)/from financing activities (332,158,965) 308,275,405 646,153,142 160,906,622 Increase/(decrease) in cash and cash equivalents 89,489,025 (90,620,139) 115,858,969 38,351,034 Movements in cash and cash equivalents At start of year 63,589,864 154,210,003 38,351,034 -Increase/(decrease) 89,489,025 (90,620,139) 115,858,969 38,351,034 At end of year 20 153,078,889 63,589,864 154,210,003 38,351,034
Reporting accountant’s report For the four years to 31 December 2012 (Continues)
Consolidated Statement of Cash Flows

Listing Statement 15th July 2013 65
Reporting accountant’s report For the four years to 31 December 2012 (Continues)
Notes to the Reporting Accountant’s Report
1. Revenue 2012 2011 2010 2009 Shs Shs Shs ShsSale of plots 498,250,000 - - -Sale of office suites 342,066,340 513,419,280 56,547,000 -Project management fees - 7,057,325 - 2,944,438 Commissions income (1,200,000) - - -
839,116,340 520,476,605 56,547,000 2,944,438 2. Other operating income
Gain on disposal of property and equipment 122,463 137,500 - -Commitment fees - - 80,000 2,280,000 Gross rental income 3,328,800 - - -Other income 413,728 519,123 89,609 2,929,871 Interest earned 1,218,016 1,052,818 16,872,713 3,286,091 5,083,007 1,709,441 17,042,322 8,495,962
3. Operating profit/(loss)
The following items have been charged in arriving at operating profit/(loss): Depreciation on property and equipment (Note 13) 7,517,478 4,361,334 1,981,818 404,253 Amortisation of intangible assets (Note 14) 236,267 236,030 - -Auditors’ remuneration - current year 2,034,000 2,734,112 1,026,200 237,800 - under provision in prior years 188,000 - - -Staff costs (Note 4) 45,547,868 31,674,452 5,703,087 2,075,480
4. Staff costs
Salaries and wages 42,805,181 31,437,452 5,529,487 1,988,480 Other staff costs 2,569,087 150,000 - -Pension costs: - National Social Security Fund 173,600 87,000 173,600 87,000 45,547,868 31,674,452 5,703,087 2,075,480

Listing Statement 15th July 201366
2012 2011 2010 2009 Shs Shs Shs Shs
5. Finance costs
Interest expense: - borrowings 73,628,555 56,243,212 - -- committment fees 4,842,850 6,500,000 - -- guarantee - 15,400,000 - -- exchange loss on foreign currency borrowings 3,361 131,250 - -- finance leases 1,400,869 - - - 79,875,635 78,274,462 - - 6. Tax Current tax 16,441,984 237,717 10,465,814 1,047,359 Deferred tax charge/(credit) (Note 12) 73,727,761 (84,881,117) (1,305,023) - Tax charge/(credit) 90,169,745 (84,643,400) 9,160,791 1,047,359 The tax on the group’s profit/(loss) before tax differs from the theoretical amount that would arise using the basic rate as follows: Profit/(loss) before tax 257,849,696 (285,098,011) 24,222,466 (13,101,443) Tax calculated at a tax rate of 30% (2011-2009: 30%) 77,354,909 (85,529,403) 7,266,740 (3,930,433) Tax effect of: - expenses not deductible for tax purposes 1,422,985 692,279 1,894,051 4,977,792 - income not subject to tax - (10,053,108) - -- under provision in prior years 106,718 4,788 - -- tax losses carried foward 11,285,133 10,242,044 - - Tax charge/(credit) 90,169,745 (84,643,400) 9,160,791 1,047,359
Reporting accountant’s report For the four years to 31 December 2012 (Continues)
Notes to the Reporting Accountant’s Report (Continued)

Listing Statement 15th July 2013 67
7. Share capital 2012 2011 2010 2009 Shs Shs Shs ShsAuthorised: 50,000,000 (2011:3,000; 2010-2009: 1,000) ordinary shares of shs. 10 500,000,000 300,000 100,000 100,000 (2011-2009: Shs. 100) each Issued and fully paid: 40,525,532 (2011: 2,040; 2010-2009:1,000)ordinary shares of Shs. 10 405,255,320 204,000 100,000 100,000
(2011-2009: Shs.100) each The issued and paid up share capital of the group was increased on 31 December 2012 from Shs. 204,000 to Shs. 405,255,320 by the issuance of 40,525,532 ordinary shares of Shs. 10 each.
Increase of issued share capital from Shs. 100,000 to Shs. 164,000 on 31 October 2011. The authorised share capital of the company was increased from Shs 100,000 to Shs 300,000 on 31 December, 2011. Increase of authorised share capital from Shs 300,000 to Shs 500,000,000 on 25 October 2012. On the same day there was a split of shares at the ratio of 1: 10 where each with an initial par value of Shs. 100 was divided into ten shares of Shs. 10.
8. Share premium 2012 2011 2010 2009 Shs Shs Shs Shs
At start of year 456,718,358 354,470,857 176,691,715 -Share premium paid - - (2,872,103) -Issue for cash 17,175,000 102,351,501 180,651,245 160,806,622 Issued to promoters - - - 15,885,093 Conversion to share capital account (405,051,320) (104,000) - - At end of year 68,842,038 456,718,358 354,470,857 176,691,715
9. Preference share capital
Cumulative redeemable 1,500,000 preference shares of shs. 100 each 150,000,000 150,000,000 150,000,000 -
The preference shares are redeemable at par value on or after 31 December 2012.
Reporting accountant’s report For the four years to 31 December 2012 (Continues)
Notes to the Reporting Accountant’s Report (Continued)

Listing Statement 15th July 201368
10. Borrowings 2012 2011 2010 2009 Shs Shs Shs Shs
The borrowings are made up as follows: Non-current Bank loan 30,535,706 36,964,286 159,162,000 -Finance leases 7,929,071 - - -Shareholders’ loan 1,400,000 - - - 39,864,777 36,964,286 159,162,000 -Current Bank loan 155,042,024 521,383,618 159,162,000 -Finance leases 2,205,238 - - - 157,247,262 521,383,618 159,162,000 - 197,112,039 558,347,904 318,324,000 -
The borrowings are secured by the following: (i)I & M Bank Loan - Joint and several personal guarantees and indemnities of an amount of Shs.45,000,000 each executed by the directors. - First legal charge/mortgage for an amount of Shs.45,000,000 over property known as Office Suite 2 (Penthouse), 5th floor on L.R. No. 2/704, Ngong Road, Nairobi. - First legal charge/mortgage for an amount of Shs.400,000,000 over property L.R. No.2/689 registered in the name of Morningside Properties Limited. - Fixed and floating debenture for an amount of Shs.400,000,000 over all the assets of Suburban Limited. - Corporate guarantee and indemnity for Shs.400,000,000 executed by Home Africa Limited, Morningside Development Limited, Investeq Capital Limited and Morningside Properties Limited.- Joint and several personal guarantees and indemnities for an amount of Shs.400,000,000 each to be executed by the directors.
(ii) Equity Bank Loan - First legal charge of Kshs.100,000,000 over the property Nos HC01, PDS F01, F02, F03, F04, F05, F06, F07 and F09 all being portions curved out of title IR No. 133694 LR No. 29059. - Corporate guarantee by Home Africa Limited for Shs. 100,000,000. - Corporate guarantee by Tulip Trustee group Limited for Shs. 100,000,000. - Corporate guarantee by Linyanti Limited for Shs. 100,000,000.
Reporting accountant’s report For the four years to 31 December 2012 (Continues)
Notes to the Reporting Accountant’s Report (Continued)

Listing Statement 15th July 2013 69
Weighted average effective interest rates at the 2012 2011 2010 2009reporting date were: Shs Shs Shs Shs
Bank borrowings 21.5% 19.5% 19.5% -Finance lease liabilities 23.2% - - - The carrying amounts of the group’s borrowings are denominated in Kenya shillings. Maturity based on the repayment structure of non-current borrowings (excluding finance lease liabilities) is as follows:
2012 2011 2010 2009 Shs Shs Shs Shs
Between 1 and 2 years 12,857,160 12,857,160 159,162,000 -Between 2 and 5 years 24,602,833 24,107,126 - - 37,459,993 36,964,286 159,162,000 -
Gross finance lease liabilities - minimum lease payments
Not later than 1 year 3,463,732 - - -Later than 1 year and not later than 5 years 9,604,864 - - -
Total gross finance leases 13,068,596 - - - Future interest expense on finance leases (2,934,287) - - - Present value of finance leases 10,134,309 - - -
Present value of finance leases - minimum lease payments
Not later than 1 year 2,205,238 - - -Later than 1 year and not later than 5 years 7,929,071 - - -
10,134,309 - - - 11. Earnings/(loss) per share Earnings/(loss) per share is calculated by dividing the net profit/(loss) attributable to shareholders by the weighted average number of ordinary shares in issue during the year. 2012 2011 2010 2009 Shs Shs Shs ShsNet profit/(loss) attributable to shareholders 94,592,746 (136,177,332) 10,248,175 (14,148,802) Weighted average number of ordinary shares 20,245,193 1,520 1,000 1,000 Earnings/(loss) per share 4.67 (89,590.35) 10,248.18 (14,148.80)
10. Borrowings (continued)
Reporting accountant’s report For the four years to 31 December 2012 (Continues)
Notes to the Reporting Accountant’s Report (Continued)

Listing Statement 15th July 201370
12. Deferred tax Deferred tax is calculated, in full, on all temporary timing differences under the liability method using a principal tax rate of 30% (2011-2009: 30%). The movement on the deferred tax account is as follows: 2012 2011 2010 2009 Shs Shs Shs Shs
At start of year/period (86,185,796) (1,304,679) - -Charge/(credit) to profit or loss (Note 6) 73,727,762 (84,881,117) (1,304,679) - At end of year/period (12,458,034) (86,185,796) (1,304,679) -
eferred tax (assets) and liabilities, deferred tax charge/(credit) to other comprehensive income and deferred tax charge/(credit) in profit or loss are attributable to the following items: Charge/(credit) Year ended 31 December 2012 At start to profit or At end of year loss of year Shs Shs Shs
Deferred tax assets Property and equipment (710,053) (132,344) (842,397)Tax losses carried forward (85,475,743) 73,860,106 (11,615,637)
(86,185,796) 73,727,762 (12,458,034) Year ended 31 December 2011
Deferred tax assets Property and equipment 27,344 (737,397) (710,053)Tax losses carried forward (1,332,023) (84,143,720) (85,475,743)
(1,304,679) (84,881,117) (86,185,796)
Year ended 31 December 2010 Deferred tax assets Property and equipment - 27,344 27,344 Tax losses carried forward - (1,332,023) (1,332,023)
- (1,304,679) (1,304,679)
Reporting accountant’s report For the four years to 31 December 2012 (Continues)
Notes to the Reporting Accountant’s Report (Continued)

List
ing
Sta
tem
ent
15th
Jul
y 20
1371
Re
po
rtin
g a
cco
un
tan
t’s
rep
ort
F
or
the
fo
ur
year
s to
31
De
cem
be
r 20
12 (
Co
nti
nu
es)
No
tes
to t
he
Re
po
rtin
g A
cco
un
tan
t’s
Re
po
rt (
Co
nti
nu
ed
)
13
. P
rop
erty
and
eq
uip
men
t (c
ont
inue
d)
Ye
ar e
nded
31
Dec
emb
er 2
012
W
ork
in
M
oto
r C
om
put
er
Furn
itur
e
Offi
ce
pro
gre
ss
Bui
ldin
gs
ve
hicl
es
equi
pm
ent
and
fitt
ing
s eq
uip
men
t To
tal
Shs
Shs
Shs
Shs
Shs
Shs
Shs
Co
st
A
t st
art
of y
ear
65
2,80
3,74
9
107,
758,
474
65
0,00
0
2,79
8,42
0
10,3
72,1
82
2,48
3,26
9
776,
866,
094
Rec
lass
ifica
tio
n to
exp
ense
- (2
,426
,007
) -
- -
- (2
,426
,007
)D
isp
osa
l
- -
- (1
29,0
00)
(878
,106
) -
(1,0
07,1
06)
Ad
dit
ions
119,
644,
750
-
7,20
0,86
0
533
,100
8
78,1
06
8,0
33,8
65
136,
290,
681
At
end
of y
ear
77
2,44
8,49
9
105,
332,
467
7,
850,
860
3,
202,
520
10
,372
,182
10
,517
,134
90
9,72
3,66
2
D
epre
ciat
ion
A
t st
art
of y
ear
-
3,25
4,11
2
162,
500
1,
176,
901
1,
511,
797
50
4,44
6
6,60
9,75
6 D
isp
osa
l
- -
- (3
8,70
0)
(109
,763
) -
(148
,463
)C
harg
e fo
r th
e ye
ar
-
2,61
3,09
5
1,92
2,09
0
596,
076
1,
093,
828
1,
292,
389
7,
517,
478
At
end
of y
ear
-
5,86
7,20
7
2,08
4,59
0
1,73
4,27
7
2,49
5,86
2
1,79
6,83
5
13,9
78,7
71
Net
bo
ok
valu
e
772,
448,
499
99
,465
,260
5,
766,
270
1,
468,
243
7,
876,
320
8,
720,
299
89
5,74
4,89
1

List
ing
Sta
tem
ent
15th
Jul
y 20
1372
Re
po
rtin
g a
cco
un
tan
t’s
rep
ort
F
or
the
fo
ur
year
s to
31
De
cem
be
r 20
12 (
Co
nti
nu
es)
No
tes
to t
he
Re
po
rtin
g A
cco
un
tan
t’s
Re
po
rt (
Co
nti
nu
ed
)
13
. P
rop
erty
and
eq
uip
men
t (c
ont
inue
d)
Year
end
ed 3
1 D
ecem
ber
20
11
Wo
rk in
Mo
tor
Co
mp
uter
Fu
rnit
ure
O
ffice
pro
gre
ss
Bui
ldin
gs
ve
hicl
es
equi
pm
ent
and
fitt
ing
s eq
uip
men
t To
tal
Shs
Shs
Shs
Shs
Shs
Shs
Shs
Co
st
A
t st
art
of y
ear
-
56,5
47,0
00
550,
000
97
7,89
5
954,
731
77
0,30
9
59,7
99,9
35
Ad
dit
ions
652,
803,
749
5
1,21
1,47
4
650,
000
1
,820
,525
9
,417
,451
1
,712
,960
71
7,61
6,15
9 D
isp
osa
l
- -
(550
,000
) -
- -
(550
,000
)
A
t en
d o
f yea
r
652,
803,
749
10
7,75
8,47
4
650,
000
2,
798,
420
10
,372
,182
2,
483,
269
77
6,86
6,09
4
D
epre
ciat
ion
A
t st
art
of y
ear
-
1,41
3,67
5
137,
500
40
5,17
5
227,
040
20
2,53
2
2,38
5,92
2 D
isp
osa
l
- -
(137
,500
) -
- -
(137
,500
)C
harg
e fo
r th
e ye
ar
-
1,84
0,43
7
162,
500
77
1,72
6
1,28
4,75
7
301,
914
4,36
1,33
4 A
t en
d o
f yea
r
- 3,
254,
112
16
2,50
0
1,17
6,90
1
1,51
1,79
7
504,
446
6,
609,
756
N
et b
oo
k va
lue
652,
803,
749
10
4,50
4,36
2
- 1,
621,
519
8,
860,
385
1,
978,
823
77
0,25
6,33
8

List
ing
Sta
tem
ent
15th
Jul
y 20
1373
Re
po
rtin
g a
cco
un
tan
t’s
rep
ort
F
or
the
fo
ur
year
s to
31
De
cem
be
r 20
12 (
Co
nti
nu
es)
No
tes
to t
he
Re
po
rtin
g A
cco
un
tan
t’s
Re
po
rt (
Co
nti
nu
ed
)
13
. P
rop
erty
and
eq
uip
men
t (c
ont
inue
d)
Ye
ar e
nded
31
Dec
emb
er 2
010
Mo
tor
Co
mp
uter
Fu
rnit
ure
O
ffice
Bui
ldin
gs
ve
hicl
es
equi
pm
ent
and
fitt
ing
s eq
uip
men
t To
tal
Co
st
Shs
Shs
Shs
Shs
Shs
Shs
At
star
t o
f yea
r -
- 3
54,4
95
657
,650
6
47,5
78
1,6
59,7
23
Ad
diti
ons
5
6,54
7,00
0
550,
000
6
23,2
00
297
,500
1
22,7
31
58,
140,
431
At
end
of
year
5
6,54
7,00
0
550,
000
9
77,6
95
955
,150
7
70,3
09
59,8
00,1
54
Dep
reci
atio
n
At
star
t o
f yea
r -
- 1
59,5
23
123
,309
1
21,4
21
404
,253
C
harg
e fo
r th
e ye
ar
1,4
13,6
75
138,
000
2
45,0
52
103
,980
8
1,11
1
1,9
81,8
18
At
end
of
year
1
,413
,675
1
38,0
00
404
,575
2
27,2
89
202
,532
2
,386
,071
N
et b
oo
k va
lues
5
5,13
3,32
5
412
,000
5
73,1
20
727
,861
5
67,7
77
57,
414,
083
Year
end
ed 3
1 D
ecem
ber
200
9
Co
st
A
t st
art
of y
ear
- -
- -
- -
Ad
diti
ons
-
- 3
54,4
95
657
,650
6
47,5
78
1,6
59,7
23
At
end
of
year
-
- 3
54,4
95
657
,650
6
47,5
78
1,6
59,7
23
Dep
reci
atio
n
At
star
t o
f yea
r -
- -
- -
-C
harg
e fo
r th
e ye
ar
- -
159
,523
1
23,3
09
121
,421
4
04,2
53
At
end
of
year
-
- 1
59,5
23
123
,309
1
21,4
21
404
,253
Net
bo
ok
valu
es
- -
194
,972
5
34,3
41
526
,157
1
,255
,470
Bui
ldin
gs
amo
untin
g t
o S
hs. 4
4,54
0,13
3 ha
ve b
een
ple
dg
ed a
s se
curit
y ag
ains
t b
orr
ow
ing
s as
dis
clo
sed
in N
ote
10.

Listing Statement 15th July 201374
14. Intangible assets - software 2012 2011 2010 2009 Shs Shs Shs ShsCost At start of year 708,800 - - -Additions - Website cost - 708,800 - - At end of year 708,800 708,800 - - Accumulated amortisation At start of year 236,030 - - -Amortisation for the year 236,267 236,030 - - At end of year 472,297 236,030 - - Carrying amount 236,503 472,770 - -
15. Goodwill At cost 74,284,247 74,284,247 74,284,247 - The goodwill arose from acquisition of a subsidiary, Suburban Limited. Goodwill has been allocated for impairment testing purpose to the cash generating unit, the inventory of the subsidiary company. The unit continues to generate positive cash flows. The recoverable cash is based on the current market trends in the real estate industry. The cash flows are from the generating unit are based on expected return on capital invested at a rate of up to 100%. Management is of the opinion that any possible reasonable change in these assumptions would not cause the carrying amount to exceed the recoverable amount. 16. Deposit for shares 2012 2011 2010 2009 Shs Shs Shs Shs
Deposit for shares in Suburban Limited - - - 75,000,000
Reporting accountant’s report For the four years to 31 December 2012 (Continues)
Notes to the Reporting Accountant’s Report (Continued)

Listing Statement 15th July 2013 75
17. Financial assets 2012 2011 2010 2009 Shs Shs Shs ShsLoans and advances Receivables from related parties - - - 49,334,247 Available-for-sale financial assets Morningside Office Park Limited 12% 2,000 - - - Total financial assets 2,000 - - 49,334,247
The loan represents an amount advanced to Suburban Limited during the process of formation and starting operations. The loan attracts interest at 25% per annumn with effect from 1st January 2010. 18. Inventories 2012 2011 2010 2009 Shs Shs Shs Shs
Plots held for sale 626,356,035 643,475,926 75,000,000 - Units held for sale 158,495,729 413,364,498 557,289,000 - Work in progress 486,754,668 275,850,814 - - 1,271,606,432 1,332,691,238 632,289,000 -
19. Trade and other receivables Current Trade receivables 48,000,000 10,000,000 - -Other receivables 44,640,085 23,742,616 2,905,549 -VAT recoverable - - 65,924,000 -Deposits and prepayments 630,412 585,139 212,239 212,239 Shareholders account 602,000 100,000 - -Due from directors 5,735,500 - - 250,904 Receivables from related parties (Note 23(ii)) 14,718,436 16,369,914 - - 114,326,433 50,797,669 69,041,788 463,143
In the opinion of the directors, the carrying amounts of trade and other receivables approximate to their fair value. The directors are of the opinion that the company’s exposure is limited because the debt is widely held. The carrying amounts of the group’s trade and other receivables are denominated in Kenya shillin
Reporting accountant’s report For the four years to 31 December 2012 (Continues)
Notes to the Reporting Accountant’s Report (Continued)
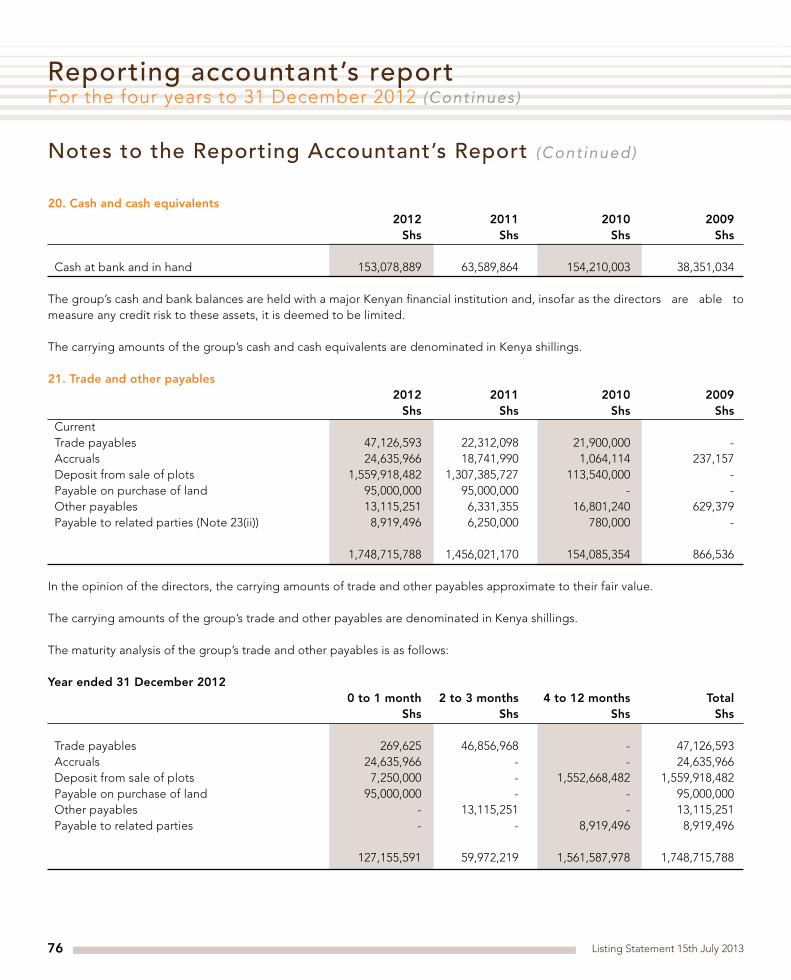
Listing Statement 15th July 201376
20. Cash and cash equivalents 2012 2011 2010 2009 Shs Shs Shs Shs
Cash at bank and in hand 153,078,889 63,589,864 154,210,003 38,351,034
The group’s cash and bank balances are held with a major Kenyan financial institution and, insofar as the directors are able to measure any credit risk to these assets, it is deemed to be limited. The carrying amounts of the group’s cash and cash equivalents are denominated in Kenya shillings. 21. Trade and other payables 2012 2011 2010 2009 Shs Shs Shs Shs
Current Trade payables 47,126,593 22,312,098 21,900,000 -Accruals 24,635,966 18,741,990 1,064,114 237,157 Deposit from sale of plots 1,559,918,482 1,307,385,727 113,540,000 -Payable on purchase of land 95,000,000 95,000,000 - -Other payables 13,115,251 6,331,355 16,801,240 629,379 Payable to related parties (Note 23(ii)) 8,919,496 6,250,000 780,000 - 1,748,715,788 1,456,021,170 154,085,354 866,536
In the opinion of the directors, the carrying amounts of trade and other payables approximate to their fair value. The carrying amounts of the group’s trade and other payables are denominated in Kenya shillings.
The maturity analysis of the group’s trade and other payables is as follows: Year ended 31 December 2012 0 to 1 month 2 to 3 months 4 to 12 months Total Shs Shs Shs Shs
Trade payables 269,625 46,856,968 - 47,126,593 Accruals 24,635,966 - - 24,635,966 Deposit from sale of plots 7,250,000 - 1,552,668,482 1,559,918,482 Payable on purchase of land 95,000,000 - - 95,000,000 Other payables - 13,115,251 - 13,115,251 Payable to related parties - - 8,919,496 8,919,496
127,155,591 59,972,219 1,561,587,978 1,748,715,788
Reporting accountant’s report For the four years to 31 December 2012 (Continues)
Notes to the Reporting Accountant’s Report (Continued)

Listing Statement 15th July 2013 77
Year ended 31 December 2011 0 to 1 month 2 to 3 months 4 to 12 months Total Shs Shs Shs Shs
Trade payables 22,312,098 - - 22,312,098 Accruals 18,741,990 - - 18,741,990 Deposit from sale of plots 1,307,385,727 - - 1,307,385,727 Payable on purchase of land - 95,000,000 - 95,000,000 Other payables - 6,331,355 - 6,331,355 Payable to related parties - - 6,250,000 6,250,000 1,348,439,815 101,331,355 6,250,000 1,456,021,170
Year ended 31 December 2010
Trade payables 21,900,000 - - 21,900,000 Accruals 1,064,114 - - 1,064,114 Deposit from sale of plots 113,540,000 - - 113,540,000 Other payables - 16,801,240 - 16,801,240 Payable to related parties - - 780,000 780,000 136,504,114 16,801,240 780,000 154,085,354
Year ended 31 December 2009
Trade payables 629,379 - - 629,379 Accruals 237,157 - - 237,157 866,536 - - 866,536
21. Trade and other payables (continued)
Reporting accountant’s report For the four years to 31 December 2012 (Continues)
Notes to the Reporting Accountant’s Report (Continued)

Listing Statement 15th July 201378
22. Cash from operations 2012 2011 2010 2009 Shs Shs Shs Shs
Reconciliation of profit/(loss) before tax to cash used in operations: Profit/(loss) before tax 257,849,696 (285,098,011) 24,222,466 (13,101,443) Adjustments for: Depreciation on property and equipment (Note 13) 7,517,478 4,361,334 1,981,818 404,253 Amortization intangible assets (Note 14) 236,267 236,030 - -Interest expense (Note 5) 78,471,405 62,743,212 - -Gain on disposal of property and equipment (122,463) (137,500) - -Issue of shares to promoters - - - 15,885,093 Interest income (Note 2) (1,218,016) (1,052,818) (16,872,713) (3,286,091)Changes in working capital: - Deposits payable - - 40,659 400,000 - Inventories 61,084,806 (700,402,238) (632,288,656) - -- Trade and other receivables (63,528,764) 18,244,119 (68,578,645) (463,143)- Trade and other payables 292,694,618 1,301,935,816 153,278,818 806,536
Cash from/(used in) operations 632,985,027 400,829,944 (538,216,253) 645,205 23. Related party transactions and balances 2012 2011 2010 2009The following transactions were Shs Shs Shs Shscarried out with related parties: (i) Key management personnel compensation
Short term employee benefits 29,221,135 33,680,777 5,466,261 17,715,033 (ii) Outstanding balances arising from payments
to/received from related parties Receivable from related parties (Note 19) 14,718,436 - 16,369,914 - -
The receivables from related parties are interest free, have no specific dates of repayment and are unsecured. Payable to related parties (Note 21) 8,919,496 6,250,000 780,000 - The payables to related parties are interest free, have no specific dates of repayment and are unsecured.
Reporting accountant’s report For the four years to 31 December 2012 (Continues)
Notes to the Reporting Accountant’s Report (Continued)
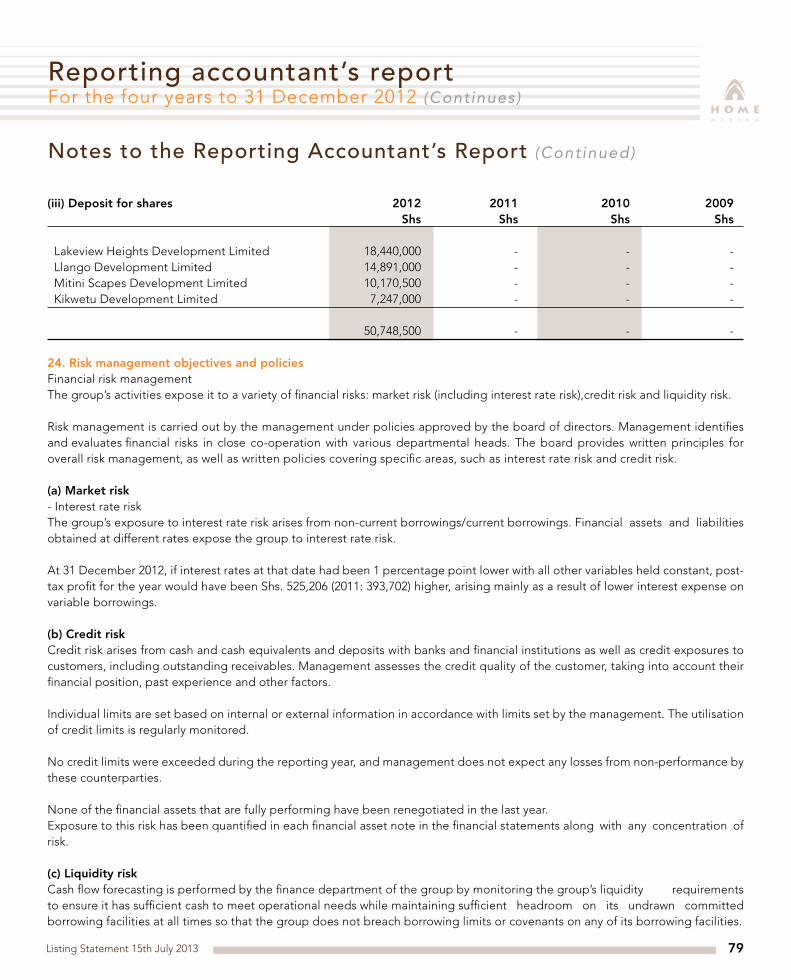
Listing Statement 15th July 2013 79
(iii) Deposit for shares 2012 2011 2010 2009 Shs Shs Shs Shs Lakeview Heights Development Limited 18,440,000 - - -Llango Development Limited 14,891,000 - - -Mitini Scapes Development Limited 10,170,500 - - -Kikwetu Development Limited 7,247,000 - - - 50,748,500 - - -
24. Risk management objectives and policies Financial risk management The group’s activities expose it to a variety of financial risks: market risk (including interest rate risk),credit risk and liquidity risk. Risk management is carried out by the management under policies approved by the board of directors. Management identifies and evaluates financial risks in close co-operation with various departmental heads. The board provides written principles for overall risk management, as well as written policies covering specific areas, such as interest rate risk and credit risk. (a) Market risk - Interest rate risk The group’s exposure to interest rate risk arises from non-current borrowings/current borrowings. Financial assets and liabilities obtained at different rates expose the group to interest rate risk. At 31 December 2012, if interest rates at that date had been 1 percentage point lower with all other variables held constant, post-tax profit for the year would have been Shs. 525,206 (2011: 393,702) higher, arising mainly as a result of lower interest expense on variable borrowings. (b) Credit risk Credit risk arises from cash and cash equivalents and deposits with banks and financial institutions as well as credit exposures to customers, including outstanding receivables. Management assesses the credit quality of the customer, taking into account their financial position, past experience and other factors. Individual limits are set based on internal or external information in accordance with limits set by the management. The utilisation of credit limits is regularly monitored. No credit limits were exceeded during the reporting year, and management does not expect any losses from non-performance by these counterparties. None of the financial assets that are fully performing have been renegotiated in the last year. Exposure to this risk has been quantified in each financial asset note in the financial statements along with any concentration of risk. (c) Liquidity risk Cash flow forecasting is performed by the finance department of the group by monitoring the group’s liquidity requirements to ensure it has sufficient cash to meet operational needs while maintaining sufficient headroom on its undrawn committed borrowing facilities at all times so that the group does not breach borrowing limits or covenants on any of its borrowing facilities.
Reporting accountant’s report For the four years to 31 December 2012 (Continues)
Notes to the Reporting Accountant’s Report (Continued)

Listing Statement 15th July 201380
26. Incorporation Home Afrika Limited is incorporated in Kenya under the Companies Act as a public limited liability group and is domiciled in Kenya. 27. Presentation currency The financial statements are presented in Kenya Shillings (Shs).
Prudent liquidity risk management implies maintaining sufficient cash, the availability of funding through an adequate amount of committed credit facilities and the ability to close out market positions. Due to the dynamic nature of the underlying businesses, the group’s management maintains flexibility in funding by maintaining availability under committed credit lines. Notes 10 and 21 disclose the maturity analysis of borrowings and trade and other payables respectively. 25. Capital management Internally imposed capital requirements - to provide an adequate return to shareholders by pricing products and services commensurate with the level of risk; - to comply with the capital requirements set out by the group’s bankers; - to safeguard the entity’s ability to continue as a going concern, so that it can continue to provide returns for shareholders
and benefits for other stakeholders; and - to maintain a strong asset base to support the development of business. - to maintain an optimal capital structure to reduce the cost of capital.
The group sets the amount of capital in proportion to risk. The group manages the capital structure and makes adjustments to it in the light of changes in economic conditions and the risk characteristics of the underlying assets. In order to maintain or adjust the capital structure, the group may adjust the amount of dividends paid to shareholders, return capital to shareholders, issue new shares, or sell assets to reduce debt. Consistently with others in the industry, the group monitors capital on the basis of the gearing ratio. This ratio is calculated as net debt divided by capital. Net debt is calculated as total debt (as shown in the statement of financial position) less cash and cash equivalents. Capital comprises all components of equity (i.e. share capital, share premium and other reserves retained earnings).
The gearing ratios at 31 December 2012, 2011, 2010 and 2009 were as follows: 2012 2011 2010 2009 Shs Shs Shs Shs
Total borrowings (Note 10) 197,112,039 558,347,904 318,324,000 -
Less cash and cash equivalents (Note 20) 153,078,889 63,589,864 154,210,003 38,351,034
Net debt 44,033,150 494,758,040 164,113,997 (38,351,034) Total equity 389,765,145 316,844,399 350,670,230 162,642,913 Gearing ratio 0.1:1 1.6:1 0.5:1 -
Reporting accountant’s report For the four years to 31 December 2012 (Continues)
Notes to the Reporting Accountant’s Report (Continued)

Pent Suite 01, 5th Floor,Morningside Office Park, Ngong Road.P.O. Box 6254 00100, Nairobi, Kenya.
Tel: +254 (0)20 277-2000Email: [email protected]
Website: www.homeafrika.com


![INDEX [] · INDEX In this month’s issue: Deadline to submit articles: the 15th of each month. Please submit articles ... Find an ETCP Certified Rigger Online The listing of ETCP](https://static.fdocuments.in/doc/165x107/5bdba74909d3f248078c56c1/index-index-in-this-months-issue-deadline-to-submit-articles-the-15th.jpg)