Listed company’s name: Kawasaki Heavy Industries, Ltd. · attributable to owners of parent...
24
1 Report of Earnings and Financial Statements for the Fiscal Year Ended March 31, 2019 (Consolidated) (Prepared pursuant to Japanese GAAP) April 25, 2019 Listed company’s name: Kawasaki Heavy Industries, Ltd. Listed on: 1st sections of the TSE, and NSE Stock code: 7012 URL: https://www.khi.co.jp/ Representative: Yoshinori Kanehana, President Contact: Tatsuo Hoshino, Senior Manager, Accounting Department Tel: +81 3-3435-2130 Scheduled dates: Ordinary general meeting of shareholders June 26, 2019 Commencement date of dividend payments June 27, 2019 Submission of financial statements June 26, 2019 Supplementary materials to financial results Available Earnings presentation Conducted (for institutional investors, analysts and the press) 1. Consolidated Financial Results for the Fiscal Year Ended March 31, 2019 (April 1, 2018 – March 31, 2019) (Amounts in million yen rounded down to the nearest million yen) (1) Operating Results Years ended March 31 (Percentage figures indicate change compared with the previous fiscal year) Net sales Operating income Recurring profit Net income attributable to owners of parent million yen % million yen % million yen % million yen % 2019 1,594,743 1.3 64,023 14.4 37,861 (12.4) 27,453 (5.0) 2018 1,574,242 3.6 55,925 21.6 43,225 17.8 28,915 10.3 Note: Comprehensive income Fiscal year ended March 31, 2019: ¥ 23,183 million (41.5%) Fiscal year ended March 31, 2018: ¥ 39,683 million 56.6% Years ended March 31 Earnings per share Earnings per share – diluted Return on equity Return on assets Operating income to net sales Yen Yen % % % 2019 164.34 - 5.8 2.0 4.0 2018 173.09 - 6.4 2.4 3.5 For reference: Equity in income of non-consolidated subsidiaries and affiliates Fiscal year ended March 31, 2019: ¥ 1,574 million Fiscal year ended March 31, 2018: ¥ 4,492 million Note: As the Company carried out a share consolidation with a 10:1 ratio of common shares with an effective date of October 1, 2017, earnings per share has been calculated assuming this share consolidation was carried out at the beginning of the fiscal year ended March 31, 2018.
Transcript of Listed company’s name: Kawasaki Heavy Industries, Ltd. · attributable to owners of parent...

1
Report of Earnings and Financial Statements for the Fiscal Year Ended March 31, 2019 (Consolidated)
(Prepared pursuant to Japanese GAAP)
April 25, 2019
Listed company’s name: Kawasaki Heavy Industries, Ltd.
Listed on: 1st sections of the TSE, and NSE
Stock code: 7012
URL: https://www.khi.co.jp/
Representative: Yoshinori Kanehana, President
Contact: Tatsuo Hoshino, Senior Manager, Accounting Department
Tel: +81 3-3435-2130 Scheduled dates:
Ordinary general meeting of shareholders June 26, 2019
Commencement date of dividend payments June 27, 2019
Submission of financial statements June 26, 2019 Supplementary materials to financial results Available
Earnings presentation Conducted (for institutional investors, analysts and the
press) 1. Consolidated Financial Results for the Fiscal Year Ended March 31, 2019
(April 1, 2018 – March 31, 2019)
(Amounts in million yen rounded down to the nearest million yen)
(1) Operating Results
Years ended March 31 (Percentage figures indicate change compared with the previous fiscal year)
Net sales Operating income Recurring profit Net income attributable
to owners of parent
million yen % million yen % million yen % million yen %
2019 1,594,743 1.3 64,023 14.4 37,861 (12.4) 27,453 (5.0)
2018 1,574,242 3.6 55,925 21.6 43,225 17.8 28,915 10.3
Note: Comprehensive income Fiscal year ended March 31, 2019: ¥ 23,183 million (41.5%)
Fiscal year ended March 31, 2018: ¥ 39,683 million 56.6%
Years ended March 31
Earnings per share Earnings per share
– diluted Return on equity Return on assets
Operating income
to net sales
Yen Yen % % %
2019 164.34 - 5.8 2.0 4.0
2018 173.09 - 6.4 2.4 3.5
For reference: Equity in income of non-consolidated subsidiaries and affiliates
Fiscal year ended March 31, 2019: ¥ 1,574 million
Fiscal year ended March 31, 2018: ¥ 4,492 million
Note: As the Company carried out a share consolidation with a 10:1 ratio of common shares with an effective date of October 1, 2017, earnings per share has been calculated assuming this share consolidation was carried out at the beginning of the fiscal year ended March 31, 2018.

2
(2) Financial Condition
March 31
Total assets Net assets Equity ratio Net assets per share
million yen million yen % Yen
2019 1,838,855 492,261 25.9 2,851.84
2018 1,785,028 481,386 26.1 2,789.99
For reference: Shareholders’ equity March 31, 2019: ¥ 476,387 million
March 31, 2018: ¥ 466,061 million
Note: As the Company carried out a share consolidation with a 10:1 ratio of common shares with an
effective date of October 1, 2017, net assets per share has been calculated assuming this share
consolidation was carried out at the beginning of the fiscal year ended March 31, 2018.
(3) Cash Flow Position
Years ended March 31 (Million yen)
Cash flow from
operating activities
Cash flow from
investing activities
Cash flow from
financing activities
Cash and cash equivalents
at end of year
2019 109,762 (85,344) (19,771) 68,311
2018 56,050 (80,590) 37,770 64,362
2. Dividends Years ended/ending March 31
Record
date or
term
Dividend per share Total
dividends
paid
(annual)
Payout ratio
(consolidated)
Dividends /
Net assets
(consolidated) 1Q 2Q 3Q Year-end Full year
Yen Yen Yen Yen Yen million yen % %
2018 - 3.00 - 30.00 - 10,023 34.6 2.2
2019 - 35.00 - 35.00 70.00 11,693 42.5 2.4
2020
(forecast) - 35.00 - 35.00 70.00 30.7
Note: The Company conducted a share consolidation with a 10:1 ratio of common shares, with an
effective date of October 1, 2017. The dividend per share for the fiscal year ended March 31, 2018
affected by the impact of the share consolidation is shown. The total annual dividend for the fiscal
year ended March 31, 2018 is denoted with the “-“mark. Without the impact of the share
consolidation factored in, the dividend per share for the fiscal year ended March 31, 2018 would be
¥3 per share, and the total annual dividend would be ¥6 per share.
3. Forecast of Consolidated Earnings for the Fiscal Year Ending March 31, 2020
(April 1, 2019 – March 31, 2020) (Percentage figures indicate change compared with the previous fiscal year)
Net sales Operating income Recurring profit
Net income
attributable to owners
of parent
Earnings
per share
million yen % million yen % million yen % million yen % Yen
Full year 1,700,000 6.6 72,000 12.4 61,000 61.1 38,000 38.4 227.48

3
*Notes
(1) Changes affecting the status of material subsidiaries (scope of consolidation): None
(2) Changes in accounting policies, changes in accounting estimates, and correction of errors
(i) Changes in accounting policies in accord with revisions to accounting standards: None
(ii) Changes in accounting policies other than (i): None
(iii) Changes in accounting estimates: None
(iv) Correction of errors: None
(3) Number of shares issued and outstanding (common stock)
(i) Number of shares issued as of period-end (including treasury stock)
March 31, 2019: 167,080,532 shares
March 31, 2018: 167,080,532 shares
(ii) Number of shares held in treasury as of period-end
March 31, 2019: 35,196 shares
March 31, 2018: 33,049 shares
(iii) Average number of shares during respective periods
March 31, 2019: 167,046,422 shares
March 31, 2018: 167,051,224 shares
*As the Company carried out a share consolidation with a 10:1 ratio of common shares with an effective date of
October 1, 2017, the average number of shares during respective periods has been calculated assuming that
this share consolidation was carried out at the beginning of the fiscal year ended March 31, 2018.
*Report of Earnings and Financial Statements are not subject to audit.
*Appropriate Use of Financial Forecasts and Other Important Matters
Forward-Looking Statements
These materials contain earnings forecast and other forward-looking statements based on information
available to the Company at the time of disclosure and the Company makes no assurances as to the actual
results and/or other outcomes, which may differ from those expressed or implied herein due to various
factors. For assumptions underlying earnings forecasts and other information regarding the use of such
forecasts, refer to “(4) Consolidated earnings outlook” on page 10 in section “1. Overview of operating
results” in the Accompanying Materials.
How to Obtain Supplementary Briefing Material on Financial Results and Details of the Financial
Results Briefing
The Company plans to conduct a briefing for institutional investors, analysts and the press on Thursday
April 25, 2019, and to post the briefing material on financial results to be used for the briefing on TDnet
and the Company’s website simultaneously with the announcement of financial results.

4
Accompanying Materials – Contents
1. Overview of operating results 5
(1) Consolidated operating results 5
(2) Consolidated financial condition 9
(3) Cash flows 9
(4) Consolidated earnings outlook 10
2. Basic rationale for selecting accounting standards 10
3. Consolidated Financial Statements 11
(1) Consolidated balance sheets 11
(2) Consolidated statements of income and comprehensive income 13
(3) Consolidated statement of changes in net assets 15
(4) Consolidated statements of cash flows 17
(5) Notes on financial statements
Notes on the going-concern assumption
18
18
Related to consolidated statements of balance sheets 18
Related to consolidated statements of income 18
Segment information
Per share data
Material subsequent events
20
23
23
4. Other 23
(1) Claim for damages in overseas LNG tank construction work 23
5. Supplementary information on earnings forecasts for the fiscal year ending March 31, 2020 24

5
1. Overview of operating results
(1) Consolidated operating results
In the fiscal year ended March 31, 2019, the global economy is relatively lacking in vigor overall
due to the economic slowdown in emerging countries and resource-rich countries, along with other
factors, despite the ongoing modest growth centered on the U.S., where the real economy remains
strong. In addition, there continues to be uncertainty about future prospects for the real economy, as
a downturn in corporate earnings stemming from U.S.-China trade friction is beginning to emerge,
while there is still a chance of a U.K. split from the EU without an agreement, even though the
deadline for the split from the EU has been delayed. There is a continued need for such risks with the
potential to drag down the global economy to be watched sufficiently closely.
The Japanese economy has been recovering modestly, due to the modest increasing of capital
investment, the improvement in corporate earnings, and other factors. Although overall modest
growth is expected to continue, it is necessary to continue to closely watch foreign exchange rates
since the economic policies of the U.S. and other countries or other factors may trigger a swing to
yen appreciation.
Amid such an operating environment, the Group’s orders received in the fiscal year ended March
31, 2019, decreased overall versus the previous fiscal year due to the decreasing in the Rolling Stock
segment and the Aerospace Systems segment, despite increase in the Ship & Offshore Structure
segment and other segments. Net sales increased overall compared with the previous fiscal year, due
to the increasing in the Motorcycle & Engine segment, the Precision Machinery & Robot and other
segments, despite decrease in the Rolling Stock segment and other segments. Operating income
increased overall, due to the improvement in the Ship & Offshore Structure segment and the
increasing in the Energy System & Plant Engineering segment and other factors. Recurring profit
decreased due to the payments for the in-service issues of commercial aircraft jet engines and other
factors despite the increasing in the operating income. Net income attributable to owners of parent
decreased as a result of the decrease of recurring profit and other factors.
As a result, the Group’s consolidated orders received decreased ¥22.0 billion versus the previous
fiscal year to ¥1,585.9 billion, consolidated net sales increased ¥20.5 billion year on year to ¥1,594.7
billion, consolidated operating income increased ¥8.0 billion year on year to ¥64.0 billion,
consolidated recurring profit fell by ¥5.3 billion year on year to ¥37.8 billion, and net income
attributable to owners of parent decreased ¥1.4 billion year on year to ¥27.4 billion. ROIC* was
4.5%, while ROE was 5.8%.
* Before-tax ROIC = EBIT (income before income taxes + interest expense) ÷ invested capital
(interest-bearing debt + shareholders’ equity)
6
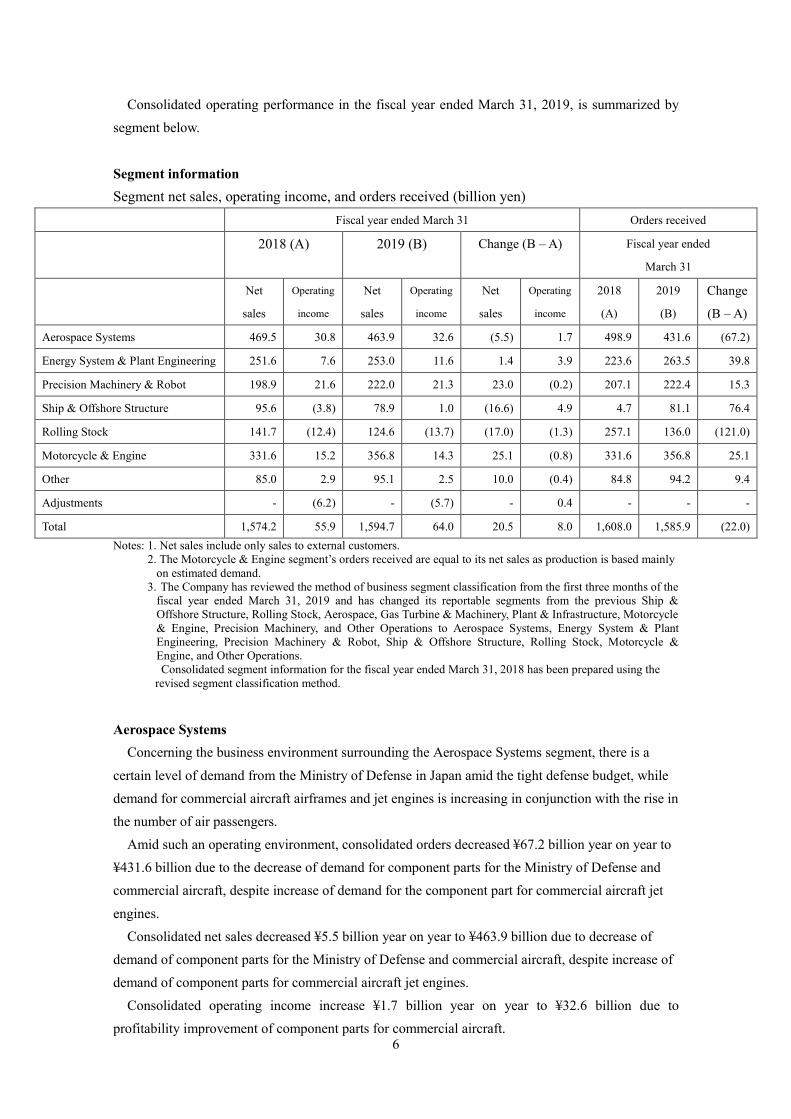
Consolidated operating performance in the fiscal year ended March 31, 2019, is summarized by
segment below.
Segment information
Segment net sales, operating income, and orders received (billion yen)
Fiscal year ended March 31 Orders received
2018 (A)
2019 (B) Change (B – A) Fiscal year ended
March 31
Net
sales
Operating
income
Net
sales
Operating
income
Net
sales
Operating
income
2018
(A)
2019
(B)
Change
(B – A)
Aerospace Systems 469.5 30.8 463.9 32.6 (5.5) 1.7 498.9 431.6 (67.2)
Energy System & Plant Engineering 251.6 7.6 253.0 11.6 1.4 3.9 223.6 263.5 39.8
Precision Machinery & Robot 198.9 21.6 222.0 21.3 23.0 (0.2) 207.1 222.4 15.3
Ship & Offshore Structure 95.6 (3.8) 78.9 1.0 (16.6) 4.9 4.7 81.1 76.4
Rolling Stock 141.7 (12.4) 124.6 (13.7) (17.0) (1.3) 257.1 136.0 (121.0)
Motorcycle & Engine 331.6 15.2 356.8 14.3 25.1 (0.8) 331.6 356.8 25.1
Other 85.0 2.9 95.1 2.5 10.0 (0.4) 84.8 94.2 9.4
Adjustments - (6.2) - (5.7) - 0.4 - - -
Total 1,574.2 55.9 1,594.7 64.0 20.5 8.0 1,608.0 1,585.9 (22.0)
Notes: 1. Net sales include only sales to external customers.
2. The Motorcycle & Engine segment’s orders received are equal to its net sales as production is based mainly
on estimated demand.
3. The Company has reviewed the method of business segment classification from the first three months of the
fiscal year ended March 31, 2019 and has changed its reportable segments from the previous Ship &
Offshore Structure, Rolling Stock, Aerospace, Gas Turbine & Machinery, Plant & Infrastructure, Motorcycle
& Engine, Precision Machinery, and Other Operations to Aerospace Systems, Energy System & Plant
Engineering, Precision Machinery & Robot, Ship & Offshore Structure, Rolling Stock, Motorcycle &
Engine, and Other Operations.
Consolidated segment information for the fiscal year ended March 31, 2018 has been prepared using the
revised segment classification method.
Aerospace Systems
Concerning the business environment surrounding the Aerospace Systems segment, there is a
certain level of demand from the Ministry of Defense in Japan amid the tight defense budget, while
demand for commercial aircraft airframes and jet engines is increasing in conjunction with the rise in
the number of air passengers.
Amid such an operating environment, consolidated orders decreased ¥67.2 billion year on year to
¥431.6 billion due to the decrease of demand for component parts for the Ministry of Defense and
commercial aircraft, despite increase of demand for the component part for commercial aircraft jet
engines.
Consolidated net sales decreased ¥5.5 billion year on year to ¥463.9 billion due to decrease of
demand of component parts for the Ministry of Defense and commercial aircraft, despite increase of
demand of component parts for commercial aircraft jet engines.
Consolidated operating income increase ¥1.7 billion year on year to ¥32.6 billion due to
profitability improvement of component parts for commercial aircraft.

7
Energy System & Plant Engineering
Regarding the business environment surrounding the Energy System & Plant Engineering
segment, in addition to the recovery in resources development and oil and natural gas-related
investment overseas, there is still demand for energy infrastructure maintenance in Asia. Besides,
demand for distributed power sources is increasing due to stronger interest in investment to the
environment and energy conservation, among other factors. In Japan, there is ongoing demand for
replacing aging facilities for refuse incineration plants and industrial machinery. Meanwhile, in the
energy and environmental field, although there is large potential demand for distributed power
sources in Japan, investment plans are slightly delayed in light of the liberalization of electricity.
Amid such an operating environment, consolidated orders received increased ¥39.8 billion year on
year to ¥263.5 billion, due to the order received of a Combined Cycle Power Plant (CCPP) and a
LNG tank for the Japanese market among other factors.
Consolidated net sales increased ¥1.4 billion year on year to ¥253.0 billion due to the increasing in
construction work volume in Energy System segment and other factors despite the decline in
construction work volume on refuse incineration plants for Japanese market and chemical plants for
overseas market.
Consolidated operating income was ¥11.6 billion, ¥3.9 billion increase compared to the previous
year, due to the profitability improvement in the Energy System segment and the other factors.
Precision Machinery & Robot
With respect to the business environment surrounding the Precision Machinery & Robot segment,
in the construction machinery market, excavator sales competition in the Chinese market is
becoming increasingly intense, and there are growing concerns and a sense of uncertainty about the
future prospects of the China market, particularly among foreign construction machinery
manufacturers that are losing market share in the Chinese market (especially for small- and
medium-sized excavators). However, demand still exceeds its production capacity, so the Company
is working to increase production. The Company will continue to keep an eye on the situation in the
Chinese market. In the robot market, the current market situation is deteriorating due to the
postponement of capital investment and the putting off of investment by semiconductor
manufacturers in the Chinese market due to the U.S.-China trade friction, and the overseas market is
expected to remain unstable for a while. Still, semiconductor investment is expected to resume in the
second half of the fiscal year, and demand is expected to recover. In the domestic market, demand is
expected to steadily expand in the industrial sector as a whole, including in human-robot coexistence
field.
Amid such an operating environment, consolidated orders received increased ¥15.3 billion year on
year to ¥222.4 billion, due to the increase in hydraulic components for construction machinery,
despite the decrease in robots in the semiconductors field.
Consolidated net sales was ¥222.0 billion, a ¥23.0 billion increase compared to the previous fiscal
year ended March 31, 2018, due to the increase in hydraulic components for construction machinery,
despite the decrease in industrial robots for semiconductor.
Consolidated operating income was ¥21.3 billion, roughly the same level as the
8
previous fiscal year, due to the increase in SG&A expenses, including expenses to
increase production as well as R&D costs, along with other factors, despite the increase
in net sales.
Ship & Offshore Structure
With respect to the business environment surrounding the Ship & Offshore Structure segment,
while new-build vessel prices are recovering after bottoming out and demand for gas-fueled vessels
has been increasing in conjunction with the tightening of environmental regulations, competition
remains intense due to factors including the pushing back of demand for LNG carriers because of the
delay in LNG development projects and the continuation of policies by the South Korean
governments to support their domestic shipbuilding industries.
Amid such an operating environment, consolidated orders received were ¥81.1 billion, a ¥76.4
billion year on year increase versus the previous fiscal year when the Company terminates a ship
building contract for an offshore service vessel, due to receiving the order of submarine for the
Ministry of Defense.
Consolidated net sales fell by ¥16.6 billion year on year to ¥78.9 billion, due to a change in the
sales mix between LNG carriers and LPG carriers, and other factors.
Consolidated operating income was ¥1.0 billion, a ¥4.9 billion improvement from the previous
fiscal year due to improvement of shipbuilding cost and other factors, despite decrease of sales.
Rolling Stock
With respect to the business environment surrounding the Rolling Stock segment, there continues
to be stable demand in Japan for the replacement of aging railcars. In North America, demand for
new and replacement railcars have been increasing in the New York area, which is its core market,
and the other areas. Meanwhile, in Asia, demand in emerging markets is increasing in tandem with
the Japanese government’s efforts to promote infrastructure-related exports.
Amid such an business environment, consolidated orders received were ¥136.0 billion, a ¥121.0
decline compared with the fiscal year ended March 31, 2018, when orders were received for new
generation subway cars from the New York City Transit Authority, despite the fact that an order for
commuter train cars was received from the Port Authority of New York and New Jersey, along with
other factors.
Consolidated net sales decreased ¥17.0 billion year on year to ¥124.6 billion, due to the decrease
of sales for overseas market in the U.S., Asia and other countries, and other factors.
Consolidated operating income decreased ¥1.3 billion year on year to ¥13.7 billion of the
operating loss due to a deterioration of profitability in orders for the U.S. since the previous year.

9
Motorcycle & Engine
Regarding the business environment surrounding the Motorcycle & Engine segment, the modest
growth in motorcycle markets mainly in Europe is continuing, and the decline in demand for
motorcycles in emerging countries is signaling a bottoming out. With respect to utility vehicles, the
market continues to grow stably mainly in North America, and the general-purpose engine market is
also growing steadily.
Amid such an operating environment, consolidated net sales increased ¥25.1 billion year on year
to ¥356.8 billion, due to the increase in motorcycles and vehicles for developed countries.
Consolidated operating income deteriorated ¥0.8 billion year on year to ¥14.3 billion despite the
increase in sales, which there was a rise in prices of steel and other materials in the U.S., the impact
of weakness of currencies in emerging countries and other factors.
Other Operations
Consolidated net sales increased ¥10.0 billion year on year to ¥95.1 billion.
Consolidated net operating income decreased ¥0.4 billion year on year to ¥2.5 billion.
(2) Consolidated financial position
(i) Assets
Total assets at March 31, 2019, were ¥1,838.8 billion, ¥53.8 billion increase from March 31,
2018. Current assets increased ¥20.5 billion compared to March 31, 2018, to ¥1,136.3 billion, due
to an increase in inventory assets and other factors. Fixed assets increased ¥33.2 billion year on
year to ¥702.5 billion, due to an increase in holdings of property, plant and equipment because of
capital investment and other factors.
(ii) Liabilities
Overall liabilities increased ¥42.9 billion compared to March 31, 2018, to ¥1,346.5 billion, due
to the rise in net defined benefit liabilities, the posting of the provision for the in-service issues of
commercial aircraft jet engines, and other factors. Interest bearing liabilities decreased ¥7.2 billion
year on year to ¥439.4 billion.
(iii) Net assets
Consolidated net assets increased ¥10.8 billion year on year to ¥492.2 billion, due to factors
including the increase from the posting of net income attributable to owners of parent and the
decline due to dividend payments and other factors.
(3) Cash flows
(i) Cash flows from operating activities
Operating activities provided net cash of ¥109.7 billion, a ¥53.7 billion increase from the
previous fiscal year. Major sources of operating cash flow included income before income taxes of
¥37.8 billion and depreciation and amortization of ¥59.0 billion. Major uses of operating cash
flow included expenditure of ¥65.3 billion due to an increase in inventory assets.

10
(ii) Cash flows from investing activities
Investing activities used net cash of ¥85.3 billion which is ¥4.7 billion more than in the previous
fiscal year, mainly due to requisition of property, plant and equipment, as well as intangible assets.
(iii) Cash flows from financing activities
Financing activities used ¥19.7 billion, which is ¥57.5 billion more than in the previous fiscal
year when financing activities provided net cash of ¥37.7 billion. This was mainly due to the
payment of dividends.
(4) Consolidated earnings outlook
For the fiscal year ending March 31, 2020, the Company is expecting consolidated net sales of
¥1,700.0 billion, a ¥105.3 billion year on year increase, due to expected increases in the Aerospace
Systems segment and Rolling Stock segment and Precision Machinery & Robot segment and other
segments. In terms of profit, the Company is forecasting consolidated operating income of ¥72.0
billion, recurring profit of ¥61.0 billion, and net income attributable to owners of parent of ¥38.0
billion. Furthermore, the Company is expecting ROIC of 6.7% and ROE of 7.8%. These forecasts
are based on the expectation for a recovery in Rolling Stock which posted a large loss in the previous
fiscal year, an increase in profits in conjunction with a rise in sales of Precision Machinery & Robot
segment and other factors.
Consolidated orders received are expected to increase ¥114.1 billion year on year to ¥1,700.0
billion.
Assumed exchange rates of ¥110/US$ and ¥125/Euro were used for the above consolidated
earnings outlook.
Note regarding consolidated earnings outlook
The above earnings outlook is based on information available at the time of preparation, and
includes risks and uncertainties. The Company therefore discourages making investment decisions
depending solely on this outlook. Please note that actual earnings may differ materially from this
outlook, due to a variety of important factors stemming from changes in the external environment
and/or the Company’s internal environment. Important factors that impact actual operating
performance include, but are not limited to, the economic situation surrounding the Company’s
scope of business, foreign exchange rates in particular the yen/dollar exchange rate, tax codes and
other regulatory system-related issues.
2. Basic rationale for selecting accounting standards
In the near term, KHI Group plans to continue to use Japanese accounting standards to disclose
consolidated financial statements. The Group will continue to study the possible adoption of IFRS
from the standpoint of increasing corporate value over the medium- to long-term horizon as well as
promoting constructive dialogue with investors, all while taking the situation surrounding the Group
both in Japan and overseas into consideration.
11
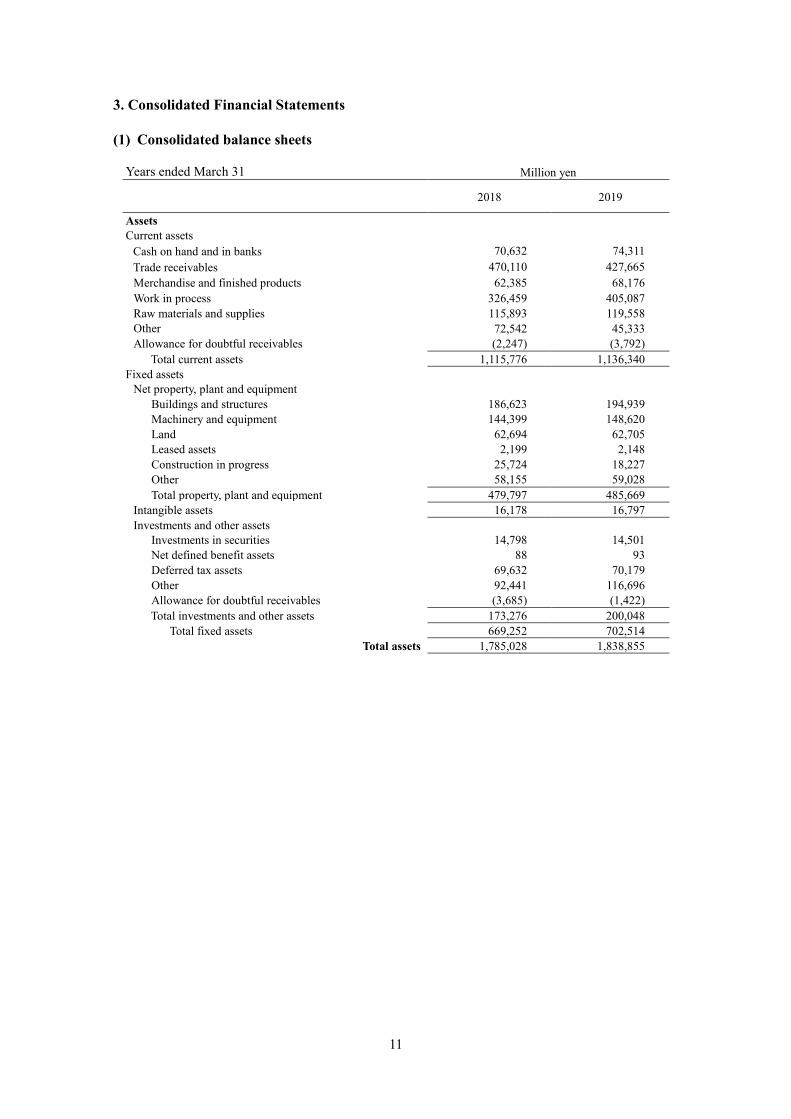
3. Consolidated Financial Statements
(1) Consolidated balance sheets
Years ended March 31 Million yen
2018 2019
Assets
Current assets Cash on hand and in banks 70,632 74,311
Trade receivables 470,110 427,665
Merchandise and finished products 62,385 68,176
Work in process 326,459 405,087
Raw materials and supplies 115,893 119,558
Other
72,542 45,333
Allowance for doubtful receivables (2,247) (3,792)
Total current assets 1,115,776 1,136,340
Fixed assets
Net property, plant and equipment
Buildings and structures 186,623 194,939
Machinery and equipment 144,399 148,620
Land 62,694 62,705
Leased assets 2,199 2,148
Construction in progress 25,724 18,227
Other 58,155 59,028
Total property, plant and equipment 479,797 485,669
Intangible assets 16,178 16,797
Investments and other assets
Investments in securities 14,798 14,501
Net defined benefit assets 88 93
Deferred tax assets 69,632 70,179
Other 92,441 116,696
Allowance for doubtful receivables (3,685) (1,422)
Total investments and other assets 173,276 200,048
Total fixed assets 669,252 702,514
Total assets 1,785,028 1,838,855
12
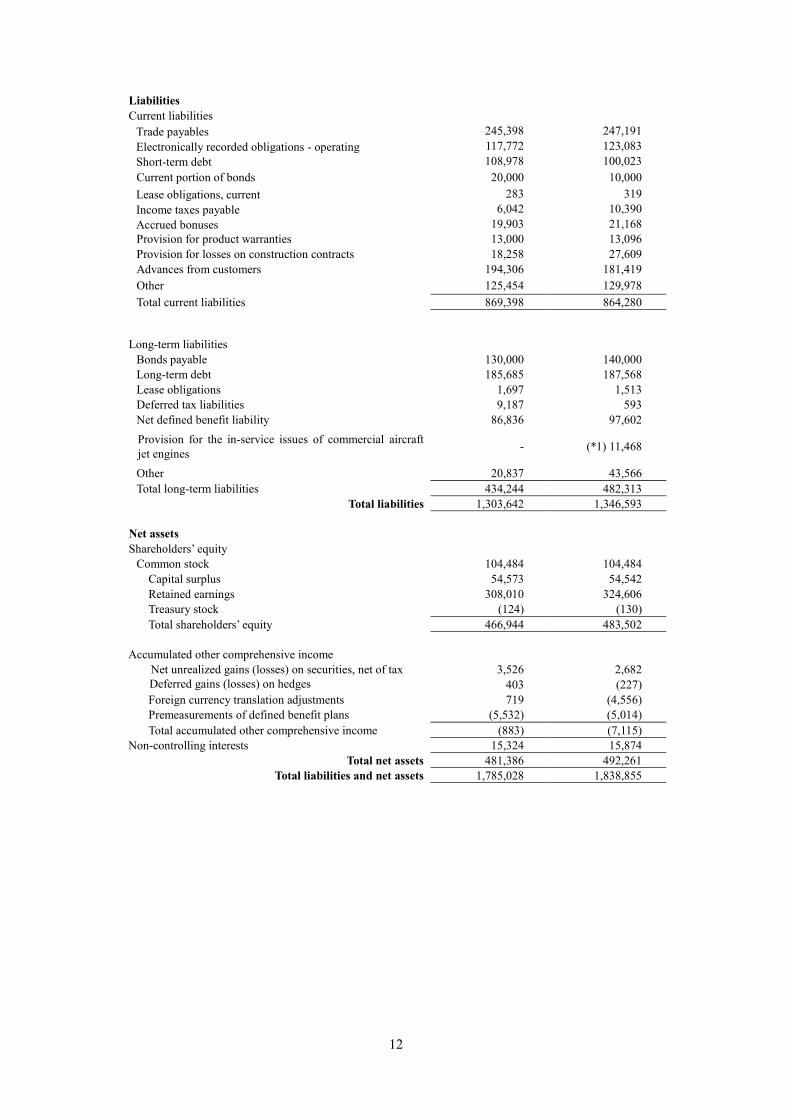
Liabilities
Current liabilities
Trade payables 245,398 247,191
Electronically recorded obligations - operating 117,772 123,083
Short-term debt 108,978 100,023
Current portion of bonds 20,000 10,000
Lease obligations, current 283 319
Income taxes payable 6,042 10,390
Accrued bonuses 19,903 21,168
Provision for product warranties 13,000 13,096
Provision for losses on construction contracts 18,258 27,609
Advances from customers 194,306 181,419
Other 125,454 129,978
Total current liabilities 869,398 864,280
Long-term liabilities
Bonds payable 130,000 140,000
Long-term debt 185,685 187,568
Lease obligations 1,697 1,513
Deferred tax liabilities 9,187 593
Net defined benefit liability 86,836 97,602
Provision for the in-service issues of commercial aircraft
jet engines - (*1) 11,468
Other 20,837 43,566
Total long-term liabilities 434,244 482,313
Total liabilities 1,303,642 1,346,593
Net assets
Shareholders’ equity
Common stock 104,484 104,484
Capital surplus 54,573 54,542
Retained earnings 308,010 324,606
Treasury stock (124) (130)
Total shareholders’ equity 466,944 483,502
Accumulated other comprehensive income
Net unrealized gains (losses) on securities, net of tax 3,526 2,682
Deferred gains (losses) on hedges 403 (227)
Foreign currency translation adjustments 719 (4,556)
Premeasurements of defined benefit plans (5,532) (5,014)
Total accumulated other comprehensive income (883) (7,115)
Non-controlling interests
15,324 15,874
Total net assets 481,386 492,261
Total liabilities and net assets 1,785,028 1,838,855

13
(2) Consolidated statements of income and comprehensive income
Consolidated statements of income
Years ended March 31 Million yen
2018 2019
Net sales 1,574,242 1,594,743
Cost of sales 1,319,715 1,326,668
Gross profit 254,527 268,075
Selling, general and administrative expenses
Salaries and benefits 52,502 54,952
R&D expenses 45,434 48,734
Other 100,665 100,364
Total selling, general and administrative expenses 198,602 204,052
Operating income 55,925 64,023
Non-operating income
Interest income 720 909
Dividend income 291 294
Interest on securities 46 862
Equity in income of non-consolidated subsidiaries and affiliates 4,492 1,574
Other 3,580 3,056
Total non-operating income 9,131 6,696
Non-operating expenses
Interest expense 2,794 3,427
Foreign exchange losses 7,017 4,721
Payments for the in-service issues of commercial aircraft jet engines
- (*1)14,851
Payments for contract adjustment for commercial aircraft jet engines
(*2)2,505 -
Other 9,513 9,857
Total non-operating expenses 21,830 32,858
Recurring profit 43,225 37,861
Extraordinary income
Gain on sale of fixed assets (*3)2,606 -
Total extraordinary income 2,606 -
Extraordinary losses
Losses from the termination of a shipbuilding contract for an offshore service vessel
(*4)12,833 -
Total extraordinary losses 12,833 -
Income before income taxes 32,999 37,861
Income taxes
Current 11,634 16,704
Deferred (9,982) (8,681)
Total income taxes 1,652 8,022
Net income 31,347 29,838
Net income attributable to non-controlling interests 2,431 2,385
Net income attributable to owners of parent 28,915 27,453
14
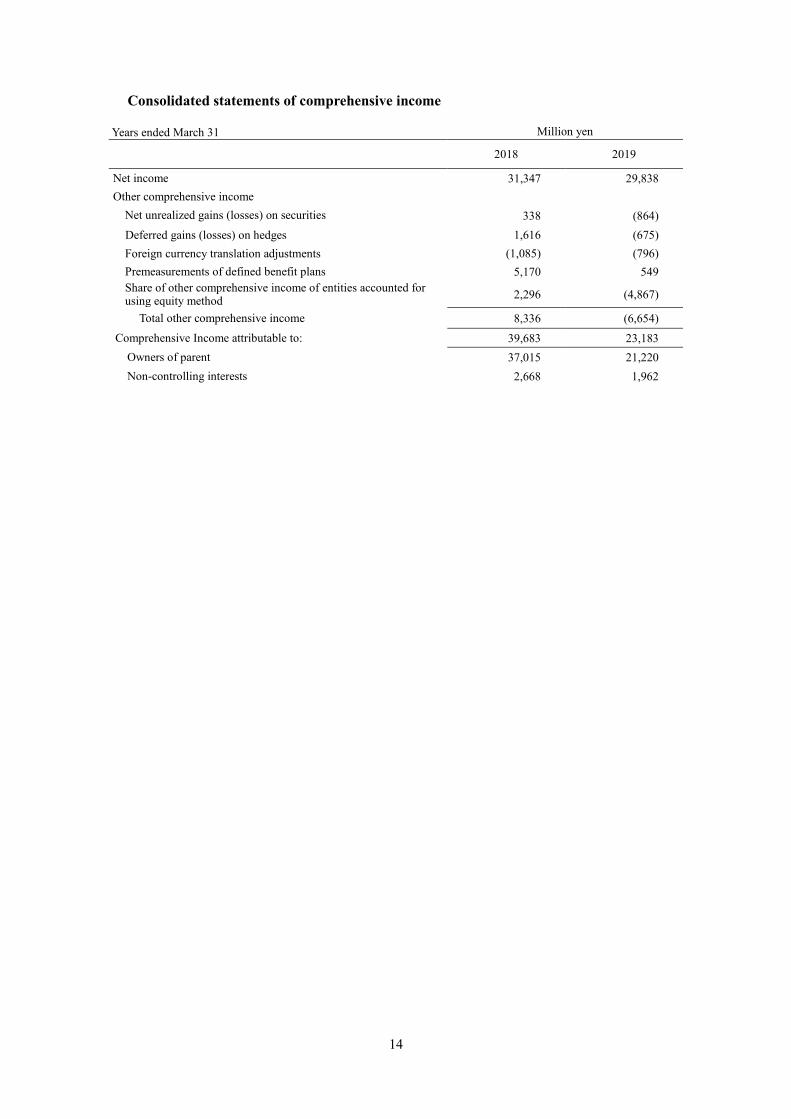
Consolidated statements of comprehensive income
Years ended March 31 Million yen
2018 2019
Net income 31,347 29,838
Other comprehensive income
Net unrealized gains (losses) on securities 338 (864)
Deferred gains (losses) on hedges 1,616 (675)
Foreign currency translation adjustments (1,085) (796)
Premeasurements of defined benefit plans 5,170 549
Share of other comprehensive income of entities accounted for using equity method
2,296 (4,867)
Total other comprehensive income 8,336 (6,654)
Comprehensive Income attributable to: 39,683 23,183
Owners of parent 37,015 21,220
Non-controlling interests 2,668 1,962

15
(3) Consolidated statements of changes in net assets
Years ended March 31 Million yen
2018 2019
Shareholders’ equity
Common stock
Balance at end of previous year 104,484 104,484
Total changes during the period - -
Balance at end of year 104,484 104,484
Capital surplus
Balance at end of previous year 54,393 54,573
Treasury stock disposed (0) (0)
Transfer of loss on disposal of treasury stock - 0
Capital increase of consolidated subsidiaries 179 (30)
Total changes during the period 179 (30)
Balance at end of year 54,573 54,542
Retained earnings
Balance at end of previous year 287,448 308,010
Changes during the period
Cash dividend (8,352) (10,858)
Net income attributable to owners of parent 28,915 27,453
Transfer of loss on disposal of treasury stock - (0)
Total changes during the period 20,562 16,595
Balance at end of year 308,010 324,606
Treasury stock
Balance at end of previous year (96) (124)
Changes during the period
Treasury stock purchased (28) (7)
Treasury stock disposed 0 1
Total changes during the period (27) (5)
Balance at end of year (124) (130)
Total shareholders’ equity
Balance at end of previous year 446,230 466,944
Changes during the period
Cash dividend (8,352) (10,858)
Net income attributable to owners of parent 28,915 27,453
Treasury stock purchased (28) (7)
Treasury stock disposed 0 1
Transfer of loss on disposal of treasury stock - -
Capital increase of consolidated subsidiaries 179 (30)
Total changes during the period 20,714 16,558
Balance at end of year 466,944 483,502
16
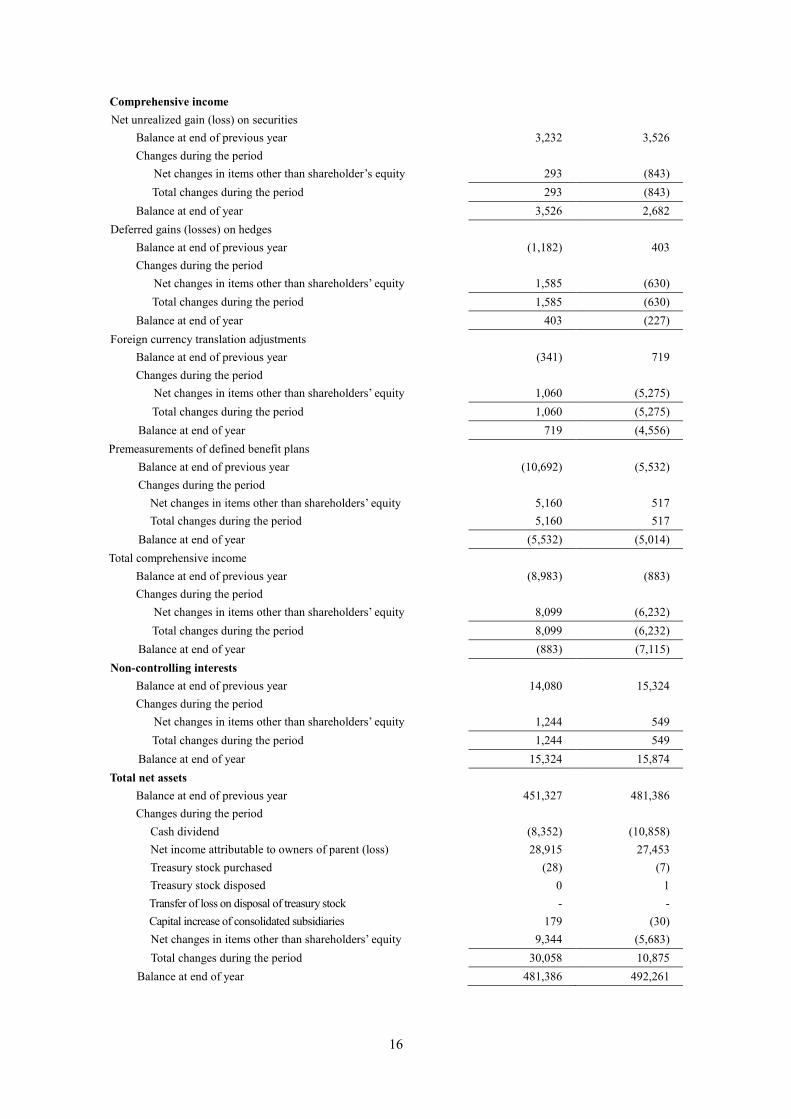
Comprehensive income
Net unrealized gain (loss) on securities
Balance at end of previous year 3,232 3,526
Changes during the period
Net changes in items other than shareholder’s equity 293 (843)
Total changes during the period 293 (843)
Balance at end of year 3,526 2,682
Deferred gains (losses) on hedges
Balance at end of previous year (1,182) 403
Changes during the period
Net changes in items other than shareholders’ equity 1,585 (630)
Total changes during the period 1,585 (630)
Balance at end of year 403 (227)
Foreign currency translation adjustments
Balance at end of previous year (341) 719
Changes during the period
Net changes in items other than shareholders’ equity 1,060 (5,275)
Total changes during the period 1,060 (5,275)
Balance at end of year 719 (4,556)
Premeasurements of defined benefit plans
Balance at end of previous year (10,692) (5,532)
Changes during the period
Net changes in items other than shareholders’ equity 5,160 517
Total changes during the period 5,160 517
Balance at end of year (5,532) (5,014)
Total comprehensive income
Balance at end of previous year (8,983) (883)
Changes during the period
Net changes in items other than shareholders’ equity 8,099 (6,232)
Total changes during the period 8,099 (6,232)
Balance at end of year (883) (7,115)
Non-controlling interests
Balance at end of previous year 14,080 15,324
Changes during the period
Net changes in items other than shareholders’ equity 1,244 549
Total changes during the period 1,244 549
Balance at end of year 15,324 15,874
Total net assets
Balance at end of previous year 451,327 481,386
Changes during the period
Cash dividend (8,352) (10,858)
Net income attributable to owners of parent (loss) 28,915 27,453
Treasury stock purchased (28) (7)
Treasury stock disposed 0 1
Transfer of loss on disposal of treasury stock - -
Capital increase of consolidated subsidiaries 179 (30)
Net changes in items other than shareholders’ equity 9,344 (5,683)
Total changes during the period 30,058 10,875
Balance at end of year 481,386 492,261
17
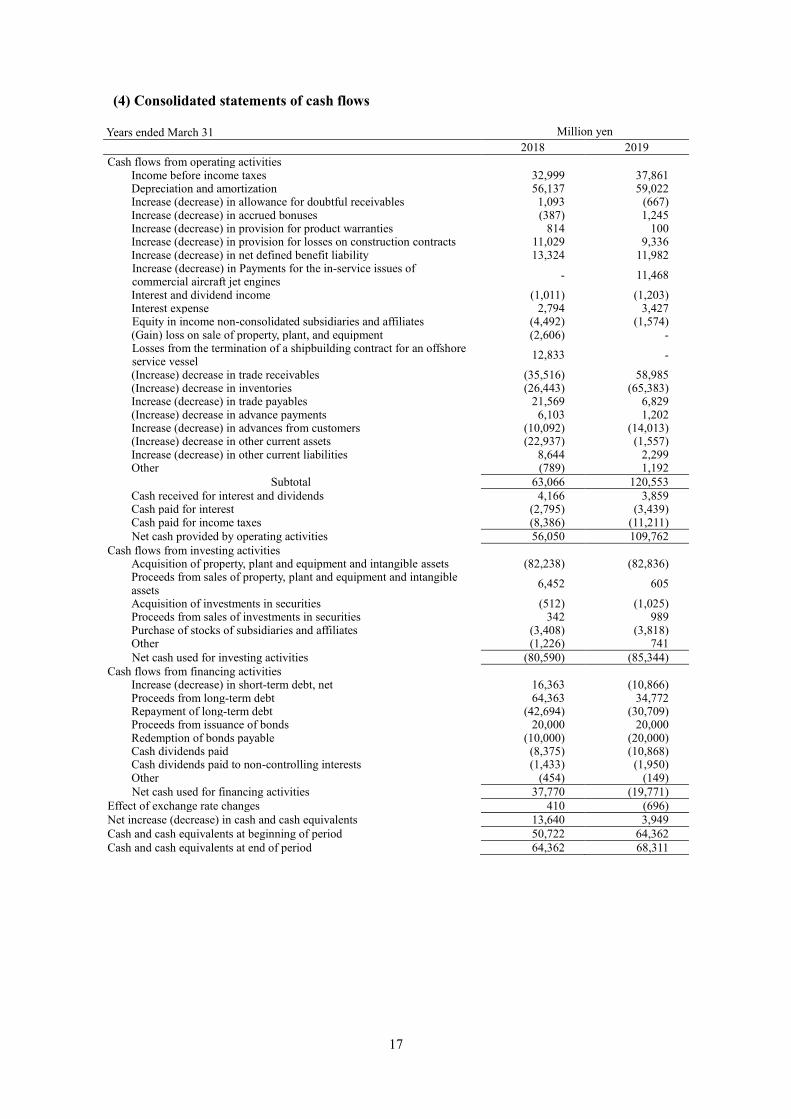
(4) Consolidated statements of cash flows
Years ended March 31 Million yen
2018 2019
Cash flows from operating activities Income before income taxes 32,999 37,861 Depreciation and amortization 56,137 59,022 Increase (decrease) in allowance for doubtful receivables 1,093 (667) Increase (decrease) in accrued bonuses (387) 1,245 Increase (decrease) in provision for product warranties 814 100 Increase (decrease) in provision for losses on construction contracts 11,029 9,336 Increase (decrease) in net defined benefit liability 13,324 11,982 Increase (decrease) in Payments for the in-service issues of commercial aircraft jet engines
- 11,468
Interest and dividend income (1,011) (1,203) Interest expense 2,794 3,427 Equity in income non-consolidated subsidiaries and affiliates (4,492) (1,574) (Gain) loss on sale of property, plant, and equipment (2,606) - Losses from the termination of a shipbuilding contract for an offshore service vessel
12,833 -
(Increase) decrease in trade receivables (35,516) 58,985 (Increase) decrease in inventories (26,443) (65,383) Increase (decrease) in trade payables 21,569 6,829 (Increase) decrease in advance payments 6,103 1,202 Increase (decrease) in advances from customers (10,092) (14,013) (Increase) decrease in other current assets (22,937) (1,557) Increase (decrease) in other current liabilities 8,644 2,299 Other (789) 1,192
Subtotal 63,066 120,553
Cash received for interest and dividends 4,166 3,859 Cash paid for interest (2,795) (3,439) Cash paid for income taxes (8,386) (11,211)
Net cash provided by operating activities 56,050 109,762
Cash flows from investing activities Acquisition of property, plant and equipment and intangible assets (82,238) (82,836) Proceeds from sales of property, plant and equipment and intangible assets
6,452 605
Acquisition of investments in securities (512) (1,025) Proceeds from sales of investments in securities 342 989 Purchase of stocks of subsidiaries and affiliates (3,408) (3,818) Other (1,226) 741
Net cash used for investing activities (80,590) (85,344)
Cash flows from financing activities Increase (decrease) in short-term debt, net 16,363 (10,866) Proceeds from long-term debt 64,363 34,772 Repayment of long-term debt (42,694) (30,709) Proceeds from issuance of bonds 20,000 20,000 Redemption of bonds payable (10,000) (20,000) Cash dividends paid (8,375) (10,868) Cash dividends paid to non-controlling interests (1,433) (1,950) Other (454) (149)
Net cash used for financing activities 37,770 (19,771)
Effect of exchange rate changes 410 (696)
Net increase (decrease) in cash and cash equivalents 13,640 3,949
Cash and cash equivalents at beginning of period 50,722 64,362
Cash and cash equivalents at end of period 64,362 68,311

18
(5) Notes on financial statements
Notes on the going-concern assumption
Not applicable.
Related to consolidated balance sheets
(*1) The provision for the in-service issues of commercial aircraft jet engines
The Company participates as a risk and revenue sharing partner on the Rolls-Royce Trent 1000
engine program, which has been impacted by the challenge of managing significant in-service issues.
Rolls-Royce continues to work hard to remedy this situation and has made further substantial
progress on the implementation of long-term solutions and mitigation of the near-term impact on
customers. In the FY2018 financial results, the Company has made a provision of the abnormal cost
related to in-service issues which the Company would cover as a member of this program.
Related to consolidated statements of income
(*1) The payments for the in-service issues of commercial aircraft jet engines
The Company participates as a risk and revenue sharing partner on the Rolls-Royce Trent 1000
engine program, which has been impacted by the challenge of managing significant in-service issues.
Rolls-Royce continues to work hard to remedy this situation and has made further substantial
progress on the implementation of long-term solutions and mitigation of the near-term impact on
customers. In the FY2018 financial results, the Company has made a provision of the abnormal cost
related to in-service issues which the Company would cover as a member of this program. The
provision was included within the non-operating expenses.
(*2) Payments for contract adjustment for commercial aircraft jet engines
The Company faces one-time expenses in connection with contracts with customers relating to
engine programs in which the Company is participating. These expenses arose from the new
requirement to allocate a portion of the engines planned to be delivered to customers for use as spare
engines for operational supports. Accordingly, the Company recorded these program expenses as
non-operating expenses.
(*3) Gain on sale of fixed assets
Gain on sale of fixed assets occurred in relation to the sale of the land and building of the
Company’s Tokyo office. The gain was mainly the sale of the land.
19
(*4) Losses from the termination of a shipbuilding contract for an offshore service vessel
These are losses in conjunction with the termination of a shipbuilding contract for an offshore
service vessel (losses recognized on valuation of inventories and trade receivables, etc.)
(Additional information)
Concerning the posting of losses in conjunction with the termination of a shipbuilding contract for
an offshore service vessel.
With the intention of entering the offshore development industry, which is a promising market over
the medium to long term, in November 2013 the Company entered into a shipbuilding agreement for
an offshore service vessel (hereinafter, “vessel”) with a subsidiary* of Island Offshore Shipholding
LP (hereinafter, “Island Offshore”). This was the first vessel of its type to be constructed by the
Company, and certain problems during the engineering stage arose along with an increase in
materials costs and other issues.
Meanwhile, the stagnation in crude oil prices led to a very difficult business environment for
offshore service providers in general ever since the order for this vessel was received, and Island
Offshore negotiated financial restructuring with its banking partners since November 2016.
Given the above circumstances, the Company proceeded cautiously, including temporarily
suspending the construction of the vessel, while paying close attention to the progress of the
financial restructuring of Island Offshore. During this time, the Company was holding discussions
with Island Offshore regarding the handling of the vessel. Based on the shared understanding that the
environment surrounding the offshore service business remained challenging, and that uncertainty
about the future would not be eliminated, the Company and Island Offshore agreed to terminate the
shipbuilding agreement, and the Company therefore carried out the necessary accounting treatment.
*Island Navigator I KS (100% subsidiary company of Island Offshore Shipholding LP)
20
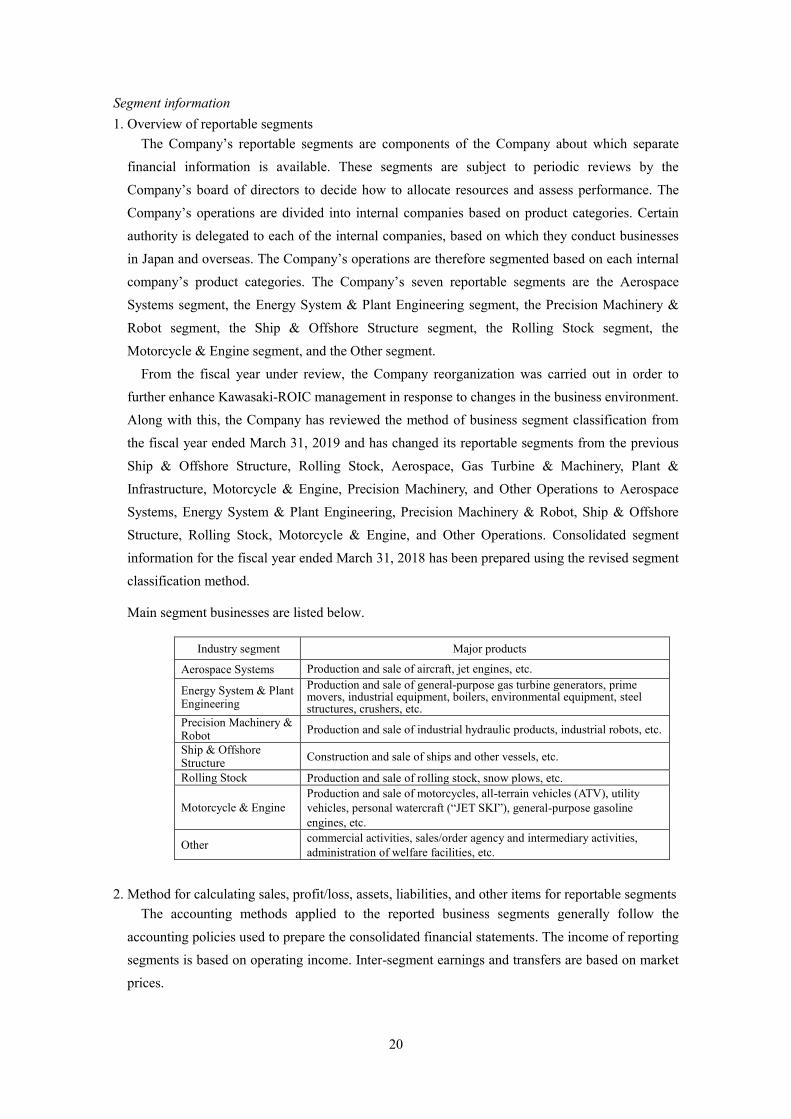
Segment information
1. Overview of reportable segments
The Company’s reportable segments are components of the Company about which separate
financial information is available. These segments are subject to periodic reviews by the
Company’s board of directors to decide how to allocate resources and assess performance. The
Company’s operations are divided into internal companies based on product categories. Certain
authority is delegated to each of the internal companies, based on which they conduct businesses
in Japan and overseas. The Company’s operations are therefore segmented based on each internal
company’s product categories. The Company’s seven reportable segments are the Aerospace
Systems segment, the Energy System & Plant Engineering segment, the Precision Machinery &
Robot segment, the Ship & Offshore Structure segment, the Rolling Stock segment, the
Motorcycle & Engine segment, and the Other segment.
From the fiscal year under review, the Company reorganization was carried out in order to
further enhance Kawasaki-ROIC management in response to changes in the business environment.
Along with this, the Company has reviewed the method of business segment classification from
the fiscal year ended March 31, 2019 and has changed its reportable segments from the previous
Ship & Offshore Structure, Rolling Stock, Aerospace, Gas Turbine & Machinery, Plant &
Infrastructure, Motorcycle & Engine, Precision Machinery, and Other Operations to Aerospace
Systems, Energy System & Plant Engineering, Precision Machinery & Robot, Ship & Offshore
Structure, Rolling Stock, Motorcycle & Engine, and Other Operations. Consolidated segment
information for the fiscal year ended March 31, 2018 has been prepared using the revised segment
classification method.
Main segment businesses are listed below.
Industry segment Major products
Aerospace Systems Production and sale of aircraft, jet engines, etc.
Energy System & Plant Engineering
Production and sale of general-purpose gas turbine generators, prime movers, industrial equipment, boilers, environmental equipment, steel structures, crushers, etc.
Precision Machinery & Robot
Production and sale of industrial hydraulic products, industrial robots, etc.
Ship & Offshore Structure
Construction and sale of ships and other vessels, etc.
Rolling Stock Production and sale of rolling stock, snow plows, etc.
Motorcycle & Engine
Production and sale of motorcycles, all-terrain vehicles (ATV), utility
vehicles, personal watercraft (“JET SKI”), general-purpose gasoline
engines, etc.
Other commercial activities, sales/order agency and intermediary activities,
administration of welfare facilities, etc.
2. Method for calculating sales, profit/loss, assets, liabilities, and other items for reportable segments
The accounting methods applied to the reported business segments generally follow the
accounting policies used to prepare the consolidated financial statements. The income of reporting
segments is based on operating income. Inter-segment earnings and transfers are based on market
prices.

21
3. Sales, income (loss), assets, liabilities, and other items by reportable segment
Fiscal year ended March 31, 2018 (April 1, 2017 – March 31, 2018) (Million yen)
Sales
Segment income (loss)
Segment assets
Other items
External sales Intersegment
sales or transfer
Total Depreciation/ amortization
Investment in equity-
method affiliates
Increase in property, plant and equipment and intangibles
Aerospace Systems
469,507 5,030 474,538 30,876 644,719 20,674 - 34,613
Energy System & Plant Engineering
251,640 19,695 271,336 7,686 288,895 3,337 19,118 3,738
Precision Machinery & Robot
198,996 15,890 214,887 21,648 188,155 7,165 411 10,974
Ship & Offshore Structure
95,610 3,786 99,397 (3,820) 147,963 1,444 49,749 4,774
Rolling Stock 141,760 105 141,866 (12,438) 180,792 2,567 138 2,505
Motorcycle & Engine
331,659 669 332,329 15,255 266,550 14,163 1,474 20,542
Other
Operations 85,066 41,507 126,573 2,925 85,061 1,579 3,336 696
Total 1,574,242 86,686 1,660,929 62,133 1,802,139 50,932 74,228 77,844
Adjustments - (86,686) (86,686) (6,207) (17,110) 5,205 - 4,319
Consolidated
total 1,574,242 - 1,574,242 55,925 1,785,028 56,137 74,228 82,163
Fiscal year ended March 31, 2019 (April 1, 2018 – March 31, 2019) (Million yen)
Sales
Segment income (loss)
Segment assets
Other items
External sales Intersegment
sales or transfer
Total Depreciation/ amortization
Investment in equity-
method affiliates
Increase in property, plant and equipment and intangibles
Aerospace Systems
463,958 12,089 476,048 32,611 649,260 21,299 - 24,022
Energy System & Plant Engineering
253,041 19,899 272,940 11,634 301,798 3,412 18,552 2,237
Precision Machinery & Robot
222,095 17,151 239,247 21,352 205,199 8,220 634 11,636
Ship & Offshore Structure
78,974 4,549 83,523 1,090 121,918 1,559 45,955 2,360
Rolling Stock 124,689 27 124,716 (13,797) 211,102 2,615 133 3,358
Motorcycle & Engine
356,847 718 357,566 14,366 283,770 15,317 1,549 18,505
Other
Operations 95,136 41,136 136,273 2,501 93,601 1,527 3,509 861
Total 1,594,743 95,572 1,690,316 69,760 1,866,652 53,953 70,334 62,982
Adjustments - (95,572) (95,572) (5,737) (27,797) 5,069 - 3,918
Consolidated
total 1,594,743 - 1,594,743 64,023 1,838,855 59,022 70,334 66,900
22
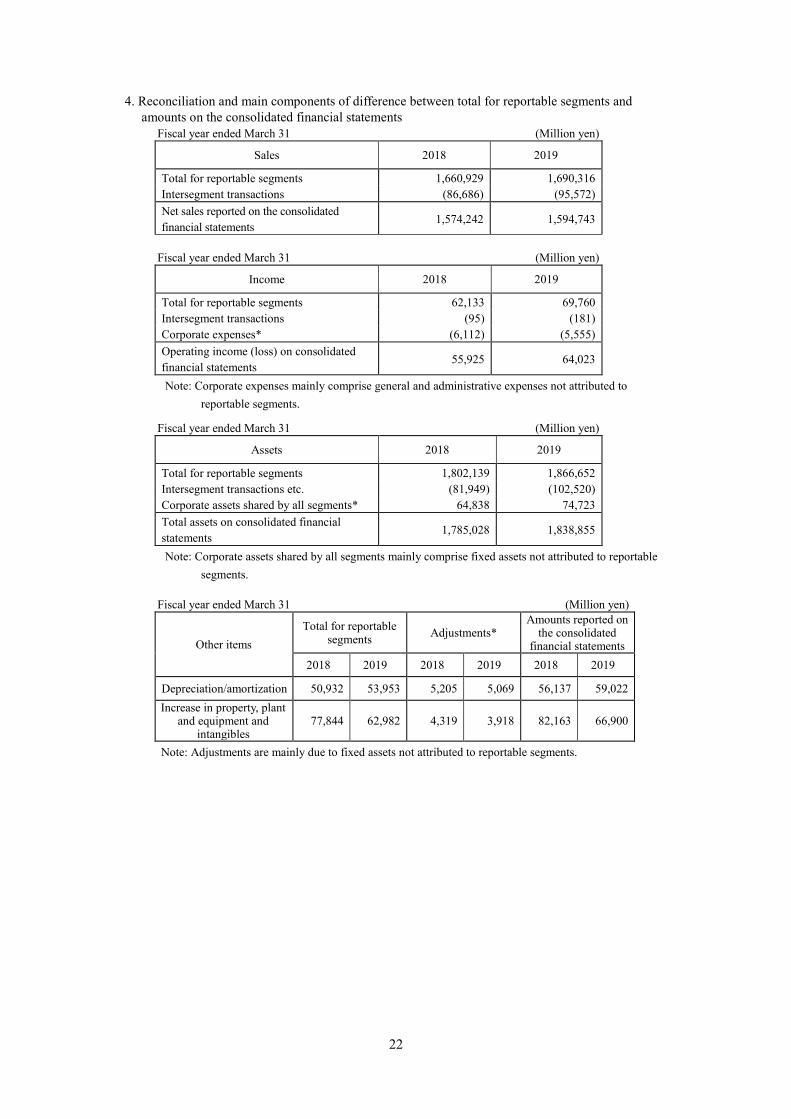
4. Reconciliation and main components of difference between total for reportable segments and
amounts on the consolidated financial statements
Fiscal year ended March 31 (Million yen)
Sales 2018 2019
Total for reportable segments 1,660,929 1,690,316
Intersegment transactions (86,686) (95,572)
Net sales reported on the consolidated
financial statements 1,574,242 1,594,743
Fiscal year ended March 31 (Million yen)
Income 2018 2019
Total for reportable segments 62,133 69,760
Intersegment transactions (95) (181)
Corporate expenses* (6,112) (5,555)
Operating income (loss) on consolidated
financial statements 55,925 64,023
Note: Corporate expenses mainly comprise general and administrative expenses not attributed to
reportable segments.
Fiscal year ended March 31 (Million yen)
Assets 2018 2019
Total for reportable segments 1,802,139 1,866,652
Intersegment transactions etc. (81,949) (102,520)
Corporate assets shared by all segments* 64,838 74,723
Total assets on consolidated financial
statements 1,785,028 1,838,855
Note: Corporate assets shared by all segments mainly comprise fixed assets not attributed to reportable
segments.
Fiscal year ended March 31 (Million yen)
Other items
Total for reportable segments
Adjustments* Amounts reported on
the consolidated financial statements
2018 2019 2018 2019 2018 2019
Depreciation/amortization 50,932 53,953 5,205 5,069 56,137 59,022
Increase in property, plant and equipment and
intangibles 77,844 62,982 4,319 3,918 82,163 66,900
Note: Adjustments are mainly due to fixed assets not attributed to reportable segments.
23
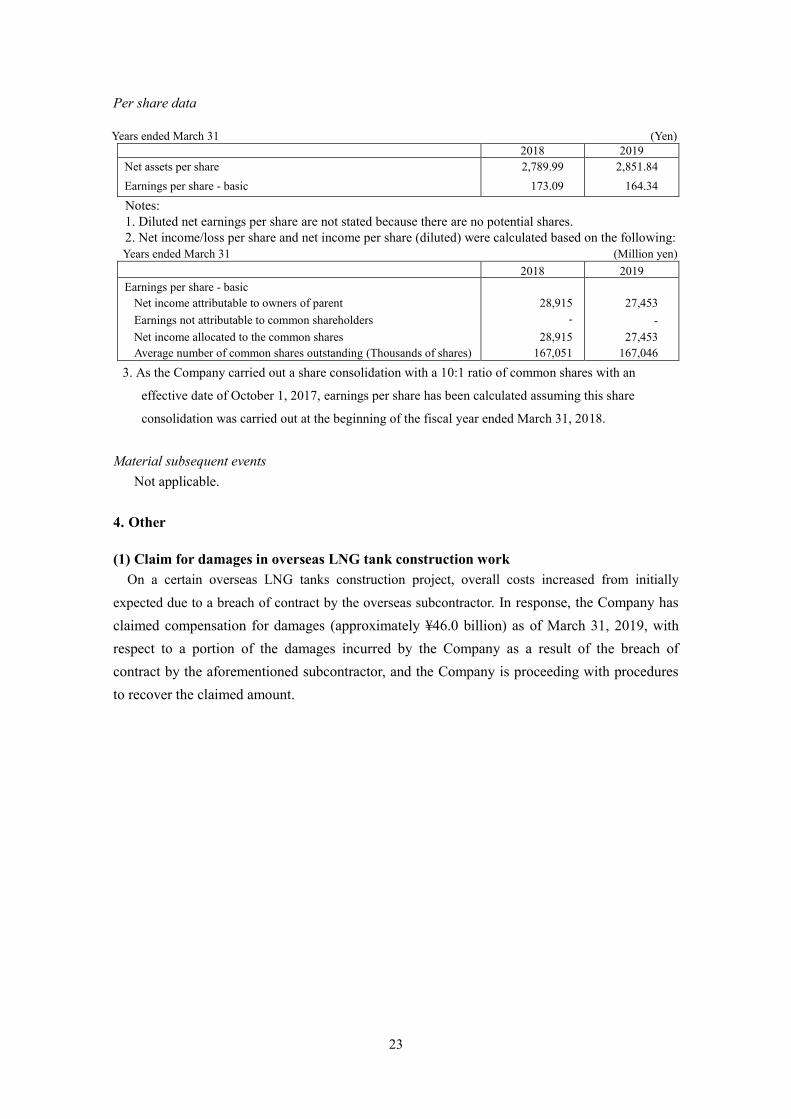
Per share data
Years ended March 31 (Yen)
2018 2019
Net assets per share 2,789.99 2,851.84
Earnings per share - basic 173.09 164.34
Notes:
1. Diluted net earnings per share are not stated because there are no potential shares.
2. Net income/loss per share and net income per share (diluted) were calculated based on the following:
Years ended March 31 (Million yen)
2018 2019
Earnings per share - basic
Net income attributable to owners of parent 28,915 27,453
Earnings not attributable to common shareholders - -
Net income allocated to the common shares 28,915 27,453
Average number of common shares outstanding (Thousands of shares) 167,051 167,046
3. As the Company carried out a share consolidation with a 10:1 ratio of common shares with an
effective date of October 1, 2017, earnings per share has been calculated assuming this share
consolidation was carried out at the beginning of the fiscal year ended March 31, 2018.
Material subsequent events
Not applicable.
4. Other
(1) Claim for damages in overseas LNG tank construction work
On a certain overseas LNG tanks construction project, overall costs increased from initially
expected due to a breach of contract by the overseas subcontractor. In response, the Company has
claimed compensation for damages (approximately ¥46.0 billion) as of March 31, 2019, with
respect to a portion of the damages incurred by the Company as a result of the breach of
contract by the aforementioned subcontractor, and the Company is proceeding with procedures
to recover the claimed amount.
24
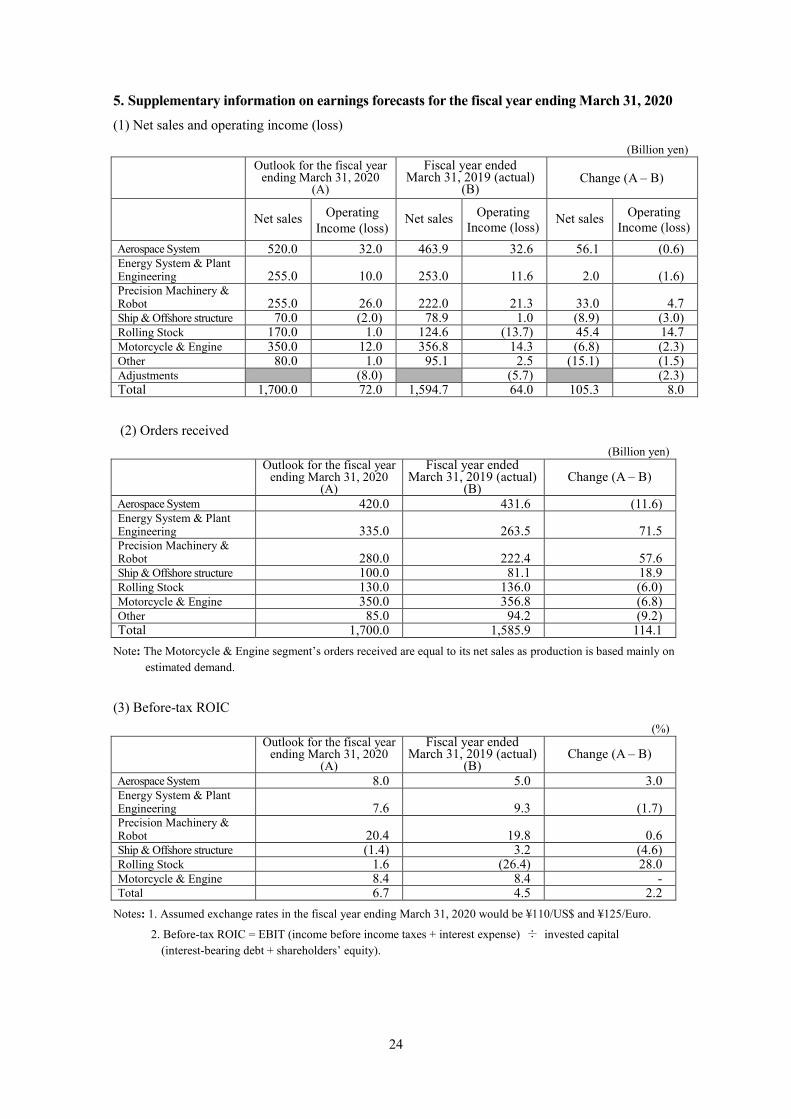
5. Supplementary information on earnings forecasts for the fiscal year ending March 31, 2020
(1) Net sales and operating income (loss)
(Billion yen)
Outlook for the fiscal year ending March 31, 2020
(A)
Fiscal year ended March 31, 2019 (actual)
(B) Change (A – B)
Net sales Operating
Income (loss) Net sales
Operating
Income (loss) Net sales
Operating
Income (loss)
Aerospace System 520.0 32.0 463.9 32.6 56.1 (0.6) Energy System & Plant Engineering 255.0 10.0 253.0 11.6 2.0 (1.6) Precision Machinery & Robot 255.0 26.0 222.0 21.3 33.0 4.7 Ship & Offshore structure 70.0 (2.0) 78.9 1.0 (8.9) (3.0) Rolling Stock 170.0 1.0 124.6 (13.7) 45.4 14.7 Motorcycle & Engine 350.0 12.0 356.8 14.3 (6.8) (2.3) Other 80.0 1.0 95.1 2.5 (15.1) (1.5) Adjustments (8.0) (5.7) (2.3) Total 1,700.0 72.0 1,594.7 64.0 105.3 8.0
(2) Orders received
(Billion yen) Outlook for the fiscal year
ending March 31, 2020 (A)
Fiscal year ended March 31, 2019 (actual)
(B) Change (A – B)
Aerospace System 420.0 431.6 (11.6) Energy System & Plant Engineering 335.0 263.5 71.5 Precision Machinery & Robot 280.0 222.4 57.6 Ship & Offshore structure 100.0 81.1 18.9 Rolling Stock 130.0 136.0 (6.0) Motorcycle & Engine 350.0 356.8 (6.8) Other 85.0 94.2 (9.2) Total 1,700.0 1,585.9 114.1
Note: The Motorcycle & Engine segment’s orders received are equal to its net sales as production is based mainly on
estimated demand.
(3) Before-tax ROIC
(%) Outlook for the fiscal year
ending March 31, 2020 (A)
Fiscal year ended March 31, 2019 (actual)
(B) Change (A – B)
Aerospace System 8.0 5.0 3.0 Energy System & Plant Engineering 7.6 9.3 (1.7) Precision Machinery & Robot 20.4 19.8 0.6 Ship & Offshore structure (1.4) 3.2 (4.6) Rolling Stock 1.6 (26.4) 28.0 Motorcycle & Engine 8.4 8.4 - Total 6.7 4.5 2.2
Notes: 1. Assumed exchange rates in the fiscal year ending March 31, 2020 would be ¥110/US$ and ¥125/Euro.
2. Before-tax ROIC = EBIT (income before income taxes + interest expense) ÷ invested capital
(interest-bearing debt + shareholders’ equity).