List of Tables · Web view0.1032 0.111 4.6300000000000001E-2 6.8900000000000003E-2...
105
NATIONAL REPORT ON THE ISSUE AND USE OF IMMUNOGLOBULIN (Ig) Annual Report 2015-16 National Blood Authority pg. 1
Transcript of List of Tables · Web view0.1032 0.111 4.6300000000000001E-2 6.8900000000000003E-2...

NATIONAL REPORT ON THE ISSUE AND USE OF IMMUNOGLOBULIN (Ig)
Annual Report 2015-16
National Blood Authority pg. 1

With the exception of any logos and registered trademarks, and where otherwise noted, all material presented in this document is provided under a Creative Commons Attribution 3.0 Australia licence.
The details of the relevant licence conditions are available on the Creative Commons website (accessible using the links provided) as is the full legal code for the CC BY 3.0 AU licence.
The content obtained from this document or derivative of this work must be attributed as the National Blood Authority National Report on the Issue and Use of Immunoglobulin (Ig) Annual Report 2015-16.
ISSN 1839-1079 (online version)
This report is available online at http://www.blood.gov.au/data-analysis-reporting
Locked Bag 8430Canberra ACT 2601
Phone: 13 000 BLOOD (13000 25663)Email: [email protected]
www.blood.gov.au
National Blood Authority pg. 2

ContentsLIST OF TABLES............................................................................................................................................................4LIST OF FIGURES..........................................................................................................................................................4
INTRODUCTION.................................................................................................................................................. 5
REPORT SNAPSHOT............................................................................................................................................ 7
METHODOLOGY................................................................................................................................................. 8
DATA QUALITY............................................................................................................................................................9
10 YEAR TRENDS............................................................................................................................................... 10
DEMAND TRENDS......................................................................................................................................................10FINANCIAL TRENDS.....................................................................................................................................................11
DEMOGRAPHICS............................................................................................................................................... 13
PATIENT NUMBERS....................................................................................................................................................13GEOGRAPHIC DISTRIBUTION.........................................................................................................................................14AGE........................................................................................................................................................................15WEIGHT...................................................................................................................................................................16
EXPENDITURE................................................................................................................................................... 17
CLINICAL INDICATIONS..................................................................................................................................... 19
IG ISSUES BY CRITERIA CHAPTER....................................................................................................................................19IG ISSUES BY DIAGNOSTIC GROUPS.................................................................................................................................20IG ISSUES BY CONDITION..............................................................................................................................................22IG ISSUES BY CLINICAL DISCIPLINE..................................................................................................................................24IG GRAMS ISSUED PER 1,000 POPULATION.....................................................................................................................25
DOSING............................................................................................................................................................ 30
IVIG AND SCIG.................................................................................................................................................. 32
NHIG................................................................................................................................................................ 39
APPENDIX A – BACKGROUND............................................................................................................................ 41
APPENDIX B – ACRONYMS AND GLOSSARY.......................................................................................................46
ACRONYMS...............................................................................................................................................................46GLOSSARY OF TERMS..................................................................................................................................................47
APPENDIX C – CLINICAL DISCIPLINE MAPPING TABLE.........................................................................................49
APPENDIX D – DATASET OF IG SUPPLY BY STATE/TERRITORY 2015-16...............................................................55
APPENDIX E – GRAMS IG ISSUED BY STATE AND TERRITORY..............................................................................70
APPENDIX F – UNIQUE PATIENTS BY QUARTER AND STATE AND TERRITORY......................................................71
APPENDIX G – SYSTEM SOURCE FOR TABLES AND FIGURES...............................................................................72
National Blood Authority pg. 3

LIST OF TABLESTable 1 Growth in Ig grams issued since 2006-07..................................................................................10Table 2 Percentage change in grams issued over time by state and territory.......................................11Table 3 Annual numbers of patients, treatment episodes and grams...................................................13Table 4 Basic numbers...........................................................................................................................13Table 5 Issues of domestic Ig compared with imported Ig.....................................................................18Table 6 Ig issues (g) by Criteria chapter.................................................................................................19Table 7 Ig issues by Criteria chapter (percentage).................................................................................19Table 8 Ig grams issued for top 10 diagnostic groups over time............................................................21Table 9 Difference in grams issued for secondary hypogammaglobulinaemia (percentage).................21Table 10 Patient numbers and age for the top 20 conditions..............................................................22Table 11 Ig grams issued by clinical discipline......................................................................................24Table 12 Grams of Ig issued by state and territory..............................................................................26Table 13 Patient numbers by state and territory: chronic inflammatory demyelinating polyneuropathy.........................................................................................................................................26Table 14 Patient numbers by state and territory: common variable immunodeficiency disease........27Table 15 Patient numbers by state and territory: myasthenia gravis..................................................27Table 16 Patient numbers by state and territory: chronic lymphocytic leukaemia..............................28Table 17 Patient numbers by state and territory: multiple myeloma..................................................28Table 18 Ig issued per 1,000 population by state and territory for top 10 conditions.........................29Table 19 Ig grams per kg weight per episode.......................................................................................31Table 20 Patient numbers for products issued by state and territory in 2015-16................................33Table 21 Grams of product issued by state and territory in 2015-16...................................................34Table 22 Treatment episode numbers for products issued by state and territory in 2015-16.............35Table 23 Patient numbers for products issued by diagnostic group in 2015-16..................................36Table 24 Grams of product issued by diagnostic group in 2015-16.....................................................37Table 25 Treatment episodes for product issued by diagnostic group in 2015-16..............................38Table 26 NHIg issued from 2011-12 to 2015-16...................................................................................39Table 27 Grams of NHIg issued by state and territory.........................................................................40Table 28 Grams per 1,000 population of NHIg issued by state and territory.......................................40
LIST OF FIGURESFigure 1 Ten year trends in issues of Ig...............................................................................................10Figure 2 Ten year trends in expenditure on Ig....................................................................................12Figure 3 Patients per 1,000 population 2015-16.................................................................................14Figure 4 Grams of Ig per 1,000 population by state and territory over time.......................................15Figure 5 Patient age compared to average Australian age..................................................................15Figure 6 Patient weights relative to Australian average......................................................................16Figure 7 Ig expenditure as a proportion of the national blood budget...............................................17Figure 8 Ig grams issued by diagnostic group......................................................................................20Figure 9 Proportion of Ig used for top 10 diagnosis group..................................................................23Figure 10 Ig issues by clinical discipline.................................................................................................24Figure 11 Percentage Ig issues by clinical discipline for top 10 diagnosis groups by state and territory
25Figure 12 Grams per episode by condition............................................................................................30Figure 13 NHIg Grams issued and grams issued per 1,000 population.................................................39
National Blood Authority pg. 4

IntroductionImmunoglobulin products analysed in this report include intravenous immunoglobulin (IVIg, subcutaneous immunoglobulin (SCIg) and normal human immunoglobulin (NHIg). Aggregated data for IVIg and SCIg is referred to as immunoglobulin (Ig) unless specifically stated. NHIg is reported separately. Ig is a blood product derived from donated human blood. Ig products are used to treat a broad range of conditions, with applications in replacement and immune modulation therapy. This report provides an analysis of national data on national Ig supply in Australia in 2015-16, also considering trends in supply over the last ten years.
In Australia it is estimated that over 99% of all Ig is supplied under national blood arrangements through contracts administered by the National Blood Authority (NBA). The NBA’s role is to coordinate national supply and demand planning for blood and blood products including supply risk management; purchasing blood and blood products on behalf of all Australian governments; developing and implementing national strategies to encourage better governance, promoting appropriate use of blood and blood products; and providing expert advice to support government policy development. Further background is at Appendix A – Background.
The Criteria for the Clinical Use of Intravenous Immunoglobulin (IVIg) in Australia (Criteria) identifies the conditions and circumstances for which the use of intravenous and subcutaneous immunoglobulin (SCIg) is funded under national blood arrangements. The Criteria was first published in 2008, and was updated in 2012. It classifies the 93 diagnostic groups described in the Criteria into those for which IVIg has an established therapeutic role (Chapter 5), has an emerging therapeutic role (Chapter 6) and those where IVIg has application in exceptional circumstances only (Chapter 7). IVIg is only supplied for these diagnostic groups unless purchased by a single state, hospital or individual (a Direct Order). Chapter 8 of the Criteria outlines those conditions for which IVIg should not be supplied, under national blood arrangements.
In addition to the clinical and diagnostic criteria for access to immunoglobulin products, access to SCIg products is provided through an assurance framework for the appropriate use of the product. SCIg access rules are detailed on the NBA website at https://www.blood.gov.au/SCIg. Participation in the National SCIg program requires hospitals to establish their capability and capacity to manage a hospital-based SCIg program, where the hospital provides access to all resources and takes full accountability for the management and use of the product within defined governing requirements.
Normal human immunoglobulin (NHIg) may only be supplied for two purposes; for the treatment of susceptible contacts of measles, hepatitis A, poliomyelitis and rubella, as directed by public health officials; or for the treatment of immunodeficiency conditions for which the product is indicated for patients for whom IVIg and SCIg are both contraindicated. NHIg access rules are detailed on the NBA website at https://www.blood.gov.au/NHIg.
Immunoglobulin products should be prescribed and dispensed in accordance with any applicable state or territory legislative requirements. In-hospital management of immunoglobulin products must also be in accordance with the National Safety and Quality Health Service (NSQHS) Standards, in particular Standards 1 and 7, and the Australian and New Zealand Society of Blood Transfusion (ANZSBT) Guidelines for the Administration of Blood Products and Guidelines for Pre-transfusion Laboratory Practice.
National Blood Authority pg. 5

Ig comprises a large proportion of blood expenditure each year. Demand for Ig continues to rise steadily, and Australian per 1000 population use of this product is one of the highest among western countries1. Demand for Ig is met through domestic and imported Ig products. Domestic Ig is manufactured by CSL Behring using plasma collected from voluntary, non-remunerated Australian donations. Both domestic and imported Ig are distributed by the Australian Red Cross Blood Service (Blood Service), with the Blood Service also being responsible for collection of data on behalf of governments for product funded under the national blood arrangements.
Australia is in a unique position to provide analysis and commentary on the use of Ig due to national supply arrangements. This report begins with an analysis of Ig supply over the last ten years, then considers patient demographics, expenditure on Ig, clinical indications for which Ig was supplied and finally analyses the dose prescribed for various conditions. The top ten diagnostic groups account for 88.4% of all Ig supplied in 2015-16, and for this reason specific analysis focuses on these groups.
1 Robert, Patrick. Global Use Of Plasma-Derived Medicinal Products, 2015
National Blood Authority pg. 6

Report Snapshot
National Blood Authority pg. 7
Ig USE
4.98 million grams issued
208 grams per 1,000
population
43% imported product
EXPENDITURE
Total cost of $541.5 million
49% of total blood budget
PATIENTS
16,331 patients
6,398 new patients
Median age 63 years

MethodologyThe report uses data from two primary sources, as follows:
1. Data collected by the Blood Service under contractual arrangements with the NBA on behalf of all Australian governments. This data is collected either when an order is placed for Ig, or is collected following the treatment where product is issued as imprest stock. The data is collected into the Blood Service’s Supply Tracking Analysis Recording System (STARS) database.
2. Data collected by the NBA on the units Ig issued to Australian Health Providers (AHPs) and purchases from suppliers. This data is held in the NBA Integrated Data Management System (IDMS).
Over the eight years between 2008-09 and 2015-16, data has been captured on 48,643 patients. Caveats relating to the quality of this data are outlined below.
This report includes data on the supply of Normal Human Immunoglobulin (NHIg) for the past five years and Subcutaneous Immunoglobulin (SCIg) for 2013-15, as no SCIg product was available in Australia before 2013-14. In this report data for IVIg and SCIg is aggregated and referred to as immunoglobulin (Ig) unless specifically stated. NHIg is reported separately. The report includes some language that may be unique to the Australian environment. A list of acronyms and definitions used in this report is at Appendix B – Acronyms and Glossary.
The Criteria groups together a number of conditions into one diagnostic group. For example, primary immunodeficiency disease is a diagnostic group in the Criteria, with this group incorporating the numerous separate conditions. In some cases the analysis will focus on the diagnostic group, while in other areas it will focus on the condition.
Each condition has been classified according to its allocated clinical discipline. It is acknowledged that for some conditions this classification is somewhat arbitrary. For example, there are immunological conditions affecting the blood that could potentially be mapped to either immunology or haematology. Where there appears to be significant overlap between clinical disciplines, the condition was mapped as mixed. In the majority of cases, the condition was mapped to the speciality most likely to be responsible for patients with that condition, noting that this can vary. Appendix C – Clinical Discipline mapping table provides the mapping of condition to discipline.
The summary of key items from the data file is provided for each condition at the state and territory level. The summary includes patient numbers, grams of Ig used for the condition, grams per treatment episode and grams per 1,000 population (Appendix D – Dataset of Ig supply by state/territory 2015-1). The source used for each figure and table is provided at Appendix G – System Source for Tables and Figures.
National Blood Authority pg. 8

DATA QUALITYThere are some factors relating to data quality, which need to be considered when reading this report, as follows:
The reconciliation of data held in STARS and IDMS indicates minor variances at a national level. In some cases these differences can be explained by product being ordered and recorded in STARS the month prior to product actually being issued to a patient.
Not all data fields are completed for all patients. For example, of the total patients recorded since 2008 43,661 patients (90%) had weight data entered, but only 8,201 (17%) had their weight data change in a treatment following the first entry.
The ABS population series 3201.0 (Population by Age and Sex, Australian States and Territories) ended in June 2010 and was replaced by Australian Demographic Statistics (cat. No 3101.0). Series 3201.0 was utilised as the denominator for population statistics for Ig annual reports before 2011-12.
Care should be taken when interpreting the data relating to the smaller states and territories as one or two patients can overly influence the use compared to larger states. The five largest Australian states are New South Wales (NSW), Victoria (VIC), Queensland (QLD), South Australia (SA) and Western Australia (WA).
There has been no adjustment for Ig used in one state or territory for patients residing in a different state or territory.
A total of 1141 (2%) patients received product in more than one state and territory. For example, if a patient relocated from New South Wales to Victoria, they will be counted as a patient in both states. The national patient count only includes one count for each patient. This may result in the sum of the state and territory totals being greater than the national total.
Patient numbers were first reported in 2008-09. A small number of patients who did not receive product funded under national blood arrangements have been excluded from the total patient count.
A total of 4,423 (9%) patients had more than one condition over time. In these cases, a patient may be counted more than once in the data in this report, that is, the patient will be counted in the totals for each condition.
The STARS data has age and weight data recorded at treatment dates (first reported in 2009-10). This data changes over time. Age data is based on the patient’s age at 1 January each year.
Diagnosis group and conditions captured prior to the implementation of the Criteria were mapped to ensure that they were meaningfully represented, however information from previous years may not be directly comparable from 2008-09 forward. There is a small variance between disciplines by year due to mapping methodology.
National Blood Authority pg. 9

10 Year TrendsDEMAND TRENDSIn 2015-16 a total of 4,982,503 grams of Ig was issued, representing an increase of 549,357 grams (12.4%) over 2014-15. Since 2006-07 there has been an on average 11.6% increase in Ig use, with the greatest proportion of that increase comprising imported products (Figure 1).
2006
-07
2007
-08
2008
-09
2009
-10
2010
-11
2011
-12
2012
-13
2013
-14
2014
-15
2015
-160
1,000,000
2,000,000
3,000,000
4,000,000
5,000,000
6,000,000
0
50
100
150
200
250
Total Domestic Total Imported Issues per 1000 population
Financial Year
Gram
s of I
g Iss
ued
to A
HPs
Gram
s per
100
0 po
pula
tion
Figure 1 Ten year trends in issues of Ig
Table 1 Growth in Ig grams issued since 2006-072006-
072007-
082008-
092009-
102010-
112011-
122012-
132013-
142014-
152015-
16
Growth from previous year 14% 13% 11% 12% 11% 11% 11% 11% 10% 12%
Average Growth from 2006-07 7% 8% 10% 11% 12% 13% 14% 15% 16%
Total grams per 1,000 population 92 102 111 121 133 145 158 173 188 208
Increase in grams per 1,000 population over previous year
12% 11% 8% 10% 10% 9% 9% 9% 9% 11%
There has been a steady increase in demand for Ig over the last ten years, with increases of 10-12% per annum for the last five years. While a small proportion of this increase may be attributable to
National Blood Authority pg. 10

population increases, there has also been a steady increase of 8-11% per annum in the use of Ig per ’000 population (Table 1) since the introduction of the Criteria in 2008.
A breakdown of the year on year change in grams issued by state and territory has been provided in Table 2. Queensland has been growing at the fastest rate, closely followed by Victoria and New South Wales. Further information about the breakdown of domestic and imported Ig by state over time can be found in Appendix E – Grams Ig Issued by .
Table 2 Percentage change in grams issued over time by state and territoryNSW VIC QLD WA SA TAS ACT NT
2006-07 13% 20% 18% 10% -11% 30% 12% -16%
2007-08 18% 8% 16% 6% 14% 5% 29% 1%
2008-09 15% 3% 14% 0% 23% 14% -14% 54%
2009-10 13% 11% 15% -4% 12% 7% 20% -18%
2010-11 11% 10% 16% 10% -4% 8% 28% 7%
2011-12 11% 7% 16% 6% 9% 1% 17% 47%
2012-13 11% 13% 11% 7% 9% -6% 12% 21%
2013-14 10% 11% 12% 6% 15% 14% 1% 12%
2014-15 9% 11% 12% 12% 7% 8% 8% 8%
2015-16 14% 10% 14% 17% 11% 2% 3% 36%
FINANCIAL TRENDSThe increase in demand for Ig places a financial burden on the Australian health system. In Australia, the total cost of domestic Ig supply comprises the cost of the plasma collected by the Blood Service, plus the cost of purchase of the finished Ig product from the supplier (CSL Behring). Imported plasma is purchased at a total product cost only.
Total expenditure on Ig (excluding plasma for fractionation) in 2015-16 was $296.4 million, an increase of $23.3 million (8.5%) over 2014-15 (Figure 2). The increased expenditure predominately represents increases in demand.
There also continues to be an increase in the price of plasma for fractionation due to the increased ratio of apheresis to whole blood plasma for fractionation being supplied, resulting in an increase in the cost of domestic Ig. Combined with expenditure for plasma for fractionation, Ig accounts for a total expenditure of $541.5 million (excluding hyperimmune plasma for fractionation).
National Blood Authority pg. 11

2006-07 2007-08 2008-09 2009-10 2010-11 2011-12 2012-13 2013-14 2014-15 2015-160
50
100
150
200
250
300
350Domestic Fractionation Cost and Imported Product Cost for IgDomestic Plasma Costs
Financial Year
Dolla
rs ($
m)
Figure 2 Ten year trends in expenditure on Ig
National Blood Authority pg. 12

DemographicsPATIENT NUMBERSA total of 16,331 patients were issued Ig under the national blood arrangements during 2015-16 for 159,041 treatment episodes. This represents a 9.0% increase in the number of patients since 2014-15. A summary of some patient numbers is provided in Table 3 and Table 4. A breakdown of unique patients by state and territory and quarter is provided in Appendix F – Unique Patients by Quarter and .
Table 3 Annual numbers of patients, treatment episodes and gramsYear Patients Treatment Episodes Total Grams Issued
2008-09 9,870 77,212 2,380,257
2009-10 10,537 85,299 2,655,184
2010-11 11,492 93,893 2,950,371
2011-12 12,127 101,388 3,271,309
2012-13 13,102 110,183 3,622,433
2013-14 13,981 122,791 4,021,861
2014-1514,983 140,855 4,433,146
2015-16 16,331 159,041 4,982,503
Table 4 Basic numbers2015-16
Total unique patient IDs with some weight data 16,062Total unique patient IDs with an age recorded 16,331Total unique patient IDs with a weight change 918Total unique patient IDs with more than one state or territory 248Total unique patient IDs with two states or territories 229Total unique patient IDs with three or more states or territories 19Total unique patient IDs with more than one condition 451Total unique patient IDs with two conditions 441Total unique patient IDs with three conditions 10Total unique patient IDs with four or more conditions 0Total unique patient IDs aged 93 or older 63Note: The above table calculations relate to only 2015-16 patients unlike previous reports where it included multiple years of data
National Blood Authority pg. 13

GEOGRAPHIC DISTRIBUTIONNationally, 0.7 patients per 1,000 population received Ig in 2015-16. This varied between states and territories, ranging from 0.4 in Western Australia to 0.9 in Queensland (Figure 3). All states and territories show an increase in the number of patients per 1,000 population over the previous year.
Details on the number of patients by condition are at Appendix D – Dataset of Ig supply by state/territory 2015-1.
NSW VIC QLD WA SA TAS ACT NT Australia0.0
0.1
0.2
0.3
0.4
0.5
0.6
0.7
0.8
0.9
1.0
Patie
nts p
er 1
,000
pop
ulati
on
Figure 3 Patients per 1,000 population 2015-16
There is significant variation between jurisdictions in Ig use in grams per 1,000 population, ranging from 98.7 in the Northern Territory to 281.9 in Queensland (Figure 4 Grams of Ig per 1,000 population by state and territory over time). Rates for the smaller population states and territories must be viewed with some caution as there are many factors that could contribute to their different use patterns, such as patients travelling to larger states for specialist treatment. Comparing only the five largest Australian states, the variation in Ig use is 2.4 fold, ranging from 120.0 grams per 1,000 population in Western Australia to 281.9 grams per 1,000 population in Queensland. The reason for this inter-state and territory variation is unknown. The lower use may represent appropriate management and prescribing practices, or may represent a level of under-diagnosis.
Prior to 2014-15 Western Australia had shown only slight increases in the number of grams issued per 1,000 population, while most states and territories have seen a continued strong increase in Ig issued per 1,000 population. However, in 2015-16 Western Australia had the highest increase in growth of Ig issued per 1,000 population (excluding NT). Western Australia does remain with the lowest Ig issued per 1,000 population regardless.
National Blood Authority pg. 14

NSW VIC QLD WA SA TAS ACT NT Australia0
50
100
150
200
250
300
2011-122012-132013-142014-152015-16
Ig g
ram
s iss
ued
per 1
,000
pop
ulati
on
Figure 4 Grams of Ig per 1,000 population by state and territory over time
AGEThe distribution of estimated age is shown in Figure 5 where it is compared with the age distribution of the Australian population at December 20152. A bimodal peak can be seen in the patient population treated with Ig, with the majority of Ig recipients either being very young, or over 55. The ageing population is expected to place a greater burden on Ig demand into the future, with the proportion of the world’s population over 60 years expected to more than double between 2015 and 20503.
06
121824303642485460667278849096
102
0.040 0.030 0.020 0.010 0.000 0.010 0.020
IVIg recipient population Australian population
Percentage of population
Estim
ated
Age
Figure 5 Patient age compared to average Australian age
2 ABS 3101.03 World Health Organization, http://www.who.int/ageing/en/ (Accessed 16 June 2017)
National Blood Authority pg. 15

WEIGHTIg dosing is dependent on the weight of the patient. For many immune replacement conditions, the patient weight determines the initial dosing, with maintenance therapy titrated against IgG levels and the patient’s clinical response to therapy. However, for conditions where Ig is used for its immunomodulatory properties, the Criteria limits the dose that can be prescribed based on the patient weight alone.
< 55 55 to 59
60 to 64
65 to 69
70 to 74
75 to 79
80 to 84
85 to 89
90 to 94
95 to 99
100 to 104
105 to 109
> 1090%
2%
4%
6%
8%
10%
12%
14%
Adult Ig patients Average Australian Adults
Weight in kilograms
Prop
ortio
n of
tota
l
Figure 6 Patient weights relative to Australian averageNote: The above figure calculations relate to only 2015-16 patients.
Figure 6 Patient weights relative to Australian average compares the weight of Ig recipients in Australia and the Australian population4. There is a higher proportion of patients treated with Ig less than 55kg relative to the proportion in the Australian population. The average weight of adult Ig patients (78.3 kg) is slightly higher than the average weight of an Australian adult (77.7 kg5); this is a change from previous years where it has been lower suggesting that the Ig population is getting heavier. Given that studies suggest that 63% of Australians are overweight or obese6, the similarity in weight profiles between Ig recipients and the Australian population suggests that a large proportion of Ig recipients may also be overweight. While the current Criteria provides for dosing based on body weight, some limited studies suggest that dosing on lean body weight (ideal body weight) may be more appropriate. A small pilot study in Western Australia focussing on a narrow range of conditions suggested reductions of Ig dose of between 2.4% and 4.2% were achieved using a lean body dosing methodology7. However, this has not been published in peer review literature, was not a randomised controlled trial, and did not discuss whether there were differences in clinical outcomes between the two groups. With an increasingly obese population, we can expect increases in demand if total (rather than lean) body weight dosing is continued and following reviews conducted of the literature relating to lean body mass dosing this area should be considered for future research.
It should be noted that care should be taken when analysing the weights, not all patients have weight recorded and for those that do the weight recorded may not be recent.
4 ABS 4841.05 ABS 4841.0 (average of male and female)6 ABS 4364.0.55.0017 Aston, L 2012, The effect of ideal body weight (IBW) adjusted dosing on the use of intravenous immunoglobulin (IVIg) in Western Australia, Australian Red Cross Blood Service, Australia.
National Blood Authority pg. 16

ExpenditureIn 2015-16, Australian expenditure on Ig products was $296.4 million, with additional expenditure of $245.1 million on plasma for fractionation (excluding hyperimmune plasma for fractionation) collected by the Blood Service.
The cost of Ig as a proportion of the national blood budget is shown at Figure 7 Ig expenditure as a proportion of the national blood budget. Ig is the second largest budget item, representing 27% of the total budget for blood and blood products. Combined with expenditure for plasma for fractionation, Ig accounts for 49% of the total blood budget, at a total expenditure of $541.5 million (excluding hyperimmune plasma for fractionation).
Clotting Factor Products
15%
Hyperimmunes1%Diagnostic
<1%
Ig27%
Plasma Collections22%
Albumin2%
Fresh Blood Products32%
Figure 7 Ig expenditure as a proportion of the national blood budget
Of the Ig supplied under national blood arrangements in Australia, 57% (2,850,947 grams) was manufactured domestically and 43% (2,131,556 grams) was imported from overseas. This represents a 20.1% increase in product importation since 2013-14 (476,604 grams) (Table 5). Domestic supply is driven by the amount of plasma for fractionation collected in Australia and this increased by 5.1% in 2015-16 over 2014-15. Intragam P (IVIg) and Evogam (SCIg) are Ig products manufactured domestically in 2015-16. The imported products available were Kiovig (IVIg), Octagam (IVIg), Privigen (IVIg), Flebogamma (IVIg), Hizentra (SCIg) and Gammanorm (SCIg). When a patient is allocated to receive one of the imported products it is the clinician’s choice as to which product they order. Supply of Octagam constituted 41% of the supply of imported Ig.
National Blood Authority pg. 17

Table 5 Issues of domestic Ig compared with imported Ig
NSW NSW VIC QLD WA SA TAS ACT NT AUS
Domestic Ig
Intragam Pg 986,685 633,909 754,161 146,661 161,283 52,677 52,518 5,589 2,793,483
$(m) $62 $40 $47 $9 $10 $3 $3 $0 $175
Evogamg 17,843 9,431 17,021 6,239 6,316 530 83 57,464
$(m) $1 $1 $1 $0 $0 $0 $0 $4
Total Domestic
g 1,004,528 643,340 771,182 152,900 167,599 53,207 52,601 5,589 2,850,947
$(m) $63 $40 $48 $10 $11 $3 $3 $0 $179
Imported Ig
Kiovigg 144,640 112,027 130,704 39,577 65,551 2,068 16,554 8,906 520,025
$(m) $9 $7 $8 $2 $4 $0 $1 $1 $31
Octagamg 364,569 180,052 237,902 57,246 175 24,778 4,514 137 869,372
$(m) $22 $11 $14 $3 $0 $1 $0 $0 $52
Gammanormg 9,268 1,051 587 1,914 1,036 3,614 17,470
$(m) $1 $0 $0 $0 $0 $0 $1
Flebogammag 79,296 42,917 42,693 21,308 12,340 5,841 875 35 205,305
$(m) $4 $2 $2 $1 $1 $0 $0 $0 $9
Privigeng 119,105 116,535 162,265 38,770 21,625 13,630 13,755 9,410 495,095
$(m) $5 $5 $7 $2 $1 $1 $1 $0 $22
Hizentrag 8,083 239 9,661 2,143 1,560 651 1,952 24,289
$(m) $0 $0 $1 $0 $0 $0 $0 $1
Total Imported
g 724,960 451,770 584,275 159,631 103,165 48,003 41,264 18,489 2,131,556
$(m) $41 $25 $32 $9 $6 $3 $2 $1 $117
Proportion of domestic to imported Ig
g % 58% 59% 57% 49% 62% 53% 56% 23% 57%
$(m) % 61% 62% 60% 53% 65% 56% 59% 27% 61%
Note: $(m) excludes the costs for plasma for fractionation.
National Blood Authority pg. 18

Clinical IndicationsIG ISSUES BY CRITERIA CHAPTERThe Criteria classifies conditions into four chapters based on the level of evidence supporting the use of Ig, as follows:
Chapter 5, conditions for which IVIg has an established therapeutic role Chapter 6, conditions for which IVIg has an emerging therapeutic role Chapter 7, conditions for which IVIg has application in exceptional circumstances only Chapter 8, conditions for which IVIg use is not indicated.
Ig was predominately issued for conditions within Chapter 5 (Error: Reference source not found). The relative distribution by chapter has remained relatively stable since 2008, with a decrease in Ig issues for Chapter 8 conditions (Table 7).
Table 6 Ig issues (g) by Criteria chapter2008-09 2009-10 2010-11 2011-12 2012-13 2013-14 2014-15 2015-16
Chapter 5 1,990,586 2,212,914 2,505,332 2,724,809 3,025,452 3,409,100 3,785,615 4,223,866
Chapter 6 345,176 371,832 397,231 444,605 453,352 463,361 494,489 535,596
Chapter 7 47,275 61,924 76,033 101,287 120,979 148,581 178,221 216,927
Chapter 8 3,326 2,550 2,574 1,909 39 0 0 5
Total 2,386,361 2,649,462 2,981,385 3,272,930 3,599,831 4,021,042 4,458,326 4,976,394
Table 7 Ig issues by Criteria chapter (percentage)2009-10 2010-11 2011-12 2012-13 2013-14 2014-15 2015-16
Chapter 5 84% 84% 83% 84% 85% 85% 85%
Chapter 6 14% 13% 14% 13% 12% 11% 11%
Chapter 7 2% 3% 3% 3% 4% 4% 4%
Chapter 8 <1% <1% <1% <1% 0% 0% 0%
For conditions where Ig is used only in exceptional circumstances (Chapter 7), five diagnostic groups accounted for 54.1% of those issues. These conditions were Limbic Encephalitis – nonparaneoplastic (48,098g), Solid organ transplantation (other than kidney) (24,266g), Pyoderma gangrenosum (16,598g), Paraneoplastic syndromes (16,116g) and Devic disease (neuromyelitis optica) (12,477g). While use in these conditions represents a small proportion of total Ig use, closer examination may be warranted.
Both Limbic Encephalitis – nonparaneoplastic and Pyoderma gangrenosum have approximately quadrupled in grams issued since 2012-13 and tripled in patient count.
National Blood Authority pg. 19

While Ig may be issued in life threatening situations prior to diagnosis or in situations where the diagnosis is unclear at the time of treatment, in 2015-16 there was one case where Ig was supplied for a condition not in the Criteria (excluding Direct Orders where alignment with the Criteria is not required as it is not funded under the national blood arrangements). However, data to support compliance with all aspects of qualifying criteria for each condition is not always collected.
IG ISSUES BY DIAGNOSTIC GROUPSThe top ten diagnostic groups account for 88.4% of all Ig supplied, with the top three diagnostic groups accounting for 57.0%.
Acquired hypogammaglobulinaemia secondary to haematological malignancies is the diagnostic group for which the greatest percentage of Ig was issued in 2015-16 (22.2%), closely followed by chronic inflammatory demyelinating polyneuropathy (21.5%). Primary immunodeficiency diseases accounted for 13.3% of total Ig use (Figure 8, ).
Since 2011-12 there has been a greater than 14% increase in Ig issues for both acquired hypogammaglobulinaemia secondary to haematological malignancies and chronic inflammatory demyelinating polyneuropathy, and a 9.6% increase in issues for primary immunodeficiency diseases. This is compared with the 13% increase in Ig over this period for all conditions. This indicates that while Ig issues for acquired hypogammaglobulinaemia secondary to haematological malignancies and chronic inflammatory demyelinating polyneuropathy are growing at a high rate, primary immunodeficiency diseases are growing at a lower rate while remaining a high use diagnostic group. If these trends continue as they are, we would expect to see myasthenia gravis overtake primary immunodeficiency diseases in the next 7 years.
Acqu
ired
hypo
gam
mag
lobu
linae
mia
se
cond
ary
to h
aem
atol
ogica
l mal
igna
n-cie
sCh
roni
c infl
amm
ator
y de
mye
linati
ng
poly
neur
opat
hy
Prim
ary
imm
unod
eficie
ncy
dise
ases
Mya
sthe
nia
grav
is
Mul
tifoc
al m
otor
neu
ropa
thy
Infla
mm
ator
y m
yopa
thie
s
ITP
in a
dults
Seco
ndar
y hy
poga
mm
aglo
bulin
aem
ia
Guill
ain-
Barr
e sy
ndro
me
Spec
ific a
ntibo
dy d
eficie
ncy
0200,000400,000600,000800,000
1,000,0001,200,000
2011-122012-132013-142014-152015-16Ig
Gra
ms i
ssue
d
Figure 8 Ig grams issued by diagnostic group
National Blood Authority pg. 20
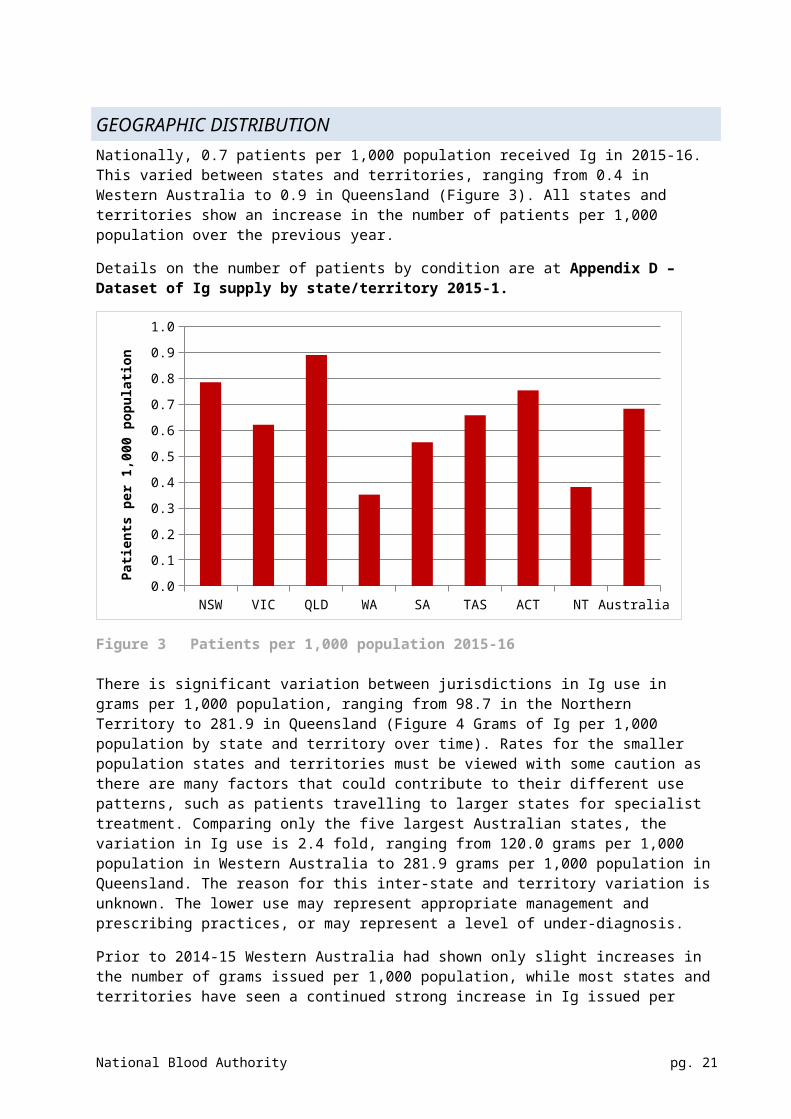
Table 8 Ig grams issued for top 10 diagnostic groups over time2011-12 2012-13 2013-14 2014-15 2015-16 % Change
Acquired hypogammaglobulinaemia secondary to haematological malignancies
694,640 771,071 862,898 982,773 1,106,721 12.6%
Chronic inflammatory demyelinating polyneuropathy 677,458 758,271 857,533 974,258 1,071,135 9.9%
Primary immunodeficiency diseases 477,461 509,364 558,617 614,781 660,816 7.5%
Myasthenia gravis 231,064 257,966 313,940 348,336 402,881 15.7%
Multifocal motor neuropathy 192,109 209,791 239,314 256,041 293,458 14.6%
Inflammatory myopathies 153,931 188,362 230,473 249,229 293,422 17.7%
ITP in adults 162,098 178,738 186,640 187,621 210,094 12.0%
Secondary hypogammaglobulinaemia 95,183 106,484 110,024 126,561 145,497 15.0%
Guillain-Barre syndrome 95,359 104,360 108,929 105,567 124,692 18.1%
Specific antibody deficiency 99,521 97,749 83,220 83,381 88,994 6.7%
Secondary hypogammaglobulinaemia falls into the top ten diagnostic groups. The increase in issues of secondary hypogammaglobulinaemia was largely in New South Wales between 2009-10 and 2012-13, however in the last 2 years QLD, VIC and WA have also had substantial increases (Table 9). In NSW there has been a 431% increase between 2008-09 and 2015-16, associated with a concurrent increase in patient numbers (increase of 183%). The grams issued per patient has increased by 87%. However there has also been a large increase in grams per 1,000 population from 1.5 to 5.7.
Table 9 Difference in grams issued for secondary hypogammaglobulinaemia (percentage)2009-10 2010-11 2011-12 2012-13 2013-14 2014-15 2015-16
NSW 51% 31% 37% 31% 8% 20% 15%
VIC 17% 35% 30% 4% -7% 11% 20%
QLD -6% 13% 12% 1% 7% 15% 16%
WA -14% -20% 45% 10% -24% 6% 38%
National Blood Authority pg. 21

SA 88% 0% -4% 45% 15% -9% -20%
TAS 16% 41% -4% -8% -2% -3% -7%
ACT 29% -16% -66% -51% 41% 454% 22%
NT - 1100% -67% 330% -73% 119% -81%
Total 11% 21% 20% 12% 3% 15% 15%
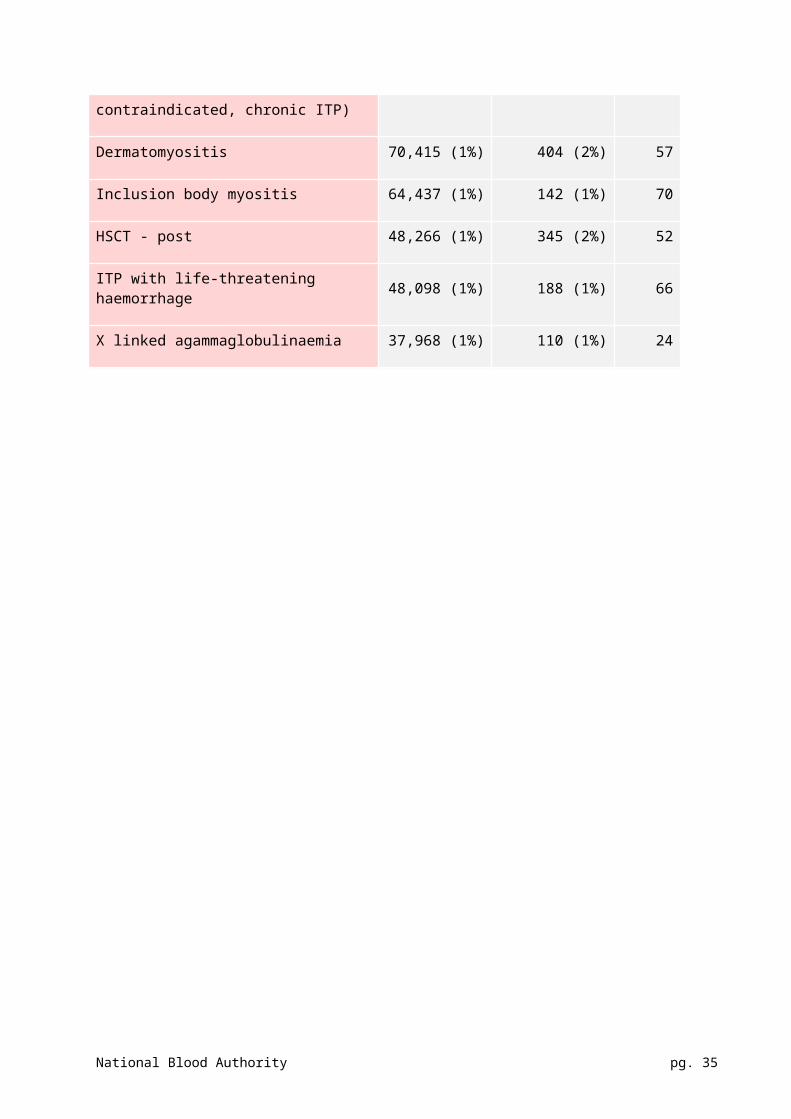
IG ISSUES BY CONDITIONTable 10 provides an overview of the conditions that use the most Ig, including data on total Ig use, patient numbers and median birth year. These conditions account for 88.9% of all Ig supplied, with the top ten conditions accounting for 75.1%. This data is also replicated in Figure 9 for the top 10 conditions.
Table 10 Patient numbers and age for the top 20 conditions
Conditions (Top 20) Igg (% of total)
Patientsn (% of total)
Median Age
Chronic inflammatory demyelinating polyneuropathy 1,071,135 (22%) 2,250 (14%) 64
Common variable immunodeficiency disease 580,964 (12%) 1,724 (11%) 54
Myasthenia gravis 402,881 (8%) 945 (6%) 63
Chronic lymphocytic leukaemia 350,066 (7%) 1,380 (8%) 72
Non-Hodgkin lymphoma 332,148 (7%) 1,308 (8%) 68
Multifocal motor neuropathy 293,458 (6%) 496 (3%) 57
Multiple myeloma 275,685 (6%) 1,177 (7%) 71
Polymyositis 158,414 (3%) 393 (2%) 64
Secondary hypogammaglobulinaemia (excludes haem malignancies) 145,497 (3%) 652 (4%) 60
Guillain-Barré syndrome 124,692 (3%) 727 (4%) 55
Kidney transplantation post-transplant 100,556 (2%) 533 (3%) 50
National Blood Authority pg. 22

Other relevant haematological malignancies 94,004 (2%) 574 (4%) 64
ITP refractory 80,807 (2%) 349 (2%) 64
Specific antibody deficiency 72,403 (1%) 268 (2%) 57
ITP in specific circumstances (surgery, corticosteroids contraindicated, chronic ITP) 70,571 (1%) 193 (1%) 59
Dermatomyositis 70,415 (1%) 404 (2%) 57
Inclusion body myositis 64,437 (1%) 142 (1%) 70
HSCT - post 48,266 (1%) 345 (2%) 52
ITP with life-threatening haemorrhage 48,098 (1%) 188 (1%) 66
X linked agammaglobulinaemia 37,968 (1%) 110 (1%) 24
National Blood Authority pg. 23

NSW VIC QLD WA SA TAS ACT NT National0%
10%
20%
30%
40%
50%
60%
70%
80%
90%
100%
Specific antibody deficiency
Guillain-Barre syndrome
Secondary hypogammaglobulinaemia
ITP in adults
Multifocal motor neuropathy
Inflammatory myopathies
Myasthenia gravis
Primary immunodeficiency diseases
Chronic inflammatory demyelinating polyneuropathy
Acquired hypogammaglobulinaemia secondary to haematological ma-lignancies
State
Figure 9 Proportion of Ig used for top 10 diagnosis group
Population based data on Ig issues is particularly interesting for conditions where the majority of patients receive Ig as it can provide an estimation of disease prevalence. One condition for which Ig would be prescribed for the vast majority of diagnosed patients is common variable immunodeficiency disease.
Ig was supplied for 1,724 patients with common variable immunodeficiency disease. The estimated prevalence of common variable immunodeficiency disease as measured by patients treated with Ig for this indication is 7.2 per 100,000 population (ranging from 3.7 to 16.0 per 100,000 population across Australian states and territories and 3.7 to 10.6 if ACT, NT and TAS are excluded).
For common variable immunodeficiency disease, this estimate is higher than other studies suggest with estimates between 2 and 4 people per 100,000 population8. The ability to calculate accurate prevalence estimates is important for health service planning. It should be noted that the prevalence estimate is for diagnosed and treated patients only.
8 Cunningham-Rundles, C 2012, The many faces of common variable immunodeficiency, American Society of Hematology, USA.
National Blood Authority pg. 24

IG ISSUES BY CLINICAL DISCIPLINEThe number of grams of Ig issued categorised according to clinical discipline is shown in Figure 10. Some conditions are classified as mixed, in that they fall across more than one clinical discipline. Other conditions fall within a clinical discipline other than neurology, haematology or immunology, such as use in transplants or dermatology. These are considered under ‘Other’ in Figure 10. Table 11 replicates this data.
Since 2011-12, there has been a 1.6 fold increase in Ig issues for neurological conditions, compared with a 1.4 fold increase for both haematological conditions and immunological conditions.
Neurology Haematology Immunology Other0
500,000
1,000,000
1,500,000
2,000,000
2,500,000
3,000,000
2011-122012-132013-142014-152015-16Ig
gra
ms i
ssue
d
Figure 10 Ig issues by clinical discipline
Table 11 Ig grams issued by clinical discipline2011-12 2012-13 2013-14 2014-15 2015-16
Neurology 1,460,702 1,649,358 1,916,792 2,120,111 2,407,995
Haematology 961,366 1,026,177 1,116,037 1,234,816 1,390,824
Immunology 656,179 695,298 746,828 828,735 885,933
Other 194,363 228,947 241,386 274,664 291,643
There is significant variation across Australia in Ig use for each clinical discipline (as allocated). Figure 11 shows that in Western Australia issues for neurological conditions represent a greater proportion of
National Blood Authority pg. 25

total issues than for other states. The proportional use for immunological conditions is much lower in Queensland and Tasmania than other states, with use of Ig for neurological and haematological conditions prevailing in these two states. The reason for this inter-state and territory variation is unknown, but it may represent differences in clinical practice, differing patient populations with disease profiles, variable access to alternative therapies and/or differences due to the availability of specialist services across Australia.
NSW VIC QLD WA SA TAS ACT NT0%
10%20%30%40%50%60%70%80%90%
100%
OtherHaematologyImmunologyNeurology
State
Perc
enta
ge Ig
gra
ms i
ssue
d
Figure 11 Percentage Ig issues by clinical discipline for top 10 diagnosis groups by state and territory
IG GRAMS ISSUED PER 1,000 POPULATIONThe amount of Ig issued per 1,000 population for each indication varies between state and territory. Complete data for conditions by state and territory can be found at Appendix D – Dataset of Ig supply bystate/territory 2015-1and is summarised for the conditions with the highest usage of Ig. Table 12 shows a breakdown of the proportion of Ig issued in each state and territory with a comparison to the proportion of the population in each state and territory.
The highest variation between states and territories in Ig use per ’000 population is seen in Chronic Inflammatory Demyelinating Polyneuropathy and Non-Hodgkin lymphoma. In total, for the five largest states, there were a low number of Ig issues per ’000 population in South Australia and Western Australia respectively, and high use in Queensland. The reason for the significant variation between these states is unknown, and further studies may be required to ascertain the significance of this finding. Interestingly, the difference appears to be attributed to a greater number of patients, rather than higher dosing, with the dosing in South Australia and Western Australia being higher than Queensland for Chronic Inflammatory Demyelinating Polyneuropathy (Appendix D – Dataset of Ig supply by state/territory 2015-1).
National Blood Authority pg. 26

Table 12 Grams of Ig issued by state and territory
Ig issued (g) Proportion of total Ig issued
Proportion of Australian population
Grams per 1,000 population
NSW 1,729,488 34.7% 32.0% 225
VIC 1,095,110 22% 25.1% 183
QLD 1,355,457 27% 20.1% 282
WA 312,531 6% 10.9% 120
SA 270,764 5% 7.1% 159
TAS 101,210 2% 2.2% 196
ACT 93,865 2% 1.0% 385
NT 24,078 0% 1.6% 61
Total 4,982,503 100% 100% 208
The following tables (Table 13, Table 14, Table 15, Table 16 and Table 17) show the patient numbers for states and territories over time for specific conditions.
Table 13 Patient numbers by state and territory: chronic inflammatory demyelinating polyneuropathy
Chronic inflammatory demyelinating polyneuropathy
2011-12 2012-13 2013-14 2014-15 2015-16
NSW 598 652 704 772 834
VIC 372 421 447 464 507
QLD 386 485 529 580 648
WA 99 105 108 123 130
SA 73 80 81 81 93
TAS 30 33 37 32 36
ACT 17 22 28 27 32
NT 5 7 <5 8 15
Australia 1,551 1,753 1,903 2,054 2,250
National Blood Authority pg. 27

Note: The national patient count only includes one count for each patient. This may result in the sum of the state and territory totals being greater than the national total.
National Blood Authority pg. 28

Table 14 Patient numbers by state and territory: common variable immunodeficiency diseaseCommon variable immunodeficiency disease 2011-12 2012-13 2013-14 2014-15 2015-16
NSW 617 650 721 793 813
VIC 232 241 265 276 288
QLD 276 311 317 338 370
WA 61 67 78 88 95
SA 102 101 110 110 116
TAS 20 21 25 25 29
ACT 54 58 60 66 63
NT 5 <5 <5 <5 10
Australia 1,323 1,406 1,543 1,656 1,724
Note: The national patient count only includes one count for each patient. This may result in the sum of the state and territory totals being greater than the national total.
Table 15 Patient numbers by state and territory: myasthenia gravisMyasthenia gravis 2011-12 2012-13 2013-14 2014-15 2015-16
NSW 219 235 267 297 335
VIC 141 177 186 199 215
QLD 181 199 212 245 310
WA 36 39 51 41 46
SA 19 17 14 17 28
TAS 17 10 10 11 16
ACT 10 13 14 16 16
NT <5
Australia 609 671 747 818 945
Note: The national patient count only includes one count for each patient. This may result in the sum of the state and territory totals being greater than the national total.
National Blood Authority pg. 29

National Blood Authority pg. 30

Table 16 Patient numbers by state and territory: chronic lymphocytic leukaemiaChronic lymphocytic leukaemia 2011-12 2012-13 2013-14 2014-15 2015-16
NSW 381 394 431 483 523
VIC 230 225 271 290 310
QLD 283 297 292 318 347
WA 48 41 45 64 68
SA 79 79 86 77 88
TAS 31 31 34 34 32
ACT 25 29 30 31 27
NT 5 5 6 9 6
Australia 1,060 1,078 1,179 1,283 1,380
Note: The national patient count only includes one count for each patient. This may result in the sum of the state and territory totals being greater than the national total.
Table 17 Patient numbers by state and territory: multiple myelomaMultiple myeloma 2011-12 2012-13 2013-14 2014-15 2015-16
NSW 324 378 389 425 466
VIC 153 157 176 215 214
QLD 330 346 360 365 382
WA 15 16 20 23 23
SA 17 22 24 25 40
TAS 51 47 42 39 40
ACT 14 10 10 14 17
NT <5 <5 <5 <5
Australia 901 969 1,012 1,100 1,177
Note: The national patient count only includes one count for each patient. This may result in the sum of the state and territory totals being greater than the national total.
National Blood Authority pg. 31
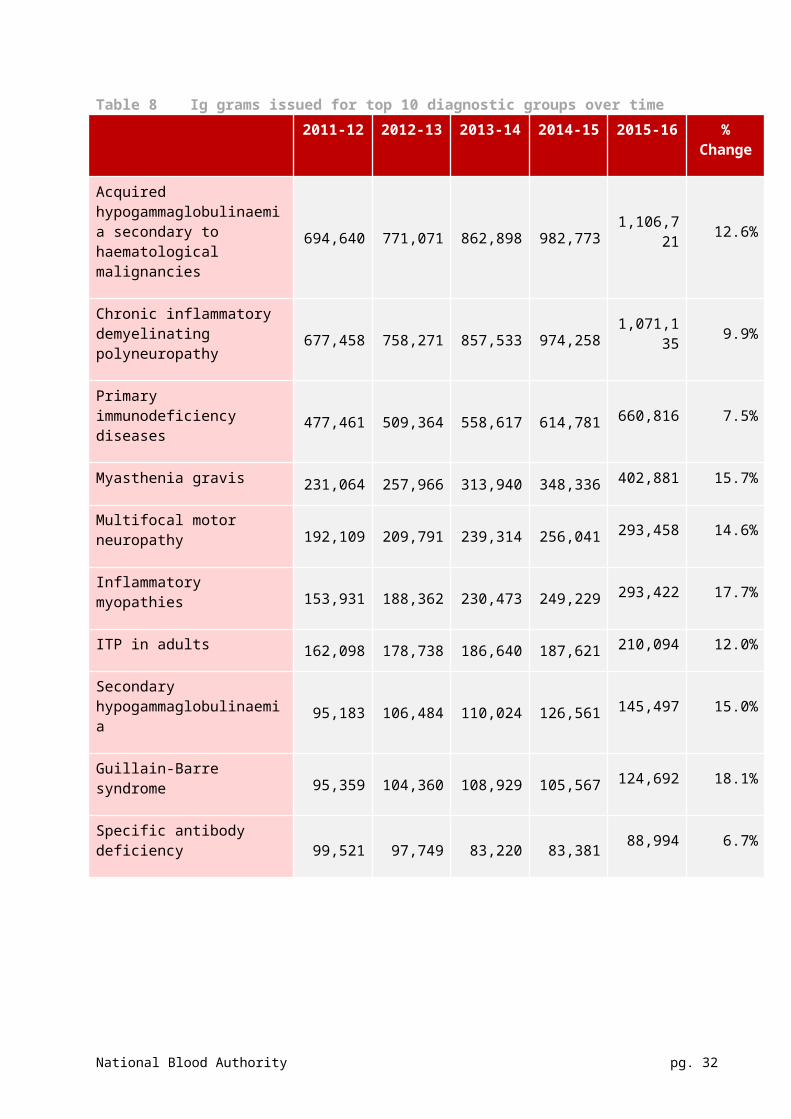
Table 18 shows the top 10 conditions by the Ig issued per 1,000 population by state and territory.
Table 18 Ig issued per 1,000 population by state and territory for top 10 conditions
Condition NSW VIC QLD WA SA TAS ACT NT National Fold Variation*
Chronic inflammatory demyelinating polyneuropathy
47 41 58 40 23 38 25 27 45 2.5
Common variable immunodeficiency disease 35 16 25 12 21 15 56 6 24 2.9
Myasthenia gravis 18 12 19 5 12 17 18 8 15 3.8
Chronic lymphocytic leukaemia 17 17 27 8 5 10 21 1 17 5.5
Non-Hodgkin lymphoma 12 11 28 3 9 16 11 1 14 9.4
Multifocal motor neuropathy 13 10 11 12 17 9 17 21 12 1.7
Multiple myeloma 13 8 20 2 4 23 7 0 12 11.9
Polymyositis 7 5 10 2 9 2 5 1 7 5.8
Secondary hypogammaglobulinaemia (excludes haem malignancies)
8 4 11 2 1 10 2 0 6 7.4
Guillain-Barré syndrome 5 6 5 5 4 5 5 2 5 1.5
*The Fold Variation in Table 18 shows the top 10 conditions by the Ig issued per 1,000 population by state and territory. is a measure describing difference in the Ig grams per 1,000 population between the state being issued the least to the state being issued the most, using only data from the five largest states. For example, a low value of 30 and a high value of 60 correspond to a fold variation of 2, or in common terms, a two-fold increase.
National Blood Authority pg. 32

DosingCh
roni
c infl
amm
ator
y de
mye
linati
ng
poly
neur
opat
hy
Com
mon
var
iabl
e im
mun
odefi
cienc
y di
seas
e
Mya
sthe
nia
grav
is
Chro
nic l
ymph
ocyti
c leu
kaem
ia
Non-
Hodg
kins
lym
phom
a
Mul
tifoc
al m
otor
neu
ropa
thy
Mul
tiple
mye
lom
a
Poly
myo
sitis
Seco
ndar
y hy
poga
mm
aglo
bulin
aem
ia
(exc
lude
s hae
m m
alig
nanc
ies)
Guill
ain-
Barr
é sy
ndro
me
01020304050
Primary Diagnosis
Gram
s/Ep
isode
Figure 12 Grams per episode by condition
The data shows that there is significant variance in the dosing of the top 10 conditions by grams per episode; where dosing is calculated as number of grams administered in each episode (Figure 12). The definition of episode in the data is not uniform and therefore this data should be interpreted with caution. Variations are expected as the doses and frequency of dose varies as the underlying method for calculating the dose also varies. Also note that the Criteria requires the lowest possible dose to achieve the desired clinical outcome, so the ‘dose’ is not ‘mandated’ but rather suggested and guided to the lower end to achieve efficacy which may contribute to the differences in dosing between conditions. The dosing is stable compared to the 2014-15 year.
Dosing in the neurological conditions is higher than for other conditions, as provided for in the Criteria. For dosing information for other conditions refer to Appendix D – Dataset of Ig supply by state/territory 2015-1.
The grams per kilogram were calculated for each infusion episode (Table 19). From this data it is difficult to assess whether the dosing strategy utilised was in accordance with that provided for under the Criteria. This is particularly difficult as the patient weight data is not updated for every episode and may change over time.
National Blood Authority pg. 33

Condition
<=0.4 g/kg/episode
n (%)
0.4 – 0.99 g/kg/episode
n (%)
1 – 2 g/kg/episode
n (%)
>2 g/kg/episode
n (%)
No weight Data
n(%)
Chronic inflammatory demyelinating polyneuropathy
9,151 (39%) 12,766 (55%) 1,101 (5%) 27 (0%) 372 (2%)
Common variable immunodeficiency disease 9,082 (47%) 8,873 (46%) 77 (0%) 3 (0%) 1,389 (7%)
Myasthenia gravis 3,891 (42%) 4,926 (54%) 271 (3%) 5 (0%) 86 (1%)
Chronic lymphocytic leukaemia 6,910 (58%) 4,916 (41%) 4 (0%) 1 (0%) 136 (1%)
Non-Hodgkin lymphoma 1,401 (26%) 3,365 (62%) 558 (10%) 12 (0%) 101 (2%)
Multiple myeloma 7,144 (62%) 4,251 (37%) 13 (0%) 0 (0%) 148 (1%)
Multifocal motor neuropathy 5,744 (61%) 3,533 (38%) 1 (0%) 0 (0%) 137 (1%)
Polymyositis 1,211 (35%) 2,013 (58%) 211 (6%) 4 (0%) 33 (1%)
Secondary hypogammaglobulinaemia (excludes haem malignancies)
419 (46%) 432 (47%) 45 (5%) 21 (2%) 3 (0%)
Guillain-Barré syndrome 2,931 (55%) 2,256 (42%) 72 (1%) 0 (0%) 51 (1%)
Table 19 Ig grams per kg weight per episode
National Blood Authority pg. 34
IVIg and SCIgIn March 2013, the JBC approved the introduction of SCIg under the national blood arrangements. The first phase of implementation was through hospital-based management arrangements, with no additional cost to patients, and further work will be undertaken to support supply of SCIg for other pathways of care. In 2015-16 the NBA established arrangements for supply of the following SCIg products:
Evogam 16% 0.8g/5ml and 3.2g/20ml supplied by CSL Behring (Australia) Pty Ltd (domestic) Gammanorm 16% 1650mg/10ml and 3300mg/20ml supplied by Octapharma Australia Pty Ltd
(imported) Kiovig 10% 1g/10ml, 2.5g/25ml, 5g/50ml, 10g/100ml and 20g/200ml supplied by Baxter
Healthcare (imported) Hizentra 5% 1g/5ml, 2g/10ml, 4g/20ml and 10g/50ml supplied by CSL Behring (Australia) Pty Ltd
(imported)
In addition to the clinical and diagnostic criteria for access to immunoglobulin products, access to SCIg products is provided through an assurance framework for the appropriate use of the product. SCIg access rules are detailed on the NBA website at https://www.blood.gov.au/SCIg. Participation in the National SCIg program requires hospitals to establish their capability and capacity to manage a hospital-based SCIg program, where the hospital provides access to all resources and takes full accountability for the management and use of the product within defined governing requirements.
These products are authorised and distributed by the Blood Service in the same manner as IVIg.
Tables 20-22 show the patient numbers, grams issued andtreatment episodes, by state and territory for IVIg and SCIg products in 2015-16. Tables 23-25 show patient numbers, grams issued and treatment episodes by diagnostic group for IVIg and SCIg products in 2015-16.
National Blood Authority pg. 35

Table 20 Patient numbers for products issued by state and territory in 2015-16IVIg SCIg
State
Fleb
ogam
ma
5 pe
rcen
t
Fleb
ogam
ma
10 p
erce
nt
Intr
agam
P
Kiov
ig 1
0 pe
rcen
t
Oct
agam
5 p
erce
nt
Oct
agam
10
perc
ent
Priv
igen
10
perc
ent
SCIg
Evo
gam
SCIg
gam
man
orm
SCIg
Kio
vig
10 p
erce
nt
Hize
ntra
20
perc
ent
Tota
l
NSW 235
252 3,853 414 610 433 673 70 49 57 6,019
VIC 111
141 2,360 331 430 218 628 58 <5 3,723
QLD 131
129 2,505 437 430 483 904 62 14 <5 51 4,276
WA 48 45 534 108 96 61 151 29 <5 18 916SA 9 42 665 181 <5 84 33 8 10 942TAS 7 21 180 9 18 91 72 <5 <5 8 340ACT <5 196 48 8 7 68 <5 12 11 296NT 43 35 <5 31 93
AUS 538
629 10,166 1,532 1,578 1,280 2,594 251 90 <5 156 16,33
1Note: The national patient count only includes one count for each patient. This may result in the sum of the state and territory totals being greater than the national total. In addition, each patient may have received multiple products, meaning the total number of patients for each state/territory may not match the total of the patient counts for each product.
National Blood Authority pg. 36

Table 21 Grams of product issued by state and territory in 2015-16IVIg SCIg
StateFl
ebog
amm
a 5
perc
ent
Fleb
ogam
ma
10 p
erce
nt
Intr
agam
P
Kiov
ig 1
0 pe
rcen
t
Oct
agam
5 p
erce
nt
Oct
agam
10
perc
ent
Priv
igen
10
perc
ent
SCIg
Evo
gam
SCIg
gam
man
orm
SCIg
Kio
vig
10 p
erce
nt
Hize
ntra
20
perc
ent
Tota
l
NSW 36,131 40,235 991,716 150,866 221,856 158,411 113,150 18,156 9,230 8,357 1,748,108VIC 17,562 21,525 633,105 114,407 128,622 58,169 111,990 9,435 231 1,095,046QLD 17,209 19,125 743,694 134,087 121,763 124,627 149,975 17,436 1,393 120 9,238 1,338,667WA 9,666 10,800 147,186 39,824 42,030 16,235 37,895 6,045 554 2,121 312,355SA 1,378 7,050 159,747 67,499 150 16,920 6,286 1,952 1,398 262,379TAS 1,217 3,975 53,337 2,628 5,659 20,780 12,480 112 1,096 623 101,905ACT 930 52,803 16,942 2,015 3,489 12,720 77 3,706 1,544 94,226NT 6,087 9,192 135 8,295 23,709AUS 83,162 103,640 2,787,675 535,444 522,229 381,711 463,425 57,546 17,931 120 23,512 4,976,394
National Blood Authority pg. 37

Table 22 Treatment episode numbers for products issued by state and territory in 2015-16
IVIg SCIg
State
Fleb
ogam
ma
5 pe
rcen
t
Fleb
ogam
ma
10 p
erce
nt
Intr
agam
P
Kiov
ig 1
0 pe
rcen
t
Oct
agam
5 p
erce
nt
Oct
agam
10
perc
ent
Priv
igen
10
perc
ent
SCIg
Evo
gam
SCIg
gam
man
orm
SCIg
Kio
vig
10 p
erce
nt
Hize
ntra
20
perc
ent
Tota
l
NSW 1,058 969 31,400 3,991 6,052 3,798 3,104 3,798 1,668 1,206 57,044VIC 497 654 19,227 2,811 3,617 1,500 2,866 2,110 39 33,321QLD 650 523 24,926 3,921 3,796 3,726 4,394 2,255 213 24 1,121 45,549WA 192 179 4,175 765 748 346 631 944 48 428 8,456SA 33 158 4,679 1,464 6 358 896 186 105 7,885TAS 31 75 1,645 66 168 570 359 12 65 80 3,071ACT 16 1,705 315 59 66 292 16 519 156 3,144NT 177 218 2 174 571AUS 2,461 2,574 87,934 13,551 14,448 10,006 12,178 10,031 2,699 24 3,135 159,041
National Blood Authority pg. 38

Table 23 Patient numbers for products issued by diagnostic group in 2015-16
IVIg SCIg
Diagnostic Group
Fleb
ogam
ma
5 pe
rcen
t
Fleb
ogam
ma
10 p
erce
nt
Intr
agam
P
Kiov
ig 1
0 pe
rcen
t
Oct
agam
5 p
erce
nt
Oct
agam
10
perc
ent
Priv
igen
10
perc
ent
SCIg
Evo
gam
SCIg
gam
man
orm
SCIg
Kio
vig
10 p
erce
nt
Hize
ntra
20
perc
ent
Tota
l
Acquired hypogammaglobulinaemia secondary to haematological malignancies 33 46 4,123 209 167 175 300 28 10 27 4,711Chronic inflammatory demyelinating polyneuropathy 129 129 881 401 450 267 608 2,250Primary immunodeficiency diseases 10 10 1,713 45 28 29 44 186 67 <5 103 1,990Myasthenia gravis 85 71 272 169 225 150 320 945Multifocal motor neuropathy 23 27 157 119 102 52 186 496Inflammatory myopathies 36 57 294 138 129 84 163 726ITP in adults 62 73 466 127 115 123 296 1,168Secondary hypogammaglobulinaemia 13 13 519 30 33 31 45 14 <5 10 652Guillain-Barré syndrome 48 48 219 77 106 85 172 727Kidney transplantation 31 60 59 42 71 90 116 410Specific antibody deficiency <5 <5 272 5 12 <5 9 23 11 16 314Note: Each patient may have received multiple products per diagnosis, so the total number of patients for each diagnostic group may not match the total of the patient counts for each product.
National Blood Authority pg. 39
Table 24 Grams of product issued by diagnostic group in 2015-16
IVIg SCIg
Diagnostic Group
Fleb
ogam
ma
5 pe
rcen
t
Fleb
ogam
ma
10 p
erce
nt
Intr
agam
P
Kiov
ig 1
0 pe
rcen
t
Oct
agam
5 p
erce
nt
Oct
agam
10
perc
ent
Priv
igen
10
perc
ent
SCIg
Evo
gam
SCIg
gam
man
orm
SCIg
Kio
vig
10 p
erce
nt
Hize
ntra
20
perc
ent
Tota
l
Acquired hypogammaglobulinaemia secondary to haematological malignancies 3,322 3,970 940,026 45,217 35,212 39,143 29,355 4,890 1,927 3,659 1,106,721
Chronic inflammatory demyelinating polyneuropathy 25,040 24,225 438,204 161,461 188,645 109,705 123,855 1,071,135
Primary immunodeficiency diseases 675 1,420 547,440 12,708 7,493 8,697 6,310 45,252 14,235 120 16,467 660,816Myasthenia gravis 12,183 11,445 119,208 67,993 84,457 52,435 55,160 402,881Multifocal motor neuropathy 4,135 7,620 96,000 60,154 52,378 24,282 48,890 293,458Inflammatory myopathies 4,954 9,045 116,037 54,631 46,836 29,105 32,815 293,422ITP in adults 7,925 11,285 80,886 25,722 19,136 21,840 43,300 210,094Secondary hypogammaglobulinaemia 893 780 114,966 7,332 7,067 5,364 4,095 3,104 482 1,415 145,497Guillain-Barré syndrome 7,098 8,795 33,273 13,699 19,184 13,808 28,835 124,692Kidney transplantation 5,600 7,665 9,174 8,426 17,792 22,566 17,035 88,258Specific antibody deficiency 228 285 75,777 870 2,729 675 880 4,301 1,287 1,963 88,994
National Blood Authority pg. 40

Table 25 Treatment episodes for product issued by diagnostic group in 2015-16
IVIg SCIg
Diagnostic Group
Fleb
ogam
ma
5 pe
rcen
t
Fleb
ogam
ma
10 p
erce
nt
Intr
agam
P
Kiov
ig 1
0 pe
rcen
t
Oct
agam
5 p
erce
nt
Oct
agam
10
perc
ent
Priv
igen
10
perc
ent
SCIg
Evo
gam
SCIg
gam
man
orm
SCIg
Kio
vig
10 p
erce
nt
Hize
ntra
20
perc
ent
Tota
l
Acquired hypogammaglobulinaemia secondary to haematological malignancies 98 131 32,996 1,656 1,237 1,341 982 837 180 463 39,921
Chronic inflammatory demyelinating polyneuropathy 680 569 11,663 3,988 4,897 2,557 3,164 27,518Primary immunodeficiency diseases 26 42 18,932 360 250 279 174 7,875 2,193 24 2,076 32,231Myasthenia gravis 338 279 3,305 1,828 2,466 1,442 1,581 11,239Multifocal motor neuropathy 110 136 2,192 1,278 1,183 537 1,054 6,490Inflammatory myopathies 144 225 3,011 1,382 1,312 706 846 7,626ITP in adults 187 195 1,662 555 419 448 888 4,354Secondary hypogammaglobulinaemia 33 33 4,275 276 247 208 139 510 58 276 6,055Guillain-Barré syndrome 238 257 1,017 409 570 430 857 3,778Kidney transplantation 289 294 396 247 663 665 764 3,318Specific antibody deficiency 9 10 2,915 36 104 22 37 809 268 316 4,526
National Blood Authority pg. 41

NHIgIn 2013–14, as a result of the introduction of SCIg as discussed above, demand for Normal Human Immunoglobulin (NHIg) reduced significantly by 18.8 per cent. CSL Behring (Australia) Pty Ltd produces NHIg from hyperimmune plasma specially collected by the Blood Service. The volume of product is limited by the availability of this specialised plasma, and by production scheduling arrangements in CSL Behring (Australia) Pty Ltd’s manufacturing facility.
Demand for normal Ig NHIg further declined in 2014-15 as a result of implementation of the NHIg policy outlining the national position on access and use under the national blood arrangements.
Normal human immunoglobulin (NHIg) may only be supplied for two purposes; for the treatment of susceptible contacts of measles, hepatitis A, poliomyelitis and rubella, as directed by public health officials; and for the treatment of immunodeficiency conditions for which the product is indicated for patients for whom IVIg and SCIg are both contraindicated. NHIg access rules are detailed on the NBA website at https://www.blood.gov.au/NHIg.
Tables 26-28 and Figure 13 show the grams issued and the issues per 1,000 population by states and territories for either purpose listed above.
2011-12 2012-13 2013-14 2014-15 2015-16 -
5,000
10,000
15,000
20,000
25,000
30,000
35,000
-
0.20
0.40
0.60
0.80
1.00
1.20
1.40
1.60
Gra
ms I
ssue
d
Per 1
,000
Pop
ulati
on
Introduction of SCIg
Introduction of NHIg Policy
Figure 13 NHIg Grams issued and grams issued per 1,000 population
Table 26 NHIg issued from 2011-12 to 2015-16Product 2011-12 2012-13 2013-14 2014-15 2015-16
Normal Immunoglobulin 2VI - 2ml (grams) 879 699 654 167 112Normal Immunoglobulin 2VI - 5ml (grams) 30,836 30,466 24,649 5,409 3,254Total (grams) 31,715 31,165 25,303 5,576 3,366Grams Per 1,000 Population 1.41 1.36 1.09 0.24 0.14
National Blood Authority pg. 42

Table 27 Grams of NHIg issued by state and territory2011-12 2012-13 2013-14 2014-15 2015-16
NSW 9,136 9,634 6,915 82 238VIC 6,323 6,903 6,747 2,278 489QLD 1,844 1,640 2,774 1,472 1,134WA 5,258 5,261 3,458 59 38SA 8,124 6,543 4,431 936 980TAS 182 344 272 154 43ACT 797 816 514 480 432NT 50 24 191 35 12OTHER9 0 0 0 80 0Australia 30,867 30,325 24,597 4,981 2,922
Table 28 Grams per 1,000 population of NHIg issued by state and territory
Per 1,000 Population 2011-12 2012-13 2013-14 2014-15 2015-16
NSW 1.26 1.31 0.93 0.01 0.03VIC 1.13 1.22 1.17 0.39 0.08QLD 0.41 0.36 0.59 0.31 0.24WA 2.20 2.12 1.36 0.02 0.01SA 4.93 3.94 2.64 0.55 0.58TAS 0.36 0.67 0.53 0.30 0.08ACT 2.15 2.16 1.34 1.24 1.10NT 0.22 0.10 0.79 0.14 0.05
9 Other here covers NHIg sent to the New Zealand Blood Service.
National Blood Authority pg. 43

Appendix A – BackgroundFunding for IgIg supplied under national blood arrangements is funded 63% by the Commonwealth government, with the remaining 37% being funded by the state and territory to which the product is supplied.
The CriteriaA process to review the Australian Health Ministers’ Advisory Council (AHMAC) (2000) guidelines commenced in 2004. A result was the approval of the first edition of the Criteria by Health Ministers in December 2007. The first edition of the Criteria was made available to clinicians on 3 March 2008 and applied to all new patients from that date. For patients already receiving Ig for an indication not listed as being funded under national blood arrangements, a six month transition period was allowed to enable treatment strategies to be reviewed, with the exception of IgG subclass deficiency, where grandfathering of the use of Ig was permitted under defined circumstances.
The Criteria is a publication that describes the eligibility criteria that patients must meet to receive Ig that is funded by all Australian governments. Product is provided free of charge to all patients who have a condition meeting qualifying criteria for supply as outlined in the Criteria. The Criteria helps to ensure that Ig is accessed consistently across Australia for the treatment of patients whose health is likely to be improved with Ig therapy. The Criteria was developed using the best available medical evidence and expertise.
As part of the process to implement the new Criteria, the NBA established a clarification process in November 2008. A consultation group was consulted on specific queries that arose in relation to interpretation of the Criteria. Consideration of the queries and comments resulted in some amendments to specific indications in the Criteria. The revisions were published on the NBA’s website in February 2009.
A review of the Criteria commenced in 2010. A National Ig Criteria Review Working Group was established to oversee the 2010–11 Criteria review process. The Criteria second edition was made available to clinicians on 10 August 2012 and applied to all new patients from that date. For patients already receiving Ig for an indication where the specific eligibility criteria had changed, a six month transition period was allowed to enable treatment strategies to be reviewed, with the exception of IgG subclass deficiency patients, as described above.
Supply of ProductImmunoglobulin is made from donated human plasma. The supply of Australian plasma is contracted by the NBA and importation of IVIg is a government policy position to ensure risk mitigation and continuity of supply. While the NBA makes sure there is enough Ig by importing this product, there is a finite international supply.
There are two main ways Ig is available in Australia:
1. Supply under national blood arrangements
If the Ig is ordered to treat a medical condition which is funded under the Criteria then the product is supplied and funded under national blood arrangements. In this case the cost of the product is shared between the Commonwealth and the relevant state or territory.
Orders for Ig under national blood arrangements are made to the Blood Service, which is contracted by the NBA as the authoriser and distributor of all Ig funded under these arrangements. In seeking
National Blood Authority pg. 44

authorisation, the requesting clinician will be asked to provide information to the Blood Service to establish that the request meets the Criteria. For ongoing conditions, the Criteria may specify review criteria to be applied in reviewing the patient to determine whether access to funded Ig will continue.
In the role as authoriser of requests for Ig, the Blood Service maintains a database of requests, and provides data to the NBA which is used as a basis for reporting on the annual use of Ig in Australia.
2. Direct order and other supply arrangements
If the Ig is to treat a medical condition that is not funded under the Criteria, then the individual state or territory may approve the accessing of product under the Direct Order arrangements established by the NBA, or the product may be ordered directly from a commercial supplier of Ig. In this case the supply of the product is not funded under national blood arrangements, and the cost must be met in some other way.
HistoryIn 2003-04 the NBA coordinated demand management activities for two products in short supply; Biostate (plasma-derived Factor VIII) and Intragam P (plasma-derived Ig). At all times, the NBA successfully met the blood and blood product needs of all Australian states and territories through intensive management of the product, via its contracts with the Blood Service and CSL Limited and the importation of substitutable products from overseas. The NBA arranged for an imported product to be purchased to make up for the shortfall, and this product was made available to patients in March 2004.
In 2004-05 the NBA successfully negotiated a new Plasma Products Agreement with CSL Limited, which came into effect from 1 January 2005.
In December 2004 the NBA also signed a Standing Offer contract with CSL Limited (for the supply of Sandoglobulin ®), as well as with Octapharma Australia Pty Ltd (for the supply of Octagam) for a two-year period in order to allow access to imported Ig as a contingency supply if and when needed to supplement shortfalls in the domestic Ig supply. The Ig Standing Offer comprised two components, a National Blood Supply component whereby imported Ig was procured by the NBA for use under the National Blood Agreement (i.e. for those conditions covered under the nationally agreed cost sharing arrangements) and a Jurisdictional Direct Order component which allowed approved recipients to access imported Ig for all other conditions.
Ig had to be intensively managed again in 2004–05 due to ongoing increases in demand and indications for its clinical use for over 60 clinical syndromes and conditions.
As part of a strategic solution to the shortage of Ig, governments purchased imported Ig (Sandoglobulin®) in 2003 and placed it in the National Reserve of Plasma Products. In order to optimise the use of the stocks in the National Reserve, the NBA in conjunction with states and territories, the Blood Service and CSL Limited, developed and implemented a plan to rotate the Sandoglobulin® stocks out of the National Reserve. This rotation commenced in October 2004.
In 2005–06, the challenges in supply of domestic Ig required the NBA to adopt the same intensive product management arrangements as it had in 2004-05 with the continued rotation of Sandoglobulin®.
In 2006-07 in order to ensure Ig remained available to all Australians, the NBA negotiated a further 12-month extension to the Ig Standing Offer in December 2006. A procurement process for the renewal of the standing offer arrangements commenced in early 2007.
Intensive product management was successfully undertaken in 2006–07 to avert a number of temporary and longer-term potential shortages, including shortages of Ig and plasma-derived Factor VIII.
National Blood Authority pg. 45

In 2007-08 the NBA commenced a procurement process for new contracts. The outcome of the procurement was the finalisation of a new fixed price contract with Octapharma Australia Pty Ltd for the supply of Octagam for three years under the National Blood Supply arrangement. Octagam and a CSL Ltd imported product, Sandoglobulin Liquid, were also supplied under Direct Order arrangements negotiated by the NBA.
In 2008-09 the NBA continued imports of intravenous immunoglobulin to be able to meet domestic clinical demand.
During 2009–10 the plasma fractionation arrangements were governed by the five-year Plasma Products Agreement between the NBA and CSL Limited, which expired on 31 December 2009, and a new CSL Australian Fractionation Agreement which took effect on 1 January 2010.
The contract with Octapharma Australia Pty Ltd for the supply of Octagam was due to expire on 31 December 2010, with the NBA having an option to extend the contract by one year. In May 2010 the NBA moved to exercise the option to extend the contract with Octapharma Australia Pty Ltd, with improved value for money, for a further 12 months.
A contract with CSL Limited for the supply of Sandoglobulin NF (nanofiltration) Liquid under the Direct Order arrangement expired at the end of December 2009.
The NBA entered into a three-year contract with Lateral Grifols Pty Ltd for the supply of Flebogamma 5% DIF (dual inactivation plus nanofiltration) under Direct Orders, which commenced on 1 January 2010.
During 2010-11 imported intravenous immunoglobulin continued to supplement domestic Ig production to meet clinical demand in Australia. In September 2010, Octapharma issued a nationwide voluntary recall of Octagam due to production concerns. To enable domestic demand to be met, the NBA invoked relevant clauses that had been included in the contract with Lateral Diagnostics to allow supply of Flebogamma through national blood arrangements (in addition to the Direct Orders supply). Lateral Diagnostics, working with the Spanish-based manufacturer of Flebogamma, Grifols S.A., responded rapidly and fully to the NBA’s additional requirements and this arrangement continued for the remainder of the year. The voluntary recall of Octagam was still in place in Australia at 30 June 2011.
In 2011-12 CSL Limited experienced a decline in its immunoglobulin (IgG) yield. As a result of the reduction in yield, and other logistical factors, CSL Limited was unable to supply Intragam P 200ml from its working inventory against the full annual supply estimate amounts. The NBA also gave approval for CSL Limited to access the Minimum Product Inventory and the National CSL Reserve to augment supply. By the end of June 2012 CSL Limited had fully restocked the Minimum Product Inventory and the National CSL Reserve, although the NBA continued to carefully manage the planned supply of Intragam P in 2012-13.
The Therapeutic Goods Administration (TGA), Australia’s national regulator for drugs and regulatory devices, approved the re-introduction of Octagam 5% in October 2011 following the voluntary recall of product in September 2010. The NBA worked with the Blood Service, Octapharma Australia Pty Ltd and Grifols Australia Pty Ltd to manage the transition of patients from Flebogamma 5% DIF under the national supply arrangements; this was achieved by March 2012.
In October 2011 the NBA signed contracts for the supply of imported Ig with Octapharma Australia Pty Ltd for the supply of Octagam 5%. The new contract took effect on 1 January 2012. A 10% formulation of this product became available in July 2012; Baxter Healthcare Pty Ltd for the supply of Kiovig 10% from 1 January 2012 and with Grifols Australia Pty Ltd for a direct order contract operating until 31 December 2012 for the supply of Flebogamma 5% DIF. A new direct order contract for continued supply of Flebogamma 5% commenced on 1 January 2012.
National Blood Authority pg. 46

In 2012-13 two contracts were placed for supply of imported Ig under the national blood arrangements. The contracts commenced on 1 January 2012 for a period of three years with provision for a one year extension. The suppliers were Baxter Healthcare Pty Ltd and Octapharma Australia Pty Ltd.
The NBA, on behalf of all Australian governments, completed a review of the adequacy of the current Ig authorisation and clinical governance arrangements. The aim of the review was to identify options for improvements in the management of Ig. The review also analysed the issues, benefits and risks of potentially including NHIg and subcutaneous immunoglobulin (SCIg) in the Ig management framework.
The review identified significant variations in Ig management processes nationally, with process inefficiencies, under investment in integrated data systems and limited evidence of alternative therapies being considered before prescription. It also found variation in dosing, high prescription rates in some conditions compared to international rates of use, limited transparency of price implications and no accountability for cost with the prescriber.
In March 2013, the Jurisdictional Blood Committee (JBC) considered the final report of the review and endorsed the NBA commencing work to implement five short term improvement projects recommended by the review. The five projects were to:
describe the functional model for the authorisation and clinical governance arrangements, and formally allocate responsibility in each jurisdiction
introduce new management processes to include NHIg and SCIg in the Ig authorisation process improve patient information to ensure patients are aware of the Criteria requirements for
eligibility and ongoing therapy centralise hospital ordering and product management at the blood bank or pharmacy for
improved management, and define when and how emergency stock should be managed define and deliver a package of information concerning Ig products and arrangements,
particularly for junior medical and nursing staff.
In March 2013, the JBC approved the introduction of SCIg under the national blood arrangements. The first phase of implementation was through hospital-based management arrangements, with no additional cost to patients, and further work was undertaken to support supply of SCIg for other pathways of care. Supply of SCIg commenced in September 2013, including both domestically manufactured and imported SCIg products.
In 2013-14 the NBA established arrangements for supply of the following SCIg products:
Evogam 16% 0.8g/5ml and 3.2g/20ml supplied by CSL Behring (Australia) Pty Ltd (domestic) Gammanorm 16% 1650mg/10ml and 3300mg/20ml supplied by Octapharma Australia Pty Ltd
(imported) Kiovig 10% 1g/10ml, 2.5g/25ml, 5g/50ml, 10g/100ml and 20g/200ml supplied by Baxter
Healthcare (imported)
In 2015-16 the NBA established arrangements for supply of the following SCIg product:
Hizentra 5% 1g/5ml, 2g/10ml, 4g/20ml and 10g/50ml supplied by CSL Behring (Australia) Pty Ltd (imported)
During 2013-14 to 2015-16 the NBA made significant progress to implement new Ig authorisation and clinical governance arrangements. These arrangements aim to address a range of deficiencies identified in the 2012-13 review of the management of Ig, including:
significant variations and inefficiencies in Ig management processes nationally variation in dosing
National Blood Authority pg. 47

high prescription rates in some conditions compared to international rates of use limited transparency of price implications no accountability for cost with the prescriber.
Key 2013-14 achievements included:
development and approval by governments of the business cases describing the high level functional model for new authorisation and clinical governance arrangements and the associated supporting national database
development and implementation of new management processes for NHIg and SCIg establishment of the National Ig Governance Advisory Committee.
Key 2014-15 achievements included:
establishment of a network of new national specialist advisory committees to assess and recommend changes to the arrangements for the supply of Ig in Australia
publication and implementation of new Ig Governance policies, a standardised patient treatment review process and revised forms
review of the Criteria for the clinical use of intravenous immunoglobulin in Australia (Criteria) for adaptation to the new information management system under development, BloodSTAR.
Key 2015-16 achievements included:
holding five meetings of the National Immunoglobulin Governance Advisory Committee (NIGAC), and approval by NIGAC of Specialist Working Group three year work plans for achieving key governance outcomes
implementation of the National Ig Governance framework processes in Western Australia publication and implementation of the second edition of the Ig Governance policy to support
the implementation of BloodSTAR finalisation of the online adaptation of Criteria for BloodSTAR commencement of a further review of the Criteria for the clinical use of intravenous
immunoglobulin in Australia (the Criteria) with a view to implementing Version Three in 2017 Specialist Working Groups for Neurology, Immunology, Haematology and Transplantation
Medicine finalised the review of the medical conditions in Chapters 5 & 6 of the Criteria through regular teleconference meetings
Approval of revised Chapter 5 and 6 conditions by the JBC.
For further information on the Ig Governance Program go to the NBA website at https://www.blood.gov.au/Ig-program.
On 31 December 2015 two contracts for the supply of imported Ig expired. The suppliers were Baxalta Australia Pty Ltd and Octapharma Australia Pty Ltd.
In June 2015, the NBA successfully concluded a tender process for new contracts for the national supply of imported Ig to replace the current contracts which expired on 31 December 2015. The new contracts were awarded to CSL Behring Pty Ltd and Grifols Australia Pty Ltd.
National Blood Authority pg. 48

Appendix B – Acronyms and GlossaryACRONYMSACT Australian Capital TerritoryAHMAC Australian Health Ministers’ Advisory CouncilAHMC See SCoHAHP Australian Health ProvidersANCA Anti-neutrophil cytoplasmic antibodyAUS AustraliaDO Direct OrderHIV Human immunodeficiency virusHSCT Hematopoietic stem cell transplantationIDMS Integrated Data Management SystemIg Immunoglobulin products including IVIg and SCIgITP Idiopathic thrombocytopenic purpuraIVIg Intravenous immunoglobulinJBC Jurisdictional Blood CommitteeJDO Jurisdictional Direct OrderNBA National Blood AuthorityNHIg Normal human immunoglobulinNIGAC National Immunoglobulin Governance Advisory CommitteeNSW New South WalesNT Northern Territory
PANDAS Paediatric autoimmune neuropsychiatric disorder associated with streptococcal infections
QLD QueenslandSA South AustraliaSCIg Subcutaneous ImmunoglobulinSCoH Standing Council of HealthSTARS Supply Tracking Analysis Recording SystemTAS TasmaniaTGA Therapeutic Goods AdministrationTSS Toxic shock syndromeVIC VictoriaWA Western Australia
National Blood Authority pg. 49

GLOSSARY OF TERMS
Term Description
Blood products Products manufactured from human blood
Blood Service The Australian Red Cross Blood Service
Clinical Discipline Classification of the conditions according to the clinical speciality
Condition Specific diagnoses within a diagnostic group. Also known as the primary diagnosis. In some instances the diagnostic group may be the same as the condition, for example – Myasthenia gravis is the condition and Diagnostic Group
Criteria for the clinical use of intravenous immunoglobulin in Australia (the Criteria)
A document describing the conditions, indications and patient qualifying and review criteria for which Ig is funded under national blood arrangements by all Australian governments
Criteria Met An assessment that the patient eligibility requirements as defined in the Criteria for a particular condition have been achieved
Criteria Not Met or Qualifying (Q) Criteria Not Met
An assessment that the patient eligibility requirements as defined in the Criteria for a particular condition have not been achieved
Direct Orders (DO) Previously known as Jurisdictional Direct Orders (JDO). Arrangements implemented by the NBA with suppliers to facilitate the purchase of Ig for the treatment of conditions not satisfying the Criteria for the clinical use of IVIg in Australia
Diagnostic Group A grouping of clinical/medical conditions, as outlined in the Criteria. Also known as disease group
Disease Group See diagnostic group
Fractionation A manufacturing process that separates blood plasma into specific protein fractions
Imprest stock Health provider orders of product for stock that is maintained at a certain level
Intravenous immunoglobulin
An immunoglobulin product derived from donated human plasma that is administered intravenously
National Blood Authority pg. 50

Term Description
Jurisdiction Any of the parties to the Australian National Blood Agreement, being the Australian Government and all state and territory governments
Minimum Product Inventory
The minimum inventory of Ig held by CSL to meet contract obligations
National Blood Agreement The Agreement signed by all governments in 2003 that sets out the objectives for governments for the management of the Australian blood sector
National blood arrangements
Arrangements, including funding arrangements, established under the National Blood Agreement
National CSL Reserve The reserve of inventory of Ig that CSL Behring manages on behalf of the NBA for contingency purposes
Normal immunoglobulin An immunoglobulin product derived from human plasma that is administered by intramuscular injection (as opposed to intravenous or sub-cutaneous injection)
Plasma The liquid part of the blood containing antibodies and other proteins
Primary diagnosis See ‘condition’
Subcutaneous immunoglobulin
An immunoglobulin product derived from donated human plasma that is administered subcutaneously
Treatment episode One instance or episode of a treatment plan, for example a treatment plan may be made up of 4 episodes over 4 months with an episode occurring every 4 weeks OR 1 dose of transfused product every two weeks for 6 months would be 13 treatment episodes
National Blood Authority pg. 51

Appendix C – Clinical Discipline mapping tableCondition Chapter Diagnostic Group Clinical
DisciplineChronic lymphocytic leukaemia Chapter 5 Acquired hypogammaglobulinaemia
secondary to haematological malignanciesHaematology
Multiple myeloma Chapter 5 Acquired hypogammaglobulinaemia secondary to haematological malignancies
Haematology
Non-Hodgkin lymphoma Chapter 5 Acquired hypogammaglobulinaemia secondary to haematological malignancies
Haematology
Other relevant haematological malignancies
Chapter 5 Acquired hypogammaglobulinaemia secondary to haematological malignancies
Haematology
Post-haemopoietic stem cell transplantation (HSCT)
Chapter 5 Acquired hypogammaglobulinaemia secondary to haematological malignancies
Haematology
Chronic inflammatory demyelinating polyneuropathy
Chapter 5 Chronic inflammatory demyelinating polyneuropathy
Neurology
Guillain-Barré syndrome Chapter 5 Guillain-Barré syndrome NeurologyDermatomyositis Chapter 5 Inflammatory myopathies NeurologyInclusion body myositis Chapter 5 Inflammatory myopathies NeurologyPolymyositis Chapter 5 Inflammatory myopathies NeurologyIdiopathic thrombocytopenic purpura - Adult
Chapter 5 ITP in adults Haematology
ITP associated with HIV Chapter 5 ITP in adults HaematologyITP in pregnancy Chapter 5 ITP in adults HaematologyITP in Specific circumstances (surgery, corticosteroids contraindicated, chronic ITP)
Chapter 5 ITP in adults Haematology
ITP Refractory Chapter 5 ITP in adults HaematologyITP with life-threatening haemorrhage
Chapter 5 ITP in adults Haematology
Kawasaki disease Chapter 5 Kawasaki disease ImmunologyLambert-Eaton myasthenic syndrome
Chapter 5 Lambert-Eaton myasthenic syndrome Neurology
Multifocal motor neuropathy Chapter 5 Multifocal motor neuropathy NeurologyMultifocal motor neuropathy with persistent conduction block
Chapter 5 Multifocal motor neuropathy Neurology
Myasthenia gravis Chapter 5 Myasthenia gravis NeurologyNeonatal haemochromatosis Chapter 5 Neonatal haemochromatosis Mixed -
Haem/ImmunCommon variable immunodeficiency disease
Chapter 5 Primary immunodeficiency diseases Immunology
Other Primary Immunodeficiency
Chapter 5 Primary immunodeficiency diseases Immunology
National Blood Authority pg. 52

Condition Chapter Diagnostic Group Clinical Discipline
Severe combined Immunodeficiency
Chapter 5 Primary immunodeficiency diseases Immunology
Transient hypogammaglobulinaemia of infancy
Chapter 5 Primary immunodeficiency diseases Immunology
Wiskott-Aldrich Syndrome Chapter 5 Primary immunodeficiency diseases ImmunologyX linked agammaglobulinaemia Chapter 5 Primary immunodeficiency diseases ImmunologyStiff person syndrome Chapter 5 Stiff person syndrome NeurologyAcute disseminated encephalomyelitis
Chapter 6 Acute disseminated encephalomyelitis Neurology
ANCA (PR3 or MPO)-positive idiopathic rapidly progressive glomerulonephritis
Chapter 6 ANCA-positive necrotising vasculitis Immunology
Churg-Strauss Syndrome Chapter 6 ANCA-positive necrotising vasculitis ImmunologyMicroscopic polyangiitis Chapter 6 ANCA-positive necrotising vasculitis ImmunologyWegener’s granulomatosis Chapter 6 ANCA-positive necrotising vasculitis ImmunologyAutoimmune haemolytic anaemia
Chapter 6 Autoimmune haemolytic anaemia Haematology
Evans syndrome Chapter 6 Evans syndrome HaematologyFoeto-maternal /neonatal alloimmune thrombocytopenia (Antenatal)
Chapter 6 Foeto-maternal /neonatal alloimmune thrombocytopenia
Haematology
Foeto-maternal /neonatal alloimmune thrombocytopenia (Neonatal)
Chapter 6 Foeto-maternal /neonatal alloimmune thrombocytopenia
Haematology
Haemophagocytic syndrome Chapter 6 Haemophagocytic syndrome HaematologyHSCT (for prevention of GvHD in high risk Allogeneic HSCT).
Chapter 6 HSCT (for prevention of GvHD in high risk Allogeneic HSCT).
Haematology
IgM para-proteinaemic neuropathy
Chapter 6 IgM para-proteinaemic neuropathy Neurology
ITP in children Chapter 6 ITP in children HaematologyKidney transplantation – post-transplant
Chapter 6 Kidney transplantation Renal specialist
Kidney transplantation – pre-transplant
Chapter 6 Kidney transplantation Renal specialist
Kidney transplantation post-transplant
Chapter 6 Kidney transplantation Renal specialist
Kidney transplantation pre-transplant
Chapter 6 Kidney transplantation Renal specialist
Multiple sclerosis - Severe relapse with no response to high dose methylprednisolone
Chapter 6 Multiple sclerosis Neurology
Multiple Sclerosis in Pregnancy Chapter 6 Multiple sclerosis NeurologyMultiple Sclerosis in young patients severe/relapsing/remitting in whom other therapies have
Chapter 6 Multiple sclerosis Neurology
National Blood Authority pg. 53

Condition Chapter Diagnostic Group Clinical Discipline
failedOpsoclonus myoclonus ataxia Chapter 6 Opsoclonus myoclonus ataxia NeurologyBullous pemphigoid Chapter 6 Pemphigoid ImmunologyCicatricial pemphigoid Chapter 6 Pemphigoid ImmunologyPemphigus foliaceus Chapter 6 Pemphigus ImmunologyPemphigus vulgaris Chapter 6 Pemphigus ImmunologyPost transfusion purpura Chapter 6 Post transfusion purpura HaematologySecondary hypogammaglobulinaemia (excludes haem malignancies)
Chapter 6 Secondary hypogammaglobulinaemia Mixed
IgG subclass deficiency EXISTING patients only
Chapter 6 Specific antibody deficiency Immunology
Specific antibody deficiency Chapter 6 Specific antibody deficiency ImmunologyIgG subclass deficiency. Existing patient with suppurative lung disease
Chapter 6 Specific antibody deficiency Immunology
Toxic epidermal necrolysis/Steven Johnson Syndrome
Chapter 6 Toxic epidermal necrolysis/Steven Johnson Syndrome
Immunology
Toxic Shock Syndrome (TSS) - Staphylococcal
Chapter 6 Toxic shock syndrome Immunology
Toxic Shock Syndrome (TSS) - Streptococcal
Chapter 6 Toxic shock syndrome Immunology
Acute leukaemia in children Chapter 7 Acute leukaemia in children HaematologyAutoimmune congenital heart block
Chapter 7 Autoimmune congenital heart block Immunology
Autoimmune diabetic neuropathy
Chapter 7 Autoimmune diabetic neuropathy Neurology
Autoimmune neutropenia Chapter 7 Autoimmune neutropenia HaematologyAutoimmune uveitis Chapter 7 Autoimmune uveitis ImmunologyCatastrophic antiphospholipid syndrome
Chapter 7 Catastrophic antiphospholipid syndrome Immunology
Coagulation factor inhibitors Chapter 7 Coagulation factor inhibitors HaematologyDevic disease (neuromyelitis optica)
Chapter 7 Devic disease (neuromyelitis optica) Neurology
Diabetic Amyotrophy Chapter 7 Diabetic Amytrophy NeurologyEpidermolysis bullosa acquisita Chapter 7 Epidermolysis bullosa acquisita DermatologyEpilepsy (rare childhood cases) Chapter 7 Epilepsy (rare childhood cases) NeurologyGraves ophthalmopathy Chapter 7 Graves ophthalmopathy ImmunologyHaemolytic disease of the newborn
Chapter 7 Haemolytic disease of the newborn Haematology
Haemolytic transfusion reaction Chapter 7 Haemolytic transfusion reaction HaematologyHashimoto encephalopathy Chapter 7 Hashimoto enecephalopathy NeurologyHIV in children Chapter 7 HIV in children ImmunologyLimbic encephalitis-nonparaneoplastic
Chapter 7 Limbic encephalitis-nonparaneoplastic Neurology
National Blood Authority pg. 54

Condition Chapter Diagnostic Group Clinical Discipline
Myocarditis in children Chapter 7 Myocarditis in children MixedPANDAS/tic disorders Chapter 7 PANDAS/tic disorders NeurologyLimbic encephalitis-paraneoplastic
Chapter 7 Paraneoplastic syndromes Neurology
Paraneoplastic cerebellar degeneration (Yo antibodies)
Chapter 7 Paraneoplastic syndromes Neurology
Paraneoplastic Subacute Sensory Neuropathy
Chapter 7 Paraneoplastic syndromes Neurology
Paraneoplastic syndromes Chapter 7 Paraneoplastic syndromes NeurologyPotassium channel antibody-associated encephalopathy
Chapter 7 Potassium channel antibody-associated encephalopathy
Neurology
Pure red cell aplasia Chapter 7 Pure red cell aplasia HaematologyPure white cell aplasia Chapter 7 Pure white cell aplasia HaematologyPyoderma gangrenosum Chapter 7 Pyoderma gangrenosum DermatologyRasmussen Syndrome Chapter 7 Rasmussen Syndrome NeurologyScleromyxedema Chapter 7 Scleromyxedema MixedSepsis - neonatal Chapter 7 Sepsis - neonatal PaediatricianSjogren’s syndrome Chapter 7 Sjogren’s syndrome ImmunologySjogren's Syndrome Chapter 7 Sjogren’s syndrome ImmunologySolid Organ - Heart Chapter 7 Solid organ transplantation (other than
kidney)- totalOrgan specialist
Solid Organ - Heart/Lung Chapter 7 Solid organ transplantation (other than kidney)- total
Organ specialist
Solid Organ - Liver Chapter 7 Solid organ transplantation (other than kidney)- total
Organ specialist
Solid Organ - Lung Chapter 7 Solid organ transplantation (other than kidney)- total
Organ specialist
Solid Organ - Other Chapter 7 Solid organ transplantation (other than kidney)- total
Organ specialist
Solid Organ - Pancreas Chapter 7 Solid organ transplantation (other than kidney)- total
Organ specialist
Transplant - Solid Organ Chapter 7 Solid organ transplantation (other than kidney)- total
Organ specialist
Transplants - Allogeneic stem cell or bone marrow
Chapter 7 Solid organ transplantation (other than kidney)- total
Organ specialist
Susac syndrome Chapter 7 Susac syndrome NeurologySystemic Capillary Leak Syndrome
Chapter 7 Systemic Capillary Leak Syndrome Immunology
Acute optic neuritis Chapter 8 Acute optic neuritis NeurologyAcute rheumatic fever Chapter 8 Acute rheumatic fever MixedAdrenoleukodystrophy Chapter 8 Adrenoleukodystrophy NeurologyAmegakaryocytic thrombocytopenia
Chapter 8 Amegakaryocytic thrombocytopenia Haematology
Antiphospholipid syndrome (non obstetric)
Chapter 8 Antiphospholipid syndrome (non obstetric) Mixed
Aplastic anaemia/pancytopenia Chapter 8 Aplastic anaemia/pancytopenia Haematology
National Blood Authority pg. 55

Condition Chapter Diagnostic Group Clinical Discipline
Asthma Chapter 8 Asthma MixedAtopic dermatitis/eczema Chapter 8 Atopic dermatitis/eczema DermatologyAutism – young adults Chapter 8 Autism – young adults MixedAutologous haemopoietic stem cell transplantation
Chapter 8 Autologous haemopoietic stem cell transplantation
Haematology
Behcet's disease Chapter 8 Behcet's disease ImmunologyCardiac surgery with bypass – prophylaxis
Chapter 8 Cardiac surgery with bypass – prophylaxis Mixed
Congestive cardiac failure Chapter 8 Congestive cardiac failure MixedCrohn’s disease Chapter 8 Crohn’s disease MixedDiamond Blackfan syndrome Chapter 8 Diamond Blackfan syndrome HaematologyFemale infertility Chapter 8 Female infertility MixedGlomerulonephritis – IgA nephritis
Chapter 8 Glomerulonephritis – IgA nephritis Mixed
Haemolytic uraemic syndrome Chapter 8 Haemolytic uraemic syndrome HaematologyHenoch-Schonlein purpura Chapter 8 Henoch-Schonlein purpura MixedHIV/AIDS – adult Chapter 8 HIV/AIDS – adult MixedIdiopathic dilated cardiomyopathy
Chapter 8 Idiopathic dilated cardiomyopathy Mixed
Linear IgA disease Chapter 8 Linear IgA disease DermatologyLupus cerebritis Chapter 8 Lupus cerebritis MixedLupus nephritis Chapter 8 Lupus nephritis MixedMotor neuron disease/amyotrophic lateral sclerosis
Chapter 8 Motor neuron disease/amyotrophic lateral sclerosis
Neurology
Myalgic encephalomyelitis Chapter 8 Myalgic encephalomyelitis NeurologyNarcolepsy/cataplexy Chapter 8 Narcolepsy/cataplexy NeurologyNephrotic syndrome Chapter 8 Nephrotic syndrome MixedObsessive compulsive disorders Chapter 8 Obsessive compulsive disorders MixedPolyneuropathy of critical illness
Chapter 8 Polyneuropathy of critical illness Neurology
Recurrent foetal loss (with or without antiphospholipid syndrome)
Chapter 8 Recurrent foetal loss (with or without antiphospholipid syndrome)
Mixed
Rheumatoid arthritis Chapter 8 Rheumatoid arthritis MixedSepsis (other than neonatal sepsis)
Chapter 8 Sepsis (other than neonatal sepsis) Mixed
Sickle cell disease Chapter 8 Sickle cell disease HaematologySystemic lupus erythematosus Chapter 8 Systemic lupus erythematosus MixedUlcerative colitis Chapter 8 Ulcerative colitis MixedJDO issue JDO
ChapterJDO JDO
Acute Idiopathic Dysautomia NA Pre 2008 Criteria NeurologyAlloimmune Neutropenia In Infancy
NA Pre 2008 Criteria Haematology
Alloimmune Thrombocytopenia NA Pre 2008 Criteria Haematology
National Blood Authority pg. 56

Condition Chapter Diagnostic Group Clinical Discipline
NeonatalAutoimmune Thrombocytopenic
NA Pre 2008 Criteria Haematology
Cutaneous Vasculitis NA Pre 2008 Criteria MixedHypogammaglobulinaemia NA Pre 2008 Criteria ImmunologyHypogammaglobulinaemia Unclassified
NA Pre 2008 Criteria Immunology
Immunological Miscellaneous, No diagnosis recorded
NA Pre 2008 Criteria Immunology
Miscellaneous NA Pre 2008 Criteria MixedMyelopathy due to HTLV-1 NA Pre 2008 Criteria ImmunologyNecrotising Myelitis NA Pre 2008 Criteria MixedOther Lymphoproliferative / Hypogammaglobulinaemia
NA Pre 2008 Criteria Haematology
Paediatric Myocarditis NA Pre 2008 Criteria MixedSensory neuropathy associated with anti-Hu antibodies
NA Pre 2008 Criteria Neurology
Septic thrombocytopenia NA Pre 2008 Criteria HaematologyStills Disease - Adults NA Pre 2008 Criteria ImmunologyTrauma - Burns NA Pre 2008 Criteria Mixed
National Blood Authority pg. 57

Appendix D – Dataset of Ig supply by state/territory 2015-16Condition NSW VIC QLD WA SA TAS ACT NT NationalChapter 5
Chronic inflammatory demyelinating polyneuropathy
Patients 834 507 648 130 93 36 32 15 2,250Grams 363,767 248,735 277,894 104,920 40,008 19,413 9,843 6,557 1,071,135Grams/Episode 39 38 34 64 45 39 32 42 39Grams per 47 41 58 40 23 38 25 27 45
Chronic lymphocytic leukaemia
Patients 523 310 347 68 88 32 27 6 1,380Grams 134,563 72,774 90,921 12,915 21,203 8,551 7,188 1,953 350,066Grams/Episode 30 28 26 26 31 30 31 34 28Grams per 18 12 19 5 12 17 18 8 15
Common variable immunodeficiency disease
Patients 813 288 370 95 116 29 63 10 1,724Grams 265,166 96,612 122,267 30,887 34,925 7,645 21,888 1,574 580,964Grams/Episode 21 24 22 18 20 28 17 37 21Grams per 35 16 25 12 21 15 56 6 24
Dermatomyositis
Patients 71 49 35 14 12 5 7 0 193Grams 21,427 15,056 17,952 6,075 2,994 3,450 3,618 0 70,571Grams/Episode 35 41 39 45 37 58 55 0 39Grams per 3 3 4 2 2 7 9 0 3
Guillain-Barré syndrome
Patients 231 196 159 71 41 18 11 <5 727Grams 40,830 33,735 26,257 12,171 6,603 2,579 2,017 501 124,692Grams/Episode 33 34 32 33 33 34 34 36 33Grams per 5 6 5 5 4 5 5 2 5
HSCT - post
Patients 168 79 57 19 17 6 <5 <5 345Grams 19,552 10,269 12,346 2,492 1,839 1,535 144 90 48,266Grams/Episode 27 19 28 23 32 26 48 30 25Grams per 3 2 3 <1 1 3 <1 <1 2Patients 48 48 33 <5 15 <5 0 <5 142
National Blood Authority pg. 58

Condition NSW VIC QLD WA SA TAS ACT NT National
Inclusion body myositisGrams 18,108 24,929 14,164 543 6,290 312 0 93 64,437Grams/Episode 37 37 35 49 41 24 0 47 37Grams per 2 4 3 <1 4 <1 0 <1 3
ITP associated with HIV
Patients 0 0 0 0 0 <5 0 0 <5Grams 0 0 0 0 0 275 0 0 275Grams/Episode 0 0 0 0 0 92 0 0 92Grams per 0 0 0 0 0 <1 0 0 <1
ITP in pregnancy
Patients 23 18 16 <5 6 <5 0 0 67Grams 3,687 2,962 3,555 636 504 480 0 0 11,824Grams/Episode 52 74 36 71 72 32 0 0 49Grams per <1 <1 <1 <1 <1 <1 0 0 <1
ITP in specific circumstances (surgery, corticosteroids contraindicated, chronic ITP)
Patients 117 90 134 23 32 7 <5 <5 404Grams 20,167 12,359 28,026 3,812 5,121 712 80 140 70,415Grams/Episode 50 61 38 49 60 65 80 70 46Grams per 1,000
3 2 6 1 3 1 <1 <1 3
ITP refractory
Patients 97 204 156 37 64 12 <5 5 574Grams 18,567 30,378 24,751 4,405 12,953 1,690 460 802 94,004Grams/Episode 49 59 36 69 63 65 51 62 50Grams per 2 5 5 2 8 3 1 3 4
ITP with life-threatening haemorrhage
Patients 141 14 10 13 10 <5 <5 <5 194Grams 25,864 2,140 1,803 1,232 1,547 70 638 282 33,576Grams/Episode 47 54 36 68 77 35 64 71 48Grams per 3 <1 <1 <1 <1 <1 2 1 1
Kawasaki disease
Patients 140 103 56 30 21 8 8 9 375Grams 5,151 4,604 1,791 1,305 1,080 359 459 297 15,046Grams/Episode 30 30 28 36 47 45 31 27 31Grams per <1 <1 <1 <1 <1 <1 1 1 <1
Lambert-Eaton myasthenic syndrome
Patients 7 <5 10 <5 0 0 0 0 20Grams 2,721 2,283 4,856 650 0 0 0 0 10,510Grams/Episode 45 45 35 50 0 0 0 0 40
National Blood Authority pg. 59

Condition NSW VIC QLD WA SA TAS ACT NT NationalGrams per <1 <1 1 <1 0 0 0 0 <1
Multifocal motor neuropathy
Patients 189 98 108 38 43 11 13 5 496Grams 100,747 60,204 54,720 32,224 29,136 4,722 6,494 5,213 293,458Grams/Episode 44 43 38 67 54 34 53 57 45Grams per 13 10 11 12 17 9 17 21 12
Multiple myeloma
Patients 466 214 382 23 40 40 17 <5 1,177Grams 102,726 47,721 98,411 4,460 7,533 11,955 2,814 66 275,685Grams/Episode 30 30 26 29 33 32 29 22 29Grams per 13 8 20 2 4 23 7 <1 12
Myasthenia gravis
Patients 335 215 310 46 28 16 16 <5 945Grams 128,034 100,633 130,107 22,007 8,418 5,219 8,125 339 402,881Grams/Episode 35 36 34 50 35 36 49 57 36Grams per 17 17 27 8 5 10 21 1 17
Neonatal haemochromatosis
Patients 5 <5 0 0 <5 0 <5 0 10Grams 353 1,335 0 0 12 0 1,260 0 2,960Grams/Episode 32 83 0 0 6 0 60 0 59Grams per <1 <1 0 0 <1 0 3 0 <1
Non-Hodgkin lymphoma
Patients 388 277 504 38 63 35 15 <5 1,308Grams 95,513 63,791 136,216 7,825 15,489 8,456 4,496 363 332,148Grams/Episode 29 29 25 27 30 25 30 33 27Grams per 12 11 28 3 9 16 11 1 14
Other primary immunodeficiency
Patients 48 34 10 8 14 <5 <5 <5 121Grams 12,740 10,725 2,474 1,665 2,561 888 228 790 32,072Grams/Episode 11 18 16 16 9 15 10 22 13Grams per 2 2 <1 <1 2 2 <1 3 1
Other relevant haematological malignancies
Patients 230 71 150 29 39 12 9 <5 533Grams 38,764 15,676 30,678 3,624 7,932 1,934 1,661 288 100,556Grams/Episode 28 29 25 19 28 28 21 24 26Grams per 5 3 6 1 5 4 4 1 4Patients 163 59 109 10 42 <5 6 <5 393
National Blood Authority pg. 60
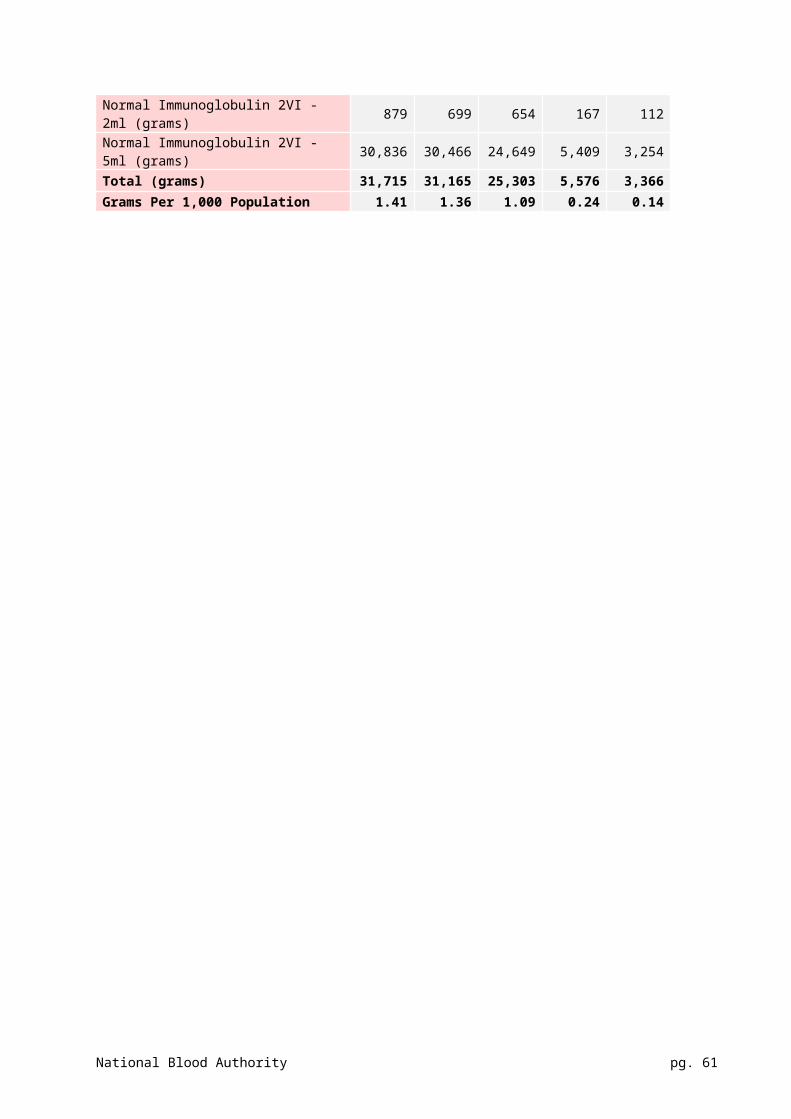
Condition NSW VIC QLD WA SA TAS ACT NT National
PolymyositisGrams 57,093 29,149 48,830 4,571 15,190 1,086 2,137 359 158,414Grams/Episode 35 47 38 44 44 37 49 36 39Grams per 7 5 10 2 9 2 5 1 7
Severe combined Immunodeficiency
Patients 7 13 17 <5 <5 0 0 0 39Grams 1,743 2,311 4,440 135 6 0 0 0 8,636Grams/Episode 9 9 20 17 6 0 0 0 13Grams per <1 <1 <1 <1 <1 0 0 0 <1
Stiff person syndrome
Patients 25 13 21 <5 0 <5 0 0 62Grams 13,487 4,830 11,614 865 0 1,338 0 0 32,134Grams/Episode 43 38 37 39 0 37 0 0 40Grams per 2 <1 2 <1 0 3 0 0 1
Wiskott-Aldrich syndrome
Patients <5 <5 0 <5 0 0 0 0 5Grams 33 465 0 678 0 0 0 0 1,176Grams/Episode 33 6 0 26 0 0 0 0 11Grams per <1 <1 0 <1 0 0 0 0 <1
X linked agammaglobulinaemia
Patients 32 50 17 6 5 0 <5 <5 110Grams 10,791 16,889 5,933 1,698 1,815 0 241 600 37,968Grams/Episode 25 20 17 10 31 0 5 24 19Grams per 1 3 1 <1 1 0 <1 2 2
Chapter 5 Total
Patients 4,998 2,909 3585 703 771 272 239 76 13,328Grams 1,501,589 910,563 1,150,002 261,791 223,157 82,668 73,791 20,306 4,223,866Grams/Episode 31 33 29 39 34 33 27 41 31Grams per 196 152 239 101 131 160 188 83 176
Chapter 6
Acute disseminated encephalomyelitis
Patients 28 20 23 <5 0 <5 0 <5 75Grams 5,291 3,557 3,279 20 0 323 0 160 12,630Grams/Episode 38 37 37 20 0 27 0 80 37Grams per <1 <1 <1 <1 0 <1 0 <1 <1Patients <5 <5 8 0 0 0 <5 0 14
National Blood Authority pg. 61

Condition NSW VIC QLD WA SA TAS ACT NT NationalANCA (PR3 or MPO)-positive idiopathic rapidly progressive glomerulonephritis
Grams 450 1,090 1,907 0 0 0 175 0 3,622Grams/Episode 30 44 43 0 0 0 18 0 39Grams per <1 <1 <1 0 0 0 <1 0 <1
Autoimmune haemolytic anaemia
Patients 45 38 24 7 8 <5 0 0 125Grams 7,272 5,825 3,493 936 2,376 180 0 0 20,081Grams/Episode 41 58 31 41 77 36 0 0 45Grams per <1 <1 <1 <1 1 <1 0 0 <1
Bullous pemphigoid
Patients 16 <5 6 <5 0 0 0 0 28Grams 11,087 1,820 4,236 660 0 0 0 0 17,803Grams/Episode 47 67 36 44 0 0 0 0 45Grams per 1 <1 <1 <1 0 0 0 0 <1
Churg-Strauss syndrome
Patients 0 <5 0 0 <5 0 0 0 <5Grams 0 175 0 0 140 0 0 0 315Grams/Episode 0 25 0 0 140 0 0 0 39Grams per 0 <1 0 0 <1 0 0 0 <1
Cicatricial pemphigoid
Patients <5 <5 7 <5 <5 0 <5 0 21Grams 3,684 1,800 2,602 1,880 3,760 0 4,035 0 17,761Grams/Episode 88 67 45 134 70 0 122 0 78Grams per <1 <1 <1 <1 2 0 10 0 <1
Evans syndrome
Patients 0 <5 0 <5 0 0 0 0 <5Grams 0 160 0 195 0 0 0 0 355Grams/Episode 0 80 0 65 0 0 0 0 71Grams per 0 <1 0 <1 0 0 0 0 <1
Foeto-maternal /neonatal alloimmune thrombocytopenia (Antenatal)
Patients <5 5 6 <5 <5 <5 0 0 21Grams 2,268 4,385 4,683 2,484 2,175 240 0 0 16,235Grams/Episode 76 69 78 71 62 60 0 0 71Grams per <1 <1 <1 <1 1 <1 0 0 <1
Foeto-maternal /neonatal alloimmune thrombocytopenia
Patients 9 5 <5 5 <5 <5 <5 0 23Grams 33 21 3 27 6 3 6 0 99Grams/Episode 3 4 3 3 3 3 3 0 3
National Blood Authority pg. 62

Condition NSW VIC QLD WA SA TAS ACT NT National
(Neonatal)Grams per <1 <1 <1 <1 <1 <1 <1 0 <1
Haemophagocytic syndrome
Patients 23 13 8 <5 <5 0 0 0 49Grams 2,156 1,589 1,165 397 560 0 0 0 5,867Grams/Episode 35 44 38 36 93 0 0 0 40Grams per <1 <1 <1 <1 <1 0 0 0 <1
HSCT (for prevention of GvHD in high risk Allogeneic HSCT).
Patients <5 0 0 0 0 0 0 0 <5Grams 48 0 0 0 0 0 0 0 48Grams/Episode 24 0 0 0 0 0 0 0 24Grams per <1 0 0 0 0 0 0 0 <1
IgG subclass deficiency EXISTING patients only
Patients 0 22 <5 <5 <5 <5 0 0 31Grams 0 3,207 42 351 549 948 0 0 5,097Grams/Episode 0 28 21 23 31 22 0 0 27Grams per 0 <1 <1 <1 <1 2 0 0 <1
IgG subclass deficiency. Existing patient with suppurative lung disease
Patients 16 19 0 <5 <5 <5 0 0 42Grams 5,545 4,221 0 519 477 732 0 0 11,494Grams/Episode 30 29 0 23 25 29 0 0 29Grams per <1 <1 0 <1 <1 1 0 0 <1
IgM para-proteinaemic neuropathy
Patients 39 12 37 <5 6 <5 0 0 98Grams 13,102 2,873 14,861 2,874 1,590 767 0 0 36,066Grams/Episode 37 35 34 68 32 43 0 0 37Grams per 2 <1 3 1 <1 1 0 0 2
ITP in children
Patients 28 42 48 10 16 <5 5 <5 152Grams 2,198 1,842 2,132 249 1,605 435 462 24 8,947Grams/Episode 29 32 27 23 31 24 31 12 29Grams per <1 <1 <1 <1 <1 <1 1 <1 <1
Kidney transplantation post-transplant
Patients 63 175 58 17 22 12 <5 <5 349Grams 8,030 47,688 14,352 3,122 2,088 4,383 530 616 80,807Grams/Episode 22 30 20 38 22 46 44 77 27Grams per 1 8 3 1 1 8 1 3 3Patients 32 24 8 <5 5 <5 <5 0 72
National Blood Authority pg. 63

Condition NSW VIC QLD WA SA TAS ACT NT National
Kidney transplantation pre-transplant
Grams 2,134 2,810 1,052 325 779 165 187 0 7,451Grams/Episode 27 14 16 81 31 55 47 0 20Grams per <1 <1 <1 <1 <1 <1 <1 0 <1
Microscopic polyangiitis
Patients 0 0 <5 <5 0 0 0 0 <5Grams 0 0 168 288 0 0 0 0 456Grams/Episode 0 0 24 24 0 0 0 0 24Grams per 0 0 <1 <1 0 0 0 0 <1
Multiple sclerosis - severe relapse with no response to high dose methylprednisolone
Patients 5 <5 5 0 <5 0 0 0 13Grams 1,354 624 1,309 0 20 0 0 0 3,307Grams/Episode 35 24 34 0 20 0 0 0 32Grams per <1 <1 <1 0 <1 0 0 0 <1
Multiple sclerosis in pregnancy
Patients <5 0 <5 0 0 0 0 0 5Grams 657 0 267 0 0 0 0 0 924Grams/Episode 37 0 30 0 0 0 0 0 34Grams per <1 0 <1 0 0 0 0 0 <1
Multiple sclerosis in young patients severe/relapsing/remitting in whom other therapies have failed
Patients 17 0 <5 0 0 0 <5 0 19Grams 4,028 0 348 0 0 0 150 0 4,526Grams/Episode 30 0 35 0 0 0 25 0 30Grams per <1 0 <1 0 0 0 <1 0 <1
Opsoclonus myoclonus ataxia
Patients 12 6 <5 <5 <5 0 0 0 27Grams 2,107 927 255 168 2,008 0 0 0 5,465Grams/Episode 27 16 15 13 54 0 0 0 27Grams per <1 <1 <1 <1 1 0 0 0 <1
Pemphigus foliaceus
Patients <5 <5 <5 0 0 0 0 0 6Grams 2,157 540 1,121 0 0 0 0 0 3,818Grams/Episode 49 60 35 0 0 0 0 0 45Grams per <1 <1 <1 0 0 0 0 0 <1
Pemphigus vulgaris Patients 15 5 8 <5 <5 0 <5 0 34Grams 10,404 2,175 6,183 2,238 640 0 1,615 0 23,254Grams/Episode 53 70 53 97 160 0 124 0 60
National Blood Authority pg. 64

Condition NSW VIC QLD WA SA TAS ACT NT NationalGrams per 1 <1 1 <1 <1 0 4 0 <1
Post transfusion purpura
Patients 0 <5 <5 0 0 0 0 0 <5Grams 0 69 270 0 0 0 0 0 339Grams/Episode 0 69 45 0 0 0 0 0 48Grams per 0 <1 <1 0 0 0 0 0 <1
Secondary hypogammaglobulinaemia (excludes haem malignancies)
Patients 269 125 197 34 14 15 8 <5 652Grams 57,591 22,351 51,562 5,405 2,456 5,260 834 39 145,497Grams/Episode 26 25 23 16 18 33 22 39 24Grams per 8 4 11 2 1 10 2 <1 6
Specific antibody deficiency
Patients 105 39 49 50 19 <5 8 <5 268Grams 28,037 10,312 13,773 12,056 5,453 503 2,149 122 72,403Grams/Episode 18 23 23 15 14 24 24 9 18Grams per 4 2 3 5 3 <1 5 <1 3
Toxic epidermal necrolysis/Steven Johnson syndrome
Patients 19 21 <5 <5 <5 <5 <5 <5 53Grams 2,649 2,924 108 510 243 490 60 30 7,014Grams/Episode 55 61 9 128 49 163 60 15 57Grams per <1 <1 <1 <1 <1 <1 <1 <1 <1
Transplant - Solid Organ
Patients 0 <5 0 0 0 0 0 0 <5Grams 0 162 0 0 0 0 0 0 162Grams/Episode 0 27 0 0 0 0 0 0 27Grams per 0 <1 0 0 0 0 0 0 <1
TSS - staphylococcal
Patients 13 32 8 <5 <5 <5 <5 <5 63Grams 1,794 3,851 1,061 369 18 244 192 3 7,532Grams/Episode 69 77 66 53 9 81 64 3 70Grams per <1 <1 <1 <1 <1 <1 <1 <1 <1
TSS - streptococcal
Patients 31 27 34 9 <5 <5 <5 0 109Grams 4,248 4,354 4,572 1,219 132 90 587 0 15,202Grams/Episode 70 93 86 87 33 45 53 0 79Grams per <1 <1 <1 <1 <1 <1 1 0 <1Patients 0 <5 <5 0 <5 0 0 0 6
National Blood Authority pg. 65

Condition NSW VIC QLD WA SA TAS ACT NT National
Wegeners granulomatosis
Grams 0 650 49 0 324 0 0 0 1,023Grams/Episode 0 28 25 0 27 0 0 0 28Grams per 0 <1 <1 0 <1 0 0 0 <1
Chapter 6 Total
Patients 790 628 543 168 117 54 38 10 2,315Grams 178,320 132,001 134,849 36,290 27,398 14,763 10,982 994 535,596Grams/Episode 29 31 27 24 28 36 46 34 29Grams per 23 22 28 14 16 29 28 4 22
Condition NSW VIC QLD WA SA TAS ACT NT NationalChapter 7
Acute leukaemia in children
Patients 0 12 0 0 0 <5 0 0 13Grams 0 855 0 0 0 120 0 0 975Grams/Episode 0 33 0 0 0 24 0 0 31Grams per 0 <1 0 0 0 <1 0 0 <1
Autoimmune congenital heart block
Patients <5 0 <5 0 0 0 0 0 <5Grams 6 0 6 0 0 0 0 0 12Grams/Episode 6 0 6 0 0 0 0 0 6Grams per <1 0 <1 0 0 0 0 0 <1
Autoimmune neutropenia
Patients <5 <5 <5 0 0 <5 0 <5 6Grams 447 375 150 0 0 80 0 1,116 2,168Grams/Episode 50 75 30 0 0 40 0 86 64Grams per <1 <1 <1 0 0 <1 0 5 <1
Autoimmune uveitis
Patients <5 0 <5 0 0 0 0 0 <5Grams 473 0 175 0 0 0 0 0 648Grams/Episode 47 0 35 0 0 0 0 0 43Grams per <1 0 <1 0 0 0 0 0 <1
Catastrophic antiphospholipid syndrome
Patients <5 <5 5 <5 0 0 0 <5 13Grams 482 181 813 149 0 0 0 80 1,705Grams/Episode 40 91 37 21 0 0 0 16 36
National Blood Authority pg. 66

Condition NSW VIC QLD WA SA TAS ACT NT NationalGrams per <1 <1 <1 <1 0 0 0 <1 <1
Coagulation factor inhibitors
Patients <5 <5 6 <5 <5 0 0 0 13Grams 635 200 3,120 78 495 0 0 0 4,528Grams/Episode 45 100 89 39 33 0 0 0 67Grams per <1 <1 <1 <1 <1 0 0 0 <1
Devic disease (neuromyelitis optica)
Patients 26 5 6 <5 <5 <5 <5 0 42Grams 7,667 1,538 1,137 1,625 260 150 100 0 12,477Grams/Episode 32 35 26 125 29 30 20 0 34Grams per <1 <1 <1 <1 <1 <1 <1 0 <1
Diabetic Amyotrophy
Patients <5 <5 <5 0 0 0 0 0 9Grams 1,404 485 1,023 0 0 0 0 0 2,912Grams/Episode 26 32 28 0 0 0 0 0 28Grams per <1 <1 <1 0 0 0 0 0 <1
Epidermolysis bullosa acquisita
Patients 0 0 0 <5 <5 0 <5 0 <5Grams 0 0 0 2,886 90 0 2,006 0 4,982Grams/Episode 0 0 0 74 90 0 87 0 79Grams per 0 0 0 1 <1 0 5 0 <1
Epilepsy (rare childhood cases)
Patients <5 7 <5 6 <5 0 0 0 20Grams 696 2,496 894 1,347 252 0 0 0 5,685Grams/Episode 41 43 43 36 42 0 0 0 41Grams per <1 <1 <1 <1 <1 0 0 0 <1
Graves ophthalmopathy
Patients 0 0 <5 <5 0 0 0 0 5Grams 0 0 2,360 450 0 0 0 0 2,810Grams/Episode 0 0 54 90 0 0 0 0 57Grams per 0 0 <1 <1 0 0 0 0 <1
Haemolytic disease of the newborn
Patients 26 20 11 11 13 0 <5 <5 86Grams 1,068 3,962 192 342 51 0 18 3 5,636Grams/Episode 23 51 12 24 3 0 3 3 31Grams per <1 <1 <1 <1 <1 0 <1 <1 <1Patients <5 <5 0 0 0 0 0 0 <5
National Blood Authority pg. 67

Condition NSW VIC QLD WA SA TAS ACT NT National
Haemolytic transfusion reaction
Grams 200 110 0 0 0 0 0 0 310Grams/Episode 50 55 0 0 0 0 0 0 52Grams per <1 <1 0 0 0 0 0 0 <1
Hashimoto encephalopathy
Patients <5 <5 <5 <5 0 0 0 0 10Grams 1,337 946 330 1,655 0 0 0 0 4,268Grams/Episode 29 32 30 57 0 0 0 0 37Grams per <1 <1 <1 <1 0 0 0 0 <1
Limbic Encephalitis (nonparaneoplastic)
Patients 54 41 70 5 10 <5 6 <5 188Grams 12,355 8,166 21,913 970 1,583 368 2,194 550 48,098Grams/Episode 34 29 32 46 37 26 56 37 33Grams per 2 1 5 <1 <1 <1 6 2 2
Limbic Encephalitis (Paraneoplastic)
Patients 14 9 15 <5 <5 0 <5 0 46Grams 2,313 1,190 2,982 490 687 0 453 0 8,114Grams/Episode 27 29 36 38 33 0 24 0 31Grams per <1 <1 <1 <1 <1 0 1 0 <1
Myocarditis in children
Patients 6 11 6 <5 <5 0 0 0 29Grams 48 719 204 54 30 0 0 0 1,055Grams/Episode 7 26 20 18 8 0 0 0 20Grams per <1 <1 <1 <1 <1 0 0 0 <1
PANDAS/tic disorders
Patients <5 <5 <5 <5 0 <5 0 0 6Grams 244 792 171 120 0 120 0 0 1,447Grams/Episode 41 36 171 120 0 60 0 0 45Grams per <1 <1 <1 <1 0 <1 0 0 <1
Paraneoplastic cerebellar degeneration
Patients <5 0 <5 <5 <5 <5 0 0 8Grams 100 0 180 850 175 274 0 0 1,579Grams/Episode 20 0 30 53 35 30 0 0 39Grams per <1 0 <1 <1 <1 <1 0 0 <1
Paraneoplastic cerebellar degeneration (Yo antibodies)
Patients <5 0 0 <5 <5 <5 0 0 5Grams 160 0 0 665 35 256 0 0 1,116Grams/Episode 40 0 0 60 35 32 0 0 47
National Blood Authority pg. 68

Condition NSW VIC QLD WA SA TAS ACT NT NationalGrams per <1 0 0 <1 <1 <1 0 0 <1
Paraneoplastic Subacute Sensory Neuropathy
Patients 6 5 0 0 <5 <5 0 <5 17Grams 1,307 941 0 0 480 105 0 655 3,488Grams/Episode 23 38 0 0 28 35 0 82 32Grams per <1 <1 0 0 <1 <1 0 3 <1
Paraneoplastic syndromes
Patients 0 <5 <5 0 <5 0 0 0 <5Grams 0 150 1,240 0 429 0 0 0 1,819Grams/Episode 0 30 43 0 33 0 0 0 39Grams per 0 <1 <1 0 <1 0 0 0 <1
Potassium channel antibody-associated encephalopathy
Patients 12 5 <5 <5 <5 <5 0 0 25Grams 4,516 1,027 640 920 1,148 1,170 0 0 9,421Grams/Episode 33 37 40 92 38 33 0 0 37Grams per <1 <1 <1 <1 <1 2 0 0 <1
Pure red cell aplasia
Patients 10 <5 8 <5 <5 <5 0 0 24Grams 2,467 221 3,394 610 170 1,560 0 0 8,422Grams/Episode 39 37 45 122 85 40 0 0 44Grams per <1 <1 <1 <1 <1 3 0 0 <1
Pyoderma gangrenosum
Patients 8 17 0 0 <5 0 0 0 27Grams 4,687 10,141 0 0 1,770 0 0 0 16,598Grams/Episode 81 58 0 0 68 0 0 0 64Grams per <1 2 0 0 1 0 0 0 <1
Rasmussen Syndrome
Patients 11 <5 <5 0 <5 0 <5 0 19Grams 4,067 551 1,303 0 715 0 495 0 7,131Grams/Episode 37 31 36 0 55 0 38 0 38Grams per <1 <1 <1 0 <1 0 1 0 <1
Scleromyxedema
Patients 6 <5 <5 <5 <5 0 <5 0 14Grams 3,367 2,372 240 350 1,505 0 27 0 7,861Grams/Episode 47 39 80 35 79 0 27 0 47Grams per <1 <1 <1 <1 <1 0 <1 0 <1Patients 10 <5 5 0 <5 0 <5 0 22
National Blood Authority pg. 69

Condition NSW VIC QLD WA SA TAS ACT NT National
Sjogren's SyndromeGrams 3,811 489 1,510 0 1,088 0 2,800 0 9,698Grams/Episode 31 33 37 0 68 0 58 0 40Grams per <1 <1 <1 0 <1 0 7 0 <1
Solid organ - heart
Patients 9 5 <5 <5 0 <5 0 0 16Grams 1,295 999 495 150 0 132 0 0 3,071Grams/Episode 24 43 35 75 0 44 0 0 32Grams per <1 <1 <1 <1 0 <1 0 0 <1
Solid organ - heart/lung
Patients <5 <5 <5 0 0 0 0 0 7Grams 345 547 324 0 0 0 0 0 1,216Grams/Episode 58 20 27 0 0 0 0 0 26Grams per <1 <1 <1 0 0 0 0 0 <1
Solid organ - liver
Patients 8 <5 <5 0 0 0 0 0 11Grams 777 9 60 0 0 0 0 0 846Grams/Episode 43 9 20 0 0 0 0 0 38Grams per <1 <1 <1 0 0 0 0 0 <1
Solid organ - lung
Patients 31 55 13 <5 5 <5 0 0 106Grams 4,993 10,473 1,885 564 861 140 0 0 18,915Grams/Episode 30 27 20 40 29 35 0 0 27Grams per <1 2 <1 <1 <1 <1 0 0 <1
Solid organ - other
Patients 0 <5 <5 0 0 0 0 0 <5Grams 0 53 51 0 0 0 0 0 104Grams/Episode 0 8 7 0 0 0 0 0 7Grams per 0 <1 <1 0 0 0 0 0 <1
Solid organ - pancreas
Patients <5 0 0 0 0 0 0 0 <5Grams 115 0 0 0 0 0 0 0 115Grams/Episode 38 0 0 0 0 0 0 0 38Grams per <1 0 0 0 0 0 0 0 <1
Susac syndrome Patients 7 0 8 0 0 0 0 0 15Grams 6,148 0 3,146 0 0 0 0 0 9,294Grams/Episode 51 0 46 0 0 0 0 0 49
National Blood Authority pg. 70

Condition NSW VIC QLD WA SA TAS ACT NT NationalGrams per <1 0 <1 0 0 0 0 0 <1
Systemic Capillary Leak syndrome
Patients <5 <5 <5 0 0 0 <5 0 9Grams 672 2,496 3,879 0 0 0 1,360 0 8,407Grams/Episode 27 89 90 0 0 0 105 0 77Grams per <1 <1 <1 0 0 0 3 0 <1
Chapter 7 Total
Patients 270 224 188 49 61 15 21 6 820Grams 68,199 52,482 53,816 14,275 11,824 4,475 9,453 2,404 216,927Grams/Episode 35 37 37 57 41 35 56 57 38Grams per 9 9 11 5 7 9 24 10 9
Chapter 8
Sepsis (other than neonatal sepsis)
Patients 0 0 0 0 0 0 0 <5 <5Grams 0 0 0 0 0 0 0 5 5Grams/Episode 0 0 0 0 0 0 0 5 5Grams per 0 0 0 0 0 0 0 <1 <1
Chapter 8 Total
Patients 0 0 0 0 0 0 0 <5 <5Grams 0 0 0 0 0 0 0 5 5Grams/Episode 0 0 0 0 0 0 0 5 5Grams per 0 0 0 0 0 0 0 <1 <1
Total
Patients 6,019 3,723 4276 916 942 340 296 93 16,331Grams 1,748,108 1,095,04 1,338,667 312,355 262,379 101,905 94,226 23,709 4,976,394Grams/Episode 31 33 29 37 33 33 30 42 31Grams per 228 183 278 120 154 197 240 97 208
Note: The national patient count only includes one count for each patient. This may result in the sum of the state and territory totals being greater than the national total.
National Blood Authority pg. 71

Appendix E – Grams Ig Issued by State and TerritoryNSW VIC QLD WA SA TAS ACT NT
2005-06 Imported Ig 76,368 52,097 134,475 7,765 15,300 13,608 8,165Domestic Ig 452,565 361,665 219,633 152,127 109,515 33,837 21,774 8,004
2006-07 Imported Ig 103,270 88,398 79,393 20,577 18,375 11,065 7,170Domestic Ig 493,172 407,244 337,301 155,821 92,958 50,583 26,470 6,732
2007-08 Imported Ig 105,633 111,010 85,055 38,445 18,416 11,740 16,875Domestic Ig 599,126 423,170 400,144 148,986 108,596 52,755 27,393 6,825
2008-09 Imported Ig 249,905 131,228 171,367 42,895 27,604 19,965 14,200Domestic Ig 562,320 417,574 383,865 143,628 128,511 53,745 22,841 10,503
2009-10 Imported Ig 252,416 101,930 200,264 16,248 31,244 17,110 11,550Domestic Ig 668,526 507,038 439,089 162,963 143,285 61,686 33,225 8,610
2010-11 Imported Ig 136,728 93,835 107,798 30,108 27,383 8,843 11,900 80Domestic Ig 887,016 577,260 631,545 167,745 139,296 76,197 45,540 9,099
2011-12 Imported Ig 265,995 144,284 183,435 59,900 35,775 12,138 14,708 30Domestic Ig 874,995 570,969 674,277 150,294 145,134 73,491 52,446 13,440
2012-13 Imported Ig 467,371 321,085 361,654 92,914 72,613 16,436 26,648 9,551Domestic Ig 804,375 484,680 589,662 132,108 123,810 64,305 48,480 6,744
2013-14 Imported Ig 469,174 312,713 291,460 70,709 87,901 24,069 30,626 10,429Domestic Ig 934,478 584,561 771,037 168,295 138,876 67,776 53,723 6,036
2014-15 Imported Ig 593,045 416,868 458,189 111,570 107,343 41,608 32,199 12,861
Domestic Ig 930,412 579,560 735,658 155,977 135,795 57,987 59,210 4,863
2015-16 Imported Ig 724,960 451,770 584,275 159,631 103,165 48,003 41,264 18,489Domestic Ig 1,004,528 643,340 771,182 152,900 167,599 53,207 52,601 5,589

Appendix F – Unique Patients by Quarter and State and TerritoryYear Quarte
rNSW VIC QLD WA SA TAS ACT NT AUST
2009-10 Q1 2,434 1,367 1,644 380 400 183 112 23 6,508Q2 2,496 1,378 1,667 356 440 177 109 20 6,619Q3 2,554 1,386 1,682 353 395 183 102 15 6,640Q4 2,602 1,451 1,752 371 413 189 120 22 6,889
2010-11 Q1 2,692 1,492 1,839 376 420 197 143 22 7,148Q2 2,781 1,533 1,886 394 394 205 132 21 7,315Q3 2,752 1,532 1,884 376 396 211 130 15 7,262Q4 2,791 1,622 1,946 385 417 197 142 23 7,496
2011-12 Q1 2,921 1,658 2,047 407 419 199 142 27 7,794Q2 2,971 1,628 2,115 413 428 206 137 22 7,898Q3 2,949 1,590 2,150 401 430 203 150 23 7,860Q4 2,961 1,632 2,215 405 458 202 154 29 8,019
2012-13 Q1 3,107 1,751 2,391 449 449 205 168 32 8,494Q2 3,139 1,809 2,360 436 462 196 171 26 8,557Q3 3,211 1,753 2,298 410 454 183 164 33 8,465Q4 3,309 1,821 2,378 425 463 187 170 36 8,737
2013-14 Q1 3,406 1,890 2,472 435 506 204 181 36 9,081Q2 3,428 1,971 2,510 472 481 209 172 36 9,237Q3 3,440 1,952 2,583 454 502 213 188 30 9,317Q4 3,550 2,042 2,660 513 493 215 188 34 9,653
2014-15 Q1 3,713 2,150 2,763 518 545 238 189 41 10,099Q2 3,725 2,169 2,719 521 506 228 202 32 10,057Q3 3,733 2,161 2,772 510 530 215 191 25 10,096Q4 3,846 2,249 2,868 514 555 223 202 31 10,440
2015-16 Q1 4,101 2,354 3,026 554 587 234 202 46 11,033Q2 4,103 2,346 3,067 583 591 225 198 38 11,081Q3 4,161 2,358 3,073 583 595 226 197 41 11,164Q4 4,263 2,400 3,132 602 601 227 207 50 11,424
Appendix G – System Source for Tables and FiguresTable 1 Growth in Ig grams issued since 2006-07................................................................................................................................................................ IDMSTable 2 Percentage change in grams issued over time by state and territory..................................................................................................................... IDMSTable 3 Annual numbers of patients, treatment episodes and grams...................................................................................................................STARS & IDMSTable 4 Basic numbers........................................................................................................................................................................................................ STARSTable 5 Issues of domestic Ig compared with imported Ig................................................................................................................................................... IDMSTable 6 Ig issues (g) by Criteria chapter..............................................................................................................................................................................STARSTable 7 Ig issues by Criteria chapter (percentage)..............................................................................................................................................................STARSTable 8 Ig grams issued for top 10 diagnostic groups over time.........................................................................................................................................STARSTable 9 Difference in grams issued for secondary hypogammaglobulinaemia (percentage).............................................................................................STARSTable 10 Patient numbers and age for the top 20 conditions...........................................................................................................................................STARSTable 11 Ig grams issued by clinical discipline..................................................................................................................................................................STARSTable 12 Grams of Ig issued by state and territory............................................................................................................................................................ IDMSTable 13 Patient numbers by state and territory: chronic inflammatory demyelinating polyneuropathy.......................................................................STARSTable 14 Patient numbers by state and territory: common variable immunodeficiency disease.....................................................................................STARSTable 15 Patient numbers by state and territory: myasthenia gravis...............................................................................................................................STARSTable 16 Patient numbers by state and territory: chronic lymphocytic leukaemia..........................................................................................................STARSTable 17 Patient numbers by state and territory: multiple myeloma...............................................................................................................................STARSTable 18 Ig issued per 1,000 population by state and territory for top 10 conditions......................................................................................................STARSTable 19 Ig grams per episode.......................................................................................................................................................................................... STARSTable 20 Patient numbers for products issued by state and territory in 2015-16............................................................................................................STARSTable 21 Grams of product issued by state and territory in 2015-16...............................................................................................................................STARSTable 22 Treatment episode numbers for products issued by state and territory in 2015-16.........................................................................................STARSTable 23 Patient numbers for products issued by diagnostic group in 2015-16...............................................................................................................STARSTable 24 Grams of product issued by diagnostic group in 2015-16..................................................................................................................................STARSTable 25 Treatment episode numbers for product issued by diagnostic group in 2015-16..............................................................................................STARSTable 26 NHIg issued from 2011-12 to 2015-16................................................................................................................................................................. IDMSTable 27 Grams of NHIg issued from by state and territory............................................................................................................................................... IDMSTable 28 Grams per 1,000 population of NHIg issued by state and territory..................................................................................................................... IDMS

Figure 1 Ten year trends in issues of Ig............................................................................................................................................................................. IDMSFigure 2 Ten year trends in expenditure on Ig.................................................................................................................................................................. IDMSFigure 3 Patients per 1,000 population 2015-16..............................................................................................................................................................STARSFigure 4 Grams of Ig per 1,000 population by state and territory over time.....................................................................................................................IDMSFigure 5 Patient age compared to average Australian age..............................................................................................................................................STARSFigure 6 Patient weights relative to Australian average..................................................................................................................................................STARSFigure 7 Ig expenditure as a proportion of the national blood budget.............................................................................................................................IDMSFigure 8 Ig grams issued by diagnostic group..................................................................................................................................................................STARSFigure 9 Proportion of Ig used for top 10 diagnosis group...............................................................................................................................................STARSFigure 10 Ig issues by clinical discipline.............................................................................................................................................................................STARSFigure 11 Ig issues by clinical discipline for top 10 conditions by state and territory........................................................................................................STARSFigure 12 Grams per episode by condition........................................................................................................................................................................STARSFigure 13 NHIg Grams issued and grams issued per 1,000 population............................................................................................................................... IDMS
Appendix D – Dataset of Ig supply by state/territory 2015-16………………………………………………………………………………………………………………………………………..…STARSAppendix E – Grams Ig Issued by State and Territory …………………………………………………………………………………………………………………………………………….……..…..IDMSAppendix F – Unique Patients by Quarter and State and Territory ……………………………………………………………………………………………………………………………….....STARS
National Blood Authority pg. 75