List of Figures - rsc.org · Density Functional Theory: ... (208) 306 3605; E-mail:...
12
High-Resolution Molybdenum K-edge X-ray Absorption Spectroscopy analyzed with Time-Dependent Density Functional Theory: Supplementary Information Frederico A. Lima, a‡§ Ragnar Bj¨ ornsson, a§ Thomas Weyherm¨ uller, a Perumalreddy Chandrasekaran, b Pieter Glatzel, c Frank Neese, a and Serena DeBeer a,d⇤ a Max-Planck-Institut f¨ ur Chemische Energikonversion, Stiftstrasse 34-36, D- 45470, M¨ ulheim an der Ruhr, Germany Fax: +49 (208) 306 3951; Tel: +49 (208) 306 3605; E-mail: [email protected] b Department of Chemistry and Biochemistry, Lamar University, Beaumont, TX 77710, USA. c European Synchrotron Radiation Facility, 6 Rue Jules Horowitz, 38043 Grenoble Cedex, France. d Department of Chemistry and Chemical Biology, Cornell University, Ithaca, New York 14853, United States. ‡ Present address: Centro Nacional de Pesquisa em Energia e Materiais, Brazilian Synchrotron Light Laboratory - LNLS, CP 6192, 13084-971 Campinas, SP, Brazil. List of Figures S1 Example of the correction of the self-absorption effects in the Mo K-edge HERFD-XAS of compound (1) ([Mo VI (O) 3 ]). After applying the self-absorption correction the XAS data measured in TFY and transmission modes overlay. The same correction was applied in the HERFD-XAS data. ...................................... 3 S2 Results of the peak fit procedure for compound (1). ..................... 4 S3 Results of the peak fit procedure for compound (2). ..................... 4 S4 Results of the peak fit procedure for compound (3). ..................... 4 S5 Results of the peak fit procedure for compound (4). ..................... 5 S6 Results of the peak fit procedure for compound (5). ..................... 5 S7 Results of the peak fit procedure for compound (6). ..................... 5 S8 Results of the peak fit procedure for compound (7). ..................... 6 S9 Results of the peak fit procedure for compound (8). ..................... 6 S10 Correlations between the experimental and calculated Mo K- pre-edge intensity-weighted average energies (left) and intensities (right) obtained using the B3LYP functional and DKH2 relativistic correction.................................. 8 S11 Correlations between the experimental and calculated Mo K- pre-edge intensity-weighted average energies (left) and intensities (right) obtained using the B3LYP functional and ZORA relativistic correction.................................. 8 S12 Correlations between the experimental and calculated Mo K- pre-edge intensity-weighted average energies (left) and intensities (right) obtained using the BP86 functional and DKH2 relativistic correction...................................... 9 S13 Correlations between the experimental and calculated Mo K- pre-edge intensity-weighted average energies (left) and intensities (right) obtained using the BP86 functional and ZORA relativistic correction...................................... 9 S14 Correlations between the experimental and calculated Mo K- pre-edge intensity-weighted average energies (left) and intensities (right) obtained using the BP86 functional and with- out any relativistic correction. ................................ 9 S15 Decomposition of the pre-edge peaks into electric dipole, magnetic dipole and electric quadrupole contributions.................................... 10 1 Electronic Supplementary Material (ESI) for Physical Chemistry Chemical Physics This journal is © The Owner Societies 2013
Transcript of List of Figures - rsc.org · Density Functional Theory: ... (208) 306 3605; E-mail:...

High-Resolution Molybdenum K-edge X-ray Absorption Spectroscopy analyzed with Time-DependentDensity Functional Theory: Supplementary Information
Frederico A. Lima,a‡§ Ragnar Bjornsson,a§ Thomas Weyhermuller,a Perumalreddy Chandrasekaran,b PieterGlatzel,c Frank Neese,a and Serena DeBeera,d⇤
a Max-Planck-Institut fur Chemische Energikonversion, Stiftstrasse 34-36, D- 45470, Mulheim an der Ruhr, Germany Fax: +49(208) 306 3951; Tel: +49 (208) 306 3605; E-mail: [email protected] Department of Chemistry and Biochemistry, Lamar University, Beaumont, TX 77710, USA.c European Synchrotron Radiation Facility, 6 Rue Jules Horowitz, 38043 Grenoble Cedex, France.d Department of Chemistry and Chemical Biology, Cornell University, Ithaca, New York 14853, United States.‡ Present address: Centro Nacional de Pesquisa em Energia e Materiais, Brazilian Synchrotron Light Laboratory - LNLS, CP 6192,13084-971 Campinas, SP, Brazil.
List of FiguresS1 Example of the correction of the self-absorption effects in the Mo K-edge HERFD-XAS of
compound (1) ([MoV I(O)3]). After applying the self-absorption correction the XAS datameasured in TFY and transmission modes overlay. The same correction was applied in theHERFD-XAS data. . . . . . . . . . . . . . . . . . . . . . . . . . . . . . . . . . . . . . . 3
S2 Results of the peak fit procedure for compound (1). . . . . . . . . . . . . . . . . . . . . . 4S3 Results of the peak fit procedure for compound (2). . . . . . . . . . . . . . . . . . . . . . 4S4 Results of the peak fit procedure for compound (3). . . . . . . . . . . . . . . . . . . . . . 4S5 Results of the peak fit procedure for compound (4). . . . . . . . . . . . . . . . . . . . . . 5S6 Results of the peak fit procedure for compound (5). . . . . . . . . . . . . . . . . . . . . . 5S7 Results of the peak fit procedure for compound (6). . . . . . . . . . . . . . . . . . . . . . 5S8 Results of the peak fit procedure for compound (7). . . . . . . . . . . . . . . . . . . . . . 6S9 Results of the peak fit procedure for compound (8). . . . . . . . . . . . . . . . . . . . . . 6S10 Correlations between the experimental and calculated Mo K- pre-edge intensity-weighted
average energies (left) and intensities (right) obtained using the B3LYP functional andDKH2 relativistic correction. . . . . . . . . . . . . . . . . . . . . . . . . . . . . . . . . . 8
S11 Correlations between the experimental and calculated Mo K- pre-edge intensity-weightedaverage energies (left) and intensities (right) obtained using the B3LYP functional andZORA relativistic correction. . . . . . . . . . . . . . . . . . . . . . . . . . . . . . . . . . 8
S12 Correlations between the experimental and calculated Mo K- pre-edge intensity-weightedaverage energies (left) and intensities (right) obtained using the BP86 functional and DKH2relativistic correction. . . . . . . . . . . . . . . . . . . . . . . . . . . . . . . . . . . . . . 9
S13 Correlations between the experimental and calculated Mo K- pre-edge intensity-weightedaverage energies (left) and intensities (right) obtained using the BP86 functional and ZORArelativistic correction. . . . . . . . . . . . . . . . . . . . . . . . . . . . . . . . . . . . . . 9
S14 Correlations between the experimental and calculated Mo K- pre-edge intensity-weightedaverage energies (left) and intensities (right) obtained using the BP86 functional and with-out any relativistic correction. . . . . . . . . . . . . . . . . . . . . . . . . . . . . . . . . 9
S15 Decomposition of the pre-edge peaks into electric dipole, magnetic dipole and electricquadrupole contributions. . . . . . . . . . . . . . . . . . . . . . . . . . . . . . . . . . . . 10
1
Electronic Supplementary Material (ESI) for Physical Chemistry Chemical PhysicsThis journal is © The Owner Societies 2013

AcronymsXAS X-ray Absorption Spectroscopy
XANES X-ray Absorption Near Edge Spectroscopy
EXAFS Extended X-ray Absorption Fine Structure
HERFD-XAS High Energy Resolution X-ray Absorption Spectroscopy
TFY Total Fluorescence Yield
TDDFT Time-dependent Density Functional Theory
ZORA Zeroth Order Regular Approximation
DKH2 second order Douglas-Kroll-Hess
COSMO Conductor-like Screening Model
MLCT Metal-to-Ligand Charge Transfer
MMCT Metal-to-Metal Charge Transfer
HF Hartree-Fock
S1 Experimental MethodsS1.1 HERFD-XAS measurementsThe x-ray absorption spectra were collected at the ID26 beamline in the European Synchrotron RadiationFacility. The storage ring was operated in the 7/8 + 1 filling mode, with 200 mA current. The radiationfrom the ID26 source was monochromatized by a double crystal monochromator using a pair of Si(311)possessing an intrinsic resolution of 0.3 x 10�4. The x-ray beam size was 200 x 700 µm (V x H) at thesample position. XAS data was also collected in transmission and total fluorescence yield modes concomi-tant with the high-resolution (HERFD) measurements. A closed-cycle liquid helium cryostat was used tocool down the samples and prevent radiation damage. The temperature at the samples was estimated to bearound 40 K. A multi-crystal Johanson-type x-ray spectrometer was used to energy-select the x-ray emis-sion lines and record HERFD-XAS data. It was equipped with five Ge(111) crystals, posed at an Braggangle of approximately 77.74�. The [999] reflection selected the Mo Ka1 emission (⇠ 17.4 keV). A silicondrift detector was used to record the high-resolution fluorescence (HERFD-XAS), whereas a Si diode wasused to record the total fluorescence. The individual contribution of the monochromator and analyzer to thetotal experimental resolution were determined following the procedure given in Ref.1. The monochromatorresolving power including the vertical divergence of the incident beam is about 25000 (Si (311)), whichaccounts for less than 1 eV at the Mo K-edge. The intermediate state core-hole lifetime is 4.52 eV, whereasthe final state core-hole lifetime is 1.80 eV. Given these parameters, we estimate a total experimental broad-ening of 3.5 eV with 0.8 eV from the incident beam monochromator and 3.9 eV arising from the X-rayemission spectrometer. Clearly, the analyzer crystals provide the dominant contribution to the instrumentalbroadening. The energy bandwidth can be readily improved, however, with a loss of detection efficiency.There are efforts underway to reduce the energy bandwidth while maintaining the efficiency. Such effortswill improve the overall energy bandwidth to 2.5 eV in future experiments.
2
Electronic Supplementary Material (ESI) for Physical Chemistry Chemical PhysicsThis journal is © The Owner Societies 2013

1.0
0.8
0.6
0.4
0.2
0.0
Nor
m. A
bs. [
a.u.
]
202002015020100200502000019950
X-ray energy [eV]
Transm. TFY TFY - SA corrected
Figure S1 Example of the correction of the self-absorption effects in the Mo K-edge HERFD-XAS of compound (1)([MoV I(O)3]). After applying the self-absorption correction the XAS data measured in TFY and transmission modesoverlay. The same correction was applied in the HERFD-XAS data.
For each sample several successive spectra were averaged together in order to increase the signal-to-noise ratio. Background subtraction and normalization were performed using the ATHENA package2. Afirst-order polynomial was subtracted from the pre-edge region and third-order from the post-edge region.The atomic background was taken into account by subtracting a spline over the post-edge region using theAutobkg algorithm also implemented in ATHENA.
A comparison of data collected in transmission and total fluorescence yield modes revealed that somesamples suffered from self-absorption effects. The XANES data collected in TFY mode was corrected forself-absorption using the “Fluo” algorithm implemented in ATHENA, taking the transmission mode data asreference. The same correction was then applied to the HERFD XAS. An illustration of the self-absorptioncorrection on the XAS data is shown in S1.
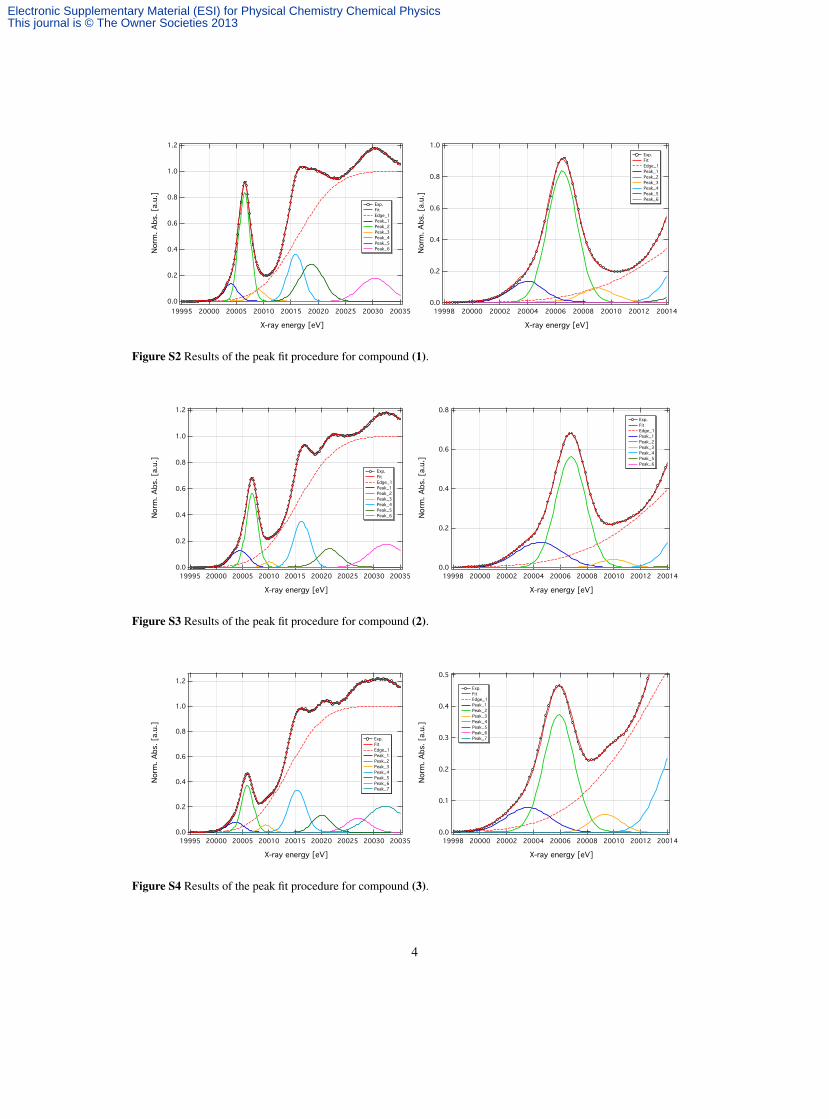
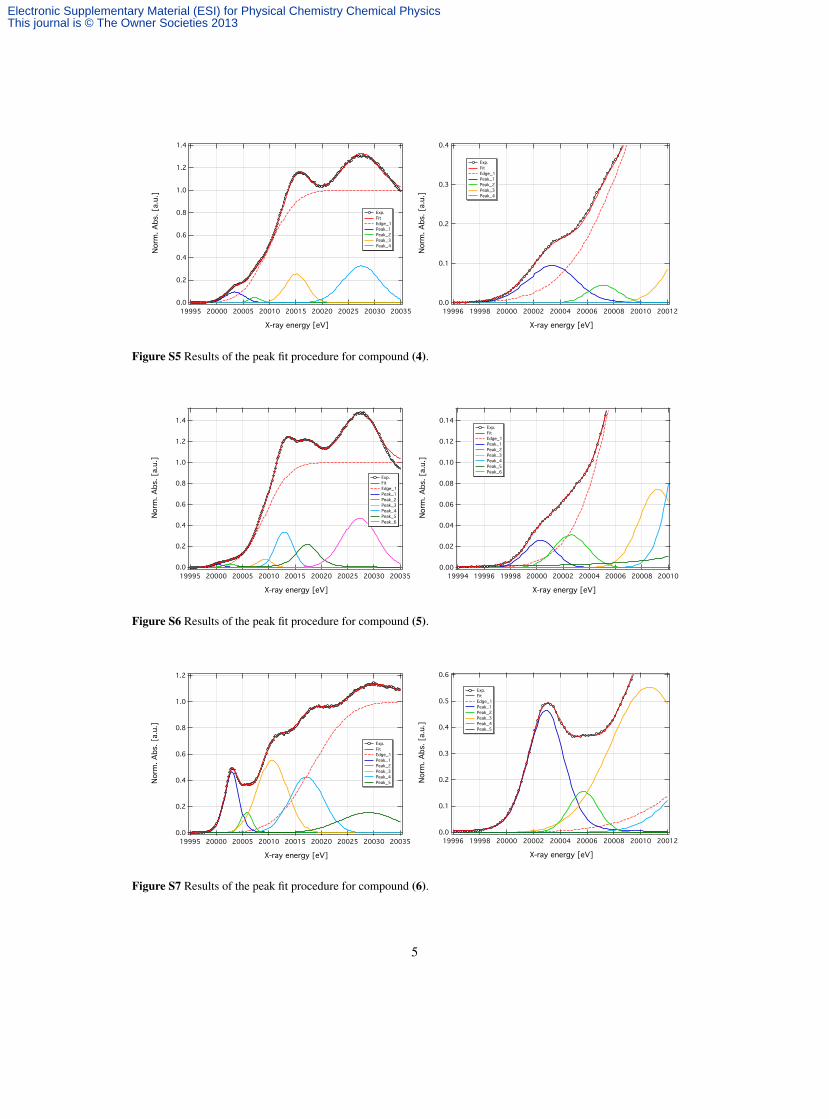
S1.2 Fits of the pre-edge peaksThe energy position and areas of the pre-edge features were determined by fitting the peaks using theBlueprint XAS software3,4. The number of peaks in the pre-edge region were estimated by inspection ofthe second derivative. A set of pseudo-Voigt functions seemed to properly account for features in the pre-edge and the XANES region of the spectrum. The edge was simulated by an actangent function with a stepsize of one. Between five and seven peaks were needed to reproduce ca. 50 eV around the Mo edge region.The results of the peak fit procedure are shown in figures S2, S3, S4, S5, S6, S7, S8 and S9.
3
Electronic Supplementary Material (ESI) for Physical Chemistry Chemical PhysicsThis journal is © The Owner Societies 2013
1.2
1.0
0.8
0.6
0.4
0.2
0.0
Nor
m. A
bs. [
a.u.
]
200352003020025200202001520010200052000019995
X-ray energy [eV]
Exp. Fit Edge_1 Peak_1 Peak_2 Peak_3 Peak_4 Peak_5 Peak_6
1.0
0.8
0.6
0.4
0.2
0.0
Nor
m. A
bs. [
a.u.
]
200142001220010200082000620004200022000019998
X-ray energy [eV]
Exp. Fit Edge_1 Peak_1 Peak_2 Peak_3 Peak_4 Peak_5 Peak_6
Figure S2 Results of the peak fit procedure for compound (1).
1.2
1.0
0.8
0.6
0.4
0.2
0.0
Nor
m. A
bs. [
a.u.
]
200352003020025200202001520010200052000019995
X-ray energy [eV]
Exp. Fit Edge_1 Peak_1 Peak_2 Peak_3 Peak_4 Peak_5 Peak_6
0.8
0.6
0.4
0.2
0.0
Nor
m. A
bs. [
a.u.
]
200142001220010200082000620004200022000019998
X-ray energy [eV]
Exp. Fit Edge_1 Peak_1 Peak_2 Peak_3 Peak_4 Peak_5 Peak_6
Figure S3 Results of the peak fit procedure for compound (2).
1.2
1.0
0.8
0.6
0.4
0.2
0.0
Nor
m. A
bs. [
a.u.
]
200352003020025200202001520010200052000019995
X-ray energy [eV]
Exp. Fit Edge_1 Peak_1 Peak_2 Peak_3 Peak_4 Peak_5 Peak_6 Peak_7
0.5
0.4
0.3
0.2
0.1
0.0
Nor
m. A
bs. [
a.u.
]
200142001220010200082000620004200022000019998
X-ray energy [eV]
Exp. Fit Edge_1 Peak_1 Peak_2 Peak_3 Peak_4 Peak_5 Peak_6 Peak_7
Figure S4 Results of the peak fit procedure for compound (3).
4
Electronic Supplementary Material (ESI) for Physical Chemistry Chemical PhysicsThis journal is © The Owner Societies 2013
1.4
1.2
1.0
0.8
0.6
0.4
0.2
0.0
Nor
m. A
bs. [
a.u.
]
200352003020025200202001520010200052000019995
X-ray energy [eV]
Exp. Fit Edge_1 Peak_1 Peak_2 Peak_3 Peak_4
0.4
0.3
0.2
0.1
0.0
Nor
m. A
bs. [
a.u.
]
200122001020008200062000420002200001999819996
X-ray energy [eV]
Exp. Fit Edge_1 Peak_1 Peak_2 Peak_3 Peak_4
Figure S5 Results of the peak fit procedure for compound (4).
1.4
1.2
1.0
0.8
0.6
0.4
0.2
0.0
Nor
m. A
bs. [
a.u.
]
200352003020025200202001520010200052000019995
X-ray energy [eV]
Exp. Fit Edge_1 Peak_1 Peak_2 Peak_3 Peak_4 Peak_5 Peak_6
0.14
0.12
0.10
0.08
0.06
0.04
0.02
0.00
Nor
m. A
bs. [
a.u.
]
200102000820006200042000220000199981999619994
X-ray energy [eV]
Exp. Fit Edge_1 Peak_1 Peak_2 Peak_3 Peak_4 Peak_5 Peak_6
Figure S6 Results of the peak fit procedure for compound (5).
1.2
1.0
0.8
0.6
0.4
0.2
0.0
Nor
m. A
bs. [
a.u.
]
200352003020025200202001520010200052000019995
X-ray energy [eV]
Exp. Fit Edge_1 Peak_1 Peak_2 Peak_3 Peak_4 Peak_5
0.6
0.5
0.4
0.3
0.2
0.1
0.0
Nor
m. A
bs. [
a.u.
]
200122001020008200062000420002200001999819996
X-ray energy [eV]
Exp. Fit Edge_1 Peak_1 Peak_2 Peak_3 Peak_4 Peak_5
Figure S7 Results of the peak fit procedure for compound (6).
5
Electronic Supplementary Material (ESI) for Physical Chemistry Chemical PhysicsThis journal is © The Owner Societies 2013

1.2
1.0
0.8
0.6
0.4
0.2
0.0
Nor
m. A
bs. [
a.u.
]
200352003020025200202001520010200052000019995
X-ray energy [eV]
Exp. Fit Edge_1 Peak_1 Peak_2 Peak_3 Peak_4 Peak_5 Peak_6
0.35
0.30
0.25
0.20
0.15
0.10
0.05
0.00
Norm
. A
bs. [a.u
.]
200122001020008200062000420002200001999819996
X-ray energy [eV]
HERFD
Fit
Edge_1
Peak_1
Peak_2
Peak_3
Peak_4
Peak_5
Peak_6
Figure S8 Results of the peak fit procedure for compound (7).
1.2
1.0
0.8
0.6
0.4
0.2
0.0
Nor
m. A
bs. [
a.u.
]
200352003020025200202001520010200052000019995
X-ray energy [eV]
Exp. Fit Edge_1 Peak_1 Peak_2 Peak_3 Peak_4 Peak_5
0.30
0.25
0.20
0.15
0.10
0.05
0.00
Nor
m. A
bs. [
a.u.
]
200122001020008200062000420002200001999819996
X-ray energy [eV]
Exp. Fit Edge_1 Peak_1 Peak_2 Peak_3 Peak_4 Peak_5
Figure S9 Results of the peak fit procedure for compound (8).
6
Electronic Supplementary Material (ESI) for Physical Chemistry Chemical PhysicsThis journal is © The Owner Societies 2013

Table S1 Comparison of the calculated energies and intensities of the pre-edge peaks in the Mo K-edge HERFD-XASfor different compounds used in the calibration study
FunctionalCompound
Ave.a(1) (2) (3) (4) (5) (6) (7) (8)
BP86 (x-ray)E 19796.0 19796.1 19795.5 19793.2 19792.7 19791.6 19791.5 19791.4 n.a.
DE 210.0 210.1 209.9 210.2 208.9 211.4 209.9 209.6 210.0 ± 0.7Int. 4.953 4.182 3.708 0.485 0.171 2.180 0.840 1.254 n.a.
BP86 (opt)E 19795.9 19795.9 19795.0 19793.2 19792.64 19791.6 19791.2 19791.4 n.a.
DE 210.1 210.3 210.3 210.2 208.9 211.3 210.3 209.6 210.1 ± 0.7Int. 5.052 4.062 2.883 0.520 0.1620 2.203 1.446 1.279 n.a.
B3LYPE 19853.3 19853.3 19852.3 19850.2 19849.5 19848.8 19849.0 19848.7 n.a.
DE 152.8 153.0 153.1 153.2 152.1 154.1 152.44 152.3 152.9 ± 0.6Int. 4.856 4.223 3.070 0.505 0.108 2.1460 1.263 1.190 n.a.
PBEE 19791.3 19791.3 19792.4 19788.4 19788.0 19787.0 19786.7 19786.8 n.a.
DE 214.8 214.9 212.9 214.9 213.6 215.9 214.7 214.2 214.5 ± 0.9Int. 5.001 3.983 2.789 0.473 0.156 2.181 1.209 1.243 n.a.
PBE0E 19867.3 19867.3 19866.3 19864.2 19863.3 19862.8 19863.1 19862.8 n.a.
DE 138.8 138.9 139.1 139.1 138.3 140.1 138.3 138.2 138.9 ± 0.6Int. 4.924 4.324 3.126 0.523 0.091 2.155 1.276 1.212 n.a.
TPSSE 19815.6 19815.6 19814.7 19812.7 19812.3 19811.2 19810.9 19811.0 n.a.
DE 190.5 190.6 190.7 190.7 189.3 191.8 190.5 190.0 190.5 ± 0.7Int. 4.968 4.049 2.864 0.486 0.164 2.186 1.219 1.238 n.a.
TPSShE 19843.7 19843.6 19842.7 19840.5 19840.7 19839.2 19839.2 19838.9 n.a.
DE 162.4 162.6 162.7 162.9 160.9 163.7 162.2 162.1 162.4 ± 0.8Int. 4.749 3.970 2.878 0.453 0.213 2.046 1.239 1.083 n.a.
revTPSSE 19816.9 19816.9 19816.0 19814.0 19813.9 19812.5 19812.2 19812.3 n.a.
DE 189.1 189.3 189.4 189.4 187.7 190.5 189.2 188.7 189.2 ± 0.8Int. 4.749 3.970 2.878 0.453 0.213 2.046 1.239 1.083 n.a.
revTPSShE 19844.8 19844.8 19843.8 19841.7 19840.8 19840.4 19840.3 19840.1 n.a.
DE 161.2 161.4 161.5 161.7 160.8 162.6 161.1 160.9 161.4 ± 0.6Int. 5.092 4.262 3.090 0.455 0.069 2.190 1.324 1.163 n.a.
BP86-ZORAE 20291.5 20291.5 20290.6 20288.7 20288.4 20287.1 20286.7 20287.0 n.a.
DE -285.4 -285.3 -285.2 -285.3 -286.9 -284.2 -285.3 -286.0 -285.5 ± 0.7Int. 4.967 3.988 2.830 0.508 0.193 2.158 1.420 1.248 n.a.
B3LYP-ZORAE 20349.0 20349.0 20348.0 20345.9 20344.9 20344.5 20344.7 20344.4 n.a.
DE -342.9 -342.8 -342.6 -342.5 -343.3 -341.6 -343.3 -343.4 -342.8 ± 0.6Int. 5.094 4.423 3.222 0.493 0.114 2.249 1.315 1.235 n.a.
a Ave. refers to the average energy shift.
7
Electronic Supplementary Material (ESI) for Physical Chemistry Chemical PhysicsThis journal is © The Owner Societies 2013

S2 Correlation plots
19854
19853
19852
19851
19850
19849
19848
Calc
ulate
d en
ergy
[eV]
200062000520004200032000220001
Experimental energy [eV]
B3LYP - EnergyR = 0.954
(1) (2)
(3)
(4)(5)
(6)(7)
(8)
5
4
3
2
1
0
Calc
ulate
d int
ensit
y [a
.u.]
3.02.52.01.51.00.50.0
Experimental intensity [a.u.]
B3LYP - Intensity
R = 0.963(1)(2)
(3)
(4)(5)
(6)
(7)(8)
Figure S10 Correlations between the experimental and calculated Mo K- pre-edge intensity-weighted averageenergies (left) and intensities (right) obtained using the B3LYP functional and DKH2 relativistic correction.
20350
20349
20348
20347
20346
20345
20344
Calc
ula
ted e
nerg
y [
eV
]
200062000520004200032000220001
Experimental energy [eV]
B3LYP ZORA - Energy
R = 0.963 (1) (2)
(3)
(4)
(5)
(6)
(7)(8)
5
4
3
2
1
0
Calc
ula
ted intensit
y [
a.u
.]
3.02.52.01.51.00.50.0
Experimental intensity [a.u.]
B3LYP ZORA - Intensity
R = 0.963
(1)
(2)
(3)
(4)
(5)
(6)
(7)(8)
Figure S11 Correlations between the experimental and calculated Mo K- pre-edge intensity-weighted averageenergies (left) and intensities (right) obtained using the B3LYP functional and ZORA relativistic correction.
8
Electronic Supplementary Material (ESI) for Physical Chemistry Chemical PhysicsThis journal is © The Owner Societies 2013
19796
19795
19794
19793
19792
19791
Calc
ulate
d en
ergy
[eV]
200062000520004200032000220001
Experimental energy [eV]
BP86 - Energy
R = 0.948
(1) (2)
(3)
(4)(5)
(6)(7)
(8)
5
4
3
2
1
0
Calc
ulate
d int
ensit
y [a
.u.]
3.02.52.01.51.00.50.0
Experimental intensity [a.u.]
BP86 - Intensity
R = 0.967
(1)
(2)
(3)
(4)(5)
(6)(7)
(8)
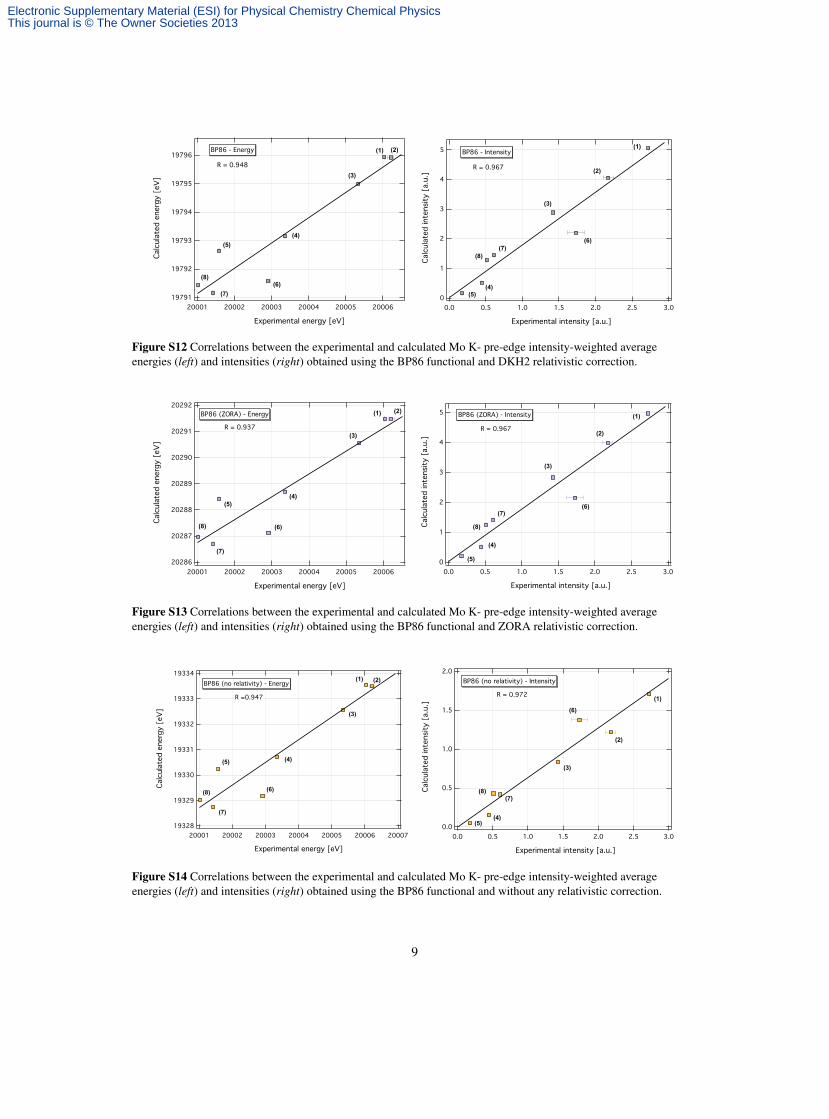
Figure S12 Correlations between the experimental and calculated Mo K- pre-edge intensity-weighted averageenergies (left) and intensities (right) obtained using the BP86 functional and DKH2 relativistic correction.
20292
20291
20290
20289
20288
20287
20286
Calc
ula
ted e
nerg
y [
eV
]
200062000520004200032000220001
Experimental energy [eV]
BP86 (ZORA) - Energy
R = 0.937
(1) (2)
(3)
(4)(5)
(6)
(7)
(8)
5
4
3
2
1
0
Calc
ula
ted intensit
y [
a.u
.]
3.02.52.01.51.00.50.0
Experimental intensity [a.u.]
BP86 (ZORA) - Intensity
R = 0.967
(1)
(2)
(3)
(4)
(5)
(6)(7)
(8)
Figure S13 Correlations between the experimental and calculated Mo K- pre-edge intensity-weighted averageenergies (left) and intensities (right) obtained using the BP86 functional and ZORA relativistic correction.
19334
19333
19332
19331
19330
19329
19328
Calc
ulate
d en
ergy
[eV]
20007200062000520004200032000220001
Experimental energy [eV]
BP86 (no relativity) - Energy
R =0.947
(1) (2)
(3)
(4)(5)
(6)
(7)
(8)
2.0
1.5
1.0
0.5
0.0
Calc
ulate
d int
ensit
y [a
.u.]
3.02.52.01.51.00.50.0
Experimental intensity [a.u.]
R = 0.972
BP86 (no relativity) - Intensity
(1)
(2)
(3)
(4)(5)
(6)
(7)(8)
Figure S14 Correlations between the experimental and calculated Mo K- pre-edge intensity-weighted averageenergies (left) and intensities (right) obtained using the BP86 functional and without any relativistic correction.
9
Electronic Supplementary Material (ESI) for Physical Chemistry Chemical PhysicsThis journal is © The Owner Societies 2013

S3 Contribution to the pre-edge
3.0
2.5
2.0
1.5
1.0
0.5
0.0
Cal
cula
ted
inte
nsity
[a.
u.]
2001220010200082000620004200022000019998
X-ray energy [eV]
electric dipole magnetic dipole electric quadrupole
Compound (1)2.5
2.0
1.5
1.0
0.5
0.0
Cal
cula
ted
inte
nsity
[a.
u.]
2001220010200082000620004200022000019998
X-ray energy [eV]
electric dipole magnetic dipole electric quadrupole
Compound (2)
2.0
1.5
1.0
0.5
0.0
Cal
cula
ted
inte
nsity
[a.
u.]
2001220010200082000620004200022000019998
X-ray energy [eV]
electric dipole magnetic dipole electric quadrupole
Compound (3) 0.25
0.20
0.15
0.10
0.05
0.00 C
alcu
late
d in
tens
ity [
a.u.
]2001020008200062000420002200001999819996
X-ray energy [eV]
electric dipole magnetic dipole electric quadrupole
Compound (4)
0.05
0.04
0.03
0.02
0.01
0.00
Cal
cula
ted
inte
nsity
[a.
u.]
2001020008200062000420002200001999819996
X-ray energy [eV]
electric dipole magnetic dipole electric quadrupole
Compound (5)1.4
1.2
1.0
0.8
0.6
0.4
0.2
0.0
Cal
cula
ted
inte
nsity
[a.
u.]
2001020008200062000420002200001999819996
X-ray energy [eV]
electric dipole magnetic dipole electric quadrupole
Compound (6)
0.7
0.6
0.5
0.4
0.3
0.2
0.1
0.0
Cal
cula
ted
inte
nsity
[a.
u.]
2001020008200062000420002200001999819996
X-ray energy [eV]
electric dipole magnetic dipole electric quadrupole
Compound (7) 0.8
0.6
0.4
0.2
0.0
Cal
cula
ted
inte
nsity
[a.
u.]
2001020008200062000420002200001999819996
X-ray energy [eV]
electric dipole magnetic dipole electric quadrupole
Compound (8)
Figure S15 Decomposition of the pre-edge peaks into electric dipole, magnetic dipole and electric quadrupolecontributions.
10
Electronic Supplementary Material (ESI) for Physical Chemistry Chemical PhysicsThis journal is © The Owner Societies 2013
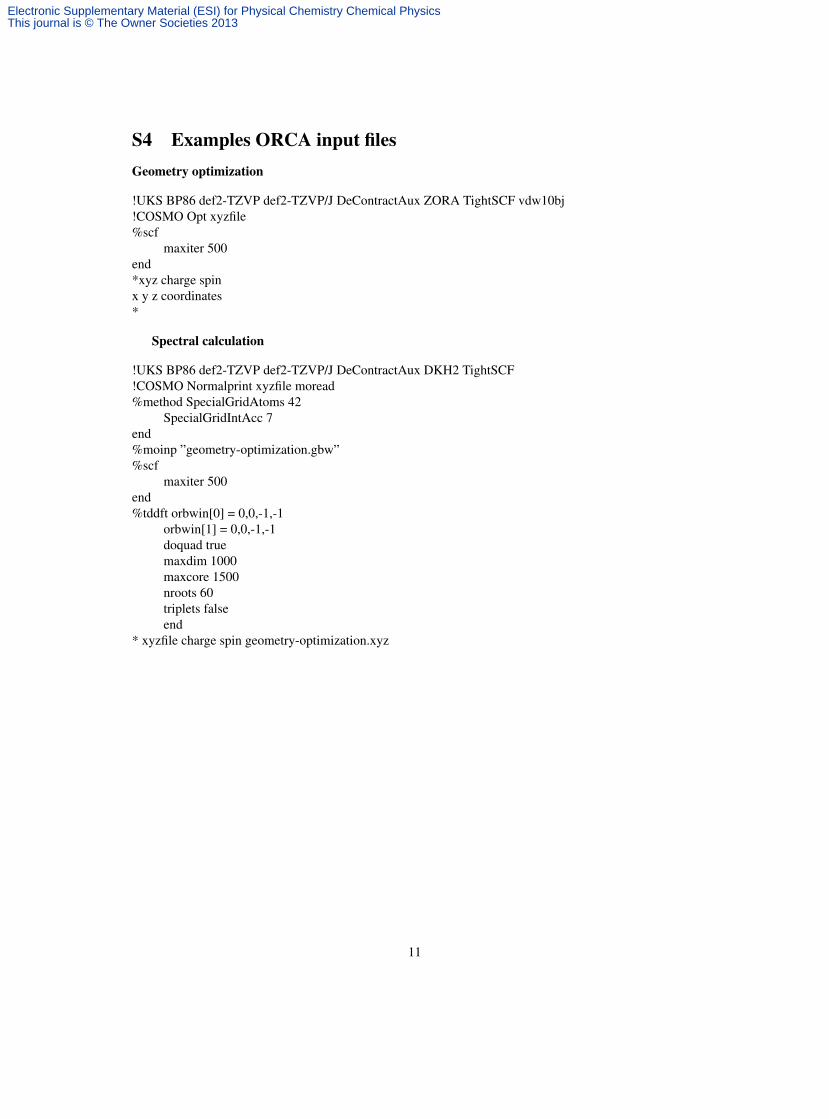
S4 Examples ORCA input filesGeometry optimization
!UKS BP86 def2-TZVP def2-TZVP/J DeContractAux ZORA TightSCF vdw10bj!COSMO Opt xyzfile%scf
maxiter 500end*xyz charge spinx y z coordinates*
Spectral calculation
!UKS BP86 def2-TZVP def2-TZVP/J DeContractAux DKH2 TightSCF!COSMO Normalprint xyzfile moread%method SpecialGridAtoms 42
SpecialGridIntAcc 7end%moinp ”geometry-optimization.gbw”%scf
maxiter 500end%tddft orbwin[0] = 0,0,-1,-1
orbwin[1] = 0,0,-1,-1doquad truemaxdim 1000maxcore 1500nroots 60triplets falseend
* xyzfile charge spin geometry-optimization.xyz
11
Electronic Supplementary Material (ESI) for Physical Chemistry Chemical PhysicsThis journal is © The Owner Societies 2013

References[1] P. Glatzel, T.-C. Weng, K. Kvashnina, J. Swarbrick, M. Sikora, E. Gallo, N. Smolentsev and R. A. Mori,
J. Electron Spectrosc. Relat. Phenom., 2012, DOI: dx.doi.org/10.1016/j.elspec.2012.09.004.
[2] B. Ravel and M. Newville, J. Synchrotron Radiat., 2005, 12, 537–541.
[3] M. U. Delgado-Jaime, C. P. Mewis and P. Kennepohl, J. Synchrotron Radiat., 2010, 17, 132–137.
[4] M. U. Delgado-Jaime and P. Kennepohl, J. Synchrotron Radiat., 2010, 17, 119–128.
12
Electronic Supplementary Material (ESI) for Physical Chemistry Chemical PhysicsThis journal is © The Owner Societies 2013