
List of Figures - EcoAfrica Environmental … · Web viewLimpopo Environmental Outlook Report 2016...
21
Discussion Document Limpopo Environmental Outlook Report 2016 1 st DRAFT Chapter 5: Energy for the Limpopo Province, South Africa 1 This document is an ongoing outcome of a consultative process that underpins the Limpopo Environmental Outlook (LEO) Report 2016. It can be quoted only with the explicit and written permission of LEDET. It has been reviewed by specialists in the field, as well as members of the provincial Steering Committee for the LEO Project. All LEO Reports are distributed as widely as possible, for inputs and comments.
Transcript of List of Figures - EcoAfrica Environmental … · Web viewLimpopo Environmental Outlook Report 2016...
Discussion Document
Limpopo Environmental Outlook Report2016
1st DRAFT
Chapter 5: Energy for the Limpopo Province, South Africa
1
This document is an ongoing outcome of a consultative process that underpins the Limpopo Environmental Outlook (LEO) Report 2016. It can be quoted only with the explicit and written permission of LEDET. It has been reviewed by specialists in the field, as well as members of the provincial Steering Committee for the LEO Project. All LEO Reports are distributed as widely as possible, for inputs and comments.
Discussion Document
This document was prepared by EcoAfrica under the aegis of Limpopo Economic Development, Environment and Tourism (LEDET), for stakeholders to engage with the environmental assessment and reporting. Its date of release is the 9th December, 2015.
Table of Contents
List of Acronyms........................................................................................................................................3
1. Introduction........................................................................................................................................4
2. Drivers and Pressures.........................................................................................................................4
3. State, Impacts and Trends..................................................................................................................5
4. Global Change Aspects.....................................................................................................................11
5. Responses ………………….....................................................................................................................12
6. Identifying Scenarios........................................................................................................................12
7. Conclusions and Recommendations.................................................................................................13
8. References …………………………………………………………………………………………………………………………………. 15
List of Figures
Figure 1: South Africa’s primary sources of energy in 2010 (left); and Polokwane LM’s secondary sources of energy in 2011 (StatsSA, 2015; SALGA, 2013)...........................................................5
Figure 2: Location of energy generation projects in the Limpopo Province.............................................7Figure 3: Limpopo installed capacity in MW (red), and energy delivered by Eskom to the
province in GWh (blue) (StatsSA, 2015).....................................................................................8Figure 4: South African users of energy per type of sector in 2000 (left); and for the Limpopo LM
in 2011 (right) (StatsSA, 2015; SALGA, 2013).............................................................................9Figure 5: Liquid fuel sales for the Limpopo province compared with national sales (left), and
disaggregated per type of fuel (right)........................................................................................9Figure 6: Percentage of households using electricity in the Limpopo Province per District
Municipality (StatsSA, 2012)....................................................................................................10Figure 7: Primary source of energy for lighting, heating and cooking amongst the Limpopo
Households (electricity not plotted) (StatsSA, 2012)...............................................................11Figure 8: Trends in household’s fuel usage for heating (red) and cooking (blue) (StatsSA, 2012)..........11
List of Tables
Table 1: Summary of indicators for the energy assessment of the Limpopo Province.............................4Table 2: Summary of electricity generation projects in the Limpopo Province at 2015...........................7Table 3: Summary of electricity generation for the Limpopo Province....................................................8Table 4: List of priority activities at provincial level regarding clean energy and energy efficiency........12
2
Discussion Document
Table 5: Scenarios of intervention for energy related strategies............................................................13Table 6: Summary of the outlook for energy based on indicators considered.......................................14
3
Discussion Document
List of Acronyms
CSP Concentrated solar power
DM District Municipality
FET Further Education and Training
FGD Flue Gas Desulphurisation
GWh Gigawatt hour
kWh Kilo watt hour
LDA Limpopo Department of Agriculture
LDE Limpopo Department of Education
LDPT Limpopo Department of Provincial Treasury
LDSD Limpopo Department of Social Development
LEDET Limpopo Department of Economic Development, Environment and Tourism
LGEP Limpopo Green Energy Plan
LM Local municipality
LM Local municipality
LPG Liquefied Petroleum Gas
MW Megawatt
MWh Megawatt hour
PV Photovoltaic
RE Renewable Energy
REIPP Renewable Energy Independent Power Procurement program
TJ Tera joule
ZLED Zero Liquid Effluent Discharge
4
Discussion Document
1. Introduction
Energy is essential to sustain life in all living organisms. Modern lifestyle has related well-being and prosperity with an increase demand for energy, and a strong link has been established between economic growth and energy demand. For example, the per capita energy consumption in the United States for 2013 was 12 185 kWh, while for the same period in South Africa it was 4 821 kWh (CIA, 2014).
In South Africa the fossil fuels dominate the energy sector, with coal (67%) and crude oil (21%) providing most of the primary energy1. Coal accounts for more than 90% of the electricity generation of the country(DoE, 2013). The Limpopo energy carriers2 do not differ, and it is electricity, coal and oil that satisfies most of its energy requirements. However, the use of fossil fuel for energy generation brings an overwhelming burden on the environment in the form of air pollutants, greenhouse gas emissions, water contamination, and ecosystems degradation.
Limpopo’s leading economic sectors are mining, tourism and agriculture. Mining and mining associated industries are intense energy users per se, they are the greatest consumers of energy within the Limpopo province. However, the long term effects of a constant supply of energy for these activities also threatens the sustainability of the agriculture and tourist sector. On the other hand, poverty and inequality is still present in the province, and about 10% of the households don’t have or can’t afford access to electricity.
This chapter describes the energy sector for the Limpopo province from the generation and consumption perspective. This report uses the indicators described in Table 1 as a framework for the analysis. Detailed descriptions of the environmental impacts on air and climate from power generation are included in the Air Quality and Climate chapters.
Table 1: Summary of indicators for the energy assessment of the Limpopo Province
Indicators Considered Description and CommentHousehold Energy source It describes the household access to electricity, and the preferred
source of energy to supply the needs for lighting, heating and cookingTrends in energy consumption per sector
Identifies the main energy users within in the province
Renewable energy production as percentage of total electricity consumption.
Compares the output from renewable projects with the electricity requirements of the province.
2. Drivers and Pressures
Without a doubt, the primary drivers of the environmental impacts of energy generation and usage are population growth and economic growth. For the Limpopo Province, the influence of these factors extend beyond its boundaries, as the province has a large mineral industry and power generation facilities in place in order to contribute to the economic growing requirements of the nation.
1 Primary energy is an energy form found in nature that has not been subjected to any conversion or transformation process.2 An energy carrier refers to any system or substance that contains energy for conversion as usable energy later or somewhere else (ISO 13600)
5
Discussion Document
Other factors such as urbanization levels, population age, household size, transport systems and ambient temperature also influence significantly not only the amount of energy required; but also the consumption patterns. Consumptions patterns, amount of energy, and efficiency of use of such energy ultimately determine the overall impact on environmental features through the various pressures.
Limpopo’s activities that drive energy consumption comprise coal power stations, industry (including mining), transportation and residential usage. For all cases it is true that the amount of energy consumed is related to efficiency of use, which also depends on the technology of the applications. The nature of this energy consumption determines whether there is room for improvement in energy carriers or energy efficiency.
For example, residential users require smaller units of energy at specific times (i.e. morning and evening) for household appliances, which could be provided from renewable sources and electricity from the grid. On the other hand, mining or smelting requires a large amount of constant supply of energy which can only come from grid supplied electricity sourced from coal. Regarding transportation, no shifts from liquid fuels are expected unless there is a significant change in public transport services or inclusion of electricity/gas driven vehicles.
3. State, Impacts and Trends
Sources of energy
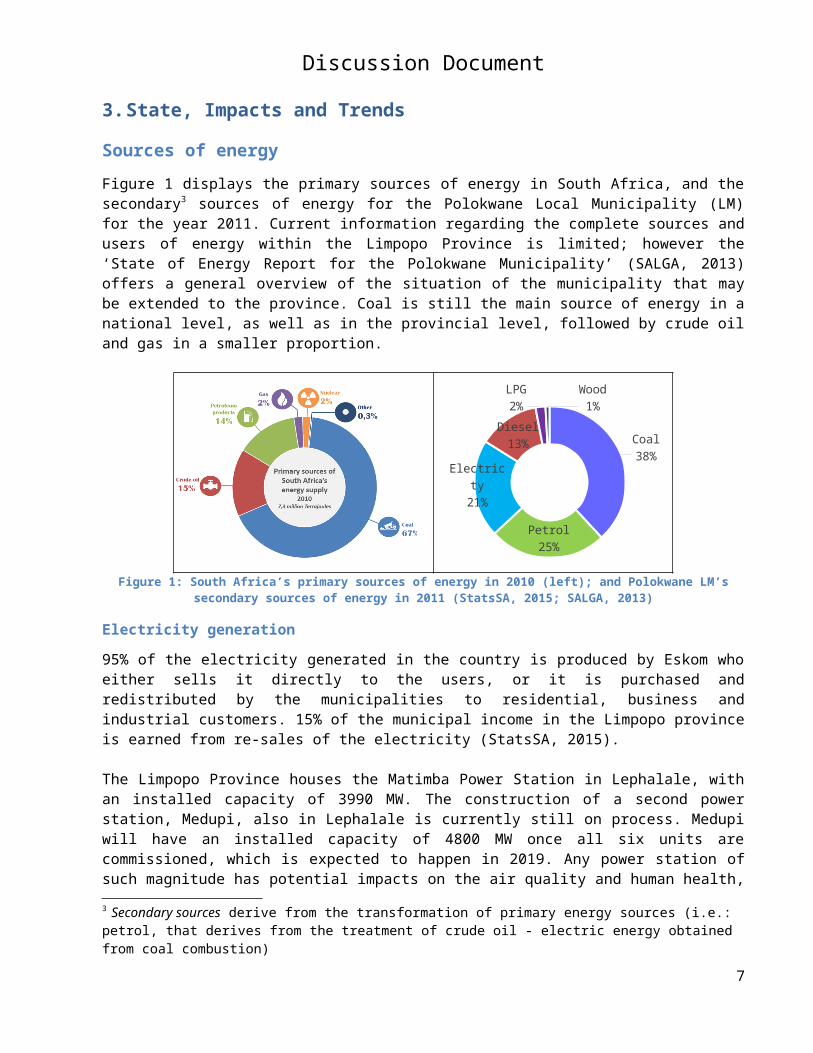
Figure 1 displays the primary sources of energy in South Africa, and the secondary3 sources of energy for the Polokwane Local Municipality (LM) for the year 2011. Current information regarding the complete sources and users of energy within the Limpopo Province is limited; however the ‘State of Energy Report for the Polokwane Municipality’ (SALGA, 2013) offers a general overview of the situation of the municipality that may be extended to the province. Coal is still the main source of energy in a national level, as well as in the provincial level, followed by crude oil and gas in a smaller proportion.
Figure 1: South Africa’s primary sources of energy in 2010 (left); and Polokwane LM’s secondary sources of energy in 2011 (StatsSA, 2015; SALGA, 2013)
3 Secondary sources derive from the transformation of primary energy sources (i.e.: petrol, that derives from the treatment of crude oil - electric energy obtained from coal combustion)
6
Coal38%
Petrol25%
Electricty21%
Diesel13%
LPG2%
Wood1%
Secondary sources of
energy supply PLM2011
160.2 TJ
Discussion Document
Electricity generation
95% of the electricity generated in the country is produced by Eskom who either sells it directly to the users, or it is purchased and redistributed by the municipalities to residential, business and industrial customers. 15% of the municipal income in the Limpopo province is earned from re-sales of the electricity(StatsSA, 2015).
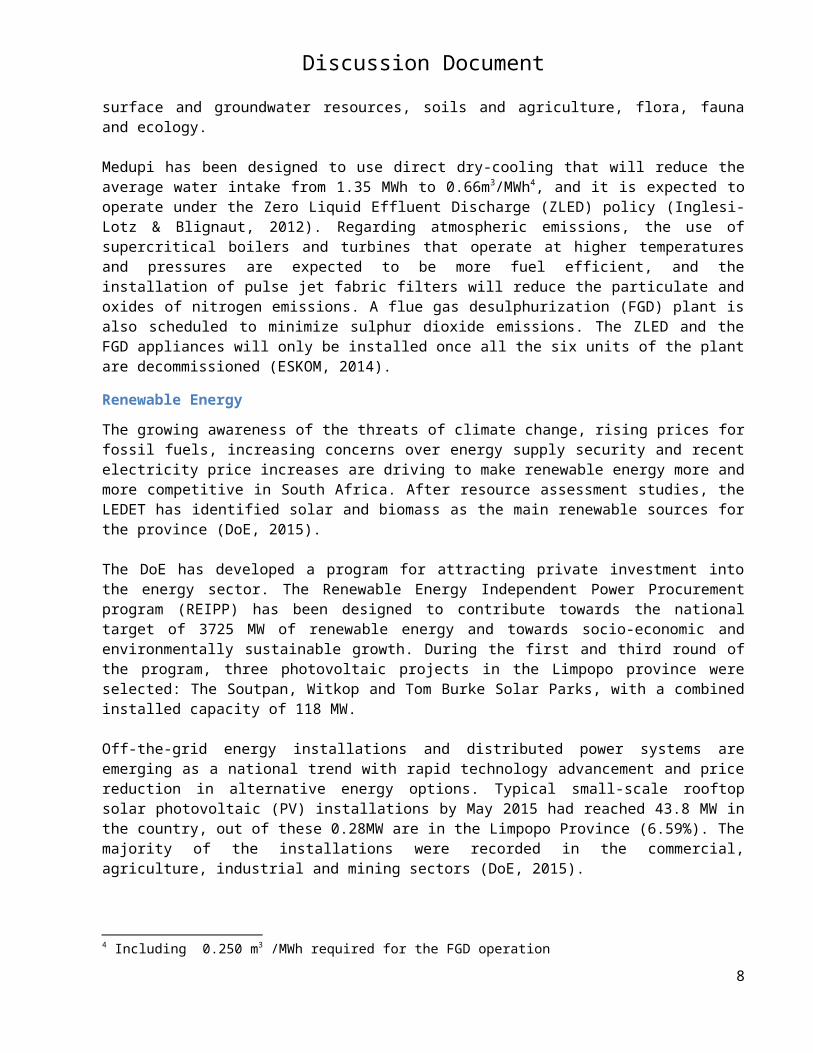
The Limpopo Province houses the Matimba Power Station in Lephalale, with an installed capacity of 3990 MW. The construction of a second power station, Medupi, also in Lephalale is currently still on process. Medupi will have an installed capacity of 4800 MW once all six units are commissioned, which is expected to happen in 2019. Any power station of such magnitude has potential impacts on the air quality and human health, surface and groundwater resources, soils and agriculture, flora, fauna and ecology.
Medupi has been designed to use direct dry-cooling that will reduce the average water intake from 1.35 MWh to 0.66m3/MWh4, and it is expected to operate under the Zero Liquid Effluent Discharge (ZLED) policy (Inglesi-Lotz & Blignaut, 2012). Regarding atmospheric emissions, the use of supercritical boilers and turbines that operate at higher temperatures and pressures are expected to be more fuel efficient, and the installation of pulse jet fabric filters will reduce the particulate and oxides of nitrogen emissions. A flue gas desulphurization (FGD) plant is also scheduled to minimize sulphur dioxide emissions. The ZLED and the FGD appliances will only be installed once all the six units of the plant are decommissioned (ESKOM, 2014).
Renewable Energy
The growing awareness of the threats of climate change, rising prices for fossil fuels, increasing concerns over energy supply security and recent electricity price increases are driving to make renewable energy more and more competitive in South Africa. After resource assessment studies, the LEDET has identified solar and biomass as the main renewable sources for the province (DoE, 2015).
The DoE has developed a program for attracting private investment into the energy sector. The Renewable Energy Independent Power Procurement program (REIPP) has been designed to contribute towards the national target of 3725 MW of renewable energy and towards socio-economic and environmentally sustainable growth. During the first and third round of the program, three photovoltaic projects in the Limpopo province were selected: The Soutpan, Witkop and Tom Burke Solar Parks, with a combined installed capacity of 118 MW.
Off-the-grid energy installations and distributed power systems are emerging as a national trend with rapid technology advancement and price reduction in alternative energy options. Typical small-scale rooftop solar photovoltaic (PV) installations by May 2015 had reached 43.8 MW in the country, out of these 0.28MW are in the Limpopo Province (6.59%). The majority of the installations were recorded in the commercial, agriculture, industrial and mining sectors (DoE, 2015).
4 Including 0.250 m3 /MWh required for the FGD operation
7
Discussion Document
Figure 2: Location of energy generation projects in the Limpopo Province
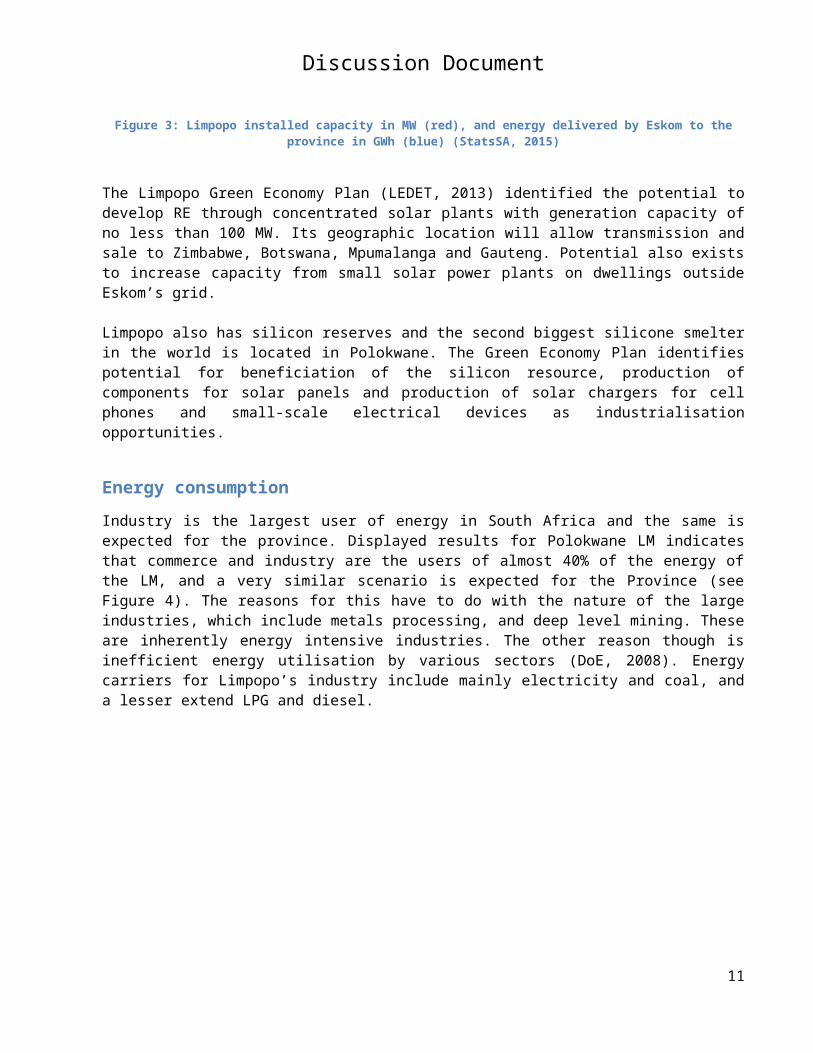
Table 2 and summarize the current state of the electricity generation projects in the Limpopo province. In spite of the promising solar and biomass resource, the share of renewable energy (RE) is still very small (<1%), with most of the RE projects being developed in the last two years and being of the Photovoltaic type. A representation of the province installed capacity and the Eskom electricity delivered is portrayed in Figure 3.
Table 2: Summary of electricity generation projects in the Limpopo Province at 2015
Name Type Installed capacity (MW) Online Capacity (MW)
Matimba Coal Power Station 3,900 3,900 82%Medupi Coal Power Station 4,800 800 17%Soutpan Solar-PV 28 28 0.6%Witkop Solar-PV 30 30 0.6%Tom Burke Solar-PV 60 Construction -PV Rooftop Solar-PV (off-grid) 0.28 0.28 0.01%Cronimet Solar-PV (off-grid) 1 1 -Tubase Pumped Storage 1500* *On hold -Total 8,818.28 4,758.28
8

Discussion Document
Table 3: Summary of electricity generation for the Limpopo Province
Description GWh
2014 electricity delivered by Eskom to the Limpopo Province5 11,9642014 electricity delivered by Eskom to the country5 231,4492015 estimated electricity generation in Limpopo6 24,1322015 estimated RE generation in Limpopo6 104RE production as percentage of provincial electricity consumption7 0.87%
2007 2008 2009 2010 2011 2012 2013 2014 2015 2016 2017 2018 2019 2020 -
2,000
4,000
6,000
8,000
10,000
10,000
11,000
12,000
13,000
14,000 Estimated
Limpopo installed capacity and electricity delivered by Eskom
Limpo
po e
lecit
ricity
gen
erati
on
- ins
talle
d ca
pacit
y (M
W)
Limpo
po e
lect
ricity
del
iver
ed
by E
skom
(GW
h)
Figure 3: Limpopo installed capacity in MW (red), and energy delivered by Eskom to the province in GWh (blue) (StatsSA, 2015)
The Limpopo Green Economy Plan (LEDET, 2013) identified the potential to develop RE through concentrated solar plants with generation capacity of no less than 100 MW. Its geographic location will allow transmission and sale to Zimbabwe, Botswana, Mpumalanga and Gauteng. Potential also exists to increase capacity from small solar power plants on dwellings outside Eskom’s grid.
Limpopo also has silicon reserves and the second biggest silicone smelter in the world is located in Polokwane. The Green Economy Plan identifies potential for beneficiation of the silicon resource, production of components for solar panels and production of solar chargers for cell phones and small-scale electrical devices as industrialisation opportunities.
Energy consumption
Industry is the largest user of energy in South Africa and the same is expected for the province. Displayed results for Polokwane LM indicates that commerce and industry are the users of almost 40% of the energy of the LM, and a very similar scenario is expected for the Province (see Figure 4). The reasons for this have to do with the nature of the large industries, which include metals processing, and deep level mining. These are inherently energy intensive industries. The other reason though is inefficient energy utilisation by
5 (StatsSA, 2015)6 Assuming 0.65 Capacity factor for Power Stations, 0.2 for PV and 0.1 for roof-PV. Medupi operations estimated only for the last quarter of the year.7 As % of total electricity delivered by Eskom to the province
9

Discussion Document
various sectors (DoE, 2008). Energy carriers for Limpopo’s industry include mainly electricity and coal, and a lesser extend LPG and diesel.
Figure 4: South African users of energy per type of sector in 2000 (left); and for the Limpopo LM in 2011 (right) (StatsSA, 2015; SALGA, 2013)
In terms of Liquid fuels8 (see Figure 5) the market share has been reduced across the province since 2010/11. The most significant reductions in volume between 2005 and 2013 happened in petrol and diesel. In terms of percentage, paraffin usage has been reduced by 82% since 2005, and LPG by 48% since 2011, this explained to the shift of household to electricity for heating and cooking. On the other hand, furnace oil, jet fuel and aviation gasoline have shown an increase in sales since 2005 (DoE, 2015).
2005 2008 2011 2012 2013 -
5,000
10,000
15,000
20,000
25,000
30,000
4.3% 4.4% 2.4% 3.2% 3.1%
National and provincial sales of liquid fuels
National Total Limpopo Total
Lite
rs (m
illio
ns)
2005 2008 2011 2012 2013 -
200,000,000
400,000,000
600,000,000
800,000,000
1,000,000,000
1,200,000,000
Provincial sales of liquid fuels per type of fuel
Jet Fuel Aviation Gasoline Diesel Petrol LPG Paraffin Furnace Oil
Figure 5: Liquid fuel sales for the Limpopo province compared with national sales (left), and disaggregated per type of fuel (right)
Household energy sourceThe main source of energy for the household sector is electricity (87%), this is a significant achievement from 64% in 2004 (StatsSA, 2012). According to Eskom, electricity distribution to Limpopo improved from 8571 GWh in 2002 to 13000 GWh in 2011, an increase of more than 40%. Percentage of households usingelectricity in the Limpopo Province per District Municipality Figure 6 displays the electrification levels per
8 Liquid fuels include: Jet Fuel, Aviation Gasoline, Diesel, Petrol, LPG, Paraffin and Furnace Oil.
10
Residential; 23%
Commerce and indus-
try; 39%
Local au-thority; 1%
Transport; 38%
Agriculture; 0%
Discussion Document
District Municipality and per type of area (i.e. tribal, urban, farm). The highest percentage is for the Mopani DM with 89%, and the lowest is Sekhukhune DM with 86%, still however above the national average of 84%.
Mopani Vhembe Capricorn Waterberg Greater Sekhukhune
National Average
0%
20%
40%
60%
80%
100%
Electrification percentajes per District Municipality
Tribal or Tradional area Urban area Farm
Figure 6: Percentage of households using electricity in the Limpopo Province per District Municipality (StatsSA, 2012)
It is the residential sector where the extreme inequalities of society are more vividly seen. Households where there is not, or can’t afford access to electricity, turn to wood, paraffin or coal amongst others so-called ‘dirty fuels’ to supply their needs for lighting, heating or cooking. The burning of these fuels is not only inefficient but has severe health consequences from indoor air pollution.
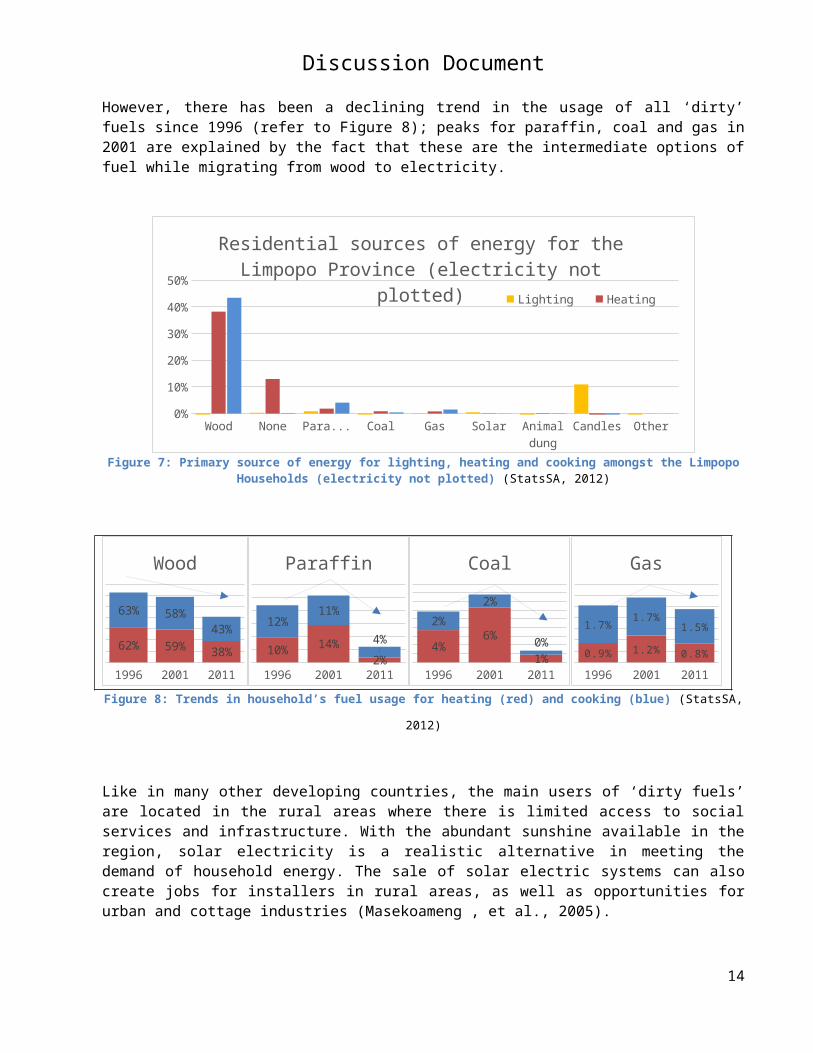
Figure 6 exposes the primary source of energy (excluding electricity) per type of activity in the provincial households as recorded in the 2011 census. Limpopo has the lowest rate of electricity use for cooking in the country (57%), followed by the Eastern Cape Province with 75% (StatsSA, 2015). Despite of the high electrification levels, wood is the main source of energy for cooking and heating (>38%) while paraffin and candles are mainly used for lighting.
Wood use is greater in the Vembe and Mopani DM, paraffin and gas are common in the Capricorn DM and coal is mainly used in the Sekhukhune DM. However, there has been a declining trend in the usage of all ‘dirty’ fuels since 1996 (refer to Figure 8); peaks for paraffin, coal and gas in 2001 are explained by the fact that these are the intermediate options of fuel while migrating from wood to electricity.
11

Discussion Document
Wood None Paraffin Coal Gas Solar Animal dung
Candles Other0%5%
10%15%20%25%30%35%40%45%50%
Residential sources of energy for the Limpopo Province (electricity not plotted)
Lighting Heating Cooking
Figure 7: Primary source of energy for lighting, heating and cooking amongst the Limpopo Households (electricity not plotted) (StatsSA, 2012)
1996 2001 2011
62% 59% 38%
63% 58%43%
Wood
1996 2001 2011
10% 14%2%
12%11%
4%
Paraffin
1996 2001 2011
4%6%
1%
2%
2%
0%
Coal
1996 2001 2011
0.9% 1.2% 0.8%
1.7%1.7%
1.5%
Gas
Figure 8: Trends in household’s fuel usage for heating (red) and cooking (blue) (StatsSA, 2012)
Like in many other developing countries, the main users of ‘dirty fuels’ are located in the rural areas where there is limited access to social services and infrastructure. With the abundant sunshine available in the region, solar electricity is a realistic alternative in meeting the demand of household energy. The sale of solar electric systems can also create jobs for installers in rural areas, as well as opportunities for urban and cottage industries (Masekoameng , et al., 2005).
4. Global Change Aspects
The combustion processes of fossil fuels release significant amounts of air pollutants and greenhouse gasses affecting health and influencing climate change. The changing climate is expected to have particularly grave consequences, leading to an increased number of “extreme” weather events, potential rises in sea level, and possible extinction of plant and animal species due to habitat loss. Activities of extraction, processing, distribution and transformation of fuels also imply depletion of natural resources, water contamination, erosion, acidification of the environment and degradation of ecosystems.
Matimba power station releases approximately 25 million tons of CO2 per year, equivalent to 5% of the national CO2 emission (WBI, 2014). Medupi in full operation is expected to add 32million CO 2. Matimba has
12

Discussion Document
the lowest relative emissions of 0.89 tons CO2 per MWh sent out (Eskom average= 1.04 ton CO2/MWh), and Medupi is expected to perform even more efficiently sat 0.75 tons CO2/MWh.
5. Responses
Since 1998 the national government has followed a remarkable path for the integration of renewables into the electricity mix. The 2010 Integrated Resource Plan for electricity estimates that the national electricity capacity should increase in 52 GW by 2030, of which 17.8 GW should be sourced from RE (34%). To achieve this goal a massive roll out of transmission infrastructure lead by Eskom has started, as well as the introduction of a bidding system (REIPP) to motivate the private investment on renewable generation. This bidding system has been ongoing for three years and has proved to be very successful attracting more than R192 billion rand investment.
At provincial level, the LEDET published the Limpopo Green Economy Plan (LGEP) in 2013. This plan is formulated with the aim of generating jobs, improving environmental quality and creating conditions for a green economy. The plan recognises the importance of energy in the economy and the potential for strengthening the green economy in the province.
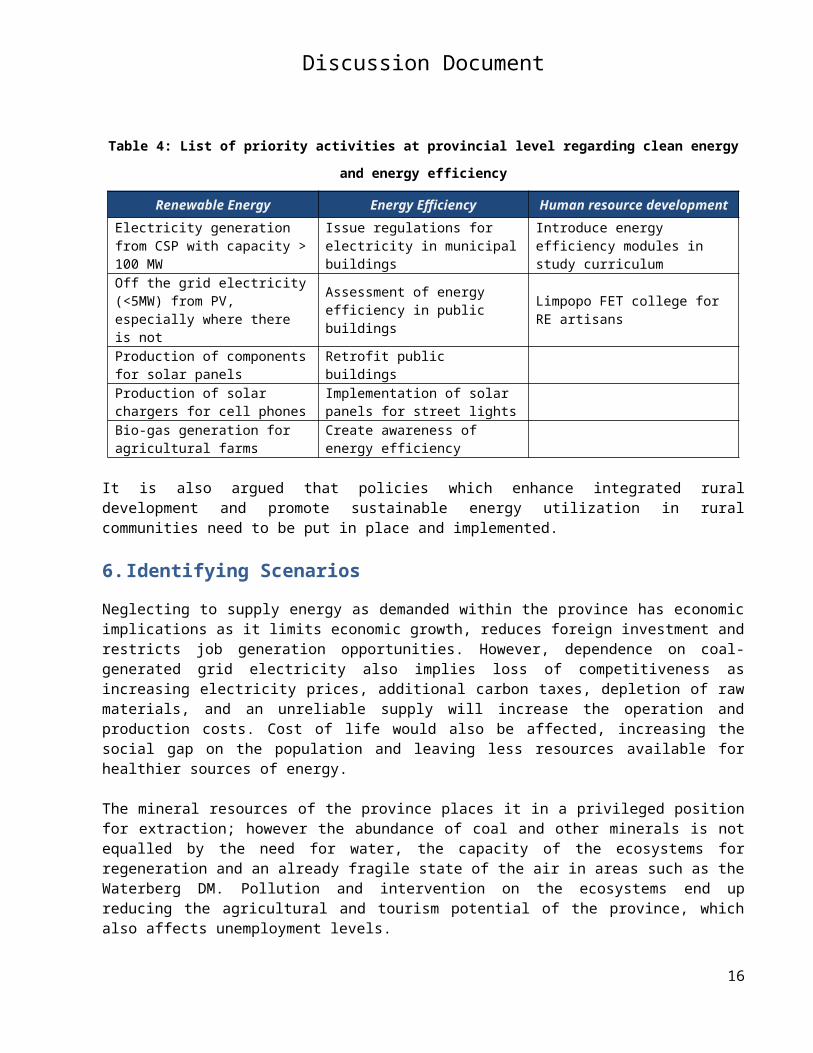
The LGEP identifies Renewal Energy, Energy Efficiency and Human resource development as key components to ensure energy security and the much needed employment opportunities in Limpopo. Details of their proposed strategies in terms of clean energy and energy efficiency are summarized in Table 4.
Table 4: List of priority activities at provincial level regarding clean energy and energy efficiency
Renewable Energy Energy Efficiency Human resource development
Electricity generation from CSP with capacity > 100 MW
Issue regulations for electricity in municipal buildings
Introduce energy efficiency modules in study curriculum
Off the grid electricity (<5MW) from PV, especially where there is not
Assessment of energy efficiency in public buildings Limpopo FET college for RE artisans
Production of components for solar panels Retrofit public buildings
Production of solar chargers for cell phones
Implementation of solar panels for street lights
Bio-gas generation for agricultural farms
Create awareness of energy efficiency
It is also argued that policies which enhance integrated rural development and promote sustainable energy utilization in rural communities need to be put in place and implemented.
6. Identifying Scenarios
Neglecting to supply energy as demanded within the province has economic implications as it limits economic growth, reduces foreign investment and restricts job generation opportunities. However, dependence on coal-generated grid electricity also implies loss of competitiveness as increasing electricity prices, additional carbon taxes, depletion of raw materials, and an unreliable supply will increase the operation and production costs. Cost of life would also be affected, increasing the social gap on the population and leaving less resources available for healthier sources of energy.
13
Discussion Document
The mineral resources of the province places it in a privileged position for extraction; however the abundance of coal and other minerals is not equalled by the need for water, the capacity of the ecosystems for regeneration and an already fragile state of the air in areas such as the Waterberg DM. Pollution and intervention on the ecosystems end up reducing the agricultural and tourism potential of the province, which also affects unemployment levels.
A more sustainable scenario for the Limpopo province comes from the implementation of renewable energy projects and the development of RE related components, driving more energy efficiency systems and skills development in RE related areas. below describes actions suggested for a null, minimal and maximum intervention scenario.
Table 5: Scenarios of intervention for energy related strategies
7.
Conclusions and Recommendations
The Limpopo’s energy supply relies mainly on coal-sourced electricity and liquid fuels. Although there is promising solar and biomass resources, the development and implementation of renewable energy projects is happening very slowly, and pressing needs are forcing the country to move towards the traditional technologies for supply of electricity.
Meeting the growing demand for energy in a safe and environmentally responsible manner is the key challenge that current society faces. As a result, the authorities in each region should take a special interest in different sources of energy and make suitable policies in this regard and find alternative, clean and efficient sources of energy. The province has programs in place as the Limpopo Green Economy Plan; however efforts should be focused on the structuration, implementation and allocation of resources to materialize the strategies suggested in the plan.
14
Scenario Description Actions Required Relevant Implementer
a) Nothing Changes
Minimum measures for control of impacts based on national requirements
- Provision of minimum resources (technical, financial and economic) for the licensing, monitoring and control of power generation facilities.
LEDETDMsLMs
b) Minimal Intervention
Provincial promotion of cleaner and energy efficient systems
- Incentive the usage of cleaner technologies - Energy efficiency assessment and retrofit of municipal facilities- Stimulate the development of RE projects- Roll-out of off-grid solar and biomass projects for rural areas - Support to Research and development in RE
LEDETLMsLDA
LDSD
c) Maximum Intervention
Local enforcement of cleaner and energy efficient systems
-Enforcement of energy efficiency & saving targets-Behaviour change through fiscal interventions-Set targets for electricity generation from RE- Develop financial incentives for the manufacture of RE components-Skills development
LEDETLPG LDE
LDPT

Discussion Document
Promising areas of improvement are the implementation of household scale RE technologies in remote rural areas, large scale solar and biomass energy facilities, and the promotion of energy efficiency programs. The gathering of accurate data on provincial energy is also important to be able to evaluate the performance. It is suggested that the province engage with large energy users and distributors on reporting mechanisms that will satisfy its need for information. The findings in this chapter suggest an outlook for the energy sector in the province, detailing aspects that can be considered, as presented in Table 6 below.
Table 6: Summary of the outlook for energy based on indicators considered
Indicators Considered Quantification TrendHousehold Energy Source 77% of households using electricity
for lighting in 2004 to 87% in 2011 Decreasing % of households using
‘dirty fuels for cooking and heating’
Improving
Trends in electricity consumption per sector
Mostly coal based electricity and liquid fuels
Industry and commerce are the main consumers
Petrol and diesel sales have decreased within the province, while there has been a slightly increase in aviation gasoline
Stable*(seems stable but there is not enough current information regarding energy consumption per sector to draw a trend)
Renewable energy production as percentage of total electricity consumption.
Not previous information in RE projects. Almost 1% of electricity demand is supplied from RE
Slowly improving
15
Discussion Document
8. References
CIA, 2014. CIA World Factbook. [Online] Available at: https://www.cia.gov/library/publications/the-world-factbook/rankorder/2233rank.html[Accessed 05 11 2015].
DoE, 2013. Draft 2012 Integrated Energy Planning Report, Pretoria: Department of Energy.
DoE, 2015. Overview of petrol and diesel market in South Africa between 2002 and 2013, Pretoria: Department of Energy - Directorate: Energy data collection, management and analysis.
DoE, 2015. State of Renewable Energy in South Africa , Pretoria: Department of Energy.
ESKOM, 2014. Medupi Power Station Project Fact Sheet February 2014, s.l.: ESKOM.
Inglesi-Lotz , R. & Blignaut, J., 2012. Estimating the opportunity cost of water for the Kusile and. Journal of Energy in Southern Africa, 23(4), pp. 76-84.
LEDET, 2013. Limpopo Greeen Economy Plan - Including Provincial Climate Change Response, Polokwane: Limpopo Department of Economic Development, Environment & Tourism.
Masekoameng , K., Simalenga , T. & Saidi, T., 2005. Household energy needs and utilization patterns. Journal of Energy in Southern Africa, p. Vol 16 No 3.
SALGA, 2013. Compilation of a state of energy reort for Polokwane Municipality, Polokwane: South Africa Local Goverment Association.
StatsSA, 2012. 2011 South Africa Census, Pretoria: Statistics South Africa.
StatsSA, 2015. 2014 General Household Survey, Pretoria: Statistics South Africa.
StatsSA, 2015. Electricity generated and available for distribution (Preliminary) December 2014, Pretoria: Statistics South Africa.
StatsSA, 2015. Environmental Economic Accounts Compendium, Pretoria: Statistics South Africa.
16


