List of Drivers and Barriers governing Soil Management by ...
180
This project has received funding from the European Union’s Seventh Framework Programme for research, technological development and demonstration under grant agreement no 289782 Project duration: January 2012 - December 2014 List of Drivers and Barriers governing Soil Management by Farmers, including Cost Aspects D4.434 Pronk, A.A, Bijttebier J., Ten Berge, H., Ruysschaert G., Hijbeek R., Rijk, B., Werner M., Raschke I., Steinmann, H.H., Zylowska, K., Schlatter N., Guzmán G., Syp A., Bechini L., Turpin N., Guiffant N., Perret, E., Mauhé, N., Toqué, C., Zavattaro L., Costamagna C., Grignani, C., Lehninen, T., Baumgarten, A., Spiegel, H., Portero, A., Van Walleghem, T., Pedrera, A., Laguna, A., Vanderlinden, K., Giráldez, V., Verhagen A. Submission date: May 22, 2015 Funded by the European Union Compatibility of Agricultural Management Practices and Types of Farming in the EU to enhance Climate Change Mitigation and Soil Health
Transcript of List of Drivers and Barriers governing Soil Management by ...

This project has received funding from the European Union’s Seventh Framework Programme for
research, technological development and demonstration under grant agreement no 289782
Project duration: January 2012 - December 2014
List of Drivers and Barriers governing Soil
Management by Farmers, including Cost
Aspects
D4.434
Pronk, A.A, Bijttebier J., Ten Berge, H., Ruysschaert G., Hijbeek R.,
Rijk, B., Werner M., Raschke I., Steinmann, H.H., Zylowska, K.,
Schlatter N., Guzmán G., Syp A., Bechini L., Turpin N., Guiffant N.,
Perret, E., Mauhé, N., Toqué, C., Zavattaro L., Costamagna C.,
Grignani, C., Lehninen, T., Baumgarten, A., Spiegel, H., Portero, A.,
Van Walleghem, T., Pedrera, A., Laguna, A., Vanderlinden, K.,
Giráldez, V., Verhagen A.
Submission date: May 22, 2015
Funded by the European Union
Compatibility of Agricultural Management Practices and
Types of Farming in the EU to enhance Climate Change
Mitigation and Soil Health

CATCH-C
No. 289782
Deliverable number:
22 May 2015
Page 2 of 180
The CATCH-C project aims at identifying and improving the farm compatibility of
sustainable soil management practices for farm productivity, climate-change mitigation, and
soil quality. The project is carried out by a consortium of 12 partners, led by Stichting Dienst
Landbouwkundig Onderzoek (DLO), The Netherlands.
Email: [email protected]
Internet: www.catch-c.eu
Authors of this report and contact details
Name: Annette Pronk Partner acronym: WUR-PRI
Address: P.O. Box 616, 6700 AP Wageningen, The Netherlands
E-mail: [email protected]
Disclaimer:
This publication has been funded under the CATCH-C project (Grant Agreement N° 289782)
within the 7th Framework Programme for Research, Technological Development and
Demonstration, Theme 2 – Biotechnologies, Agriculture & Food. Its content does not
represent the official position of the European Commission and is entirely under the
responsibility of the authors.
The information in this document is provided as is and no guarantee or warranty is given that
the information is fit for any particular purpose. The user thereof uses the information at its
sole risk and liability.
Information contained in this document will be part of the published papers of PhD students
and other authors collaborating to the project. The use of reported data or the reproduction of
tables and figures requires explicit authors' authorization for five years from the publication
date of the present document.

CATCH-C
No. 289782
Deliverable number:
22 May 2015
Page 3 of 180
Table of contents
Table of contents 3
General information 7
Executive summary 7
1 Introduction 11
1.1 Guide to readers 11
1.2 Background 11
1.3 Farm survey stratification 12
1.4 Farm survey methodology 17
2 Results: Drivers and Barriers per BMP 19
2.1 Rotation 19 2.1.1 BMP Crop Rotation 19 2.1.2 BMP Including Legume Crops in Rotation 25 2.1.3 BMP Land Exchange 28
2.2 Catch and cover crops and green manures 30 2.2.1 BMP Cover / Catch Crops / Green Manures 30 2.2.2 BMP Early Harvest of Maize to enable cover crops 38
2.3 Crop residue management 40 2.3.1 BMP Incorporation of Straw 40
2.4 Grazing 45 2.4.1 BMP Permanent grazing / rotational grazing / pastoral planning 45
2.5 Tillage and transport 47 2.5.1 BMP Non-Inversion / Minimum / Light Tillage 47 2.5.2 BMP No tillage / Direct Drilling 55 2.5.3 BMP Controlled Traffic Farming 58 2.5.4 BMP Low Soil Pressure Systems 60
2.6 Nutrient management 62 2.6.1 BMP Soil Analysis and / or making a Nutrient Management Plan 62 2.6.2 BMP Application of Organic Fertilizers 65 2.6.3 BMP Application of Farm Yard Manure 67 2.6.4 BMP Application of Compost 69 2.6.5 BMP Application of Reactor Digestate 71 2.6.6 BMP Spring Application of Manure on Clay 73 2.6.7 BMP Row Application of Slurry 75
2.7 Water management 77 2.7.1 BMP Sprinkler and Drip irrigation 77
3 Short term financial costs associated with the application of Best Practices 81
3.1 Methodology 81 3.1.1 Practices that affect the cultivation of a specific crop (First pathway). 81 3.1.2 When the BMP affects the crop rotation (Second pathway). 82
3.2 France 83

CATCH-C
No. 289782
Deliverable number:
22 May 2015
Page 4 of 180
3.2.1 INRA expertise on BMPs 84 3.2.2 Last, indirect costs have been estimated by INRA up to 16 €/ha for catch crops, and 17
€/ha for direct seeding, which is far from being negligible.Are cost barriers? 85 3.2.3 Conclusion (France) 87
3.3 Germany 88 3.3.1 BMP: Non-inversion tillage 88 3.3.2 BMP: Catch Crops 89 3.3.3 BMP: Crop Rotation 90 3.3.4 Conclusions (Germany) 90
3.4 Poland 92 3.4.1 BMP: Reduced tillage 92 3.4.2 Conclusion (Poland) 94
3.5 Spain 95 3.5.1 BMP: Direct drilling in Spain 95 3.5.2 BMP: Cover crops for controlling water erosion in permanent crop farms. The particular
case of olive trees 99 3.5.3 Conclusion (Spain) 102
3.6 The Netherlands 103 3.6.1 Non-inversion tillage 103 3.6.2 Conclusion (The Netherlands) 103
References 105
Appendix I: Overview of farmer views on drivers and barriers for best practices (BMPs) in soil
management 107
Appendix II: Farm survey Austria 111
FTZ 1A: Lower Austria (ENZ8_SL3+SL1_TXT2), FTZ 2M: Upper Austria (ENZ6_SL3_TXT3) and
FTZ 3C: Tirol (ENZ5_SL5_TXT2) 111
FTZ 1A: Lower Austria (ENZ8_SL3+SL1_TXT2) 112
FTZ 2M: Upper Austria, mixed farms (arable farms, ENZ6_SL3_TXT3) 115
FTZ 3C: Tirol, dairy cattle/permanent grassland (ENZ5_SL5_TXT2) 118
Appendix III: Farm survey Belgium (Flanders) 121
FTZ 4A: arable/specialized crop farms (ENZ7_SL2_TXT3) 121
FTZ 6C: dairy farms on sandy soils (ENZ7_SL1_TXT1) 126
FTZ 5M: mixed farms (vegetables-pigs, ENZ7_SL1_TXT2) 129
Appendix IV: Farm survey France 135
FTZ 13A: arable farms on Rendzina, Champagne Berichonne (ENZ7_SL2_TXT2); and FTZ 14C:
dairy farms on Cambisols and luvisols (long term grassland, ENZ7_SL2_TXT3) 135
FTZ 13A: arable farms on Rendzina, Champagne Berichonne (ENZ7_SL2_TXT2); FTZ 15A: arable
farms on Cambisols (ENZ12_SL3_TXT4); and FTZ 14C: dairy farms on Cambisols and luvisols
(long term grassland, ENZ7_SL2_TXT3) 137
Appendix V: Farm survey Germany 141
FTZ 7A: arable and mixed farms on sandy soil (ENZ4_SL1-TXT1) 141
FTZ 8A: arable/cereal and mixed farms on sandy soils (ENZ6_SL1_TXT1) 144

CATCH-C
No. 289782
Deliverable number:
22 May 2015
Page 5 of 180
FTZ 9A: arable/cereal and mixed farms on sandy soils (ENZ6_SL2+SL3_TXT3) 146
Appendix VI: Farm survey Italy 149
FTZ 16C: dairy cattle/temporary grass (ENZ12_SL1_TXT2,TXT1,TXT3) 149
FTZ 16A: arable/cereal (ENZ12_SL1_TXT1,TXT2_TXT3) 152
FTZ 17A: arable/cereal (ENZ12_SL3_TXT2; ENZ12_SL4_TXT2,TXT3) 156
Appendix VII: Farm survey Poland 161
FTZ 21A: arable farms (ENZ6_SL2_TXT3); FTZ 22M mixed farming (ENZ6_SL2_TXT1); and FTZ
23C: dairy cattle (ENZ6_SL1_TXT1) 161
FTZ 22M: mixed farming (ENZ6_SL2_TXT1) and FTZ 23C: dairy cattle (ENZ6_SL1_TXT1) 163
Appendix VIII: Farm survey Spain 165
FTZ 10A: Arable farms with cereals (ENZ13_SL1, SL2, SL3, SL4_TXT4) 165
FTZ 11P: Permanent crop farms (olive and fruit trees, vineyards, ENZ13_SL2,SL3,SL4_TXT3) 167
FTZ 12C: Mixed farms known as Dehesa (sheep, pigs and beef and permanent grass,
ENZ12_SL2,SL3,SL4_TXT2; ENZ13_SL3_TXT1; ENZ13_SL2,SL3,SL4,SL5_TXT2) 168
Appendix IX: Farm survey The Netherlands 171
FTZ 20C: Dairy farms on sandy soils (ENZ7_TXT1_SL1) 171
FTZ 18A: arable farms on clay soils (ENZ4,ENZ7_TXT2,TXT3_SL1); and FTZ 20A: arable farms
on sandy soils (ENZ4,ENZ7_TXT1_SL1) 174
FTZ 18A: arable farms on clay soils (ENZ4,ENZ7_TXT2,TXT3_SL1); and FTZ 20A arable farms on
sandy soils (ENZ4,ENZ7_TXT2,TXT3_SL1) 175
FTZ 18A: arable farms on clay soils (ENZ4,ENZ7_TXT2,TXT3_SL1) 178
FTZ 20A: arable farms on sandy soils (ENZ4,ENZ7_TXT1_SL1) 180


CATCH-C
No. 289782
Deliverable number:
22 May 2015
Page 7 of 180
General information Deliverable D4.434
Task(s) and Activity code(s): A4.3.3
Input from (Task and Activity codes): A4.2.1
Output to (Task and Activity codes): WP6
Related milestones: MS4.3.1
Suggested citation:
Pronk, A.A. et al., 2015. List of drivers and barriers governing soil management by farmers,
including cost aspects. CATCH-C “Compatibility of Agricultural Management Practices and
Types of Farming in the EU to enhance Climate Change Mitigation and Soil Health”,
www.catch-c.eu. 180 pp.
Executive summary
This report consists of two components: (i) an overview of drivers and barriers for the
adoption of so-called ‘Best Management Practices’ (BMPs) in soil management, as seen
through the eyes of farmers (the extensive Chapter 2); and (ii) an inventory of cost associated
with the implementation of certain BMPs at the farm (the brief Chapter 3).
The overview of drivers and barriers presented in Chapter 2 is based on a survey held among
10,000 farmers in different farm types across all CATCH-C partner countries, 2520 of whom
responded. The inventory of costs to implement BMPs is based on empirical information
collected by the research team in the project partner countries, through various channels.
The BMPs studied in the farmer survey include options for crop rotation, tillage, nutrient
management, crop residue management, water management, and grassland management. The
survey was carried out in 24 major ‘farm type x agri-environmental zone’ (FTZ) units across
eight partner countries, three per country. An FTZ unit is defined by the combination of an
agri-environmental zone (with climate, slope, and soil texture as keys) with a farm type
(arable-cereal, arable-specialised, dairy, mixed, etc.). The criteria to select FTZs for the farm
surveys were 1) representation of a large agricultural area, 2) large economic value of the
FTZ and/or 3) occurrence of soil degradation problems. In most agri-environmental zones,
one specific farm type was studied, or sometimes two. Our FTZ units were also called ‘major
farm types’ in other project documents.
To identify drivers and barriers for adopting Best Management Practices (BMPs), we applied
a behavioural approach, based on the Theory of Planned Behaviour (Ajzen, 1988; Ajzen,
1991), to identify the main barriers and drivers of farmers towards adoption of sustainable
management practices. The theory and details of the results obtained were extensively
reported in Deliverable D4.422 of the CATCH-C project (Bijttebier et al., 2014).
The intention of a farmer to implement a certain ‘BMP’ is determined by the degree to which
implementing the BMP is evaluated positively or negatively by the farmer (Attitude, A), the
feeling of social pressure from others (called referents) to perform or not perform a certain

CATCH-C
No. 289782
Deliverable number:
22 May 2015
Page 8 of 180
BMP (Subjective Norm, SN) and the subjective beliefs about the ease or difficulty of
successfully performing the BMP (Perceived Behavioural Control, PBC). In this approach,
Attitude is formed by the belief that the behaviour (e.g. ‘to perform ‘no tillage’) will be
associated with a set of outcomes (e.g., ‘no tillage reduces erosion’), weighted by a subjective
evaluation of these outcomes (e.g. ‘less erosion is very good’). Subjective Norm expresses
how much the farmer perceives that others (called referents, e.g. ‘neighbours’) think the
farmer should perform the behaviour (normative belief), weighted by the farmer’s motivation
to comply with those distinct referents. Finally, Perceived Behavioural Control is determined
by the belief that a set of control factors (e.g. weather conditions, input prices, available
equipment) facilitate or obstruct the behaviour (control beliefs), weighted by the expected
impact that these factors would have if they were present (perceived power; e.g. ‘in wet
autumn it is very difficult to incorporate crop residues’). Combining attitude, subjective norm
and perceived behavioural control, results in a positive or negative intention to actually
perform the behaviour. All these underlying subjective beliefs influence a farmers’ intention
to adopt a certain BMP, and are acting as cognitive drivers or barriers which encourage or
discourage the farmer to adopt a specific BMP. These constituent variables underlying the
aggregate variables A, SN, and PBC were reported and discussed separately for adopters and
non-adopters in the above-cited report D4.422.
In contrast, the current report is a concise overview of the most pronounced outcomes from
the survey, in terms of the aggregate variables (A, SN, PBC) alone, with a focus on the
highest scoring among these. Any of these (A, SN, PBC) can be a driver or a barrier. A
positive score defines the variable as a driver, a negative score as a barrier. Drivers may rank
from 0 to 10, barriers from -10 to 0. Where we state that one driver or barrier is ‘stronger’
than another, we mean that its absolute value is larger.
We qualified a driver / barrier as ‘strong’ if it meets two criteria simultaneously. For variables
of attitude: both the absolute value for Attitude AND for its underlying ‘belief strength’ are 3
or more. For variables of subjective norm: both the absolute value for Subjective Norm AND
its underlying ‘motivation to comply’ are 3 or more. For variables of Perceived Behavioural
Control: both the absolute value for Perceived Behavioural Control AND its underlying
‘control belief’ are 3 or more. These criteria were applied to the mean scores over all
respondents (to a particular question on a particular BMP in a particular farm type), adopters
and non-adopters merged. (As stated, contrasts were evaluated in report D4.422.).
In our study, strongest expressions among categories (A, SN and PBC) were usually in
category A. This holds both for drivers and barriers. Moreover, drivers were often stronger
than barriers. Nevertheless, many cases were found where they appeared equally strong.
Strong barriers were often found in categories A and PBC. Generally, variables of SN
category were weak, relative to A or PBC.
Where necessary, short explanations per BMP of the local context are given. It is important to
stress that all outcomes listed in this report are views (expectations, beliefs, judgements, etc.)
held by farmers, and are not necessarily congruent with scientifically proven outcomes from
experiments. Moreover, they have a local orientation because farmers were asked to judge
BMPs for compatibility with their own farming situation. Nevertheless, where many farmers
in different farm types and agri-environmental zones come up with similar evaluations of a
certain BMP, a common view or understanding can be expressed in terms of drivers and
barriers affecting uptake. In other cases, contrasts between FTZs illustrate that drivers or
barriers depend on specific local conditions.
This report includes a compressed overview table showing all major drivers and barriers per
BMP and farm type (see Appendix 1). Selected features illustrated by that table are briefly
discussed below.

CATCH-C
No. 289782
Deliverable number:
22 May 2015
Page 9 of 180
The first group of indicators relates to soil quality. Within this batch, all BMPs show (many)
more drivers than barriers. Expected beneficial impacts on soil indicators are drivers for
adopting the proposed BMPs. Farmers appear well aware of the benefits for soil quality.
(Here we can say ‘aware’ because views on expected beneficial impacts are endorsed by
scientific documentation, see Deliverables D3.324, D3.334, D3.344, D3.354, D3.364,
D3.371). Their evaluations of soil benefits often rank highest among driver scores, and refer
to the whole spectrum of commonly cited soil quality aspects (humus content, structure,
workability, rooting, fertility (nutrient supply), soil life, soil borne diseases control, erosion
control). In spite of overall benefits of most BMPs to a broad set of soil quality indicators,
strong barriers against certain BMPs exist, also within the set of soil quality indicators. Here,
the proposed BMPs deteriorate specific aspects of soil quality. Where this occurs, it often
relates to physical damage (structure, compaction) and related water dynamics (infiltration,
waterlogging, erosion).
The second batch of indicators relates to crop growth, produce quality and – in farms with
livestock – feeding. One set of BMPs shows predominantly drivers (beneficial effect on
production indicators). These BMPs are in the groups crop rotation, catch and cover crops
and green manures (CCCGM), legumes in the rotation, controlled traffic, nutrient
management, and water management. In contrast, the overall pattern for reduced tillage and
no-tillage is that they reduce yield and produce quality.
The third indicator group relates to crop protection. Crop rotation and CCCGM show
predominantly drivers, implying expected benefits in terms of reduced pest, diseases and/or
weed pressure. In contrast, these unwanted pressures are believed to increase by the
cultivation of legumes, reduced tillage, no-tillage, incorporation of crop residues, the use of
compost and digestates.
The next group represent impacts on farm inputs (water, fertilisers, biocides, labour, fuel) but
also equipment/machinery and storage capacity (for manures). These indicators, obviously,
play a central role in farm economy and organisation, but are sometimes judged in their own
right. For example, farmers often dislike an increased use of biocides irrespective of cost or
net benefits. This group as a whole shows a rather balanced pattern of drivers and barriers. A
BMP with predominantly drivers is crop rotation. A BMP dominated by barriers is the
cultivation of CCCGM. For reduced tillage and no-tillage, our results reflect the well known
trade-off between time and fuel saving on the one hand (drivers), and increased biocide use
and need for adapted machinery on the other (barriers).
In the group of financial indicators, reduced tillage and no-till are dominated by drivers. All
other BMPs show largely financial barriers, except in the special case of the Netherlands
where economic benefits are associated with the acceptance of organic manures by arable
farmers. (Note that – within this group - the lack of subsidies has been quoted in some
countries/farm types as a barrier, too.)
The next group contains a large and highly diverse set of indicators or (control) factors, that
farmers find themselves faced with. Virtually all outcomes here reflect barriers, rather than
drivers.
The next group consists of only two stakes: biodiversity and environment. Here we find
practically only drivers, but in very restricted numbers: only few FTZ units have expressed
these drivers clearly (we cannot exclude that this is in part due to the formulation of
questionnaires). ‘Environment’ was found relatively important in Belgium, France and The
Netherlands, while ‘biodiversity’ was important in Germany and Austria.
Finally, there is another set of mixed aspects, including legislation. This set is again filled
with both drivers and barriers. Some BMPs are drivers because they enable other practices

CATCH-C
No. 289782
Deliverable number:
22 May 2015
Page 10 of 180
preferred by farmers. Legislation is sometimes a driver, sometimes a barrier. See details in
following chapters.
Outcomes can also be classified by other schemes (Section 1.4). Barriers are of mostly
financial, agro-technical (‘physical’) or ecological (‘natural’) type. Some of them refer to
direct positive or negative impacts on soil quality (‘natural’). Risk plays an important role,
too, with reference to yield level, product prices, weather conditions (e.g. wet autumn, wet
spring) and occurrence of diseases. This type of barrier (risks) was often recorded in the PBC
category, and often refers to particular local control factors. For example, a BMP may
promote yield in general, but may reduce yield on heavy soils, or in cold years. Or may
promote yield of certain crops but not others. A fully consistent classification of all outcomes
remains difficult. For example, we found barriers caused by legislation that aims to address
environmental issues (e.g. nitrate leaching), but these could have been listed, instead, under
the stake ‘environment’ as well.
We believe that the inventory of drivers and barriers presented here provides a concise and
valuable complement to the more elaborate survey report by Bijttebier et al. (D4.422), and to
the outcomes from other work packages, notably those evaluating long term experiments and
the policy environment to soil management. Our survey outcomes reflect opinions and
beliefs, rather than measured fact, but many aspects of soil management discussed here are
hardly covered by the scientific literature. Moreover, while farmer views may provide no
substitute for proven fact, they are perhaps more relevant to the design of effective policies to
make soil management more sustainable. Finally, our outcomes refer to a very wide set of
farming conditions across Europe, which is hard to cover by long term experiments.
Chapter 3 presents an assessment of costs related to the implementation of specific BMPs,
collected from five CATCH-C partner countries. The key question is related to how costs for
a farmer change when changing to the BMP. A common methodology to assess these costs is
presented and applied to a range of farming systems in Europe. Because of structural
differences in farms and differences in how the BMP is implemented, a direct comparison
between countries remains difficult. The BMPs investigated were non-inversion / reduced
tillage, and cover / catch crops / green manures.
In general, moving from conventional to non-inversion / reduced tillage has a small positive
effect on the net return. Estimates vary from 0 to 20 € per ha for France and Poland, to 20 to
40 €/ha for Germany and The Netherlands. Most important cost factors are fuel consumption
and labour requirements. When converting to non-inversion / reduced tillage, costs for fuel
and labour generally reduce, while yields are often hardly affected and so net return will
increase. Implementing non-inversion / reduced tillage sometimes goes well with introducing
other BMP’s such as the incorporation of straw. This occurs for example in Poland.
Incorporation of straw – instead of selling – obviously results in loss of income. The
anticipated financial gain of implementing non-inversion / reduced tillage then seems too
small for farmers to adopt this practice.
Cultivating cover / catch crops and green manures costs money where clear financial benefits
are not identified. The additional costs are related to seed and labour to sow the cover / catch
crop / green manures. Only in Spain, spontaneous cover crops in olive orchards have some
financial benefits: the ‘practice’ implies skipping tillage operations that would otherwise be
carried out to keep the land bare between the trees; and sowing costs are avoided (relative to a
more active mode of cultivating cover crops). In other cases, cover / catch crops / green
manures may be financially unattractive in the short term, but farmers have other incentives
for this BMP. After all, our survey (Bijttebier et al., 2014) showed that adoption rates range
between 42% in Poland to 88% in Germany (i.e. these percentages of respondents apply the
practice on at least one of their fields). Such drivers are extensively documented in Chapter 2
of this report.

CATCH-C
No. 289782
Deliverable number:
22 May 2015
Page 11 of 180
1 Introduction
This section is largely based on the Introduction and Methods sections of deliverable D4.422
by Bijttebier et al. 2014 and parts are identical with those sections.
1.1 Guide to readers
This report consists of two main sections.
Chapter 2 and corresponding appendices constitute the main body of the report, presenting
the outcomes of an extensive farmer survey held in the major farm types of all CATCH-C
partner countries. This section can be read as a complement to the study D4.422 presented by
Bijttebier et al. (2015), and elaborates materials presented in the underlying national reports
from the partner countries. This report reduces the survey outcomes into concise lists of
drivers and barriers associated with a certain practice of soil management. Results are
presented per Best Management Practice (BMP), grouping together the outcomes from
different countries and farm types (FTZs) where the particular BMP was investigated. At the
end of each BMP section, a table with the three highest scoring drivers and barriers is
included. Detailed results grouped by country and – within countries – farm types with their
particular BMPs are included in Appendices II-IX. The nature (human, financial, natural etc.)
of all drivers and barriers is specified there, too.
Appendix 1 presents a summary table of the main survey results, where major drivers and
barriers are listed for each combination of BMP x FTZ, and are grouped into sets of
indicators or stakes that are affected by the BMP (e.g., a set of soil quality indicators, a set of
farm inputs, financial indicators, etc.).
Chapter 3 presents the results of our attempt to quantify the costs associated with the on-farm
application of selected BMPs. The material presented is based on an inventory held in
CATCH-C partner countries (literature; extension materials; expert opinion), independent
from the above farmer survey.
1.2 Background
During the past decades, so called best management practices (BMPs) have been proposed
to maintain or restore soil quality which is essential to the sustainability and resilience of the
farm. Nevertheless, compared to other regions in the world, the adoption of conservation
practices by European farmers is lagging and varies among different countries and even
among different regions within a country (Derpsch 2005; Lahmar 2010). Adoption rates are
dependent on the specific context of a region or a country, consisting of biophysical,
economic, social but also regulatory and institutional conditions (Stonehouse 1995). With
respect to European farmers, it has been suggested that they are generally not strongly
affected by the consequence of soil degradation and therefore unlikely to adopt some
conservation practices compared to other regions in the world (Van den Putte et al. 2010).
However, adoption rates also fluctuate in time caused by e.g., some unforeseen problems
after uptake of a new management practice or changes in economic conditions (Lahmar
2010). In this respect, the fundamentally changing EU’s common agricultural policy
accompanied by an increased social pressure, might increase the adoption of conservation
practices in Europe (Van den Putte et al. 2010). Nevertheless, to raise the uptake of
conservation practices, we need a better understanding of country and region specific
differences in adoption rates of BMPs. Therefore, it is necessary to investigate why farmers

CATCH-C
No. 289782
Deliverable number:
22 May 2015
Page 12 of 180
refrain from implementing practices that have proven to increase soil quality and
sustainability. The overall aim of the CATCH-C project is to identify and improve on-farm
compatibility of sustainable soil management practices for farm productivity, climate change
(CC)-mitigation and soil quality. Hence, the objective of this study is to investigate farmers’
barriers in adopting best management practices (BMPs) across Europe. Attitude and
behaviour towards new technologies, including soil conservation practices, have been
extensively studied in agriculture. While some studies described the distribution of benefits
and costs of adopting a management practice, other researchers studied correlations between
the adoption of conservation practices and a number of potential independent variables such
as age, land tenure, farm size, education level, etc. (Knowler & Bradshaw 2007). However, a
meta- analysis to integrate these variables into significant correlations revealed no causal
impact of variables such as farm size and land tenure on the adoption of conservation
practices (Knowler & Bradshaw 2007). Farmers’ attitudes towards specific conservation
practices have also been investigated in a socio-psychological manner by using a behavioural
approach, which refers to studies that employ actor-oriented quantitative methodologies for
the investigation of decision making (Burton 2004; Edwards-Jones 2006; Wauters & Mathijs
2013). This approach has been proven successful and offers a repeatable methodology which
is very valuable for performing attitudinal research in an wide European context and allows
us to identify the nature of the drivers and barriers in adopting BMPs. Beforehand, drivers
and barriers were anticipated to be of a financial kind of nature and therefore costs between
traditional management practices were compared to costs of the best management practice.
1.3 Farm survey stratification
Farmers’ views on drivers and barriers to implement BMPs were surveyed in all eight
CATCH-C partner countries, covering 24 Farm Type Zone units (FTZs). The FTZs are
characterized by land use and farm specialization (Andersen et al. 2007; EC 1985) and by
agri-environmental zones, defined by slope, soil texture (JRC soil map) and climate zone
(Metzger et al. 2005). The agri-environmental zones were described by Hijbeek et al (2013)
and are shown in Figure 1. The criteria to select FTZs for the farm surveys as well as the
methodology and data processing of these surveys, were described in detail by Bijttebier et al
(2015) and covers the major agricultural land use types in Europa (Figure 2). Some
characteristics of the selected Farm Type Zones (FTZ units) are presented in Table 1 and an
overview of the best management practices investigated per country is shown in Table 2.

CATCH-C
No. 289782
Deliverable number:
22 May 2015
Page 13 of 180
Figure 1: Overview of agri-environmental zones (AEZ) in which farm surveys were held (Bijttebier et al.
2015). Within AEZs, farm types (FTZ, see Table 1) were distinguished, usually only one FTZ but
occasionally two FTZs.
Figure 2: Overview of FTZs, in which farm surveys were held (Bijttebier et al. 2015)

CATCH-C
No. 289782
Deliverable number:
22 May 2015
Page 14 of 180
Table 1: Specialisation, land use and soil texture of each farm type zone (FTZ) (Bijttebier et al. 2015).
Country FTZ ID Farm specialization Land use Soil texture
Austria (AT) 1A arable (lowland) cereals medium soils
2M mixed (upland) all land use types medium soils
3C dairy cattle (Tirol) permanent grassland medium soils
Belgium (BE) 4A arable specialised crops medium fine soils
6C dairy cattle permanent grass coarse soils
5M mixed
(vegetable-pigs) all land use types medium soils
Germany (DE) 7A arable+mixed (NW) specialised crops coarse soils
8A arable+mixed (NE) specialised crops coarse soils
9A arable+mixed specialised crops medium fine soils
Spain (ES) 10A arable cereals fine soils
11P permanent crops permanent crops medium fine soils
12C beef and mixed cattle
+ sheeps and goats dehesa medium soils
France (FR) 13A arable cereals fine soils
14C dairy cattle temporary grass medium fine soils
15A arable cereals medium soils
Italy (IT) 16A arable (lowland) cereals coarse to medium fine soils
16C dairy cattle temporary grass coarse to medium fine soils
17A arable (upland) cereals medium and medium fine soils
The Netherlands
(NL)
18A arable specialised crops
and cereals medium and medium fine soils
20A arable specialised crops coarse soils
20C dairy cattle permanent grass coarse soils
Poland (PL) 21A arable cereals medium fine soils
22M mixed all land use types coarse soils
23C dairy cattle permanent grass coarse soils

CATCH-C
No. 289782
Deliverable number:
22 May 2015
Page 15 of 180
Table 2: Number of FTZs in which each BMP was selected in the participating countries. The last column
presents the overall number of FTZs where the BMP was included in the study (DE: German, AT: Austria,
PL: Poland, ES: Spain, FR: France, BE: Belgium, IT: Italy, NL: the Netherlands) (Bijttebier et al. 2015).
DE AT PL ES FR BE IT NL Total
Rotation
Crop Rotation 2 1 2 1 1 7
Including Legume Crops in Rotation 2 1 2 5
Land Exchange 1 1
Catch & cover crops / green manures
Catch / Cover Crops / Green Manures
(incl. underseeding & early maize harvest)
3 2 3 1 3 3 3 4 22
Grazing systems
Permanent Grazing / Rotational Grazing /
Pastoral Plan
1 1 2
Tillage and transport
Reduced / Non Inversion / Minimum /
Light tillage
2 1 3 2 3 3 2 3 19
No Tillage / Direct Drilling 1 3 2 6
Controlled Traffic Farming 1 1 1 3
Low Soil Pressure Systems 1 1
Nutrient management
Soil Analysis / Nutrient Management Plan 3 2 1 6
Application of Organic Fertilizer 1 2 3
Application of Farm Yard Manure 2 2
Application of Compost 2 1 3
Application of Reactor Digestate 2 2
Spring Application of Manure on Clay Soil 1 1
Row Application of Manure in Maize 1 1
Crop residue management
Straw Incorporation 3 1 3 2 9
Water management
Sprinkler & Drip Irrigation 2 2


CATCH-C
No. 289782
Deliverable number:
22 May 2015
Page 17 of 180
1.4 Farm survey methodology
To identify drivers and barriers for adopting Best Management Practices (BMP’s), we
applied a behavioural approach, based on the Theory of Planned Behaviour, to identify
the main barriers and drivers for farmers towards adoption of sustainable management
practices. According to the theory of planned behaviour, individual beliefs about a
behaviour or practice are believed to determine intention and behaviour (Ajzen 1988;
1991). The greater the intention to behave, the more likely one is to actually perform the
behaviour. The intention of a farmer to implement a certain ‘BMP’ is determined by the
degree to which implementing the BMP is evaluated positively or negatively by the
farmer (attitude), the feeling of social pressure from others (called referents) to perform or
not perform a certain BMP (subjective norm) and the subjective beliefs about the ease or
difficulty of successfully performing the BMP (perceived behavioural control) (Figure
3Error! Reference source not found.). According to the theory of planned behaviour,
ttitude is formed by the belief that the behaviour will be associated with a set of outcomes
(belief strength), weighted by an evaluation of these outcomes (outcome evaluation). The
latter is the value given by the farmer to this outcome: e.g. how important it is to him/her
to have good soil structure. Subjective norm is thought to be a function of how much we
perceive others (called referents) think we should perform the behaviour (normative
belief), weighted by our motivation to comply with these referents. Finally, perceptions of
behavioural control are determined by the belief that a set of control factors facilitate or
obstruct the behaviour (control beliefs), weighted by the expected impact that these
factors would have if they were to be present (perceived power). Combining attitude,
subjective norm and perceived behavioural control, results in a positive or negative
intention to actually perform the behaviour. All these underlying subjective beliefs
influence a farmers’ intention to adopt a certain BMP, and are acting as cognitive drivers
or barriers which encourage or discourage the farmer to adopt a specific BMP.
Figure 3: Theory of planned behavior, adapted from Ajzen (1991).
First, a face to face interviews were held with a limited set of farmers for each FTZ unit
(farm type), to select key BMPs relevant to their farm type, and to make an inventory of
the many aspects attached to that particular BMP. Based on these interviews, we
composed a tailored questionnaire per BMP, usually consisting of 40 to 60 questions
addressing the various aspects of that BMP. The questionnaires were then sent out to a
larger group of farmers which varied per country and farm type. The total number of

CATCH-C
No. 289782
Deliverable number:
22 May 2015
Page 18 of 180
farmers reached (all countries and farm types) was about 10,000. Farmers were requested
to return their responses either through regular mail or internet (depending on country /
region). We received the response forms from 2,520 farmers. The responses per question
were then processed following a standard protocol (Bijttebier et al., 2014) to yield a
positive (driver) or negative (barrier) score. The strongest score for a driver is +10, the
strongest score for a barrier -10. We qualified a driver / barrier as ‘strong’ if it meets two
criteria simultaneously. For variables of Attitude: both the absolute value for Attitude
AND for its underlying ‘belief strength’ are 3 or more. For variables of Subjective Norm:
both the absolute value for Subjective Norm AND its underlying ‘motivation to comply’
are 3 or more. For variables of Perceived Behavioural Control: both the absolute value for
Perceived Behavioural Control AND its underlying ‘control belief’ are 3 or more. These
criteria were applied to the mean scores over all respondents (to a given question on a
given BMP in a given farm type), adopters and non-adopters merged. (Contrasts between
the groups were evaluated in report D4.422). All scores presented refer to means.
Furthermore, each question (i.e., all questions within categories Attitude, Subjective Norm
and Perceived Behavioral Control) was classified (by the corresponding national project
team) to be of a natural, human, financial, physical or social kind of nature (Figure
4Error! Reference source not found.). These characterizations are listed in the tables
hat present the detailed outcomes per country (see Appendices II-IX for the respective
countries). This classification allows the grouping of drivers and barriers for later
applications. It also gives an explicit starting point for seeking ways to overcome barriers
via technical, social innovation or other pathways.
Figure 4: The Fan chart used to classify each question asked in the farmers interviews (after Carney
1998).

CATCH-C
No. 289782
Deliverable number:
22 May 2015
Page 19 of 180
2 Results: Drivers and Barriers per BMP
2.1 Rotation
2.1.1 BMP Crop Rotation
Belgium
- dairy farms on sandy soils (6C=ENZ7_SL1_TXT1)
Rotation maize-grass (N=189)
Rotation of maize with grass clover (181)
- mixed farms (5M=vegetables/pigs, ENZ7_SL1_TXT2)
Rotation of vegetables with cereals (N=41)
Germany
- arable and mixed farms on sandy soil (7A=ENZ4_SL1-TXT1); N=53
- arable/cereal and mixed farms on sandy loam and loam soils
(9A=ENZ6_SL2+SL3_TXT3); N=76
Italy
- dairy cattle/temporary grass (16C=ENZ12_SL1_TXT2,TXT1,TXT3)
Rotation with grass meadows (N=92)
Rotation with legume meadows (N=92)
- arable/cereal (16A=ENZ12_SL1_TXT1,TXT2_TXT3)
Rotation with legume ley crop (N=108)
The Netherlands
- dairy farms on sandy soils (20C=ENZ7_TXT0_SL1)
rotation grass-maize (N=46)
Spain
- arable farms with cereals (10A=ENZ13_SL1, SL2, SL3, SL4_TXT4); N=96
Drivers for Crop Rotation
Belgium
In dairy farming on sand, growing maize in rotation with grassland was compared to
maize monoculture. Drivers for the rotation are expressed stronger than barriers. Among
drivers, those of category A are strong, and are of both natural (increased soil fertility and
biological soil quality, and better weed control) and financial (increased maize yield)
nature. Low fertilization cost is also a driver.
Strong drivers for maize in rotation with grass-clover are free nitrogen (due to biological
N fixation) and associated reduction of fertiliser cost. Another driver is higher crude
protein in fodder.
For mixed farms on medium-textured soil, the practice of including cereals in vegetable
rotations was analysed. Among the drivers, those of category A were the strongest: higher
yields, improved soil quality (humus, structure, workability), less erosion, and ease of
sowing cover crops are all strong drivers.
Germany
For arable and mixed farms on sandy soils, the major drivers are again of category A:
improved soil quality (fertility, health), crop yields and yield stability, and prevention/less
escalation of pest and diseases and of certain problematic weeds all rank high as drivers.
Supporting bees and breaking labour peaks are listed, too.
CATCH-C
No. 289782
Deliverable number:
22 May 2015
Page 20 of 180
For arable/cereal and mixed farms on sandy loam and loam soils (central uplands), the
strong drivers are again of category A: higher yield, soil quality (humus), avoidance of
labour peaks, but also support to wildlife. Avoidance of nutrient deficiencies is a weaker
driver.
Italy
On dairy farms with temporary grassland, strong drivers for the inclusion of this crop in
the rotation are benefits to soil structure, lower need for herbicides and pesticides, better
feed ration for cattle, and better work distribution (labour peaks). All of these drivers are
of category A. High forage prices are a weaker driver (PBC).
Alternatively – on the same farm type – rotation with legume meadows scores still higher
for the above drivers (all strong), and has several additional strong drivers: higher crop
yields, soil fertility (besides soil structure) higher milk production, reduction of fertiliser,
reduction of protein purchase cost (expensive soy bean), high level and diversity of forage
production, lower insect and pathogen pressure in following crop. All of these are of
category A. Besides, feed advisors are positive about this practice (not strong). High soy
price and available expertise (growing alfalfa) are strong drivers of PBC category.
In arable/cereal systems, strong drivers for adopting legume leys in the rotation are of
category A: higher soil fertility and crop yields, reduced cultivation cost and less weed
pressure. An increase in pests, however, was recorded as barrier (albeit weak at -2.8, cf.
drivers scoring 3.2 to 7.5).
The Netherlands
In dairy farming on sandy soil, strong drivers for growing grass and maize in rotation
rather than both crops as monocultures are higher yields in both crops, better fodder
quality, and reduction of soil borne diseases. Re-sowing improves sod quality. Besides
(weaker driver), an advantage to this rotation particular to Dutch legislation is that
plowing-up grassland (for re-seeding) is allowed only in spring. Cultivating first maize
upon such plowing-up enables to re-seed the grassland in August, when establishment is
better due to lower weed pressure.
Extension opinion is positive, as are outcomes from research. Arable farmers support the
practice, too. All of these referents have strong SN values.
Spain
Strong drivers for crop rotation in cereal-based arable systems are better control of pest,
diseases and weeds; better soil nutrient storage and environmental quality; and better
financial profit. Farmer associations are a positive driver for rotations. Weaker drivers are
push by the CAP, and the fact that fallow fields are not appreciated socially.
Barriers for Crop Rotation
Belgium
In dairy farming on sand, a strong barrier is high residual soil nitrate levels in autumn for
maize after grassland. (farms are monitored in Belgium for this parameter, and can receive
penalties for high values). The dispersed geographical position of fields (far from farm
house) is a barrier, too.
For rotation with grass-clover, the fact that protein feeds are expensive seems insufficient
trigger to adopt the rotation. Barriers for rotation with grass-clover are the higher cost of
crop protection (strong), and the sensitivity of clover to some herbicides.

CATCH-C
No. 289782
Deliverable number:
22 May 2015
Page 21 of 180
For mixed farms on medium-textured soil, strong barriers to the practice of including
cereals in vegetable rotations are of category A (low financial return of cereals; additional
fertiliser cost), but also of category PCB (wet weather conditions; cereal price).
Interestingly, unwanted attraction of pigeons is mentioned, too.
Germany
For arable and mixed farms on sandy soils, the major barrier is of financial nature (higher
cost; variable gross margin; high land rent); negative pressure from advisors and other
farmers also discourages rotation. A ‘barrier’ perhaps exclusive to the German situation is
that there is no alternative to maize as bio-energy crop (subsidised).
For arable/cereal and mixed farms on sandy loam and loam soils (central uplands), there is
one very strong barrier: ‘my farm is not organic’ (score -7.2). This is somewhat
problematic to interpret.
Other barriers recorded are (not strong) that some crops have low yields, and that work
load is higher. SN is negative (strong) from fellow farmers and extension.
Italy
On dairy farms with temporary grassland, barriers (relatively weak) are the consumption
of irrigation water, and the cost for meadow cultivation. Also, earnings to be made with
selling maize was found to be a barrier (not strong). For rotation with legume meadows in
these systems, no clear barriers were found.
In arable systems, barriers to including a legume ley in the rotation are the cost of specific
machinery (strong), and increased pest incidence (almost strong).
The Netherlands
In dairy farming on sandy soil, strong barriers for growing grass and maize in rotation are
physical damage to the soil (due to maize harvest under wet conditions); also loss of SOC
(as compared to grassland) is a strong barrier. Strong barriers of financial nature are the
cost of plowing and re-seeding, and lower grass yield and protein content in the first year
of grassland phase. A barrier of the PBC group (not strong) is that poorly drained fields
are kept in continuous grassland only.
Spain
No strong barriers were recorded for crop rotation in cereal-based systems.


CATCH-C
No. 289782
Deliverable number:
22 May 2015
Page 23 of 180
Table 3: The top three of drivers and barriers per FTZ unit for BMP Crop Rotation (A = attitude, PBC = perceived behavioural control).
Drivers Barriers
Country FTZ question Value Type Nature Question Value Type Nature
BE dairy farms on
sandy soils
6C
Increased soil activity, biology 5.4 A Natural
Often too high nitrate residue in autumn when grassland is
followed by maize -4.5 A Natural
Increased soil fertility 5.9 A Natural Most of the parcels are not close to the farm -2.8 PBC Physical
Less weeds 4.8 A Natural Soil texture and quality are more appropriate for grass -2.3 PBC Natural
mixed farms
(vegetables /pigs)
5M
Less damage to soil structure 7.2 A Natural Wet weather conditions -5.3 PBC Natural
Higher yields 6.6 A Financial Low prices for cereals -4.9 PBC Financial
More humus 5.8 A Natural Yield of cereals is low -4.7 A Financial
DE arable and mixed
farms on sandy
soil
Increase soil fertility 5.9 A Natural Crops that vary widely in respect to their gross margin -4.3 PBC Physical
Support soil health 5.4 A Natural High land rents -4.3 PBC Financial
Avoiding certain problematic weeds 4.9 A Social Considerable higher costs* -3.9 A Financial
arable/cereal and
mixed farms on
sandy soils
Higher yields 5.9 A Natural My farm is not organic -7.2 PBC Physical
Maintenance of humus content 5.4 A Natural I have plots that are far away -2.9 PBC Physical
Mutual facilitation of crops within
the crop rotation 5.3 A Natural
I do not have a high range of different market and
utilization opportunities for a lot of different crops -2.9 PBC Financial
IT dairy
cattle/temporary
grass
Improve soil structure 5.9 A Natural High irrigation amount needed -2.7 A Natural
Less insecticide needed 5.0 A Physical Cost for meadow cultivation -2.2 A Financial
Less herbicide needed 5.0 A Physical High selling price of maize -2.1 PBC Financial
NL
dairy farms on
sandy soils
The rotation of grass-maize favours
yields of both crops 8.1 A Financial
Harvesting maize when fields are very wet causes
physical damage to the soil -9.0 A Natural
The rotation of grass-maize
improves the quality of the fodder 7.3 A Financial
Costs of ploughing and the establishment of the sod are
high -6.2 A Financial
Regular resowing of grass improves
the sod 6.7 A Natural
The rotation of grass-maize decreases soil organic matter
content -4.9 A Natural
ES Arable farms with Pests, diseases and weeds are better 4.7 A Natural Assessment on markets and profitable crops is needed -1.6 PBC Human

CATCH-C
No. 289782
Deliverable number:
22 May 2015
Page 24 of 180
cereals controlled
It enhances the storage of nutrients
within the soil 4.4 A Natural Benefits and profitability are reduced -1.6 A Financial
Environmental quality is improved 4.1 A Natural Weather conditions are very variable -1.1 PBC Natural

CATCH-C
No. 289782
Deliverable number:
22 May 2015
Page 25 of 180
2.1.2 BMP Including Legume Crops in Rotation
Austria
- Lower Austria arable farms (1A=ENZ8_SL3+SL1_TXT2); N=20
- Upper Austria mixed farms (2M=ENZ6_SL3_TXT3); N=7
Belgium
- dairy farms on sandy soils (6C=ENZ7_SL1_TXT1); N=181
Italy
- dairy cattle/temporary grass (16C=ENZ12_SL1_TXT2,TXT1,TXT3) Rotation with legume meadows (N=92)
- arable/cereal (16A=ENZ12_SL1_TXT1,TXT2_TXT3)
Rotation with legume ley crop (N=108)
For Belgium, the BMP Legume Crops coincides with ‘Rotation of maize with grass-
clover’; outcomes listed are therefore identical to those in section 2.1.1 (Rotation).
For Italy, the BMP Legume Crops coincides with ‘Rotation with legume meadows’
(dairy) and Rotation with legume ley crop (arable) as specified in section 2.1.1 (Rotation);
outcomes listed on these practices are therefore identical.
Drivers for Including Legume Crops in Rotation
Austria
In Lower Austria (arable), virtually all drivers are of category A and type ‘natural’: better
soil structure, soil cultivation is easier, good deep loosening of the soil, positive effects on
growth and uniformity of other crops, wider crop rotation, and feed value to cattle are all
strong positive drivers. Weaker drivers of SN or PBC type are GM-free feeding, social
demand (population), and lack of feed protein in the ‘inland’.
In Upper Austria (mixed farms), strongest drivers are again in Category A, and here they
are of mixed type (natural, financial, physical). Strong drivers are contribution to soil
fertility (nitrogen, humus) and to feed protein supply, higher feed nitrogen content, good
for next crop (winter cereals), and lower production cost (less fertiliser (strong); less
labour and pesticides (both not strong)). The fact that same production technology as for
grain can be used was also recorded as driver. There is however a long suite of barriers
(see below).
Belgium
In dairy farming on sand, drivers for maize in rotation with grass-clover are free nitrogen
(due to biological N fixation) and associated reduction of fertiliser cost (strong); and
higher crude protein in fodder.
Italy
On dairy farms with temporary grassland, there are many strong drivers for the inclusion
of legume meadows in the rotation: benefits to soil structure, lower need for herbicides
and pesticides, better feed ration for cattle, better work distribution (labour peaks), higher
crop yields, soil fertility (besides soil structure) higher milk production, reduction of
fertiliser, reduction of protein purchase cost (expensive soy bean), high level and diversity
of forage production, lower insect and pathogen pressure in following crop. All of these
are of category A. Besides, feed advisors are positive about this practice (not strong),
High soy price and available expertise (growing alfalfa) are strong drivers of PBC
category.
CATCH-C
No. 289782
Deliverable number:
22 May 2015
Page 26 of 180
In arable/cereal systems, strong drivers for adopting legume leys in the rotation are of
category A: higher soil fertility and crop yields, reduced cultivation cost and less weed
pressure. An increase in pests, however, was recorded as barrier (albeit weak at -2.8, cf.
drivers scoring 3.2 to 7.5).
Barriers for Including Legume Crops in Rotation
Austria
In Lower Austria, strong barriers (although weaker than drivers) are again of category A
but are (in contrast to drivers) mostly of ‘financial’ type: strong yield fluctuation, seed
cost, poor marketability. Also, difficulties of crop management, higher pesticide use, poor
seed quality, and lack of ‘stable varieties’ are quoted as barriers (none of them strong).
In Upper Austria (mixed farms), strongest barriers are in Categories A and PBC. They are
of mostly natural and financial types. Foremost of all is the increased erosion risk (A=-7).
Pest pressure is another important ‘natural’ and strong barrier. Other strong barriers are
financial (low margin; yield fluctuation; yield decline over years; not competitive), and
increased complexity. Seed cost, low market demand, and weather dependency (years
without reaching maturity) are weaker barriers of Category A. Strong barriers are also
mentioned in the PBC category: yield uncertainty and late maturity, low market price, and
high precipitation. Other barriers are lack of good varieties (‘breeding’) and lack of
effective pesticides.
Belgium
For rotation with grass-clover in dairy farming on sand, the fact that protein feeds are
expensive seems insufficient trigger to adopt the rotation. Barriers for rotation with grass-
clover are the higher cost of crop protection (strong), and the sensitivity of clover to some
herbicides.
Italy
On dairy farms with temporary grassland, no clear barriers were found against rotation
with legume meadows.
In arable systems, barriers to including a legume ley in the rotation are the cost of specific
machinery (strong), and increased pest incidence (almost strong).

CATCH-C
No. 289782
Deliverable number:
22 May 2015
Page 27 of 180
Table 4: The top three drivers and barriers per FTZ unit for BMP Legume crops (A = attitude, PBC = perceived behavioural control).
Drivers Barriers
Country FTZ question Value Type Nature Question Value Type Nature
AT
arable farms
Positive previous crops 6.9 A Natural Strong yield fluctuations -5.0 A Financial
Better soil structure 6.5 A Natural Expensive seeds -4.8 A Financial
Fixation of nitrogen 6.3 A Natural Bad marketing -4.5 A Financial
mixed farms
(arable farms)
Increased nitrogen content 7.3 A Natural Increased risk of erosion -7.0 A Natural
Support the soil fertility 6.7 A Natural Poor contribution margin -6.7 A Financial
Contribution to the local protein supply 6.5 A Physical Strong fluctuations in yield -6.7 A Financial
BE dairy farms on
sandy soils
Less use of mineral fertilizers 4.2 A Financial Higher costs for crop protection -4.4 A Financial
N fixation 3.3 A Natural Purchase of feed protein is expensive -2.5 PBC Financial
More crude protein in grass silage 2.8 A Natural Grassland is intensively cultivated on my farm -2.5 PBC Physical
IT dairy
cattle/tempora
ry grass
Increase crop yield 7.4 A Natural no barriers
Increase soil fertility 6.7 A Natural
Increase of milk production 6.4 A Natural
arable/cereal
Increased soil fertility 7.5 A Natural Machineries are expensive -3.2 PBC Financial
Higher crop yield 6.9 A Natural More pests -2.8 A Natural
Increased soil nitrogen availability 6.5 A Natural Cereals have high price -1.6 PBC Financial

CATCH-C
No. 289782
Deliverable number:
22 May 2015
Page 28 of 180
2.1.3 BMP Land Exchange
Belgium
- mixed farms vegetables-pigs (5M=ENZ7_SL1_TXT2)
Land Exchange (N=101)
Drivers for Land Exchange
Belgium
All strong drivers for this practice are of category A and are of different types (financial,
natural, physical): higher yields, less soil depletion, less diseases, more options for
rotation, better nutrient balance.
Barriers for Land Exchange
Belgium
Many barriers are expressed of the following rated ‘strong’. Besides damage to soil
structure and increase in specific weeds on own land, farmers face the situation that many
surrounding farmers grow the same crops. Also, farmers are satisfied with their own
rotation (no need for exchange) and don’t seem to benefit financially. Farmers are not sure
(PBC category) about how others will treat their land, nor about the quality of land they
get in return (notably pH concerns). The distance may act as a barrier, too.

CATCH-C
No. 289782
Deliverable number:
22 May 2015
Page 29 of 180
Table 5: The top three drivers and barriers per FTZ unit for BMP Land exchange (A = attitude, PBC = perceived behavioural control).
Drivers
Barriers
Country FTZ question Value Type Nature Question Value Type Nature
BE mixed farms
(vegetables/pigs)
Higher yields 6.0 A Financial Less good structure of my soil -5.1 A Natural
Decreases soil depletion 5.4 A Natural Additional source of revenues -4.7 PBC Financial
More possibilities for crop rotation 4.9 A Physical My rotation scheme is good -4.2 PBC Physical

CATCH-C
No. 289782
Deliverable number:
22 May 2015
Page 30 of 180
2.2 Catch and cover crops and green manures
2.2.1 BMP Cover / Catch Crops / Green Manures
Austria (Cover/Catch Crops/green manures):
- Lower Austria arable farms (1A=ENZ8_SL3+SL1_TXT2); N=15
- upper Austria mixed farms (2M=ENZ6_SL3_TXT3); N=6
Belgium (cover crops)
- arable/specialized crop farms (4A=ENZ7_SL2_TXT3); N=196
- dairy farms on sandy soils (6C=ENZ7_SL1_TXT1); N=198
- mixed farms vegetables-pigs (5M=ENZ7_SL1_TXT2); N=101
France (catch-crops/cover crops)
- arable farms on Rendzina (13A=ENZ7_SL2_TXT2); N=16
- dairy farms on Cambisol and Luvisol (14C=ENZ7_SL2_TT3); N=17
Germany
- arable and mixed farms on sandy soil (7A=ENZ4_SL1-TXT1); N=60
- arable/cereal and mixed farms on sandy soils (8A=ENZ6_SL1_TXT1); N=96
- arable/cereal and mixed farms on loamy/clay soils (9A=ENZ6_SL2+SL3_TXT3);
N=80
Italy
- dairy cattle/temporary grass (16C=ENZ12_SL1_TXT2,TXT1,TXT3); N=91
- arable/cereal (16A=ENZ12_SL1_TXT1,TXT2_TXT3);N=109
- arable/cereal (17A=ENZ12_SL3_TXT2; ENZ12_SL4_TXT2,TXT3); N=92
Poland
- arable farms (21A=ENZ6_SL2_TXT3), N= 93
- mixed farming (22M=ENZ6_SL2_TXT1) N=68
- dairy cattle (23C=ENZ6_SL1_TXT1) N=140
Spain
- Permanent crop farms (olive and fruit trees, vineyards)
(11P=ENZ13_SL2,SL3,SL4_TXT3) N=150
The Netherlands
- dairy farms on sandy soils (20C=ENZ7_TXT0_SL1);
undersowing of green manures under maize; N=49
early maize harvest in favour of green manures; N=51
- arable farms on clay soils (18A=ENZ4,ENZ7_TXT2,TXT3_SL1) ; N=95
- arable farms on sandy soils (20A=ENZ4,ENZ7_TXT1_SL1); N=132
Drivers for Cover / Catch Crops / Green Manures
Austria (cover/catch crops/green manures)
On arable farms, strong drivers are of category A and type Natural: reduced erosion, better
rooting, soil fertility, humus, soil life, nitrogen fixation, water storage over winter, value
for insects, relaxing for crop rotation. Strong drivers in the PBC category are available
machinery, sufficient precipitation, cheap seeds, and similar seeding technology as for
other crops (e.g. cultivator).
In upper Austria (mixed farms), strong drivers of category A are same as above. Weaker
drivers are reduction of soil borne diseases, and early tillage (seems in conflict with
barrier of slow spring warming). Strong drivers are also found in category PBC: financial

CATCH-C
No. 289782
Deliverable number:
22 May 2015
Page 31 of 180
support by ÖPUL, the presence of early harvested crops (barley), and availability of well-
adapted varieties. Crop experts are very positive (SN=5.43).
Belgium (cover crops)
In arable farms, strong drivers are improved soil (structure, health, nitrogen, carbon),
lower erosion risk, less nitrate leaching, weed suppression, earlier tillage in spring, and the
opinion of fellow farmers (SN). For the dairy farms roughly the same drivers are reported
(all strong). Additional strong drivers are better rooting and yield of next crop, and less
soil compaction. A subsidy compensates for extra cost (type PBC) and government
encouragement (SN) counts as driver, too.
Most of the above drivers (given for arable, dairy) hold equally strong in mixed farms,
where better aeration and drainage, and easier spring tillage (only for non-graminoid
cover crops) are mentioned as additional strong drivers. Subsidy was no driver in mixed
farms.
France (catch-crops/cover crops)
In both arable and dairy farms, strong drivers for catch-crop implementation are a
decrease of the weeds pressure, an improvement of the biological activity of the soil, an
increase of the organic matter content, and an improvement of top layers porosity and soil
structure stability. All these drivers belong to category A. On the environmental side of
category A drivers are also an impact on decrease of run-off and erosion (only for arable
farm for the latter).
Specific drivers for arable farms are on the economic group of category A drivers with a
decrease of herbicides and fertilisation costs. They are associated with a better water
storage, that in turn decreases irrigation needs in these shallow soils. A strong driver is the
limitation of soil borne diseases.
The dairy farms we have surveyed are located in vulnerable zones, where covering the
soils in winter is mandatory. Farmers have two options, modify their rotations to include
more winter crops, or implement catch-crops. Besides being mandatory, specific drivers
towards implementation of catch-crops are the improvement of the following crop, and
the crops in the succession. In line with the vulnerable zone stakes, dairy farmers mention
that catch-crops mitigate nitrate issues and facilitate the reasoning of the N fertilisation.
For the two groups of farms, there are no drivers from the SN category. In the PBC
category, a lack of OM and the heterogeneity of the soils are drivers in arable farms, but
not in dairy farms (that suffer less from low SOC, because of animals).
Germany (cover crops)
On arable and mixed farms on sandy soil in the North-West, strong drivers are higher soil
fertility and humus content, less erosion and nutrient leaching, food and shelter for
wildlife, and soil drying. Also, cover crops allow slurry application and so reduce required
slurry storage capacity. All of these are strong drivers of category A.
On arable and mixed farms on sandy soil in the North-East, the same strong drivers are
mentioned, but scores are higher, notably various aspect of soil quality, workability and
erosion. Facilitation of bees is an extra and well-expressed driver. Training is a driver of
the SN category.
On the finer textured soils of central/south regions, major drivers are again in category A
and of type Natural. Besides the above benefits for soil quality, strong drivers cited are

CATCH-C
No. 289782
Deliverable number:
22 May 2015
Page 32 of 180
better soil life, soil aeration, and workability, and weed suppression. Faster spring
warming is a weaker driver.
Italy (green manures)
On dairy farms with temporary grassland, strong drivers for green manures are soil
improvement (structure, humus), nutrient retention and fertiliser saving, and less weed
pressure. In arable/cereal systems, higher yields are an additional strong driver. For the
third farm type in the Italian study (arable/cereal in accidented terrain) less erosion is a
strong driver, as well as increased protein in following crops (in addition to the above soil
benefits and fertiliser saving, all strong).
Poland (cover crops)
In all three farm types, soil fertility, organic matter and structure, and reduced erosion are
strong drivers of category A. In the SN category, another strong driver is the opinion of
advisors. For arable and mixed systems, better soil biological activity and soil
phytosanitary condition, higher yields and lower fertiliser cost are strong drivers, too.
Spain
Cover crops were evaluated in Spain only for use in permanent crops (trees, vineyards).
Here, strong drivers are erosion control, and better water retention and soil properties
(category A). Technicians and farmers associations also encourage cover cropping
(category SN).
The Netherlands
In dairy farms on sandy soil, drivers for (undersown) catch crops in maize are strong and
of category A and mixed type (natural, financial, human): improved nutrient efficiency,
N-availability to next crop, preventing N loss, soil organic matter. Increased soil bearing
strength (machinery) is a strong driver, too, as is the saving on fields later in the season.
Still in dairy farming: early harvest of maize in favour of green manures has strong
drivers: better development of the green manure, therefore more contribution to soil
organic matter, more N interception, facilitates re-establishing the grass sod, and better
nitrogen availability. On wet parcels: avoiding soil damage by late maize harvest. There
are strong barriers, however (see below).
In arable farming (same for both clay and sand), strong drivers for green manures are soil
improvement (soil N supply, structure, workability), organic matter, soil fauna, less
erosion (wind, water) and less nitrate leaching. All of these are of category A, type
Natural. There are strong drivers, too, in the SN category, again same for both sand and
clay: extension, clubs, magazines, seed providers all encourage green manuring. A
preference to plow down cereal straw seems to support this practice (PBC category,
strong).
Barriers for Cover / Catch Crops / Green Manures
Austria(cover/catch crops/green manures)
On arable farms (Lower Austria), strong barriers are financial: higher cost, fuel use, and
lower income. It was also recorded that more crop protection is needed, that there is risk
of failure, and that residues may be difficult to handle (none of them strong barriers).

CATCH-C
No. 289782
Deliverable number:
22 May 2015
Page 33 of 180
In upper Austria (mixed farms), strong barriers are of various types (financial, natural,
physical): more demanding weed management, retarded spring soil warming, higher costs,
overwintering of fungal diseases. Other barriers (not strong) are difficulties with seed
placement (A), and availability of technical equipment (PBC).
Belgium (cover crops)
In arable farms, weak barriers are increased herbicide use, short time window after harvest
for sowing (1 Sept.), and lack of appropriate machinery for sowing and incorporation.
For the dairy farms, strong barriers are bad weather in autumn (PBC), labour demand, and
too dry soil in spring (in case of graminoid cover crop as rye or rye grass).
For mixed farms, additional barriers are bad autumn weather (PBC; strong), increased cost
and herbicide use (after graminoids), and discouragement by contract workers (SN).
France (catch-crops/cover crops)
The main barriers towards implementation are of SN category, while neither accountants,
advisors, family nor fellow farmers are favourable of the implantation of catch-crops.
PCB barriers are all of low importance.
In arable farms, the risk of lower yields, the increase of fuel and mechanisation costs,
work load, difficulty to destroy the crop and complexification of the nitrogen fertilisation
reasoning are the main barriers, all from category A.
In dairy farms, barriers are of environmental type, with a shallow risk of erosion
(especially in early autumn or during wet springs). Fuel, mechanisation and seed costs are
also quoted, and might prevent adoption if the catch-crops weren’t mandatory, but are not
active barriers at the moment. The increase of work load and difficulties of organising
work at time where seeding the catch-crop is needed, are also reported.
Germany (cover crops)
On arable and mixed farms on sandy soil in the North-West, barriers are of categories SN
and PBC, and are weaker than drivers: fellow farmers, machinery for stubble management
and seeding of cover crop, and rainy autumn.
On arable and mixed farms on sandy soil in the North-East, there is a long list of relatively
weak barriers, all in the PBC category, including lack of irrigation on maize fields, labour,
cost, late harvest, and bad weather.
On the finer textured soils of central/south regions, barriers are (again) numerically
weaker than drivers. Still strong are fuel use, and difficulties to incorporate cover crops
into the soil in spring. Work effort is a weaker barrier.
Italy
In all three Italian farm types, the strongest barrier is cost.
On dairy farms with temporary grassland, green manures go at the expense of own feed
production (strong barrier). Here, other farmers and feed advisors do not encourage the
practice (SN).
Lack of incentives is a (weak) barrier in level terrain (SL1 class), but in accidented terrain
(SL3/4) having incentives is a (weak) driver. A weak barrier here is lack of appropriate
machinery.

CATCH-C
No. 289782
Deliverable number:
22 May 2015
Page 34 of 180
Poland
No strong barriers to cover crops were recorded. Limited technical knowledge was cited
as weak barrier for dairy farmers.
Spain
Barriers cited are only weak and include local traditions, lack of subsidies, and increased
contamination by herbicides.
The Netherlands
Cultivation of catch / cover crops after maize is an obligation on sandy soils in the
Netherlands. The general problem is that such after-crops are seldom successful, due to
late maize harvest. The obligation is therefore not often effective in reducing nitrate
leaching (its goal). Two options were investigated for dairy on sandy soils: undersowing
of the catch crop during the maize season; and earlier maize harvesting to give catch crops
a better start.
Strong barriers for undersown catch crops in maize are: double cost in case of failure (due
to obligation to re-establish catch crop), competition for water, and higher cost than
sowing after maize harvest.
Strong barriers against early maize harvesting are lower yield and quality in maize, lack of
financial compensation, lack of extra nitrogen quota (as reward; NL farmers feel that
maize yields are nitrogen limited due to stringent nitrogen quotation), and lack of high
yielding early maize cultivars. There is negative peer pressure among farmers.
In arable farming, strong barriers for green manures are (same for both clay and sand)
extra cost and more nematodes. Increased labour requirement is a strong barrier on clay. A
weaker barrier (both soils) is higher weed pressure in next crop. Other than in dairy,
nitrogen quota seem to play no role here (either soil type).

CATCH-C
No. 289782
Deliverable number:
22 May 2015
Page 35 of 180
Table 6: The top three drivers and barriers per FTZ unit for BMP Cover / Catch Crops / Green Manures (A = attitude, PBC = perceived behavioural control).
Drivers Barriers
Country FTZ question Value Type Nature Question Value Type Nature
AT
arable farms
Reduced erosion 7.5 A Natural Higher costs -4.3 A Financial
Soil is rooted and loosened 6.9 A Natural Higher use of fuel -4.2 A Financial
Enhanced soil life 6.7 A Natural Higher application of plant protection -3.5 A Natural
mixed farms
(arable farms)
Good soil structure 9.4 A Natural
General weed management (e.g. weed control) is more
demanding -5.4 A Natural
Reduced soil erosion 9.4 A Natural Slower warming and drying of the fields in spring -5.0 A Natural
Increase of the humus content 8.9 A Natural Caused costs -4.9 A Financial
BE arable/specialized
crop farms
Improved soil structure 6.8 A Natural Short time period harvest -sowing (before Sept 1) -2.4 PBC Physical
Increased soil health 6.6 A Natural Increased use of herbicides -2.1 A Financial
Lower erosion risk 5.4 A Natural No appropriate machinery for incorporation -2.0 PBC Physical
dairy farms on
sandy soils
Improved soil fertility 5.8 A Natural Bad weather in autumn -4.1 PBC Natural
More soil humus 5.8 A Natural Seed for cover crop is expensive -2.0 PBC Financial
Grass as cover crop results in
additional roughage for my herd 5.6 A Financial Increase of total costs -1.3 A Financial
mixed farms
(vegetables/pigs)
More soil humus 7.1 A Natural Increase in total costs -4.5 A Financial
Better soil structure 6.3 A Natural Weather conditions in autumn are often bad -4.1 PBC Natural
More airy soil 6.2 A Natural Lots of administration to get a subsidy -2.8 PBC Human
DE arable and mixed
farms on sandy
soil
Soil fertility 6.1 A
Beekeepers -3.8 SN Social
High humus content in the soil 5.5 A
Lack of machine endowment for stubble cultivating and
seeding of cover crops -3.2 PBC
Soil erosion 5.5 A
High precipitation in autumn -2.9 PBC
arable/cereal and
mixed farms on
sandy soils
Reduced nutrient leaching 7.8 A Natural No irrigation plots for maize cultivation -3.6 PBC Physical
Prevention of erosion 7.6 A Natural I am at the limit with my workforce -3.4 PBC Physical
Positive influence on humus
content 7.4 A Natural
Growing cover crops results in labour peaks on my
farm -3.3 PBC Physical

CATCH-C
No. 289782
Deliverable number:
22 May 2015
Page 36 of 180
arable/cereal and
mixed farms on
sandy soils
More active soil life 8.0 A Natural I cannot easily incorporate cover crops in spring -3.3 PBC Physical
Prevention of erosion 6.9 A Natural More fuel use -3.2 A Financial
Looser and better aerated soil 6.9 A Natural Higher work effort -2.7 A Human
FR Arable improves soil biological activity 5.1 A Environment Accountants -2.1 SN Social
increase organic matter content 3.7 A Environment bad quality -2.0 PBC Environment
improves soil structure stability 2.9 A Environment Family -1.9 SN Social
Dairy improves soil biological activity 3.1 A Environment increase seed cost -2.7 A Economic
increase organic matter content 2.7 A Environment increase fuel cost -2.3 A Economic
mitigates nitrate issues 2.3 A Environment increase mechanisation cost -2.3 A Economic
IT dairy
cattle/temporary
grass
Improved soil structure 6.1 A Natural Cost increase -7.2 A Financial
Increase of SOM 5.76 A Natural Lower self-production of forage -4.2 A Natural
Less weeds 5.23 A Physical Feed advisor -4.0 SN Social
arable/cereal
Higher soil organic matter 6.8 A Natural Additional costs for green manure -3.2 PBC Financial
Improved soil structure 6.8 A Natural No incentives for green manure -2.3 PBC Financial
Higher soil nitrogen content 5.6 A Natural Other farmers -2.2 SN Social
arable/cereal
Improved soil structure 6.3 A Natural Higher cultivation costs -4.6 A Financial
Higher soil organic matter 6.0 A Natural Lack of adequate machineries -2.3 PBC Physical
Reduced use of mineral
fertilisers 5.4 A Physical Other farmers -2.3 SN Social
NL
dairy farms on
sandy soils
Improve nutrient efficiency 6.8 A Natural When undersowing fails double costs -6.7 A Financial
Increases the N-availability to
the following crop 6.7 A Financial Competes on nutrients and water with maize -4.9 A Natural
Organic matter increase 6.3 A Natural More expensive than sowing after harvest -4.0 A Financial
arable farms on
clay soils
Better soil structure 9.1 A Natural Increases costs -5.2 A Financial
Support long term soil fertility 9.0 A Natural Requires extra time -3.9 A Human
Improve soil handling 8.8 A Natural More nematodes -3.8 A Natural
arable farms on Better soil structure 8.7 A Natural Increases costs -4.7 A Financial

CATCH-C
No. 289782
Deliverable number:
22 May 2015
Page 37 of 180
sandy soils Support long term soil fertility 8.3 A Natural More nematodes -3.8 A Natural
More organic matter 8.3 A Natural Requires extra time -2.8 A Human
PL
arable farms
Prevent erosion 6.2 A Natural Not enough technical knowledge -0.7
Human
Better soil structure 6.0 A Natural
Increase organic matter in the
soil 5.8 A Natural
mixed farming
Prevent erosion 6.0 A Natural Not enough technical knowledge -0.3 PBC Human
More organic matter in the soil 5.8 A Natural
Better soil structure 5.5 A Natural
dairy cattle
Increase of organic matter in the
soil 4.8 A Natural Not enough technical knowledge -1.1 PBC Human
Better soil structure 4.7 A Natural
Prevent erosion 4.6 A Natural
ES Permanent crop
farms (olive and
fruit trees,
vineyards)
Controls soil erosion 4.9 A Physical Increases contamination -2.0 A Physical
Improves water retention 4.9 A Natural Traditions of the region -1.9 PBC Social
Improves soil properties 3.4 A Natural Lack of subsidies -1.8 PBC Financial
CATCH-C
No. 289782
Deliverable number:
22 May 2015
Page 38 of 180
2.2.2 BMP Early Harvest of Maize to enable cover crops
The Netherlands
- dairy farms on sandy soils (20C=ENZ7_TXT1_SL1);
early maize harvest in favour of green manures; N=51
(Same results for this practice are given as were included under cover crops for The
Netherlands dairy farms on sand, section 2.2.4.)
Drivers for Early Harvest of Maize to enable cover crops
The Netherlands
In dairy farms on sandy soil, early harvest of maize in favour of green manures has strong
drivers: better development of the green manure, therefore more contribution to soil
organic matter, more N interception, facilitates re-establishing the grass sod, and better
nitrogen availability. On wet parcels: avoiding soil damage by late maize harvest. There
are strong barriers, however (see below).
Barriers for Early Harvest of Maize to enable cover crops
The Netherlands
Cultivation of catch/cover crops after maize is an obligation on sandy soils in the
Netherlands. The general problem is that such after-crops are seldom successful, due to
late maize harvest. The obligation is therefore not often effective in reducing nitrate
leaching (its goal). Two options were investigated for dairy on sandy soils: undersowing
of the catch crop during the maize season; and earlier maize harvesting to give catch crops
a better start.
Strong barriers against early maize harvesting are lower yield and quality in maize, lack of
financial compensation, lack of extra nitrogen quota (as reward; NL farmers feel that
maize yields are nitrogen limited due to stringent nitrogen quotation), and lack of high
yielding early maize cultivars. There is negative peer pressure among farmers.

CATCH-C
No. 289782
Deliverable number:
22 May 2015
Page 39 of 180
Table 7: The top three drivers and barriers per FTZ unit for BMP Early Harvest of Maize (A = attitude, PBC = perceived behavioural control).
Drivers Barriers
Country FTZ question Value Type Nature Question Value Type Nature
NL dairy farms
on sandy
soils
A good green manure produces more organic matter 8.8 A Natural Early harvest of maize lowers yields -8.3 A Financial
Early harvest of maize improves green manures 7.2 A Natural Early harvest reduces the quality of the maize -7.2 A Financial
Early harvest of maize facilitates reestablishment of
the grass sod 7.0 A Natural
I do not get reimbursed for early harvesting my
maize -5.9 PBC Financial

CATCH-C
No. 289782
Deliverable number:
22 May 2015
Page 40 of 180
2.3 Crop residue management
2.3.1 BMP Incorporation of Straw
Belgium
- arable/specialized crop farms (4A=ENZ7_SL2_TXT3); N=179
Italy
- dairy cattle/temporary grass (16C=ENZ12_SL1_TXT2,TXT1,TXT3); N=91
- arable/cereal (16A=ENZ12_SL1_TXT1,TXT2_TXT3);N=114
- arable/cereal (17A=ENZ12_SL3_TXT2; ENZ12_SL4_TXT2,TXT3); N=93
Poland
- arable farms (21A=ENZ6_SL2_TXT3), N= 93
- mixed farming (22M=ENZ6_SL2_TXT1) N=68
- dairy cattle (23C=ENZ6_SL1_TXT1) N=140
The Netherlands
- arable farms on clay soils (18A=ENZ4,ENZ7_TXT2,TXT3_SL1) ; N=99
- arable farms on sandy soils (20A=ENZ4,ENZ7_TXT1_SL1); N=55
Drivers for Incorporation of Straw
Belgium
All strong drivers are of category A and type ‘Natural’: benefits to soil quality (structure,
fertility, humus, potassium, trace elements). A strong driver of category PBC is that
current legislation makes it difficult to maintain soil humus content. Weaker drivers in this
category are that straw constitutes a ‘free’ source of N and P (not accounted for in the
administrative nutrient quotation system), and that buyers for straw are not always easily
found.
Italy
In dairy farms, strong drivers (category A) are soil quality (structure, organic matter), and
higher yields. Suppression of weeds and fungi in next crop is a weaker driver. A
conditional driver (PBC) is the availability of adequate machinery. Suppliers of farm
product, and other farmers are positive (weak, SN) about the practice.
In arable/cereal farms in the plains, strong drivers are improved soil quality (structure,
organic matter), lower fertiliser requirement; increased grain protein in wheat is a weaker
driver. Within category A, slow decomposition and missed selling revenues rank as very
weak drivers (indicating positive attitude in spite of these aspects). Advisors and fellow
farmers are positive. A strong driver in PBC category is that straw burning is now
prohibited.
In arable/cereal farms in the hills, strong drivers are again soil quality (fertility, structure,
organic matter). There is positive opinion (SN) among advisors, family and fellow
farmers. Strong drivers of PBC category are the ban on burning residues, and having
adequate machinery.
Poland
All strong drivers are in category A, and are of type ‘Natural’. Arable farmers are most
expressive (scores), followed by mixed farmers and then dairy farmers. Strong drivers are
soil quality (structure, fertility), and prevention of erosion (in arable, dairy; weak in
mixed). Weaker drivers are the reduction of water loss (all), and the inhibition of weeds
(mixed, dairy).

CATCH-C
No. 289782
Deliverable number:
22 May 2015
Page 41 of 180
Positive opinion (SN) is held with research, other farmers and advisors, but this holds only
for the arable and mixed farmers. For the dairy farmers, a negative opinion among these
referents is noted. Additional income is a weak driver in all three farm types (category
PBC).
The Netherlands
The expression of drivers was very similar between the two groups of arable farms (on
sand and clay, respectively). Strong drivers were found in all three categories (A, SN,
PBC). Highest scores were for soil quality aspects (structure, organic matter, soil fauna,
workability). Keeping the nutrients in the field, and ease of operation (versus straw
removal) are strong drivers, too. Perceived opinion among referents ranks positive (press,
study clubs, extension, other farmers). The cultivation of green manure after wheat is not
seen as a barrier against straw incorporation (PBC category).
Barriers for Incorporation of Straw
Belgium
The fact that nitrogen is needed to digest straw was – surprisingly - recorded as weak
barrier.
Strong barriers are the extra fuel consumption (category A), and the good price for straw
on the market (category PBC). Weaker barriers (PBC) are that the practice complicates
the land application of manure, and that insufficient nitrogen is allowed to digest the
straw. Still weaker are (PBC): cost of chopping, night-time harvesting, agreements with
livestock farmers, extra field operation, high biomass, an nitrogen requirement.
In category A, difficulties with digestion (in soil) or seeding of next crop are only very
weak barriers. In the SN category, there is negative opinion from fellow farmers and
contract workers.
Italy
In dairy farms, there is only one barrier ( strong, category A), and that is the farm’s own
straw requirement (bedding material).
In arable/cereal farms in the plains, the strongest barrier (category A) is increased risk of
fungal diseases. Further, increased fertiliser use is a weak barrier (A=-2.28), contradicting
the above driver (A=5.07). Weak barriers in category PBC are adverse environments for
decomposition, and high selling price.
In arable/cereal farms in the hills, barriers are (category A) increased fertiliser requirement
(strong) and (not strong) increases in weeds, pest and diseases, complications in sowing
the next crop, and missed income from selling. Further, chopping and distribution of straw
is expensive (weakest barrier; PBC category).
Poland
Barriers (category A, weak) are the cost of mechanisation, increase of fungal diseases, and
lower seed germination (next crop). These hold for all three farm types. For dairy farmers,
negative opinion among referents was recorded.
The Netherlands
The strongest barrier is the need for extra nitrogen to enable straw decomposition (both
soil types). Other strong barriers on both soil types are extra cost, and an increase of
fungal diseases. Another well expressed barrier (not strong) is the use of heavy
machinery. (All of the above are in category A). Weak barriers of the PBC category are
CATCH-C
No. 289782
Deliverable number:
22 May 2015
Page 42 of 180
the cultivation of whole crop silage (maize), the nitrogen quota system (statutory fertiliser
limits), selling price for straw (clay only), alternative uses (covering harvested beets or
potatoes), or relations with livestock farmers.
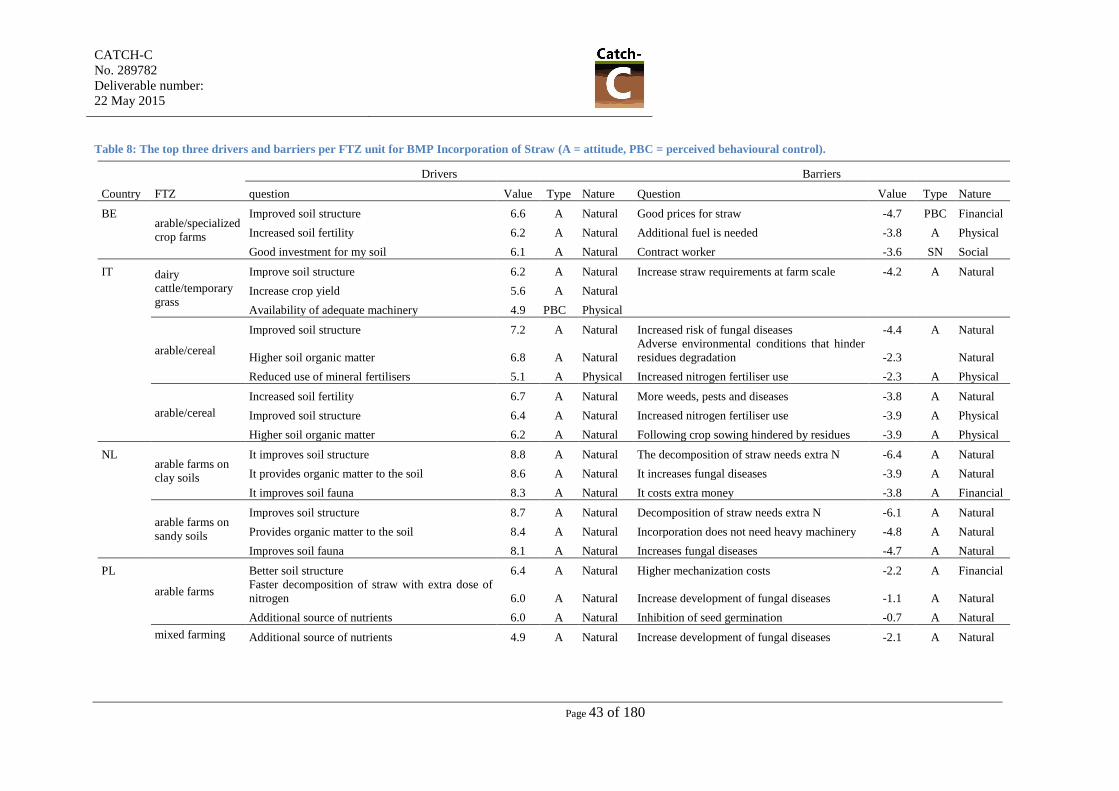
CATCH-C
No. 289782
Deliverable number:
22 May 2015
Page 43 of 180
Table 8: The top three drivers and barriers per FTZ unit for BMP Incorporation of Straw (A = attitude, PBC = perceived behavioural control).
Drivers Barriers
Country FTZ question Value Type Nature Question Value Type Nature
BE arable/specialized
crop farms
Improved soil structure 6.6 A Natural Good prices for straw -4.7 PBC Financial
Increased soil fertility 6.2 A Natural Additional fuel is needed -3.8 A Physical
Good investment for my soil 6.1 A Natural Contract worker -3.6 SN Social
IT dairy
cattle/temporary
grass
Improve soil structure 6.2 A Natural Increase straw requirements at farm scale -4.2 A Natural
Increase crop yield 5.6 A Natural
Availability of adequate machinery 4.9 PBC Physical
arable/cereal
Improved soil structure 7.2 A Natural Increased risk of fungal diseases -4.4 A Natural
Higher soil organic matter 6.8 A Natural
Adverse environmental conditions that hinder
residues degradation -2.3
Natural
Reduced use of mineral fertilisers 5.1 A Physical Increased nitrogen fertiliser use -2.3 A Physical
arable/cereal
Increased soil fertility 6.7 A Natural More weeds, pests and diseases -3.8 A Natural
Improved soil structure 6.4 A Natural Increased nitrogen fertiliser use -3.9 A Physical
Higher soil organic matter 6.2 A Natural Following crop sowing hindered by residues -3.9 A Physical
NL arable farms on
clay soils
It improves soil structure 8.8 A Natural The decomposition of straw needs extra N -6.4 A Natural
It provides organic matter to the soil 8.6 A Natural It increases fungal diseases -3.9 A Natural
It improves soil fauna 8.3 A Natural It costs extra money -3.8 A Financial
arable farms on
sandy soils
Improves soil structure 8.7 A Natural Decomposition of straw needs extra N -6.1 A Natural
Provides organic matter to the soil 8.4 A Natural Incorporation does not need heavy machinery -4.8 A Natural
Improves soil fauna 8.1 A Natural Increases fungal diseases -4.7 A Natural
PL
arable farms
Better soil structure 6.4 A Natural Higher mechanization costs -2.2 A Financial
Faster decomposition of straw with extra dose of
nitrogen 6.0 A Natural Increase development of fungal diseases -1.1 A Natural
Additional source of nutrients 6.0 A Natural Inhibition of seed germination -0.7 A Natural
mixed farming Additional source of nutrients 4.9 A Natural Increase development of fungal diseases -2.1 A Natural

CATCH-C
No. 289782
Deliverable number:
22 May 2015
Page 44 of 180
Faster decomposition of straw with extra dose of
nitrogen 4.9 A Natural Higher mechanization costs -1.4 A Financial
Better soil structure 3.8 A Natural Inhibition of seed germination -1.2 A Natural
dairy cattle
Faster decomposition of straw with extra dose of
nitrogen 3.8 A Natural Increase development of fungal diseases -2.2 A Natural
Better soil structure 3.3 A Natural Results on experimental fields -1.8 SN Human
Additional source of nutrients 3.3 A Natural Other farmers -1.7 SN Social

CATCH-C
No. 289782
Deliverable number:
22 May 2015
Page 45 of 180
2.4 Grazing
2.4.1 BMP Permanent grazing / rotational grazing / pastoral planning
Austria (Tirol) (permanent/rotational grazing)
- dairy cattle/permanent grassland (3C=ENZ5_SL5_TXT2); N=6 Spain (pastoral planning)
- Mixed farms known as Dehesa (sheep, pigs and beef and permanent grass)
(12C=ENZ12_SL2,SL3,SL4_TXT2; ENZ13_SL3_TXT1;
ENZ13_SL2,SL3,SL4,SL5_TXT2) N=89
Drivers for Permanent grazing / rotational grazing/ pastoral planning
Austria (permanent / rotational grazing)
Main drivers here are of category A and are of mixed type (financial, natural, physical).
Strong among these are financial: saving of time, money, feed concentrates, fertilisers;
increased margin. Well-being of the herd (less stress, better health and metabolism,
fodder quality) rank high (strong), too. Contributing to soil humus content is a weaker
driver. All of these are of category A. Significant drivers of other types are ample
availability of nearby grazing land (PBC), and encouragement by the Chamber of
Agriculture (SN).
Spain (pastoral planning)
All drivers for this practice are relatively weak. They are of mixed types (natural,
physical, human, financial). They include improved resource management, organisation
of farm operations, improved livestock management, correcting wrong management in
the past, improved profitability and productivity, and the establishment of clear
guidelines. Advisors from some associations are positive (strong SN score).
Barriers for Permanent grazing / rotational grazing/ pastoral planning
Austria (permanent/rotational grazing)
There is one strong barriers of category A: trampling of the sward under wet conditions.
Other barriers (not strong) of category A are insufficient animal viewing (distance), and
heterogeneous nutrient input (patches). Barriers of category PBC are terrain steepness
(strong), animal numbers (do not match under wet weather conditions), and long
distances for animal travel. Erosion was cited as a weaker barrier of PBC category, too.
Spain (pastoral planning)
Barriers (all of category PBC) are lack of (or too low) subsidies for implementing a
pastoral plan (strong) and a set of weaker barriers: fluctuations in markets, prices and
weather conditions, lack of site-specific knowledge by advisors. Very weak barriers are
the need for more management information, and aspects of bureaucracy.

CATCH-C
No. 289782
Deliverable number:
22 May 2015
Page 46 of 180
Table 9: The top three drivers and barriers per FTZ unit for BMP Permanent grazing / rotational grazing / pastoral planning (A = attitude, PBC = perceived behavioural
control).
Drivers Barriers
Country FTZ Question Value Type Nature Question Value Type Nature
AT dairy
cattle/permanent
grassland
Saved time and money 7.5 A Financial
Trampling damages in the sward with wet
weather -5.5 A Natural
Increased contribution margin 7.2 A Financial
Animals are too far away and the animal
viewing is insufficient -2.75 A Natural
Improved animal health 6.6 A Natural
Fertiliser irregularly distributed on the field
surface -2.6 A Physical
ES
Mixed farms
known as Dehesa
(sheep, pigs and
beef and
permanent grass)
Technicians from some associations 3.2 SN Social
There are not enough subsidies for
implementing a pastoral plan -3.4 PBC
Financia
l
It improves the natural resources
management 2.3 A Natural
Prices and markets varies significantly from
one year to another -2.9 PBC
Financia
l
The organization of the operations and
management of the farm is improved 2.2 A Physical
The weather conditions differ from one year
to another -2.8 PBC Natural

CATCH-C
No. 289782
Deliverable number:
22 May 2015
Page 47 of 180
2.5 Tillage and transport
2.5.1 BMP Non-Inversion / Minimum / Light Tillage
Austria (Non-inversion tillage):
- Lower Austria arable farms (1A=ENZ8_SL3+SL1_TXT2); N=28
Belgium (non-inversion tillage)
- arable/specialized crop farms (4A=ENZ7_SL2_TXT3); N=134
- dairy farms on sandy soils (6C=ENZ7_SL1_TXT1); N=186
- mixed farms vegetables-pigs (5M=ENZ7_SL1_TXT2); N=117
France (non-inversion tillage)
- arable farms on Rendzina (13A=ENZ7_SL2_TXT2); N=9
- arable farms on Cambisols (15A=ENZ12_SL3_TXT4); N=19
- dairy farms on Cambisols and Luvisols (long term grassland’;
14C=ENZ7_SL2_TXT3); N=25
Germany (non-inversion tillage)
- arable and mixed farms on sandy soil; NW (7A=ENZ4_SL1_TXT1); N=72
- arable/cereal and mixed farms on loamy/clay soils; central
(9A=ENZ6_SL2+SL3_TXT3); N=95
Italy (non-inversion tillage)
- arable/cereal (16A=ENZ12_SL1_TXT1,TXT2,TXT3);N=112
- arable/cereal (17A=ENZ12_SL3_TXT2; ENZ12_SL4_TXT2,TXT3); N=94
Poland (reduced tillage)
- arable farms (21A=ENZ6_SL2_TXT3), N= 93
- mixed farming (22M=ENZ6_SL2_TXT1) N=68
- dairy cattle (23C=ENZ6_SL1_TXT1) N=140
Spain (minimum tillage, light tillage)
- Permanent crop farms (olive and fruit trees, vineyards)
(11P=ENZ13_SL2,SL3,SL4_TXT3)
minimum tillage; N=151
- Mixed farms known as Dehesa (sheep, pigs and beef and permanent grass,
12C=ENZ12_SL2,SL3,SL4_TXT2; ENZ13_SL3_TXT1;
ENZ13_SL2,SL3,SL4,SL5_TXT2)
light tillage (N=101)
The Netherlands (non-inversion tillage)
- dairy farms on sandy soils (20C=ENZ7_TXT0_SL1); N=101
- arable farms on clay soils (18A=ENZ4,ENZ7_TXT2,TXT3_SL1) ; N=96
- arable farms on sandy soils (20A=ENZ4,ENZ7_TXT1_SL1); N=71
Drivers for Non-inversion / minimum / light tillage
Austria (non-inversion tillage)
There is a long list of strong drivers of the financial and natural types, and mostly in
category A: efficient farming, saving energy and operational cost, less erosion, better soil
life and structure and seedbed quality, increased soil moisture near surface, and the
avoidance of plow soles and compaction (lanes).
In the SN category, encouragement by LOP (Landwirtschaft ohne Pflug) and literature
count positive. Time saving is a driver in category PBC, as well as the availability of
effective herbicides.
Belgium (non-inversion tillage)

CATCH-C
No. 289782
Deliverable number:
22 May 2015
Page 48 of 180
Strong drivers in arable farming are the killing of volunteer potatoes (frost more
effective), less erosion, saving of labour and fuel, increased moisture holding. Another
driver (not strong) is increase in soil carbon. Positive is the combination with sowing of
cover crop in August (PBC; strong).
On dairy farms (maize), saving of labour, fuel and tillage cost are strong drivers. Of type
‘Natural’, drivers are better moisture holding (strong), and some weaker drivers: faster
germination of next crop, increased herbicide effectiveness, easy seedbed preparation, and
less nitrate leaching.
On mixed farms (vegetables/pigs), saving of labour and fuel rank highest (strong), next
(also strong) are soil quality (life, humus, less erosion, early spring warming). Weaker
drivers are soil structure and smooth seedbed.
France (non-inversion tillage)
The main drivers in all farm systems and soils are improvement of soil quality
components. Moreover, non-inversion tillage is expected to lower work load, fuel and
fertilisation costs and to have a positive effect on erosion. The effect on erosion is much
more important on Rendzina than on Cambisols. For arable farms on Cambisols, the
existence of appropriate material and bad soil quality (lack of OM, eroded soils,
compacted soils) are PBC drivers.
The positive effect of NIT on soil borne disease is a driver too, especially for dairy farms
and on Rendzina for arable farms, although of lower magnitude.
Germany (non-inversion tillage)
High ranking drivers on sandy soils (arable and mixed farms) are increased work
effectiveness, less erosion, better soil (life, moisture storage, structure,), lower fuel use,
and easy employment of unskilled labour. All of these are strong drivers. Weaker are plant
vitality, and the avoidance of undigested straw layers (which may occur in the plow
system).
On heavier soils (arable/cereal and mixed farms), work efficiency and fuel saving rank
highest, along with avoidance of plow pans. Keeping nutrients in the top layer is another
driver, albeit weaker. Still, all of these are strong drivers.
Italy (non-inversion tillage)
Strong drivers for arable/cereal farms in both terrain types (level / accidented) are saving
of cost and labour. Another strong driver for level terrain is improved timeliness while
yields are similar to conventional tillage (plowing). For accidented terrain, higher yields
are quoted as strong driver. Also reduced risk of waterlogging is a strong driver here (in
contrast to flat terrain, where waterlogging is a strong barrier). Still in the hills, high fuel
price is a strong driver in the PBC category.
Poland (reduced tillage)
The following set of strong drivers of category A applies to all three farm types
(expression is generally strongest for the arable farm type): saving of fuel, labour, , fewer
actions.
Lower cost, and reduction of water loss are drivers in all farm types, but strong only in
arable. Weaker drivers are more soil organic matter and topsoil nutrients, and better soil
structure.

CATCH-C
No. 289782
Deliverable number:
22 May 2015
Page 49 of 180
Spain (minimum / light tillage)
In permanent crops, no strong drivers were recorded for reduced tillage. Weak drivers are
better infiltration, cost saving, and less soil compaction. Technicians and farmer
associations encourage the practice.
In the mixed Dehesa system, the only strong driver is the control of unwanted shrubs and
weeds. Other drivers for light tillage are rather weak: maintenance of soil quality
(increased porosity, water and nutrient retention, aggregate structure, organic matter,
fertility), and higher yields. Technicians support the practice (strong SN).
The Netherlands (non-inversion tillage)
Strong drivers (all in category A) are expressed for dairy farms on sandy soils: time and
cost saving, increased soil quality (topsoil organic matter, physical), better for soil fauna.
Farmers feel encouraged by research outcomes.
For arable farms (both soil types), strongest drivers are of category A, next comes
category SN, and weakest drivers are of category PBC. Drivers of the first group (A) are
same as in above (dairy), with one additional strong driver: reduction of volunteer potato
(killed by frost). Farmers feel encouraged by research, magazines, fellow farmers in
USA/Canada, and the internet.
Barriers against Non-inversion/minimum/light tillage
Austria (non-inversion tillage)
The most important barriers in Lower Austria are increased weed pressure (strong),
increased disease pressure (almost strong: A=-3.86, belief strength=2.86), and volunteer
growth of previous crop (strong).
Belgium (non-inversion tillage)
There are many strong barriers on arable farms, mostly of categories A and PBC: weed
control (more weed germination, herbicide use, more difficult), lower yields (and more
yield risk / due to weather), higher risk of pests and diseases, uncertain seedbed quality
(crop germination). Weaker barriers are damage to soil structure, the relation with
contractors, inappropriate own machinery, the good results obtained by plowing, apparent
need to adjust the rotation scheme, and the weed sensitivity of crops grown.
On dairy farms (sand, maize) and on mixed farms (medium texture; vegetable/pigs), there
are again many barriers, of all types (financial, social etc) and categories (A, SN, PBC).
For both farm types, there is a well-expressed negative pressure from extension,
contractors, and (dairy only) fellow farmers. For both farm types, strong barriers are
increased weed pressure, lower yields (uncertainty; quality), more soil compaction and
less good rooting/aeration.
Additional strong barriers specific for dairy are higher sensitivity of maize to fungi,
herbicide use, and lack of appropriate machinery. Weaker barriers are limited experience
and knowledge.
Additional barriers (strong) specific to mixed farms (vegetable/pigs) are related to risk of
diseases, difficulties with crop residues, and risk of tracks developing. Several other
barriers (PBC category; strong) on the mixed farms are related to ‘after harvest
conditions’: dealing with crop residues, damage to soil structure, and (weaker) remaining
weeds. Intensity of production (vegetables) was also recorded as a strong barrier. Contract
workers and extension have strong negative SN value.

CATCH-C
No. 289782
Deliverable number:
22 May 2015
Page 50 of 180
France (non-inversion tillage)
The main barrier for all farms is the risk of crop yield losses on the short term. This
barrier is much more important for arable farms on Rendzina. Weeds are an issue
everywhere, but of lower magnitude than the risk of yield loss. SN group barriers are
important too, especially for dairy farms. In the PBC group, absence of available material
on the farm, difficulties in organising work, work available, disposition and size of fields,
heterogeneity of soils, are all barriers against Nit.
The agri-environmental contracts the farmers already have, along with the agri-food
industry requirements, can be barriers too. Last, in line with SN barriers, poor access to
needed knowledge for implementation is reported as being of preventing implementation.
Germany (non-inversion tillage)
High ranking (all strong) barriers on sandy soils (arable and mixed farms) are a persistent
weed (Elymus repens, quackgrass), herbicide use, slow soil warming, lack of measures
preventing corn borer, skin quality of potato, and volunteer crops. Lack of specific
machinery (mulch seeding) is also a strong barrier (related to capital access and farm
size). Weaker barriers are lower maize yield, and poor crop emergence.
On heavier soils (arable/cereal and mixed farms), strong barriers are bad tilth, poor
conditions for crop emergence, more disease pressure (root and stem diseases). All of
these are in category A. Unevenness of fields is another barrier (almost strong).
Italy (non-inversion tillage)
Strong barriers for arable/cereal farms in level terrain are weeds and accentuated
waterlogging. For accidented terrain, more weeds and lower crop yield are quoted as
strong barriers (higher yield was a weak driver; the seeming conflict is possibly related to
the merging of soil texture classes here). Reduced soil water retention is a weaker barrier.
Clay soils and lack of machinery are listed as (weak) barriers in the PBC category.
Poland(reduced tillage)
For all three farm types, strong barriers are lack of appropriate machinery, increased weed
pressure and increased need for crop protection. Somewhat weaker barriers are lower
yields (nowhere strong), and lack of knowledge (strong in dairy only).
Spain(minimum / light tillage)
Permanent crop: as the drivers, also the barriers are expressed weakly: damage to shallow
roots (as compared to no-till), increase of diseases and of soil loss (erosion), lack of
subsidies, steep slopes, lack of adequate machinery.
In the mixed Dehesa system, a strong barrier is the lack of subsidies for soil conservation.
Steep slopes and stoniness are weakly expressed barriers.
The Netherlands(non-inversion tillage)
Strong barriers (all in category A) are expressed for dairy farms on sandy soils: weed
pressure, increased risk on diseases, increased pesticide use, and the formation of
impermeable layers. Lower yields is a strong barrier of category PBC. Weaker barriers are
lack of financial benefit, need to plow for incorporating green manures, and lack of
suitable equipment with contractors.
For arable farms (both sand and clay) strong barriers are: the attraction of geese, increased
weed pressure, pesticide use, risk on diseases (strong on sand; almost strong on clay), and
desire to have weed-free seedbed (strong on clay; almost strong on sand).
Strong barriers in the PBC category on clay are: often too wet weather, lack of financial
benefit, lower yields. On sand, lower yield and lack of financial benefit are clearly

CATCH-C
No. 289782
Deliverable number:
22 May 2015
Page 51 of 180
expressed, too, but not strong barriers. Undesired soil drying is a weaker barrier on both
soil types.
Weaker barriers are also the cultivation of potatoes (clay), and need to invest in machinery
(clay, sand).

CATCH-C
No. 289782
Deliverable number:
22 May 2015
Page 52 of 180
Table 10: The top three drivers and barriers per FTZ unit for BMP Non-inversion / minimum / light tillage (A = attitude, PBC = perceived behavioural control).
Drivers Barriers
Country FTZ Question Value Type Nature question Value Type Nature
AT
Lower Austria
arable farms
Efficient way of farming 7.6 A Financial Higher weed pressure -4.7 A Natural
Reduced erosion 7.6 A Natural Higher disease pressure -3.9 A Natural
Saved energy 7.3 A Financial
Growth of the previous crop in the following
crop -3.5 A Natural
BE arable/specialized
crop farms
Promotes freezing of remaining potatoes 4.7 A Natural More germination of weeds -4.7 A Natural
Less erosion 4.2 A Natural Lower yields in bad weather -4.1 A Financial
Less labour intensive 3.8 A Human Higher risk of transfer of crop diseases -4.0 A Natural
dairy farms on
sandy soils
Lower use of fuel 5.0 A Financial Other farmers -5.2 SN Social
Less labour intensive 4.3 A Human More weeds -5.0 A Natural
Reduce of tillage costs 4.1 A Financial Lower yields in general -4.6 A Natural
mixed farms
(vegetables/pigs)
Less fuel 5.4 A Financial More weeds -4.9 A Natural
Time saving 4.8 A Human Lower crop yields -4.4 A Financial
Improved soil life 4.7 A Natural Higher risk on crop diseases -4.2 A Natural
DE arable and mixed
farms on sandy soil
Increased work effectiveness 6.5 A Human Difficulties with Elymus repens (quackgrass) -6.4 A Natural
Prevention of erosion 6.4 A Natural Slow warming up of soil in spring -6.3 A Natural
Support of soil life 6.3 A Natural Higher use of herbicides -6.2 A Physical
arable/cereal and
mixed farms on
sandy soils
High work efficiency 6.4 A Physical More disease pressure -5.5 A Natural
Prevention of plough pans 5.9 A Natural Root and stem diseases -5.5 A Natural
Fuel savings 5.5 A Physical Bad conditions for crop emergence -5.4 A Natural
FR
Arable Rendzin
improves soil biological activity 7.1 A Environment soils are compacted -1.9 PBC Environment
decrease erosion 5.2 A Environment soils are heterogeneous -1.9 PBC Environment
increase organic matter content 4.8 A Environment bad quality -1.9 PBC Environment
Arable Cambisols improves soil structure stability 3.5 A Environment Accountants -1.8 SN Social

CATCH-C
No. 289782
Deliverable number:
22 May 2015
Page 53 of 180
increase organic matter content 3.3 A Environment modifies work organisation -1.8 PBC Human
decrease run off 3.3 A Environment Fellow farmers -1.6 SN Social
Dairy improves soil biological activity 3.1 A Environment Accountants -2.1 SN Social
increase organic matter content 2.9 A Environment Advisors -2 SN Social
improves soil structure stability 1.7 A Environment soils are compacted -2 PBC Environment
IT
arable/cereal
Lower cultivation costs than in CT 7.2 A Financial More weeds than in CT -6.2 A Natural
Improved timeliness of tillage compared to CT 5.4 A Physical Accentuated waterlogging -4.6 A Natural
Less working time than in CT 5.3 A Physical Other farmers -1.6 SN Social
arable/cereal
Lower cultivation cost 6.5 A Financial Reduced crop yield -5.2 A Natural
Reduced working time 6.2 A Physical More weeds -5.1 A Natural
Reduced risk of waterlogging 3.3 A Natural Reduced soil water retention -2.5 A Natural
NL dairy farms on
sandy soils
NIT better for soil fauna than ploughing 7.2 A Natural NIT increases weed pressure -7.2 A Natural
NIT increases o.m. in top soil 7.1 A Natural NIT increases pesticide use -6.4 A Financial
NIT saves time compared to ploughing 6.8 A Human NIT increases the risk on diseases -6.3 A Natural
arable farms on
clay soils
NIT saves time compared to ploughing 7.3 A Human NIT stimulates geese on my field -7.2 A Natural
NIT reduces volunteer potatoes 7.1 A Natural Due to NIT weed pressure increases -6.8 A Natural
NIT is cheaper than ploughing 6.6 A Financial With NIT pesticide use increases -5.1 A Financial
arable farms on
sandy soils
NIT stimulates soil fauna 6.6 A Natural NIT increases weed pressure -6.7 A Natural
NIT cheaper than ploughing 6.5 A Financial NIT stimulates geese on my field -6.0 A Natural
NIT saves time compared to ploughing 6.3 A Human NIT increases risk on diseases -5.5 A Natural
PL
arable farms
Lower fuel use 4.8 A Financial No appropriate machinery for RT application -4.6 A Physical
Lower labour input 4.8 A Human Increase weeds -4.2 A Natural
Lower financial costs 4.6 A Financial Increase crop protection -4.1 A Financial
mixed farming
Lower fuel use 4.2 A Financial No appropriate machinery for RT application -4.7 PBC Physical
Lower labour input 3.9 A Human Increases crop protection -4.0 A Financial
Less agricultural practices 3.6 A Financial Increase weeds -4.0 A Natural

CATCH-C
No. 289782
Deliverable number:
22 May 2015
Page 54 of 180
dairy cattle
Less agricultural practices 4.0 A Financial No appropriate machinery for RT application -5.9 PBC Physical
Lower labour input 3.9 A Human Not enough technical knowledge -3.3 PBC Human
Lower fuel use 3.9 A Financial Increase weeds -3.3 A Natural
ES Permanent crop
farms (olive and
fruit trees,
vineyards)
Good for controlling shrubs and weeds 3.2 A Physical
There are no subsidies for preserving soil
conservation -3.6 PBC Financial
Enhances the maintenance of soil quality 2.6 A Natural The slope of the farm is high -2.4 PBC Natural
Higher yields 2.6 A Natural The farm has a high % of stones -2.1 PBC Natural
CATCH-C
No. 289782
Deliverable number:
22 May 2015
Page 55 of 180
2.5.2 BMP No tillage / Direct Drilling
France
- arable farms on Rendzina, Champagne Berichonne (13A=ENZ7_SL2_TXT2),
- arable farms on Cambisols (15A=ENZ12_SL3_TXT4)
- dairy farms on Cambisols and luvisols (long term grassland,
14C=ENZ7_SL2_TXT3)
Italy
- arable/cereal (16A=ENZ12_SL1_TXT1,TXT2,TXT3);N=105
- arable/cereal (17A=ENZ12_SL3_TXT2; ENZ12_SL4_TXT2,TXT3); N=92
Spain
- Arable farms with cereals (10A=ENZ13_SL1, SL2, SL3, SL4_TXT4); N=94
Drivers for No tillage / Direct Drilling
France (no tillage)
The main drivers for no-tillage are improvements of soil biological activity, structure and
organic matter content. Environmental effects on decreasing erosion and run-off are of a
lower magnitude. Another group of drivers are the reduction of costs, mostly fuel in arable
farms on Cambisols and dairy farms. The decrease of work load is of particular
importance in the labour intensive dairy farms.
The perception that soil lack organic matter is driver in arable farms too.
Italy (no tillage)
In the arable farms of level terrain, the strongest drivers are again of category A, and of
mixed types (financial, physical, natural). Foremost is cost saving. Better timeliness, and
increased biological activity are other strong drivers. Weak drivers are that yields are
similar to conventional, benefits to soil organic matter, and water retention.
In accidented terrain, strong drivers (all category A) are saving of labour and cost,
improved soil structure; lower risk for waterlogging and higher yield are weaker drivers.
The latter is expressed much weaker than the barrier of yield reduction.
Spain (direct drilling)
In the arable/cereal farms, strongest drivers are reduction of runoff and erosion, and the
saving of fuel and labour time. Other strong drivers are conservation of soil fertility
(organic matter, nutrients) and soil moisture retention, enhancement of biodiversity,
reduced pollution. Farmers are encouraged by their associations, by technicians and
research (all weak but positive SN, and high motivation to comply >3.3).
Barriers for No tillage / Direct Drilling
France (no tillage)
There is a handful of barriers against the use of no-tillage in France. The more important
are of SN group, because no referent advice for this technique. In line, PBC highlight the
lack of relevant advice and long life training on it.
In arable farms on the south of France (Cambisols) the heterogeneity of soils, scattering of
fields, absence of appropriate material at the farm level combine with difficulties in weed
management as a bundle of PBC barriers, which are even enforced by current contracts
that prevent its adoption.

CATCH-C
No. 289782
Deliverable number:
22 May 2015
Page 56 of 180
For arable farms on Rendzina, the main barrier is the decrease of yields along the crop
succession, that combines, to a lower extent with difficulties in managing pests and weeds
on soil that are perceived as hydromorphic and compacted.
A similar set of barriers apply for dairy farms, with the absence of material on first
position, soil issues coming very close behind (heterogeneity, compaction, hydromorphic,
sensitive to weeds). The weed issue is of particular magnitude, because of the current crop
succession that involves grassland.
Italy (no tillage)
In the arable farms of both types (level and accidented terrain), the strong barriers are of
categories A but also PBC. In category A are higher weed pressure, and lower crop yields.
Additional barriers in the hills are diseases (in wheat; strong), and uneven field surface
(almost strong).
Farmers do not feel encouraged for this practice by social factors. A strong barrier of PBC
type is that machines required are expensive or unavailable. Other (weaker) barriers (all
PBC) are lack of skills (direct drilling), heavy soil texture, lack of machinery market, and
an ‘unkempt look’ of the fields.
Spain (direct drilling)
For direct drilling in Spain, there are no barriers of category A.
A strong barrier is the investment in machinery required (PBC category). Another well
expressed barrier in the same category is that information and training are needed (PBC =
-2.58).

CATCH-C
No. 289782
Deliverable number:
22 May 2015
Page 57 of 180
Table 11: The top three drivers and barriers per FTZ unit for BMP No tillage / Direct Drilling (A = attitude, PBC = perceived behavioural control).
Drivers Barriers
Country FTZ question Value Type Nature question Value Type Nature
FR Arable Rendzin
increase organic matter content 8.9 A Environment decrease yield for the following crop -2.1 A Economic
improves soil biological activity 6.8 A Environment managing weeds is difficult on your farm -2.1 PBC Environment
improves soil structure stability 5.8 A Environment hydromorphy -1.9 PBC Environment
Arable Cambisols
increase organic matter content 4.8 A Environment lack available material -3.6 PBC Machinery
improves soil biological activity 4.2 A Environment soils are heterogeneous -3.3 PBC Environment
prevents erosion 3.1 A Environment managing weeds is difficult on your farm -3.2 PBC Environment
Dairy increase organic matter content 5 A Environment managing weeds is difficult on your farm -3.3 PBC Environment
improves soil biological activity 5 A Environment lack available material -2.9 PBC Machinery
decrease work load 3.9 A Machinery
fields are too scattered to implement the
technique -2.3 PBC Human
IT arable/cereal
Lower cultivation costs 7.1 A Financial More weeds -6.5 A Natural
Improved timeliness of tillage 5.4 A Physical Lower crop yield -6.2 A Natural
Increased soil organic matter 4.4 A Natural Expensive machineries -5.0 A Financial
arable/cereal
Lower cultivation cost 6.5 A Financial Reduced crop yield -5.2 A Natural
Reduced risk of waterlogging 3.3 A Natural Reduced soil water retention -2.5 A Natural
Reduced working time 6.2 A Physical More weeds -5.1 A Natural
ES Arable farms with
cereals
Reduces soil loss 4.58 A Natural Strong investment in machinery -3.33 PBC Physical
Saves up fuel 4.55 A Physical Information and training is demanded -2.58 PBC Human
Saves up time 4.39 A Physical High clay content -1.15 PBC Natural

CATCH-C
No. 289782
Deliverable number:
22 May 2015
Page 58 of 180
2.5.3 BMP Controlled Traffic Farming
France
- arable farms on Rendzina, Champagne Berichonne (13A=ENZ7_SL2_TXT2),
- arable farms on Cambisols (15A=ENZ12_SL3_TXT4)
- dairy farms on Cambisols and luvisols (long term grassland,
14C=ENZ7_SL2_TXT3)
Italy
- arable/cereal (16A=ENZ12_SL1_TXT1,TXT2,TXT3);N=105
- arable/cereal (17A=ENZ12_SL3_TXT2; ENZ12_SL4_TXT2,TXT3); N=92
Spain
- Arable farms with cereals (10A=ENZ13_SL1, SL2, SL3, SL4_TXT4); N=94
Drivers for Controlled Traffic Farming
Germany
The strongest drivers are of category A and types natural and physical: better soil (root
growth, loose structure, soil life, humus content, infiltration, avoidance of subsoil
compaction), fuel savings and straight machine tracks. Better trafficability under wet
conditions is a weaker driver.
Spain
Strong drivers are the avoidance of soil compaction, and ease of operations. Another
driver (weaker) is higher yields. Technicians (advisors) are a positive drivers, too
(SN=2.88).
The Netherlands
Strong drivers for CTF in category A are improved soil structure, rooting, higher yields,
and less problems related to wetness. Weaker drivers are reduction of diseases, and the
benefit of enabling field work under wet conditions (spraying, weeding). Research and
fellow farmers are positive, especially organic farmers and those working on cropped
beds. However, it is also recognised that CTF is difficult to implement.
Barriers for Controlled Traffic Farming
Germany
Strong barriers are the expectation that CFT results in cemented tracks (category A), and
the fact that CTF systems are regarded very expensive. Weaker barriers are related to farm
size, land ownership, specialisation, and (lack of) experience with GPS, and not having
acquired equipment with standard working width.
Spain
The only strong barrier recorded is the lack of subsidies. Another well pronounced barrier
(A=2.52) is that the track width of machinery is not normalised. A weaker barrier is that
trailers and harvesting machines cannot yet be controlled.
The Netherlands
Strong barriers are that conversion is an all-at-once transition is costly, and that ‘standard’
machinery is not suitable. Other barriers are that CTF advantages are not always clear, and
that harvesting from lanes is not yet possible.

CATCH-C
No. 289782
Deliverable number:
22 May 2015
Page 59 of 180
Table 12: The top three drivers and barriers per FTZ unit for BMP Controlled Traffic Farming (A = attitude, PBC = perceived behavioural control).
Drivers Barriers
Country FTZ Question Value Type Nature question Value Type Nature
DE arable/cereal and
mixed farms on
sandy soils
Better root growth 6.6 A Natural A CTF system would be very expensive for me -3.2 PBC Financial
Support of soil life 6.1 A Natural Cemented machine tracks -3.2 A Natural
Looser soil between machine tracks 5.5 A Natural Other farmers -2.9 SN Social
ES
Arable farms with
cereals
In general terms, it reduces soil compaction 3.2 A Natural There is not enough subsidies -3.2 PBC Financial
It makes easier some operations carried out
in the farm 3.1 A Physical Width machinery is not normalized -2.5 PBC Physical
Technicians 2.9 SN Social
It is not easy to control the traffic when using
trailers and harvesters -1.5 PBC Physical
NL Arable farms on
clay soils
Controlled traffic improve rooting 7.8 A Natural
Converting to controlled traffic should be done at
once -4.9 PBC Human
With controlled traffic soil structure
improves 7.4 A Natural
Converting to controlled traffic requires a large
investment -3.6 PBC Financial
Controlled traffic reduces water troubles 6.6 A Natural My machines are not suitable for controlled traffic -3.4 PBC Physical

CATCH-C
No. 289782
Deliverable number:
22 May 2015
Page 60 of 180
2.5.4 BMP Low Soil Pressure Systems
Definition: Reduction of soil pressure by either using reduced tire pressure of 1 bar at
most or by using special tires like wide tires, caterpillar tracks or twin tires.
Germany
- arable/cereal and mixed farms on sandy soils (8A=ENZ6_SL1_TXT1); N=93
Drivers for Low Soil Pressure Systems
Germany
Strong drivers – all of category A - are more even root penetration, reduced soil pressure,
prevention of compaction, and fuel savings. Farmer journals are positive about the
practice.
Barriers for Low Soil Pressure Systems
Germany
Major barriers, besides not having adjustable tire pressure, are that farmers have to use
streets and even cross villages if fields are dispersed. Weaker barriers are costs for
adjustable pressure or special tire systems, and time required for adjusting pressure.
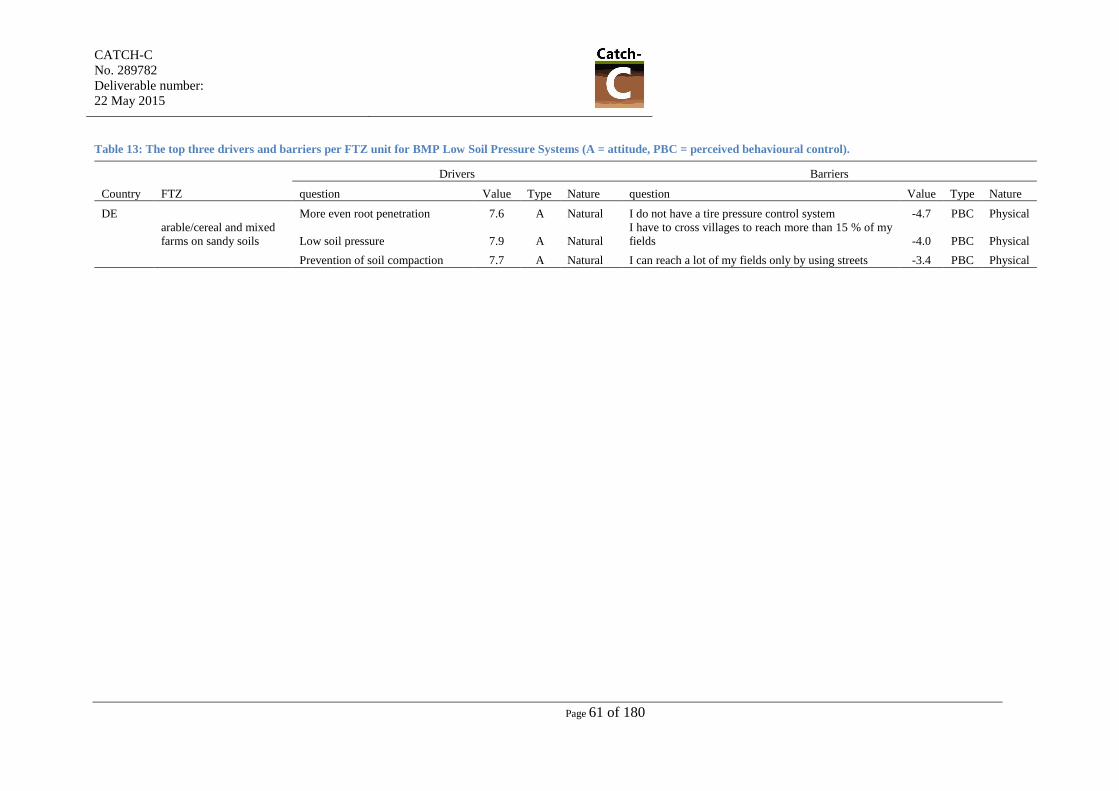
CATCH-C
No. 289782
Deliverable number:
22 May 2015
Page 61 of 180
Table 13: The top three drivers and barriers per FTZ unit for BMP Low Soil Pressure Systems (A = attitude, PBC = perceived behavioural control).
Drivers Barriers
Country FTZ question Value Type Nature question Value Type Nature
DE
arable/cereal and mixed
farms on sandy soils
More even root penetration 7.6 A Natural I do not have a tire pressure control system -4.7 PBC Physical
Low soil pressure 7.9 A Natural
I have to cross villages to reach more than 15 % of my
fields -4.0 PBC Physical
Prevention of soil compaction 7.7 A Natural I can reach a lot of my fields only by using streets -3.4 PBC Physical

CATCH-C
No. 289782
Deliverable number:
22 May 2015
Page 62 of 180
2.6 Nutrient management
2.6.1 BMP Soil Analysis and / or making a Nutrient Management Plan
Austria (Soil Analysis):
- Lower Austria (1A=ENZ8_SL3+SL1_TXT2); N=28
- upper Austria (2M=ENZ6_SL3_TXT3); N=11
- Tirol (3C=ENZ5_SL5_TXT2); N=6
Italy (Nutrient management plan):
- dairy cattle/temporary grass (16C=ENZ12_SL1_TXT2,TXT1,TXT3); N=91
Poland (Nutrient management plan)
- mixed farming (22M=ENZ6_SL2_TXT1); N=62
- dairy cattle (23C=ENZ6_SL1_TXT1); N=136
Drivers for Soil Analysis and / or making a Nutrient Management Plan
Austria (Soil Analysis)
Austria. Of the three categories (A, SN, PCB), those in category PCB are weakest in all
three regions. Among the other two categories (A, SN), A is the strongest in Lower
Austria, while categories A and SN seem equally important in Upper Austria, showing
more peer pressure in Upper Austria to perform this BMP.
Within ‘Attitude’, natural and physical drivers dominate in all three regions. Farmers
appreciate better insight in nutrient supply, possible deficiencies and pH issues, and
expect better recommendations from advisors. Lower Austria scores higher throughout the
list of natural/physical drivers in the Attitude group, than Upper Austria or Tirol. In Lower
Austria, strong drivers are overview/insight in nutrient demand, food and feed value,
fertiliser planning, keeping track of soil properties (humus content, biological activity,
trace elements, pH), and optimisation of crop yield. Most of these are strong drivers in
Upper Austria and Tirol, too, with insight in pH especially relevant in Upper Austria
(A=6, belief strength=4.58).
Within the SN group, agricultural schools and literature are strong drivers in all three
regions (except schools in Lower Austria). Advisors (chambers; private) score higher in
Upper Austria and Tirol than in Lower Austria.
Within the PCB group, the smooth organisation of sampling and sample delivery is
important, notably in Upper Austria. Still in Upper Austria, the support by a funding
programme is a strong driver (PBC), not so in the other two regions.
Italy (Nutrient management plan)
The strongest drivers are all in category A, and are mostly of type ‘natural’. Proper
valorisation of livestock manure, and proper dosage of fertilisers (and cost savings
thereof) are very important drivers (6.1 to 6.6). Other strong drivers are yield stability,
forage quality, animal health and milk quality. Strong drivers exist also in category SN,
albeit with lower scores than the above.
Poland (Nutrient management plan)
The strongest drivers are all in category A, and are of both ‘financial’ and ‘natural’ types.
Appropriate dosage of fertilisers, reduction of fertiliser cost, and high nutrient efficiencies
are all enabled by proper estimation of nutrient supplies from soil and manures; this set of

CATCH-C
No. 289782
Deliverable number:
22 May 2015
Page 63 of 180
drivers is the most important (scores A=4.1 to 5.3). In mixed systems (as compared to
dairy farms) nutrient planning is also valued as it pays attention to soil acidification. The
subjective norm (SN) with respect to farmers is important for both farm types (strong in
dairy farms). Strong drivers of TBC category are the preparation of a nutrient
management plan (both farm types) and the help of advisers (mixed farms).
Barriers for Soil Analysis and / or making a Nutrient Management Plan
Austria (Soil Analysis)
In all regions, the strongest barriers are the expectation (group A) that observing the crop
itself rather than soil) gives more information; and the cost of analysis. Time requirement
is a barrier, too, notably in Upper Austria and Tirol. In the latter, the possibility of lab
mistakes is a barrier, too.
Italy (Nutrient management plan)
There are not many, nor any strong barriers. The strongest is the cost of soil testing, but it
is much weaker (-2.4) than the driver of fertiliser saving (+6.1).
Poland (Nutrient management plan)
No clear barriers were reported.

CATCH-C
No. 289782
Deliverable number:
22 May 2015
Page 64 of 180
Table 14: The top three drivers and barriers per FTZ unit for BMP Soil analysis and / or making a Nutrient management Plan (A = attitude, PBC = perceived behavioural
control).
Drivers Barriers
Country FTZ Question Value Type Nature question Value Type Nature
AT
arable farms
Overview of the nutrient supply 6.1 A Natural
Less information compared to the observation
of plant growth -4.7 A Natural
Adaption of the fertilisation to the crops
needs 5.6 A Physical Higher costs -4.1 A Financial
Optimization of the crop yield 5.1 A Financial Mistakes in the evaluation by soil laboratories -1.7 PBC Social
mixed farms (arable
farms)
Adaption of the fertilisation to the crops needs 6.3 A Physical
Less information compared to the observation
of plant growth -5.8 A Natural
Control of the pH value 6.0 A Physical Causing costs -5.2 A Financial
Shows nutrient deficiencies in the soil 5.8 A Natural Higher time requirements -2.4 A Financial
dairy cattle/permanent
grassland
Adaption of the fertilisation to the crops
needs 5.8 A Physical
Less information compared to the observation
of plant growth -5.0 A Natural
Better advice by the agricultural advisors 5.4 A Social Causing costs -6.4 A Financial
Literature 4.8 SN Human Higher time requirements -3.0 A Financial
IT
dairy cattle/temporary
grass
Valorisation of livestock manure 6.6 A Natural Increase of costs due to soil testing -2.4 A Financial
Use of the proper fertiliser amount 6.5 A Natural
Scarce information on the value of livestock
manure -1.7 PBC Human
Reduction of fertiliser costs 6.1 A Financial
Lack of an independent service for fertilisation
advice -1.0 PBC Social
PL
mixed farming
Assistance of advisor 5.7 PBC Social no barriers
Good tool to determine the appropriate doses
of fertilizers 5.1 A Financial
Calculate nutrient in FYM 4.5 A Financial
dairy cattle
Good tool to determine the appropriate doses
of fertilizers 5.3 A Financial no barriers
Lower fertilization costs 5.1 A Financial
Calculate nutrient in FYM 4.7 A Financial

CATCH-C
No. 289782
Deliverable number:
22 May 2015
Page 65 of 180
2.6.2 BMP Application of Organic Fertilizers
This includes all common organic manure products (farm yard manure, slurries, composts
of biowaste, plant, or sludge), unspecified in the surveys for Austria and Italy.
Austria (Non-inversion tillage):
- Lower Austria arable farms (1A=ENZ8_SL3+SL1_TXT2); N=11
Italy (non-inversion tillage)
- arable/cereal (16A=ENZ12_SL1_TXT1,TXT2,TXT3);N=106
- arable/cereal (17A=ENZ12_SL3_TXT2; ENZ12_SL4_TXT2,TXT3); N=90
Drivers for Application of Organic fertilizers
Austria
Many strong drivers of various types (natural, physical, financial) and categories (A, SN,
PBC) were recorded for the use of organic fertilisers: ecologically practical, support to
soil life, yield potential (appropriate/increased nutrient supply, trace elements). Other
strong drivers are getting a better catch crop, reduced operational cost, and the condition
of dry farmland before field application. Social factors are positive. Further conditions or
stimulants (PBC) are (of course) availability of the organic product, the use of ‘drag
hoses’ (less odour / nuisance to population), and experience in fertiliser planning.
Italy
In arable farms of both level and accidented regions, strong drivers of category A are soil
quality (fertility, structure, organic matter), and lower fertiliser requirement.
The slower release of nutrients was also recorded as driver in the plains. Fellow farmers,
professional organisations and suppliers are all in favour of the practice, but this is clearly
expressed only in the plains.
Barriers for Application of Organic fertilizers
Austria
Strong barriers to the use of organic fertilisers are the higher cost, increased use of fuel,
limited storage capacity (slurries), heavy equipment (soil damage), and increased
dependence on weather conditions.
Italy
In arable farms both in the plains as in the hills, strong barriers are that the practice is
time-consuming and expensive (distribution cost), low confidence in quality of
compost/sludge. Another barrier (not strong) is low availability of manures among
neighbours. Legislative constraints on transport and application are barriers, too. In the
hills, additional barriers are odour (strong), lack of adequate machinery, and lack of
incentives (strong).

CATCH-C
No. 289782
Deliverable number:
22 May 2015
Page 66 of 180
Table 15: The top three drivers and barriers per FTZ unit for BMP Application of Organic fertilizer (A = attitude, PBC = perceived behavioural control).
Drivers Barriers
Country FTZ Question Value Type Nature question Value Type Nature
AT mixed farms (arable
farms)
Ecologically practical 8.6 A Natural Higher costs -6.5 A Financial
Support of the soil life 8.6 A Natural Increased use of fuel -6.2 A Financial
Increased yield potential 8.2 A Financial Limited storage capacity (slurry) -5.8 A Physical
IT arable/cereal
Increased soil fertility 8.1 A Natural
Lack of confidence in the compost and
sludge quality -4.9 PBC Social
Improved soil structure 7.7 A Natural Slow and expensive distribution -4.2 A Financial
Higher soil organic matter 7.3 A Natural
Manure is not available in the
neighbouring farms -3.7 PBC Physical
arable/cereal
Increased soil fertility 7.4 A Natural FYM transport is expensive -5.5 PBC Financial
Improved soil structure 6.8 A Natural Unpleasant odours emission -4.6 A Physical
Higher soil organic matter 6.7 A Natural
I do not have neighbours with excess
manure -4.5 PBC Physical

CATCH-C
No. 289782
Deliverable number:
22 May 2015
Page 67 of 180
2.6.3 BMP Application of Farm Yard Manure
Belgium
- arable/specialized crop farms (4A=ENZ7_SL2_TXT3); N=152
- mixed farms (vegetables/pigs, 5M=ENZ7_SL1_TXT2); N=69
Drivers for Application of Farm Yard Manure
Belgium
All strong drivers are of type ‘Natural’ and category A and were recorded for both farm
types: more soil life, better soil structure / aeration (compared to slurry), better soil
fertility and water holding, lower erosion risk, more organic matter (than in slurry), higher
soil N supply capacity or slow nitrogen release. Mixed farmers also mentioned higher
yields, and the association with cover crops as strong drivers.
Barriers for Application of Farm Yard Manure
Belgium
For the arable farms: barriers of category A are uncertainty about nitrogen release (time,
quantity) as compared to fertiliser and (weaker) as compared to slurry. Strong barriers are
of category PBC: no storage capacity on farm, expense of transport, variable
supply/availability of FYM. Weaker barriers are timeliness of contractor availability,
uneven spreading on the field, no appropriate machinery, and time needed to find supplier.
Mixed farmers reported the high availability of slurry as a strong barrier to the use of
FYM. Cost of spreading, and the fact that these farmers produce their own slurry (and no
FYM) are barriers.

CATCH-C
No. 289782
Deliverable number:
22 May 2015
Page 68 of 180
Table 16: The top three drivers and barriers per FTZ unit for BMP Application of Farm Yard Manure (A = attitude, PBC = perceived behavioural control).
Drivers Barriers
Country FTZ question Value Type Nature Question Value Type Nature
BE arable/specialized
crop farms
Better soil structure compared to slurry 6.1 A Natural No appropriate storage capacity on my farm -5.3 PBC Physical
Better soil fertility 5.8 A Natural Transport of farmyard manure is more expensive -3.9 PBC Financial
More soil life 5.5 A Natural Supply of farmyard manure varies -3.4 PBC Physical
mixed farms
(vegetables/pigs)
Improved soil structure 6.8 A Natural Short time period harvest -sowing (before Sept 1) -2.4 PBC Physical
Increased soil health 6.6 A Natural Increased use of herbicides -2.1 A Financial
Lower erosion risk 5.4 A Natural No appropriate machinery for incorporation -2.0 PBC Physical

CATCH-C
No. 289782
Deliverable number:
22 May 2015
Page 69 of 180
2.6.4 BMP Application of Compost
Belgium
- arable/specialized crop farms (4A=ENZ7_SL2_TXT3); N=121
- mixed farms (vegetables/pigs, 5M=ENZ7_SL1_TXT2); N=61
The Netherlands
- arable farms on sandy soils (20A=ENZ4,ENZ7_SL1_TXT1; ENZ4_SL1_TXT0
(reclaimed peat sands).
Drivers for Application of Compost
Belgium
All strong drivers are of type ‘Natural’ and category A and were recorded for arable
farms: more soil life, better soil fertility and health, increased humus content, lower
erosion risk, long-term nitrogen release and less heavy soil.
Mixed farmers mentioned improved soil structure, soil life and humus, better infiltration
and drainage as strong drivers; they showed a (weak) preference of compost over farm
yard manure.
The Netherlands
The strong drivers (category A) are the contribution to soil organic matter, and the fact
that compost may be applied in winter (there is strict regulation with closed periods for
animal manures). All referents (SN drivers) are positive, too.
Barriers for Application of Compost
Belgium
In both farm types, long lists of barriers were found. For the arable farms these were of
categories A and PBC, for the mixed farms all social factors (SN) were negative, too.
Strong barriers of category A in arable farms: contains waste products, risk for diseases
and weeds, risk for high residual soil nitrogen in autumn. Strong barriers of category PBC
include cost (transport and purchase), lack of experience/knowledge, uncertain availability
of compost, variable prices, and the fact that land application of slurry is done by others,
unlike of compost.
Weaker barriers are uncertainty about nitrogen release (time, quantity), and lack of
appropriate machinery.
In mixed farms, strong barriers are the availability of (own) slurries, fear for diseases
carried with compost. Having sufficient soil humus content already, and labour
requirement count as (weak) barriers. Further, most of the above barriers hold for mixed
farms, too. Mixed farmers do not feel encouraged (SN category) by any of referents:
extension, farmers, producers, education, municipality, research and press.
The Netherlands
There is only one strong barrier: compost may contain unwanted waste. Weaker barriers
are labour requirement, and ample availability of slurry (competing product) in the region.
Legal restrictions on phosphate use are a (weak) barrier, in spite of the ‘phosphate-
discount’ applicable for compost (a relaxation of the legislative constraint).

CATCH-C
No. 289782
Deliverable number:
22 May 2015
Page 70 of 180
Table 17: The top three drivers and barriers per FTZ unit for BMP Application of Compost (A = attitude, PBC = perceived behavioural control).
Drivers Barriers
Country FTZ question Value Type Nature Question Value Type Nature
BE arable/specialized crop
farms
Improved soil fertility 5.1 A Natural Low offer of compost -4.6 PBC Physical
Improved soil life 5.1 A Natural Expensive transport -4.5 PBC Financial
Improved soil health 4.9 A Natural Contains waste products -4.5 A Natural
mixed farms
(vegetables/pigs)
Improved soil structure 5.9 A Natural Too much slurry -5.8 PBC Social
Better soil life 5.5 A Natural Extension -5.4 SN Social
More humus 5.3 A Natural Other farmers -5.3 SN Social
NL arable farms on sandy
soils
Compost provides organic matter 8.2 A Natural It can contain unwanted waste -7.0 A Natural
Can be applied in the fall/winter 6.7 A Natural Cost more labour to apply -2.5 A Human
Extension agents are positive 4.0 SN Social Slurry is largely available -1.8 PBC Natural

CATCH-C
No. 289782
Deliverable number:
22 May 2015
Page 71 of 180
2.6.5 BMP Application of Reactor Digestate
The Netherlands
- arable farms on clay soils (18A=ENZ4,ENZ7_TXT2,TXT3_SL1) ; N=100
- arable farms on sandy soils (20A=ENZ4,ENZ7_TXT1_SL1); N=68
Drivers for Application of Reactor Digestate
The Netherlands
The strongest drivers are of category A and are similar between both soil texture groups:
ease of application, homogeneous and well-specified (nutrient contents) product, organic
matter supply, increase of soil fauna. Weaker drivers are the low cost (still strong on
sand), and fast nitrogen availability. Suppliers are a (weak) driver of the SN category.
Barriers for Application of Reactor Digestate
The Netherlands
Barriers are present in each category (A, SN, PBC), with weakest barriers in the SN
category.
Well expressed barriers (category A) for both soils are risk of contaminating the soil
(strong on clay), and an increase in crop diseases (expressed but not strong on either soil
type).
In the PBC category, there is a mix of natural, human, financial, and physical barriers.
Strongest again ranks the lack of guarantee that the product is free of diseases (strong on
clay, not on sand). In the sand district, high availability of untreated manure (competing
product) is a barrier. Further weak barriers include cost, uncertainty of origin, and legal
constraints related to phosphate input.

CATCH-C
No. 289782
Deliverable number:
22 May 2015
Page 72 of 180
Table 18: The top three drivers and barriers per FTZ unit for BMP Application of Reactor Digestate (A = attitude, PBC = perceived behavioural control).
Drivers Barriers
Country FTZ Question Value Type Nature Question Value Type Nature
NL arable farms on
clay soils
It is easy to apply 6.1 A Human
Applying digestate increases the risk on
contaminating my fields -5.5 A Natural
The composition is homogeneous 6.0 A Natural Applying Digestate increases diseases -5.3 A Natural
You know what minerals are in digestate 5.8 A Human No guarantee that it is disease free -4.4 PBC Natural
arable farms on
sandy soils
It is easy to apply 7.4 A Human
Applying digestate increases the risk on
contaminating my fields -4.8 A Natural
The composition is homogeneous 7.0 A Natural There is a large supply of manure in my region -4.1 PBC Natural
You know what minerals are in digestate 6.2 A Human Applying digestate increases diseases -4.1 A Natural

CATCH-C
No. 289782
Deliverable number:
22 May 2015
Page 73 of 180
2.6.6 BMP Spring Application of Manure on Clay
The Netherlands
- arable farms on clay soils (18A=ENZ4,ENZ7_TXT2,TXT3_SL1) ; N=101
Drivers for Spring Application of Manure on Clay
The Netherlands
In the Netherlands it is no longer allowed to apply manures to land in autumn. As a result,
arable farmers on clay – where manures were traditionally applied only in autumn – were
faced with the choice between abstaining from the use of animal manures, or adopting
techniques enabling spring application without damaging the (then susceptible) soil
structure. Technological innovations to enable spring application on clay soils include
low-pressure tires, and drag hoses where the (heavy) slurry tank remains at the edge of the
field.
Strong drivers for the spring application of manures are financial (arable farmers receive
money for accepting manures from livestock farmers) but also benefits to yield, and soil
organic matter content. A weaker driver are benefits to soil fauna. All of these are in
category A. Extension and press are positive about this practice, too (no strong drivers).
Another driver requires more explanation. Manures are mostly produced in the sand
district, but land application in the clay districts is often in a narrow time window when
weather and soil conditions permit. This window is so tight that manures can only be
successfully applied if they already stored in the clay regions. This requires capacity for
temporary storage. Farmers expressed that enabling such storage facilities would be a
strong driver. However, there are legal restrictions to building such facilities.
Barriers for Spring Application of Manure on Clay
The Netherlands
Strong barriers – apart from local storage capacity – are soil damage (tracks due to heavy
equipment), slurry makes for fatty and sticky soils, uncertainty about composition, and
unwanted dependence on contractors. Despite innovations, farmers still consider weather
conditions often too wet for land application in spring (strong barrier). The fact that
trailing hose manure spreading technology is no longer permitted (slurry exposed for too
long on the soil surface, allowing ammonia loss) was also reported as barrier because that
practice was ‘friendly’ to standing crops (winter wheat).

CATCH-C
No. 289782
Deliverable number:
22 May 2015
Page 74 of 180
Table 19: The top three drivers and barriers per FTZ unit for BMP Spring Application of Manure on Clay (A = attitude, PBC = perceived behavioural control).
Drivers Barriers
Country FTZ question Value Type Nature question Value Type Nature
NL arable farms
on clay soils
No storage facility for the manure 7.2 PBC Physical It makes heavy tracks -6.9 A Natural
Financial beneficial 6.2 A Financial The weather is often too wet to apply manure in the spring -5.9 PBC Natural
It delivers organic matter to the soil 6.0 A Natural It makes the soil fatty and sticky -5.7 A Natural

CATCH-C
No. 289782
Deliverable number:
22 May 2015
Page 75 of 180
2.6.7 BMP Row Application of Slurry
The Netherlands
- dairy farms on sandy soils (20C=ENZ7_TXT1_SL1)
Drivers for Row Application of Slurry
The Netherlands
There are virtually no drivers for this practice. There is only one driver of category A,
which is of financial nature: less manure is needed to reach a certain yield. This is at the
same time a barrier (see below). The low driver score also reflects that most dairy farmers
have no shortage of manures.
Drivers of SN category are positive research outcomes (strong), and good on-farm results
(weaker). All PBC variables show negative scores (weak barriers).
Barriers for Row Application of Slurry
The Netherlands
Several barriers of category A are expressed strongly: extra cost of land application, time
constraints of the contractor, more physical damage to roots, , and technical complexity.
Weaker barriers are the risk for ‘root burn’ damage to the crop, and the fear for (even
tighter) legal restrictions (application standards: allowed nitrogen input quota) once it is
shown that row application saves nitrogen while enabling the same yield. In category
PBC, strong barriers are that contractors do not have proper equipment, and that the
practice generates no extra profit.
Background. The suitable time window for land application of slurries is narrow. Large
scale application by contractors requires a high working speed, which does not allow to
combine slurry application with maize seeding. As a result, land application and seeding
are two separate events. This rendered row application of slurry infeasible, until the
widespread arrival of GPS guidance. With this technology, the two practices (slurry
application, seeding) can remain separate while still achieving proper spatial matching of
crop row with slurry row. In spite of this advance, however, the practice is still not
broadly accepted.

CATCH-C
No. 289782
Deliverable number:
22 May 2015
Page 76 of 180
Table 20: The top three drivers and barriers per FTZ unit for BMP Row Application of Slurry (A = attitude, PBC = perceived behavioural control).
Drivers Barriers
Country FTZ question Value Type Nature question Value Type Nature
NL
dairy farms on
sandy soils
Research is positive on row application of
manure 3.73 SN Human
Row application increases the costs to
apply manure -6.8 A Financial
On farm tests of row application of manure
show good results 2.52 SN Social
With row application of manure the
contractor faces increasing time pressure -6.0 A Human
With row applications you need less manure
for the same yield 2.30 A Financial
With row application of manure you get
more physical damage -5.4 A Natural

CATCH-C
No. 289782
Deliverable number:
22 May 2015
Page 77 of 180
2.7 Water management
2.7.1 BMP Sprinkler and Drip irrigation
Italy
- dairy cattle/temporary grass (16C=ENZ12_SL1_TXT2,TXT1,TXT3); N=92
- arable/cereal (16A=ENZ12_SL1_TXT1,TXT2_TXT3);N=108
Drivers for Sprinkler and Drip Irrigation
Italy
On dairy farms, the strong drivers are again of category A: higher water use efficiency and
crop yield, avoidance of drought stress and waterlogging, lower diesel consumption (for
drip), lower water consumption, less soil compaction. A weaker driver is reduction of
insects (sprinkler). Opinion among referents is positive or close to neutral. High water
availability is a weak driver of the PBC category.
In the arable farms of the plain, additional strong drivers (besides all of the above) are
avoidance of diseases, the possibility of fertigation, lower nutrient leaching. Other
advantages (weak drivers) of sprinklers are the ‘washing’ of crop plants and an improved
micro-climate. Suppliers and collectors (of farm inputs and products) have positive
opinion about these techniques. Factors that support the BMP (PBC) are sandy soils, high
water availability, and high-value crops.
Barriers for Sprinkler and Drip Irrigation
Italy
In both farm types (dairy, arable), the main barriers (all strong, category A) are higher
investment cost, and higher operational cost (diesel consumption). Small field size is a
barrier, too in arable farms.
For the dairy farms, the extra time required to handle the self-retracting hose reel is an
additional barrier (not cited for the arable farms).


CATCH-C
No. 289782
Deliverable number:
22 May 2015
Page 79 of 180
Table 21: The top three drivers and barriers per FTZ unit for BMP Sprinkler and Drip Irrigation (A = attitude, PBC = perceived behavioural control).
Drivers Barriers
Country FTZ question Value Type Nature question Value Type Nature
IT dairy cattle/temporary
grass
Higher water use efficiency 6.1 A Natural Higher costs -6.8 A Financial
Higher crop yield 5.8 A Natural Higher diesel consumption (sprinkler) -4.3 A Physical
No crop water stress 5.3 A Natural Longer work for self-retracting hose reel -2.7 A Human
arable/cereal
Higher crop yield 6.9 A Natural Drip irrigation increases operating costs -4.1 A Financial
Drip irrigation allows fertigation 4.6 A Physical
Sprinkler irrigation causes high initial
investments -3.1 A Financial
Drip irrigation reduces energy and fuel
costs 4.4 A Financial Reduced field size with impediments -2.1 PBC Physical


CATCH-C
No. 289782
Deliverable number:
22 May 2015
Page 81 of 180
3 Short term financial costs associated with the application
of Best Practices
3.1 Methodology
In the approach we distinguish two pathways to calculate costs. First pathway relates to
management practices that affect the cultivation of a specific crop or field, second pathway
relates to practices that affect the crop rotation on the farm. The implications of practices of the
latter type are more complicated, as they depend on the share of farm area where the BMP is
implemented. The calculations for the two pathways are further explained in sections 3.1.1 and
3.1.2.
3.1.1 Practices that affect the cultivation of a specific crop (First pathway).
In this situation the changes are limited to the plot of land or area on which the crop is grown.
The baseline or reference costs of the standard practice can be obtained from the regular, often
national, accounting systems and are commonly expressed in euro per ha. The costs related to
the actions needed to implement the BMP are additional. If standard practices are no longer
necessary when applying the BMP, then the associated costs need to be subtracted.
To quantify the cost of the BMP two steps are needed:
1. Start with a standard cost calculation for the crop in question. This is most likely to be
available from the economic department or from farmers’ organisations or national statics
offices. For example in the Netherlands the “kwantitatieve informatie” or KWIN is used
(Schreuder et al. 2012; Vermeij 2013).
2. Create a table describing the differences in costs between the standard practice and the
BMP for the crop in question. Consider the following items:
a. Inputs (seed, fertilizers, pesticides, ...)
b. Labour (number of hours for different tasks)
c. Machine use (variable costs like petrol)
d. Machine ownership (investment costs, only differences when different machines need to
be used with higher costs).
As example for the calculations we look at the BMP “undersowing a green manure in maize”
in the Netherlands. The standard practice is to sow a green manure after the harvest of maize.
The BMP is to sow the green manure three weeks after planting the maize. To implement this
practice a more expensive machine is needed.
The reference costs items and the BMP cost items are presented in Table 22.
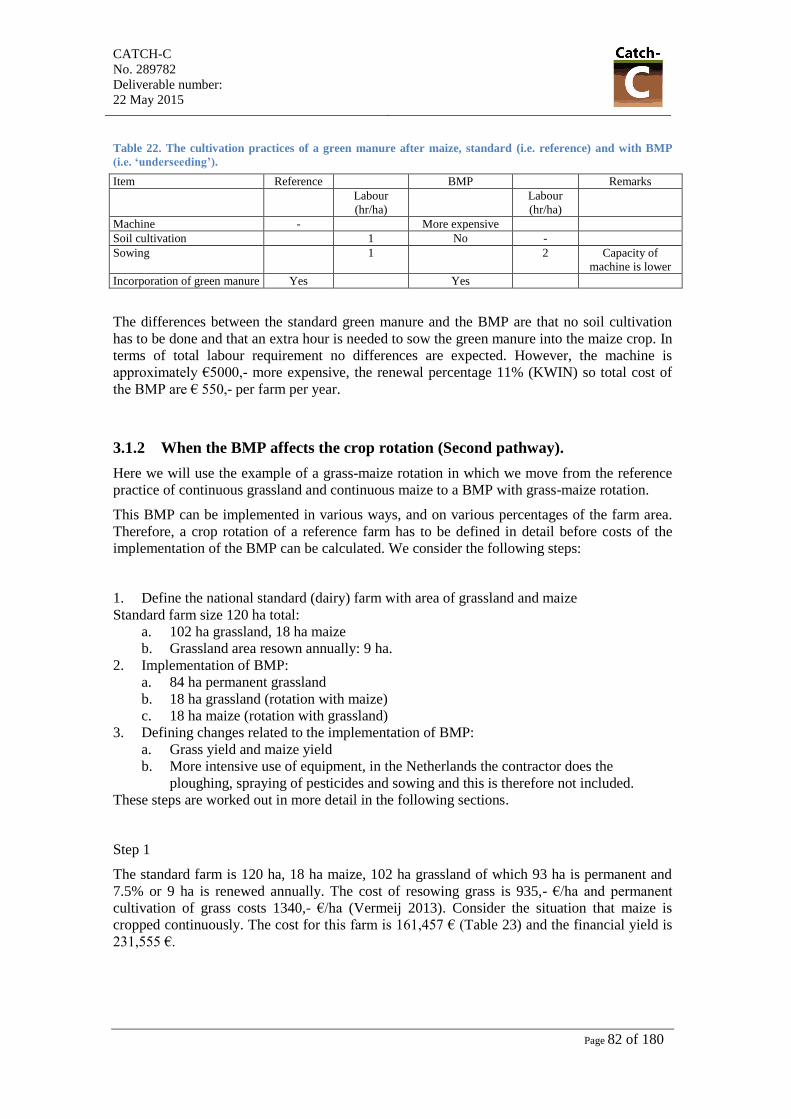
CATCH-C
No. 289782
Deliverable number:
22 May 2015
Page 82 of 180
Table 22. The cultivation practices of a green manure after maize, standard (i.e. reference) and with BMP
(i.e. ‘underseeding’).
Item Reference BMP Remarks
Labour
(hr/ha)
Labour
(hr/ha)
Machine - More expensive
Soil cultivation 1 No -
Sowing 1 2 Capacity of
machine is lower
Incorporation of green manure Yes Yes
The differences between the standard green manure and the BMP are that no soil cultivation
has to be done and that an extra hour is needed to sow the green manure into the maize crop. In
terms of total labour requirement no differences are expected. However, the machine is
approximately €5000,- more expensive, the renewal percentage 11% (KWIN) so total cost of
the BMP are € 550,- per farm per year.
3.1.2 When the BMP affects the crop rotation (Second pathway).
Here we will use the example of a grass-maize rotation in which we move from the reference
practice of continuous grassland and continuous maize to a BMP with grass-maize rotation.
This BMP can be implemented in various ways, and on various percentages of the farm area.
Therefore, a crop rotation of a reference farm has to be defined in detail before costs of the
implementation of the BMP can be calculated. We consider the following steps:
1. Define the national standard (dairy) farm with area of grassland and maize
Standard farm size 120 ha total:
a. 102 ha grassland, 18 ha maize
b. Grassland area resown annually: 9 ha.
2. Implementation of BMP:
a. 84 ha permanent grassland
b. 18 ha grassland (rotation with maize)
c. 18 ha maize (rotation with grassland)
3. Defining changes related to the implementation of BMP:
a. Grass yield and maize yield
b. More intensive use of equipment, in the Netherlands the contractor does the
ploughing, spraying of pesticides and sowing and this is therefore not included.
These steps are worked out in more detail in the following sections.
Step 1
The standard farm is 120 ha, 18 ha maize, 102 ha grassland of which 93 ha is permanent and
7.5% or 9 ha is renewed annually. The cost of resowing grass is 935,- €/ha and permanent
cultivation of grass costs 1340,- €/ha (Vermeij 2013). Consider the situation that maize is
cropped continuously. The cost for this farm is 161,457 € (Table 23) and the financial yield is
231,555 €.

CATCH-C
No. 289782
Deliverable number:
22 May 2015
Page 83 of 180
Step 2.
When maize is incorporated into the crop rotation every year 18 ha is resown.
Step 3
The main change due to the introduction of this BMP is the increase of the grassland area
which is to be resown every year: 18 ha instead of 9 ha. In addition, yield levels of maize
increase by approximately 6 ton dm/ha relative to the standard practice. The yield of renewed
grassland is lower in the first year. Only 2 cuts are produced in that year, instead of the 5 cuts
in the reference situation. The cost of cultivation is slightly lower in the BMP situation than for
the reference situation and financial yield is slightly higher.
The direct financial benefits of implementing the BMP are approximately 370 €/ha.
Table 23. Overview of the cost calculation for the standard cultivation of maize on sandy and the BMP grass-
maize rotation.
Crop Ha Cost (€/ha) Crop yield (ton
dm/ha)
Price
(€/kg dm)
Financial
yield (€/ha) Profit (€)
Reference situation
Maize 18 1449 13 0.149 1937
Green manure 18 130 - - -
Grass renewed 9 935 11 0.156 1704
Grass permanent 93 1340 13 0.156 1950
Total 120 161457 231555 70098
Grass-maize rotation
Maize 18 1449 15 0.149 2228
Green manure 18 130 - - -
Grass renewed 18 935 11 0.156 1704
Grass permanent 84 1340 13 0.156 1950
Total 120 157812 234 573 76761
Cost €/ha -370
3.2 France
The objective is to assess the cost of BMP adoption in France and is a contribution to MS442.
In France, two BMPs have been chosen:
1. Simplified cultivation techniques (SCT) : a. deep reduced tillage: use of chisel plough or field cultivator to depths of over 15 cm.
b. reduced tillage: use of chisel plough or field cultivator to depths of 5 - 15 cm.
c. strip till : this type of tillage is performed with special equipment, to till up an 20 – 25
cm row, and at the same time incorporate fertilizers or chemicals, and just behind,
seed.
2. Catch-crops (CC): soil is covered by specific crops during November to March.

CATCH-C
No. 289782
Deliverable number:
22 May 2015
Page 84 of 180
Adoption costs for these BMPs are of several orders. First, prior to adoption, there are
transaction costs, related to time the farmer allocates to look for information about drawbacks
and advantages of the BMP, eventually to contact an advisor if there is an agri-environmental
measure available, time devoted to administrative documents to be filled. INRA has estimated
these costs for several BMPs in France, using outcomes from a EU project, ITAES1. We have
relied on their measurements to assess the private transaction associated with the BMPs chosen
for France.
Short term costs correspond to yield losses, difference in fuel consumption, adjustments of
fertilisation, and they occur with the same magnitude over years. There are also long term
costs, related to investment for specific material. Regarding investment, two options exist:
either the farm totally converts to a technique, and then the new material is paid off as normal
renewing of the material; or the farm adopts the BMP one year out of two, or four years out of
five, and there is a need for new investment. INRA discounts investments at a 4% yearly rate
(actualisation rate). All the costs described in this report come from the analysis performed by
INRA (Pellerin et al. 2013).
Additionally, during the survey in three AENZ in France, we have asked the farmers about
their perception of costs and how it impacts their decision of adopting a BMP. This enables us
to extend the INRA analysis over a more local perspective.
3.2.1 INRA expertise on BMPs
Pellerin et al.(2013) analysed the direct costs of several BMPs: simplified techniques,
simplified techniques once every other year, traditional ploughing once every 5 years, and
direct seeding. From FADN data, material costs and expertise, they conclude that, compared to
traditional ploughing, all the techniques result in a lower net return (Error! Reference source
ot found.). For the BMP simplified cultivation techniques this lower net return is 12 €/ha.
Notable are the reduction of fuel costs, the increase in herbicides use, and decrease of work
load (Table 24).
For catch crops the costs estimates provided by Pellerin et a.l (2013) are not very detailed.
They estimate costs of 41 €/ha. Other institutes report seeds cost ranging from 12 to 87 €/ha,
seeding operations ranging from 25 to 67 €/ha, and destruction of the catch crop ranging from
7 to 25 €/ha (Charles et al. 2012).
Table 24: INRA estimations of product net return depending on the technique (€/ha).
Product (€/ha)
Traditional ploughing 1214
Simplified cultivation techniques 1202
Simplified cultivation techniques once every other year 1208
Traditional ploughing once every 5 years 1164
Direct seeding 1121
1 https://w3.rennes.inra.fr/internet/ITAES/website/Objectives.html
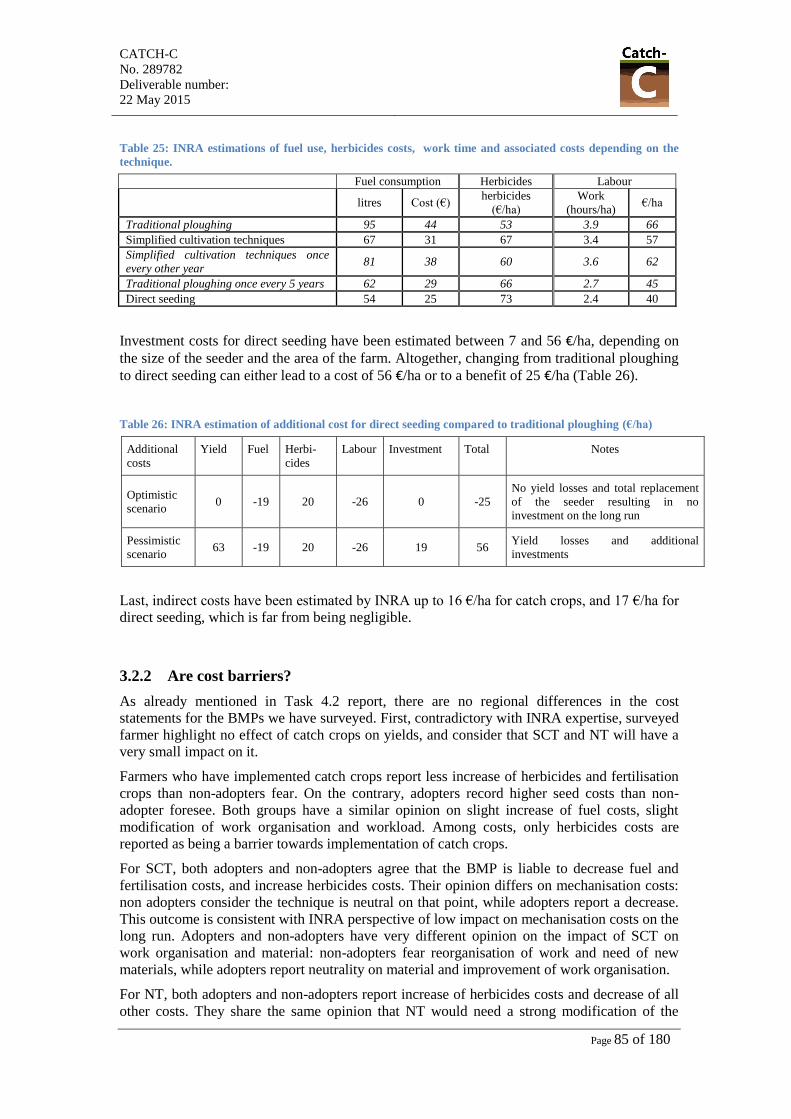
CATCH-C
No. 289782
Deliverable number:
22 May 2015
Page 85 of 180
Table 25: INRA estimations of fuel use, herbicides costs, work time and associated costs depending on the
technique.
Fuel consumption Herbicides Labour
litres Cost (€) herbicides
(€/ha)
Work
(hours/ha) €/ha
Traditional ploughing 95 44 53 3.9 66
Simplified cultivation techniques 67 31 67 3.4 57
Simplified cultivation techniques once
every other year 81 38 60 3.6 62
Traditional ploughing once every 5 years 62 29 66 2.7 45
Direct seeding 54 25 73 2.4 40
Investment costs for direct seeding have been estimated between 7 and 56 €/ha, depending on
the size of the seeder and the area of the farm. Altogether, changing from traditional ploughing
to direct seeding can either lead to a cost of 56 €/ha or to a benefit of 25 €/ha (Table 26).
Table 26: INRA estimation of additional cost for direct seeding compared to traditional ploughing (€/ha)
Additional
costs
Yield Fuel Herbi-
cides
Labour Investment Total Notes
Optimistic
scenario 0 -19 20 -26 0 -25
No yield losses and total replacement
of the seeder resulting in no
investment on the long run
Pessimistic
scenario 63 -19 20 -26 19 56
Yield losses and additional
investments
Last, indirect costs have been estimated by INRA up to 16 €/ha for catch crops, and 17 €/ha for
direct seeding, which is far from being negligible.
3.2.2 Are cost barriers?
As already mentioned in Task 4.2 report, there are no regional differences in the cost
statements for the BMPs we have surveyed. First, contradictory with INRA expertise, surveyed
farmer highlight no effect of catch crops on yields, and consider that SCT and NT will have a
very small impact on it.
Farmers who have implemented catch crops report less increase of herbicides and fertilisation
crops than non-adopters fear. On the contrary, adopters record higher seed costs than non-
adopter foresee. Both groups have a similar opinion on slight increase of fuel costs, slight
modification of work organisation and workload. Among costs, only herbicides costs are
reported as being a barrier towards implementation of catch crops.
For SCT, both adopters and non-adopters agree that the BMP is liable to decrease fuel and
fertilisation costs, and increase herbicides costs. Their opinion differs on mechanisation costs:
non adopters consider the technique is neutral on that point, while adopters report a decrease.
This outcome is consistent with INRA perspective of low impact on mechanisation costs on the
long run. Adopters and non-adopters have very different opinion on the impact of SCT on
work organisation and material: non-adopters fear reorganisation of work and need of new
materials, while adopters report neutrality on material and improvement of work organisation.
For NT, both adopters and non-adopters report increase of herbicides costs and decrease of all
other costs. They share the same opinion that NT would need a strong modification of the

CATCH-C
No. 289782
Deliverable number:
22 May 2015
Page 86 of 180
material and a slight one on work organisation. But their opinions differ on workload: non-
adopters believe that NT will decrease workload, while adopters report neutrality.
Displaying the data with a Principal component analysis provides additional and interesting
information (Figure 5): if we start from the objectives at farm level (in red on the figure), we
can notice there are two main groups of variables. On the right side are farmers who declare
themselves willing to be independent (in general), limit money losses, decrease taxes and
debts, increase premiums; these are sensitive to increase in fuel, mechanisation, fertilisation
costs, along with work load (in blue as additional variables). They also invest in land and either
on family earnings or on new materials (which are a bit opposite).
Figure 5: principal component analysis of cost in the French farm survey
In this group, adoption of catch crops seems to be opposite to high costs forecasts, but there is
no clear distinction of farmers and we can find non-adopters in very close position to adopters.
On the left side, we can find farmers who already have a high share of their land in property,
who talk about making profit and making an earning, and, maybe more important, seek to gets
independence, not in general, but from EU decisions. Most of them are SCT adopters, but not
all (Figure 6Error! Reference source not found.).

CATCH-C
No. 289782
Deliverable number:
22 May 2015
Page 87 of 180
Figure 6: individuals in the principal component analysis of cost in the French farm survey
3.2.3 Conclusion (France)
From the literature survey, in France, there are strong discrepancies in cost estimations for
catch crops, SCT and no tillage, ranging from high costs to some benefits. Maybe these
discrepancies, due to the variety of technique combinations, create unclear messages that can
be barriers towards adoption (non-adopters quoting higher costs than adopters).
Clearly, from our survey, some famers have adopted some BMP despite the costs (and not only
catch crops in vulnerable zones). It can be because these farmers balance differently the
expected benefits with costs, or hope that these costs can decrease over years (it is noticeable
that the size of the period over which farmers have adopted a BMP is orthogonal to costs
estimates in our survey).
The BMP Simplified Cultivation Techniques reduce net return by 12 €/ha and the BMP Cover
Crops cost 45 €/ha.
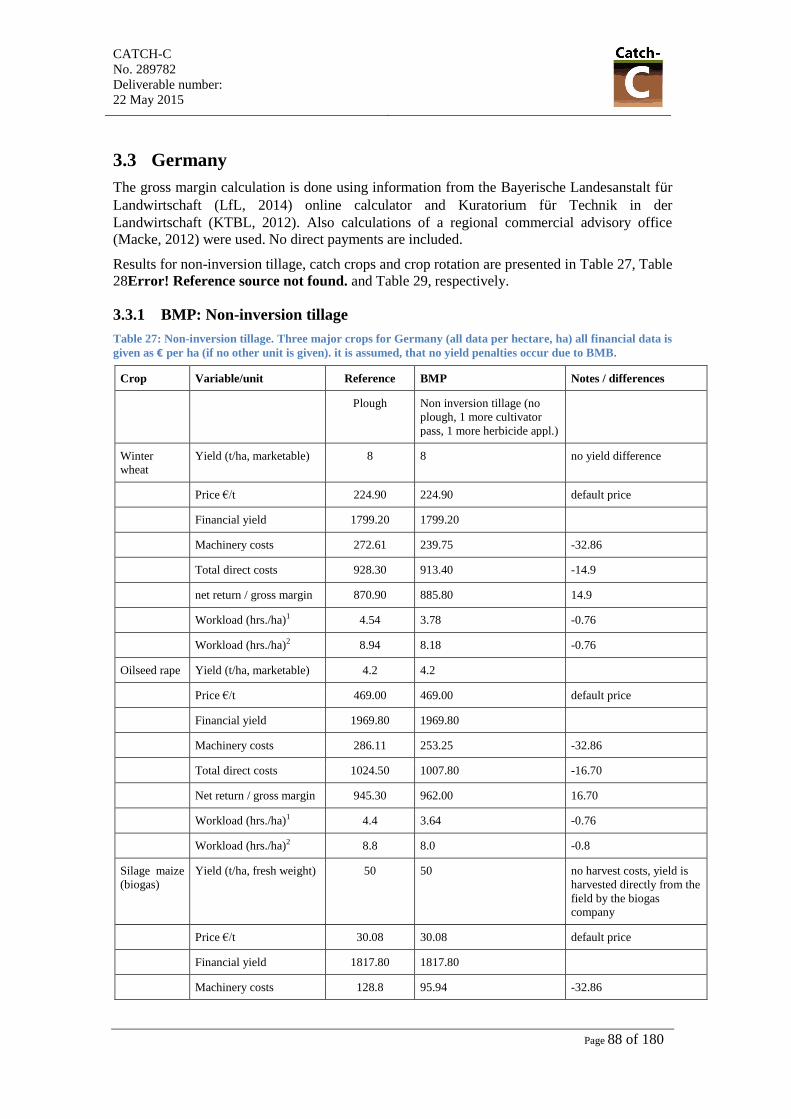
CATCH-C
No. 289782
Deliverable number:
22 May 2015
Page 88 of 180
3.3 Germany
The gross margin calculation is done using information from the Bayerische Landesanstalt für
Landwirtschaft (LfL, 2014) online calculator and Kuratorium für Technik in der
Landwirtschaft (KTBL, 2012). Also calculations of a regional commercial advisory office
(Macke, 2012) were used. No direct payments are included.
Results for non-inversion tillage, catch crops and crop rotation are presented in Table 27, Table
28Error! Reference source not found. and Table 29, respectively.
3.3.1 BMP: Non-inversion tillage
Table 27: Non-inversion tillage. Three major crops for Germany (all data per hectare, ha) all financial data is
given as € per ha (if no other unit is given). it is assumed, that no yield penalties occur due to BMB.
Crop Variable/unit Reference BMP Notes / differences
Plough Non inversion tillage (no
plough, 1 more cultivator
pass, 1 more herbicide appl.)
Winter
wheat
Yield (t/ha, marketable) 8 8 no yield difference
Price €/t 224.90 224.90 default price
Financial yield 1799.20 1799.20
Machinery costs 272.61 239.75 -32.86
Total direct costs 928.30 913.40 -14.9
net return / gross margin 870.90 885.80 14.9
Workload (hrs./ha)1 4.54 3.78 -0.76
Workload (hrs./ha)2 8.94 8.18 -0.76
Oilseed rape Yield (t/ha, marketable) 4.2 4.2
Price €/t 469.00 469.00 default price
Financial yield 1969.80 1969.80
Machinery costs 286.11 253.25 -32.86
Total direct costs 1024.50 1007.80 -16.70
Net return / gross margin 945.30 962.00 16.70
Workload (hrs./ha)1 4.4 3.64 -0.76
Workload (hrs./ha)2 8.8 8.0 -0.8
Silage maize
(biogas)
Yield (t/ha, fresh weight) 50 50 no harvest costs, yield is
harvested directly from the
field by the biogas
company
Price €/t 30.08 30.08 default price
Financial yield 1817.80 1817.80
Machinery costs 128.8 95.94 -32.86

CATCH-C
No. 289782
Deliverable number:
22 May 2015
Page 89 of 180
Crop Variable/unit Reference BMP Notes / differences
Total direct costs 1068.70 1063.90 -4.80
Net return / gross margin 749.10 753.9 4.80
Workload (hrs./ha)1 3.46 2.7 -0.76
Workload (hrs./ha)2 7.86 7.1 -0.76
1 machinery 2 total system
3.3.2 BMP: Catch Crops
Table 28: Calculations for Catch Crop (Zwischenfrucht, that means sensu strictu green manure, not
harvested).
Additional costs
Conventional
Cultivator (€ / ha) 16.40
Seeding material (€ / ha) 56.50
seeding machinery (€ / ha) 31.33
Cutting/mulching (€ / ha) 31.26
Total (€ / ha) 135.70
Workload (hr/ha) 2.45
In case of failure or low/hardly any frost
Herbicide (glyphosate) (€ / ha) 20.00
Application (€ / ha) 4.56
Total (€ / ha) 24.56
Workload (hr/ha) 0.18
Note: It can happen, that due to low, hardly any frost an additional glyphosate application is required. Then, these costs have to be
added.

CATCH-C
No. 289782
Deliverable number:
22 May 2015
Page 90 of 180
3.3.3 BMP: Crop Rotation
Table 29: Calculations for Crop Rotation. Comparison of different typical rotations for central Germany
including the valuation of beneficial value of pre-crop* (data according to Macke, 2012). Euro per hectare.
Ranking according to gross margin. Reference rotation is continuous maize. The BMP Crop Rotation in
defined as including at least four crops in the rotation
Rotation Rank Average Gross
Margin of rotation
(€/ha)
Comparison
(extended > simple)
based on ranks
Difference (benefit of
extended rotation)
(€/ha)
beet-wheat-wheat-barley 1 530 1 > 4 38
beet-wheat-barley-rape-wheat-
wheat
2 509 2 > 3
2 > 4
2 > 5
15
17
57
rape-wheat-wheat-barley 3 494 3 > 5 42
beet-wheat-wheat 4 492
rape-wheat-wheat 5 452
rape-wheat-maize-wheat 6 451 6 > 8 84
rape-wheat-maize-wheat-wheat 7 445 6 > 7 78
maize-wheat-wheat 8 367 8 > 9 35
maize-maize-maize1 9 332
* Comparisons are made for a diverse rotation and another (or a couple of) simple rotations of a similar structure. So, as an
example #1 could be seen as a diversified type of #4, but not of #5.
1 here, maize is calculated as a market crop, despite is often cropped in bioenergy or dairy farms for internal nutrient and raw matter cycling. So, rotation #9 does not reflect the overall picture. Many farmers grow biogas maize with higher profitability. Also
dairy farmers get more financial benefits from maize.
3.3.4 Conclusions (Germany)
Non-inversion tillage
From the results (Table 27) it is clear that the BMP is equal to the reference system or slightly
better. Whether gross margin calculations provide the best picture of the economics of reduced
tillage is debatable. Another way is the use of the full cost approach. This is a more or less
farm individual calculation including changes in investments, fix costs and general farm
structure. It is estimated that under full costs non-inversion tillage has economic benefits about
60 (western part of Germany) to 160 (eastern part) Euro per hectare compared to conventional
cultivation (Schneider, M., PhD Thesis Munich, 2009).
Catch Crops
For catch crops (Table 28) the implementation of the BMP is more costly when compared to
the reference system. When calculating additional costs of the BMP per hectare (ha) it is
assumed that farmers have to apply these processes on top of their regular business (data
according to LfL/KTBL). The yield of the following crop is generally not affected.
Crop rotation
From Table 29Error! Reference source not found. it is clear that diverse crop rotations are
more profitable than the reference system were continuously maize was cropped. Although, not
all farmers are able to grow sugar beets, diverse combinations of oilseed rape, wheat and
barley offer many chances for combination with maize. The BMP Crop rotation according to

CATCH-C
No. 289782
Deliverable number:
22 May 2015
Page 91 of 180
the definition of including at least four cultivations increases net return from 113 up to 198
€/ha depending on the extended crop rotation used.

CATCH-C
No. 289782
Deliverable number:
22 May 2015
Page 92 of 180
3.4 Poland
3.4.1 BMP: Reduced tillage
In Poland two systems conventional (CT) and reduced tillage (RT) on private farms in Rogów
are compared. The data are collected during 2007-2009. Results are presented in Table 30. The
average yield in the RT system was lower than in the CT system (Table 30). Production costs
(seeds, fertilizers, plant protection products) are the same for both systems. The key differences
are the labour input and the use of machines (especially cultivation) which directly relates to
differences in fuel consumption.
Table 30. Overview of the costs of winter wheat production in different technologies (winter wheat was
cultivated after pea) (average yield from 2007-2009).
Item Unit Conventional Tillage (CT) Reduced Tillage (RT) Difference
Crop yield t/ha 7.42 7.34 0.08
Value of production Euro 1159 1149 10
Seeds Euro 66 66 0
Fertilisers Euro 215 215 0
Crop protection Euro 192 192 0
Fuel Euro 72 61 11
Total costs Euro 545 534 11
Profit Euro 614 615 -1
Labour input hr/ha 8.2 7.6 -0.6
Machine hr/ha 7.2 6.6 -0.6
Fuel l 69.8 58.5 -11.3
Conversion factor from PLN to Euro is 0.25
The farm applying the RT did not buy additional equipment, and therefore was not forced to
incur additional costs. RT was performed using a disc harrow that was available on the farm.
Table 31 presents differences in cultivation treatments performed between the conventional
technique (using a plough) and RT (using a disc harrow). Disking and ploughing are applied in
CT, whereas in RT, only double disking is performed.
Table 31. Overview labour input (hr/ha) in conventional tillage (CT) and reduced tillage (RT).
Technique
Item CT RT Difference
Agricultural practices (hr/ha, tractor unit/ha):
- ploughing 1.2 - -1.2
- disking 1 1.6 (2x) 0.6

CATCH-C
No. 289782
Deliverable number:
22 May 2015
Page 93 of 180
- ploughing by seed drill unit 0.7 0,7 0
Total input 2.9 2.3 -0.6
Conversion factor from PLN to Euro is 0.25
The same set of drill-seed was used in both systems. Other treatments, such as fertilization,
plant protection and harvesting of wheat in both systems were performed using the same
equipment.
Based on data from Table 31, implementing of RT instead of conventional tillage results in
decrease of labour and machinery input per hectare, respectively of 0.6 h and 0.6 tractor unit.
Reducing labour input is not included in the cost calculation because all labour is provided by
the farmer (FADN methodology). The difference resulting from reduced consumption of 0.6
tractor unit is reflected in the lower fuel consumption of 11.3 l per ha (Table 30).
In the conventional tillage, straw was collected and sold. In the RT system straw was
incorporated. Therefore, the additional benefits and losses should be considered. Harvest
residues left on the field in the form of chopped straw, after mixing with the top layer of soil,
improve its structure, and further provide additional quantities of phosphorus and potassium,
allowing the farmer to reduce the dose of a mineral acid and potassium fertilizer for
forthcoming cultivation.
For the calculation of the benefits of straw incorporation, the ratio of straw to winter wheat
grain harvested by combine was adopted. The ratio is 1:0.97 (Harasim 2006).
In our experiment, 7.56 t of crop residues, mainly straw, remains in the field and is mixed with
the topsoil. Straw contains 0.11% phosphorus and 1.06% potassium (Harasim 2006). Leaving
wheat straw in the field, we supply the soil with 6.7 kg of phosphorus and 64.9 kg of potassium
per hectare (in elemental form). After conversion to an oxide form, we obtain 15 kg P2O5 and
78 kg K2O.
Table 32: Calculation of the cost of benefits and losses resulting from incorporation of a straw applying RT in
winter wheat.
Calculation in PLN Calculation in Euro
Savings resulting from phosphorus and potassium supplied by
crop residues
(about 7 kg P2O5, 47 kg K2O per ha)
15 kg ∗ 4.32 PLN/kg +
78 kg ∗ 3.00 PLN/kg =
298.80 PLN
+74.70
Loss of benefits from the selling of straw (7.34 t crop yield,
7.56 t straw) 7.56 dt ∗ 150.00
PLN/dt
= 1134.00 PLN
-283.50
The costs of the additional nitrogen (to decompose the straw
in a dosage of 30 kg N /ha)
56 kg ∗ 3.62 PLN/kg =
202.72 PLN
-51.00
Calculation of leaving crop residues on the 1 hectare in RT -1037.92 PLN -259.48
Conversion factor from PLN to Euro is 0.25
For winter crops, it is advised to provide an additional dose of nitrogen fertilization (8-10 kg
N/t straw) (Harasim 2011). This will cause that nitrogen supplied before sowing of the crops
will be able to be fully exploited. Nitrogen dose adopted on the straw was 56 kg / ha. The value
of straw is set at 150 PLN/t (37.5 Euro/t) (prices for 2013) Ratios calculation to elemental form
after Harasim (2006) are: potassium – K x 1,2 = K2O, phosphorus – P x 2,29 = P2O5. An

CATCH-C
No. 289782
Deliverable number:
22 May 2015
Page 94 of 180
alternative calculation of the costs of leaving straw on the field shows that farmer suffers an
economic loss of 260 Euros per hectare.
3.4.2 Conclusion (Poland)
Reduced tillage yields almost the same profit as conventional tillage (1€ difference).The
somewhat lower financial yield of the product is compensated by less fuel use and although not
included in the financial evaluation, by reduced labour needs. There is no additional need for
crop protection.
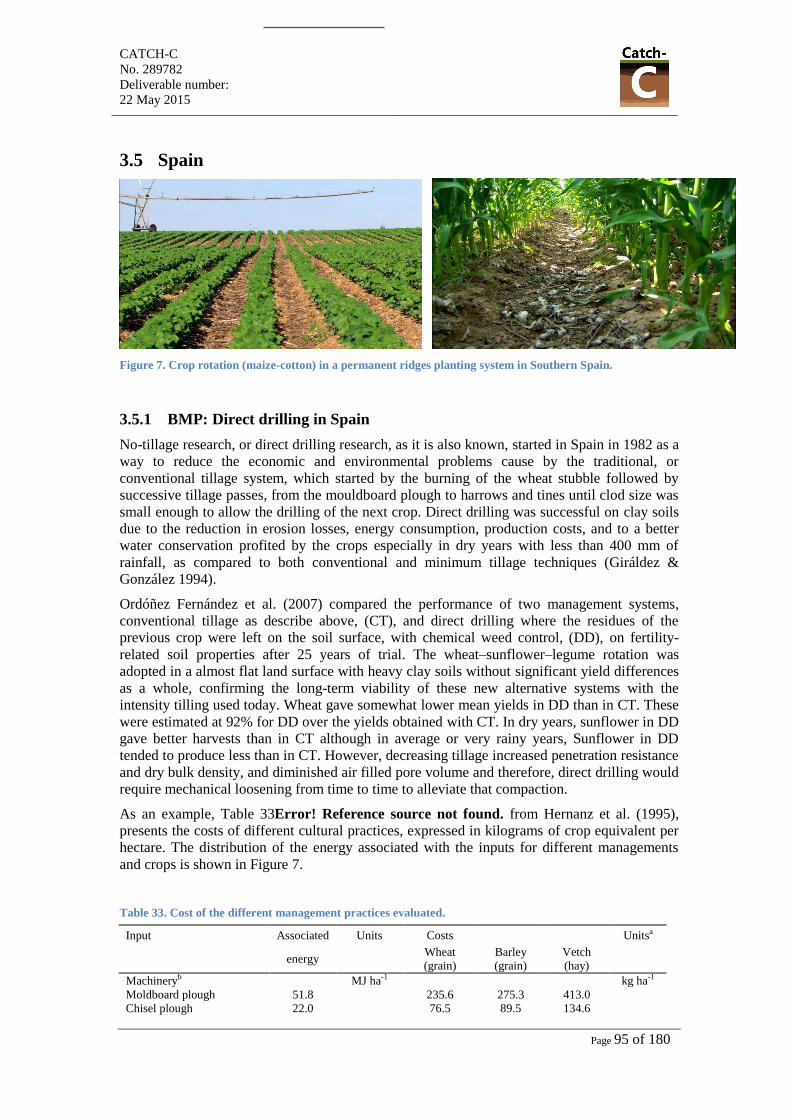
CATCH-C
No. 289782
Deliverable number:
22 May 2015
Page 95 of 180
3.5 Spain
Figure 7. Crop rotation (maize-cotton) in a permanent ridges planting system in Southern Spain.
3.5.1 BMP: Direct drilling in Spain
No-tillage research, or direct drilling research, as it is also known, started in Spain in 1982 as a
way to reduce the economic and environmental problems cause by the traditional, or
conventional tillage system, which started by the burning of the wheat stubble followed by
successive tillage passes, from the mouldboard plough to harrows and tines until clod size was
small enough to allow the drilling of the next crop. Direct drilling was successful on clay soils
due to the reduction in erosion losses, energy consumption, production costs, and to a better
water conservation profited by the crops especially in dry years with less than 400 mm of
rainfall, as compared to both conventional and minimum tillage techniques (Giráldez &
González 1994).
Ordóñez Fernández et al. (2007) compared the performance of two management systems,
conventional tillage as describe above, (CT), and direct drilling where the residues of the
previous crop were left on the soil surface, with chemical weed control, (DD), on fertility-
related soil properties after 25 years of trial. The wheat–sunflower–legume rotation was
adopted in a almost flat land surface with heavy clay soils without significant yield differences
as a whole, confirming the long-term viability of these new alternative systems with the
intensity tilling used today. Wheat gave somewhat lower mean yields in DD than in CT. These
were estimated at 92% for DD over the yields obtained with CT. In dry years, sunflower in DD
gave better harvests than in CT although in average or very rainy years, Sunflower in DD
tended to produce less than in CT. However, decreasing tillage increased penetration resistance
and dry bulk density, and diminished air filled pore volume and therefore, direct drilling would
require mechanical loosening from time to time to alleviate that compaction.
As an example, Table 33Error! Reference source not found. from Hernanz et al. (1995),
presents the costs of different cultural practices, expressed in kilograms of crop equivalent per
hectare. The distribution of the energy associated with the inputs for different managements
and crops is shown in Figure 7.
Table 33. Cost of the different management practices evaluated.
Input Associated Units Costs Unitsa
energy Wheat
(grain)
Barley
(grain)
Vetch
(hay)
Machineryb
MJ ha-1
kg ha-1
Moldboard plough 51.8
235.6 275.3 413.0
Chisel plough 22.0
76.5 89.5 134.6

CATCH-C
No. 289782
Deliverable number:
22 May 2015
Page 96 of 180
Disc plough 34.3
90.3 104.8 156.8
Cultivator 13.2
63.5 74.2 110.9
Vibrocultor 11.9
69.6 81.1 122.4
Conventional drill 21.7
60.4 70.4 105.5
Zero-till drill 41.7
99.4 115.5 173.6
Spreader 2.8
15.3 17.6 26.0
Sprayer 2.7
11.5 13.0 19.9
Combine 64.2
149.9 175.2
Bar-mover 16.5
184
Rake 6.4
87
Baler 28.8 157
Fuel MJ l-1 kg l-1
Diesel 36.6 1.9 2.2 3.3
Fertilizer MJ kg-1 kg kg-1
N 61.2
2.4 2.8 4.2
P 10.7
2.3 2.7 4.1
K 5.4 0.9 1.1 1.6
Seeds MJ kg-1 kg kg-1
Winter wheat 9.9
2.2
Winter barley 9.9
2.0
Spring barley 9.9
2.3
Vetch 7.6 2.8
Herbicidesc MJ kg-1 kg kg-1
Glyphosate 344.2
151.4 175.9 263.9
Paraquat 344.2
177.4
206.5
Joxynil+MCPP+bromoxynil 141.5 99.4 115.5 a Expressed in equivalent crop quantities, talking in account the sales prices of 1993 (converted from US$ to Pesetas to Euro’s as 1:
127. 26 : 0.00601012 per ton); 200, 170 and 113 for wheat, barley and vetch respectively. b Including implement and tractor but not fuel consumption. c In units of active ingredient.
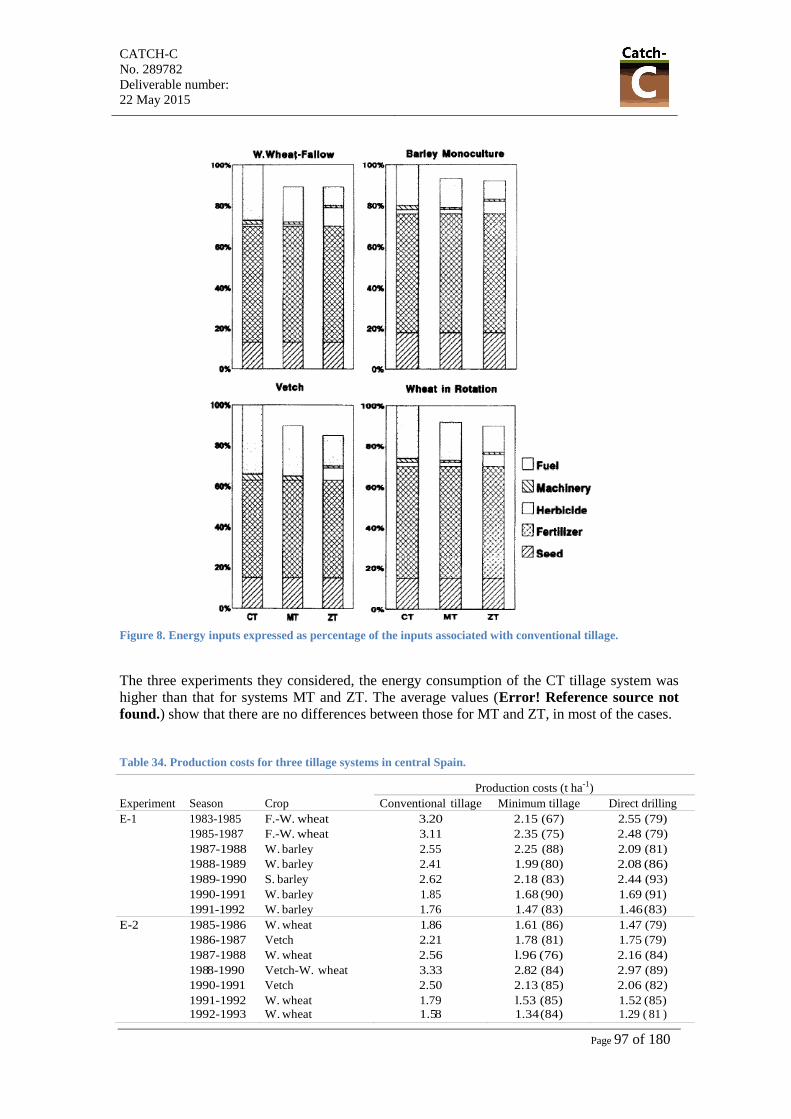
CATCH-C
No. 289782
Deliverable number:
22 May 2015
Page 97 of 180
Figure 8. Energy inputs expressed as percentage of the inputs associated with conventional tillage.
The three experiments they considered, the energy consumption of the CT tillage system was
higher than that for systems MT and ZT. The average values (Error! Reference source not
found.) show that there are no differences between those for MT and ZT, in most of the cases.
Table 34. Production costs for three tillage systems in central Spain.
Production costs (t ha-1)
Experiment Season Crop Conventional tillage Minimum tillage Direct drilling
E-1 1983-1985 F.-W. wheat 3.20 2.15 (67) 2.55 (79)
1985-1987 F.-W. wheat 3.11 2.35 (75) 2.48 (79)
1987-1988 W. barley 2.55 2.25 (88) 2.09 (81)
1988-1989 W. barley 2.41 1.99 (80) 2.08 (86)
1989-1990 S. barley 2.62 2.18 (83) 2.44 (93)
1990-1991 W. barley 1.85 1.68 (90) 1.69 (91)
1991-1992 W. barley 1.76 1.47 (83) 1.46 (83)
E-2 1985-1986 W. wheat 1.86 1.61 (86) 1.47 (79)
1986-1987 Vetch 2.21 1.78 (81) 1.75 (79)
1987-1988 W. wheat 2.56 l.96 (76) 2.16 (84)
1988-1990 Vetch-W. wheat 3.33 2.82 (84) 2.97 (89)
1990-1991 Vetch 2.50 2.13 (85) 2.06 (82)
1991-1992 W. wheat 1.79 l.53 (85) 1.52 (85) 1992-1993 W. wheat 1.58 1.34 (84) 1.29 ( 81 )

CATCH-C
No. 289782
Deliverable number:
22 May 2015
Page 98 of 180
E-3 1986-1987 S. barley 2.41 2.13 (88) 2.29 (95)
1987-1988 S. barley 2.50 2.22 (88) 2.38 (95)
1988-1989 S. barley 2.50 2.22 (88) 2.38 (95)
Mean 6 years F.-W. wheat 3.21 2.44 (76) 2.67 (83)
4 years W. wheat in rotation 1.95 1.61 (83) 1.61 (83)
2 years Vetch in rotation 2.35 2.04 (86) 1.91 (81 )
4 years W. barley 2.14 l.85 (86) 1.83 (85)
4 years S. barley 2.50 2.18 (87) 2.37 (94)
W. = winter; S. = spring; F. = fallow
Figures in parentheses are percentages with respect to the production costs of conventional tillage for each experiment
and season.
In another long term study, Sánchez-Girón et al. (2004), assessed the economic feasibility of
rainfed reduced (CP) and no-tillage (NT) systems compared to conventional-tillage (MP) for
other rainfed crop rotation.
Table 35. Description of cultural operations performed by tillage method and crop rotation.
MP and CP NTa
Operation Timing Input Operation Timing Input
Winter wheat + winter barley
Moldboard ploughb October 1.47 h/ha Sprayer October 0.2 h/ha
Chisel ploughc November l.04 h/ha Herbicide October 0.72 kg/ha
Cultivator November 0.96 h/ha Spreader November 0.2 h/ha
Spreader November 0.2 h/ha Fertilizer 200 kg/ha
Fertilizer 200 kg/ha Sowing November 0.8 h/ha
Sowing November 0.65 h/ha Seed 180 kg/ha
Seed 180 kg/ha Spreader March 0.2 h/ha
Roller November 0.4 h/ha Fertilizer 200 kg/ha
Spreader March 0.2 h/ha Sprayer March 0.2 h/ha
Fertilizer 200 kg/ha Herbicide• 3 1/ha
Sprayer March 0.2 h/ha Harvesting July 36 € ha-1
Herbicide• 3 1/ha Hauling July 0.5 h/ha
Harvesting July 36 € ha-1
Hauling July 0.5 h/ha
Vetch for hay
Moldboard plough October 1.47 h/ha Sprayer October 0.2 h/ha
Chisel plough November Herbicided 0.72 kg/ha
Cultivator November 0.96 h/ha Spreader November 0.2 h/ha
Spreader November 0.2 h/ha Fertilizer 200 kg/ha
Fertilizer 200 kg/ha Sowing November 0.8 h/ha
Sowing November 0.65 h/ha Seed 100 kg/ha
Seed 100 kg/ha Cutterbar May 0.4 h/ha
Cutterbar May 0.4 h/ha Windrowing May 0.3 h/ha
Windrowing May 0.3 h/ha Baling May 16.8 €/Mg
Baling May 16.8 €/Mg a Tillage systems: MP, mouldboard ploughing; CP, chisel ploughing; NT, no-tillage. b Primary tillage in MP was mouldboard ploughing. c Primary tillage in CP was chisel ploughing. d Glyphosate.

CATCH-C
No. 289782
Deliverable number:
22 May 2015
Page 99 of 180
3.5.2 BMP: Cover crops for controlling water erosion in permanent crop farms.
The particular case of olive trees
Figure 9. Conventional tillage and cover crop plots in a commercial olive orchard in Southern Spain.
In the following tables information is provided for the cost evaluation associated with the
implementation of cover crops (CC), as compared to conventional tillage (CT) (according to
our classification in the WP3 report). All the information in this report has been provided and
adapted from Asociación Española Agricultura de Conservación / Suelos Vivos (AEAC/SV)
and the literature mentioned in the text.
Table 36. Conventional tillage (CT) and cover crops (CC) in olive orchards: Common tasks, execution period
and required machinery and equipment for the implementation.
Common tasks in CC and CT
Task Execution period Machinery and equipment
Regular pruning or rejuvenation
(biannual) January-April Chainsaw, axe pruning, ...
Pruning elimination January-April Wood chopping machine
Fertilization January-March Tractor + fertilization with centrifugal spreader
+ trailer
Application of phytosanitary
products + fertilization March Tractor + sprayer or atomizer
Application of phytosanitary
products+ fertilization April-May Tractor + sprayer or atomizer
Twig cut1 August-September Tractor + sprayer
Herbicide application (pre and post
emergence) October-November Tractor + sprayer
Application of phytosanitary
products + fertilization October-December Tractor + sprayer + atomizer
1 Chemical control during May-June.
Table 37. Implementation of conventional tillage in olive orchards: Specific tasks, execution period and
required machinery and equipment.
Specific tasks in CT
Task Execution period Machinery and equipment
Cultivator pass February-April Tractor + cultivator
Harrowing (once or twice depending on
annual precipitation) April-August Tractor + harrow
Soil preparation September Tractor + roller compactor

CATCH-C
No. 289782
Deliverable number:
22 May 2015
Page 100 of 180
Table 38. Specific tasks associated with the implementation of spontaneous CC.
Specific tasks in spontaneous (SpCC)
Task Execution period Machinery and equipment
Mowing of CC (cleared + herbicide) March-May Tractor + weeding machine + sprayer
Table 39. Specific tasks associated with the implementation of sown CC.
Specific tasks in sown CC (SCC)
Task Execution period Machinery and equipment
Mowing of CC (cleared +
herbicide) March-May Tractor + weeding machine + sprayer
Sowing of CC in-between tree
rows September-November Tractor + fertilizer spreader + sowing machine
Figure 10. Scheme of the timing of the different tasks associated with the implementation of cover crops.
Table 40. Estimation of cost for fertilizers, pesticides and sowing a Barley cover crop.
Input Unit Amount Unitary price € Cost € /ha
Fertilization ha 1 62.6 62.6
NPK fertilizer kg 120 0.5 54
Sown ha 1 62.6 62
Barley seed kg 120 0.3 36
Total costs 215

CATCH-C
No. 289782
Deliverable number:
22 May 2015
Page 101 of 180
Table 41. Required time and cost of operations for common tasks in of olive cultivation. Mechanization,
labour and fuel costs are included.
Operation h/ha €/h €/ha
With tractor
+ Spreader for fertilization 0.3-0.5 32 9.6-16
+ Atomizer 0.5-2 35 17.5-21
+ Cultivator 0.7-1 35 24.5-35
+ Weeding machine 0.4-0.8 38 15.2-30.4
+ Harrow 0.4-0.7 30 12-21
+ Shovel 1.3-2 38 49.4-76
+ Wood chopping machine 1-2 41 41-82
+ Sprayer 0.5-1 40 15-43
+ Trailer 0.3-0.5 26 7.8-13
+ Roller compactor 0.7-0.9 29 19.6-25.2
+ Sowing machine +
fertilization machine 0.7 35 24.5
+ Cultivator 0.4-0.7 30 12-21
Without tractor
Twig cut 1.4-2 44 61.6-88
Pruning 3.3 40 132
Formation of branches 2.5 30 75
Sprayer 0.5-1 10 5-10
Table 42. Comparison of costs associated to conventional tillage (CT), spontaneous cover crops (SpCC), and
sown cover crops (SCC) (costs of Table 40 not included).
MP h/ha mechanized tasks h/ha total tasks €/ha mechanized tasks €/ha fuel €/ha total
CT 9.6 23.4 239 50 428
SpCC 7.4 21.2 186 39 363
SCC 7.8 21.6 196 29 364
Costs from management operations are shown in Error! Reference source not found.
(Rebolledo et al. 2014; Taguas et al. 2012) where the highest costs are associated with CT
(673.74€ ha−1
year−1
) and the lowest with SpCC (630.18€ ha−1
year−1
) (SpCC = spontaneous
grass cover, CT = conventional tillage). In summary, and based on the study made by Taguas
et al. (2012), SpCC was the most profitable alternative for soil management.
Table 43. Summary of annual income received by the farmer and cost analysis derived from the management
operations in the study case.
Olive yield (kg/ha)-olive oil (21% yield) Unit price (€/kg) Unit value (€/ha)
Harvest benefits 1100 2.33 538.23
(-) Transformation
costs 1100 0.06 13.54
Subsidies - 1.32 304.92
Annual income
829.61
Season Operations SpCC Components Unit value (€/ha)
Autumn Fertilization NPK 16, manual
application Fertilizers, 1 farmers 71.7
Weed control with pre-emergence
residual herbicide
Tractor, 1 farmer,
herbicide 40.44
Winter Soil preparation and olive harvest Tractor, 8 farmers, rolling 379.99
Spring Chemical elimination of weeds with
herbicide around the trees Tractor, farmer, herbicide 40.59
Tractor driven over the land twice to
destroy and limit the vegetation strips Tractor, farmer, tires 97.46

CATCH-C
No. 289782
Deliverable number:
22 May 2015
Page 102 of 180
Annual costs SpCC
630.18
Net return SpCC 199.43
Season Operations CT Components Unit value (€/ha)
Autumn Fertilization NPK 16.manual application Fertilizers, 1 farmers 71.7
Weed control with pre-emergence
residual herbicide
Tractor, 1 farmer,
herbicide 40.44
Tillage operations Tractor, farmer, plow 70.47
Winter Soil preparation and olive harvest Tractor, 8 farmers, rolling 379.99
Spring Post-emergence herbicide Tractor, 1 farmer,
herbicide 40.67
Tillage operations Tractor, farmer, plow 70.47
Annual Costs CT 673.74
Net return CT 155.87
3.5.3 Conclusion (Spain)
Tillage
The three tillage systems were found to provide similar gross margins and risk regardless of
the crop grown although they were highly sensitive to EU Common Agricultural Policy
subsidies. The risk associated with crops and rotations was similar with the three tillage
systems.
Cover crops
The costs for a sown cover crop is 215 € /ha and the benefits of reduced tillage is 71 €/ha,
resulting in net increased costs of 144 €/ha. This is high compared to spontaneous cover crops
(SpCC) which have no costs involved for sowing and only benefits for reduced tillage of 71
€/ha. Therefore, SpCC seems slightly beneficial in terms of net return as no costs for tillage
operations are done in comparison to conventional tillage (CT).

CATCH-C
No. 289782
Deliverable number:
22 May 2015
Page 103 of 180
3.6 The Netherlands
3.6.1 Non-inversion tillage
To estimate costs for the analysis of the Netherlands data is taken from the national database
KWIN Akkerbouw (2012). When farmers move to non-inversion tillage (NIT) ploughing is
often replaced by a soil treatment with a fixed tine cultivator. Most farmers cultivate up to 30
cm deep to loosen the soil. In addition, efforts for weed control a likely to increase when
applying NIT. In general ploughing results in lower weed pressures than NIT.
The cost calculations for the BMP focus therefor on the replacement of fuel needed for
ploughing by fuel needed of the fixed tine cultivator, the difference in labour and some
increased costs for additional weed control, that is costs for herbicides, labour and fuel (Table
44). It is assumed that yields will not or not significantly affected by NIT as literature suggests
that that is the case in the long run when using NIT.
Table 44. Non-inversion tillage for arable farming on clay soils with a standard crop rotation of potatoes,
beets, winter wheat, carrots and onions.
Reference BMP notes/differences
Plough
NIT, one more
cultivation needed
Winter
wheat:
yield (t/ha) 9.2 9.2 no yield differences
price per ton 160 160 default price (KWIN 2012)
financial yield 1472 1472
machinery costs 120 83 -37.15
total direct costs 693 656 -37.15
Net return /gross margin 779 816 37.15
work load (hr/ha) 10 8 -2
Beets: Yield 83 83 no yield differences
Price 40 40 default price (KWIN 2012)
financial yield 3320 3320 0
machinery costs 102 59 -43
total direct costs 1255 1212 -43
Net return /gross margin 2065 2108 43
work load (hr/ha) 17 15 -2
Carrots: Yield 50000 50000 no yield differences
Price 0.2 0.2 default price (KWIN 2012)
financial yield 10000 10000
machinery costs 150 150 0
total direct costs 3124 3081 -43
Net return /gross margin 6876 6919 43
work load (hr/ha) 109 107 -2
Onions: Yield 28000 28000 no yield differences
Price 0.265 0.265 default price (KWIN 2012)
financial yield 7420 7420
machinery costs 68 68
total direct costs 4023 3996 -27
Net return /gross margin 3397 3424 27
work load (hr/ha) 123 122 -1
3.6.2 Conclusion (The Netherlands)
When adopting NIT the cost for ploughing is replaced by cost for a pass with the fixed tine
cultivator. The pass with the cultivator is much faster than ploughing and fuel consumption is
lower. However with NIT additional weed control when growing carrot and onion is often
required and will come with additional costs. These cost maybe substantial especially when
CATCH-C
No. 289782
Deliverable number:
22 May 2015
Page 104 of 180
manual labour is involved. Burning and hand weeding are labour consuming activities. If
labour is available within the family this may not cause great difficulties but when labour
needs to be hired the costs may outweigh the benefits. Additional weed control is not needed in
winter wheat, sugar beet or potato (Wilting 2007; www.spna.nl).
When adopting NIT in winter wheat, potato and sugar beet cultivation some money is saved on
direct (fuel) costs. Also lowering the demand for labour during peak periods might be driver
for farmers adopt NIT. An additional advantage and reason why farmers start to adopt that is
that on clay soils potato volunteers are controlled.
CATCH-C
No. 289782
Deliverable number:
22 May 2015
Page 105 of 180
References
Ajzen I., 1988. Attitudes, personality, and behavior. Open University Press, Milton Keynes.
Ajzen I., 1991. The theory of planned behavior. Organizational Behavior and Human
Decision Processes 50, 179-211.
Andersen E., B. Elbersen, F. Godeschalk & D. Verhoog, 2007. Farm management indicators
and farm typologies as a basis for assessments in a changing policy environment.
Journal of Environmental Management 82, 353-362.
Bijttebier J., G. Ruysschaert, R. Hijbeek, B. Rijk, M. Werner, I. Raschke, H.H. Steinmann, K.
Zylowska, A.A. Pronk, N. Schlatter, G. Guzmán, A. Syp, L. Bechini, N. Turpin, N.
Guiffant, E. Perret, N. Mauhé, C. Toqué, L. Zavattaro, C. Costamagna, C. Grignani,
T. Lehninen, A. Baumgarten, H. Spiegel, A. Portero, T. Van Walleghem, A. Pedrera,
A. Laguna, K. Vanderlinden & V. Giráldez, 2015. Farmers review of Best
Management Practices: drivers and barriers as seen by adopters and non-adopters.
D4.422, 171 pp.
Burton R.J.F., 2004. Reconceptualising the 'behavioural approach' in agricultural studies: A
socio-psychological perspective. Journal of Rural Studies 20, 359-371.
Carney D., 1998. Sustainable rural livelihoods : what contribution can we make? Department
for International Development, London. 213 p.
Charles R., C. Dürr & A. Joannon, 2012. Les itinéraires techniques des cultures
intermédiaires. In Réduire les fuite de nitrates au moyen de cultures intermédiaires.
pp. 17.
Derpsch R., 2005. The extent of conservation agriculture adoption worldwide: implications
and impact. In Proceedings 3rd world congress on conservation agriculture, Nairobi,
2005. pp. 15
EC, 1985. Commission decision of 7 June 1985 establishing a community typology for
agricultural holdings, Brussels.
Edwards-Jones G., 2006. Modelling farmer decision-making: Concepts, progress and
challenges. Animal Science 82, 783-790.
Giráldez J.V. & P. González, 1994. No- tillage in clay soils under Mediterranean climate:
Physical aspects. In Proceedings of the EC-Workshop- I-, Experience with the
applicability of no- tillage crop production in the West- European countries,
Wissenschaftlicher Fachverlag, 27- 28 June, 1994, 1994. pp. 111- 117.
Harasim A., 2011. Gospodarowanie słomą, IUNG-PIB, Puławy.
Harasim A., 2006. Przewodnik ekonomiczno-rolniczy w zarysie, IUNG-PIB, Puławy.
Hernánz J.L., V.S. Girón & C. Cerisola, 1995. Long-term energy use and economic
evaluation of three tillage systems for cereal and legume production in central Spain.
Soil and tillage research 35, 183-198.
Hijbeek R., J. Wolf & M.K.v. Ittersum, 2013. A typology of farming systems, related soil
management and soil degradation in eight European countries, Wageningen
University, 226 pp.
Knowler D. & B. Bradshaw, 2007. Farmers' adoption of conservation agriculture: A review
and synthesis of recent research. Food Policy 32, 25-48.
Lahmar R., 2010. Adoption of conservation agriculture in Europe. Lessons of the KASSA
project. Land Use Policy 27, 4-10.
Landbouw I.K.C., V. Praktijkonderzoek voor de Akkerbouw en de & D.L.V. De
Landbouwvoorlichting, 2012. Kwantitatieve informatie akkerbouw en
vollegrondsgroenteteelt. 1571-3059, Proefstation voor de Akkerbouw en de
Groenteteelt in de Vollegrond, Lelystad, 204 pp.

CATCH-C
No. 289782
Deliverable number:
22 May 2015
Page 106 of 180
Metzger M.J., R.G.H. Bunce, R.H.G. Jongman, C.A. Mücher & J.W. Watkins, 2005. A
climatic stratification of the environment of Europe. Global Ecology and
Biogeography 14, 549-563.
Ordóñez Fernández R., P. González Fernández, J.V. Giráldez Cervera & F. Perea Torres,
2007. Soil properties and crop yields after 21 years of direct drilling trials in southern
Spain. Soil and tillage research 94, 47-54.
Pellerin S., L. Bamière, D. Angers, F. Béline, M. Benoît, J.P. Butault, C. Chenu, C.
Colnenne-David, S. De Cara, N. Delame, M. Doreau, P. Dupraz, P. Faverdin, F.
Garcia-Launay, M. Hassouna, C. Hénault, M.H. Jeuffroy, K. Klumpp, A. Metay, D.
Moran, S. Recous, E. Samson, I. Savini & L. Pardon, 2013. Quelle contribution de
l’agriculture française à la réduction des émissions de gaz à effet de serre ? Potentiel
d'atténuation et coût de dix actions techniques. Synthèse du rapport d'étude, , INRA,
France, 92 pp.
Rebolledo J.J., E.V. Taguas & J.A. Gómez, 2014. Análisis y modelado de la erosión por flujo
concentrado y propuesta de medidas de conservación del suelo en una microcuenca
de olivar de Setenil de las Bodegas (Cádiz) Universidad de Córdoba, Escuela Técnica
Superior de Ingenieros Agrónomos y de Montes, Córdoba.
Sánchez-Girón V., A. Serrano, J.L. Hernanz & L. Navarrete, 2004. Economic assessment of
three long-term tillage systems for rainfed cereal and legume production in semiarid
central Spain. Soil and tillage research 78, 35-44.
Schreuder R., M. Van Leeuwen, J. Spruijt, M. Van der Voort, P. Van Asperen & V.
Hendriks-Goossens, 2012. Quantitative information arable crops and vegetable crops
2012 [in Dutch: Kwantitatieve Informatie akkerbouw en vollegrondsgroenteteelt
2012]. Publication number: 486, Praktijkonderzoek Plant en Omgeving.
Stonehouse D.P., 1995. Profitability of soil and water conservation in Canada: a review.
Journal of Soil & Water Conservation 50, 215-219.
Taguas E.V., Y. Yuan, R.L. Bingner & J.A. Gómez, 2012. Modeling the contribution of
ephemeral gully erosion under different soil managements: A case study in an olive
orchard microcatchment using the AnnAGNPS model. CATENA 98, 1-16.
Van den Putte A., G. Govers, J. Diels, K. Gillijns & M. Demuzere, 2010. Assessing the effect
of soil tillage on crop growth: A meta-regression analysis on European crop yields
under conservation agriculture. European Journal of Agronomy 33, 231-241.
Vermeij I., 2013. Quantitative information animal husbandry 2013-2014 [in Dutch: KWIN
Kwantitatieve Informatie Veehouderij 2013-2014]. Wageningen UR Livestock
Research, Lelystad. 407 p.
Wauters E. & E. Mathijs, 2013. An Investigation into the Socio-psychological Determinants
of Farmers' Conservation Decisions: Method and Implications for Policy, Extension
and Research. Journal of Agricultural Education and Extension 19, 53-72.
Wilting P., 2007. Het effect van een niet-kerende hoofdgrondbewerking op de opbrengst en
interne kwaliteit van suikerbieten : resultaat van vier proefvelden van 2003 tot en met
2005. Stichting IRS, Bergen op Zoom.
www.spna.nl, aardappelteeltinnietgeploegdegrondKW214jv98.pdf;
minimalegrondbewerkingwintertarweEH812jv98.pdf;
minimalegrondbewerkingwintertarweEH812jv99.pdf, 19 august 2014 pp.

CATCH-C
No. 289782
Deliverable number:
22 May 2015
Page 107 of 180
Appendix I: Overview of farmer views on drivers and barriers for best practices (BMPs) in soil management
soil quality
growth and
produce quality crop protection inputs use / equipment financial weather / technical (often control) factors Biodiv Various
Man
agem
ent
Pra
ctic
e
foo
tno
tes
Co
untr
y
farm
ty
pe
soil
ph
ysi
cal
com
pac
tio
n/
bea
rin
g
soil
fer
tili
ty
Hu
mu
s
soil
lif
e
soil
hea
lth
earl
ines
s
wat
er
sto
rag
e w
ater
log
dra
inag
e
Ero
sion
yie
ld s
tabil
ity
ger
min
atio
n
fodd
er
anim
al w
elfa
re
wee
ds
vo
lun
teer
cro
p
pes
ts
dis
ease
s
wat
er u
se
fuel
use
bio
cid
e u
se
fert
ilis
er u
se
lab
ou
r /
tim
e
mac
hin
ery
sto
rag
e ca
p
sub
sidy
inco
me
cost
wea
ther
tim
e w
ind
ow
inco
rpo
rate
-in
soil
un
even
nes
s
seed
ing
inpu
t q
ual
ity
inpu
t
avai
lab
ilit
y.
slo
w/u
nsu
re N
rele
ase
soil
NO
3/
leac
hin
g
fiel
ds
far
apar
t
wil
dli
fe b
iod
iv
env
iron
enab
les
oth
er
pra
ctic
es
man
agem
ent
info
Leg
isla
tion
con
trac
ts /
coo
lect
ors
oth
er
footnotes A C E F G H J K
R
O
T
A
T
I
O
N
1 BE dairy-sand D D D DB B B
2 BE dairy-sand D D B
3 BE mix-veg D D D B D
DE ar-mix-sand D D D D D D D B D B
DE ar-mix-med D D DB D B
4 IT dairy D D B D D B B
5 IT dairy D D D D D D D D
5 IT ar-cer-LO D D B B D
1 NL dairy-sand B B B DB D B D
ES ar-cereal D D D D D D D
L
E
G
U
M
AT Ar-LO D B D B B DBBB
AT mixed-UP D D B B D B D D D B DB BBB
2 BE dairy-sand D B B D D
IT dairy D D D D D D D D
IT ar-cer-LO D D B B D
LANDEX BE mix-veg B DB B D B
C
C
C
G
M
AT ar-LO D D D D D B B (D) B B (D) D
AT mix-UP D D D DB D D B DB (D) B B D (D)B
BE ar-spec D D D D D D D B B B B B D
BE dairy-sand D D D D D D D D B B (D) (B) D
BE mix-veg D D D D D D B B (B) D
FR ar-rendzin D D(D) D D D D D D D B D D B B B B
FR dairy D D D D B D B B B D D D
DE ar-mix-sandNW D D D D B B (B) D D D
DE ar-mix-sandNE D D D (B) (B) (B) (B) D D
DE ar-mix-med D D D D D D B B B
IT dairy D D D D D B
IT ar-cer-LO D D D D D B B
IT ar-cer-UP D D B
PL Ar D D D D D D D D
PL mixed D D D D
PL dairy
ES tree crops D D D D B B
6 NL dairy-sand D D D B D D (B) D
7 NL dairy-sand (D) D D B D B
NL ar-clay D D D D D B B B B D
NL ar-sand D D D D D B B B B D
C
R
E
S
I
N
C
BE ar-spec D D B D B B B B DB
IT Dairy D D (D) B
IT ar-cer-LO D D B DB (B) (B) D
IT ar-cer-UP D D D B B B B (D) B B B D
PL Ar D D D D B B B
PL Mixed D D D D D B B B
Pl Dairy D D D D D B B B
NL ar-clay D B D D D B B D (B) B B
NL ar-sand D B D D D B B D B B
GRAZE AT dairyTirol (B) D B D D D D D B B
PASTPLN ES Dehesa D D B (B) (B)

CATCH-C
No. 289782
Deliverable number:
22 May 2015
Page 108 of 180
R
E
D
U
C
E
D
T
I
L
L
A
G
E
AT ar-LO D D D D D D B B B D (D) D
BE ar-spec (B) D D D B B D B D B D B (B) D
BE dairy-sand B B D D B B D DB D B D D
BE mix-veg DB B D D D D B B D D B
FR ar-rendzin D D D D D D B D D D DB B
FR ar-cambi D D D(D) D D (D) B D D DB (D) B
FR dairy D D D D D (D) B D D D DB B
DE ar-mix-sandNW D D B D D B B B B D B D B
DE ar-mix-med D D B B D D B
IT ar-cer-LO D B B D D
IT ar-cer-UP B D B D D
PL arable D D D D B D B D B D
PL mixed D D D D B D B D B D
PL dairy D D D D B D B D B D
ES treecrops D D B B B B D
ES dehesa D D D D B
NL dairy-sand D B D D B B B B D B B D B
NL ar-clay D D D B D B B D (B) (B) D (B) B
NL ar-sand D D D B D B B D D B
N
O
T
I
L
L
FR ar-rendzin D D D D (B) (B)
FR ar-cambi D D(D) D (B) D B (B) D (B) (B)
FR dairy D (B) D D (B) D B D B D
IT ar-cer-LO D D D B D (B) D
IT ar-cer-UP D D B D D (B) D B
ES ar-cer D D D D D D B DB D D
C
T
F
DE ar-mix-sandNE D DB D D D D B B
ES ar-cer D B B
NL ar-clay D D B D
LOWPRES DE ar-mix-sandNE D D B B B B
N
U
T
PLAN
AT ar-LO D D DB D
AT mixed-UP D B B D
AT dairyTirol D B B D
IT dairy D D D D D(B) D
PL mixed D D D D
PL dairy D D D
ORGFERT
AT ar-LO B D D B B DB (D)(B) D (D)
IT ar-cer-LO D D D B B B B B
IT ar-cer-UP D D D D B B B B B B B
FYM
BE ar-spec D D D D D D B B (B) (B) B (B) B
BE mix-veg D D D D D D B D B
COM-
POST
Be ar-spec D D D D D B B B B B B B BD B B
Be mix-veg D D D D D B B B
NL ar-sand B D
DIG-
EST
NL ar-clay D D B D D B B
NL ar-sand D D B D D B B
SPRINGSL NL ar-clay B B D D B (D) D B B B
ROWSLU NL dairy-sand B B B DB B B
SPRI/
DRIP
IT dairy D D D B B B D
IT ar-cer-LO D D D D B B D D D D
The header to the footnote includes: ROT: crop rotation LOWPRES: tire systems for low soil loading pressure
1. maize / grass rotation A. includes structure, aeration, workability, rootability LEGUM: including legume crops in rotation NUTPLAN: nutrient management plan / soil analysis
2. maize/grass clover rotation C. includes formation of plow pan LANDEX: land exchange with other farmers/farm types to widen rotation ORGFERT: application of organic fertilizers
3. vegetable/wheat E. includes soil nitrogen supply amount/rate, micronutrients, soil pH CCCGM: catch & cover crops & green manures FYM: application of farm yard manure
4. including grass ley in rotation F. includes water retention, infiltration, reduced loss CRESINC: retention & incorporation of crop residues in soil COMPOS: application of compost
5. including legume ley in rotation G. includes feed quality, feed ration, protein content, milk yield, GRAZE: grazing DIGEST: use of digestate (from methane reactors)
6. undersowing of catch crop in maize H includes dependence on contractors, ease of operations PASTPLN: making a pastoral plan SPRINGSL: spring application of slurry on clay
7. enabling catch crop by early maize harvest J includes impurities/waste, disease germs, constancy of composition REDUTIL: reduced/minimum/non-inversion tillage ROW SLU: application of slurry in rows
K includes fear for tightening of legislation NOTIL: no tillage; direct drilling SPRIDRIP: sprinkler & drip irrigation (as opposed to flood irrig.)
CTF: controlled traffic farming

CATCH-C
No. 289782
Deliverable number:
22 May 2015
Page 109 of 180
B Barrier D Driver
DB Drivers as well as barrier () control factor; when used next to a letter without parenthesis it means that it is smaller than the next letter


CATCH-C
No. 289782
Deliverable number:
22 May 2015
Page 111 of 180
Appendix II: Farm survey Austria
FTZ 1A: Lower Austria (ENZ8_SL3+SL1_TXT2), FTZ 2M: Upper
Austria (ENZ6_SL3_TXT3) and FTZ 3C: Tirol (ENZ5_SL5_TXT2)
BMP: Soil Analysis (N=28; 11; 6)
Table 45. Drivers and barriers for the arable farms in Lower Austria arable farms
(ENZ8_SL3+SL1_TXT2), upper Austria mixed farms (ENZ6_SL3_TXT3) and Tirol dairy farms
(ENZ5_SL5_TXT2) for BMP: Soil Analysis. A = Attitude, SN = subjective norm, PBC = perceived
behavioural control.
Lower
Austria
arable
Upper
Austria
mixed
Tirol
dairy
Drivers A
Overview of the nutrient supply Natural 6.1 5.3 4.8
Adaption of the fertilisation to the crops needs Physical 5.6 6.3 5.8
Optimization of the crop yield Financial 5.1 4.8 4.2
Investigation of the humus content Physical 4.9 3.2 3.2
Shows nutrient deficiencies in the soil Natural 4.9 5.7 4.8
Development of an fertilisation plan Physical 4.7 3.1 3.6
Improved food and feed quality Natural 4.7 3.4 3.2
Additional fertiliser recommendation Physical 4.6 2.8 3.6
Better advice by the agricultural advisors Social 4.5 4.9 5.4
Investigation of the trace elements Physical 4.5 3.5 4.2
Control of the pH value Physical 4.3 6.0 3.4
Improved soil life Natural 4.0 3.5 3.2
SN
Literature Human 4.2 4.6 4.8
Advisor of the Chamber of Agriculture Social 3.3 5.9 4.0
Private agricultural advisors Social 3.0 6.6 2.0
Advisor of the sugar industry Social 2.4 3.1 2.0
Colleagues in the working group Social 2.2 4.6 2.4
Agricultural school Human 2.2 4.0 4.0
Association "Maschinenring" Social 1.2 2.9 2.2
Environmentalist Social 1.1 1.2 -0.2
Other farmers Social 1.1 1.7 1.0
Representative for mineral fertilisers Social 1.1 1.8 0.6
PBC
Well organized delivery possibilities for soil samples Physical 3.6 4.2 2.2 Investigation of other soil parameters: biological activity.
humus content and trace elements Physical 2.8 1.1 0.0
Use as a routine method Physical 2.6 3.4 0.0 Support in soil sampling (by the Chamber of Agriculture or
external service) Social 2.5 3.4 -2.7
Investigation forms. labels and bags for the sample are easy Physical 2.4 2.8 1.7

CATCH-C
No. 289782
Deliverable number:
22 May 2015
Page 112 of 180
available
Bad growth of the agricultural crops Financial 2.3 1.3 3.5
Support by a funding programme Social 1.8 3.2 0.7
Sufficient knowledge of soil Human 1.8 2.0 3.5
Low-yield farm land Financial 1.2 1.8 1.5
Fertilisation only based on the nutrient uptake of the crops Physical 0.8 1.0 -2.5
Exclusive use of organic fertiliser Physical 0.3 1.1 0.2
Closed nutrient cycle Natural 0.3 1.6 1.0
Barriers A Less information compared to the observation of plant
growth Natural -4.6 -5.8 -5.0
Higher costs Financial -4.1 -5.2 -6.4
Higher time requirements Financial -1.2 -2.4 -3.0
PBC
Mistakes in the evaluation by soil laboratories Social -1.7 -1.6 -2.7
Many small parcels Physical -1.6 -1.7 -1.7
Lack of know-how Human -0.7 -0.5 0.0 Lack of fertiliser recommendation and interpretation of
results Human -0.7 -1.1 -2.5
Difficult interpretation of results Human -0.5 -0.8 -2.0
High technical complexity Physical -0.5 -1.1 0.0
FTZ 1A: Lower Austria (ENZ8_SL3+SL1_TXT2)
BMP: Non-inversion tillage (N=28)
Table 46. Drivers and barriers for the arable farms in Lower Austria (ENZ8_SL3+SL1_TXT2) for BMP:
non-inversion tillage. A = Attitude, SN = subjective norm, PBC = perceived behavioural control.
Drivers A
Efficient way of farming Financial 7.6
Reduced erosion Natural 7.6
Saved energy Financial 7.3
Reduced operational costs Financial 7.2
Conservation of soil life Natural 7.0
Improved soil structure Natural 6.9
Increased soil moisture on the surface Natural 5.5
Avoidance of a plowsole Natural 5.2
Elimination of pressure damages by lanes Natural 4.7
Crumbly seedbed Natural 3.9
Reduced C/N ratio Natural 2.0
SN
Society "LOP - Landwirtschaft ohne Pflug" Social 2.1
Literature Human 2.0
Private agricultural advisors Social 1.3
My family Social 0.6
Other farmers Social 0.5
PBC

CATCH-C
No. 289782
Deliverable number:
22 May 2015
Page 113 of 180
Higher time efficiency Financial 3.7
Availability of effective herbicides Natural 2.4
Machines by the association "Maschinenring" or contractors Social 1.1
Fertilisation in autumn Physical 1.1
Cultivation of short straw crops Physical 1.0
Sowing by a contractor Social 0.8
Higher and more precise fertiliser application rates Physical 0.7
Barriers A
Higher weed pressure Natural -4.7
Higher disease pressure Natural -3.9
Growth of the previous crop in the following crop Natural -3.5
Reduced seedbed quality for sugar beet Natural -1.5
PBC
Use of clover grass and high amounts of crop residues Physical -0.3
Lack of know-how Human -0.8
Wet soils Natural -1.4
BMP: Legume crops (N=20)
Table 47. Drivers and barriers for the arable farms in Lower Austria (ENZ8_SL3+SL1_TXT2) for BMP:
Legume crops. A = Attitude, SN = subjective norm, PBC = perceived behavioural control.
Drivers A
Positive previous crops Natural 7.0
Better soil structure Natural 6.4
Fixation of nitrogen Natural 6.3
Cultivation of soil is easier Natural 6.3
Good deep loosening of the soil Natural 5.9
Uniform and comprehensive growth of the following crop Natural 5.0
Feeding of legumes to cattle’s Natural 4.4
Funding or financial compensation Financial 4.4
Wide crop rotation Natural 4.3
SN
Information about GM free feeding Human 2.4
High demand in the population Social 2.3
Agricultural experiments Human 1.9
Literature Human 1.7
Private agricultural advisors Social 0.6
Consumers Social 0.5
Advisors of seed companies Social 0.4
Politicians Social 0.4
Society "Donau Soja" Social 0.3
PBC
Lack of food and feed protein in the inland Financial 2.0
Easy reproduction Natural 0.9
Second income Financial 0.5
Difficult to grow a new crop and adapt it to the economic Financial 0.5

CATCH-C
No. 289782
Deliverable number:
22 May 2015
Page 114 of 180
requirements
Cultivation on irrigated fields Natural 0.5
No use of legumes in mulch sowing Natural 0.0
Barriers A
Strong yield fluctuations Financial -5.0
Expensive seeds Financial -4.8
Bad marketing Financial -4.5
Higher pesticide applications Natural -3.7
Difficult crop management Financial -3.6
PBC
No stabile variants Natural -2.4
Bad seed quality Natural -2.2
No progress in breeding Natural -1.7
Susceptibility to diseases and pests Natural -1.7
Regularly complete failures in yield by rain Natural -1.3
No adaption to our climate Natural -1.1
No intensive cultivation Financial -0.8
Crop rotation already sufficient divers Natural -0.4
Achieving a positive contribution margin by its own breeding Financial -0.4
Higher market price for maize Financial -0.4
BMP: Cover/catch crops, green manure >25% (N=15)
Table 48. Drivers and barriers for the arable farms in Lower Austria (ENZ8_SL3+SL1_TXT2) for BMP:
Cover/catch crops, green manure >25%. A = Attitude, SN = subjective norm, PBC = perceived behavioural
control.
Drivers
A
Reduced erosion Natural 7.5
Soil is rooted and loosened Natural 6.9
Enhanced soil life Natural 6.7
Fixation of nitrogen Natural 6.2
Increased humus content Natural 6.1
Improved water storage over the winter Natural 5.8
Food for the insects Natural 5.6
Enriches the soil with nutrients Natural 5.4
Relaxing of the crop rotation Natural 5.4
Attractive for beneficial insects Natural 5.3
More beautiful landscapes Natural 5.1
Cultivation has to be matched to the entire operating system Financial 2.2
SN
Agricultural school Human 2.6
Literature Human 2.3
Advisors of "Bioforschung Austria" Social 2.1
Advisor of the Chamber of Agriculture Social 2.0
Other farmers Social 1.1
Politicians Social 0.4
Society "Distelverein" (Association for Agriculture and Nature Social 0.4

CATCH-C
No. 289782
Deliverable number:
22 May 2015
Page 115 of 180
Conservation)
Advisors of seed companies Social 0.3
PBC
Available technical equipment Physical 4.8
Sufficient precipitation Natural 4.5
Cheap seeds Financial 4.5
Same seeding technology for different crops Physical 4.0
Use of an cultivator Physical 3.2
Support by ÖPUL Financial 2.9
Contiguous agricultural area Physical 2.7
Combination with mulch or non-inversion tillage Physical 2.2
Fodder for the animals Natural 1.8
Gaps in the crop rotation are needed Natural 1.5
Higher availability of agricultural area Physical 1.2
Reduced livestock Financial 0.3
Barriers
A
Higher costs Financial -4.3
Higher use of fuel Financial -4.2
Higher application of plant protection Natural -3.5
Reduction of the income Financial -3.5
Time consuming Financial -3.4
Higher weed pressure Natural -3.2
High risk of failure Natural -2.9
Loss of water that is no longer available for the main crop Natural -2.8
Difficult incorporation of crop residues Natural -2.6
Not possible to use the field for cash crops Financial -2.5
"Green bridges" cause a higher disease pressure Natural -0.7
PBC
No sufficient know-how Human -0.8
FTZ 2M: Upper Austria, mixed farms (arable farms,
ENZ6_SL3_TXT3)
BMP: Organic fertilizers (N=11)
Table 49. Drivers and barriers for the arable farms in upper Austria (ENZ6_SL3_TXT3) for BMP:
Organic fertilizers. A = Attitude, SN = subjective norm, PBC = perceived behavioural control.
Drivers A
Ecologically practical Natural 8.6
Support of the soil life Natural 8.6
Increased yield potential Financial 8.2
Support of the catch crop quality Physical 8.1
Dried farmland before use Physical 6.9
Reduced operational costs Financial 6.8
Appropriate fertilisation Physical 6.3
Increased nutrient content Natural 6.2
Good supply with trace elements Natural 5.5

CATCH-C
No. 289782
Deliverable number:
22 May 2015
Page 116 of 180
SN
Colleagues in the working group Social 4.3
Other farmers Social 3.7
PBC
Sufficient amount of organic fertiliser Physical 4.9
Less odour nuisance and higher acceptance in the population by use of
drag hoses Physical 4.7
Powerful technique Physical 3.8
Experienced fertilisation plan Physical 3.7
Reduced operating technical effort by use of drag hoses Financial 3.6
Required storage size Physical 1.3
Support by the funding programme ÖPUL Financial 0.9
Sophisticated operational management Financial 0.7
Barriers A
Higher costs Financial -6.5
Increased use of fuel Financial -6.2
Limited storage capacity (slurry) Physical -5.8
Heavy equipment Physical -4.6
Increased weather dependence Natural -3.8
PBC
High fuel price Financial -0.1
BMP: Legume crops (N=7)
Table 50. Drivers and barriers for the arable farms in upper Austria (ENZ6_SL3_TXT3) for BMP: Legume
crops. A = Attitude, SN = subjective norm, PBC = perceived behavioural control.
Drivers A
Increased nitrogen content Natural 7.3
Support the soil fertility Natural 6.6
Contribution to the local protein supply Physical 6.5
Good previous crop value for winter cereals Natural 5.3
Increased humus content Natural 5.3
Decreased production costs Financial 4.7
Uncomplicated in cultivation Natural 3.8
Requires no mineral fertiliser Physical 3.2
Less labour intensive Financial 2.5
Less use of pesticides Natural 2.0
Suppress weeds Natural 1.3
Requires high attention in tillage Physical 0.2
SN
Agricultural experiments Human 1.3
Politicians Social 0.5
Advisor of the Chamber of Agriculture Social 0.3
PBS
Grain production technology can be used Physical 3.4
Use as fodder on its own farm Physical 1.3
Changed crop rotation Natural 1.2
No professional advice of agricultural advisors Social 0.2
Barriers A
Increased risk of erosion Natural -7.0

CATCH-C
No. 289782
Deliverable number:
22 May 2015
Page 117 of 180
Poor contribution margin Financial -6.7
Strong fluctuations in yield Financial -6.7
Reduced yields over the years Financial -6.5
Problems with pests Natural -6.2
Not competitive Financial -6.0
Lack of maturity in some years Natural -4.7
Expensive seeds Financial -4.3
No market demand Financial -4.2
High weather dependency Natural -4.0
Low self-compatibility Natural -3.8
Increased complexity of the crop rotation and the farm management Natural -3.0
Higher opportunity costs Financial -1.2
SN
Environmentalist Social -1.3
Seed trader Social -0.7
Population Social -0.3
Society "Donau Soja" Social -0.3
Trading Social -0.3
PBC
High yield uncertainty Financial -5.5
Low market price Financial -5.3
No effective pesticides Natural -5.0
No professional plant breeding Natural -4.7
Late stage of maturity Natural -4.0
Fertilisation with slurry Physical -3.5
High local precipitation Natural -3.0
Low price for pork meat Financial -2.7
Cultivation of rape instead Natural -2.4
Seeds are not guaranteed GM free Natural -1.0
Need the farmland for maize cultivation Physical -0.7
Have to buy fodder (maize) otherwise Financial -0.2
No extensive management Financial -0.2
Cultivation is located in labour intensive time Financial -0.2
BMP: Cover/catch crops, green manure (N=6)
Table 51. Drivers and barriers for the arable farms in upper Austria (ENZ6_SL3_TXT3) for BMP:
Cover/catch crops, green manure. A = Attitude, SN = subjective norm, PBC = perceived behavioural
control.
Drivers A
Good soil structure Natural 9.4
Reduced soil erosion Natural 9.4
Increase of the humus content Natural 8.7
Stimulated soil life (especially the earthworms) Natural 8.1
Loosening the soil Natural 7.7
Nutrient storage till the main crop Natural 5.3
Reduced soil-borne diseases Natural 2.7
Early tillage Physical 2.3
SN
Crop experts Social 5.4
Private agricultural advisors Social 2.9
Community Social 1.6

CATCH-C
No. 289782
Deliverable number:
22 May 2015
Page 118 of 180
Other farmers Social 1.1
Population Social 0.6
PBC
Support by funding program ÖPUL Financial 5.4
Early harvestable crops (e.g. barley) Natural 5.3
Good adapted varieties Natural 3.3
Cultivation of rape Natural 0.6
Less know-how Human 0.3
Barriers A
General weed management (e.g. weed control) is more demanding Natural -5.4
Slower warming and drying of the fields in spring Natural -5.0
Caused costs Financial -4.9
Overwintering of fungal diseases Natural -3.9
Problem with seed placement Physical -2.7
SN
Seed trader Social -0.3
PBC
No technical equipment Physical -2.7
Use of more herbicides Natural -0.3
FTZ 3C: Tirol, dairy cattle/permanent grassland
(ENZ5_SL5_TXT2)
BMP: Permanent grazing and rotational grazing (N=6)
Table 52. Drivers and barriers for the dairy cattle/permanent grassland farms in Tirol (ENZ5_SL5_TXT2)
for BMP: Permanent grazing and rotational grazing. A = Attitude, SN = subjective norm, PBC = perceived
behavioural control.
Drivers A
Saved time and money Financial 7.5
Increased contribution margin Financial 7.2
Improved animal health Natural 6.6
Reduced concentrated fodder Financial 6.0
Less stress for the herd Natural 5.5
Improved fodder quality Natural 4.3
Improved metabolic cycle of the cows Natural 4.3
Increased humus content Natural 4.0
Reduced mineral fertilisation Natural 3.8
Closed and sustainable circle is possible Natural 2.8
Requires a regularly overseeding Physical 2.2
Increased milk output Financial 1.4
SN
Advisors of the Chamber of Agriculture Social 4.3
Literature Human 2.5
Working group milk Social 0.0
PBC
Enough adjacent pasture around the barn Physical 4.3
Consequent observation of the herd Physical 0.8
Seasonal calving’s Physical 0.0
Operational and financial reorganisation does not worth Financial 0.0
Barriers A

CATCH-C
No. 289782
Deliverable number:
22 May 2015
Page 119 of 180
Trampling damages in the sward with wet weather Natural -5.5
Animals are too far away and the animal viewing is insufficient Natural -2.7
Fertiliser irregularly distributed on the field surface Physical -2.6
Additional combat of cow parasites Natural -0.7
SN
Parents Social -2.5
Other farmers Social -0.7
PBC
Steep slopes Natural -5.5
Number of animals on the pasture do not fit with the precipitation or
weather conditions Natural -4.3
Animals have to bridge long distances Natural -3.8
Planning safety regarding the upcoming CAP (Common
Agricultural Policy) misses Financial -3.0
Leads to erosion Natural -2.3
Lack of know-how Human -2.0
Uncertainty about use of leased land in future Financial -1.7
More fixed drinking through for animal care Physical -1.5
Fence damages by wild animals Financial -1.5
Increased weather dependency Natural -1.0
Sinkholes (Sinks on the soil surface. mainly in karst areas) Natural -0.8
Low milk prices Financial -0.5


CATCH-C
No. 289782
Deliverable number:
22 May 2015
Page 121 of 180
Appendix III: Farm survey Belgium (Flanders)
FTZ 4A: arable/specialized crop farms (ENZ7_SL2_TXT3)
BMP: Non-inversion tillage (N=134)
Table 53. Drivers and barriers for arable/specialized crop farms (ENZ7_SL2_TXT3) for BMP: Non-
inversion tillage. A = Attitude, SN = subjective norm, PBC = perceived behavioural control.
Drivers A
Promotes freezing of remaining potatoes Natural 4.7
Less erosion Natural 4.2
Less labour intensive Human 3.8
Lower use of fuel Financial 3.8
Increases moisture holding capacity of the soil Natural 3.7
Increase of soil carbon Natural 2.6
allows faster sowing Natural 2.4
Only humus in top layer of soil Natural 1.3
SN
Research and experts Social 1.0
Extension from the province Social 0.2
Other farmers (arable farmers) Social 0.1
PBC
I sow cover crop in august Human 3.8
Existence of a subsidy for NIT Financial 1.2
I have a lot of erodible land Human 1.0
My soil of often too dry under tillage Natural 0.3
I incorporate cover crops Human 0.0
Barriers A
More germination of weeds Natural -4.7
Lower yields in bad weather Financial -4.1
Higher risk of transfer of crop diseases Natural -4.0
Increased use of herbicides Financial -3.9
Lower yields in general Financial -3.9
Less sure of a good preparation of seedbed Natural -3.5
More difficult elimination of weeds Natural -3.5
Higher risk of pests Natural -3.5
Less good germination of following crop Natural -3.5
Less security of a good yield Financial -2.7
More damage of soil structure Natural -2.6
Less good mix of soil with fertilizers Natural -2.5
Esthetical less beautiful fields Social -2.3
More nitrate leaching Natural -2.1
Drying of the soil is more difficult Natural -1.8
SN
The machine contractor Social -2.1
European agricultural policy stimulates NIT Social -0.7

CATCH-C
No. 289782
Deliverable number:
22 May 2015
Page 122 of 180
Results on experimental fields Social -0.5
Flemish Government stimulates NIT Social -0.5
Literature Social -0.4
Extension from agricultural associations Social -0.3
PBC
Good results with ploughing Social -3.7
No appropriate machinery for NIT application Human -3.2
Lot of my crops are sensitive to weeds Human -2.8
I need to adjust my rotation scheme Human -2.2
Contractors (vegetables) want me to plough Social -1.6
No experience with NIT Human -1.6
My soil is often too wet under tillage Natural -1.4
Bad experience with NIT Human -1.2
Lot of my crops are cultivated on hills Human -1.2
A lot of conditions to obtain the subsidy for NIT Financial -1.2
Lot of my crops are vegetables Human -1.0
Lot of my crops start from small seeds Human -1.0
BMP: Incorporation of straw (N=179)
Table 54. Drivers and barriers for arable/specialized crop farms (ENZ7_SL2_TXT3) for BMP:
Incorporation of straw. A = Attitude, SN = subjective norm, PBC = perceived behavioural control.
Drivers A
Improved soil structure Natural 6.6
Increased soil fertility Natural 6.2
Good investment for my soil Natural 6.1
More soil humus Natural 4.9
Source of potassium to my soil Natural 4.8
More trace elements in soil Natural 4.0
Nitrogen is needed to digest the straw Natural 1.8
SN
Animal farmers Social 2.0
PBC
Hard to maintain humus content of soil (legislation) Natural 4.3
Straw is not calculated as source of N and P in legislation Social 2.5
Not easy to find a buyer for straw Physical 2.0
Straw is often too wet and of bad quality Natural 0.6
Barriers A
Additional fuel is needed Physical -3.8
Sowing cover crops is difficult Physical -1.4
Straw is hard to digest Natural -0.6
SN
Contract worker Social -3.6
Other arable farmers Social -3.6
PBC
Good prices for straw Financial -4.7

CATCH-C
No. 289782
Deliverable number:
22 May 2015
Page 123 of 180
I often use manure Physical -3.3
Not allowed to give enough nitrogen to digest straw Social -2.8
Increased cost for chopping straw Financial -2.1
I prefer to harvest cereals at night Physical -1.8
Agreement with animal farmer (straw against manure) Social -1.5
Two operations are needed instead of one Physical -1.3
Dry matter yield of straw is high on my field Financial -0.5
Additional nitrogen is needed to digest straw Natural -0.3
BMP: Application of farmyard manure (N=152)
Table 55. Drivers and barriers for arable/specialized crop farms (ENZ7_SL2_TXT3) for BMP: Application
of farmyard manure. A = Attitude, SN = subjective norm, PBC = perceived behavioural control.
Drivers A
Better soil structure compared to slurry Natural 6.1
Better soil fertility Natural 5.8
More soil life Natural 5.5
Lower erosion risk Natural 5.4
More organic matter compared to slurry Natural 5.2
Improved water holding capacity of the soil Natural 4.6
Higher N supplying capacity of the soil Natural 3.1
SN
Animal farmers offer more slurry Social 1.3
Other arable farmers apply it a lot Social 0.3
PBC
Depending on the contractor Physical 2.1
Working with system of effective nitrogen Social 1.3
Barriers A
Less sure on timing and quantity of N release by the soil compared
to mineral fertilizer Natural -2.3
Less sure on timing and quantity of N release by the soil compared
to slurry Natural -1.9
PBC
No appropriate storage capacity on my farm Physical -5.3
Transport of farmyard manure is more expensive Financial -3.9
Supply of farmyard manure varies Physical -3.4
I have to invest time to find a supplier of farmyard manure in
another region Human -2.5
Homogeneous spread of farmyard manure is not possible Physical -1.8
Contractor not available when farmyard manure has to be spread Physical -1.8
Appropriate machinery not available Physical -1.6
Limited supply of farmyard manure in my area Physical -1.4
Slurry is less expensive for me Financial -0.8
Farmyard manure has to be stored on the farm Physical -0.8
I have to spread manure myself while I do not need to do this for
slurry Human -0.8

CATCH-C
No. 289782
Deliverable number:
22 May 2015
Page 124 of 180
BMP: Application of compost (N=121)
Table 56. Drivers and barriers for arable/specialized crop farms (ENZ7_SL2_TXT3) for BMP: Application
of compost. A = Attitude, SN = subjective norm, PBC = perceived behavioural control.
Drivers A
Improved soil fertility Natural 5.1
Improved soil life Natural 5.1
Improved soil health Natural 4.9
Lower erosion risk Natural 4.7
Increased humus content of soil Natural 4.3
Obtain less heavy soils Natural 3.5
Improved long term N release by the soil Natural 3.1
SN
Other arable farmers make little use of compost Social 2.8
I can do animal farmers in area a favour by using their
slurry/farmyard manure Social 1.0
agricultural magazines Social 0.8
PBC
I prefer organic fertilizer of animal origin Natural 0.7
I prefer solid fertilizer compared to liquid Natural 0.6
Barriers A
Contains waste products Natural -4.5
Higher risk on too high N residue in autumn Natural -3.9
More weeds Natural -3.7
Higher risk on diseases Natural -3.6
Unsure on timing of N release for crop Natural -2.4
no homogenous spread Physical -1.8
Supply of nitrogen needed to digest compost Natural -1.5
PBC
Low offer of compost Physical -4.6
Expensive transport Financial -4.5
More expensive compared to other organic fertilizers Financial -4.5
No experience with compost Human -4.3
Not sure on availability when needed Physical -3.9
Not enough knowledge on composition Human -3.6
Prices are variable Financial -3.5
Slurry is spread for me. compost not Physical -3.4
Much variation in quality Natural -3.2
Hard to find transporter Physical -3.2
No appropriate machinery available for spread Physical -2.9
Legislation for fertilization is too strict Social -2.8
Manure is easy available to me Physical -2.6
More than enough slurry available Physical -2.1
Dependent on contractor to spread compost Physical -1.5
I incorporate straw Natural -0.8

CATCH-C
No. 289782
Deliverable number:
22 May 2015
Page 125 of 180
BMP: Cover crops (N=196)
Table 57. Drivers and barriers for arable/specialized crop farms (ENZ7_SL2_TXT3) for BMP: Cover
crops. A = Attitude, SN = subjective norm, PBC = perceived behavioural control.
Drivers A
Improved soil structure Natural 6.8
Increased soil health Natural 6.6
Lower erosion risk Natural 5.4
Uptake of soil nitrogen Natural 5.1
More carbon in soil Natural 4.9
Prevents nitrogen leaching Natural 4.8
Prevents development of weeds Natural 4.2
Can be tilled earlier to till in spring Physical 4.0
SN
Other arable farmers Social 3.3
Flemish government stimulates cover crops by providing subsidy Social 2.3
PBC
Subsidy compensates cost of cover crops Financial 4.0
I fertilize as much as is allowed on my parcels Social 3.9
High risk for too high N residue in autumn Natural 2.0
I get a subsidy for cover crops Financial 1.9
Additional fertilization is needed for white mustard Financial 0.5
Barriers A
Increased use of herbicides Financial -2.1
Might result in more weeds Natural -1.9
SN
Owner of land Social -2.1
PBC
Short time period harvest -sowing (before Sept 1) Physical -2.4
No appropriate machinery for incorporation Physical -2.0
No appropriate machinery for sowing Physical -1.7
Crops are harvested late in autumn Physical -1.6
Too much administration to get subsidy Human -1.3
Weather conditions are often bad in autumn Natural -1.1
Increase of total cost Financial -0.8
I sow cover crops before 1st of September to get a subsidy Physical -0.7
I grow seed for cover crop myself Financial -0.7
Additional labour for incorporating Human -0.4
Additional labour for sowing Human -0.3

CATCH-C
No. 289782
Deliverable number:
22 May 2015
Page 126 of 180
FTZ 6C: dairy farms on sandy soils (ENZ7_SL1_TXT1)
BMP: Non-inversion tillage (N=186)
Table 58. Drivers and barriers for dairy farms on sandy soils (ENZ7_SL1_TXT1) for BMP: Non-inversion
tillage. A = Attitude, SN = subjective norm, PBC = perceived behavioural control.
Drivers A
Lower use of fuel Financial 5.0
Less labour intensive Human 4.3
Reduce of tillage costs Financial 4.1
Less nitrate leaching Natural 3.4
Increases moisture holding capacity of the soil Natural 3.2
Faster germination of following crop Natural 3.1
Increased effectiveness of the herbicides used Natural 2.9
More easy preparation of seedbed Natural 2.6
More attention for good crop protection Natural 0.1
Higher yields in general Natural 0.0
PBC
My parcels are small Physical 1.9
It’s often very busy when soil is prepared for sowing of maize Human 0.4
Barriers A
More weeds Natural -5.0
Lower yields in general Natural -4.6
Increased use of herbicides Financial -4.4
Higher sensitivity of maize to fungi related diseases Natural -4.3
Less good rooting of the crop after NIT Natural -3.8
Faster germination of weeds Natural -3.5
More soil compaction Natural -3.5
Less good quality of the harvested crop Natural -3.1
less certain of a good yield Human -3.1
Esthetical less beautiful fields Natural -2.6
SN
Other farmers Social -5.2
Extension Social -4.8
The contractor Social -4.6
Results on experimental fields Human -0.3
PBC
No appropriate machinery for NIT application Physical -4.4
Not enough technical knowledge Human -2.6
No experience with NIT Human -2.6
Other farmers have not much experience with NIT Social -2.2
I prefer to incorporate grass instead of destroying Physical -2.0
Bad experience with NIT Human -2.0
My soil is often too wet under tillage Natural -1.9
Maize is often preceded by Italian rye grass Physical -1.9
I do not have enough land to cultivate roughage for my herd Physical -1.5
NIT is new to me Human -0.6

CATCH-C
No. 289782
Deliverable number:
22 May 2015
Page 127 of 180
BMP: Rotation maize-grass (N=189)
Table 59. Drivers and barriers for dairy farms on sandy soils (ENZ7_SL1_TXT1) for BMP: Rotation
maize-grass. A = Attitude, SN = subjective norm, PBC = perceived behavioural control.
Drivers A
Increased soil activity, biology Natural 5.4
Increased soil fertility Natural 5.9
Less weeds Natural 4.8
Increased maize yield after grassland destruction Financial 5.9
Less fertilization is needed on maize when sown after grassland Financial 2.7
PBC
I have mainly large parcels Physical 1.9
Most of my parcels are drained Physical 1.1
Barriers A
Often too high nitrate residue in autumn when grassland is followed by
maize Natural -4.5
PBC
Most of the parcels are not close to the farm Physical -2.8
Soil texture and quality are more appropriate for grass Natural -2.3
Parcels close to the farm are used for grazing Physical -0.5
Soil texture and quality are better for maize production Natural -0.3
BMP: Cover crops (N=198)
Table 60. Drivers and barriers for dairy farms on sandy soils (ENZ7_SL1_TXT1) for BMP: Cover crops. A
= Attitude, SN = subjective norm, PBC = perceived behavioural control.
Drivers A
Improved soil fertility Natural 5.8
More soil humus Natural 5.8
Grass as cover crop results in additional roughage for my herd Financial 5.6
Improved root formation of following crop Natural 5.3
Less nitrate leaching Natural 5.0
Higher yield of following crop Natural 4.9
Less erosion Natural 4.6
Soil is easier to till in spring Natural 4.4
Reduces soil compaction Natural 4.4
Less need of N fertilizers Financial 2.5
SN
Government Social 3.3
PBC
The subsidy for cover crops compensates the cost Financial 3.4
I get a subsidy for sowing cover crop Financial 2.4
Soil is hard to till in autumn Natural 1.7
No derogation applicable on my parcels Social 0.6
Barriers A
Increase of total costs Financial -1.3
Shorter time period for sowing maize if first cut is taken from
graminoid cover crop Physical -1.5
More labour Human -3.0

CATCH-C
No. 289782
Deliverable number:
22 May 2015
Page 128 of 180
Labour peaks Human -3.5
Graminoid cover crops (e.g.. ryegrass. rye) results in too dry soil in
spring Natural -3.8
SN
Salesman for seeds Social -0.2
Other farmers disapprove bare soil in winter Social -1.0
The accountant disapproves Social -2.6
PBC
Bad weather in autumn Natural -4.1
Seed for cover crop is expensive Financial -2.0
My crop is harvested after 15th of October Physical -0.9
BMP: Fast sowing of the cover crop (N=198)
Table 61. Drivers and barriers for dairy farms on sandy soils (ENZ7_SL1_TXT1) for BMP: Fast sowing of
the cover crop. A = Attitude, SN = subjective norm, PBC = perceived behavioural control.
Drivers A
Better developed cover crop in spring Natural 4.5
Higher yield of cover crop Natural 4.5
Higher uptake of lagging N Natural 3.3
PBC
Wet parcels Natural 2.9
High risk on too high N residues in autumn Natural 1.0
Labour peaks when cover crops needs to be sowed Human 0.7
Barriers A
Higher risk on too high N residue Natural -3.9
Italian rye grass might be too well developed before winter has
started Natural -0.8
Better germination of the cover crop Natural -0.7
More difficult to incorporate cover crop Natural -0.7
PBC
Bad weather conditions for sowing cover crop Natural -4.3
Appropriate machinery not available Physical -2.6
Harvest of maize short before sampling for N residues Social -2.0
Damage of soil structure by harvesting maize in wet conditions Natural -1.7
BMP: Rotation of maize with grass clover (181)
Table 62. Drivers and barriers for dairy farms on sandy soils (ENZ7_SL1_TXT1) for BMP: Rotation of
maize with grass clover. A = Attitude, SN = subjective norm, PBC = perceived behavioural control.
Drivers A
Less use of mineral fertilizers Financial 4.2
N fixation Natural 3.3
More crude protein in grass silage Natural 2.8
SN
Government Social 2.1
PBC
Derogation is not allowed on grass clover Social 1.2

CATCH-C
No. 289782
Deliverable number:
22 May 2015
Page 129 of 180
Barriers
Higher costs for crop protection Financial -4.4
Higher sensitivity of clover towards some herbicides Natural -2.1
Germination of clover is more difficult compared to grass Natural -1.3
Disappearance of clover Natural -1.2
Lower DM yield of grass clover compared to grass Natural -0.9
Local dominance of clover in grass clover Natural -0.9
SN
Adviser (feeds. ration) advises against Social -2.2
Adviser (cultivation. crops. soil) advises against Social -2.1
Other farmers Social -0.7
PBC
Purchase of feed protein is expensive Financial -2.5
Grassland is intensively cultivated on my farm Physical -2.5
Positive N balance on my farm Natural -2.0
I get a subsidy for cultivation of grass clover Financial -1.9
other protein sources with relative good prices are available Financial -1.0
No extra support for cultivation of a new crop Human -0.6
Not enough land for roughage for my herd Physical -0.3
FTZ 5M: mixed farms (vegetables-pigs, ENZ7_SL1_TXT2)
BMP: Application of farmyard manure (N=69)
Table 63. Drivers and barriers for mixed farms (vegetables/pigs, ENZ7_SL1_TXT2) for BMP: Application
of farmyard manure. A = Attitude, SN = subjective norm, PBC = perceived behavioural control.
Drivers A
Improved soil fertility Natural 6.6
Better soil structure compared to slurry Natural 6.6
More soil life Natural 6.5
More humus Natural 6.4
Only visible long term effects Natural 6.2
Higher dry matter yield of crops Financial 5.4
Less marshy soil Natural 5.3
More loose/aerated soil compared to slurry Natural 5.2
Contains trace elements Natural 4.9
Slower availability of nitrogen Natural 2.5
PBC
I sow cover crops Physical 3.7
Manure by cooperation with neighbours Social 0.8
More labour for spreading Human 0.3
Barriers SN
Cattle farmers Social -3.2
Contractor Social -2.7
Pig farmers Social -1.0
PBC
Enough slurry available Physical -3.5
Too much slurry available Physical -2.5

CATCH-C
No. 289782
Deliverable number:
22 May 2015
Page 130 of 180
Higher cost for spreading Financial -1.8
Legislation for fertilization is too strict for my slurry Social -1.7
No production of manure on my farm Physical -1.5
I have to pay for manure Financial -0.9
Depending on contractor for spreading Financial -0.9
No appropriate machinery for spreading Physical -0.8
I have to pay to get rid of slurry Financial -0.8
BMP: Compost (N=61)
Table 64. Drivers and barriers for mixed farms (vegetables/pigs, ENZ7_SL1_TXT2) for BMP: Compost. A
= Attitude, SN = subjective norm, PBC = perceived behavioural control.
Drivers A
Improved soil structure Natural 5.9
Better soil life Natural 5.5
More humus Natural 5.3
Better water infiltration and drainage Natural 5.3
Better soil improver than farmyard Natural 2.6
PBC
Vegetables do not need humus Physical 0.6
Barriers A
Higher risk for diseases Natural -4.7
More labour intensive Human -2.1
Faster nutrient release compared to farmyard manure Natural -1.9
SN
Extension Social -5.4
Other farmers Social -5.3
Producers of compost Social -4.5
Education Social -4.0
The municipality Social -3.6
Experimental results Social -1.7
Agricultural magazines Social -1.2
PBC
Too much slurry Social -5.8
Don’t know where to get it Physical -4.6
Lack of knowledge Human -4.5
Compost is expensive Financial -4.5
Offer of compost is low Physical -4.3
Other alternatives to maintain humus content Physical -4.1
Lack of experience Human -3.8
No appropriate machinery for spreading Physical -3.7
Humus content of my soils is good Natural -2.0
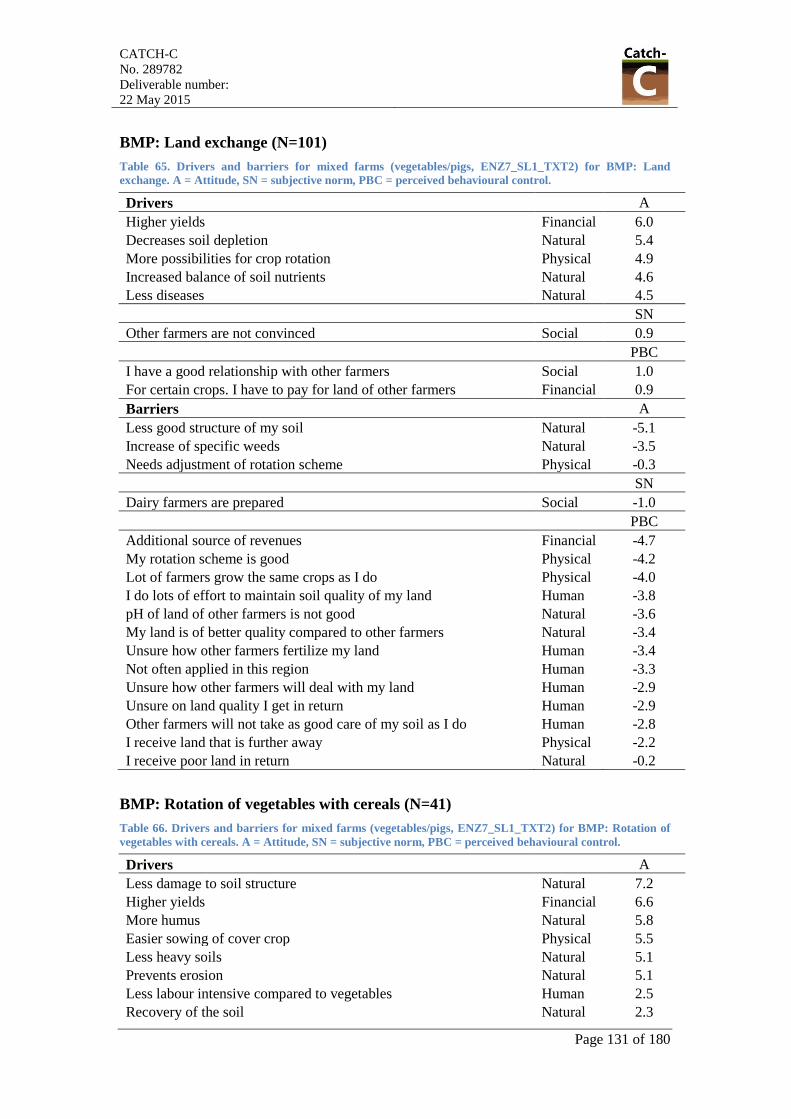
CATCH-C
No. 289782
Deliverable number:
22 May 2015
Page 131 of 180
BMP: Land exchange (N=101)
Table 65. Drivers and barriers for mixed farms (vegetables/pigs, ENZ7_SL1_TXT2) for BMP: Land
exchange. A = Attitude, SN = subjective norm, PBC = perceived behavioural control.
Drivers A
Higher yields Financial 6.0
Decreases soil depletion Natural 5.4
More possibilities for crop rotation Physical 4.9
Increased balance of soil nutrients Natural 4.6
Less diseases Natural 4.5
SN
Other farmers are not convinced Social 0.9
PBC
I have a good relationship with other farmers Social 1.0
For certain crops. I have to pay for land of other farmers Financial 0.9
Barriers A
Less good structure of my soil Natural -5.1
Increase of specific weeds Natural -3.5
Needs adjustment of rotation scheme Physical -0.3
SN
Dairy farmers are prepared Social -1.0
PBC
Additional source of revenues Financial -4.7
My rotation scheme is good Physical -4.2
Lot of farmers grow the same crops as I do Physical -4.0
I do lots of effort to maintain soil quality of my land Human -3.8
pH of land of other farmers is not good Natural -3.6
My land is of better quality compared to other farmers Natural -3.4
Unsure how other farmers fertilize my land Human -3.4
Not often applied in this region Human -3.3
Unsure how other farmers will deal with my land Human -2.9
Unsure on land quality I get in return Human -2.9
Other farmers will not take as good care of my soil as I do Human -2.8
I receive land that is further away Physical -2.2
I receive poor land in return Natural -0.2
BMP: Rotation of vegetables with cereals (N=41)
Table 66. Drivers and barriers for mixed farms (vegetables/pigs, ENZ7_SL1_TXT2) for BMP: Rotation of
vegetables with cereals. A = Attitude, SN = subjective norm, PBC = perceived behavioural control.
Drivers A
Less damage to soil structure Natural 7.2
Higher yields Financial 6.6
More humus Natural 5.8
Easier sowing of cover crop Physical 5.5
Less heavy soils Natural 5.1
Prevents erosion Natural 5.1
Less labour intensive compared to vegetables Human 2.5
Recovery of the soil Natural 2.3

CATCH-C
No. 289782
Deliverable number:
22 May 2015
Page 132 of 180
More labour intensive than maize Human 1.4
Decrease of moisture content of soil Natural 0.2
SN
Extension Social 0.8
Agricultural fairs Social 0.0
PBC
I apply non inversion tillage on my parcels Physical 0.1
Barriers A
Yield of cereals is low Financial -4.7
Additional fertilization Natural -4.6
Economically less interesting crop Financial -2.6
More crop protection Natural -2.6
Higher risk on failure with cereals Financial -1.4
grain maize residue contains more organic matter Natural -0.2
SN
Seller of seeds Social -2.0
Government Social -1.7
Other farmers are not convinced Social -1.3
My neighbours Social -0.1
PBC
Wet weather conditions Natural -5.3
Low prices for cereals Financial -4.9
Limited surface area on my farm Physical -3.0
Easy access for pigeons Natural -3.0
No appropriate machinery to fertilize cereals in spring Physical -2.4
Seed is expensive Financial -2.4
No experience with cereals Human -1.6
No ingredient in pig feed Physical -1.3
Mainly vegetables on my farm Physical -0.8
Enough organic matter in my soils Natural -0.6
No appropriate machinery to incorporate straw Physical -0.6
soil quality is not appropriate Natural -0.5
Don’t fit in current rotation scheme Physical 0.0
BMP: Non-inversion tillage (N=117)
Table 67. Drivers and barriers for dairy farms on sandy soils (ENZ7_SL1_TXT1) for BMP: Non-inversion
tillage. A = Attitude, SN = subjective norm, PBC = perceived behavioural control.
Drivers A
Less fuel Financial 5.4
Time saving Human 4.8
Improved soil life Natural 4.7
More soil humus Natural 4.6
Improved soil structure Natural 4.4
Decrease of total cost Financial 4.3
Faster warm up of soil in spring Natural 4.1
Less erosion Natural 3.7
Permits earlier sowing in spring Physical 3.6

CATCH-C
No. 289782
Deliverable number:
22 May 2015
Page 133 of 180
More smooth seedbed Natural 3.2
Crop can be harvested earlier Physical 2.7
SN
Agricultural magazines Social 1.9
PBC
I have parcels with high erosion risk Natural 1.5
A lot of small parcels Physical 1.5
Barriers A
More weeds Natural -4.9
Lower crop yields Financial -4.4
Higher risk on crop diseases Natural -4.2
Higher risk on soil compaction Natural -4.0
Higher risk on tracks Natural -3.9
Less airy soil Natural -3.7
Lagging crop residues hamper soil tillage activities Physical -3.5
Less good drainage Natural -3.3
Increased use of herbicides Financial -3.3
Faster germination of weeds Natural -2.2
Esthetical less beautiful fields Social -1.3
SN
Contract worker Social -4.2
Extension services Social -4.2
Other farmers have less good results Social -0.7
Experimental results Social -0.6
PBC
Intensive cultivation of vegetables Physical -3.9
After harvest. damaged soil structure occurs Natural -3.6
Not free of weeds before soil tillage practices Natural -3.5
After harvest. substantial amount of weeds remains Natural -3.4
After harvest. crop residues often remain Physical -3.3
Not well informed on the technique Human -2.4
A lot of crops are cultivated on hills Physical -2.4
Less dependent on good weather for good result Natural -1.9
No experience Human -1.7
Weeds are mechanically removed Physical -1.7
No appropriate machinery Physical -0.8
Not often applied in my surroundings Human -0.5

CATCH-C
No. 289782
Deliverable number:
22 May 2015
Page 134 of 180
BMP: Cover crops (N=101)
Table 68. Drivers and barriers for dairy farms on sandy soils (ENZ7_SL1_TXT1) for BMP: Cover crops. A
= Attitude, SN = subjective norm, PBC = perceived behavioural control.
Drivers A
More soil humus Natural 7.1
Better soil structure Natural 6.3
More airy soil Natural 6.2
Increased drainage Natural 5.8
Prevent nitrate leaching Natural 5.7
Less erosion Natural 5.6
Permits easier tillage of soil in spring for non-graminoid cover crops Financial 5.5
Soil is protected in winter Natural 5.5
Permits earlier tillage of soil in spring for non-graminoid cover crops Financial 5.5
Increase in crop yields Financial 5.4
More smooth soil surface in spring Natural 4.9
Esthetical more beautiful fields during winter Social 4.8
Lower N residue in autumn Natural 4.3
Less risk for diseases Natural 3.7
SN
Government Social 2.8
Other farmers Social 2.8
Extension services Social 2.7
Research institutions Social 2.6
Seed salesman Social 1.4
Agricultural press Social 0.0
PBC
I have too chose between many different cover crops Human 1.8
I get a subsidy Financial 0.7
No appropriate machinery for sowing cover crops Physical 0.1
Barriers A
Increase in total costs Financial -4.5
Increased use of herbicides after graminoid cover crops Financial -2.3
Soil is longer wet in spring after graminoid cover crops Natural -2.3
More weeds in the following crop Natural -2.3
More labour on my farm Human -2.2
Graminoid cover crops re appear in following crop Natural -2.1
SN
Contract worker Social -3.1
PBC
Weather conditions in autumn are often bad Natural -4.1
Lots of administration to get a subsidy Human -2.8
Graminoid cover crops need to be destroyed in spring Physical -2.0
Too busy when cover crops needs to be sown Human -0.7
Black oats are not easy available Physical -0.2

CATCH-C
No. 289782
Deliverable number:
22 May 2015
Page 135 of 180
Appendix IV: Farm survey France2
FTZ 13A: arable farms on Rendzina, Champagne Berichonne
(ENZ7_SL2_TXT2); and FTZ 14C: dairy farms on Cambisols and
luvisols (long term grassland, ENZ7_SL2_TXT3)
BMP: cover crops (N=16; 17)
Table 69. Drivers and barriers for arable farms on Rendzina, Champagne Berichonne (ENZ7_SL2_TXT2)
and dairy farms on Cambisols and luvisols (long term grassland, ENZ7_SL2_TXT3)for BMP: Cover crops.
A = Attitude, SN = subjective norm, PBC = perceived behavioural control.
Arable Dairy
Drivers A
better yield for the following crop Economic
0.1
better yield over the succession Economic
0.0
decrease herbicide cost Economic 0.3
decrease fertilisation cost Economic 0.5
helps decreasing irrigation needs Technical 0.5
decrease evapotranspiration Technical 0.3
decrease weeds pressure Technical 1.7 0.9
decrease soil borne diseases Technical 0.8
easy to implement in existing rotations Technical 0.8
facilitates nitrogen fertilisation Technical
0.7
improves soil biological activity Environment 5.1 3.1
decreases deep layers compaction Environment 1.7
improves top layers porosity Environment 2.8 2.1
improves soil structure stability Environment 2.9 2.0
increase organic matter content Environment 3.7 2.7
mitigates nitrate issues Environment 2.3
decreases run off Environment 0.9 2.3
decreases erosion Environment 2.1
can be implemented within current contracts Environment 0.1
SN
Advisors 0.4
PBC
soils lack OM on the farm Environment 1.6
soils are heterogeneous Environment 0.4
managing weeds is difficult on the farm Environment 0.1
Barriers A
Lower yield for the following crop Economic -0.7
Lower yield over the crop succession Economic -0.7
increase fuel cost Economic -1.5 -2.3
increase mechanisation cost Economic -2.3
2 Note: for France, the scaling of A, SN and PBC has not been done the same way as it has been done in the other
countries. Attitudes below 8 can be considered as barriers, above as drivers, for A and PBC categories

CATCH-C
No. 289782
Deliverable number:
22 May 2015
Page 136 of 180
increase seed cost Economic -1.2 -2.7
increase work load Human -1.1 -2.3
modifies work organisation Human -1.5 -1.0
increase pests Technical -0.1
hard to destroy Technical -0.5
increase erosion Environment
-0.2
SN
Accountants Social -2.1 -1.3
Advisors Social -1.4
Family Social -1.9 -1.1
Fellow farmers Social -1.9 -1.4
PBC
lack of available material on the farm Machinery -1.8 -0.8
work organisation Human -0.9 -0.3
work available Human -1.1 -0.7
fields are too scattered to implement the technique Human -0.5 -0.9
your crops need irrigation Human -0.9 -0.2
difficult access to fields Human -0.6 -0.3
rotation prevent implementing the BMP Human -1.1 -0.4
soils are eroded Environment -1.2 -0.8
soils lack OM Environment -1.0
soils are compacted Environment -1.8 -1.0
heavy metal contamination Environment -0.5 -0.2
soils are heterogeneous Environment -1.5
soil borne disease Environment -1.5 -0.6
Hydromorphy Environment -0.9 -1.0
bad quality Environment -2.0 -0.5
managing weeds is difficult on your farm Environment -1.0
contracts prevent implementing the BMP Social -0.7 -0.2
agri-food requirements prevent Social -0.5 -0.2
you can't access relevant formation Social -0.7 -0.4
no relevant advice available Social -1.0 -0.7
the technique is unknown Social -0.9 -0.3
Note: There were not enough despondences to include arable farming on Cambisols in the
analysis

CATCH-C
No. 289782
Deliverable number:
22 May 2015
Page 137 of 180
FTZ 13A: arable farms on Rendzina, Champagne Berichonne
(ENZ7_SL2_TXT2); FTZ 15A: arable farms on Cambisols
(ENZ12_SL3_TXT4); and FTZ 14C: dairy farms on Cambisols and
luvisols (long term grassland, ENZ7_SL2_TXT3)
BMP: Non-inversion tillage (N=9; 19; 25)
Table 70. Drivers and barriers for arable farms on Rendzina, Champagne Berichonne (ENZ7_SL2_TXT2),
arable farms on Cambisols (ENZ12_SL3_TXT4) and dairy farms on Cambisols and luvisols (long term
grassland, ENZ7_SL2_TXT3)for BMP: Simplified cultivation techniques. A = Attitude, SN = subjective
norm, PBC = perceived behavioural control.
Arable.
Rendzin
Arable.
Cambisols Dairy
Drivers A
increase yield over the succession Economic 0.5 1.5 0.4
decrease fuel cost Economic 2.9 2.3 1.1
decrease herbicide cost Economic 1.2
decrease fertilisation cost Economic 1.5 2.1 1.1
decrease mechanisation cost Economic 1.9 1.6 0.5
can be implemented with current material Machinery 0.3
decrease work load Machinery 4.5 2.4 1.6
does not need more irrigation Technical
0.6 0.1
decrease evapo Technical 1.9
0.3
decrease soil borne diseases Technical 0.8 0.3 0.5
does not modify rotations Technical
0.1 0.1
improves soil biological activity Environment 7.1 2.8 3.1
decrease deep layers compaction Environment 3.3 2.0 0.6
improves top layers porosity Environment 3.6 2.5 0.5
improves soil structure stability Environment 4.1 3.5 1.7
improves soil homogenisation Environment 0.9
increase organic matter content Environment 4.8 3.3 2.9
decrease run off Environment 2.5 3.3 0.9
decrease erosion Environment 5.2 2.9 0.3
no modification of current contracts Social
1.0 0.5
PBC
material available Machinery
2.6 1.0
work available Human
0.1
your crops need irrigation Human
0.3
soils are eroded Environment
1.3
soils lack OM Environment 2.5 2.7
soils are compacted Environment
2.2
soils are heterogeneous Environment
0.8
bad quality Environment
0.3
managing weeds is difficult on your farm Environment
2.3 1.1
you can't access relevant formation Social
0.2

CATCH-C
No. 289782
Deliverable number:
22 May 2015
Page 138 of 180
no relevant advice available Social
1.3
unknown technique Social 2.1
Barriers A
decrease yield for the following crop Economic -1.5 -0.2 -0.2
increase herbicide cost Economic
-0.4 -0.8
needs a modification of material Machinery
-0.3 -0.7
modifies work organisation Machinery -0.6
-0.5
Increase weeds Technical -0.3 -0.4
increase pests pressure Technical
-0.3
modifies rotations Technical -1.5
diminishes soil homogenisation Environment
-0.6 -0.9
needs a modification of current contracts Social -1.5
SN
Accountants Social -1.6 -1.8 -2.1
Advisors Social -0.3 -0.7 -2.0
Family Social -0.7 -1.3 -1.3
Fellow farmers Social -0.8 -1.6 -1.6
PBC
lack available material Machinery -0.7
modifies work organisation Human -0.9 -1.8 -1.5
work available Human -0.1 -1.1
fields are too scattered to implement the
technique Human -1.0 -1.2 -1.7
your crops need irrigation Human -0.4
-1.2
difficult access to fields Human -0.3 -1.1 -1.3
rotation prevent implementing the BMP Human -0.4 -1.2 -1.3
soils are eroded Environment -1.2
-1.6
soils lack OM Environment
-1.8
soils are compacted Environment -1.9
-2.0
heavy metal contamination Environment -0.2 -0.4 -0.6
soils are heterogeneous Environment -1.9
-1.9
soil borne disease Environment -1.5 -1.0 -1.5
Hydromorphy Environment -1.6 -1.5 -1.7
bad quality Environment -1.9
-1.6
managing weeds is difficult on your farm Environment -1.9
contracts prevent implementing the BMP Social -0.1 -1.4 -1.1
agri-food requirements prevent the BMP Social -0.1 -1.0 -0.9
you can't access relevant formation Social -0.7
-1.6
no relevant advice available Social -0.5
-1.4
unknown technique Social -0.7 -1.8

CATCH-C
No. 289782
Deliverable number:
22 May 2015
Page 139 of 180
BMP: No tillage (N=14; 14; 16)
Table 71. Drivers and barriers for arable farms on Rendzina, Champagne Berichonne (ENZ7_SL2_TXT2),
arable farms on Cambisols (ENZ12_SL3_TXT4) and dairy farms on Cambisols and luvisols (long term
grassland, ENZ7_SL2_TXT3)for BMP: No tillage. A = Attitude, SN = subjective norm, PBC = perceived
behavioural control.
Arable,
Rendzina,
Arable,
Cambisols Dairy
Drivers A
increase yield over the succession Economic
0.3 0.3
decrease fuel cost Economic 3.5 0.7 3.7
decrease fertilisation cost Economic 1.3 1.7 0.5
decrease mechanisation cost Economic 0.9 1.7 0.5
decrease work load Machinery 1.1 1.7 3.9
need less irrigation Machinery 0.5 0.1
decrease evapo Machinery 0.4
1.3
decrease soil borne diseases Machinery
1.0
Does not modify rotations Machinery
0.6 0.1
improves soil biological activity Environment 6.8 4.2 5.0
decrease deep layers compaction Environment 0.1 0.5
improves top layers porosity Environment 2.1 1.9 2.1
improves soil structure stability Environment 5.8 2.9 2.6
increase organic matter content Environment 8.9 4.8 5.0
decrease run off Environment 0.5 2.6 0.5
prevents erosion Environment 2.2 3.1 2.2
PBC
available material Machinery 0.1
1.6
soils are eroded Environment
1.0
soils lack OM Environment 1.8 2.4
soils are compacted Environment 0.6 0.7 0.1
Barriers A
decrease yield for the following crop Economic -2.1 -1.4 -0.9
decrease yield over the succession Economic -1.1
-0.1
increase herbicide cost Economic -0.7 -0.7 -1.3
needs a modification of material Machinery -0.7 -2.0 -1.6
modifies work organisation Machinery -0.7 -1.4
need more irrigation Machinery
-0.7
increase evapo Machinery
-1.1
increase weeds Machinery -0.3 -1.2 -0.9
increase pests Machinery -0.4 -0.1 -0.8
increase soil borne diseases Machinery
-0.7
modifies rotations Machinery -0.7
increase deep layers compaction Environment
-0.7
worsens soil heterogenity Environment -0.2 -0.6 -2.1
a modification of current contracts Social -0.9 -1.9 -0.9

CATCH-C
No. 289782
Deliverable number:
22 May 2015
Page 140 of 180
SN
accountants Social -1.6 -2.1 -1.9
Advisors Social -0.6 -1.2 -0.9
Family Social -0.7 -0.9 -1.9
Fellow farmers Social -0.4 -1.1 -1.2
PBC
lack available material Machinery
-3.6 -2.9
work organisation Human -0.2 -2.1 -1.0
work available Human -0.6 -1.6 -1.0
fields are too scattered to implement the
technique Human -1.1 -2.4 -2.3
your crops need irrigation Human -1.0 -1.9 -0.6
difficult access to fields Human -0.6 -1.4 -0.7
rotation prevent implementing the BMP Human -0.8 -1.3 -0.4
soils are compacted Environment -1.8 -1.8 -2.2
heavy metal contamination Environment -0.5 -1.3 -0.5
soils are heterogeneous Environment -1.6 -3.3 -2.2
soil borne disease Environment
-1.7 -1.2
hydromorphy Environment -1.9 -1.4 -2.0
bad quality Environment -1.7 -1.9 -1.3
managing weeds is difficult on your farm Environment -2.1 -3.2 -3.3
contracts prevent implementing the BMP Social -1.1 -2.8 -0.1
agri-food requirements prevent Social -0.2 -0.9 -0.6
you can't access relevant formation Social -1.1 -1.0 -1.8
no relevant advice available Social -1.8 -1.8 -1.4
unknown technique Social -0.4 -1.6 -0.8

CATCH-C
No. 289782
Deliverable number:
22 May 2015
Page 141 of 180
Appendix V: Farm survey Germany
FTZ 7A: arable and mixed farms on sandy soil (ENZ4_SL1-TXT1)
BMP: Non-inversion tillage (N=72)
Table 72. Drivers and barriers for arable and mixed farms on sandy soil (ENZ4_SL1-TXT1) for BMP:
Non-inversion tillage. A = Attitude, SN = subjective norm, PBC = perceived behavioural control.
Drivers A
Increased work effectiveness Human 6.5
Prevention of erosion Natural 6.4
Support of soil life Natural 6.3
Better storage of soil moisture Natural 6.1
Better soil structure Natural 5.4
Lower use of fuel Physical 5.2
Prevention of layers of unrotten straw Natural 4.7
Application of manure in upper 10 cm of the soil Physical 4.1
More easy employment of unskilled labour Human 3.8
More vital, strong plants Natural 3.7
Diversified work Human 1.8
A complex plant production system Physical 0.6
PBC
I have wet soils that require ploughing Natural 1.4
It is often very dry when we need to work the soil Natural 0.1
Barriers A
Difficulties with Elymus repens (quackgrass) Natural -6.4
Slow warming up of soil in spring Natural -6.3
Higher use of herbicides Physical -6.2
Bad conditions for crop emergence Natural -6.0
No prevention measures against the corn borer Natural -4.6
Worse exterior quality of potatoes Natural -4.2
Non-durable machines Physical -4.1
Volunteer crops Natural -3.9
Lower maize yields Natural -3.7
Tearing up stones from bottom to soil surface Physical -3.3
Uneven fields Natural -2.8
High set up times Human -2.1
More use of contractor service Human -0.4
SN
Other farmers Social -1.3
Extension Social -0.9
PBC
I cannot do mulch seeding with my machines Physical -3.2
Capital is currently not so cheap that one can easily buy machines Financial -2.2
My farm size does not allow me to just buy a machine when I want to Financial -2.2
Not many of my neighbours successfully apply non-inversion tillage Social -2.1

CATCH-C
No. 289782
Deliverable number:
22 May 2015
Page 142 of 180
I cannot easily borrow machines Physical -1.9
My cover crops often grow very high Natural -1.8
Glyphosate is not affordable Financial -1.7
I do not have a disc harrow Physical -1.6
A cultivator with features I would need is not on the market Physical -1.4
I do not have a big tractor Physical -1.0
I regularly apply dung on my land Physical -0.8
My seeder gets blocked more easily when I apply NIT Physical -0.4
With NIT I cannot save costs on my farm Financial -0.4
BMP: Cover crops (N=60)
Table 73. Drivers and barriers for arable and mixed farms on sandy soil (ENZ4_SL1-TXT1) for BMP:
Cover crops. A = Attitude, SN = subjective norm, PBC = perceived behavioural control.
Drivers A
Soil fertility 6.1
High humus content in the soil 5.5
Soil erosion 5.5
Provision of food and shelter for the wildlife 4.2
Less storage space for slurry needed 3.7
Dry soil 3.6
Nitrogen and potash leaking 3.0
High water buffering capacity of the soil 0.5
SN
Water management 1.7
Advisors 0.2
PBC
The effort for planting a cover crop does not pay off through higher yields
in the succeeding crop 1.3
Labour peaks during springtime seeding 0.7
Barriers SN
Beekeepers -3.8
Fellow farmers -2.4
Successor -1.3
PBC
Lack of machine endowment for stubble cultivating and seeding of cover
crops -3.2
High precipitation in autumn -2.9
Without fields that can be irrigated cost-efficiently -2.5
Impossible to start already during harvest with stubble treatment -2.1
High cover crops‘ seeds prices -1.7
No efficient contractor available in the region, -1.4
Does not fit into the workflow -1.3
A lot of unevenly spread straw on the fields after threshing -1.2
Growing maize after sugar beets -0.9
Higher costs -0.3
Higher work effort -0.1

CATCH-C
No. 289782
Deliverable number:
22 May 2015
Page 143 of 180
BMP: Crop rotation (N=53)
Table 74. Drivers and barriers for arable and mixed farms on sandy soil (ENZ4_SL1-TXT1) for BMP:
Crop rotation. A = Attitude, SN = subjective norm, PBC = perceived behavioural control.
Drivers A
Increase soil fertility 5.9
Support soil health 5.4
Avoiding certain problematic weeds 4.9
Securing yield stability of each crop 4.5
Prevention of escalation of pests and diseases 4.4
Yield increase 4.2
Increase soil humus content 4.2
Contribution to a nice looking landscape 3.9
Support of bees 3.8
Breaking labour peaks 2.6
Acceptance of biogas plant increases 1.3
PBC
Well running workflow 2.3
High cereal prices 0.6
Barriers A
Considerable higher costs* -3.9
Low income -3.4
SN
Other farmers -3.3
Agricultural advisory -3.1
PBC
Crops that vary widely in respect to their gross margin -4.3
High land rents -4.3
No other biomass plants beside maize -2.5
Having a biogas plant -2.4
Specialized farm -2.1
Cultivation on former grassland -2.0
Needing a lot of straw -0.8
Only limited market and utilization opportunities for the different crops -0.4
No exchange of fields with fellow farmers possible -0.3

CATCH-C
No. 289782
Deliverable number:
22 May 2015
Page 144 of 180
FTZ 8A: arable/cereal and mixed farms on sandy soils
(ENZ6_SL1_TXT1)
BMP: Cover crops (N=96)
Table 75. Drivers and barriers arable/cereal and mixed farms on sandy soils (ENZ6_SL1_TXT1) for BMP:
Cover crops. A = Attitude, SN = subjective norm, PBC = perceived behavioural control.
Drivers A
Reduced nutrient leaching Natural 7.8
Prevention of erosion Natural 7.6
Positive influence on humus content Natural 7.4
Better soil tilth/ crumb structure Natural 7.3
More nutrients for the succeeding crop Natural 6.7
Better workability of soil Physical 5.8
Facilitation of bees Natural 5.0
Additional fodder for cattle and biogas plants Natural 2.6
SN
Training/ studies Social 4.7
Predecessor/ successor Social 0.7
Beekeepers Social 0.6
PBC
Cover crops do not fit into my crop rotation Physical 3.5
I have plots to grow maize early in the year Natural 2.0
Barriers PBC
No irrigation plots for maize cultivation Physical -3.6
I am at the limit with my workforce Physical -3.4
Growing cover crops results in labour peaks on my farm Physical -3.3
I do not produce seeds for cover crops myself Physical -2.8
On my farm it is not profitable to grow lupines and peas Financial -2.8
We often have extreme wet conditions/ drought in autumn Natural -2.4
My financial situation is not relaxed Financial -2.4
I do not grow many summer crops Physical -2.3
On my farm harvest is relatively late Physical -2.2
No technical solutions for mulch drilling Physical -2.1
I am not motivated to prevent fallow fields in winter Human -1.9
Prices for cover crops’ seeds are currently high Financial -1.8
I cannot combine cover crops with direct drilling Physical -1.7
I cannot use cover crops as fodder or in a biogas plant Physical -1.7
I have bad experience with cover crops Human -1.5
Many cover crops have an early seeding time Natural -1.4
Adding organic matter to fields not necessary Physical -1.3
Higher workload Physical -0.0

CATCH-C
No. 289782
Deliverable number:
22 May 2015
Page 145 of 180
BMP: Controlled traffic farming (N=86)
Table 76. Drivers and barriers arable/cereal and mixed farms on sandy soils (ENZ6_SL1_TXT1) for BMP:
Controlled traffic farming. A = Attitude, SN = subjective norm, PBC = perceived behavioural control.
Drivers A
Better root growth Natural 6.6
Support of soil life Natural 6.1
Looser soil between machine tracks Natural 5.5
Higher yields Natural 5.2
Prevention of subsoil compaction Natural 5.2
Better water filtration Natural 5.1
Fuel savings Physical 4.8
Increase of humus content Natural 4.2
Straight machine tracks Physical 3.4
Better trafficability also under wet conditions Physical 2.8
SN
Farmers’ journals Social 0.1
Barriers A
Cemented machine tracks Natural -3.2
SN
Other farmers Social -2.9
Machine dealer Social -0.6
PBC
A CTF system would be very expensive for me Financial -3.2
My machines do not have the same working width Physical -2.4
When I buy new machines I do not pay attention to a uniform working
width Physical -2.2
The farm manager is old Human -1.7
I have a small farm with specialized technique Physical -1.7
I have a lot of short-term tenure Financial -1.6
I do not work with GPS Physical -1.5
I invested a lot in the last years Financial -1.1
I do not know any farm where CTF is implemented successfully Human -0.5

CATCH-C
No. 289782
Deliverable number:
22 May 2015
Page 146 of 180
FTZ 9A: arable/cereal and mixed farms on sandy soils
(ENZ6_SL2+SL3_TXT3)
BMP: Non-inversion tillage (N=95)
Table 77. Drivers and barriers for arable/cereal and mixed farms on sandy soils (ENZ6_SL2+SL3_TXT3)
for BMP: Non-inversion tillage. A = Attitude, SN = subjective norm, PBC = perceived behavioural control.
Drivers A
High work efficiency Physical 6.4
Prevention of plough pans Natural 5.9
Fuel savings Physical 5.5
Nutrients in upper soil layer Natural 2.7
SN
Farmers’ journals Social 1.84
Barriers A
Uneven fields Natural -3.0
Bad soil tilth Natural -4.7
Bad conditions for crop emergence Natural -5.4
Root and stem diseases Natural -5.5
More disease pressure Natural -5.5
SN
Other farmers Social -1.2
PBC
I have wet soils Natural -1.4
BMP: Low Soil Pressure Systems (N=93)
Table 78. Drivers and barriers for arable/cereal and mixed farms on sandy soils (ENZ6_SL2+SL3_TXT3)
for BMP: Reduced soil compaction. A = Attitude, SN = subjective norm, PBC = perceived behavioural
control.
Drivers A
More even root penetration Natural 7.6
Low soil pressure Natural 7.9
Prevention of soil compaction Natural 7.7
Fuel savings Physical 6.1
SN
Farmers’ journals Social 4.8
Barriers SN
Other farmers Social -1.3
PBC
I do not have a tire pressure control system Physical -4.7
I have to cross villages to reach more than 15 % of my fields Physical -4.0
I can reach a lot of my fields only by using streets Physical -3.4
Consequent adjustment of tire pressure to field and street results in more
work effort on my farm Physical -2.8
The price for special tires is very high Financial -2.3

CATCH-C
No. 289782
Deliverable number:
22 May 2015
Page 147 of 180
The price for a tire pressure control system is very high Financial -2.2
Consequent adjustment of tire pressure to field and street delays the
operating schedule on my farm Physical -1.9
If I use low tire pressure on the field I/ my employees often forget to
increase the pressure again for the streets Human -1.2
BMP: Cover crops (N=80)
Table 79. Drivers and barriers for arable/cereal and mixed farms on sandy soils (ENZ6_SL2+SL3_TXT3)
for BMP: Cover crops. A = Attitude, SN = subjective norm, PBC = perceived behavioural control.
Drivers A
More active soil life Natural 8.0
Prevention of erosion Natural 6.9
Looser and better aerated soil Natural 6.9
Humus enrichment Natural 6.5
Better trafficability in autumn Physical 5.5
Suppression of weed emergence Natural 5.1
Less nutrient leaching Natural 5.0
Food and shelter for wildlife Natural 3.9
Faster warming of soil in spring Natural 3.4
PBC
I am selling straw from at least 30 % of my land Financial 1.9
I do not have the machinery for mulch drilling or can easily borrow it Physical 0.0
Barriers A
More fuel use Financial -3.2
Higher work effort Human -2.7
No winter furrow Natural -2.1
SN
Extension Social -1.1
PBC
I cannot easily incorporate cover crops in spring Physical -3.3
I cannot easily try new practices on small plots Physical -2.1
I grow rape Physical -1.6

CATCH-C
No. 289782
Deliverable number:
22 May 2015
Page 148 of 180
BMP: Crop rotation (N=76)
Table 80. Drivers and barriers for arable/cereal and mixed farms on sandy soils (ENZ6_SL2+SL3_TXT3)
for BMP: Crop rotation. A = Attitude, SN = subjective norm, PBC = perceived behavioural control.
Drivers A
Higher yields Natural 5.9
Maintenance of humus content Natural 5.4
Mutual facilitation of crops within the crop rotation Natural 5.3
Breaking of labour peaks Human 4.7
Food and shelter for wildlife Natural 3.4
Prevention of nutrient deficiency Natural 3.1
PBC
Our crop rotation is quite well established Human 1.3
Barriers A
Crops with lower yields Natural -2.5
Higher work effort Human -2.1
Crops with high demands on weed control Natural -0.2
SN
Extension Social -3.3
Predecessor/ successor Social -2.9
PBC
My farm is not organic Physical -7.2
I have plots that are far away Physical -2.9
I do not have a high range of different market and utilization
opportunities for a lot of different crops Financial -2.9
I do not have to grow legumes to stabilize yields Physical -2.6
I do not have the opportunity of direct marketing Financial -2.1
I do not grow legumes Physical -1.9
I could not utilize my machines better in a wider crop rotation Physical -1.8
I could not utilize my machines better in a changed crop rotation Physical -1.5
I have not solved a certain weed problem with crop rotation Physical -1.3
I do not have sufficient storage capacity for different crops Physical -1.1
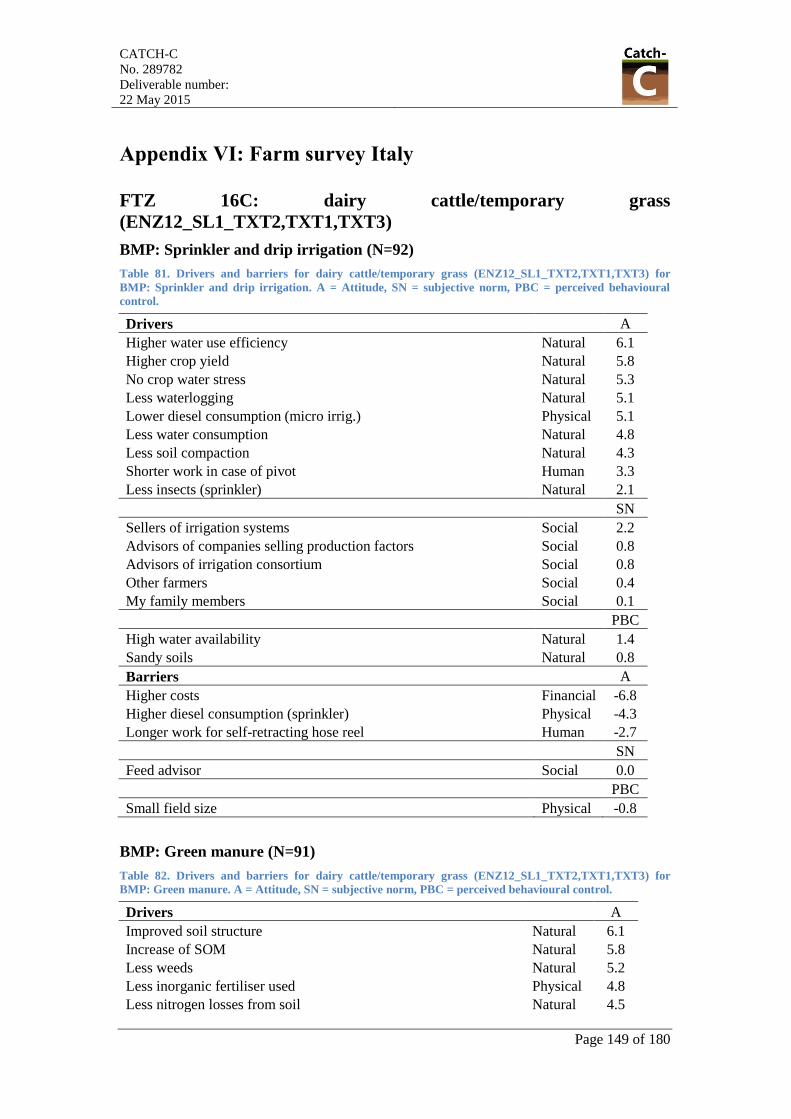
CATCH-C
No. 289782
Deliverable number:
22 May 2015
Page 149 of 180
Appendix VI: Farm survey Italy
FTZ 16C: dairy cattle/temporary grass
(ENZ12_SL1_TXT2,TXT1,TXT3)
BMP: Sprinkler and drip irrigation (N=92)
Table 81. Drivers and barriers for dairy cattle/temporary grass (ENZ12_SL1_TXT2,TXT1,TXT3) for
BMP: Sprinkler and drip irrigation. A = Attitude, SN = subjective norm, PBC = perceived behavioural
control.
Drivers A
Higher water use efficiency Natural 6.1
Higher crop yield Natural 5.8
No crop water stress Natural 5.3
Less waterlogging Natural 5.1
Lower diesel consumption (micro irrig.) Physical 5.1
Less water consumption Natural 4.8
Less soil compaction Natural 4.3
Shorter work in case of pivot Human 3.3
Less insects (sprinkler) Natural 2.1
SN
Sellers of irrigation systems Social 2.2
Advisors of companies selling production factors Social 0.8
Advisors of irrigation consortium Social 0.8
Other farmers Social 0.4
My family members Social 0.1
PBC
High water availability Natural 1.4
Sandy soils Natural 0.8
Barriers A
Higher costs Financial -6.8
Higher diesel consumption (sprinkler) Physical -4.3
Longer work for self-retracting hose reel Human -2.7
SN
Feed advisor Social 0.0
PBC
Small field size Physical -0.8
BMP: Green manure (N=91)
Table 82. Drivers and barriers for dairy cattle/temporary grass (ENZ12_SL1_TXT2,TXT1,TXT3) for
BMP: Green manure. A = Attitude, SN = subjective norm, PBC = perceived behavioural control.
Drivers A
Improved soil structure Natural 6.1
Increase of SOM Natural 5.8
Less weeds Natural 5.2
Less inorganic fertiliser used Physical 4.8
Less nitrogen losses from soil Natural 4.5

CATCH-C
No. 289782
Deliverable number:
22 May 2015
Page 150 of 180
PBC
Low SOM Natural 0.8
Bad soil structure Natural 0.6
Barriers A
Cost increase Financial -7.2
Lower self-production of forage Natural -4.2
SN
Feed advisor Social -4.0
Other farmers Social -3.6
Advisors of professional organisations Social -1.7
Advisors of companies selling production factors Social -1.7
Contractors Social -1.5
PBC
Availability of livestock manure Natural -2.8
Access to economic incentives for green manure Financial -0.3
BMP: Rotation with grass meadows (N=92)
Table 83. Drivers and barriers for dairy cattle/temporary grass (ENZ12_SL1_TXT2,TXT1,TXT3) for
BMP: Rotation with grass meadows. A = Attitude, SN = subjective norm, PBC = perceived behavioural
control.
Drivers A
Improve soil structure Natural 5.9
Less insecticide needed Physical 5.0
Less herbicide needed Physical 5.0
Improve the ration of dairy cows Physical 4.9
Better distribution of labour peaks in the farm Human 4.3
SN
Other farmers Social 0.8
Feed advisor Social 0.8
Advisors of companies selling production factors Social 0.1
PBC
High forage prices Financial 2.5
Economic incentives for cultivating grass meadows Financial 1.8
Barriers A
High irrigation amount needed Natural -2.7
Cost for meadow cultivation Financial -2.2
Meadows have a lower N uptake compared to other crops, and thus
limit the possibility to apply livestock manure Natural -1.0
PBC
High selling price of maize Financial -2.1
Scarce availability of irrigation water in my farm Natural -0.7
BMP: Rotation with legume meadows (N=92)
Table 84. Drivers and barriers for dairy cattle/temporary grass (ENZ12_SL1_TXT2,TXT1,TXT3) for
BMP: Rotation with legume meadows. A = Attitude, SN = subjective norm, PBC = perceived behavioural
control.
Drivers A

CATCH-C
No. 289782
Deliverable number:
22 May 2015
Page 151 of 180
Increase crop yield Natural 7.4
Increase soil fertility Natural 6.7
Increase of milk production Natural 6.4
Improved soil structure Natural 6.2
Reduction of fertilisers in following crop Natural 6.0
Less weeds Natural 6.0
Reduce the cost of protein for the ration, compared to buying it Natural 5.9
Diversity of forage production Natural 5.8
High forage production Natural 5.7
Reduction of insects and pathogens in following crop Natural 4.4
Better distribution of labour peaks in the farm Human 4.2
SN
Feed advisor Social 2.8
Advisors of producers associations Social 1.9
Advisors of companies selling production factors Social 1.0
Other farmers Social 0.9
PBC
High cost of soybean Financial 4.3
Expertise to cultivate alfalfa Human 4.2
Widespread cultivation of alfalfa in my area Human 2.4
Scarce irrigation water availability Natural 1.0
BMP: Crop residue incorporation (N=91
Table 85. Drivers and barriers for dairy cattle/temporary grass (ENZ12_SL1_TXT2,TXT1,TXT3) for
BMP: Crop residue incorporation. A = Attitude, SN = subjective norm, PBC = perceived behavioural
control.
Drivers A
Improve soil structure Natural 6.2
Increase crop yield Natural 5.6
Increase soil organic matter Natural 4.6
Reduce weeds and fungi in following crop Natural 2.6
SN
Advisors of companies selling production factors Social 2.1
Other farmers Social 1.9
PBC
Availability of adequate machinery Physical 4.9
Access to market of winter cereals straw Financial 1.2
Lack of knowledge of advantages of incorporation Human 0.0
Barrier A
Increase straw requirements at farm scale Natural -4.2

CATCH-C
No. 289782
Deliverable number:
22 May 2015
Page 152 of 180
BMP: Nutrient management plan (N=91)
Table 86. Drivers and barriers for dairy cattle/temporary grass (ENZ12_SL1_TXT2,TXT1,TXT3) for
BMP: Nutrient management plan. A = Attitude, SN = subjective norm, PBC = perceived behavioural
control.
Drivers A
Valorisation of livestock manure Natural 6.6
Use of the proper fertiliser amount Natural 6.5
Reduction of fertiliser costs Financial 6.1
Higher forage quality Natural 5.9
Higher yield stability Natural 5.9
Higher livestock health Natural 5.7
Improved milk quality Natural 5.4
SN
Advisors of producers associations Social 3.9
My family members Social 3.3
Feed advisor Social 3.0
Advisors of companies selling production factors Social 2.9
Other farmers Social 1.8
PBC
Legislative limitations to the amount of livestock manure that can be
applied Social 2.5
Low fertiliser prices Financial 0.3
Barriers A
Increase of costs due to soil testing Financial -2.4
PBC
Scarce information on the value of livestock manure Human -1.7
Lack of an independent service for fertilisation advice Social -1.0
FTZ 16A: arable/cereal (ENZ12_SL1_TXT1,TXT2_TXT3)
BMP: Sprinkler and drip irrigation (N=108)
Table 87. Drivers and barriers for arable/cereal (ENZ12_SL1_TXT1,TXT2_TXT3) for BMP: Sprinkler
and drip irrigation. A = Attitude, SN = subjective norm, PBC = perceived behavioural control.
Drivers A
Higher crop yield Natural 6.9
Drip irrigation allows fertigation Physical 4.6
Drip irrigation reduces energy and fuel costs Financial 4.4
Drip irrigation reduces compaction Natural 4.3
Control of soil water content Natural 4.2
Drip irrigation reduces crop diseases Natural 3.7
Reduced leaching Natural 3.4
Sprinkler irrigation improves vegetation microclimate Natural 2.9
Sprinkler irrigation washes the plant Physical 0.7
SN
Advisors of companies selling production factors social 2.3
Advisors of companies that withdraw products social 1.8
Other farmers social 0.7

CATCH-C
No. 289782
Deliverable number:
22 May 2015
Page 153 of 180
PBC
Sandy soils Natural 3.2
High water availability Natural 2.8
High-income crops Financial 2.6
Barriers A
Drip irrigation increases operating costs Financial -4.1
Sprinkler irrigation causes high initial investments Financial -3.1
PBC
Reduced field size with impediments Physical -2.1
BMP: Green manure (N=109)
Table 88. Drivers and barriers for arable/cereal (ENZ12_SL1_TXT1,TXT2_TXT3) for BMP: Green
manure. A = Attitude, SN = subjective norm, PBC = perceived behavioural control.
Drivers A
Higher soil organic matter Natural 6.8
Improved soil structure Natural 6.8
Higher soil nitrogen content Natural 5.6
Higher crop yield Natural 5.3
Barriers SN
Other farmers Social -2.2
Advisors of companies selling production factors Social -0.8
Advisors of professional organisation Social -0.3
Advisors of producer associations Social -0.2
PBC
Additional costs for green manure Financial -3.2
No incentives for green manure Financial -2.3
I know green manure benefits Physical -2.3
Clay soils Natural -2.1
I do sod seeding Physical -1.0
BMP: Rotation with legume ley crop (N=108)
Table 89. Drivers and barriers for arable/cereal (ENZ12_SL1_TXT1,TXT2_TXT3) for BMP: Rotation with
legume ley crop. A = Attitude, SN = subjective norm, PBC = perceived behavioural control.
Drivers A
Increased soil fertility Natural 7.5
Higher crop yield Natural 6.9
Increased soil nitrogen availability Natural 6.5
Reduced cultivation costs Financial 5.3
Less weeds Natural 3.2
Improved farm organisation Physical 1.8
SN
Advisors of professional organisations Social 1.1
Buyers of legume forages Social 0.9
PBC
Adequate forage prices Financial 0.8
Barriers A

CATCH-C
No. 289782
Deliverable number:
22 May 2015
Page 154 of 180
More pests Natural -2.8
SN
Other farmers Social -0.9
Advisors of companies selling production factors Social -0.1
PBC
Machineries are expensive Financial -3.2
Cereals have high price Financial -1.6
Lack of skills to cultivate alfalfa Physical -1.4
Legislation subsidises legume meadows cultivation Financial -0.6
BMP: Crop residue incorporation (N=114)
Table 90. Drivers and barriers for arable/cereal (ENZ12_SL1_TXT1,TXT2_TXT3) for BMP: Crop residue
incorporation. A = Attitude, SN = subjective norm, PBC = perceived behavioural control.
Drivers A
Improved soil structure Natural 7.2
Higher soil organic matter Natural 6.8
Reduced use of mineral fertilisers Physical 5.1
Increased protein content in wheat grain Natural 2.3
Gain through crop residues sale Financial 1.2
Slow decomposition of crop residues in soil Natural 0.5
SN
Advisors of companies selling production factors Social 3.0
Other farmers Social 2.4
PBC
Crop residues burn is forbidden Social 4.7
Barriers
A
Increased risk of fungal diseases Natural -4.4
Increased nitrogen fertiliser use Physical -2.3
SN
Farm that collect crop residues Social -0.4
PBC
Adverse environmental conditions that hinder residues degradation Natural -2.3
Residues selling at a high price Financial -2.0
BMP: Application of farmyard manure, compost and sewage sludge (N=106)
Table 91. Drivers and barriers for arable/cereal (ENZ12_SL1_TXT1,TXT2_TXT3) for BMP: Application
of farmyard manure, compost and sewage sludge. A = Attitude, SN = subjective norm, PBC = perceived
behavioural control.
Drivers A
Increased soil fertility Natural 8.1
Improved soil structure Natural 7.7
Higher soil organic matter Natural 7.3
Reduced use of mineral fertilisers Physical 7.1
Slow release of nutrients Natural 3.0
SN
Advisors of professional organisation Social 3.7
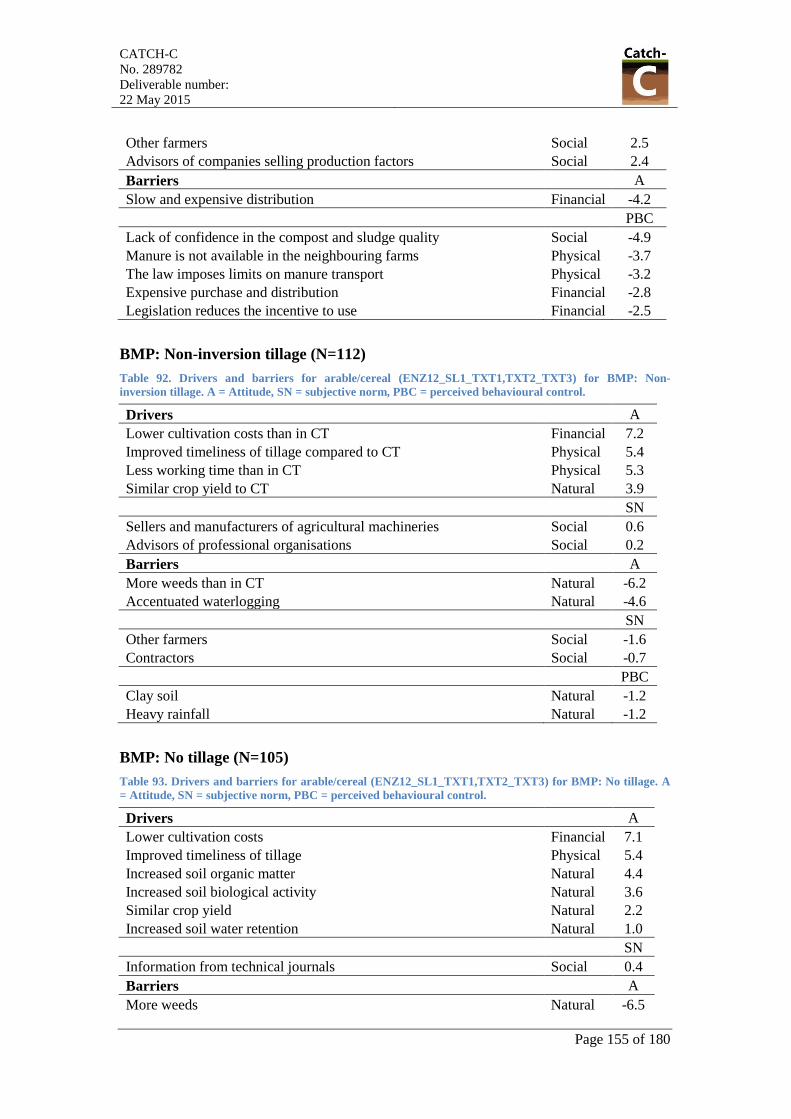
CATCH-C
No. 289782
Deliverable number:
22 May 2015
Page 155 of 180
Other farmers Social 2.5
Advisors of companies selling production factors Social 2.4
Barriers A
Slow and expensive distribution Financial -4.2
PBC
Lack of confidence in the compost and sludge quality Social -4.9
Manure is not available in the neighbouring farms Physical -3.7
The law imposes limits on manure transport Physical -3.2
Expensive purchase and distribution Financial -2.8
Legislation reduces the incentive to use Financial -2.5
BMP: Non-inversion tillage (N=112)
Table 92. Drivers and barriers for arable/cereal (ENZ12_SL1_TXT1,TXT2_TXT3) for BMP: Non-
inversion tillage. A = Attitude, SN = subjective norm, PBC = perceived behavioural control.
Drivers A
Lower cultivation costs than in CT Financial 7.2
Improved timeliness of tillage compared to CT Physical 5.4
Less working time than in CT Physical 5.3
Similar crop yield to CT Natural 3.9
SN
Sellers and manufacturers of agricultural machineries Social 0.6
Advisors of professional organisations Social 0.2
Barriers A
More weeds than in CT Natural -6.2
Accentuated waterlogging Natural -4.6
SN
Other farmers Social -1.6
Contractors Social -0.7
PBC
Clay soil Natural -1.2
Heavy rainfall Natural -1.2
BMP: No tillage (N=105)
Table 93. Drivers and barriers for arable/cereal (ENZ12_SL1_TXT1,TXT2_TXT3) for BMP: No tillage. A
= Attitude, SN = subjective norm, PBC = perceived behavioural control.
Drivers A
Lower cultivation costs Financial 7.1
Improved timeliness of tillage Physical 5.4
Increased soil organic matter Natural 4.4
Increased soil biological activity Natural 3.6
Similar crop yield Natural 2.2
Increased soil water retention Natural 1.0
SN
Information from technical journals Social 0.4
Barriers A
More weeds Natural -6.5

CATCH-C
No. 289782
Deliverable number:
22 May 2015
Page 156 of 180
Lower crop yield Natural -6.2
SN
Other farmers Social -2.3
Contractors Social -1.4
Advisors of companies selling production factors Social -1.3
Advisors of professional organisation Social -1.3
Sellers and manufacturers of agricultural machineries Social -0.4
PBC
Expensive machineries Financial -5.0
Lack of skills to do sod seeding Physical -3.2
Lack of machineries market Financial -2.6
Clay soils Natural -2.2
Nice-looking field Physical -1.5
Wheat monoculture Physical -0.5
Low fuel price Financial -0.2
FTZ 17A: arable/cereal (ENZ12_SL3_TXT2;
ENZ12_SL4_TXT2,TXT3)
BMP: Green manure (92)
Table 94. Drivers and barriers for arable/cereal (ENZ12_SL3_TXT2; ENZ12_SL4_TXT2,TXT3) for BMP:
Green manure. A = Attitude, SN = subjective norm, PBC = perceived behavioural control.
Drivers A
Improved soil structure Natural 6.3
Higher soil organic matter Natural 6.0
Reduced use of mineral fertilisers Physical 5.4
Increased protein content in following crop Natural 4.1
Reduced erosion Natural 3.3
PBC
I have incentives for green manure Financial 2.0
Cultivation contracts that remunerate high protein content Financial 1.7
Barriers A
Higher cultivation costs Financial -4.6
Green manure depletes the soil water content Natural -1.8
SN
Other farmers Social -2.3
Family members Social -2.0
Advisors of companies selling production factors Social -1.0
Advisors of producer associations Social -0.6
PBC
Lack of adequate machineries Physical -2.3
Low prices of mineral fertilisers Financial -1.2
Clay soils Natural -0.4

CATCH-C
No. 289782
Deliverable number:
22 May 2015
Page 157 of 180
BMP: Crop residue incorporation (93)
Table 95. Drivers and barriers for arable/cereal (ENZ12_SL3_TXT2; ENZ12_SL4_TXT2,TXT3) for BMP:
Crop residue incorporation. A = Attitude, SN = subjective norm, PBC = perceived behavioural control.
Drivers A
Increased soil fertility Natural 6.7
Improved soil structure Natural 6.4
Higher soil organic matter Natural 6.2
SN
Advisors of producer association Social 2.3
Family members Social 1.5
Other farmers Social 1.3
PBC
I have adequate machineries Physical 5.0
Legislation forbids crop residues burning Social 4.2
Incorporation is important Social 3.6
Crop residues given for free Financial 0.2
Barriers A
More weeds, pests and diseases Natural -3.8
Increased nitrogen fertiliser use Physical -3.9
Following crop sowing hindered by residues Physical -3.9
Loss of income if residues are not sold Financial -3.9
PBC
Residues chopping and distribution is expensive Financial -2.5
Crop residue sale is possible Financial -1.9
High price of crop residues Financial -1.8
BMP: Application of farmyard manure, compost and sewage sludge (N=90)
Table 96. Drivers and barriers for arable/cereal (ENZ12_SL3_TXT2; ENZ12_SL4_TXT2,TXT3) for BMP:
Application of farmyard manure, compost and sewage sludge. A = Attitude, SN = subjective norm, PBC =
perceived behavioural control.
Drivers A
Increased soil fertility Natural 7.4
Improved soil structure Natural 6.8
Higher soil organic matter Natural 6.7
Reduced use of mineral fertilisers Physical 6.0
SN
Other farmers Social 1.6
Neighbouring farmers Social 1.2
Advisors of companies selling production factors Social 0.4
Public administration Social 0.2
Barriers A
Unpleasant odours emission Physical -4.6
Higher cultivation costs Financial -4.4
Increased time spent for fertilisation operation Physical -3.5
PBC
FYM transport is expensive Financial -5.5
I do not have neighbours with excess manure Physical -4.5

CATCH-C
No. 289782
Deliverable number:
22 May 2015
Page 158 of 180
Lack of adequate machineries Physical -4.1
No incentives for FYM Financial -3.7
Legislation that limits odour emissions Social -3.4
I do not trust sludge and compost composition Social -3.4
I have cultivation contracts which reward cereal quality Financial -1.1
Low prices of fertilisers Financial -1.0
BMP: Non-inversion tillage (N=94)
Table 97. Drivers and barriers for arable/cereal (ENZ12_SL3_TXT2; ENZ12_SL4_TXT2,TXT3) for BMP:
Non-inversion tillage. A = Attitude, SN = subjective norm, PBC = perceived behavioural control.
Drivers A
Lower cultivation cost Financial 6.5
Reduced working time Physical 6.2
Reduced risk of waterlogging Natural 3.3
Higher crop yield Natural 2.9
Earlier crop emergence Natural 0.9
SN
Sellers and manufacturers of agricultural machineries Social 0.4
Information during technical visit Social 0.3
Advisors of companies selling production factors Social 0.1
Family members Social 0.0
Barriers A
Reduced crop yield Natural -5.2
More weeds Natural -5.1
Reduced soil water retention Natural -2.5
SN
Other farmers Social -0.8
PBC
Clay soils Natural -2.5
BMP: No tillage (N=90)
Table 98. Drivers and barriers for arable/cereal (ENZ12_SL3_TXT2; ENZ12_SL4_TXT2,TXT3) for BMP:
No tillage. A = Attitude, SN = subjective norm, PBC = perceived behavioural control.
Drivers A
Reduced working time Technical 6.5
Lower cultivation costs Financial 6.5
Improved soil structure Natural 4.7
Higher crop yield Natural 2.6
Reduced waterlogging risk Natural 2.1
PBC
Scarce farm labour Technical 2.7
Barriers A
More weeds Natural -6.0
Lower crop yield Natural -5.8
Increased wheat diseases Natural -5.4
Less levelled soil Natural -3.8
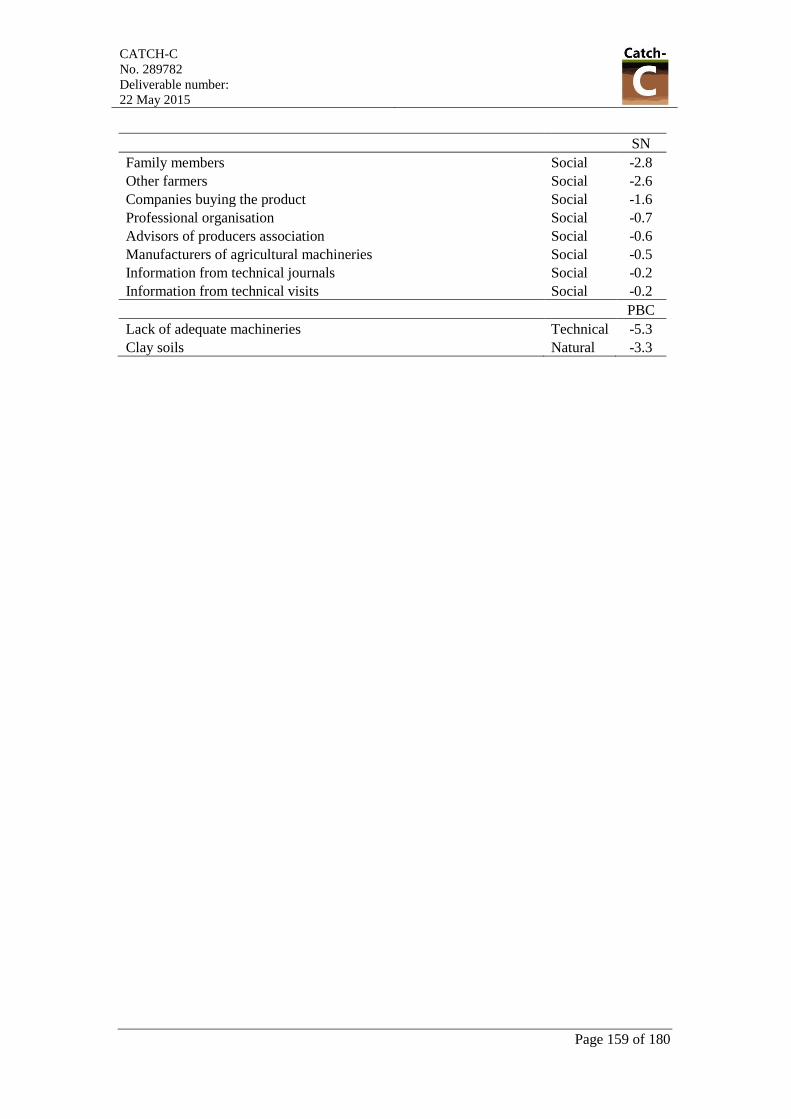
CATCH-C
No. 289782
Deliverable number:
22 May 2015
Page 159 of 180
SN
Family members Social -2.8
Other farmers Social -2.6
Companies buying the product Social -1.6
Professional organisation Social -0.7
Advisors of producers association Social -0.6
Manufacturers of agricultural machineries Social -0.5
Information from technical journals Social -0.2
Information from technical visits Social -0.2
PBC
Lack of adequate machineries Technical -5.3
Clay soils Natural -3.3


CATCH-C
No. 289782
Deliverable number:
22 May 2015
Page 161 of 180
Appendix VII: Farm survey Poland
FTZ 21A: arable farms (ENZ6_SL2_TXT3); FTZ 22M mixed
farming (ENZ6_SL2_TXT1); and FTZ 23C: dairy cattle
(ENZ6_SL1_TXT1)
BMP: Reduced tillage (N=93; 68; 140)
Table 99. Drivers and barriers for arable farms (ENZ6_SL2_TXT3), mixed farming (ENZ6_SL2_TXT1)
and dairy cattle (ENZ6_SL1_TXT1) for BMP: Reduced tillage. A = Attitude, SN = subjective norm, PBC =
perceived behavioural control.
Arable Mixed Dairy
Drivers A
Lower fuel use Financial 4.8 4.2 3.9
Lower labour input Human 4.8 3.9 3.9
Lower financial costs Financial 4.6 2.9 2.7
Less agricultural practices Financial 4.4 3.6 4.0
Limits water losses Natural 3.0 1.8 2.4
Increase organic matter in the soil Natural 2.2 1.5 3.9
Higher nitrogen content in the top layer Natural 1.8 1.8 1.7
Better soil structure Natural 1.1 0.6 0.6
SN
Advisors Social 1.8 0.6 0.0
Results on experimental fields Human 1.0 0.0 0.0
Other farmers Social 0.1 0.0 0.0
PBC
No experience with RT Human 0.1 0.0 0.0
Barriers A A A
Lower yields Financial -1.9 -2.1 -1.9
Increase crop protection Financial -4.1 -4.0 -3.3
Increase weeds Natural -4.2 -4.0 -3.3
SN
Other farmers Social
-1.1 -1.9
Results on experimental fields Human
-0.1 -1.4
Advisors Social -0.04
PBC
No appropriate machinery for RT application Physical -4.6 -4.7 -5.9
Not enough technical knowledge Human -2.3 -2.8 -3.3
No experience with RT Human -0.8 -1.9
BMP: Cover crops (N=93; 68; 140)
Table 100. Drivers and barriers for arable farms (ENZ6_SL2_TXT3), mixed farming (ENZ6_SL2_TXT1)
and dairy cattle (ENZ6_SL1_TXT1) for BMP: Cover crops. A = Attitude, SN = subjective norm, PBC =
perceived behavioural control.
Arable Mixed Dairy
Drivers A
Higher nitrogen content in the soil Natural 5.3 4.5 3.9

CATCH-C
No. 289782
Deliverable number:
22 May 2015
Page 162 of 180
Better soil structure Natural 6.0 5.5 4.7
Increase organic matter in the soil Natural 5.8 5.8 4.8
Prevent erosion Natural 6.2 6.0 4.6
Better soil phytosanitary conditions Natural 4.8 5.0 0.0
Improves biologic activity of top layer Natural 3.7 3.9 0.0
Higher cereal yields Financial 5.5 4.1 0.0
Lower fertilization costs Financial 5.4 4.6 3.7
SN
Results on experimental fields Human 2.8 3.0 2.4
Advisors Social 4.5 5.3 4.4
Other farmers Social 1.2 1.9 1.5
PBC
No experience with GM Human 1.1 0.8 0.0
Barriers PBC PBC PBC
Not enough technical knowledge Human -0.7 -0.3 -1.1
BMP: Incorporation of straw (N=93; 68; 140)
Table 101. Drivers and barriers for arable farms (ENZ6_SL2_TXT3), mixed farming (ENZ6_SL2_TXT1)
and dairy cattle (ENZ6_SL1_TXT1) for BMP: Incorporation of straw. A = Attitude, SN = subjective norm,
PBC = perceived behavioural control.
Arable Mixed Dairy
Drivers A
Better soil structure Natural 6.4 3.8 3.3
Faster decomposition of straw with extra dose of nitrogen Natural 6.0 4.9 3.8
Additional source of nutrients Natural 6.0 4.9 3.3
Prevent erosion Natural 5.0 2.3 3.2
Reduce water losses Natural 2.7 2.1 2.0
Inhibition of seed germination Natural
1.5
Inhibition of weeds development Natural
1.0 0.6
Increase development of fungal diseases Natural
Higher mechanization costs Financial
SN
Results on experimental fields Human 4.3 1.9
Other farmers Social 1.8 1.0
Advisors Social 4.9 2.5
PBC
Large market for straw Financial 1.3 -0.7 2.4
Additional income Financial 2.9 2.1 2.3
Barriers A
Higher mechanization costs Financial -2.2 -1.4 -0.6
Increase development of fungal diseases Natural -1.1 -2.1 -2.2
Inhibition of seed germination Natural -0.7 -1.2
Inhibition of weeds development Natural 0.0
SN
Results on experimental fields Human
-1.8
Other farmers Social
-1.7
Advisors Social -1.2

CATCH-C
No. 289782
Deliverable number:
22 May 2015
Page 163 of 180
FTZ 22M: mixed farming (ENZ6_SL2_TXT1) and FTZ 23C: dairy
cattle (ENZ6_SL1_TXT1)
BMP: Nutrient management plan (N=62; 136)
Table 102. Drivers and barriers for mixed farming (ENZ6_SL2_TXT1) and dairy cattle
(ENZ6_SL1_TXT1) for BMP: Nutrient management plan. A = Attitude, SN = subjective norm, PBC =
perceived behavioural control.
Mixed Dairy
Drivers A A
Good tool to determine the appropriate doses of fertilizers Financial 5.1 5.3
Calculate nutrient in FYM Financial 4.5 4.7
Lower fertilization costs Financial 4.1 5.1
Increase efficiency use of N and P Natural 4.1 4.7
Lower acidification of the soil Natural 3.6 1.3
SN SN
Advisors Social 2.5 4.5
Results on experimental fields Human 1.7 2.5
Other farmers Social 1.4 1.4
PBC PBC
Assistance of advisor Social 5.7 2.1
Preparation of NMP Human 3.2 3.5

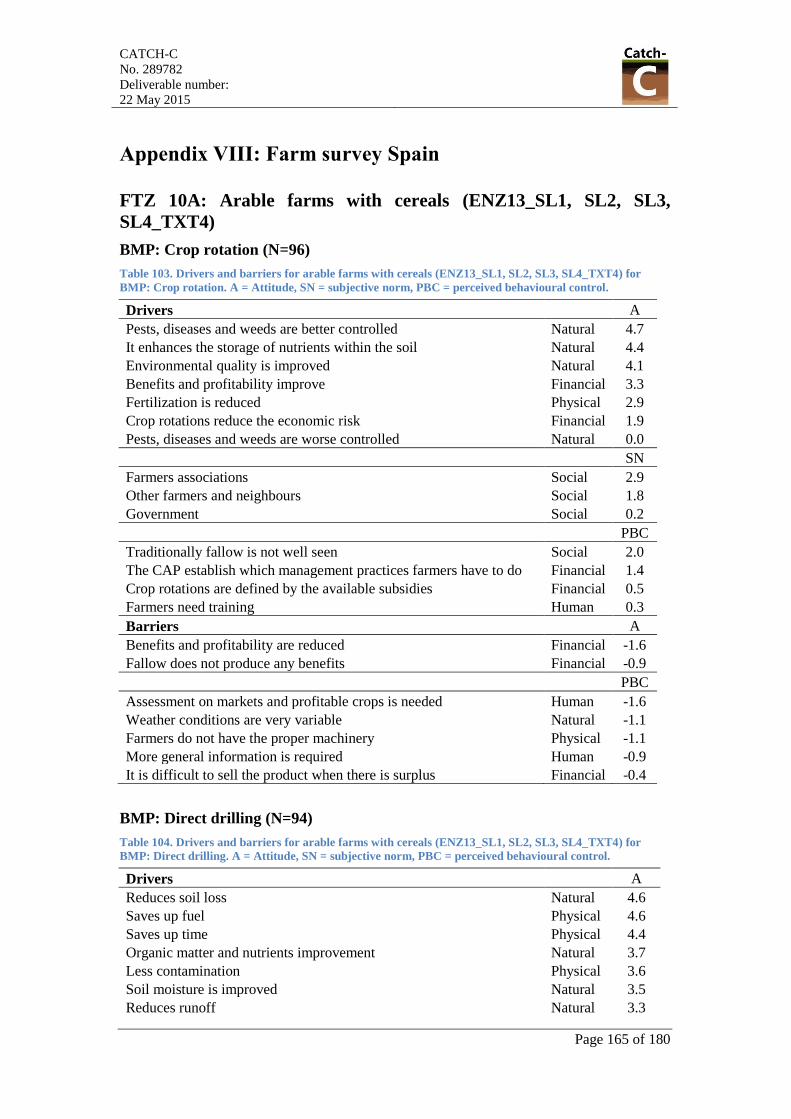
CATCH-C
No. 289782
Deliverable number:
22 May 2015
Page 165 of 180
Appendix VIII: Farm survey Spain
FTZ 10A: Arable farms with cereals (ENZ13_SL1, SL2, SL3,
SL4_TXT4)
BMP: Crop rotation (N=96)
Table 103. Drivers and barriers for arable farms with cereals (ENZ13_SL1, SL2, SL3, SL4_TXT4) for
BMP: Crop rotation. A = Attitude, SN = subjective norm, PBC = perceived behavioural control.
Drivers A
Pests, diseases and weeds are better controlled Natural 4.7
It enhances the storage of nutrients within the soil Natural 4.4
Environmental quality is improved Natural 4.1
Benefits and profitability improve Financial 3.3
Fertilization is reduced Physical 2.9
Crop rotations reduce the economic risk Financial 1.9
Pests, diseases and weeds are worse controlled Natural 0.0
SN
Farmers associations Social 2.9
Other farmers and neighbours Social 1.8
Government Social 0.2
PBC
Traditionally fallow is not well seen Social 2.0
The CAP establish which management practices farmers have to do Financial 1.4
Crop rotations are defined by the available subsidies Financial 0.5
Farmers need training Human 0.3
Barriers A
Benefits and profitability are reduced Financial -1.6
Fallow does not produce any benefits Financial -0.9
PBC
Assessment on markets and profitable crops is needed Human -1.6
Weather conditions are very variable Natural -1.1
Farmers do not have the proper machinery Physical -1.1
More general information is required Human -0.9
It is difficult to sell the product when there is surplus Financial -0.4
BMP: Direct drilling (N=94)
Table 104. Drivers and barriers for arable farms with cereals (ENZ13_SL1, SL2, SL3, SL4_TXT4) for
BMP: Direct drilling. A = Attitude, SN = subjective norm, PBC = perceived behavioural control.
Drivers A
Reduces soil loss Natural 4.6
Saves up fuel Physical 4.6
Saves up time Physical 4.4
Organic matter and nutrients improvement Natural 3.7
Less contamination Physical 3.6
Soil moisture is improved Natural 3.5
Reduces runoff Natural 3.3

CATCH-C
No. 289782
Deliverable number:
22 May 2015
Page 166 of 180
Enhances biodiversity and soil quality Natural 3.1
More herbicides are required Physical 2.0
More pests and diseases Natural 1.0
Efficiency of fertilization is maintained Physical 1.0
Higher soil compaction Natural 0.5
Some operations in the farm are more complicated Physical 0.3
SN
Technicians Social 2.0
Farmers associations Social 1.9
Universities and research centres Social 1.8
Other farmers and neighbours Social 1.0
Barriers PBC
Strong investment in machinery Physical -3.3
Information and training is demanded Human -2.6
High clay content Natural -1.2
People think that the farm is abandoned Social -0.6
This practice is not well established Physical -0.4
Lack of subsidies Financial -0.2
The available machinery do not work well Physical -0.1
BMP: Controlled traffic farming (N=93)
Table 105. Drivers and barriers for arable farms with cereals (ENZ13_SL1, SL2, SL3, SL4_TXT4) for
BMP: Controlled traffic farming. A = Attitude, SN = subjective norm, PBC = perceived behavioural
control.
Drivers A
In general terms, it reduces soil compaction Natural 3.2
It makes easier some operations carried out in the farm Physical 3.1
Crop yield increases Natural 2.2
SN
Technicians Social 2.9
Other farmers and neighbours Social 1.5
Barriers A
Crop are not able to grow properly because of the wheel tracks Natural -1.1
More runoff is observed trough the wheel tracks Natural -0.7
PBC
There is not enough subsidies Financial -3.2
Width machinery is not normalized Physical -2.5
It is not easy to control the traffic when using trailers and harvesters Physical -1.5
The characteristics of my farm are not compatible with the controlled
traffic Natural -0.2
It is hard to make people follow the same tracks Human -0.2

CATCH-C
No. 289782
Deliverable number:
22 May 2015
Page 167 of 180
FTZ 11P: Permanent crop farms (olive and fruit trees, vineyards,
ENZ13_SL2,SL3,SL4_TXT3)
BMP: Minimum tillage (151)
Table 106. Drivers and barriers for permanent crop farms (olive and fruit trees, vineyards,
ENZ13_SL2,SL3,SL4_TXT3) for BMP: Minimum tillage. A = Attitude, SN = subjective norm, PBC =
perceived behavioural control.
Drivers A
Water infiltration is improved Natural 2.1
It saves up money Financial 1.6
It reduces soil consolidation Natural 1.4
SN
Technicians Social 3.0
Farmers associations Social 2.1
Other farmers Social 0.8
Neighbours and relatives Social 0.4
PBC
Not compatible with cover crops Human 0.1
Changing weather conditions Natural 0.0
Farm design Natural 0.0
Barrier A
Top roots are damaged Physical -1.4
It enhances diseases Natural -1.3
It increases soil loss Natural -1.2
Operations in the farm are more difficult Physical -0.9
Herbicides are reduced Physical -0.8
It increases runoff Natural -0.7
SN
Salespeople Social -0.5
PBC
Lack of subsidies and economical support Financial -1.9
There is no adequate machinery Physical -1.4
Steep slopes Natural -1.1
Many stones in the farm Natural -1.0
High amount of clay Natural -0.6
Local traditions Social -0.2
BMP: Cover crops (N=150)
Table 107. Drivers and barriers for permanent crop farms (olive and fruit trees, vineyards,
ENZ13_SL2,SL3,SL4_TXT3) for BMP: Cover crops. A = Attitude, SN = subjective norm, PBC = perceived
behavioural control.
Drivers A
Controls soil erosion Physical 4.9
Improves water retention Natural 4.9
Improves soil properties Natural 3.4
Competes with the main crop Natural 0.8
It reduces the use of pesticides Physical 0.6

CATCH-C
No. 289782
Deliverable number:
22 May 2015
Page 168 of 180
SN
Technicians Social 2.8
Associations of farmers Social 2.1
Salespeople Social 0.9
Neighbours/relatives Social 0.3
Other farmers Social 0.1
Barriers A
Increases contamination Physical -2.0
Enhances pests and diseases Natural -0.4
Harvesting is more complicated Physical -0.1
PBC
Traditions of the region Social -1.9
Lack of subsidies Financial -1.8
More research in cover crops Human -1.4
Bare soils for a long time Natural -1.1
Technical limitations Physical -0.9
Risk of fire Human -0.7
The cost of maintenance Financial -0.5
Steep slopes in the farm Natural -0.3
Clay soils in farms Natural -0.2
FTZ 12C: Mixed farms known as Dehesa (sheep, pigs and beef and
permanent grass, ENZ12_SL2,SL3,SL4_TXT2; ENZ13_SL3_TXT1;
ENZ13_SL2,SL3,SL4,SL5_TXT2)
BMP: Light tillage (N=101)
Table 108. Drivers and barriers for permanent crop farms (olive and fruit trees, vineyards,
ENZ13_SL2,SL3,SL4_TXT3) for BMP: Light tillage. A = Attitude, SN = subjective norm, PBC = perceived
behavioural control.
Drivers A
Good for controlling shrubs and weeds Physical 3.2
Enhances the maintenance of soil quality Natural 2.6
Higher yields Natural 2.6
Increases soil porosity Natural 2.6
Improves the retention of nutrients and water Natural 2.4
Reduction of water retention capacity Natural 2.0
Damage to roots is lower Physical 1.9
It increases organic matter and fertility Natural 1.9
Improves aggregates structure Natural 1.5
Contamination decreases because CO2 emissions are lower Physical 1.3
It saves up money Financial 1.1
Enhances the development of a plough sole Natural 0.4
SN
Technicians from some associations Social 3.4
Other farmers and neighbours Social 1.4
University and research institutes Social 0.7
Government Social 0.2

CATCH-C
No. 289782
Deliverable number:
22 May 2015
Page 169 of 180
PBC
The size of the farm is small Natural 0.3
Barriers
A
Water retention capacity is reduced Natural -0.8
Increases soil compaction Natural -0.6
Contamination increases because more herbicides are required Physical -0.5
There are more gullies and soil loss Natural -0.5
More runoff Natural -0.4
Is not helpful for controlling shrubs and weeds Natural -0.1
PBC
There are no subsidies for preserving soil conservation Financial -3.6
The slope of the farm is high Natural -2.4
The farm has a high % of stones Natural -2.1
Organic farming is not compatible Human -1.4
It is difficult to reduce costs if tillage is necessary Physical -0.7
The legislation of these farms is very restrictive Social -0.7
BMP: Pastoral plan (N=89)
Table 109. Drivers and barriers for permanent crop farms (olive and fruit trees, vineyards,
ENZ13_SL2,SL3,SL4_TXT3) for BMP: Pastoral plan. A = Attitude, SN = subjective norm, PBC =
perceived behavioural control.
Drivers A
It improves the natural resources management Natural 2.3
The organization of the operations and management of the farm is
improved Physical 2.2
It improves the livestock management Natural 2.2
It helps to correct wrong management operations carried out in the
past Physical 2.1
The pastoral plan establish guidelines that prevent from changing
criteria Human 1.7
The pastoral plan involves a financial outlay that does not
compensate Financial 1.7
The pastoral plan increases the profitability and the productivity of
the farm Financial 1.6
SN
Technicians from some associations Social 3.2
Other farmers and neighbours Social 1.4
University and research institutes Social 1.2
Government Social 0.3
PBC
The size of my farm is very small Natural 0.3
Barriers A
The pastoral plan is rigid Physical -0.1
PBC
There are not enough subsidies for implementing a pastoral plan Financial -3.4
Prices and markets varies significantly from one year to another Financial -2.9
The weather conditions differ from one year to another Natural -2.8
The technicians that develop the pastoral plan do not know the farm Human -2.2

CATCH-C
No. 289782
Deliverable number:
22 May 2015
Page 170 of 180
properly
It is difficult to have a pastoral plan because of the bureaucracy it
involves Social -0.8
More information about the management of the farms is needed Human -0.8

CATCH-C
No. 289782
Deliverable number:
22 May 2015
Page 171 of 180
Appendix IX: Farm survey The Netherlands
FTZ 20C: Dairy farms on sandy soils (ENZ7_TXT1_SL1)
BMP: Non-inversion tillage (N=101)
Table 110. Drivers and barriers for dairy farms on sandy soils (ENZ7_TXT0_SL1) for BMP: Non-inversion
tillage (NIT). A = Attitude, SN = subjective norm, PBC = perceived behavioural control.
Drivers A
NIT better for soil fauna than ploughing Natural 7.2
NIT increases o.m. in top soil Natural 7.1
NIT saves time compared to ploughing Human 6.8
NIT cheaper than ploughing Financial 6.7
NIT increases o.m. content of the soil Natural 6.2
NIT improves physical quality of soil Natural 5.8
SN
Research is positive on NIT Human 2.5
PBC
I use mechanical weed control Physical 0.3
Barriers A
NIT increases weed pressure Natural -7.2
NIT increases pesticide use Financial -6.4
NIT increases the risk on diseases Natural -6.3
With NIT more impermeable soil layers form Natural -5.2
SN
Neighbours with whom I collaborate favour NIT Social -0.5
Other farmers are positive on NIT Social -0.4
Focus group is positive Social -0.1
PBC
Yields are lower Natural -4.1
No financial benefits when using NIT Financial -2.9
I have to plough to incorporate a non-hardy green manure correctly Physical -1.6
Unsolvable weed problem Human -1.3
Contractor does not have right equipment Human -1.1
BMP: Rotation grass-maize (N=46)
Table 111. Drivers and barriers for dairy farms on sandy soils (ENZ7_TXT0_SL1) for BMP: Rotation
grass-maize. A = Attitude, SN = subjective norm, PBC = perceived behavioural control.
Drivers A
The rotation of grass-maize favours yields of both crops Financial 8.1
The rotation of grass-maize improves the quality of the fodder Financial 7.3
Regular resowing of grass improves the sod Natural 6.7
With the rotation of grass-maize you have less soil diseases Natural 6.1
With a rotation of grass-maize I can establish the sod in August Natural 4.4
SN
Arable farmers like to engaged in grass-maize rotations Social 4.4
Projects like Cows and Chances favour grass-maize rotations Social 3.3

CATCH-C
No. 289782
Deliverable number:
22 May 2015
Page 172 of 180
Extension agents favour grass-maize rotations Social 3.0
Other dairy farmers are positive on rotation of grass-maize Social 2.3
PBC
My costs for feed continuously increase Financial 2.0
The rotation of grass-maize requires a lot of organization Human 1.8
I have fields at large distances Natural 1.7
I feed my cattle in the stables Physical 1.4
To grow grass I need an irrigation system Financial 1.4
Rotation grass-maize on wet fields needs investment in drainage Financial 1.0
My fields are difficult to visit Physical 0.8
Barriers A
Harvesting maize when fields are very wet causes physical damage
to the soil Natural -9.0
Costs of ploughing and the establishment of the sod are high Financial -6.2
The rotation of grass-maize decreases soil organic matter content Natural -4.9
When practicing rotation of grass-maize pesticide use increases Financial -3.6
Yields are lower when resowing the sod Financial -3.6
The protein content is low in the first year of resowing the sod Financial -3.0
PBC
I have continuous grass on wet fields Natural -2.6
Standard application of N for grass too low to establish the sod Natural -0.6
The derogation is too strict to rotate grass-maize Social -0.1
BMP: Undersowing a green manure in maize (N=49)
Table 112. Drivers and barriers for dairy farms on sandy soils (ENZ7_TXT0_SL1) for BMP: Undersowing
a green manure in maize. A = Attitude, SN = subjective norm, PBC = perceived behavioural control.
Drivers A
Improve nutrient efficiency Natural 6.8
Increases the N-availability to the following crop Financial 6.7
Organic matter increase Natural 6.3
Improves soil strength to the heavy machinery Natural 5.9
When undersowing the green manure no trip on the field after harvest
is necessary Human 4.8
Immobilization of nitrogen Natural 4.8
SN
Projects like Cows and Chances Social 2.5
Agricultural agencies Social 1.3
PBC
The manure law decreases soil fertility Natural 0.0
Barriers A
When undersowing fails double costs Financial -6.7
Competes on nutrients and water with maize Natural -4.9
More expensive than sowing after harvest Financial -4.0
The undersown green manure is harvested with the maize and ends up
in the silage Financial -0.3
SN
Other dairy farmers Social -0.6

CATCH-C
No. 289782
Deliverable number:
22 May 2015
Page 173 of 180
PBC
Undersowing a green manure in maize requires an additional trip
through the maize Human -2.4
For the harvest of the green manure in the spring I need a good stand Human -2.3
Undersowing a green manure in maize has not yet been tested
sufficiently in practice Human -1.9
The contractor does not have the right equipment to undersow a green
manure in maize Physical -1.8
Undersowing a green manure in maize requires an additional trip
through the maize Human -1.2
None of my neighbours tried to sow a green manure in the maize crop Social -1.2
I do not have the knowledge to sow the green manure in maize Human -1.1
The success rate of undersowing a green manure in maize is unknown Human -1.0
BMP: Early harvest of maize in favour of green manure (N=51)
Table 113. Drivers and barriers for dairy farms on sandy soils (ENZ7_TXT0_SL1) for BMP: Early harvest
of maize in favour of green manure. A = Attitude, SN = subjective norm, PBC = perceived behavioural
control.
Drivers A
A good green manure produces more organic matter Natural 8.8
Early harvest of maize improves green manures Natural 7.2
Early harvest of maize facilitates reestablishment of the grass sod Natural 7.0
I need high yields in order to be self-sufficient for my fodder Financial 6.7
A good green manure immobilizes more nitrogen Natural 6.6
SN
Civil servants like an early harvest of maize so a successful green
manure can be cropped Social 0.5
PBC
Sometimes I want to establish a sod after maize Human 4.6
Some of my fields suffer from wet conditions during maize harvest Natural 4.0
An early harvest and warm weather during silage coincide Natural 2.3
A high yield is possible by sowing maize under plastic Financial 1.5
Barriers
Early harvest of maize lowers yields Financial -8.3
Early harvest reduces the quality of the maize Financial -7.2
Early cultivars yield less Financial -3.0
SN
Other dairy farmers favour the early harvest of maize Social -4.2
The contractor favours a late harvest of maize Human -3.0
Salesmen from seed companies are positive about the early harvest of
maize Social -0.2
PBC
I do not get reimbursed for early harvesting my maize Financial -5.9
I do not get additional N-quota when I crop a green manure after maize
harvest Social -5.5
I do not know early cultivars with comparable high yields as late
cultivars Financial -4.4
Once in a while my silage stock is insufficient Physical -2.5
I do not have the knowledge to crop early cultivars Human -0.4

CATCH-C
No. 289782
Deliverable number:
22 May 2015
Page 174 of 180
The contractor has difficulties with the early harvest of maize Human -0.1
BMP: Row application of manure (N=56)
Table 114. Drivers and barriers for dairy farms on sandy soils (ENZ7_TXT0_SL1) for BMP: Row
application of manure. A = Attitude, SN = subjective norm, PBC = perceived behavioural control.
Drivers A
With row applications you need less manure for the same yield Financial 2.3
SN
Research is positive on row application of manure Human 3.7
On farm tests of row application of manure show good results Social 2.5
The contractor is not suited to apply manure in rows Social 1.9
The fertilizer lobby dislikes the row application of manure Social 0.9
Other farmers favour row application of manure Social 0.5
Barriers A
Row application increases the costs to apply manure Financial -6.8
With row application of manure the contractor faces increasing time
pressure Human -6.0
With row application of manure you get more physical damage Natural -5.4
Row application of manure may cause root burn Natural -4.7
As row application turns out to be successful the current standard
application may be reduced Human -4.4
To apply manure in rows is technical complex Human -3.2
PBC
The contractor does not have the right equipment for row application of
manure Physical -5.3
I do not profit from row application Financial -4.0
Row application of manure is in an early and experimental phase Human -1.8
Row application with manure cannot be done together with planting Human -1.3
I have never seen a successful demonstration of row application of
manure Social -1.2
FTZ 18A: arable farms on clay soils
(ENZ4,ENZ7_TXT2,TXT3_SL1); and FTZ 20A: arable farms on
sandy soils (ENZ4,ENZ7_TXT1_SL1)
BMP: Non-inversion tillage (N=96; 71)
Table 115. Drivers and barriers for arable farms on clay soils (ENZ4,ENZ7_TXT2,TXT3_SL1) and arable
farms on sandy soils (ENZ4,ENZ7_TXT1_SL1) for BMP: Non-inversion tillage. A = Attitude, SN =
subjective norm, PBC = perceived behavioural control.
Clay Sand
Drivers A
NIT saves time compared to ploughing Human 7.3 6.3
NIT reduces volunteer potatoes Natural 7.1 5.4
NIT is cheaper than ploughing Financial 6.6 6.5
NIT stimulates soil fauna Natural 6.5 6.6
Due to NIT organic matter in the top soil increases Natural 6.2 6.1
NIT increases organic matter content of the soil Natural 5.6 6.1

CATCH-C
No. 289782
Deliverable number:
22 May 2015
Page 175 of 180
The physical quality of the soil improves when using NIT Natural 5.4 6.0
For NIT I have to invest in new machines Financial 0.1 0.0
SN
Farmers in the USA or Canada use NIT Social 3.5 3.8
Magazines are positive on NIT Social 3.3 3.0
Internet is positive on NIT Social 2.9 1.8
Research is positive on NIT Human 2.5 2.6
Extension agents recommend NIT Social 1.0 0.5
Employees are positive Social 0.6 0.7
In my focus group NIT is approached positively Social 0.2 1.3
Other arable farmers are positive on NIT Social 0.1 1.5
PBC
The contractor does not have the right equipment for NIT Physical 1.2 0.7
I share my machines with other arable farmers Social 1.0 0.1
I do not have enough ha for NIT Physical 0.8 0.8
My sowing machine is not suitable for NIT Physical 0.6 0.5
I grow many beets Human 0.5 1.2
Barriers A
NIT stimulates geese on my field Natural -7.2 -6.0
Due to NIT weed pressure increases Natural -6.8 -6.7
With NIT pesticide use increases Financial -5.1 -5.3
NIT increases the risk on diseases Natural -5.0 -5.5
With NIT you do not get a weed less seed bed Financial -4.5 -2.9
Due to NIT the soil dries more out Natural -2.8 -3.7
PBC
The weather is often too wet to apply NIT Natural -4.8 -0.6
I have no financial benefits when using NIT Financial -3.6 -2.8
Yields are lower using NIT Financial -3.1 -3.5
Due to NIT I have more geese on my land Natural -2.0 -1.0
I do not have the right machines for NIT Financial -1.6 -1.1
I grow many potatoes Human -1.0 2.6
I have not enough knowledge for NIT Human -0.9 -0.2
I don't have a solution to the weed problem due to NIT Human -0.7 -0.8
I have to plough to incorporate a non-hardy green manure
correctly Natural -0.5 -0.1
To apply NIT I need to invest in machinery Financial -0.2 -0.1
FTZ 18A: arable farms on clay soils
(ENZ4,ENZ7_TXT2,TXT3_SL1); and FTZ 20A arable farms on
sandy soils (ENZ4,ENZ7_TXT2,TXT3_SL1)
BMP: Use of green manures (N=95; 132)
Table 116. Drivers and barriers for arable farms on clay soils (ENZ4,ENZ7_TXT2,TXT3_SL1) and arable
farms on sandy soils (ENZ4,ENZ7_TXT1_SL1) for BMP: Use of green manures. A = Attitude, SN =
subjective norm, PBC = perceived behavioural control.
Clay Sand
Drivers A

CATCH-C
No. 289782
Deliverable number:
22 May 2015
Page 176 of 180
Better soil structure Natural 9.1 8.7
Support long term soil fertility Natural 9.0 8.3
Improve soil handling Natural 8.8 7.6
More organic matter Natural 8.8 8.3
Increase soil fauna Natural 8.2 7.9
Less wind and soil erosion Natural 8.1 8.1
More nitrogen mineralisation Natural 7.9 7.5
Less nitrogen leaching Natural 7.3 7.5
SN
Extension agents recommend green manures Social 6.2 6.0
Magazines are positive Social 5.7 6.0
Study club is positive Social 5.6 5.6
Other arable farmers are positive Social 5.4 4.9
Green manure seed salesmen are positive Social 5.3 4.8
PBC
I like to plough down my straw Human 5.0 3.6
Enough other ways to apply organic matter Human 3.0 1.9
It is not always possible to apply liquid manure in time Human 2.7 1.2
I mainly grow winter wheat Human 2.7 1.1
I grow a lot of early potatoes Human 2.1 1.4
Sometimes growing season is too short for good crop Natural 0.6 1.5
I exchange land with husbandry farmers Social 0.4 0.9
In the fall there are not enough dry days to sow green manures Natural 0.4 0.5
Barriers A
Increases costs Financial -5.2 -4.7
Requires extra time Human -3.9 -2.8
More nematicides Natural -3.8 -3.8
More weeds in following crop Natural -3.1 -2.8
PBC
Nitrogen quota too low to grow green manures Natural -0.7 -0.8
With green manure nitrogen quota increases Natural -1.3 -0.5
BMP: Application of reactor Digestate (N=100; 68)
Table 117. Drivers and barriers for arable farms on clay soils (ENZ4,ENZ7_TXT2,TXT3_SL1) and arable
farms on sandy soils (ENZ4,ENZ7_TXT1 _SL1) for BMP: Application of reactor Digestate. A = Attitude,
SN = subjective norm, PBC = perceived behavioural control.
Clay Sand
Drivers A
It is easy to apply Human 6.1 7.4
The composition is homogeneous Natural 6.0 7.0
You know what minerals are in digestate Human 5.8 6.2
With digestate organic matter is applied Natural 5.4 5.2
Digestate increases soil fauna Natural 4.9 5.3
It is cheap Financial 2.7 3.9
Digestate has fast mineralizing N Natural 1.8 1.7

CATCH-C
No. 289782
Deliverable number:
22 May 2015
Page 177 of 180
SN
Salesmen are positive Social 2.1 2.0
Magazines are positive Social 0.8 1.4
Extension agents recommend it Social 0.0 0.2
Barriers A
Applying digestate increases the risk on contaminating my fields Natural -5.5 -4.8
Applying digestate increases diseases Natural -5.3 -4.1
SN SN
Study club is positive Social -0.9 0.2
Neighbours are positive Social -0.8 -0.6
Other arable farmers are positive Social -0.4 0.8
Research is positive Human -0.1 1.1
PBC
No guarantee that it is disease free Natural -4.4 -2.4
There is a large supply of manure in my region Natural -2.5 -4.1
The origin of the basic products is unknown Human -2.5 -1.7
Price is too high Financial -2.5 -3.1
Digestate with a low P-content is not available in my region Natural -2.2 -3.0
The manure law is too strict to apply digestate Human -2.2 -3.6
It is hardly available Natural -1.7 -1.1
Difficult to handle Physical -0.8 -0.3
BMP: Incorporating straw (N=99; 55)
Table 118. Drivers and barriers for arable farms on clay soils (ENZ4,ENZ7_TXT2,TXT3_SL1) and arable
farms on sandy soils (ENZ4,ENZ7_TXT1 _SL1) for BMP: Incorporate straw. A = Attitude, SN = subjective
norm, PBC = perceived behavioural control.
Clay Sand
Drivers A
Improves soil structure Natural 8.8 8.7
Provides organic matter to the soil Natural 8.6 8.4
Improves soil fauna Natural 8.3 8.1
Improves soil cultivation Natural 8.0 7.6
When straw is not removed nutrients stay in the field Natural 6.1 3.7
Easier to incorporate straw than to remove it Human 5.7 4.6
SN
Magazines are positive Social 4.1 4.4
Extension agents recommend the incorporation of straw Social 2.8 2.3
Study club is positive Social 2.8 3.1
Other arable farmers are positive Social 2.7 2.3
Husbandry farmers are not happy when I incorporate my straw Social 0.3 0.8
PBC
I sow a green manure after my wheat Human 4.7 4.1
The weather is often too wet to remove the straw Social 1.4 1.9
There are enough other ways to apply organic matter Human 0.1 0.9

CATCH-C
No. 289782
Deliverable number:
22 May 2015
Page 178 of 180
Barriers A
Decomposition of straw needs extra N Natural -6.4 -6.1
Increases fungal diseases Natural -3.9 -4.7
Costs extra money Financial -3.8 -4.3
Incorporation does not need heavy machinery Natural -2.4 -4.8
PBC
I have silage corn; to incorporate straw of corn I need to change to
corn cop mix Financial -2.1 -1.2
The manure law makes it impossible to apply the necessary N to the
straw to decompose Social -1.2 -0.1
Price is often too good to incorporate it Financial -1.1 0.0
I use the straw to cover beats and potatoes Human -0.7 1.9
I have a corporation with a husbandry farm for the straw Social -0.1 -0.2
FTZ 18A: arable farms on clay soils
(ENZ4,ENZ7_TXT2,TXT3_SL1)
BMP: Spring application of manure on clay (N=101)
Table 119. Drivers and barriers for arable farms on clay soils (ENZ4,ENZ7_TXT2,TXT3_SL1) for BMP:
Spring application of manure. A = Attitude, SN = subjective norm, PBC = perceived behavioural control.
Drivers A
Financial beneficial Financial 6.2
It delivers organic matter to the soil Natural 6.0
It increases yields Financial 5.6
It increases soil fauna Natural 5.1
The applied nitrogen is not manageable Natural 4.0
SN
Magazines are positive Social 2.9
Extension agents recommend the use of manure in the spring Social 2.4
Other arable farmers are positive Social 1.6
The Dutch Union of Animal Husbandry is positive Social 1.3
The salesman is positive Social 1.2
PBC
No storage facility for the manure Physical 7.2
Do not know origin of manure Human 1.3
Is demanding in organisation Human 0.0
Barriers A
It makes heavy tracks Natural -6.9
It makes the soil fatty and sticky Natural -5.7
The composition is unthrusty Human -5.2
It makes you dependent of the contractor Social -3.8
SN
Neighbours close by find manure smelling Social -0.7
PBC
The weather is often too wet to apply manure in the spring Natural -5.9

CATCH-C
No. 289782
Deliverable number:
22 May 2015
Page 179 of 180
I am not allowed to use a "sleepslang" Physical -2.0
Not enough N or P quota Natural -1.3
Not available in my area Natural -1.1
Composition not to be known Human -0.1
BMP: Controlled traffic (CTF, N=92)
Table 120. Drivers and barriers for arable farms on clay soils (ENZ4, ENZ7_TXT2, TXT3_SL1) for BMP:
Controlled traffic (CTF). A = Attitude, SN = subjective norm, PBC = perceived behavioural control.
Drivers A
CTF improve rooting Natural 7.8
With CTF soil structure improves Natural 7.4
CTF reduces water troubles Natural 6.6
CTF improve yields Financial 6.4
It is difficult to implement CTF in the management Human 6.4
CTF reduces diseases Natural 4.7
Using CTF allows you to use machines on the field with wet
weather Human 2.8
SN
Organic farmers have good results with it Social 3.8
Farmers with beds are positive Social 3.1
Research is positive Human 2.8
Magazines are positive Social 2.2
Demonstration trials of machines show good possibilities Social 1.1
Study club is positive Social 0.8
Other arable farmers are positive Social 0.1
PBC
I use non inversion tillage Human 1.8
Barriers A
CTF allows procedures such as spraying or mechanical weed
control to be done easily Human -2.8
CTF requires a high investment for the right machinery Financial -2.1
SN
Buyers emphasise Social -1.6
Extension agents are positive Social -0.7
PBC
Converting to CTF should be done at once Human -4.9
Converting to CTF requires a large investment Financial -3.6
My machines are not suitable for CTF Physical -3.4
Harvesting using CTF is not yet developed Physical -3.0
The benefits of CTF are not clear to me Financial -2.7
I do not have colleagues with whom I can share the costs for the
machines of CTF Social -2.3
I am not convinced CTF is technically possible Human -2.3
Not all machinery is available at 3 m wide Physical -2.1
I plough my land Human -0.9
I have to widen my concrete path to the field when I want to convert Financial -0.7

CATCH-C
No. 289782
Deliverable number:
22 May 2015
Page 180 of 180
to CTF
Field acceptable only through the public roads require investments
in special machines when practicing CTF Physical -0.5
FTZ 20A: arable farms on sandy soils (ENZ4,ENZ7_TXT1_SL1)
BMP: Application of compost (N=55)
Table 121. Drivers and barriers for arable farms on sandy soils (ENZ4,ENZ7_TXT1_SL1) for BMP:
Application of compost. A = Attitude, SN = subjective norm, PBC = perceived behavioural control.
Drivers A
Compost provides organic matter Natural 8.2
Can be applied in the fall/winter Natural 6.7
SN
Extension agents are positive Social 4.0
Other arable farmers are positive Social 3.6
Study club is positive Social 3.5
PBC
It is not available in my region Natural 0.6
Compost applications increase costs Financial 0.6
Plenty of other possibilities to apply organic matter Human 0.4
Barriers A
It can contain unwanted waste Natural -7.0
Cost more labour to apply Human -2.5
PBC
Slurry is largely available Natural -1.8
The levy free Phosphate level is too low Social -1.4