List Mode–Driven Cardiac and Respiratory Gating in...
9
List Mode–Driven Cardiac and Respiratory Gating in PET Florian B¨ uther 1 , Mohammad Dawood 2,3 , Lars Stegger 1 , Frank W ¨ ubbeling 4 , Michael Sch¨ afers 1,3 , Otmar Schober 1,3 , and Klaus P. Sch¨ afers 1,3 1 Department of Nuclear Medicine, University of M ¨ unster, M¨ unster, Germany; 2 Department of Computer Science, University of M¨ unster, M¨ unster, Germany; 3 European Institute of Molecular Imaging, University of M ¨ unster, M¨ unster, Germany; and 4 Department of Computational and Applied Mathematics, University of M ¨ unster, M¨ unster, Germany Gating methods acquiring biosignals (such as electrocardiogra- phy [ECG] and respiration) during PET enable one to reduce mo- tion effects that potentially lead to image blurring and artifacts. This study evaluated different cardiac and respiratory gating methods: one based on ECG signals for cardiac gating and video signals for respiratory gating; 2 others based on measured inher- ent list mode events. Methods: Twenty-nine patients with coro- nary artery disease underwent a 20-min ECG-gated single-bed list mode PET scan of the heart. Of these, 17 were monitored by a video camera registering a marker on the patient’s abdo- men, thus capturing the respiratory motion for PET gating (video method). Additionally, respiratory and cardiac gating information was deduced without auxiliary measurements by dividing the list mode stream in 50-ms frames and then either determining the number of coincidences (sensitivity method) or computing the axial center of mass and SD of the measured counting rates in the same frames (center-of-mass method). The gated datasets (respiratory and cardiac gating) were reconstructed without at- tenuation correction. Measured wall thicknesses, maximum dis- placement of the left ventricular wall, and ejection fraction served as measures of the exactness of gating. Results: All methods successfully captured respiratory motion and significantly decreased motion-induced blurring in the gated images. The center-of-mass method resulted in significantly larger left ven- tricular wall displacements than did the sensitivity method (P , 0.02); other differences were nonsignificant. List mode–based cardiac gating was found to work well for patients with high 18 F-FDG uptake when the center-of-mass method was used, leading to an ejection fraction correlation coefficient of r 5 0.95 as compared with ECG-based gating. However, the sensitivity method did not always result in valid cardiac gating information, even in patients with high 18 F-FDG uptake. Conclusion: Our study demonstrated that valid gating signals during PET scans cannot be obtained only by tracking the external motion or apply- ing an ECG but also by simply analyzing the PET list mode stream on a frame-by-frame basis. Key Words: list mode PET; respiratory motion; respiratory gating; cardiac gating J Nucl Med 2009; 50:674–681 DOI: 10.2967/jnumed.108.059204 PET is an established diagnostic tool widely appreciated in the clinical fields of oncology, neurology, cardiology, and several others. PET can show functional, metabolic, and molecular processes in vivo with a high sensitivity and offers the unique feature of absolute quantification of radiotracer distribution. However, several mathematic cor- rections have to be applied to the measured PET raw data before or during image reconstruction to obtain absolute quantitative data. The most important of these is attenua- tion correction, that is, correcting for the loss of coinci- dence photons due to absorption while they are traversing the human body. Accurate attenuation correction requires knowledge of attenuation values in the field of view of the scanner. In stand-alone PET scanners, this information is acquired during an additional transmission scan using ex- ternal g-sources to obtain attenuation values for every measured line of response. An important milestone in PET history was the devel- opment of scanners combining PET and x-ray–based CT (1). Apart from acquiring both functional/molecular and morphologic information in a single scanning session, leading to a higher diagnostic efficiency and improved spatial coregistration, PET attenuation correction can, in principle, be improved by replacing the slow and low- counting-rate transmission scan using external radioactive sources by a fast and high-counting-rate CT scan. The result, higher patient throughput and anatomic landmark information, significantly improves the signal-to-noise ratio of the attenuation correction map (2). However, PET whole- body emission scans typically require several minutes per bed position whereas the CT scan is usually acquired within a few seconds. During PET acquisitions, patients cannot hold their breath long enough (as is possible during the CT scan), resulting in motion-blurred PET data due to respira- tory movement, especially in thoracic and abdominal areas. Furthermore, if the CT data are not acquired in a respiration phase that fits the mean PET respiration phase, spatial coregistration between CT and PET is impaired. Thereby, an erroneous assignment of tissue attenuation may occur, leading to attenuation correction artifacts (3). Additionally, Received Oct. 17, 2008; revision accepted Jan. 14, 2009. For correspondence or reprints contact: Florian B ¨ uther, Department of Nuclear Medicine, University of M ¨ unster, Albert-Schweitzer-Strasse 33, 48149 M ¨ unster, Germany. E-mail: [email protected] COPYRIGHT ª 2009 by the Society of Nuclear Medicine, Inc. 674 THE JOURNAL OF NUCLEAR MEDICINE • Vol. 50 • No. 5 • May 2009 by on June 8, 2018. For personal use only. jnm.snmjournals.org Downloaded from
-
Upload
nguyenxuyen -
Category
Documents
-
view
215 -
download
3
Transcript of List Mode–Driven Cardiac and Respiratory Gating in...

List Mode–Driven Cardiac and RespiratoryGating in PET
Florian Buther1, Mohammad Dawood2,3, Lars Stegger1, Frank Wubbeling4, Michael Schafers1,3, Otmar Schober1,3,and Klaus P. Schafers1,3
1Department of Nuclear Medicine, University of Munster, Munster, Germany; 2Department of Computer Science, University ofMunster, Munster, Germany; 3European Institute of Molecular Imaging, University of Munster, Munster, Germany; and4Department of Computational and Applied Mathematics, University of Munster, Munster, Germany
Gating methods acquiring biosignals (such as electrocardiogra-phy [ECG] and respiration) during PET enable one to reduce mo-tion effects that potentially lead to image blurring and artifacts.This study evaluated different cardiac and respiratory gatingmethods: one based on ECG signals for cardiac gating and videosignals for respiratory gating; 2 others based on measured inher-ent list mode events. Methods: Twenty-nine patients with coro-nary artery disease underwent a 20-min ECG-gated single-bedlist mode PET scan of the heart. Of these, 17 were monitoredby a video camera registering a marker on the patient’s abdo-men, thus capturing the respiratory motion for PET gating (videomethod). Additionally, respiratory and cardiac gating informationwas deduced without auxiliary measurements by dividing the listmode stream in 50-ms frames and then either determining thenumber of coincidences (sensitivity method) or computing theaxial center of mass and SD of the measured counting rates inthe same frames (center-of-mass method). The gated datasets(respiratory and cardiac gating) were reconstructed without at-tenuation correction. Measured wall thicknesses, maximum dis-placement of the left ventricular wall, and ejection fraction servedas measures of the exactness of gating. Results: All methodssuccessfully captured respiratory motion and significantlydecreased motion-induced blurring in the gated images. Thecenter-of-mass method resulted in significantly larger left ven-tricular wall displacements than did the sensitivity method (P ,
0.02); other differences were nonsignificant. List mode–basedcardiac gating was found to work well for patients with high18F-FDG uptake when the center-of-mass method was used,leading to an ejection fraction correlation coefficient of r 5 0.95as compared with ECG-based gating. However, the sensitivitymethod did not always result in valid cardiac gating information,even in patients with high 18F-FDG uptake. Conclusion: Ourstudy demonstrated that valid gating signals during PET scanscannot be obtained only by tracking the external motion or apply-ing an ECG but also by simply analyzing the PET list mode streamon a frame-by-frame basis.
Key Words: list mode PET; respiratory motion; respiratorygating; cardiac gating
J Nucl Med 2009; 50:674–681DOI: 10.2967/jnumed.108.059204
PET is an established diagnostic tool widely appreciatedin the clinical fields of oncology, neurology, cardiology,and several others. PET can show functional, metabolic,and molecular processes in vivo with a high sensitivity andoffers the unique feature of absolute quantification ofradiotracer distribution. However, several mathematic cor-rections have to be applied to the measured PET raw databefore or during image reconstruction to obtain absolutequantitative data. The most important of these is attenua-tion correction, that is, correcting for the loss of coinci-dence photons due to absorption while they are traversingthe human body. Accurate attenuation correction requiresknowledge of attenuation values in the field of view of thescanner. In stand-alone PET scanners, this information isacquired during an additional transmission scan using ex-ternal g-sources to obtain attenuation values for everymeasured line of response.
An important milestone in PET history was the devel-opment of scanners combining PET and x-ray–based CT(1). Apart from acquiring both functional/molecular andmorphologic information in a single scanning session,leading to a higher diagnostic efficiency and improvedspatial coregistration, PET attenuation correction can, inprinciple, be improved by replacing the slow and low-counting-rate transmission scan using external radioactivesources by a fast and high-counting-rate CT scan. Theresult, higher patient throughput and anatomic landmarkinformation, significantly improves the signal-to-noise ratioof the attenuation correction map (2). However, PET whole-body emission scans typically require several minutes perbed position whereas the CT scan is usually acquired withina few seconds. During PET acquisitions, patients cannothold their breath long enough (as is possible during the CTscan), resulting in motion-blurred PET data due to respira-tory movement, especially in thoracic and abdominal areas.Furthermore, if the CT data are not acquired in a respirationphase that fits the mean PET respiration phase, spatialcoregistration between CT and PET is impaired. Thereby,an erroneous assignment of tissue attenuation may occur,leading to attenuation correction artifacts (3). Additionally,
Received Oct. 17, 2008; revision accepted Jan. 14, 2009.For correspondence or reprints contact: Florian Buther, Department of
Nuclear Medicine, University of Munster, Albert-Schweitzer-Strasse 33,48149 Munster, Germany.
E-mail: [email protected] ª 2009 by the Society of Nuclear Medicine, Inc.
674 THE JOURNAL OF NUCLEAR MEDICINE • Vol. 50 • No. 5 • May 2009
by on June 8, 2018. For personal use only. jnm.snmjournals.org Downloaded from

the heart itself moves because of cardiac contractions,thereby leading to an additional increase in motion blur.
One method to resolve this problem is based on gatingthe PET data: the whole set of PET raw data is distributedin subsets representing the different phases of cardiac orrespiratory motion. Reconstruction of the subsets leads toimage datasets with greatly reduced motion, albeit withlower statistics (3,4). Although gating with respect to car-diac contraction is usually achieved by using an electrocar-diography (ECG) monitor (which is already incorporatedin some scanner designs), different technical strategieshave been developed to implement respiratory gating, forexample, use of a sensor on the patient’s abdomen to de-tect pressure differences due to respiration (4), infrared (5)or optical (6) video camera systems to track thoracic motionduring the PET scans, piezoelectric crystals (7), or sensorsthat detect the temperature of air flowing into the lungs (8).However, all these methods rely on additional equipmentthat measures only external motion, which may not neces-sarily correlate well with internal organ motion (9). There-fore, it would be desirable to implement gating methodsbased directly on the measured PET emission data. We havedeveloped and implemented 2 purely event-based methodsfor human cardiac PET/CT and compared their perfor-mance with video-based and ECG-based gating methods.
MATERIALS AND METHODS
PET/CT ScannerPET data in this study were acquired on a list mode–capable
PET/CT scanner (Biograph Sensation 16; Siemens AG MedicalSolutions). The PET scanner comprises 24 detector rings oflutetium oxyorthosilicate detector crystals (384 crystal elementsper ring; ring diameter of 824 mm). The axial field of view is 162mm; the transaxial field of view, 585 mm. The scanner is operatedin 3-dimensional mode using axial compression (5 segments witha span of 7), resulting in sinogram datasets of 192 · 192 · 175bins. If operated in list mode, the measured coincidences (promptand delayed) and time tags are saved in a file that can be processedretrospectively. The scanner is equipped with an internal ECGdevice that allows recording of the R-wave temporal position to atrigger file while operating in list mode.
Patient Data and PreparationThis study included data from 29 patients who were referred
for an 18F-FDG PET scan for routine evaluation of myocardialviability. Patients with a heart rate higher than 65 beats/min re-ceived b-blocker medication before the scans to slow the heartrate. Before and during the 18F-FDG uptake phase, patients under-went a hyperinsulinemic euglycemic clamp technique to increase18F-FDG uptake in the heart (10). An intravenous dose of 4 MBqof 18F-FDG per kilogram of body weight was injected 1 h beforethe PET scan.
Data AcquisitionDuring the PET/CT scan, the patients were positioned supine
with the arms elevated behind the head. The heart was positionedinside the scanner field of view with the help of a CT topogram.After standard clinical PET and CT scans had been acquired, a20-min list mode PET scan (single bed position) was initiated while
the heart beat was monitored using the scanner’s ECG device. Togate the PET list mode data with respect to respiratory motion, avideo camera installed at the end of the patient bed monitored themovement of a white circular spot located on a black disk that wasmounted on a flexible belt around the patient’s abdomen in 17 ofthe 29 scans (video method, Fig. 1) (6). Synchronization with thelist mode scan was ensured by a light-emitting diode attached tothe black disk, emitting light only during the list mode scan. Thevideo signal was transferred to a personal computer notebook,where purpose-built in-house software analyzed the incomingsignal in real time. Briefly, the video image of the black disk wassegmented using a simple threshold method to discriminatebetween black background and white spot. Then, the verticalcoordinate of the center of the mass of the white spot wascalculated and stored, resulting in a breathing curve (sample time,200 ms) that can be used for retrospective gating (SupplementalFig. 1A; supplemental materials are available online only at http://jnm.snmjournals.org).
FIGURE 1. Setup of video camera system. Video cameraat end of bed tracks motion of white spot on black diskmounted on belt around patient. Light-emitting diode incenter of spot starts lighting when scan begins, thussynchronizing with PET list mode stream.
LIST MODE–DRIVEN GATING IN PET • Buther et al. 675
by on June 8, 2018. For personal use only. jnm.snmjournals.org Downloaded from

Data-Driven Gating and Data ReconstructionTwo gating methods (sensitivity and center of mass) that are
purely list mode–based were applied to all 29 patient scans toderive information on respiratory and cardiac motion (Fig. 2). Thesensitivity method, derived from He et al. (11), makes use of thefact that the geometric sensitivity profile (i.e., the probability thatan annihilation event located at a certain point inside the scanneris potentially detected) of the PET scanner is inhomogeneous (Fig.2A), as oblique coincidences can be measured only in the center ofthe scanner’s axial field of view, not at the front or rear of thescanner’s axis. Therefore, a moving activity source inside thescanner’s field of view will result in slightly different numbers ofmeasured coincidences in small time frames. To apply thismethod, we retrospectively analyzed the resulting list mode fileby counting the numbers of prompt and delayed coincidences in50-ms frames (P(t) and D(t), respectively). Because the physicaldecay of the radionuclide leads to a decrease in counting rate forlater frames, the determined counting rates were corrected for thisdecay by weighting every measured coincidence with the expo-nential time-dependent factor exp(lt) (l: decay constant of 18F).The difference in decay-corrected prompt and delayed countingrates is an estimate of the true coincidence rate T(t); thus, thisdifference was calculated:
TðtÞ 5 ðPðtÞ 2 DðtÞÞ � expðltÞ:
This calculation results in a raw respiration curve that, becauseof the statistical nature of the radioactive decay, is comparativelynoisy (Fig. 3A). To extract motion information, we transformedthe curve into the frequency domain using the fast Fouriertransformation FFT (Fig. 3B):
Tðf Þ 5 FFT ½TðtÞ�:
Typically, 2 prominent components can then be identified in thefrequency spectrum jTð f Þj: a low-frequency contribution Trespð f Þcaused by respiratory motion, usually limited to absolute valuessmaller than 0.5 Hz, and a contribution Tcardð f Þ caused by heartcontractions centered around frequencies fcard and –fcard. These2 components were isolated by setting all other frequencies to 0(Figs. 3C and 3E) and then transformed back into the time domainusing the inverse fast Fourier transformation iFFT, resulting in
2 gating curves TrespðtÞ 5 iFFT ½Trespð f Þ� and TcardðtÞ 5
iFFT ½Tcardð f Þ�. This leads to smooth curves valid for subsequentgating (Figs. 3D and 3F and Supplemental Fig. 1B).
The center-of-mass method is based on a more direct estimationof the motion inside the field of view (Fig. 2B). For this method,the true coincidence counting rate per 50-ms frame was deter-mined from the list mode file as a function of the axial coordinate(slice number). Oblique coincidence events, that is, coincidencesbetween detectors located on different rings, were rebinned intothe 47 transverse sinograms of the Biograph Sensation 16 scannerwith the help of the single-slice rebinning algorithm (12), thusenabling an axial assignment of coincidence events along thescanner’s z-axis. The resulting function is essentially an axialhistogram T(i,t) (t: time frame; i: slice number; i 5 1,. . .,47) ofmeasured true events within time frame t. As activity inside thethorax moves along this axis because of respiratory motion orcardiac contractions, the histogram that belongs to a certain timeframe contains information about the respiratory and cardiacphase. To extract this information, the axial center of mass as afunction of time frame center of mass (t) of every histogram T(i,t)was computed as:
Center of massðtÞ 5
+i
i � Tði; tÞ
+i
Tði; tÞ :
Additionally, for cardiac gating purposes, the SD SD(t) has alsobeen computed as:
SDðtÞ 5
ffiffiffiffiffiffiffiffiffiffiffiffiffiffiffiffiffiffiffiffiffiffiffiffiffiffiffiffiffiffiffiffiffiffiffiffiffiffiffiffiffiffiffiffiffiffiffiffiffiffiffiffiffiffiffiffiffiffiffiffiffiffiffiffiffiffi+i
i2 � Tði; tÞ
+i
Tði; tÞ 2 center of massðtÞ2:
vuuut
This SD method is valuable in some cases because the heartcontraction does not always correlate with a translational shiftalong the z-axis but sometimes correlates with a change in axialvariance of the histograms. These computations resulted in rawrespiration curves that were filtered in the same way as describedabove. Similar to the sensitivity method, this procedure results insmooth curves center of massrespðtÞ (Supplemental Fig. 1C),center of masscardðtÞ, and SDcardðtÞ (not shown) suited for gatingpurposes.
FIGURE 2. Purely event-driven gating methods. (A) Moving activities inside field of view will experience different detectionprobabilities due to inhomogeneous geometric sensitivities; thus, coincidence counting rates vary according to respiratorymotion (sensitivity method). (B) Activities moving along z-axis shift axial profiles and thus center of mass of coincidencecounting rates, indicating respiratory motion (center-of-mass method).
676 THE JOURNAL OF NUCLEAR MEDICINE • Vol. 50 • No. 5 • May 2009
by on June 8, 2018. For personal use only. jnm.snmjournals.org Downloaded from

Similarity between the obtained respiratory curves was mea-sured computing Spearman rank correlation coefficient r.
An amplitude-based approach was applied rather than a time-based approach to derive respiratory gating intervals from thebreathing curves, as amplitude-based techniques were shown tocapture respiratory motion more accurately than time-based tech-niques (6,13). To obtain gates with comparable noise, the gatingintervals were determined to result in 8 gates with equal measuredcoincidences (variable amplitude-based gating). This variabledivision of amplitudes avoids gates with limited amounts ofmeasured events, making subsequent image analysis easier (6).Furthermore, this division is better suited for comparison ofdifferent gating methods, as one cannot necessarily assume alinear relation between acquired respiratory curves for differentmethods; instead, monotonic relations are to be expected at best,as different physical quantities are measured.
Because no absolute heart phase measurement is available inthe case of ECG-based gating, a time-based gating scheme waschosen for the cardiac gating methods. Additionally, whereas thelist mode–based gating methods potentially measure absoluteinformation on heart phase, the amplitudes derived from thesemethods are characterized by beat waves because of frequencyband limitations in the filtering step described above (Fig. 3F). Forthe time-based gating, the maxima of the obtained cardiac curveswere determined; the time interval between 2 maxima was thendivided into 10 equidistant cardiac gates. This division was donewith the obtained ECG data as well; however, only R-R intervalsrepresenting pulse frequencies between 50 and 80 beats/min wereaccepted, to minimize potential R-wave misinterpretations orextra systoles. These misinterpretations and extra systoles caneasily be identified by interval lengths that are significantlyseparated from the mean peak in R-R interval length histograms.
The PET list mode file (typically ;1.5 GB of PET coincidenceraw data) was binned into gated sinogram datasets according tothe determined gating schemes using purpose-built in-house soft-ware. Applied corrections included decay and dead-time correc-tions as well as detector normalization. For comparison, anongated sinogram dataset using the whole set of PET list modedata was additionally generated.
The open-source package Software for Tomographic ImageReconstruction (available at http://stir.sourceforge.net/) was usedto reconstruct the preprocessed sinogram sets without attenuationcorrection. An iterative 3-dimensional ordered-subsets expectationmaximization algorithm was applied to obtain the PET images.The reconstruction was performed using 4 subsets and 5 iterations.A postreconstruction gaussian filter (4 mm in full width at halfmaximum) was finally applied to the images. The obtained imagescomprised 175 · 175 · 47 cubic voxels with an edge length of3.375 mm.
Data AnalysisThe displacement of the left ventricular wall between gate
1 and gate 8 (representing maximum inspiration and maximumexpiration) was chosen as a measure of successfully capturing therespiratory motion. This choice was made because large respira-tory shifts found for a given gating method indicate betterperformance in capturing the respiratory motion than do methodsyielding smaller shifts. This motion shift was determined usingthe automatic reslicer of the MPI-Tool program (AdvancedTomo Vision GmbH). The segmented left ventricular wall in themaximum-inspiration image was iteratively shifted against themaximum-expiration image until a maximum in correlationcoefficient was reached. The result was a motion resolution ofapproximately 1 mm.
FIGURE 3. Concept of Fourier filteringof raw respiratory curves: typical rawrespiratory curve (A); Fourier spectrumof raw curve (only positive frequenciesare shown here) (B); isolated respiratoryand cardiac components of spectrum(C and E, respectively); filtered respira-tory and cardiac curves derived by in-verse Fourier transformation (D and F,respectively).
LIST MODE–DRIVEN GATING IN PET • Buther et al. 677
by on June 8, 2018. For personal use only. jnm.snmjournals.org Downloaded from
Another approach taken toward evaluating the success ofrespiratory gating was measurement of cardiac wall thicknesses,because respiratory motion contributes to partial-volume effectsdue to thin myocardial walls, leading to motion-dependent blur-ring of ventricular walls and thus overestimated measured thick-nesses. For this purpose, the thickness of the anterior leftventricular wall in the nongated and gated PET images wasdetermined, as this is the part of the heart that is best seen in non–attenuation-corrected PET images; additionally, this region ingeneral is significantly affected by respiratory motion effects,since the direction of respiratory motion is usually almost per-pendicular to the anterior wall, as opposed to the lateral and septalwalls. For measuring left ventricular wall thickness, the heart wasrealigned into short-axis images. The thickness of the anterior wallwas then determined as the mean of the full width at half max-imum of gaussian profile fits taken at 3 subsequent midventricu-lar slices. For the gated images, this measurement was done for theend-expiration gate, leading to 4 thickness values in total for eachpatient.
The quality of cardiac gating was determined by measuring theleft ventricular ejection fraction derived from the different gatingmethods, using validated purpose-built in-house software (14,15).In general, with the different gating methods, larger values ofejection fraction reflect a comparatively better-quality resolving ofcardiac contractions. It is clear that in cases where the 18F-FDGuptake in the left ventricle is low, limited information aboutcardiac contractions from the list mode stream can be expected;therefore, only scans with sufficiently high 18F-FDG uptake in theleft ventricle were included in the ejection fraction analysis.
Two-tailed Wilcoxon signed rank tests were applied to inves-tigate significant differences between the 3 methods; P values ofless then 0.05 were considered to represent significant differences.
RESULTS
A comparison of the obtained respiration curves revealeda striking similarity between all 3 methods (SupplementalFig. 1). Especially, the position of respiratory maxima(maximum inspiration) in time coincided for most acquiredcurves. The video method gave the smoothest curves,whereas the other methods typically resulted in noisiercurves due to the inherent statistical nature of radioactivedecay. The correlation analysis revealed considerable meancorrelations of 0.65, 0.68, and 0.71 (n 5 17; Spearman rankcorrelation coefficient r for correlation between the videoand sensitivity methods, the video and center-of-massmethods, and the sensitivity and center-of-mass methods,respectively).
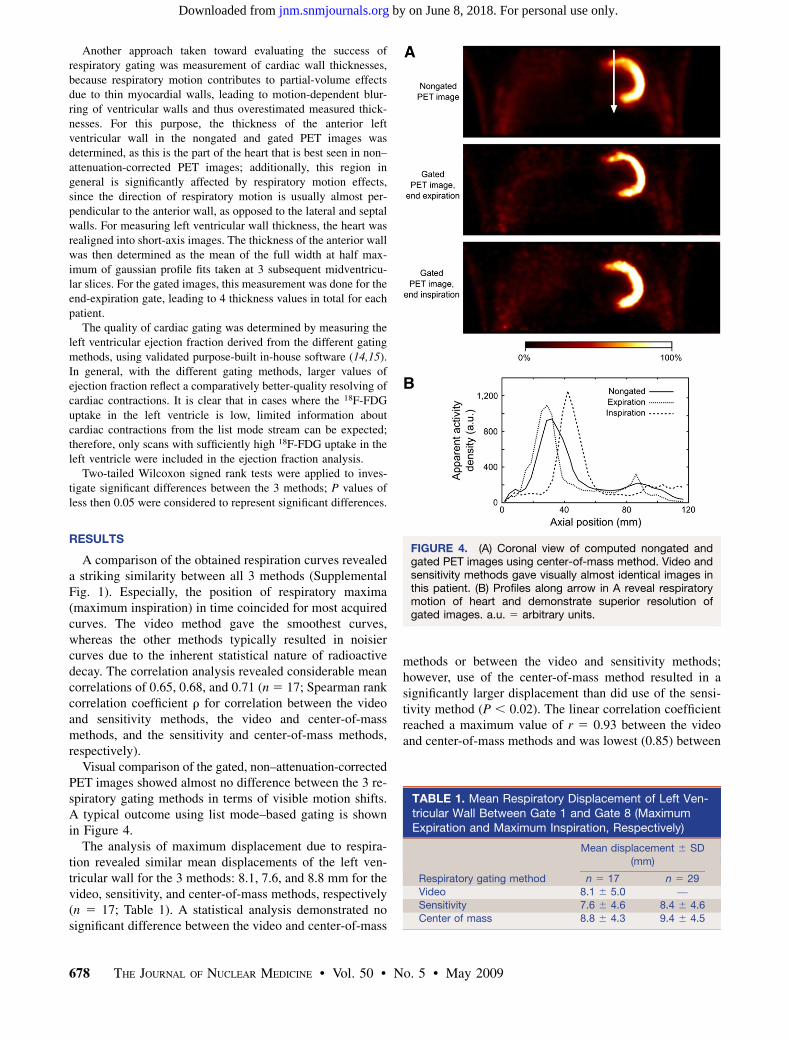
Visual comparison of the gated, non–attenuation-correctedPET images showed almost no difference between the 3 re-spiratory gating methods in terms of visible motion shifts.A typical outcome using list mode–based gating is shownin Figure 4.
The analysis of maximum displacement due to respira-tion revealed similar mean displacements of the left ven-tricular wall for the 3 methods: 8.1, 7.6, and 8.8 mm for thevideo, sensitivity, and center-of-mass methods, respectively(n 5 17; Table 1). A statistical analysis demonstrated nosignificant difference between the video and center-of-mass
methods or between the video and sensitivity methods;however, use of the center-of-mass method resulted in asignificantly larger displacement than did use of the sensi-tivity method (P , 0.02). The linear correlation coefficientreached a maximum value of r 5 0.93 between the videoand center-of-mass methods and was lowest (0.85) between
FIGURE 4. (A) Coronal view of computed nongated andgated PET images using center-of-mass method. Video andsensitivity methods gave visually almost identical images inthis patient. (B) Profiles along arrow in A reveal respiratorymotion of heart and demonstrate superior resolution ofgated images. a.u. 5 arbitrary units.
TABLE 1. Mean Respiratory Displacement of Left Ven-tricular Wall Between Gate 1 and Gate 8 (MaximumExpiration and Maximum Inspiration, Respectively)
Mean displacement 6 SD
(mm)
Respiratory gating method n 5 17 n 5 29Video 8.1 6 5.0 —
Sensitivity 7.6 6 4.6 8.4 6 4.6
Center of mass 8.8 6 4.3 9.4 6 4.5
678 THE JOURNAL OF NUCLEAR MEDICINE • Vol. 50 • No. 5 • May 2009
by on June 8, 2018. For personal use only. jnm.snmjournals.org Downloaded from

the video and sensitivity methods; comparing the sensitivityand center-of-mass methods revealed an r of 0.91. Meanvalues for the sensitivity and center-of-mass methods in thewhole patient collective (n 5 29) were 8.4 and 9.4 mm,respectively, with a highly significant difference (P , 0.01)and a linear correlation of r 5 0.90.
A decrease in motion-induced blurring when respiratory-gated PET data were used was demonstrated by wallthickness analysis (Table 2; a typical outcome is shownin Supplemental Fig. 2). Despite the applied clamp tech-nique, left ventricular 18F-FDG uptake was too low in 2patients to reasonably determine wall thicknesses; there-fore, the number of evaluated scans was reduced to 15. Themean thicknesses of the left ventricular wall were 18.0 mmin nongated PET images, 16.2 mm in video-based images,15.8 mm in sensitivity-based images, and 15.8 mm incenter-of-mass–based images. All 3 gating methods re-sulted in a highly significant decrease in thickness, com-pared with the nongated data (P , 0.002). There were nosignificant differences in wall thickness between the gatingmethods. In the whole patient collective (n 5 26; 3 scansshowed too low an 18F-FDG uptake in the left ventricularmyocardium), the mean values for nongated thicknessesand thicknesses based on sensitivity and center of masswere 17.9, 15.6, and 15.5 mm, respectively; the gatedvalues were significantly smaller than the nongated values(P , 0.0001); again, no statistical difference was foundbetween the sensitivity and center-of-mass methods.
Using only scans with sufficiently high tracer uptake inthe heart excluded 8 scans of 29 for the cardiac gatinganalysis; none of the list mode–based gating methodsshowed a cardiac peak in the Fourier spectrum in thesecases. Correlation plots of the measured ejection fractionsusing list mode–based gating versus ECG-based ejectionfraction, as well as a typical outcome for a list mode–based cardiac gated PET image, are shown in Figure 5.There were cases in which a given list mode–based gatingmethod did not lead to valid gating, even though thecorresponding 18F-FDG uptake was comparatively high,resulting in rather small linear correlation coefficientscompared with ECG-based gating (0.41, 0.61, and 0.59 forsensitivity-based gating, center-of-mass–based gating, andSD-based gating, respectively). However, combining thelatter 2 methods (as they are essentially the same method)by taking the larger ejection fraction value resulted in a
better correlation (r 5 0.89) and a linear regressionfunction f(x) 5 0.90x 1 0.03%, which is close to identity(Fig. 5B). Still, the difference in ejection fraction betweenECG-based and center-of-mass–based gating is highlysignificant, at P less than 0.002 (mean 6 SD: 49.6% 6
13.4% and 44.6% 6 13.5% for ECG-based and center-of-mass–based gating, respectively). The quality of listmode–based cardiac gating clearly depended on the ap-parent 18F-FDG uptake in the heart; taking only thosescans with high tracer uptake into account (further reduc-ing the number of evaluable scans to 15) generally leads toimproved correlation coefficients, which in the case of thecenter-of-mass approach was determined as r 5 0.95 witha linear regression function f(x) 5 0.95x 2 0.21% (Fig.5B). However, ejection fractions in this case (48.8% 6
15.8% for ECG-based and 45.5% 6 15.6% for center-of-mass–based gating) were still significantly different, at aP value of 0.025.
DISCUSSION
Respiratory motion–related image artifacts are knownto be a source of erroneous tracer quantification in cardiacPET/CT. It is therefore desirable to eliminate these motion-induced effects from the images. Methods besides gatingtechniques have been proposed for this task, including theacquisition of a slow CT scan over several respiratory cy-cles that better fits the respiratory-blurred PET data (16) orthe use of an averaged CT scan derived from 4-dimensionalCT measurements (17), therefore simulating a stand-alonePET scan, avoiding major attenuation correction artifacts,and retaining the whole PET statistics. These methods,however, still lead to motion-blurred data, resulting in apotential effective loss of resolution and of quantitativeinformation from the images. Furthermore, it is not clearwhether a limited number of acquired CT respiratory phasesreally corresponds well to the PET data.
Respiratory gating avoids blurring by dividing the PETcoincidence dataset into smaller data subsets representingjust a single respiratory phase. Crucial to this technique is therecording of respiratory motion as a function of scanningtime. In this feasibility study, we have shown that 2 gatingmethods that are driven purely by list mode events and do notrely on auxiliary measurements of respiratory motion areadequate for cardiac PET/CT studies. They compare mostfavorably with traditional video-based gating.
Quantitatively, video-based gating and center-of-mass–based gating perform similarly in measured motion shifts ofthe left ventricle, whereas sensitivity-based gating performsslightly but significantly worse than the other 2 methods.This poorer performance may be due to the fact that thecenter-of-mass method is based on, essentially, measuringthe internal craniocaudal motion of the heart itself, asopposed to the sensitivity method, which is not at all basedon a direct measurement of motion. The insignificant dif-ference between the video and center-of-mass methods is
TABLE 2. Measured Mean Thicknesses of Anterior LeftVentricular Wall
Mean wall thickness 6 SD(mm)
Respiratory gating method n 5 15 n 5 26No gating 18.0 6 3.6 17.9 6 3.2
Video 16.2 6 3.3 —
Sensitivity 15.8 6 2.0 15.6 6 1.9
Center of mass 15.8 6 3.0 15.5 6 2.5
LIST MODE–DRIVEN GATING IN PET • Buther et al. 679
by on June 8, 2018. For personal use only. jnm.snmjournals.org Downloaded from

consistent with results from MRI studies correlating inter-nal motion of organs with external skin motion, revealing aclear correlation between the two (18).
It is both surprising and helpful that information not onlyabout respiratory motion but also about heart contractioncan additionally be extracted directly from the PET emis-sion data. It is, however, clear that this extraction essen-tially requires sufficient tracer uptake in the heart. Theresults presented here indicate that up to now, list mode–based cardiac gating usually results in smaller ejectionfractions than ECG-based gating; this result is not surpris-ing, as the time resolution is much better in the ECG-basedgating (1 ms) than in the presented list mode–based gating(50 ms). Besides, it is also not clear how cardiac arrhyth-mias would limit the performance of the proposed methods.These influences should be further investigated; perhaps awindowed Fourier analysis or a wavelet analysis may provemore valuable in these situations. Yet a clear correlationbetween ECG- and list mode–based ejection fractions wasfound in patients with high 18F-FDG uptake, and futurerefinement of the proposed methods may improve thissituation. This might also be of interest in the context ofcombined PET/MRI scanners, in which ECG electrodesmay interfere with magnetic fields. Nevertheless, it shouldbe mentioned that list mode–based cardiac gating methodsas presented here are inferior to ECG-based gating as thewidely available gold standard.
Measured quantities in this study (motion shifts and wallthicknesses) by no means represent absolutely ‘‘true’’values. Measured wall thicknesses should especially betreated carefully, both because of remaining partial-volumeeffects and because no attenuation correction was applied.The measured quantities just demonstrate one method’ssuperior or inferior ability to capture respiratory motion ascompared with another’s ability.
Possible modifications of the presented list mode–basedgating methods involve a more sophisticated rebinningmethod such as Fourier rebinning replacing the simple
single-slice rebinning in the center-of-mass method, lead-ing to a better axial classification of coincidences, al-though at the cost of processing time (19). Additionally,coincidences that are known to have originated outside themyocardium may be excluded from the analysis, therebyimproving the noise properties of the raw gating signal.
A clear advantage of event-based methods is the factthat no additional equipment (e.g., sensors, video cam-eras, infrared cameras, and signal processing computers)is necessary to obtain gated scans, thus reducing costs andpotential sources of errors. Additionally, the event-basedmethods are fast, as typical processing times to generatethe respiratory curve from the list mode file were on theorder of a few minutes on a quad-core workstation, de-pending on the actual activity inside the field of view andscanning duration. Bundschuh et al. recently proposed agating method that is based on determining the respiratorymotion of objects such as tumors by reconstructing shorttime frames, defining small volumes of interest containingthese structures, and computing the craniocaudal motionof the center of the volume of interest (20). This method issimilar to the center-of-mass method presented here;however, the processing of list mode data is extremelytime-consuming as every frame has to be reconstructedbefore the center of mass is computed, whereas the center-of-mass method computes the center of mass on sinogramslices without prior reconstruction. One can even think ofimplementing the sensitivity and center-of-mass methodsfor real-time applications, obtaining a respiratory curveduring the list mode scan; however, the filtering stepnecessary to get smooth curves has to be done afterward.
Further studies are needed to investigate if and how theproposed methods can be adopted for imaging of tumorsclose to the diaphragm, as these are known to be affected byrespiratory motion. Besides better quantification of PETuptake values because of improved attenuation correctionand less blurring, tumors can be located more preciselyduring the respiratory cycle when gating techniques are
FIGURE 5. List mode–based cardiacgating. (A) In typical example usingcenter-of-mass method, cardiac con-traction is clearly resolved. (B) Correla-tion plots of ejection fraction using listmode–based gating methods (center ofmass) vs. ECG-based gating for pa-tients with highest tracer uptake. EF 5
ejection fraction.
680 THE JOURNAL OF NUCLEAR MEDICINE • Vol. 50 • No. 5 • May 2009
by on June 8, 2018. For personal use only. jnm.snmjournals.org Downloaded from

applied (9,20). This improvement could be an advantage inradiotherapy, leading to highly precise radiation of tumortissue. First results (not shown here) using list mode–basedgating demonstrated their potential value also in the field oftumor imaging.
Future work will have to determine whether event-basedmethods can also be applied to tracer kinetic studies, forexample, PET perfusion studies using H2
15O or 13NH3. It isclear that these methods have to be modified for thisscenario, as in this case changes in total counts (measuredin the sensitivity method) or shifts in axial center of mass(measured in the center-of-mass method) are correlated notonly to respiratory motion or heart contractions but also totracer kinetics.
One general drawback of PET gating is the loss of statisticsin every PET gate, as can be seen in Supplemental Figure 2A.Although this loss may not be a problem in cases that havehigh tracer uptake in the heart, gated low-uptake scans reallysuffer from limited statistics, especially if the scans arecompared with images obtained using slow CT scans for PETattenuation correction instead of PET gating to reduceattenuation correction artifacts. However, gating of PET datamay just be the first step in a motion correction algorithm(21). The idea is to use the gated PET images to model amotion field between the different respiratory gates. Thismotion field can then be applied to correct for the respiratorymotion and obtain motion-free PET images without loss ofstatistics. Several algorithms have already been investigated(rigid-body transformations (22), affine transformationmodels (23), optical flow-based methods (24,25)), andevent-driven gating methods might prove to be a valuableand easily implemented base for future development.
CONCLUSION
Emission event–driven methods for respiratory gatingwere successfully used in a list mode–based cardiac PET/CT feasibility study. Their performance was comparable tothat of conventional video-based tracking of respiratorymotion. Additionally, cardiac gating information can beobtained in scans with high tracer uptake. The event-drivencenter-of-mass–based method resulted in the best perfor-mance for respiratory and cardiac gating. List mode–basedgating methods do not require additional hardware and caneasily be applied in cardiac PET/CT.
ACKNOWLEDGMENTS
We thank Anika Brunegraf for technical assistanceand Felix Range for patient acquisition. This studywas supported by the Deutsche Forschungsgemeinschaft,Sonderforschungsbereich 656–Molecular CardiovascularImaging (SFB 656, projects C2 and B3), and a researchgrant to the European Institute of Molecular Imaging fromSiemens Medical Solutions.
REFERENCES
1. Beyer T, Townsend DW, Brun T, et al. A combined PET/CT scanner for clinical
oncology. J Nucl Med. 2000;41:1369–1379.
2. Kinahan PE, Townsend DW, Beyer T, Sashin D. Attenuation correction for a
combined 3D PET/CT scanner. Med Phys. 1998;25:2046–2053.
3. Lang N, Dawood M, Buther F, Schober O, Schafers M, Schafers K. Organ
movement reduction in PET/CT using dual-gated list mode acquisition. Z Med
Phys. 2006;16:93–100.
4. Klein GJ, Reutter BW, Ho MW, Reed JH, Huesman RH. Real-time system for
respiratory-cardiac gating in positron tomography. IEEE Trans Nucl Sci.
1998;45:2139–2143.
5. Nehmeh SA, Erdi YE, Ling CC, et al. Effects of respiratory gating on reducing
lung motion artifacts in PET imaging of lung cancer. Med Phys. 2002;29:366–
371.
6. Dawood M, Buther F, Lang N, Schober O, Schafers KP. Respiratory gating in
positron emission tomography: a comparison of different gating schemes. Med
Phys. 2007;34:3067–3076.
7. McKibben CK, Reo NV. A piezoelectric respiratory monitor for in vivo NMR.
Magn Reson Med. 1992;27:338–342.
8. Boucher L, Rodrigue S, Lecomte R, Benard F. Respiratory gating for
3-dimensional PET of the thorax: feasibility and initial results. J Nucl Med.
2004;45:214–219.
9. Rietzel E, Chen GTY, Choi NC, Willet CG. Four-dimensional image-based
treatment planning: target volume segmentation and dose calculation in the
presence of respiratory motion. Int J Radiat Oncol Biol Phys. 2005;61:1535–
1550.
10. DeFronzo RA, Tobin JD, Andres R. Glucose clamp technique: a method for
quantifying insulin secretion and resistance. Am J Physiol. 1979;237:E214–
E223.
11. He J, O’Keefe GJ, Jones G, et al. Evaluation of geometrical sensitivity for
respiratory motion gating by GATE and NCAT simulation. Conf Proc IEEE Eng
Med Biol Soc. 2007;1:4165–4168.
12. Daube-Witherspoon ME, Muehllehner G. Treatment of axial data in three-
dimensional PET. J Nucl Med. 1987;28:1717–1724.
13. Wink N, Panknin C, Solberg TD. Phase versus amplitude-based sorting of
4D-CT data. J Appl Clin Med Phys. 2006;7:77–85.
14. Stegger L, Lipke CS, Kies P, et al. Quantification of left ventricular volumes and
ejection fraction from gated 99mTc-MIBI SPECT: validation of an elastic surface
model approach in comparison to cardiac magnetic resonance imaging,
4D-MSPECT and QGS. Eur J Nucl Med Mol Imaging. 2007;34:900–909.
15. Stegger L, Biedenstein S, Schafers KP, Schober O, Schafers M. Elastic surface
contour detection for the measurement of ejection fraction in myocardial
perfusion SPECT. Eur J Nucl Med. 2001;28:48–55.
16. Lagerwaard FJ, Van Sornsen de Koste JR, Nijssen-Visser MR, et al. Multiple
‘‘slow’’ CT scans for incorporating lung tumor mobility in radiotherapy
planning. Int J Radiat Oncol Biol Phys. 2001;51:932–937.
17. Pan T, Mawlawi O, Luo D, et al. Attenuation correction of PET cardiac data with
low-dose average CT in PET/CT. Med Phys. 2006;33:3931–3938.
18. Koch N, Liu HH, Starkschall G, et al. Evaluation of internal lung motion for
respiratory-gated radiotherapy using MRI: part I—correlating internal lung
motion with skin fiducial motion. Int J Radiat Oncol Biol Phys. 2004;60:1459–
1472.
19. Defrise M, Kinahan PE, Townsend DW, Michel C, Sibomana M, Newport D.
Exact and approximate rebinning algorithms for 3D PET data. IEEE Trans Med
Imaging. 1997;16:145–158.
20. Bundschuh RA, Martınez-Moeller A, Essler M, et al. Postacquisition detection
of tumor motion in the lung and upper abdomen using list mode PET data: a
feasibility study. J Nucl Med. 2007;48:758–763.
21. Schafers KP, Dawood M, Lang N, Buther F, Schafers M, Schober O. Motion
correction in PET/CT. Nuklearmedizin. 2005;5a(suppl):S46–S50.
22. Livieratos L, Stegger L, Bloomfield PM, Schafers K, Bailey DL, Camici PG.
Rigid-body transformation of list mode projection data for respiratory motion
correction in cardiac PET. Phys Med Biol. 2005;50:3313–3322.
23. Lamare F, Cresson T, Savean J, Cheze Le Rest C, Reader AJ, Visvikis D. Re-
spiratory motion correction for PET oncology applications using affine trans-
formation of list mode data. Phys Med Biol. 2007;52:121–140.
24. Dawood M, Lang N, Jiang X, Schafers KP. Lung motion detection on respiratory
gated 3D PET/CT images. IEEE Trans Med Imaging. 2006;25:476–485.
25. Dawood M, Buther F, Jiang X, Schafers KP. Respiratory motion correction in
3-D PET data with advanced optical flow algorithms. IEEE Trans Med Imaging.
2008;27:1164–1175.
LIST MODE–DRIVEN GATING IN PET • Buther et al. 681
by on June 8, 2018. For personal use only. jnm.snmjournals.org Downloaded from

Doi: 10.2967/jnumed.108.059204Published online: April 16, 2009.
2009;50:674-681.J Nucl Med. SchäfersFlorian Büther, Mohammad Dawood, Lars Stegger, Frank Wübbeling, Michael Schäfers, Otmar Schober and Klaus P.
Driven Cardiac and Respiratory Gating in PET−List Mode
http://jnm.snmjournals.org/content/50/5/674This article and updated information are available at:
http://jnm.snmjournals.org/site/subscriptions/online.xhtml
Information about subscriptions to JNM can be found at:
http://jnm.snmjournals.org/site/misc/permission.xhtmlInformation about reproducing figures, tables, or other portions of this article can be found online at:
(Print ISSN: 0161-5505, Online ISSN: 2159-662X)1850 Samuel Morse Drive, Reston, VA 20190.SNMMI | Society of Nuclear Medicine and Molecular Imaging
is published monthly.The Journal of Nuclear Medicine
© Copyright 2009 SNMMI; all rights reserved.
by on June 8, 2018. For personal use only. jnm.snmjournals.org Downloaded from