Lisette Waits University of Idaho -...
58
Genetic Diversity Lisette Waits University of Idaho
Transcript of Lisette Waits University of Idaho -...
Genetic Diversity
Lisette Waits
University of Idaho

Outline
Diversity and Effective Population Size
Hardy Weinberg and Linkage Equilibrium
Measuring Genetic Diversity
Genetic Diversity and Fitness
Mating Systems and Genetic Diversiity
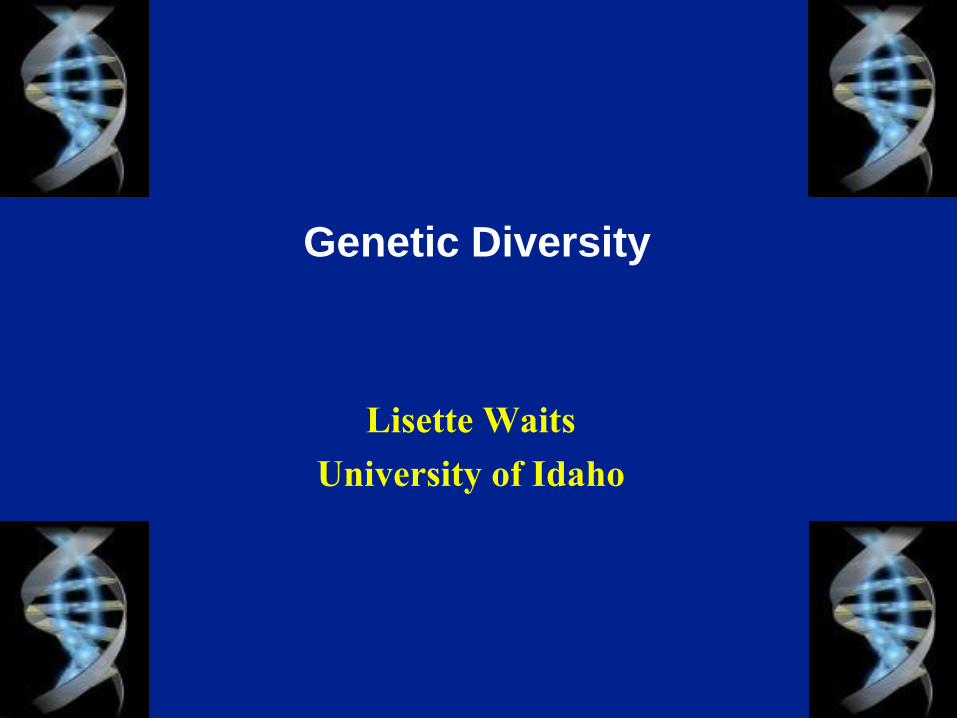
What is genetic diversity?
DNA sequence differences at the
same physical location
Sample 1 GATCC ATCGA TCTGGTA
Sample 2 GATCA ATCGG TCTGATA
Example Locus 1: (nucleotide substitution)
Example Locus 2: (insertion/deletion)
Sample 1 GATCC ATCATCATCATCATC TCTGGCA
Sample 2 GATCC ATCATCATCATC TCTGGCA

11.1 A species’ pool of genetic diversity exists at three
fundamental levels

High Genetic Diversity
- increases fitness
- increases resources available to respond to
environmental stress
Low Genetic Diversity
- decreases fitness
- increases probability of extinction
Inbreeding depression (immediate)
Decrease in evolutionary potential (long term)
Why do we care?

Genetic Diversity is affected by 4 main processes:
Mutation
Natural Selection
Drift Gene Flow

Mutation
• Creates new alleles
• Rate of mutation varies by locus
• Process of mutation varies by locus
• High rate of mutation useful for detecting changes in diversity or structure on shorter time scale (microsatellites)
• Low rate of mutation useful for detecting changes in structure on more historical time frames (mtDNA and cpDNA sequence data)
• If loci are neutral, only drift and gene flow affect the fate of a new allele created by mutation.

Genetic Drift
• Changes in allele frequencies caused by random effects of sampling when gametes are passed from one generation to the next.
• The smaller the gamete sample the more likely it will deviate widely from the parent generation.

Genetic Drift in the red flour beetle at N=10, N=100
12 replicates, with moderate selection pressure
Frankham et al 2002 Conservation Genetics, Cambridge University Press

What is Effective Population Size (Ne)?
• “Ne”, is an index of how many individuals are passing on their genetic material.
• Size of the “ideal population” that would lose variation or „drift‟ at the same rate observed in the real biological population.
• Genetic equations for sub-division & gene flow is based on an “ideal population”
–Random mating within demes
–Equal sex ratios
–All parents with equal chance of leaving progeny
–Non-overlapping generations

Census Size vs Effective Population Size?
P
op
ula
tio
n s
ize
Generations

Why do we care?
• It is the main parameter in population genetic equations
• Used to predict loss of genetic variation over time
• Allows us to model impacts of gene flow and drift
• Used as a benchmark for “viable populations” in conservation biology : 50/500 rule (Franklin 1980, Soule 1980, Waples 1990)
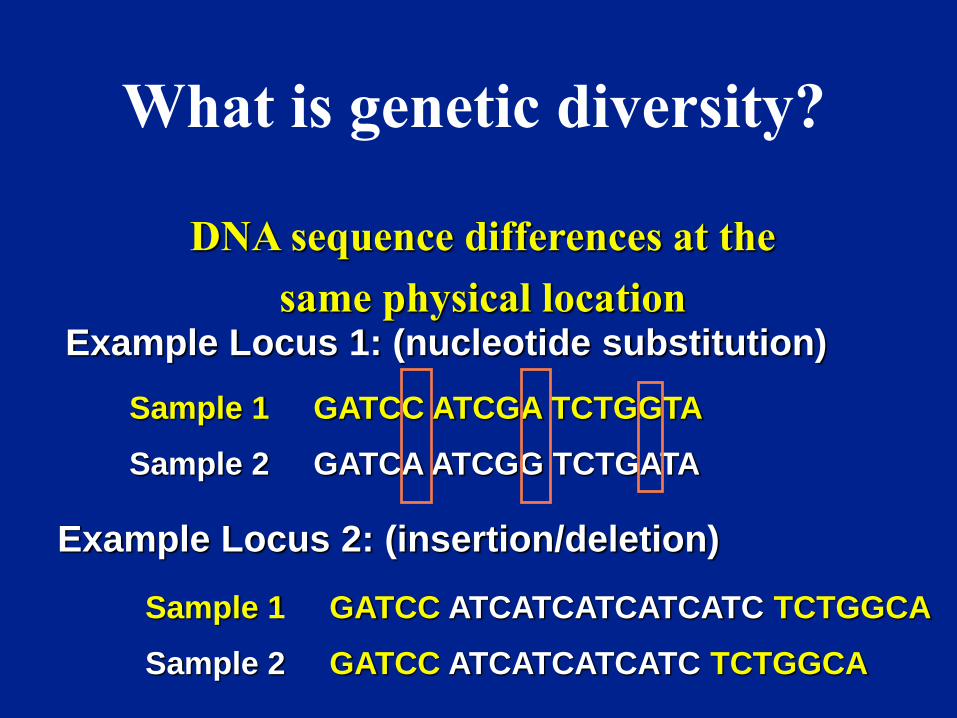
Genetic Approaches to estimate NE
(Leberg 2005 JWM 69:1385-1399)
• 4 Main methods
– Temporal Methods
– Gametic Disequilibrium
– Heterozygote Excess
– Coalescent approaches
• Includes
– Moment-estimator
– Maximum Likelihood
– Bayesian

Hardy-Weinberg Principle
• Simplest model of population genetics
• First developed in 1908 by GH Hardy and Wilhelm Weinberg
–Not used predominantly until 1968
• Model states that in an “ideal population” genetic change does not occur from one generation to the next (Allele and genotype frequencies are constant) - if assumptions are met

What does HWE mean?
• Allele and genotype frequencies are constant from one generation to the next and there is a mathematical relationship between the two.
• Genotype frequencies will be a binomial (or multinomial) function of allele frequencies
• HWE can be established in one generation of random mating if allele frequencies are the same in males and females (when there are non-overlapping generations)

p2
pq
pq
q2
p q
p
q

Hardy-Weinberg Assumptions
• Species is diploid
• Reproduction is sexual
• Random mating
• No mutation (or infinitely small)
• Large population size (Ne > 500)
• No natural selection
• No migration
• Generations are non overlapping
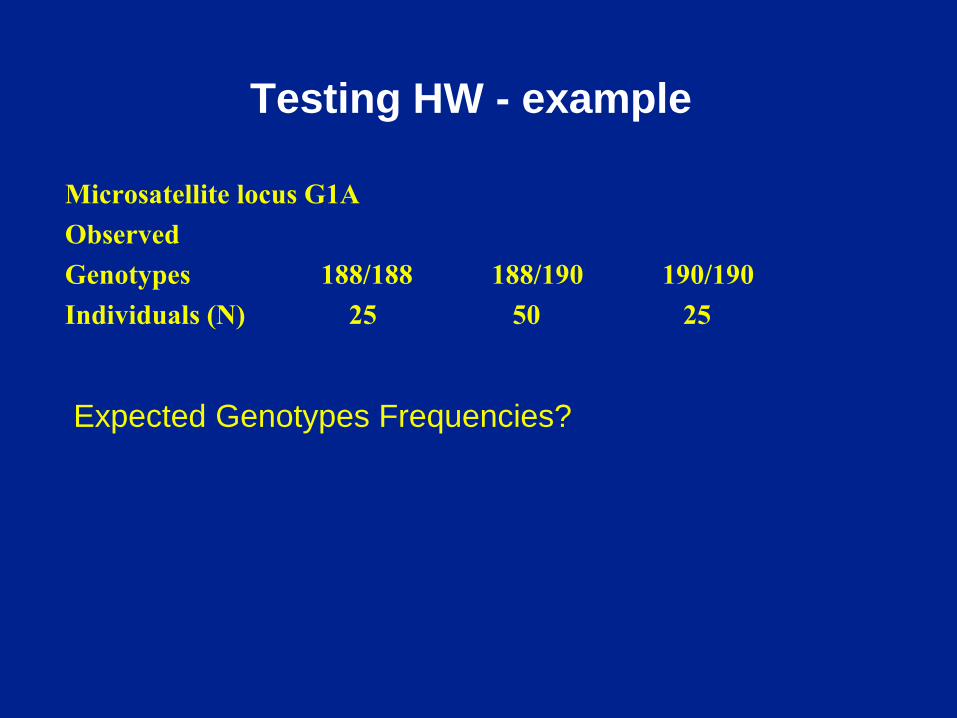
Testing HW - example
Microsatellite locus G1A
Observed
Genotypes 188/188 188/190 190/190
Individuals (N) 25 50 25
Expected Genotypes Frequencies?

Calculate Allele Frequencies
Microsatellite locus G1A
Observed
Genotypes 188/188 188/190 190/190
Individuals (N) 25 50 25

What is are the expected number of individuals per genotype?
Microsatellite locus G1A
Observed
Genotypes 188/188 188/190 190/190
Individuals (N) 25 50 25
•Use theory - p2 + 2pq + q2
• So multiply # individuals x expected frequencies

Assessing HW equilibrium Null hypothesis: in equilibrium Software: Genepop, Fstat, Arlequin
• Example – 10 loci and 10 populations
• Test HW for each locus in each population
• Loci 1 and 3 are out of HW in 9 of 10 populations
• What do you learn?

Assessing HW equilibrium Null hypothesis: in equilibrium Software: Genepop, Fstat, Arlequin
• Example – 10 loci and 10 populations
• In Population A, 8 out of 10 loci are out of HW
• What do you learn?

Testing for Linkage Equilibrium
• Null hypothesis: Alleles from different loci assort independently
• How to test? Mapping location of loci, population genetic software (Genepop, Arlequin)
• Why do we care? Methods assume loci are independent. Independent loci have more statistical power.
• What causes disequilibrium?
–Physical linkage
–Founder events
–Bottlenecks followed by rapid expansion
–Gene flow between previously isolated groups
–Selection
–Extreme drift in small populations

Outline
Diversity and Effective Population Size
Hardy Weinberg and Linkage Equilibrium
Measuring Genetic Diversity
Genetic Diversity and Fitness
Mating Systems and Genetic Diversiity

How do we measure genetic diversity?
1. Percentage of polymorphic loci (P)
Monomorphic - 1 allele only, polymorphic - multiple alleles per locus
2. Number of alleles/locus or Allelic Richness (# bands)
3. Heterozygosity

Heterozygosity:
Individual - proportion of loci with two different alleles
Aa
BB
cc
Dd
Heterozygosity:
0.50

Heterozygosity:
Individual - proportion of loci with two different alleles
Aa
BB
cc
Dd
Observed
Heterozygosity: =
6/13 = 0.462
Aa
AA
aa
Aa
AA
aa
Aa
Aa
Aa
Aa
AA
aa
AA
Heterozygosity:
0.50
Population - Proportion of genotypes in the entire population
that are heterozygous.

Expected Heterozygosity (Nei 1987)
He = 2n (1 - ∑xi2) where n = sample size, xi = freq ith allele
(2n - 1)
He is expected level of Heterozygosity under HW
When population is out of HW then Ho ≠ He

How rapidly does variation decline in a population?
• Heterozygosity is lost at a rate of 1/(2Ne) per generation.
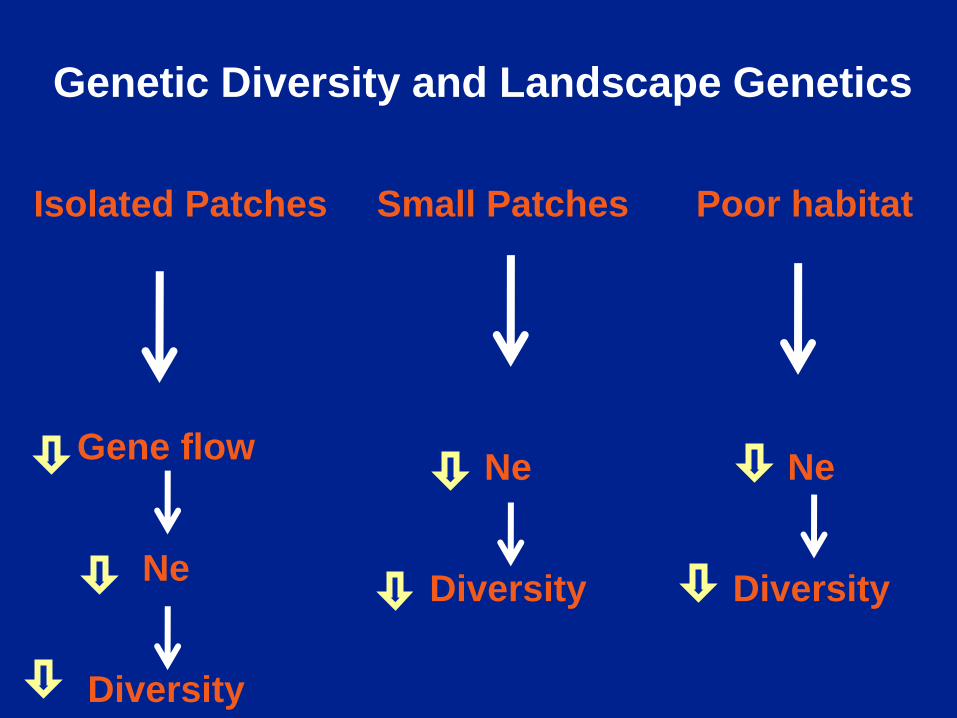
Genetic Diversity and Landscape Genetics
Isolated Patches Small Patches Poor habitat
Gene flow
Ne
Diversity
Ne
Diversity
Ne
Diversity

Detecting Bottlenecks
• Gametic disequilibrium (Waples 1991, 2002)
• Reduced allelic diversity/loss of rare alleles (Allendorf 1986)
• Mode shift in allele frequency distributions (Luikart et al 1998)
• Increased heterozygosity compared to mutation drift equilibrium (Cornuet and Luikart 1996; Bottleneck program)
• Reduced value for M statistic (Garza and Williamson 2001) (M < 0.68 provides strong support for a bottleneck)
– (M = # alleles/size range)

Inbreeding
• Inbreeding refers to matings between relatives.
• “Inbreeding” can refer to a mating system where individuals preferentially breed with relatives.
• In small populations, even when breeding occurs at random, relatives will mate more frequently than in large populations. This is called the “inbreeding effect of small populations.”

Inbreeding
• Inbreeding is unavoidable in small populations

Inbreeding Depression
• What is it?
• A decrease in growth, survival or fertility observed due to mating among closely related individuals
• Hedrick PW and Kalinowski ST (2000) Inbreeding depression in conservation biology. Annual Review of Ecology and Systematics 31: 139-162.
• Keller LF and Waller DM (2002) Inbreeding effects in wild populations. Trends in Ecology and Evolution 17: 230-241.
• Slate J, Pemberton JM (2002) Comparing molecular measures for detecting inbreeding depression. Journal of Evolutionary Biology 15: 20-31.
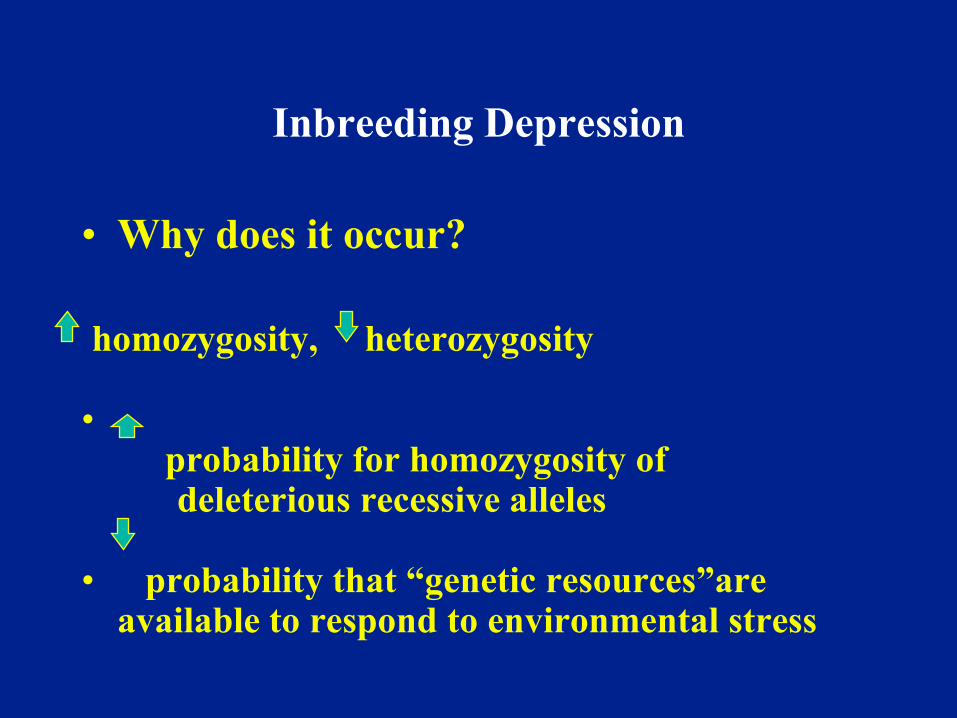
Inbreeding Depression
• Why does it occur?
homozygosity, heterozygosity
• probability for homozygosity of
deleterious recessive alleles
• probability that “genetic resources”are available to respond to environmental stress

Measures of Inbreeding
• Inbreeding Coefficient (F) - Probability that both alleles at a locus are identical by descent. Ranges from 0 - 1 (inbred).
• Direct estimates from pedigrees.
• Indirect estimates can be obtained by evaluating the deficiency of heterozygotes compared to Hardy-Weinberg expectations (Fis statistics)
• Levels of genetic diversity are often used as a surrogate for evaluating potential inbreeding due to low effective population size.
• Balloux F, Amos W, Coulson (2004) Does heterozygosity measure inbreeding in real populations? Molecular Ecology 13: 3021-3031.

Ralls et al 1988
• Estimated the effect of inbreeding on juvenille survival from 40 mammalian species using captive animals
• 36/40 species comparison had positive slopes
• Compared survival of offspring of 1st degree relatives to unrelated animals to calculate cost of inbreeding

Genetic Diversity and Fitness in Wild Populations

Evidence from wild populations?
Recent review papers on the topic
Crnokrak and Roff 1999 - reviewed 157 datasets for 34
species, concluded that 141 studies demonstrated that
inbred individuals had poorer attributes (Heredity 83:260).
Reed and Frankham 2003 - Meta-analysis of relationship of
Fitness and heterozygosity, heritability and population size.
Mean correlations were significant (r=0.432) and 28/34 were
positive. (Cons Bio 17:230)
Garner et al 2005 Cons Bio 19:1215 - 108 mammalian
species and threatened/endangered had lower diversity

3 Hypotheses for Correlations between Heterozygosity and Fitness
• Direct Effect - Heterozygote advantage at the measured loci
• Local Effect - Heterozygote advantage at closely linked loci that have a functional role. Requires linkage disequilibrium
• General Effect - Indicates levels of diversity in the genome as a whole

Increased diversity = increased probability of
individuals or pops surviving bottlenecks
Song Sparrow Keller et al 1994 Nature 372:356
Butterfly Saccheri et al 1998 Nature 392:491

Genetic Diversity
and Extinction
Saccheri et al 1998
Nature 392:491
42 butterfly pops
8 allozymes, 1 usat
7 (red) went extinct

Logistic regression with avg # of Het. Loci per individual as
explanatory variable (p < 0.001)

Decreased Diversity = Decreased resistance to Parasites
Soay Sheep Coltman et al 1999 Evol. 53:1259
Bumblebees Baer & Hempel 1999 Nature 397:151
Song sparrow Reid et al 2003 PRSL 270:2151
Deer Mice Meagher 1999 Evol 53:1318.
Fish Lively et al 1990 Nature 344:864
Sea lions Whitehouse et al 2003 Nature 422:35

Relationship between individual level diversity and reproductive success

Studies Finding Increased Diversity is correlated with increased reproductive success
Sonoran Topminnow Quattro and Vrijenhoek 1989
Science 245:976
Song Sparrow Keller et al 1998 Evol. 52:240
Male House Mouse Meagher et al 2000 PNAS 97:3324
Red Deer Slate et al 2000 PRSL 267:1657
Male Black Grouse Hoglund et al 2002 PRSL 269:711
Grey Seal, albatross Amos et al 2002 PRSL 268:2021
Pilot Whale
Collared Flycatchers Kruuk et al 2002 PRSL 269:1581

Relationship between genetic diversity and neonatal growth rate and survival

Diversity = juvenille survival and birthweight
Alpine marmots DaSilva et al 2006 Con Gen 7:371
Harbor Seal Coltman et al 1998 PRSL 265:803
Red Deer Coulson et al 1998 PRSL 265:489
Horseshoe Bat Rossiter et al 2001 PRSL 268:1055
Sonoran Topminnow Quattro and Vrijenhoek 1989
Science 245:976
Faster growth rate in Walleye with greater
Heterozygosity (Cena et al 2006 ME 15:303)

Diversity correlated with lifespan and recruitment in Darwin’s finches
Markert et al 2004 Heredity 92:306 - 315.
Climate Change and Inbreeding
(Schiegg et al 2002 PRSL 269:1153-1159)
- red-cockaded woodpeckers are laying eggs
earlier in response to climate change
- Inexperienced and inbred mothers do not lay
earlier and show a decrease in
fecundity

Briskie and MacKintosh 2004 PNAS 101:558-561.
• New Zealand birds - native and exotic
• Evaluated hatching failure rate and bottleneck size
•3% failure for non-bottlenecked > 10,000 (n = 15)
•3.7 % failure for bottleneck of 300 - 5,500 native (n = 11)
• 25% failure for bottleneck of < 150 birds native (n = 11)
Native Exotic
How many to avoid fitness problems?

Genetic Rescue of Population Decline “Genetic Restoration”
• European adder (Vipera berus) – Madsen et al 1999 Nature 402:34
• Greater Prairie Chicken (Tympanuchus cupido pinnatus) – Weistemeier et al 1998 (Science 282:1695)
• Florida Panther (Puma concolor corci) – Ellis et al 1999 (USFWS report)
• European grey wolf (Canis lupus) – Vila et al 2003 (PRSL 270:91)
• Bighorn Sheep (Ovis canadensis) – Hogg et al 2006 (PRSL 273:1491)
• Dinizia excelsa (Fabaceae) canopy emergent tree in Amazona – Dick 2001Proc. R. Soc. Lond B 268:2391

Mating
Systems in
Conservation
Genetics

Paternity/Maternity/Relatedness
Principle: The more alleles two individuals share the higher their relatedness. Relatedness statistics calculated using Kinship or Relatedness (Queller and Goodnight 1989)
Maternity and paternity can be assigned directly thru exclusion analyses by comparing genotypes at multiple loci. Generally done by computer log-likelihood analysis (Marshall et al 1998, CERVUS)
Example:
Mother’s Genotype: 150/152 120/124 200/220 175/175
Offspring 150/156 124/128 200/200 175/180
Father must be ?/156 ?/128 ?/200 ?/180

Cubs Alleged
Locus Mother 1 2 3 father
A 184 192 184 194 184 192 184 194 184 194 B 156 160 152 160 152 160 160 164 152 152 C 105 113 105 111 105 105 111 113 105 111 D 172 177 172 172 172 177 172 178 172 177 L 155 159 155 157 159 161 155 155 157 161 M 208 208 208 212 208 208 208 212 208 212 P 153 153 153 159 153 159 153 157 159 161 X 135 137 135 137 133 135 137 141 133 137
Ursus arctos grizzly bear Craighead et al. (1995)

Software for mating system analysis
• BOREL http://www.stat.washington.edu/thompson/Genepi/pangaea.shtml
• BROOD http://www.agriculture.purdue.edu/fnr/html/faculty/dewoody/parentage.html
• CERVUS http://helios.bto.ed.ac.uk/evolgen/cervus/cervus.html
• COLONY http://www.zoo.cam.ac.uk/ioz/software.htm#COLONY
• DELRIOUS http://www.zoo.utoronto.ca/stone/delrious/delrious.htm
• ECLIPSE http://www.stat.washington.edu/thompson/Genepi/pangaea.shtml
• FAMOZ http://www.pierroton.inra.fr/genetics/labo/Software/Famoz
• FMM http://publish.uwo.ca/~bneff/software.htm
• GAMETES http://www.agriculture.purdue.edu/fnr/html/faculty/dewoody/parentage.html
• GeneticStudio http://dyerlab.bio.vcu.edu/wiki/index.php/Software
• GERUD http://www.bio.tamu.edu/USERS/ajones/parentage.htm
• HAPLOTYPE http://www.agriculture.purdue.edu/fnr/html/faculty/dewoody/parentage.html
• IDENTIX http://www.genetix.univ-montp2.fr/
• KinInfor http://www.zoo.cam.ac.uk/ioz/software.htm#COLONY
• Kinship http://www.gsoftnet.us/GSoft.html
• MATCH-MAKER http://www.agriculture.purdue.edu/fnr/html/faculty/DeWoody/Rudnick/jamieweb.htm
• MER http://www.zoo.cam.ac.uk/ioz/software.htm#COLONY

Software for mating system analysis (continued)
• ML-RELATE www.montana.edu/kalinowski
• MLTR http://genetics.forestry.ubc.ca/ritland/programs.html
• NEWPAT http://www.zoo.cam.ac.uk/zoostaff/amos/newpat.html
• PAPA http://www2.bio.ulaval.ca/louisbernatchez/downloads.htm
• PARENTE http://www-leca.ujf-grenoble.fr/logiciels.htm
• PASOS http://www2.bio.ulaval.ca/louisbernatchez/downloads.htm
• PATRI http://www.binf.ku.dk/~rasmus/webpage/patri.html
• PEDIGREE http://herbinger.biology.dal.ca:5080/Pedigree
• PHASE http://www.stat.washington.edu/stephens/software.html
• PrDM http://publish.uwo.ca/~bneff/software.htm
• PREST http://galton.uchicago.edu/~mcpeek/software/prest
• PROBMAX http://www.uoguelph.ca/~rdanzman/software/PROBMAX
• PURPL http://www.clermont.inra.fr/umr-asp/purpl/
• RAFFLE http://publish.uwo.ca/~bneff/software.htm
• RELATEDNESS http://www.gsoftnet.us/GSoft.html
• RELPAIR http://www.sph.umich.edu/statgen/boehnke/selpair.html
• SPAGEDI http://www.ulb.ac.be/sciences/ecoevol/spagedi.html
• Two-Sex Paternity http://publish.uwo.ca/~bneff/software.htm

Useful Review Papers
Blouin M (2003) DNA-based methods for pedigree
reconstruction and kinship analysis in natural populations.
Trends in Ecology and Evolution 18: 503-511.
Jones AG, Ardren WR (2003) Methods of parentage analysis in
natural populations. Molecular Ecology 12: 2511-2523.