Lisa Barrow and Cecilia Elena Rouse - ERIC Barrow and Cecilia Elena Rouse F e d e r a l R e s e r v...
44
Do Returns to Schooling Differ by Race and Ethnicity? Lisa Barrow and Cecilia Elena Rouse Federal Reserve Bank of Chicago WP 2005-02
Transcript of Lisa Barrow and Cecilia Elena Rouse - ERIC Barrow and Cecilia Elena Rouse F e d e r a l R e s e r v...
Do Returns to Schooling Differ by Race and Ethnicity? Lisa Barrow and Cecilia Elena Rouse
Fe
dera
l Res
erve
Ban
k of
Chi
cago
WP 2005-02
Comments Welcome
Do Returns to Schooling Differ by Race and Ethnicity?
Lisa BarrowFederal Reserve Bank of Chicago
Cecilia Elena RousePrinceton University and NBER
February 2005
We thank Orley Ashenfelter, Kristin Butcher, Alan Krueger, Bridget Terry Long, and JesseRothstein for useful conversations, and Nina Badgaiyan, Cindy Cassaza, and Sara Christopher forexpert research assistance. We are also grateful to Karima Nagi for the special tabulation of theNLSY79 data. Funding was generously provided by the Education Research Section and theIndustrial Relations Section. All errors in fact or interpretation are ours. The opinions in this paperdo not reflect those of the Federal Reserve Bank of Chicago or the Federal Reserve System.
Abstract
Using data from the U.S. Decennial Census and the National Longitudinal Surveys, we find littleevidence of differences in the return to schooling across racial and ethnic groups, even with attemptsto control for ability and measurement error biases. While our point estimates are relatively similaracross racial and ethnic groups, our conclusion is driven in part by relatively large standard errors.That said, we find no evidence that returns to schooling are lower for African Americans orHispanics than for non-minorities. As a result, policies that increase education among the low-skilled have a good possibility of increasing economic well-being and reducing inequality. Moregenerally, our analysis suggests further research is needed to better understand the nature ofmeasurement error and ability bias across subgroups in order to fully understand potentialheterogeneity in the return to schooling across the population.
1
I. Introduction
Inequality in the U.S. has been increasing over the past 25 years. In 1979 workers in the
bottom 10th percentile of the wage distribution earned $6.88 per hour (in 2003 dollars) while those
at the 50th and 90th percentiles earned $14.58 and $30.19 per hour, respectively. By 2000 real wages
at the 10th percentile had grown by roughly 5.4 percent to $7.25. At the same time real wages at the
median and 90th percentile grew to $15.71 and $35.65 per hour, a growth of 7.8 percent at the
median and 18.1 percent at the 90th percentile. Because differences in human capital (education and
experience) account for approximately one-third of the variation in wages and because the mean
economic return to schooling is estimated at 10 percent, many researchers and policy makers have
appealed to education and training policies to bolster the wages of the lowest skilled workers
(Heckman and Carneiro 2004, Krueger 2004).
Much less is known about how the estimated returns to schooling vary across the population.
For example, Carneiro, Heckman and Vytlacil (2003) and Taber (2001) find that the return to
education is higher for more able individuals. In contrast, neither Altonji and Dunn (1996) nor
Ashenfelter and Rouse (2000) find consistent evidence that the returns to schooling are higher for
individuals that come from more advantaged families. Further, Ashenfelter and Rouse (1998)
provide some evidence that the return may be higher for more disadvantaged individuals, and this
pattern would explain some of the empirical estimates of the economic benefit of schooling using
instrumental variables techniques (Card 2001). And yet, much social policy hinges on what we
believe to be the value of education for individuals. For example, policies aimed at improving the
incomes of the lowest skilled members of society will not either improve their economic well-being
or decrease inequality if their returns to schooling are low.

2
1 In the analyses using the National Longitudinal Surveys we control for age rather than potentialwork experience (age - education - 6) because of possible measurement error in education.
In this paper we provide further evidence on the variation in returns to schooling by
examining whether the benefits vary by race and ethnicity of the individual. We do so by estimating
the return to schooling using the U.S. Decennial Census as well as the National Longitudinal
Surveys of Young Men and Young Women, and the National Longitudinal Survey of Youth, 1979.
We find that the return to schooling is relatively constant across racial and ethnic groups, even
controlling for ability and measurement error biases. The rest of the paper is organized as follows.
In the next section we lay out the empirical framework, in Section III we describe the data, in
Section IV we present the results, and we conclude in Section V.
II. Empirical Framework
A. Basic Specification
Following Mincer (1974) we estimate the relationship between schooling and income by
regressing the (natural) logarithm of the hourly wage (ln wij) of individual i of race or ethnicity j on
years of completed schooling (Sij) controlling for explanatory variables such as potential experience
or age1, sex, race, and geographic region of the country (Xij). As such we estimate:
(1)
(where gij is an error term). The coefficient on the schooling variable ($j) is interpreted as the
percentage increase in the hourly wage associated with one additional year of schooling and is
referred to as the “return to schooling.” Note that while we will refer to it as the “return to
schooling,” it is actually just the average percentage difference in mean earnings for each additional
3
year of schooling. As Mincer (1974) shows, if foregone earnings are the only cost of school
attendance this is the private rate of return to the investment in a year of schooling. A more detailed
calculation of the “return” would incorporate the other costs of schooling, including tuition, as well.
Related to many of the econometric issues raised below is the question of why we may or
may not expect to find differences in the estimated return to schooling by race or ethnicity; that is,
why $j may vary by j. If we begin by assuming that equation (1) represents the true relationship
between wages and schooling and that differences in educational attainment occur randomly, then
a constant $j ($j = $) implies that we should estimate the same return to schooling for any subgroup
of the population. However, even if $j is constant we may observe different estimates of the return
to schooling for different subgroups if years of schooling is a poor proxy for human capital due to
differences in school quality and if average school quality varies systematically by race.
Alternatively, $j may not be constant. For example, the return to schooling may depend on
the level of education. In this case, estimating returns to schooling for subgroups of the population
with different levels of education (on average) will generate different estimates of the return to
schooling. Further, it is important to keep in mind that differences in educational attainment do not
occur randomly in the population but instead arise from individuals’ decisions. A simple model of
optimal schooling investment as in Becker (1967) and Card (2001) predicts that differences in
optimal schooling choice arise from differences in the benefits and/or costs of obtaining additional
schooling. As a result, individual differences in costs or expected benefits that vary systematically
by subgroup may generate differing returns-to-schooling estimates for different subgroups. For
example, assuming that education does not affect mortality rates, differences in mortality rates by
race mean that for any given level of education, African Americans have fewer expected years than
4
whites over which to receive the benefits of an additional year of schooling. If the costs of an
additional year of education are the same for all individuals, then an African American who decides
to invest in an additional year of education must expect to receive a larger increase in annual income
than an otherwise similar white individual making the same decision. For these reasons, it is an
empirical question whether the return to schooling is constant across the population.
B. Econometric Issues
More generally, much of the literature estimating returns to schooling is concerned with
whether the ordinary least squares (OLS) estimates of $j in equation (1) reflect the causal effect of
education on wages. Specifically, does more schooling cause higher earnings or are more able
people more likely both to get more schooling and to earn higher wages, even in the absence of
additional schooling? In the latter case, the OLS estimates of $j will likely be upward biased due to
selection on ability.
Further, this ability bias may not be constant across the population. For example, if African
Americans and Hispanics tend to attend schools of poorer quality, then those students who manage
to get more schooling (particularly, perhaps, by going to college) may have unusually high ability.
This would generate greater selection bias among African Americans and Hispanics suggesting that
the cross-sectional estimate of the return to schooling is more severely upward biased for these
populations.
In this paper we address the potential for selection bias by including controls for ability
5
2 Other researchers, such as Angrist and Krueger (1991), Kane and Rouse (1993), and Card(1995), address selection bias using instrumental variables estimators. In this strategy one mustidentify an “exogenous” event (the instrumental variable) that affects an individual’s years ofcompleted schooling but that is uncorrelated with the error term in the wage equation.Unfortunately, it is very difficult to identify valid instrumental variables and one usually requireslarge samples in order to get precise estimates.
directly using test scores and using family relationships by studying siblings.2 When considering
family relationships, we characterize the wage equation as:
(2)
where ln wijk represents the log wage of individual i from racial/ethnic group j and family k, :jk
represents the “family” ability, and the other variables are defined as before. Family ability may
represent a number of things such as genetic endowment with respect to earnings capability or
access to resources that facilitate both educational attainment and labor market earnings. If log
wages are linear and separable in this ability, then one can address selection bias by relating the
difference in wages between family members (or siblings) to the difference in their education. If
there are no further unobserved differences between family members that are correlated with both
schooling differences and differences in earnings, then this “within-sibling” estimator will provide
an unbiased estimate of the return to schooling. In our analysis we can also directly control for an
observable measure of “ability” by also including individual test scores in equation (2).
There have been many previous estimates of the return to schooling using this estimator to
study the mean return to schooling (see, e.g., Gorseline (1932), Chamberlain and Griliches (1975,
1977)). More recently, Altonji and Dunn (1996) and Ashenfelter and Rouse (1998) use this
estimator to study how the returns to schooling differ by family background. We are unaware of
previous applications of this estimator to studying the return to schooling by race and ethnicity.
6
3 In this paper we assume classical measurement error in schooling. Kane, Rouse, and Staiger(1999) provide evidence that measurement error in schooling may not be classical. Unfortunatelythe sample sizes provided in our data are too small to implement their suggested estimator byrace/ethnicity.
4 See Ashenfelter and Krueger (1994) for an excellent discussion of measurement error models.
Measurement error in reported schooling poses another econometric challenge. The
attenuation caused by (classical) measurement error is exacerbated in within-sibling estimators, as
identified by Griliches (1977) because sibling education levels are so highly correlated. As such
the within-sibling estimator will generate a downward biased estimate of the return to schooling.
If the measurement error is classical in nature (i.e., uncorrelated with the error term in the wage
equation and with the true level of schooling), then an instrumental variables (IV) estimator using
an independent report of the respondent’s schooling as the instrumental variable will generate
consistent estimates of $j.3
Further, it is not clear why the measurement error need be constant across the population.
The reliability (or “signal-to-noise”) ratio is the proportion of the observed variance in schooling
due to the variance in “true” schooling. If one has two independent estimates of an individual’s
schooling level, the correlation between the two measures provides an estimate of the reliability
ratio.4 Using NLSY79 data we estimate reliability ratios for self-reported schooling, both in levels
(i.e., for each individual) and for the deviation from sibling-means. These estimates are reported in
Table 1. Overall we estimate that 11 percent of the observed variance in schooling levels is due to
measurement error. In addition, there is some variation by race/ethnicity. Nearly 20 percent of the
observed variance in schooling for African Americans is due to error compared to 14 percent for
Hispanics and 8 percent for whites. In contrast, there is not a lot of difference in the estimated
7
5 We constructed an hourly wage rate by adjusting annual wage and salary income by the numberof weeks worked in the previous year and the usual number of hours worked each week. We usedthe minimum wage in effect in the year before the Census in question because the Census incomeand wages refer to the previous year.
6 We get greater variation when we estimate the returns to schooling using hourly wages ratherthan annual earnings. This is because the relationship between greater schooling and more stablejobs is stronger for African Americans and Hispanics than for non-minorities. Whether thiscorrelation is explained by access to more stable jobs or changes in labor supply decisions is anempirical question (Ashenfelter and Ham, 1979).
reliability ratios by sex. The results in column 2 of Table 1 indicate that sibling differences in
educational attainment include more “noise” than individual measures of educational attainment.
Overall, 26 percent of the variance in sibling-differences in education is due to measurement error,
although the proportion due to error is one-third for African Americans. Based on these estimates,
we expect the estimated returns to schooling for African Americans and to some extent Hispanics
to be more downward biased than that for whites (non-African Americans/non-Hispanics).
III. Data
A. U.S. Decennial Census
We begin by using data from the 5 percent samples of the 1980, 1990, and 2000 Decennial
Censuses. The samples included individuals aged 25-65 who were U.S. citizens and born in the
U.S., who worked at least 1 week in the previous year, and who earned at least one-half of the
minimum wage.5 All wages and income are adjusted to 2003 dollars using the Personal
Consumption Expenditures chain-type price index from the Bureau of Economic Analysis. The
regression analysis is based on annual earnings.6
Because the schooling variable changed in 1990, we calculate the number of completed years
8
7 To judge the sensitivity of our results to how we categorized the 1.37 percent of individuals whoselected multiple races, we tried alternative codings. Specifically, we tried running our regressionsfor whites counting anyone who selected white only and any other combination including white as“white” (and similarly for blacks and Asians). These alternative categorizations did notsubstantively change our results.
of schooling for 1990 and 2000 according to the recoding suggested by Park (1994). In addition,
in 1980 and 1990 we identify 5 racial groups–White, Black, Native American, Asian, and Other–as
well as people who identified themselves as Hispanic, regardless of their race. (Thus, the 6 racial
and ethnic groups are not mutually exclusive.) While in the 1980 and 1990 Censuses individuals
had to choose one race category, in the 2000 Census, individuals could choose multiple races. To
make the 2000 data as consistent as possible with the previous data, we grouped those who self-
identified as belonging to multiple racial groups into the “other” category.7 Finally, all estimates
using the U.S. Census are weighted by the individual weight assigned by the Census.
B. National Longitudinal Surveys: Young Men and Young Women Cohorts
Young Men and Young Women are two of the original cohorts of the National Longitudinal
Surveys (NLS). Each cohort was chosen to be representative of Americans aged 14 to 24 in the
initial survey year, 1966 for Young Men and 1968 for Young Women. Both include an over-sample
of African Americans. We combine the Young Men and Young Women cohorts from the 1978
surveys to create a single data set of 7440 individuals. We restrict our estimation sample to those
with hourly pay greater than one-half of the minimum wage in 2003 dollars and those who are not
self-employed, not enrolled in school, and not in the military. Once we exclude those in 1978 with
no hourly pay data and those with no information on highest grade completed, we are left with an
estimation sample of 4802. The weighted means and standard deviations of this full sample are
9
provided in Appendix Table 1a.
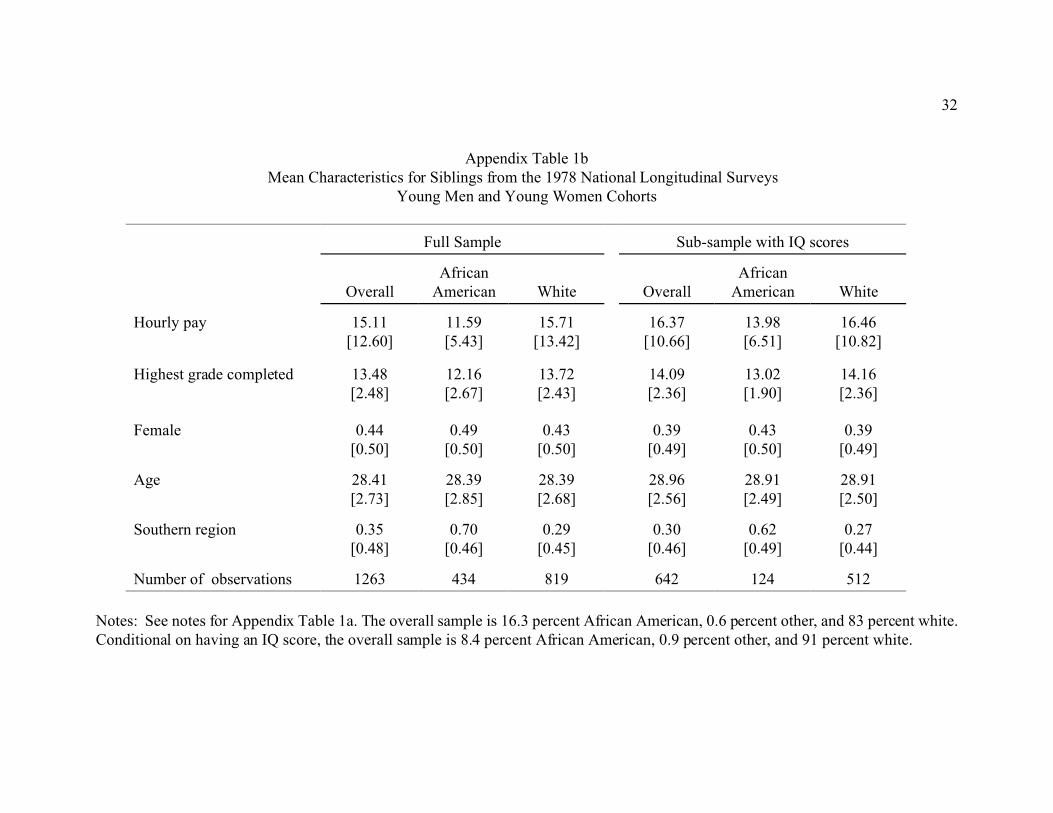
The NLS also provides information identifying respondent siblings who are also respondents
in the Young Men or Young Women cohorts. Based on this information, we were able to identify
567 families with multiple respondents (1263 respondents) in our estimation sample. If we further
restrict the sibling sample to have IQ scores we are left with 298 families (642 respondents). As
shown in Appendix Table 1b, on average the sibling sample is somewhat younger than the full
estimation sample. Otherwise, the mean characteristics are quite similar.
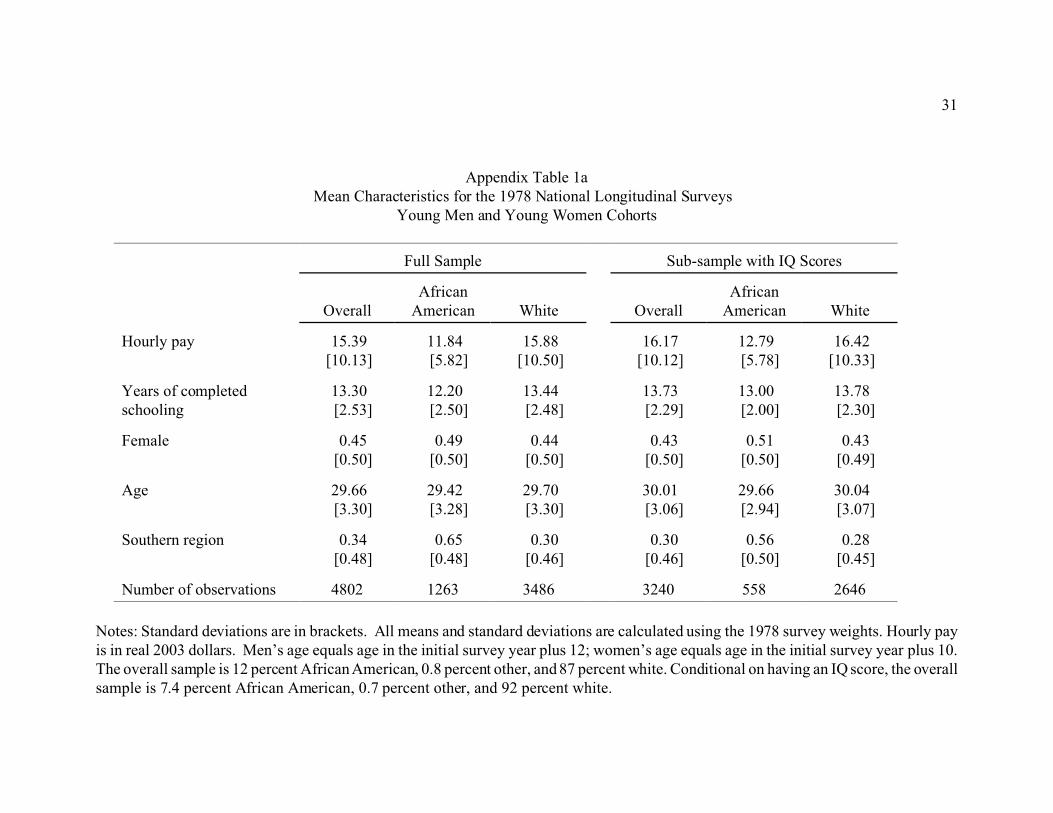
The last three columns in Appendix Tables 1a and 1b list descriptive statistics for the full and
sibling samples conditional on the respondents having a non-missing IQ score. The underlying test
scores used to construct the IQ score were only collected for individuals who had completed nine
years of schooling as of the initial survey year resulting in a non-random sample of respondents for
whom we have an IQ score. In particular, respondents with non-missing IQ scores are less likely to
be African American or live in the South and have higher average wages and more years of
schooling. Within the sibling sample, respondents with IQ scores are also more likely to be male.
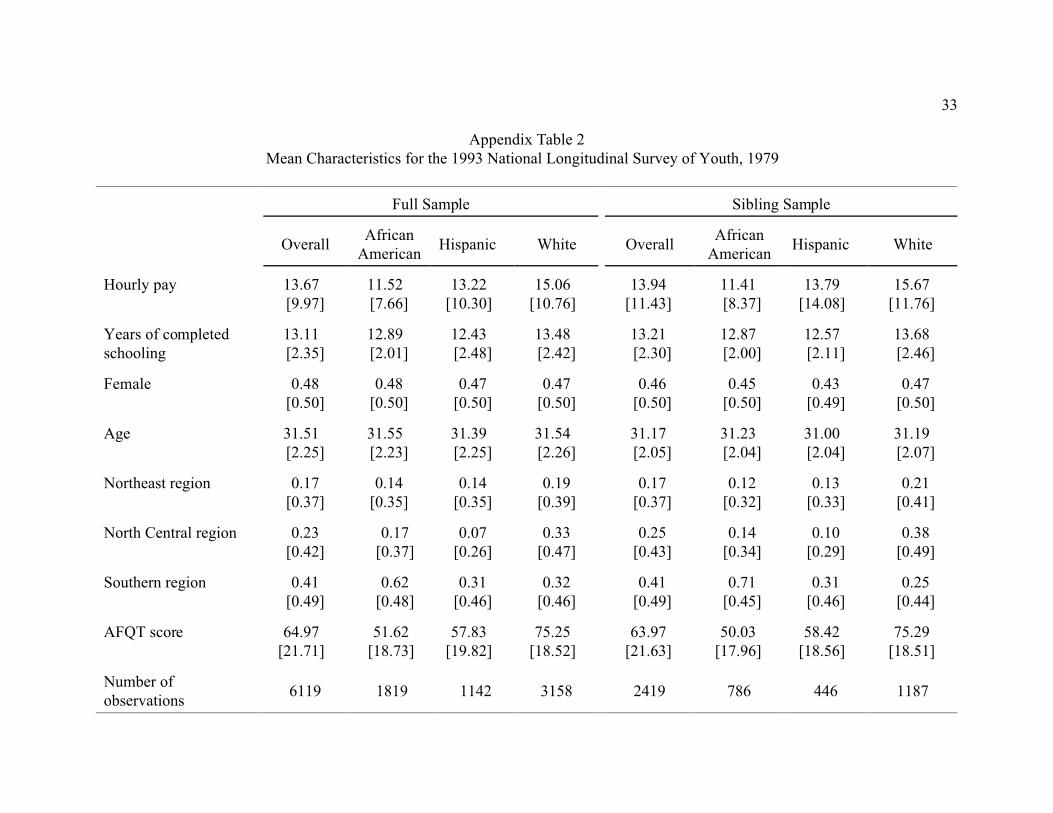
C. National Longitudinal Survey of Youth 1979 (NLSY79)
The National Longitudinal Survey of Youth 1979 (NLSY79) is a survey of youth aged 14 to
21 as of December 31, 1978 including a nationally representative sample of the civilian
noninstitutionalized youths, an over-sample of civilian Hispanic, black, and economically
disadvantaged non-black/non-Hispanic youth, and a small military sample of youths aged 17 to 21
10
8 Much of the military sample is dropped after 1984, and the supplemental sample ofeconomically disadvantaged youths is dropped after 1990.
9 For example, Herrnstein and Murray (1994) argue that the AFQT has many of the propertiesof an IQ test – the scores do not just reflect specific knowledge that has been learned in school,rather they reflect more general factors of “intelligence.” In contrast, Neal and Johnson (1996)argue that AFQT scores increase with years of schooling and therefore are not a good measure ofIQ. Others, such as Rodgers and Spriggs (1996), argue that the AFQT is a racially biased test.
10 In the estimates presented here, we simply control for AFQT and do not address the fact thatindividuals took the AFQT at different ages and had therefore completed differing years ofschooling. We have also estimated our models controlling for the individual’s education as of 1979with qualitatively similar results.
years.8 We use the 1993 survey of the NLSY79 in the analysis below and limit our sample to those
with hourly pay greater than one-half of the minimum wage in 1993 and less than $300 per hour,
as well as those who are not self-employed, enrolled in school or currently in the military.
An advantage of the NLSY79 is that in 1980 most survey participants were administered
the ASVAB (Armed Services Vocational Aptitude Battery), a basic skills test, from which it is
possible to construct an Armed Forces Qualification Test (AFQT) score. While researchers disagree
about whether AFQT scores mostly reflect “innate intelligence” or also reflect skills acquired in
school, most would agree that they reflect some information about the skills that individuals possess
at the time of the test.9 We use the AFQT as a measure of “observed” ability.10
As in the case of the NLS Young Men and Young Women surveys, many of the NLSY79
respondents have siblings who are also included in the survey. In 1979, 5914 of the civilian
respondents lived in a household with at least one other sibling (NLS Handbook, Table 3.2, p. 35).
And, in 1993 respondents were asked about their educational attainment as well as the educational
attainment of up to 13 of their siblings – whether or not these other siblings were respondents in the
11
11 Respondents were also asked a few other questions about their siblings (e.g., age, sex).
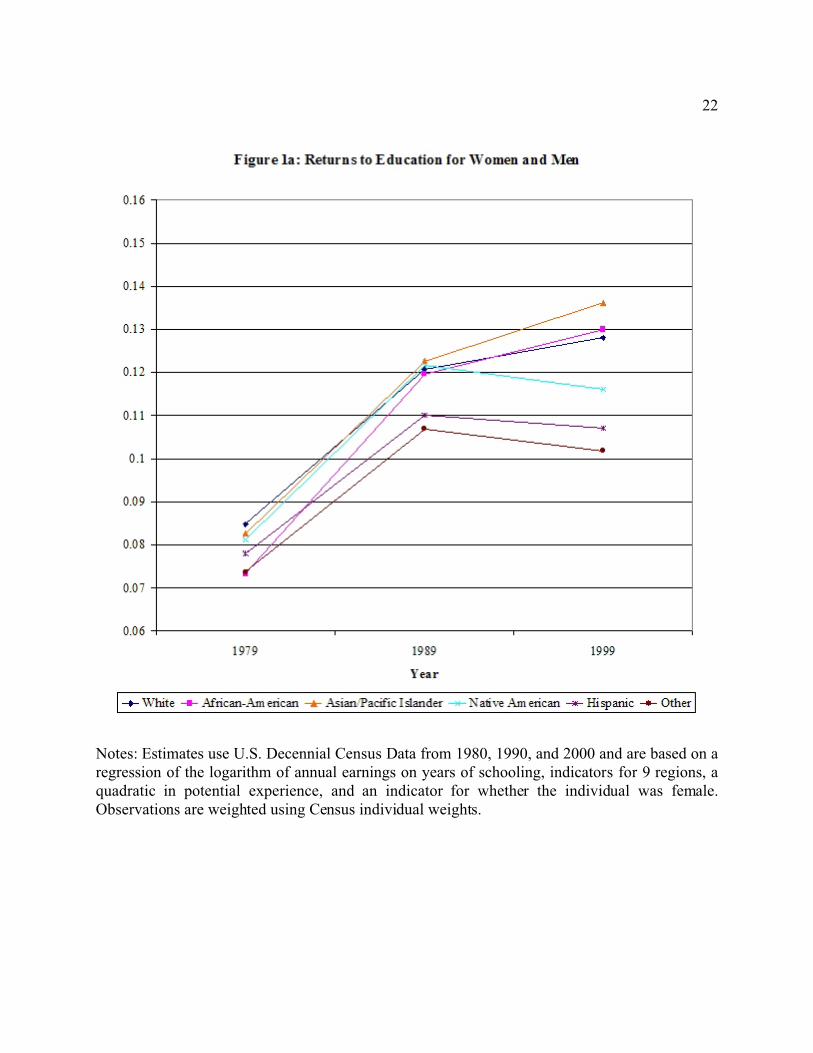
12 These returns to schooling were estimated from OLS regressions of the logarithm of annualearnings on years of schooling, indicators for 9 regions, a quadratic in potential experience, and inFigure 1a, an indicator for whether the individual was female. The regressions were weighted bythe Census weight.
original NLSY79.11 As a result, we can obtain own-reported and sibling-reported measures of a
respondent’s education level for those with siblings in the original NLSY79 sample who also
participated in the 1993 wave.
Once we additionally exclude those with no wage information and no information on
education, our “full sample” includes 6119 men and women between the ages of 28 and 36. Our
sibling sample contains information on 2419 individuals from 1062 households (for an average of
2.3 observations per household). Means and standard deviations for these samples are provided in
Appendix Table 2.
IV. Results
A. Results Using the Decennial Census
Using data from the Decennial Censuses allows us to get very precise estimates of the
relationship between education and wages by race and ethnicity. In addition, we look at how the
relationships have changed between 1979 and 1999 when there have been large increases in both
inequality and the returns to schooling. The primary drawback with the Census data is that we
cannot examine the potential for ability bias or measurement error problems.
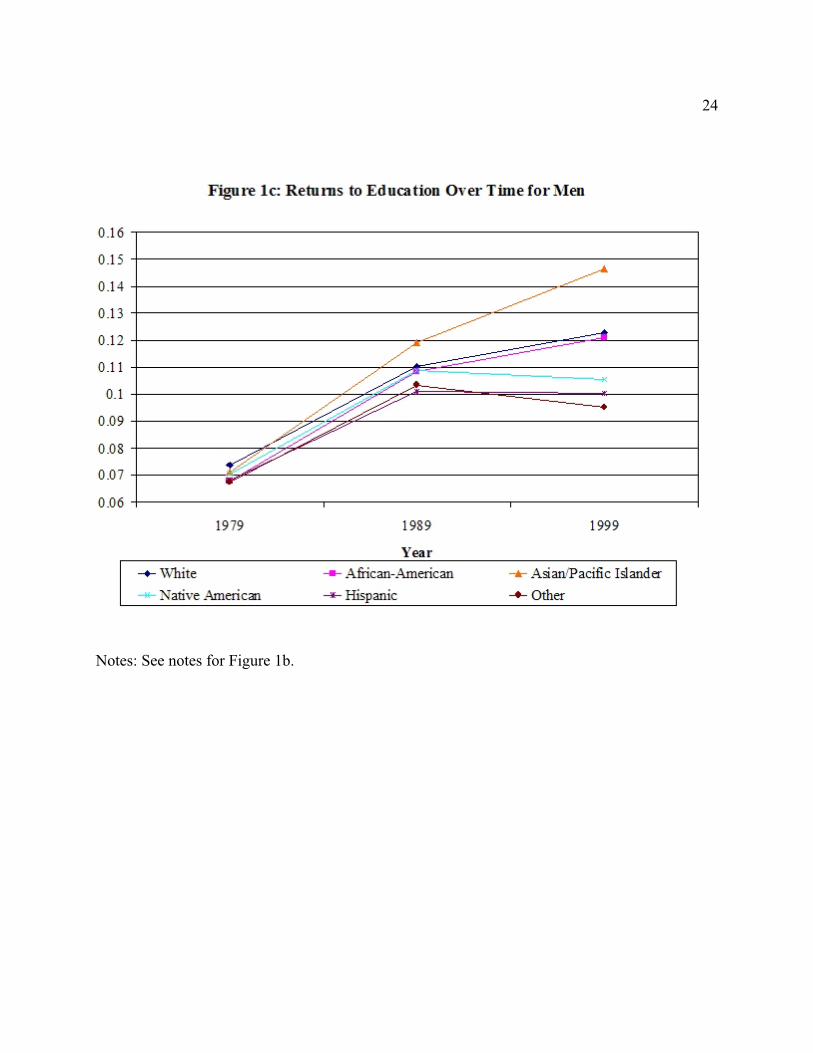
We present estimates of the returns to schooling for men and women by six race/ethnicity
categories in Figure 1a.12 In 1979, an additional year is associated with a 7.3 percent increase in
12
13 For an analysis of the change in returns to schooling by race and ethnicity between 1979 and2000 using the Current Population Survey see Bradbury (2002).
annual income for African Americans and a 8.5 percent increase in annual income for whites.
Between 1979 and 1989 the estimated return to schooling increased dramatically for all races –
especially African Americans – but remained in a relatively tight range from 10.7 percent for the
“other” category to 12.3 percent for Asians and Pacific Islanders. Between 1989 and 1999 there was
a much smaller increase in the estimated returns to education on average, but an increase in the
range of estimates (10.2 percent for “other to 13.6 percent for Asians and Pacific Islanders). As
shown in the contrast between Figures 1b (for women) and 1c (for men), this increase in the
variation in the returns to schooling by race/ethnicity is particularly true for men.13
Based on estimates of the returns to schooling using Census data, we would conclude that
the estimated return to schooling for African Americans is roughly the same as that for whites and
that the return for Hispanics is somewhat lower. While previous selection- and measurement error-
corrected estimates suggest OLS generates an estimate of the return to schooling that is roughly
“right” overall (because the selection and measurement error biases balance one another) (e.g.,
Ashenfelter and Rouse (1998)), we do not know if this “rule of thumb” holds by race and ethnicity.
B. Results Using the NLS Young Men and Young Women
Using the NLS Young Men and Young Women cohorts we can similarly estimate returns
to education overall and separately for whites and African Americans. While we cannot generate
estimates for any other racial or ethnic group, we can use the NLS measure of ability and

13
14 In addition, because the sample sizes are so small we cannot estimate the returns to schoolingfor men and women separately.
15 These specifications and those using the NLSY79 do not account for possible correlationsacross individuals within the same household. As a result the standard errors are conservative,although in the cross-sectional specifications allowing for such intra-household correlations makeslittle difference.
information on siblings to get some idea about the role of ability bias.14 Later, when we turn to the
NLSY79 cohort we will additionally be able to address measurement error issues.
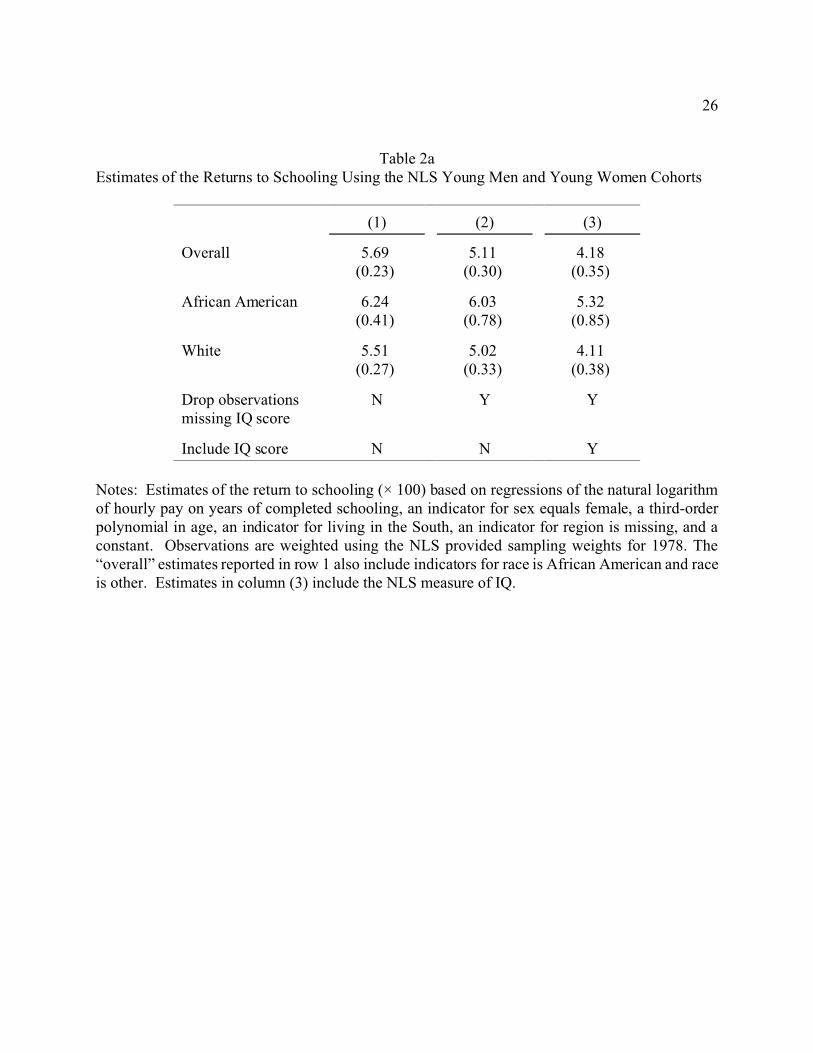
Table 2a provides various estimates of the return to schooling (× 100) overall and separately
for African Americans and whites using the NLS Young Men and Young Women cohorts. Each cell
represents estimates from a separate regression and each column represents estimates from a
different specification. All estimates are based on a regression of the natural logarithm of hourly
pay on years of completed education, a third-order polynomial in age, an indicator for whether the
individual is female, an indicator for whether the individual lives in the South, and a constant. We
weight observations using the 1978 sampling weights. Estimates for the overall sample (shown in
row 1) include indicators for whether the individual’s race is African American or other.15
Using the entire sample we estimate that an extra year of education increases hourly pay by
almost 6 percent. The separate estimates by race are quite similar. Although the estimate for
African Americans is somewhat higher than for whites, the difference is not statistically significant.
The estimates shown in column (1) of Table 2a do not control for the potential selection on ability
problem discussed above. Because IQ scores are missing for a nonrandom subset of the sample, the
estimates in column (2) are based on the sample of individuals who have an NLS measure of IQ but
do not include IQ score in the regression. In column (3) we control for ability by including the IQ
score in the regression. The column (2) estimates of the returns to education are somewhat smaller
14
16 Estimates that include IQ score but include an indicator for IQ score is missing are quite similarto the estimates shown in column (2). The coefficient (standard error) estimates are 5.06 (0.25)overall, 5.93 (0.44) for African Americans, and 4.86 (0.30) for whites.
at 5 percent, but once again we find no strong evidence that the returns to education differ between
African Americans and whites. Controlling for IQ score in column (3), we see some evidence that
indeed those who get more education are more able as the estimated returns to education decline by
almost one percentage point relative to the column (2) estimates.16 Note, however, there is a slightly
larger decline in the estimates between columns (2) and (3) for whites. This larger decrease may
be indicative of more selection on ability for whites or the IQ score may be a noisier measure of
ability for African Americans such that the column (3) estimates do not fully account for ability bias
for this subgroup.
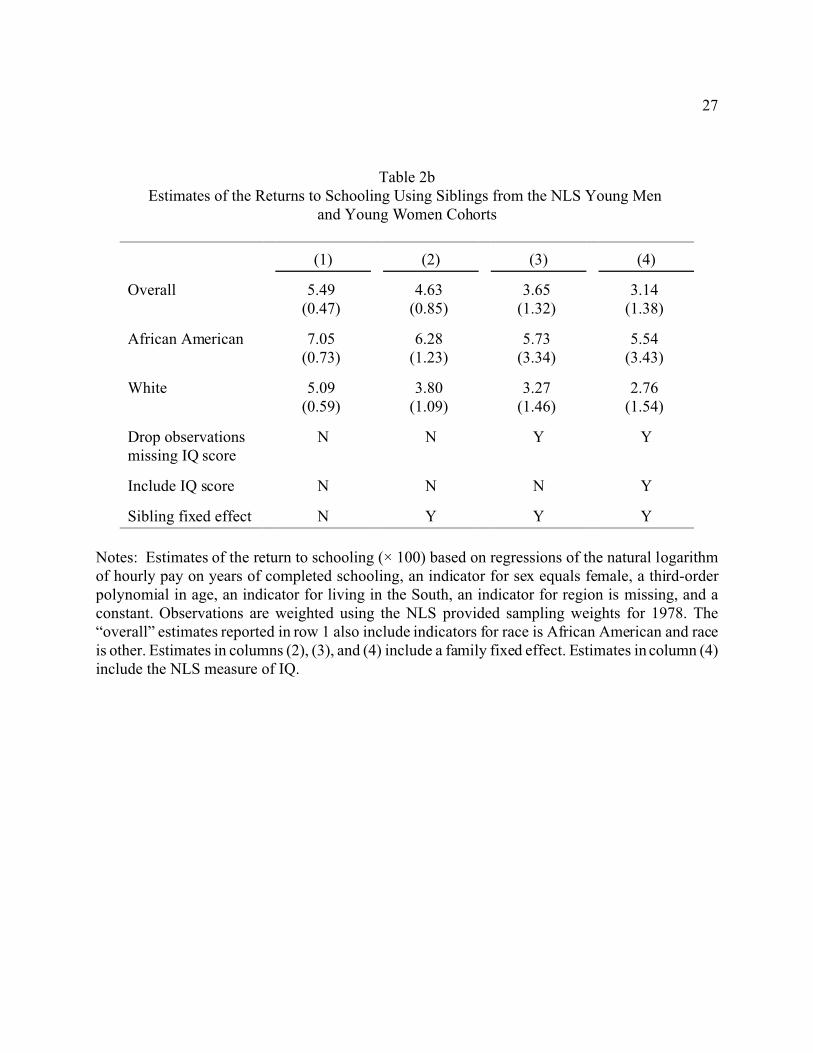
In Table 2b we turn to the NLS Young Men and Young Women sibling sample in order to
allow for sibling fixed effects as well. The results in column (1) are based on the sample of siblings
and are quite similar to the estimates based on the entire sample. The returns to education estimated
from the sibling sample is about 5.5 percent overall; the estimate for African Americans is higher
at roughly 7 percent although once again the difference is not statistically significant. When we
allow for a sibling fixed effect in the column (2) estimates, the estimates decline by 10 percent for
African Americans and 25 percent for whites. In column (3) we further restrict the sibling sample
to those with non-missing IQ scores but do not directly control for IQ score in the regression. Again
we see that the subsample with non-missing IQ scores is not a random subset of our estimation
sample. Returns to schooling estimates for African Americans and whites are again slightly lower
than for the full sibling sample. Finally, in column (4) we re-estimate returns to schooling while
controlling for ability with IQ score and allowing for a sibling fixed effect. The estimated return to
15
17 In the cross-sectional specifications, the standard errors using “cluster” are very similar to thosethat do not use allow for such intra-household correlations; the standard errors for the within-siblingspecifications presented in columns (5) and (6) in Table 3 are understated by about 50%.
schooling for African Americans is little changed by including IQ score once we have already
allowed for a sibling fixed effect. The estimate of the return to schooling for whites declines by 16
percent when controlling for a direct measure of ability.
In general we conclude from these surveys that the returns to schooling for African
Americans and whites are roughly equal, even after controlling for ability bias. However, using
these surveys we cannot correct for classical measurement error bias.
C. Results Using the NLSY79
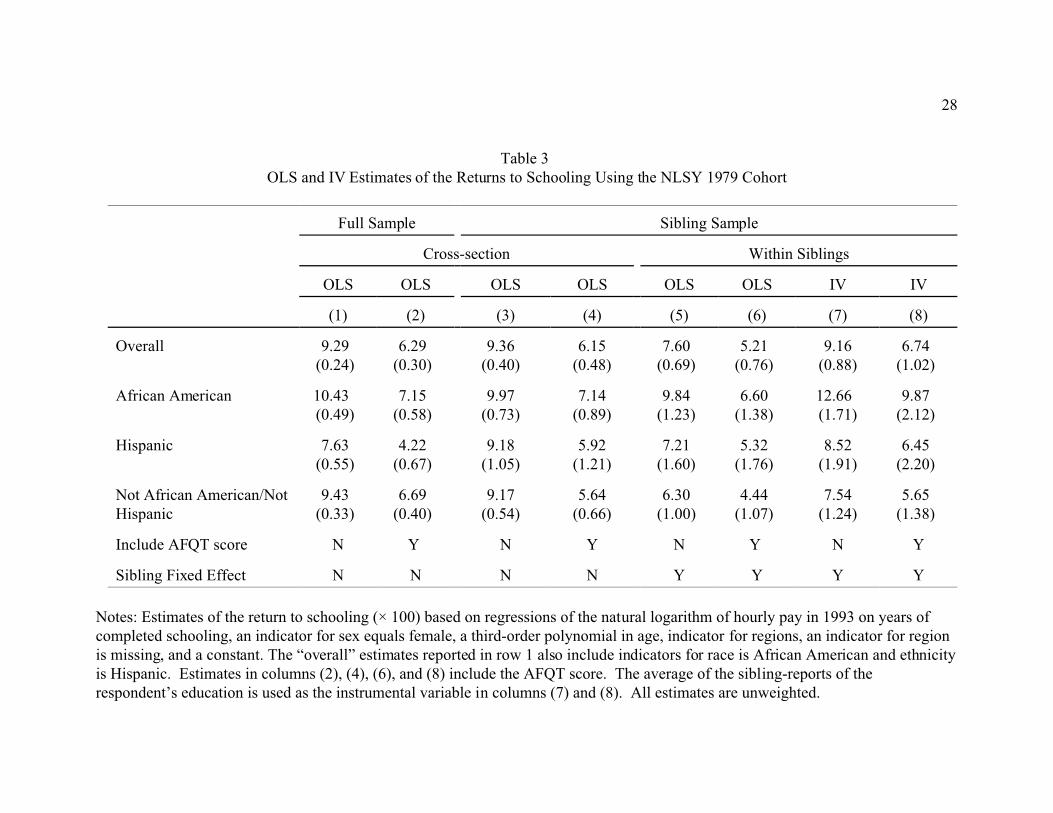
Estimates of the return to schooling using the NLSY79 are presented in Table 3 overall and
in Tables 4a and 4b for women and men separately. Each table has the following layout. Each cell
represents the return to schooling (× 100) from a separate regression. The basic specification is an
OLS regression of the natural logarithm of hourly pay on years of completed education, a third-order
polynomial in age, an indicator for whether the individual is female, indicators for four geographic
regions, and a constant. These regressions are unweighted, although results are similar if we weight.
Further, as with the analysis using the older NLS surveys, we do not cluster the standard errors on
the household such that the standard errors, especially those within sibling, are understated.17
Each column represents a different specification. The specifications in columns (1) and (2)
use the full sample; those in columns (3) - (8) are restricted to the sibling sample. The estimates in
the odd-numbered columns do not include the AFQT score while those in the even-numbered
columns do. The estimates in columns (5) - (8) control for a sibling fixed effect, and those in
16
columns (7) and (8) use the average of the sibling-reports of the respondent’s education as an
instrumental variable in an IV analysis. Thus, the estimates in columns (1) and (3) represent the
cross-sectional estimates and those in columns (2) and (4) address for selection bias by controlling
for the AFQT score. The estimates in column (5) control for selection by including a sibling fixed
effect; those in column (6) control for both a sibling fixed effect and the AFQT score; and the
estimates in columns (7) and (8) are similar to those in columns (5) and (6) but also correct for
measurement error.
In Table 3 we estimate an overall cross-sectional return to schooling of about 9 percent. The
estimate is highest among African Americans (10.4 percent) and lowest among Hispanics (7.6
percent). Only the estimated return for Hispanics is statistically different from that for the other two
groups. In general, controlling for selection by including an AFQT score decreases the cross-
sectional estimate of the return to schooling by about 3 percentage points (i.e., by comparing
columns (2) and (1) or columns (4) and (3)). However, while controlling for the AFQT makes the
biggest difference for the estimated returns to schooling (i.e., decreases the coefficient by the most)
for African Americans and Hispanics in the full sample (columns (1) and (2)), it makes the biggest
difference for non-minorities in the sibling sample (columns (3) and (4)). Overall, based on the
cross-sectional estimates, we find little difference in the return to schooling by race/ethnicity.
Estimates that account for a sibling fixed effect are presented in columns (5) - (8). As also
found with the older NLS surveys, a comparison of the estimates in columns (3) and (5) (or columns
(4) and (6)) suggest that controlling for a sibling fixed effect makes a bigger difference for non-
minorities than for minorities, especially African Americans. In fact, the within-sibling estimate of
the return to schooling for African Americans is at most 1percentage point lower than the cross-
17
18 As evidence consistent with this explanation, the within-sibling coefficients in column (6) (thatcontrol for AFQT) decrease the most relative to column (5) (that do not control for AFQT) forAfrican Americans. This pattern of results would be expected if the AFQT controls for other aspectsof “ability” that are not captured by the sibling fixed effect.
19 In results not presented here, we have also estimated these specifications using annual earningsrather than hourly wages. While the estimated returns to schooling are alittle higher, there are nodifferences by race or ethnicity.
sectional estimate. The fact that controlling for siblings makes a smaller difference for minorities
than non-minorities may reflect less selection bias in the cross-sectional returns to schooling. Or,
it may suggest that controlling for a sibling fixed effect is less effective for some populations than
others. Why might this occur? While we limit our sample to “siblings” (excluding other household
relationships, such as spouses, parents, foster siblings, step-siblings, and adopted siblings), we
cannot distinguish between “full siblings” and “half-siblings.” If African Americans and Hispanics
are more likely to live with half-siblings than are non-minorities, then the family fixed effect may
not be a good proxy for unobserved family “ability.”18
Finally, the overall measurement error corrected (IV) estimate of the within-sibling return
to schooling increases to 9.16 percent in column (7) relative to an estimate of 7.6 percent in column
(5) suggesting an attenuation bias of about 20 percent. Further, we find that correcting for
measurement error has the greatest effect on the estimated returns to schooling for African
Americans, as expected based on the reliability ratios in Table 1. Generally, while we continue to
estimate a larger point estimate for African Americans than for Hispanics and non-minorities, the
differences across race/ethnicity are not statistically significant.19
While we find that returns to schooling, overall, do not appear to vary much by race or
ethnicity, in Tables 4a and 4b we examine whether this pattern also holds separately for men and
18
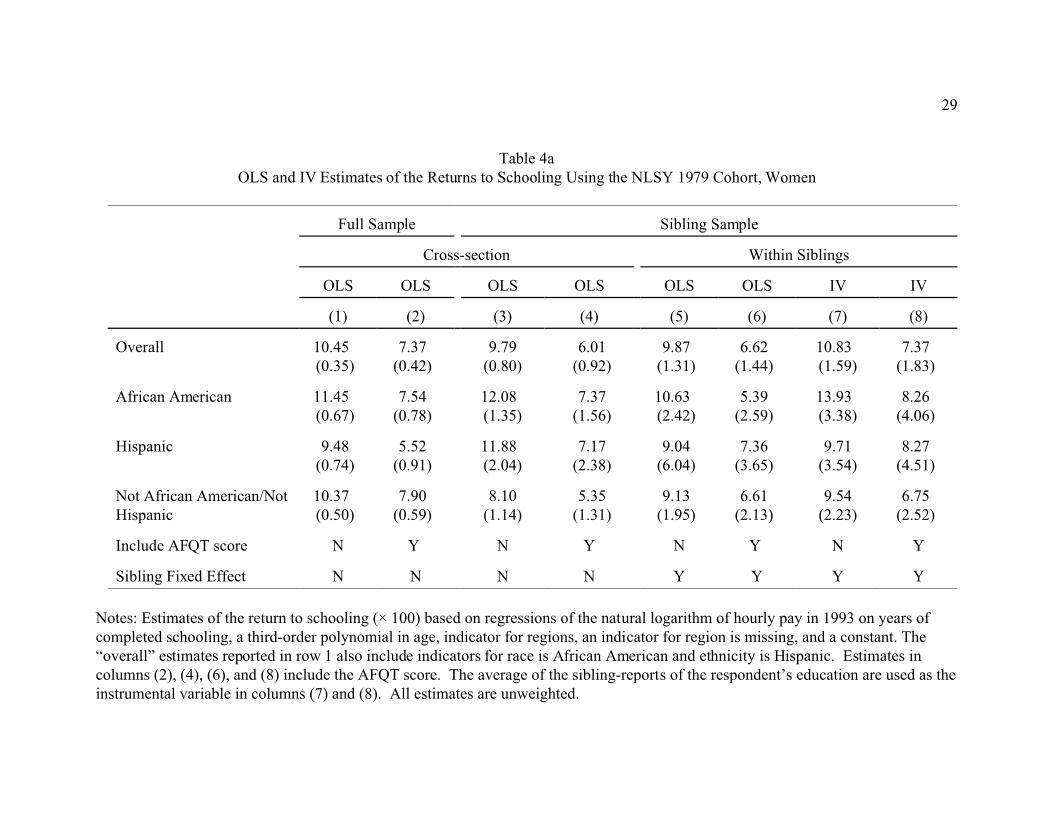
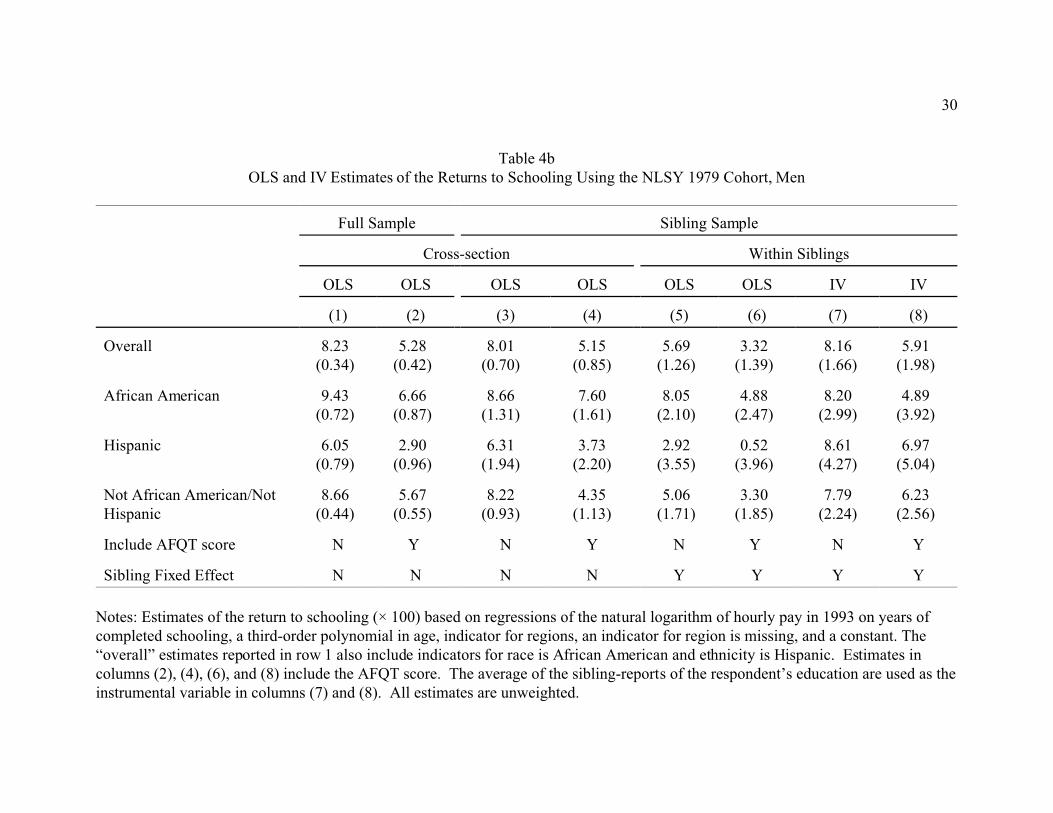
women. The results for women are reported in Table 4a and those for men in Table 4b. These tables
have a similar structure to Table 3. We continue to estimate no significant differences in the returns
to schooling across African Americans, Hispanics, and non-minorities for both men and women.
While this result may partially obtain because of smaller sample sizes (resulting in less precise
estimates), the point estimates are also quite similar.
V. Conclusion
Alarmed by the increasing wage and income inequality in the U.S., many researchers and
policymakers who are concerned that low-income individuals are losing ground have turned to
policies aimed at increasing educational attainment. And because African Americans and Hispanics
are disproportionately among the low-income, they are also disproportionately the focus of such
policies. Yet, we know little about the magnitude of the economic benefit from the increased
education for these subgroups of the population. Using data from the Census and the National
Longitudinal Surveys, we find little evidence of differences in the return to schooling across racial
and ethnic groups, even with attempts to control for ability and measurement error biases. While
we find point estimates that are relatively similar across racial and ethnic groups, we also partly
conclude this because of relatively large standard errors in some specifications due to small sample
sizes. That said, we find no evidence that returns to schooling are lower for African Americans or
Hispanics than for non-minorities. As a result, policies that increase education among the low-
skilled have a good possibility of increasing economic well-being and reducing inequality.
We find some evidence that measurement error and selection bias may differ by race and
ethnicity. For example, self-reported levels of schooling are “noisier” for African Americans than
19
for other groups. And, we find less evidence of ability bias among African Americans and Hispanics
than among non-minorities. The finding of less ability bias among minorities may arise because
there is indeed less selection among these groups. Or, estimators that attempt to address self-
selection may be less effective for some subgroups. More generally, our analysis suggests further
research is needed to better understand the nature of measurement error and ability bias across
subgroups in order to fully understand potential heterogeneity in the return to schooling across the
population.
20
References
Altonji, Joseph and Thomas Dunn. “The Effects of Family Characteristics on the Return toEducation.” Review of Economics and Statistics, 78 (1996), 692-704.
Angrist, Joshua D. and Alan B. Krueger. “Does Compulsory Schooling Affect Schooling andEarnings?” Quarterly Journal of Economics, vol. 106 (November 1991): 979-1014.
Ashenfelter, Orley and John Ham. “Education, Unemployment, and Earnings.” Journal of PoliticalEconomy 87 (October 1979), no. 5 part 2: S99-S116.
Ashenfelter, Orley and Alan Krueger. “Estimating the Returns to Schooling Using a New Sampleof Twins.” American Economic Review 84 (December 1994): 1157-1173.
Ashenfelter, Orley and Cecilia Rouse. “Schooling, Intelligence, and Income in America” inKenneth Arrow, Samuel Bowles, and Steven Durlauf, eds. Meritocracy and EconomicInequality, Princeton, NJ: Princeton University Press, 2000, 89-117.
Ashenfelter, Orley and Cecilia Rouse. “Income, Schooling, and Ability: Evidence from a NewSample of Twins.” Quarterly Journal of Economics 113 no. 1 (February 1998), pp. 253-284.
Becker, Gary S. Human Capital: A Theoretical and Empirical Analysis, with Special Refernce toEducation. New York: Columbia University Press, 1967.
Bradbury, Katharine L. “Education and Wages in the 1980s and 1990s: Are All Groups Moving UpTogether?” New England Economic Review, First quarter 2002, pp. 19-46.
Bureau of Labor Statistics, U.S. Department of Labor. NLS Handbook, 2003. Retrieved January 13,2005, from http://www.bls.gov/nls/handbook/nlshpdf.htm.
Card, David. “Earnings, Schooling, and Ability Revisited” in Solomon Polachek, ed., Research inLabor Economics, Greenwich, CT: JAI Press (1995), 23-48.
Card, David, “Estimating the Return to Schooling: Progress on Some Persistent EconometricProblems,” Econometrica 69, no. 5 (September 2001): 1127-1160.
Carneiro, Pedro and James J. Heckman. “Human Capital Policy” in Inequality in America: WhatRole for Human Capital Policies? Benjamin M. Friedman (ed.) (Cambridge, MA: The MITPress, 2003), pp. 77-239.
Carneiro, Pedro, James J. Heckman, and Edward Vytlacil. “Understanding What InstrumentalVariables Estimate: Estimating Marginal and Average Returns to Education.” Universityof Chicago working paper, 2003.
21
Chamberlain, Gary and Zvi Griliches. “Unobservables with a Variance-Components Structure:Ability, Schooling and the Economic Success of Brothers.” International Economic Review16 (June 1975): 422-449.
Chamberlain, Gary and Zvi Griliches. “More on Brothers.” In Kinometrics: The Determinants ofSocio-economic Success within and between Families, edited by Paul Taubman.(Amsterdam: North-Holland), 1977.
Gorseline, D.W. The Effect of Schooling Upon Income. (Bloomington: Indiana University Press),1932.
Griliches, Zvi. “Estimating the Returns to Schooling: Some Econometric Problems.”Econometrica 45, no. 1 (January 1977): 1-22.
Herrnstein, Richard J. and Charles Murray. The Bell Curve: Intelligence and Class Structure inAmerican Life (New York: The Free Press), 1994.
Kane, Thomas, Cecilia Rouse, and Douglas Staiger. “Estimating the Returns to Schooling WhenSchooling is Misreported” National Bureau of Economic Research Working Paper No. 7235,July 1999.
Krueger, Alan. “Inequality, Too Much of a Good Thing” in Inequality in America: What Role forHuman Capital Policies? Benjamin M. Friedman (ed.) (Cambridge, MA: The MIT Press,2003), pp. 1-75.
Mincer, Jacob. Schooling, Experience, and Earnings (New York: Columbia UniversityPress), 1974.
Neal, Derek A., and William A. Johnson. “The Role of Pre-Market Factors in Black-White WageDifferences.” Journal of Political Economy 104 (October 1996), pp. 869-895.
Park, Jin Huem. “Estimation of Sheepskin Effects and Returns to Schooling Using the Old and theNew CPS Measures of Educational Attainment.” Industrial Relations Section Working Paper#338 (August 1994).
Rodgers, William and William Spriggs. “What Does AFQT Really Measure: Race, Wages,Schooling and the AFQT Score.” The Review of Black Political Economy, 24 (1996), pp.13-46.
Taber, Christopher. “The Rising College Premium in the Eighties: Return to College or Return toUnobserved Ability?” Review of Economic Studies 68, no. 3 (July 2001), pp. 665-691.
22
Notes: Estimates use U.S. Decennial Census Data from 1980, 1990, and 2000 and are based on aregression of the logarithm of annual earnings on years of schooling, indicators for 9 regions, aquadratic in potential experience, and an indicator for whether the individual was female.Observations are weighted using Census individual weights.

23
Notes: Estimates use U.S. Decennial Census Data from 1980, 1990, and 2000 and are based on aregression of the logarithm of annual earnings on years of schooling, indicators for 9 regions, anda quadratic in potential experience. Observations are weighted using Census individual weights.
24
Notes: See notes for Figure 1b.

25
Table 1Estimated Reliability Ratios for Schooling Levels and Within-Siblings,
by Race, Ethnicity, and Sex of Individual
Levels Within-sibling
All
All 0.89 0.74
African American 0.81 0.67
Hispanic 0.86 0.77
Not African American/Not Hispanic 0.92 0.78
Women
All 0.88 0.76
African American 0.83 0.68
Hispanic 0.82 0.76
Not African American/Not Hispanic 0.91 0.81
Men
All 0.89 0.73
African American 0.79 0.65
Hispanic 0.88 0.77
Not African American/Not Hispanic 0.92 0.76
Note: Estimates are based on sibling data from the NLSY79. The within-sibling education is thedeviation of the individual’s schooling level from the mean education of his or her siblings.
26
Table 2aEstimates of the Returns to Schooling Using the NLS Young Men and Young Women Cohorts
(1) (2) (3)
Overall 5.69(0.23)
5.11(0.30)
4.18(0.35)
African American 6.24(0.41)
6.03(0.78)
5.32(0.85)
White 5.51(0.27)
5.02(0.33)
4.11(0.38)
Drop observationsmissing IQ score
N Y Y
Include IQ score N N Y
Notes: Estimates of the return to schooling (× 100) based on regressions of the natural logarithmof hourly pay on years of completed schooling, an indicator for sex equals female, a third-orderpolynomial in age, an indicator for living in the South, an indicator for region is missing, and aconstant. Observations are weighted using the NLS provided sampling weights for 1978. The“overall” estimates reported in row 1 also include indicators for race is African American and raceis other. Estimates in column (3) include the NLS measure of IQ.
27
Table 2bEstimates of the Returns to Schooling Using Siblings from the NLS Young Men
and Young Women Cohorts
(1) (2) (3) (4)
Overall 5.49(0.47)
4.63(0.85)
3.65(1.32)
3.14(1.38)
African American 7.05(0.73)
6.28(1.23)
5.73(3.34)
5.54(3.43)
White 5.09(0.59)
3.80(1.09)
3.27(1.46)
2.76(1.54)
Drop observationsmissing IQ score
N N Y Y
Include IQ score N N N Y
Sibling fixed effect N Y Y Y
Notes: Estimates of the return to schooling (× 100) based on regressions of the natural logarithmof hourly pay on years of completed schooling, an indicator for sex equals female, a third-orderpolynomial in age, an indicator for living in the South, an indicator for region is missing, and aconstant. Observations are weighted using the NLS provided sampling weights for 1978. The“overall” estimates reported in row 1 also include indicators for race is African American and raceis other. Estimates in columns (2), (3), and (4) include a family fixed effect. Estimates in column (4)include the NLS measure of IQ.
28
Table 3 OLS and IV Estimates of the Returns to Schooling Using the NLSY 1979 Cohort
Full Sample Sibling Sample
Cross-section Within Siblings
OLS OLS OLS OLS OLS OLS IV IV
(1) (2) (3) (4) (5) (6) (7) (8)
Overall 9.29(0.24)
6.29(0.30)
9.36(0.40)
6.15(0.48)
7.60(0.69)
5.21(0.76)
9.16(0.88)
6.74(1.02)
African American 10.43(0.49)
7.15(0.58)
9.97(0.73)
7.14(0.89)
9.84(1.23)
6.60(1.38)
12.66(1.71)
9.87(2.12)
Hispanic 7.63(0.55)
4.22(0.67)
9.18(1.05)
5.92(1.21)
7.21(1.60)
5.32(1.76)
8.52(1.91)
6.45(2.20)
Not African American/NotHispanic
9.43(0.33)
6.69(0.40)
9.17(0.54)
5.64(0.66)
6.30(1.00)
4.44(1.07)
7.54(1.24)
5.65(1.38)
Include AFQT score N Y N Y N Y N Y
Sibling Fixed Effect N N N N Y Y Y Y
Notes: Estimates of the return to schooling (× 100) based on regressions of the natural logarithm of hourly pay in 1993 on years ofcompleted schooling, an indicator for sex equals female, a third-order polynomial in age, indicator for regions, an indicator for regionis missing, and a constant. The “overall” estimates reported in row 1 also include indicators for race is African American and ethnicityis Hispanic. Estimates in columns (2), (4), (6), and (8) include the AFQT score. The average of the sibling-reports of therespondent’s education is used as the instrumental variable in columns (7) and (8). All estimates are unweighted.
29
Table 4aOLS and IV Estimates of the Returns to Schooling Using the NLSY 1979 Cohort, Women
Full Sample Sibling Sample
Cross-section Within Siblings
OLS OLS OLS OLS OLS OLS IV IV
(1) (2) (3) (4) (5) (6) (7) (8)
Overall 10.45(0.35)
7.37(0.42)
9.79(0.80)
6.01(0.92)
9.87(1.31)
6.62(1.44)
10.83(1.59)
7.37(1.83)
African American 11.45(0.67)
7.54(0.78)
12.08(1.35)
7.37(1.56)
10.63(2.42)
5.39(2.59)
13.93(3.38)
8.26(4.06)
Hispanic 9.48(0.74)
5.52(0.91)
11.88(2.04)
7.17(2.38)
9.04 (6.04)
7.36(3.65)
9.71(3.54)
8.27(4.51)
Not African American/NotHispanic
10.37(0.50)
7.90(0.59)
8.10(1.14)
5.35(1.31)
9.13(1.95)
6.61(2.13)
9.54(2.23)
6.75(2.52)
Include AFQT score N Y N Y N Y N Y
Sibling Fixed Effect N N N N Y Y Y Y
Notes: Estimates of the return to schooling (× 100) based on regressions of the natural logarithm of hourly pay in 1993 on years ofcompleted schooling, a third-order polynomial in age, indicator for regions, an indicator for region is missing, and a constant. The“overall” estimates reported in row 1 also include indicators for race is African American and ethnicity is Hispanic. Estimates incolumns (2), (4), (6), and (8) include the AFQT score. The average of the sibling-reports of the respondent’s education are used as theinstrumental variable in columns (7) and (8). All estimates are unweighted.
30
Table 4bOLS and IV Estimates of the Returns to Schooling Using the NLSY 1979 Cohort, Men
Full Sample Sibling Sample
Cross-section Within Siblings
OLS OLS OLS OLS OLS OLS IV IV
(1) (2) (3) (4) (5) (6) (7) (8)
Overall 8.23(0.34)
5.28(0.42)
8.01(0.70)
5.15(0.85)
5.69(1.26)
3.32(1.39)
8.16(1.66)
5.91(1.98)
African American 9.43(0.72)
6.66(0.87)
8.66(1.31)
7.60(1.61)
8.05(2.10)
4.88(2.47)
8.20(2.99)
4.89(3.92)
Hispanic 6.05(0.79)
2.90(0.96)
6.31(1.94)
3.73(2.20)
2.92(3.55)
0.52 (3.96)
8.61(4.27)
6.97(5.04)
Not African American/NotHispanic
8.66(0.44)
5.67(0.55)
8.22(0.93)
4.35(1.13)
5.06(1.71)
3.30(1.85)
7.79(2.24)
6.23(2.56)
Include AFQT score N Y N Y N Y N Y
Sibling Fixed Effect N N N N Y Y Y Y
Notes: Estimates of the return to schooling (× 100) based on regressions of the natural logarithm of hourly pay in 1993 on years ofcompleted schooling, a third-order polynomial in age, indicator for regions, an indicator for region is missing, and a constant. The“overall” estimates reported in row 1 also include indicators for race is African American and ethnicity is Hispanic. Estimates incolumns (2), (4), (6), and (8) include the AFQT score. The average of the sibling-reports of the respondent’s education are used as theinstrumental variable in columns (7) and (8). All estimates are unweighted.
31
Appendix Table 1aMean Characteristics for the 1978 National Longitudinal Surveys
Young Men and Young Women Cohorts
Full Sample Sub-sample with IQ Scores
OverallAfrican
American White OverallAfrican
American White
Hourly pay 15.39[10.13]
11.84[5.82]
15.88[10.50]
16.17[10.12]
12.79[5.78]
16.42[10.33]
Years of completedschooling
13.30[2.53]
12.20[2.50]
13.44[2.48]
13.73[2.29]
13.00[2.00]
13.78[2.30]
Female 0.45[0.50]
0.49[0.50]
0.44[0.50]
0.43[0.50]
0.51[0.50]
0.43[0.49]
Age 29.66[3.30]
29.42[3.28]
29.70[3.30]
30.01[3.06]
29.66[2.94]
30.04[3.07]
Southern region 0.34[0.48]
0.65[0.48]
0.30[0.46]
0.30[0.46]
0.56[0.50]
0.28[0.45]
Number of observations 4802 1263 3486 3240 558 2646
Notes: Standard deviations are in brackets. All means and standard deviations are calculated using the 1978 survey weights. Hourly payis in real 2003 dollars. Men’s age equals age in the initial survey year plus 12; women’s age equals age in the initial survey year plus 10.The overall sample is 12 percent African American, 0.8 percent other, and 87 percent white. Conditional on having an IQ score, the overallsample is 7.4 percent African American, 0.7 percent other, and 92 percent white.
32
Appendix Table 1bMean Characteristics for Siblings from the 1978 National Longitudinal Surveys
Young Men and Young Women Cohorts
Full Sample Sub-sample with IQ scores
OverallAfrican
American White OverallAfrican
American White
Hourly pay 15.11[12.60]
11.59[5.43]
15.71[13.42]
16.37[10.66]
13.98[6.51]
16.46[10.82]
Highest grade completed 13.48[2.48]
12.16[2.67]
13.72[2.43]
14.09[2.36]
13.02[1.90]
14.16[2.36]
Female 0.44[0.50]
0.49[0.50]
0.43[0.50]
0.39[0.49]
0.43[0.50]
0.39[0.49]
Age 28.41[2.73]
28.39[2.85]
28.39[2.68]
28.96[2.56]
28.91[2.49]
28.91[2.50]
Southern region 0.35[0.48]
0.70[0.46]
0.29[0.45]
0.30[0.46]
0.62[0.49]
0.27[0.44]
Number of observations 1263 434 819 642 124 512
Notes: See notes for Appendix Table 1a. The overall sample is 16.3 percent African American, 0.6 percent other, and 83 percent white.Conditional on having an IQ score, the overall sample is 8.4 percent African American, 0.9 percent other, and 91 percent white.
33
Appendix Table 2Mean Characteristics for the 1993 National Longitudinal Survey of Youth, 1979
Full Sample Sibling Sample
OverallAfrican
AmericanHispanic White Overall
AfricanAmerican
Hispanic White
Hourly pay 13.67[9.97]
11.52[7.66]
13.22[10.30]
15.06[10.76]
13.94[11.43]
11.41[8.37]
13.79 [14.08]
15.67[11.76]
Years of completedschooling
13.11[2.35]
12.89[2.01]
12.43[2.48]
13.48[2.42]
13.21[2.30]
12.87[2.00]
12.57[2.11]
13.68[2.46]
Female 0.48[0.50]
0.48[0.50]
0.47[0.50]
0.47[0.50]
0.46[0.50]
0.45[0.50]
0.43[0.49]
0.47[0.50]
Age 31.51[2.25]
31.55[2.23]
31.39[2.25]
31.54[2.26]
31.17[2.05]
31.23[2.04]
31.00[2.04]
31.19[2.07]
Northeast region 0.17[0.37]
0.14[0.35]
0.14[0.35]
0.19[0.39]
0.17[0.37]
0.12[0.32]
0.13[0.33]
0.21[0.41]
North Central region 0.23 [0.42]
0.17[0.37]
0.07[0.26]
0.33[0.47]
0.25 [0.43]
0.14[0.34]
0.10[0.29]
0.38[0.49]
Southern region 0.41[0.49]
0.62[0.48]
0.31[0.46]
0.32[0.46]
0.41[0.49]
0.71[0.45]
0.31[0.46]
0.25[0.44]
AFQT score 64.97[21.71]
51.62[18.73]
57.83[19.82]
75.25[18.52]
63.97[21.63]
50.03[17.96]
58.42[18.56]
75.29[18.51]
Number ofobservations
6119 1819 1142 3158 2419 786 446 1187

34
Notes: Standard deviations are in brackets. All means and standard deviations are calculated using the 1993 survey weights. Hourlypay is in real 2003 dollars. Age equals age in the initial survey year plus 14.
Working Paper Series
A series of research studies on regional economic issues relating to the Seventh Federal Reserve District, and on financial and economic topics.
Outsourcing Business Services and the Role of Central Administrative Offices WP-02-01 Yukako Ono Strategic Responses to Regulatory Threat in the Credit Card Market* WP-02-02 Victor Stango The Optimal Mix of Taxes on Money, Consumption and Income WP-02-03 Fiorella De Fiore and Pedro Teles Expectation Traps and Monetary Policy WP-02-04 Stefania Albanesi, V. V. Chari and Lawrence J. Christiano Monetary Policy in a Financial Crisis WP-02-05 Lawrence J. Christiano, Christopher Gust and Jorge Roldos Regulatory Incentives and Consolidation: The Case of Commercial Bank Mergers and the Community Reinvestment Act WP-02-06 Raphael Bostic, Hamid Mehran, Anna Paulson and Marc Saidenberg Technological Progress and the Geographic Expansion of the Banking Industry WP-02-07 Allen N. Berger and Robert DeYoung Choosing the Right Parents: Changes in the Intergenerational Transmission WP-02-08 of Inequality Between 1980 and the Early 1990s David I. Levine and Bhashkar Mazumder The Immediacy Implications of Exchange Organization WP-02-09 James T. Moser Maternal Employment and Overweight Children WP-02-10 Patricia M. Anderson, Kristin F. Butcher and Phillip B. Levine The Costs and Benefits of Moral Suasion: Evidence from the Rescue of WP-02-11 Long-Term Capital Management Craig Furfine On the Cyclical Behavior of Employment, Unemployment and Labor Force Participation WP-02-12 Marcelo Veracierto Do Safeguard Tariffs and Antidumping Duties Open or Close Technology Gaps? WP-02-13 Meredith A. Crowley Technology Shocks Matter WP-02-14 Jonas D. M. Fisher Money as a Mechanism in a Bewley Economy WP-02-15 Edward J. Green and Ruilin Zhou
1
Working Paper Series (continued) Optimal Fiscal and Monetary Policy: Equivalence Results WP-02-16 Isabel Correia, Juan Pablo Nicolini and Pedro Teles Real Exchange Rate Fluctuations and the Dynamics of Retail Trade Industries WP-02-17 on the U.S.-Canada Border Jeffrey R. Campbell and Beverly Lapham Bank Procyclicality, Credit Crunches, and Asymmetric Monetary Policy Effects: WP-02-18 A Unifying Model Robert R. Bliss and George G. Kaufman Location of Headquarter Growth During the 90s WP-02-19 Thomas H. Klier The Value of Banking Relationships During a Financial Crisis: WP-02-20 Evidence from Failures of Japanese Banks Elijah Brewer III, Hesna Genay, William Curt Hunter and George G. Kaufman On the Distribution and Dynamics of Health Costs WP-02-21 Eric French and John Bailey Jones The Effects of Progressive Taxation on Labor Supply when Hours and Wages are WP-02-22 Jointly Determined Daniel Aaronson and Eric French Inter-industry Contagion and the Competitive Effects of Financial Distress Announcements: WP-02-23 Evidence from Commercial Banks and Life Insurance Companies Elijah Brewer III and William E. Jackson III State-Contingent Bank Regulation With Unobserved Action and WP-02-24 Unobserved Characteristics David A. Marshall and Edward Simpson Prescott Local Market Consolidation and Bank Productive Efficiency WP-02-25 Douglas D. Evanoff and Evren Örs Life-Cycle Dynamics in Industrial Sectors. The Role of Banking Market Structure WP-02-26 Nicola Cetorelli Private School Location and Neighborhood Characteristics WP-02-27 Lisa Barrow Teachers and Student Achievement in the Chicago Public High Schools WP-02-28 Daniel Aaronson, Lisa Barrow and William Sander The Crime of 1873: Back to the Scene WP-02-29 François R. Velde Trade Structure, Industrial Structure, and International Business Cycles WP-02-30 Marianne Baxter and Michael A. Kouparitsas Estimating the Returns to Community College Schooling for Displaced Workers WP-02-31 Louis Jacobson, Robert LaLonde and Daniel G. Sullivan
2

Working Paper Series (continued) A Proposal for Efficiently Resolving Out-of-the-Money Swap Positions WP-03-01 at Large Insolvent Banks George G. Kaufman Depositor Liquidity and Loss-Sharing in Bank Failure Resolutions WP-03-02 George G. Kaufman Subordinated Debt and Prompt Corrective Regulatory Action WP-03-03 Douglas D. Evanoff and Larry D. Wall When is Inter-Transaction Time Informative? WP-03-04 Craig Furfine Tenure Choice with Location Selection: The Case of Hispanic Neighborhoods WP-03-05 in Chicago Maude Toussaint-Comeau and Sherrie L.W. Rhine Distinguishing Limited Commitment from Moral Hazard in Models of WP-03-06 Growth with Inequality* Anna L. Paulson and Robert Townsend Resolving Large Complex Financial Organizations WP-03-07 Robert R. Bliss The Case of the Missing Productivity Growth: WP-03-08 Or, Does information technology explain why productivity accelerated in the United States but not the United Kingdom? Susanto Basu, John G. Fernald, Nicholas Oulton and Sylaja Srinivasan Inside-Outside Money Competition WP-03-09 Ramon Marimon, Juan Pablo Nicolini and Pedro Teles The Importance of Check-Cashing Businesses to the Unbanked: Racial/Ethnic Differences WP-03-10 William H. Greene, Sherrie L.W. Rhine and Maude Toussaint-Comeau A Firm’s First Year WP-03-11 Jaap H. Abbring and Jeffrey R. Campbell Market Size Matters WP-03-12 Jeffrey R. Campbell and Hugo A. Hopenhayn The Cost of Business Cycles under Endogenous Growth WP-03-13 Gadi Barlevy The Past, Present, and Probable Future for Community Banks WP-03-14 Robert DeYoung, William C. Hunter and Gregory F. Udell Measuring Productivity Growth in Asia: Do Market Imperfections Matter? WP-03-15 John Fernald and Brent Neiman Revised Estimates of Intergenerational Income Mobility in the United States WP-03-16 Bhashkar Mazumder
3

Working Paper Series (continued) Product Market Evidence on the Employment Effects of the Minimum Wage WP-03-17 Daniel Aaronson and Eric French Estimating Models of On-the-Job Search using Record Statistics WP-03-18 Gadi Barlevy Banking Market Conditions and Deposit Interest Rates WP-03-19 Richard J. Rosen Creating a National State Rainy Day Fund: A Modest Proposal to Improve Future WP-03-20 State Fiscal Performance Richard Mattoon Managerial Incentive and Financial Contagion WP-03-21 Sujit Chakravorti, Anna Llyina and Subir Lall Women and the Phillips Curve: Do Women’s and Men’s Labor Market Outcomes WP-03-22 Differentially Affect Real Wage Growth and Inflation? Katharine Anderson, Lisa Barrow and Kristin F. Butcher Evaluating the Calvo Model of Sticky Prices WP-03-23 Martin Eichenbaum and Jonas D.M. Fisher The Growing Importance of Family and Community: An Analysis of Changes in the WP-03-24 Sibling Correlation in Earnings Bhashkar Mazumder and David I. Levine Should We Teach Old Dogs New Tricks? The Impact of Community College Retraining WP-03-25 on Older Displaced Workers Louis Jacobson, Robert J. LaLonde and Daniel Sullivan Trade Deflection and Trade Depression WP-03-26 Chad P. Brown and Meredith A. Crowley China and Emerging Asia: Comrades or Competitors? WP-03-27 Alan G. Ahearne, John G. Fernald, Prakash Loungani and John W. Schindler International Business Cycles Under Fixed and Flexible Exchange Rate Regimes WP-03-28 Michael A. Kouparitsas Firing Costs and Business Cycle Fluctuations WP-03-29 Marcelo Veracierto Spatial Organization of Firms WP-03-30 Yukako Ono Government Equity and Money: John Law’s System in 1720 France WP-03-31 François R. Velde Deregulation and the Relationship Between Bank CEO WP-03-32 Compensation and Risk-Taking Elijah Brewer III, William Curt Hunter and William E. Jackson III
4
Working Paper Series (continued) Compatibility and Pricing with Indirect Network Effects: Evidence from ATMs WP-03-33 Christopher R. Knittel and Victor Stango Self-Employment as an Alternative to Unemployment WP-03-34 Ellen R. Rissman Where the Headquarters are – Evidence from Large Public Companies 1990-2000 WP-03-35 Tyler Diacon and Thomas H. Klier Standing Facilities and Interbank Borrowing: Evidence from the Federal Reserve’s WP-04-01 New Discount Window Craig Furfine Netting, Financial Contracts, and Banks: The Economic Implications WP-04-02 William J. Bergman, Robert R. Bliss, Christian A. Johnson and George G. Kaufman Real Effects of Bank Competition WP-04-03 Nicola Cetorelli Finance as a Barrier To Entry: Bank Competition and Industry Structure in WP-04-04 Local U.S. Markets? Nicola Cetorelli and Philip E. Strahan The Dynamics of Work and Debt WP-04-05 Jeffrey R. Campbell and Zvi Hercowitz Fiscal Policy in the Aftermath of 9/11 WP-04-06 Jonas Fisher and Martin Eichenbaum Merger Momentum and Investor Sentiment: The Stock Market Reaction To Merger Announcements WP-04-07 Richard J. Rosen Earnings Inequality and the Business Cycle WP-04-08 Gadi Barlevy and Daniel Tsiddon Platform Competition in Two-Sided Markets: The Case of Payment Networks WP-04-09 Sujit Chakravorti and Roberto Roson Nominal Debt as a Burden on Monetary Policy WP-04-10 Javier Díaz-Giménez, Giorgia Giovannetti, Ramon Marimon, and Pedro Teles On the Timing of Innovation in Stochastic Schumpeterian Growth Models WP-04-11 Gadi Barlevy Policy Externalities: How US Antidumping Affects Japanese Exports to the EU WP-04-12 Chad P. Bown and Meredith A. Crowley Sibling Similarities, Differences and Economic Inequality WP-04-13 Bhashkar Mazumder Determinants of Business Cycle Comovement: A Robust Analysis WP-04-14 Marianne Baxter and Michael A. Kouparitsas
5
Working Paper Series (continued) The Occupational Assimilation of Hispanics in the U.S.: Evidence from Panel Data WP-04-15 Maude Toussaint-Comeau Reading, Writing, and Raisinets1: Are School Finances Contributing to Children’s Obesity? WP-04-16 Patricia M. Anderson and Kristin F. Butcher Learning by Observing: Information Spillovers in the Execution and Valuation WP-04-17 of Commercial Bank M&As Gayle DeLong and Robert DeYoung Prospects for Immigrant-Native Wealth Assimilation: WP-04-18 Evidence from Financial Market Participation Una Okonkwo Osili and Anna Paulson Institutional Quality and Financial Market Development: WP-04-19 Evidence from International Migrants in the U.S. Una Okonkwo Osili and Anna Paulson Are Technology Improvements Contractionary? WP-04-20 Susanto Basu, John Fernald and Miles Kimball The Minimum Wage, Restaurant Prices and Labor Market Structure WP-04-21 Daniel Aaronson, Eric French and James MacDonald Betcha can’t acquire just one: merger programs and compensation WP-04-22 Richard J. Rosen Not Working: Demographic Changes, Policy Changes, WP-04-23 and the Distribution of Weeks (Not) Worked Lisa Barrow and Kristin F. Butcher The Role of Collateralized Household Debt in Macroeconomic Stabilization WP-04-24 Jeffrey R. Campbell and Zvi Hercowitz Advertising and Pricing at Multiple-Output Firms: Evidence from U.S. Thrift Institutions WP-04-25 Robert DeYoung and Evren Örs Monetary Policy with State Contingent Interest Rates WP-04-26 Bernardino Adão, Isabel Correia and Pedro Teles Comparing location decisions of domestic and foreign auto supplier plants WP-04-27 Thomas Klier, Paul Ma and Daniel P. McMillen China’s export growth and US trade policy WP-04-28 Chad P. Bown and Meredith A. Crowley Where do manufacturing firms locate their Headquarters? WP-04-29 J. Vernon Henderson and Yukako Ono Monetary Policy with Single Instrument Feedback Rules WP-04-30 Bernardino Adão, Isabel Correia and Pedro Teles
6

7
Working Paper Series (continued) Firm-Specific Capital, Nominal Rigidities and the Business Cycle WP-05-01 David Altig, Lawrence J. Christiano, Martin Eichenbaum and Jesper Linde Do Returns to Schooling Differ by Race and Ethnicity? WP-05-02 Lisa Barrow and Cecilia Elena Rouse