
Liquidity Interim Report 2014 - Ofgem
45
Wholesale Power Market Liquidity: Interim Report 1 Wholesale Power Market Liquidity: Interim Report Report Publication date: 18 December 2014 Contact: Yasmin Valji, Senior Economist Team: Wholesale Markets Tel: 020 7901 7000 Email: [email protected] Overview: This is our first report on liquidity in the wholesale electricity market since new regulatory requirements to promote liquidity came into effect in March 2014. We introduced these requirements because of concerns that low liquidity was creating a barrier to effective competition. The new regulations aim to help improve independent suppliers to access the wholesale market and ensure that the market provides the products and price signals that all companies need to compete effectively. We are now monitoring the effects of the reforms both to assess their impact and to make sure the obligated parties comply with them. This report shows how we are doing this, as well as the results of the analysis done so far, and the feedback we have had from stakeholders. The results show that there has been an improvement in liquidity in the wholesale market over the period the new arrangements have been in place. But we recognise that there are other factors that could have contributed to this. Independent suppliers have also told us that they are finding it easier to access the products they need.
Transcript of Liquidity Interim Report 2014 - Ofgem

Wholesale Power Market Liquidity: Interim Report
1
Wholesale Power Market Liquidity: Interim
Report
Report
Publication date: 18 December 2014 Contact: Yasmin Valji, Senior Economist
Team: Wholesale Markets
Tel: 020 7901 7000
Email: [email protected]
Overview:
This is our first report on liquidity in the wholesale electricity market since new regulatory
requirements to promote liquidity came into effect in March 2014. We introduced these
requirements because of concerns that low liquidity was creating a barrier to effective
competition. The new regulations aim to help improve independent suppliers to access the
wholesale market and ensure that the market provides the products and price signals that
all companies need to compete effectively.
We are now monitoring the effects of the reforms both to assess their impact and to make
sure the obligated parties comply with them. This report shows how we are doing this, as
well as the results of the analysis done so far, and the feedback we have had from
stakeholders. The results show that there has been an improvement in liquidity in the
wholesale market over the period the new arrangements have been in place. But we
recognise that there are other factors that could have contributed to this. Independent
suppliers have also told us that they are finding it easier to access the products they need.

Wholesale Power Market Liquidity: Interim Report
2
Context
Our principal objective is to protect the interests of present and future consumers.
Understanding the impacts of the Secure and Promote licence condition is an
important part of our role in protecting the interests of consumers.
Secure and Promote was introduced to improve liquidity in the GB wholesale power
market so that it is sufficient to underpin well-functioning, competitive generation
and supply markets.
We will be publishing annual reports on the impact of Secure and Promote. However,
given this is its first year, we thought it important to issue an interim report to
explain the metrics we are using and the emerging themes. This document presents
the results of the first six months of our monitoring and analysis from 1 April to 30
September 2014.
Associated Documents
Secure and promote: wholesale power market liquidity decision letter Jan 2014
https://www.ofgem.gov.uk//publications-and-updates/wholesale-power-market-
liquidity-decision-letter
Liquidity in the Wholesale Electricity Market (Special Condition AA of the
electricity generation licence): Guidance
https://www.ofgem.gov.uk/ofgem-
publications/86717/liquidityinthewholesaleelectricitymarketspecialconditionaaofth
eelectricitygenerationlicence-guidance.pdf
Wholesale Power Market Liquidity: Interim Report
3
Contents
Executive Summary 4
1. Background and Metrics 7 Secure and Promote background and objectives 7 Metrics to track liquidity in the market 9 Market-level metrics results 10 Comments from stakeholders on the metrics 14
2. Secure and Promote Analysis 16 Supplier Market Access (SMA) 16 Market making 19 Near-term market progress 23
3. Next Steps 26
4. Appendices 28
Appendix 1 – The Secure and Promote Special Licence Condition 29 Structure of Secure and Promote 29
Appendix 2 – Liquidity Metrics 34
Appendix 3 – Glossary 39
Wholesale Power Market Liquidity: Interim Report
4
Executive Summary
This document is our first report on liquidity in the wholesale electricity market since
new reforms were introduced in March 31 2014. When introducing the reforms, we
committed to monitoring progress on an annual basis. As this is the first year that
the reforms have been in place, we are issuing an interim report explaining the
metrics that we are using to monitor the impact of the liquidity reforms and the high
level results of our monitoring so far. This report shows that there has been an
improvement in liquidity since our reforms came into place.
On March 31 2014, new regulatory requirements to promote liquidity in the
wholesale electricity market came into effect. We introduced these reforms, known
as “Secure and Promote”, because we were concerned (as were industry
participants) that low levels of liquidity were posing a barrier to effective
competition.
A liquid market should ensure that buyers or sellers, that have identified the
products they need, can then reliably make transactions in a timely way at a cost-
reflective price. Low liquidity can prevent competition in several ways, for example
by making it hard for small companies and new entrants to buy electricity in the
wholesale market to supply to their customers at a known price ahead of delivery.
Low liquidity can also weaken price signals because a low amount of trading reduces
the likelihood that prices will reflect the underlying demand and supply conditions.
The reforms were intended to meet three objectives:
to promote the availability of products that support hedging by introducing a
set of minimum service standards for trading between eligible suppliers1 and
the largest eight generators2, called Supplier Market Access (SMA) rules
to promote robust reference prices for forward products through a market
making obligation on the six largest vertically integrated companies
to secure near-term market liquidity through a reporting requirement of day-
ahead trading of the six largest vertically integrated companies and the two
largest independent generators
Progress to date
Our analysis shows that there has been some improvement in liquidity since Secure
and Promote was introduced. Several independent suppliers have also told us that it
is easier for suppliers and generators to access the products they need and that
1 Suppliers that are small enough by definition under Secure and Promote guidance can be considered eligible. The Secure and Promote guidance can be seen here: https://www.ofgem.gov.uk/ofgem publications/86717/liquidityinthewholesaleelectricitymarketspecialconditionaaoftheelectricityge
nerationlicence-guidance.pdf 2 The obligated licensees for the SMA rules are the six largest vertically integrated companies
plus the two largest independent generators, GDF Suez and Drax Power.
Wholesale Power Market Liquidity: Interim Report
5
prices for those products are perceived by industry as more robust during the times
when market making takes place.
In addition, trends such as increasing churn (the electricity traded compared to the
amount delivered to consumers) and falling bid-offer spreads (the difference
between the buy and sell price for a product3) show that liquidity is improving.
Many factors can impact liquidity and it is difficult to isolate the effect of our reforms.
In addition, liquidity follows seasonal trends. While there are positive signs so far, it
is too early to draw more meaningful conclusions. At least a full year of data is
needed.
Supplier market access
Reporting obligations show that trading volumes with eligible suppliers are low4 but
following an upward trend. More importantly, independent suppliers have told us
they are finding it easier to access products and that the responsiveness of obligated
licensees5 to trading requests has improved. Stakeholders feel that the general
improvement in trading conditions will benefit new entrants who need to trade power
to hedge6 and meet their business needs. We have also been told that obtaining
desired credit lines and the costs of posting collateral remain the main barriers to
independent suppliers.
Market making
Reporting obligations show increasing volumes traded at the times when the six
largest vertically integrated companies are market making, called the market making
“windows”. We have been told that it is now easier for market participants to access
the products they need and that prices in the windows are more robust than they
were before Secure and Promote. Despite the agreement there is a positive change,
some stakeholders have concerns about liquidity being concentrated into the
windows. Our data does not confirm this concern and we are monitoring this closely.
Near term liquidity
The near term market is still liquid and has improved slightly since Secure and
Promote. Exchange trading has shown an upward trend and intraday trading in
particular has grown substantially over the last year.
3 A low bid-offer spread indicates that the price reflects market value. 4 There are eight eligible suppliers at present which are small by definition, therefore high trading volumes are not expected 5 The obligated licensees are the largest six vertically integrated companies (Centrica, EDF Energy, E.ON UK, RWE Npower, ScottishPower and SSE Generation) and the two largest independent generators, GDF Suez and Drax Power. 6 Hedging is trading power at an agreed future price, thereby protecting against the risk that the price on the day of delivery will be different to the one in the initial contract. Hedging
reduces the risk from short term price movements.
Wholesale Power Market Liquidity: Interim Report
6
Next steps
We will publish our first annual report by the end of summer 2015. We continue to
closely monitor the metrics, and hold bilateral stakeholder meetings on an as-needed
basis.
Wholesale Power Market Liquidity: Interim Report
7
1. Background and Metrics
Chapter Summary
This chapter describes the background to Secure and Promote and the three
objectives under it. It also discusses the importance of monitoring and describes the
metrics we are using to track liquidity at the market level, and the data from our
monitoring to date. Lastly, it summarises the comments received from stakeholders
on the metrics we are using.
Liquidity has shown signs of improvement since Secure and Promote came into
effect. There is no single metric that can provide a complete view of liquidity in the
market. We therefore consider a set of metrics and stakeholder feedback. The
increase in liquidity at the level of overall trading in the market is shown by some of
the key metrics moving in positive directions, for example increasing churn and
falling bid-offer spreads.
Many factors can impact liquidity and it is difficult to isolate the impact of our
reforms. In addition, liquidity follows seasonal trends. While there are positive signs
so far, it is too early to draw more meaningful conclusions. At least a full year of data
is needed.
Secure and Promote background and objectives
1.1. On March 31 2014, new regulatory requirements to promote liquidity in the
wholesale electricity market came into effect. We introduced these reforms, known
as “Secure and Promote”, because we were concerned (as were industry
participants) that the wholesale electricity market was not delivering the products
and price signals that are needed to facilitate competition. Poor liquidity in the
wholesale power market was preventing consumers from fully realising the benefits
that competition can deliver, namely in terms of downward pressure on bills and
greater choice.
1.2. Our liquidity reforms were driven by the concern that poor liquidity was not
effectively supporting competition in the generation and supply markets.
1.3. A liquid market should ensure that buyers or sellers that have identified the
products they need can then reliably make transactions in a timely way at a cost-
reflective price.
1.4. Low liquidity can prevent competition in several ways, for example by making
it hard for small companies and new entrants to buy electricity in the wholesale
market to supply to their customers at a known price ahead of delivery. Low liquidity
can also weaken price signals because a low amount of trading reduces the likelihood
that prices will reflect the underlying demand and supply conditions.
1.5. After extensive consultation with industry, the Secure and Promote liquidity
reforms were implemented as a special licence condition into the generation licences
Wholesale Power Market Liquidity: Interim Report
8
of the six largest vertically integrated companies and the two largest independent
generators, GDF Suez and Drax Power.
1.6. To address the liquidity concerns we identified three objectives for our
reforms. These are:
to promote the availability of products that support hedging by introducing a
set of minimum service standards for trading between eligible suppliers and
the largest eight generators, called Supplier Market Access (SMA) rules
to promote robust reference prices for forward products through a market
making obligation on the six largest vertically integrated companies
to secure near-term market liquidity through a reporting requirement of day-
ahead trading of the six largest vertically integrated companies and the
largest independent generators.
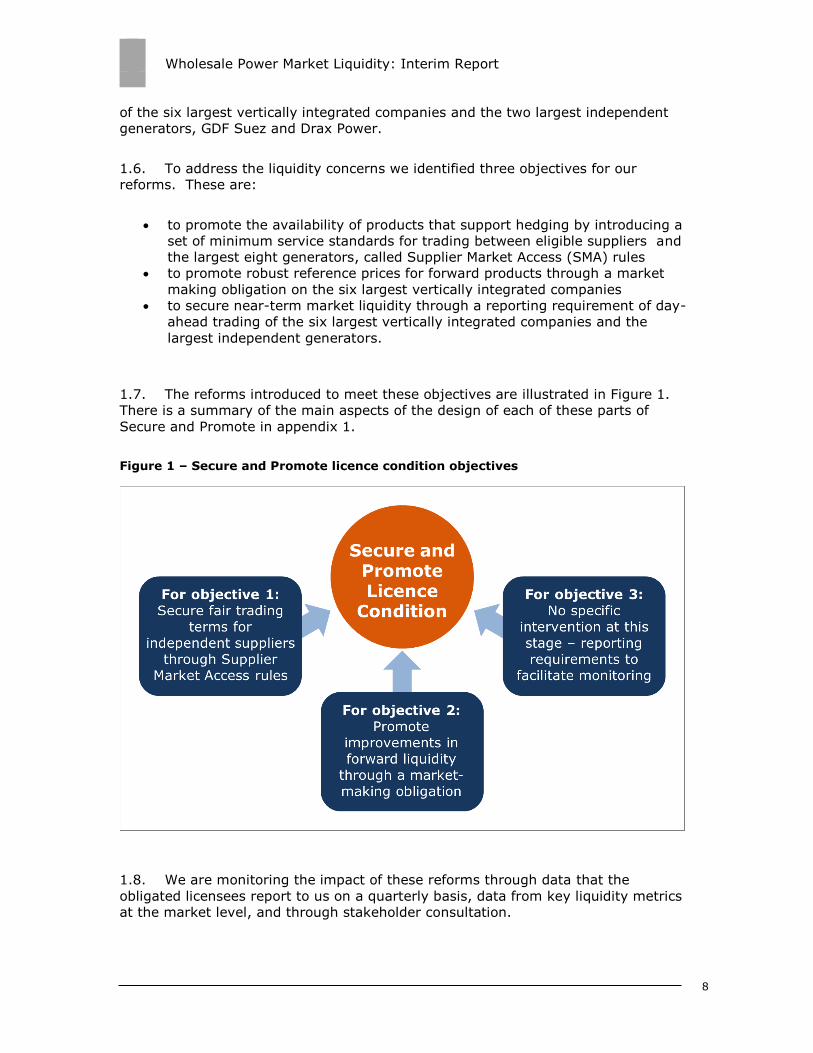
1.7. The reforms introduced to meet these objectives are illustrated in Figure 1.
There is a summary of the main aspects of the design of each of these parts of
Secure and Promote in appendix 1.
Figure 1 – Secure and Promote licence condition objectives
1.8. We are monitoring the impact of these reforms through data that the
obligated licensees report to us on a quarterly basis, data from key liquidity metrics
at the market level, and through stakeholder consultation.
Wholesale Power Market Liquidity: Interim Report
9
1.9. It is important to first look at the metrics to track liquidity at the level of total
trading in the market. We do so in the next section before looking at the results of
our monitoring under the specific parts of Secure and Promote.
Metrics to track liquidity in the market
1.10. We have committed to monitoring progress and assessing the effectiveness of
Secure and Promote on an annual basis. But no one indicator is a sufficient measure
of liquidity. While quantitative metrics like churn and bid-offer spreads are useful
indicators (as they can be indicative that availability and reliable prices are features
of the market), they are not sufficient indicators in isolation. It is also the ease and
reliability of access to products that facilitates competition and it is important that
this is assessed through relevant metrics, and more importantly through gaining
feedback from relevant industry participants.
1.11. To facilitate our monitoring of liquidity we have developed a set of
complementary metrics. These metrics show:
the volume of power traded on different platforms, the volume of electricity
traded compared to the amount consumed (churn)
at what times power was traded in the day
what type of contracts were traded (baseload or peak products and how far
out into the future they are traded), and
the difference between the bid-offer spreads (the prices that parties were
offering to sell and buy a unit of energy).
1.12. Looked at together, these metrics help us to monitor liquidity and how
participants can use the wholesale electricity market to effectively compete. The
metrics we are using are presented in appendix 2.
What do our market-level metrics tell us?
1.13. The metrics show an improvement in liquidity since Secure and Promote came
into effect:
churn was equal or higher in every quarter compared with 2013 (Figure 2)
meaning there is a higher amount of electricity traded compared to the
amount finally used by customers
bid-offer spreads are following a downward trend (Figure 6) which suggests
that the price being paid for electricity is more reflective of market value
trading volumes have risen in the market making windows and have stayed
broadly static in the rest of the day (Figure 3)
the amount of baseload products traded for delivery further into the future is
increasing compared to last year (Figure 4). This is one indicator of the ability
to hedge and shows the extent to which participants are accessing products
for delivery months and years in advance, and
Wholesale Power Market Liquidity: Interim Report
10
there are higher volumes of trade both on exchanges and over the counter
(OTC) (Figure 5 and Figure 7).
1.14. There are many factors in addition to Secure and Promote that may have
contributed to the increase in trading volumes in 2014. Where participants consider
there is greater risk to wholesale prices they are likely to trade more. There are a
number of factors that could have influenced participants’ view of risk including the
geopolitical events in Ukraine, the day-ahead market coupling in the North West
European zone, higher price volatility, the shift in relative attractiveness of spark
spreads in Q2-Q3, and several supply-side events in the GB market. There is also the
seasonal effect of the power year that causes volumes to vary. It is not possible to
determine the impact of these factors individually on the levels of liquidity.
1.15. Graphs of the main indicators follow, along with a brief explanation of what
they show. The complete set of metrics is in appendix 2.
Market-level metrics results
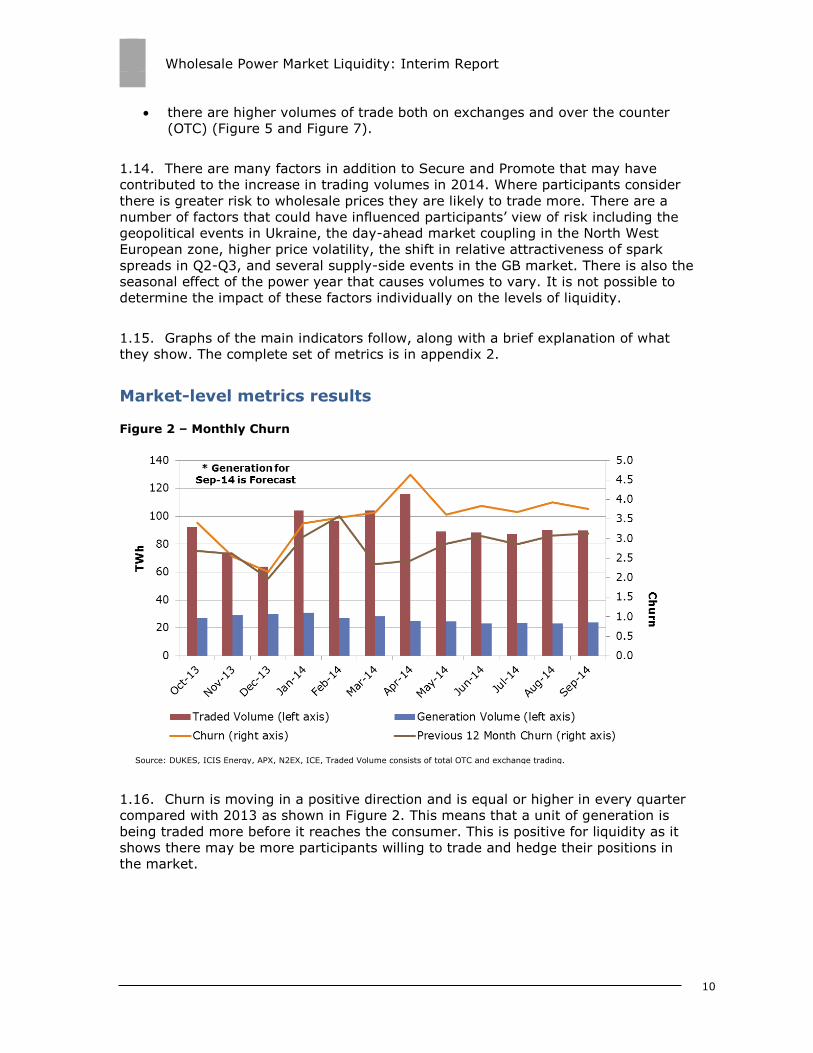
Figure 2 – Monthly Churn
1.16. Churn is moving in a positive direction and is equal or higher in every quarter
compared with 2013 as shown in Figure 2. This means that a unit of generation is
being traded more before it reaches the consumer. This is positive for liquidity as it
shows there may be more participants willing to trade and hedge their positions in
the market.
Source: DUKES, ICIS Energy, APX, N2EX, ICE, Traded Volume consists of total OTC and exchange trading.
Wholesale Power Market Liquidity: Interim Report
11
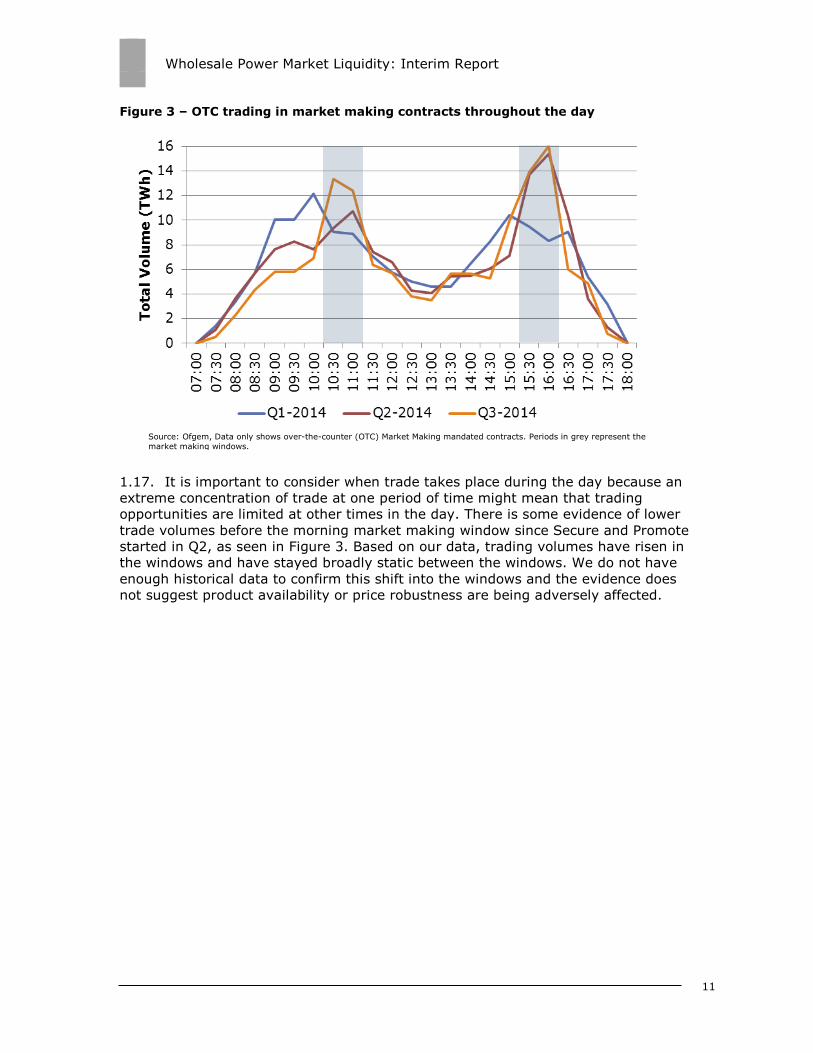
Figure 3 – OTC trading in market making contracts throughout the day
1.17. It is important to consider when trade takes place during the day because an
extreme concentration of trade at one period of time might mean that trading
opportunities are limited at other times in the day. There is some evidence of lower
trade volumes before the morning market making window since Secure and Promote
started in Q2, as seen in Figure 3. Based on our data, trading volumes have risen in
the windows and have stayed broadly static between the windows. We do not have
enough historical data to confirm this shift into the windows and the evidence does
not suggest product availability or price robustness are being adversely affected.
Source: Ofgem, Data only shows over-the-counter (OTC) Market Making mandated contracts. Periods in grey represent the
market making windows.
Wholesale Power Market Liquidity: Interim Report
12
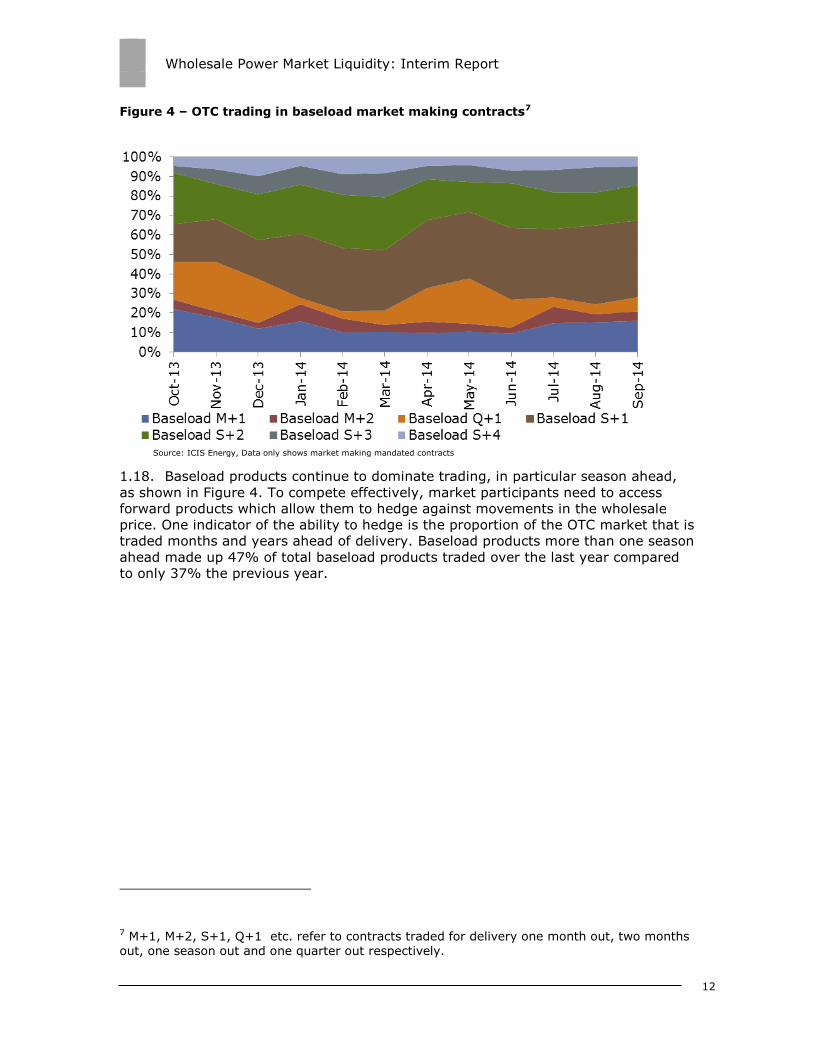
Figure 4 – OTC trading in baseload market making contracts7
1.18. Baseload products continue to dominate trading, in particular season ahead,
as shown in Figure 4. To compete effectively, market participants need to access
forward products which allow them to hedge against movements in the wholesale
price. One indicator of the ability to hedge is the proportion of the OTC market that is
traded months and years ahead of delivery. Baseload products more than one season
ahead made up 47% of total baseload products traded over the last year compared
to only 37% the previous year.
7 M+1, M+2, S+1, Q+1 etc. refer to contracts traded for delivery one month out, two months
out, one season out and one quarter out respectively.
Source: ICIS Energy, Data only shows market making mandated contracts
Wholesale Power Market Liquidity: Interim Report
13
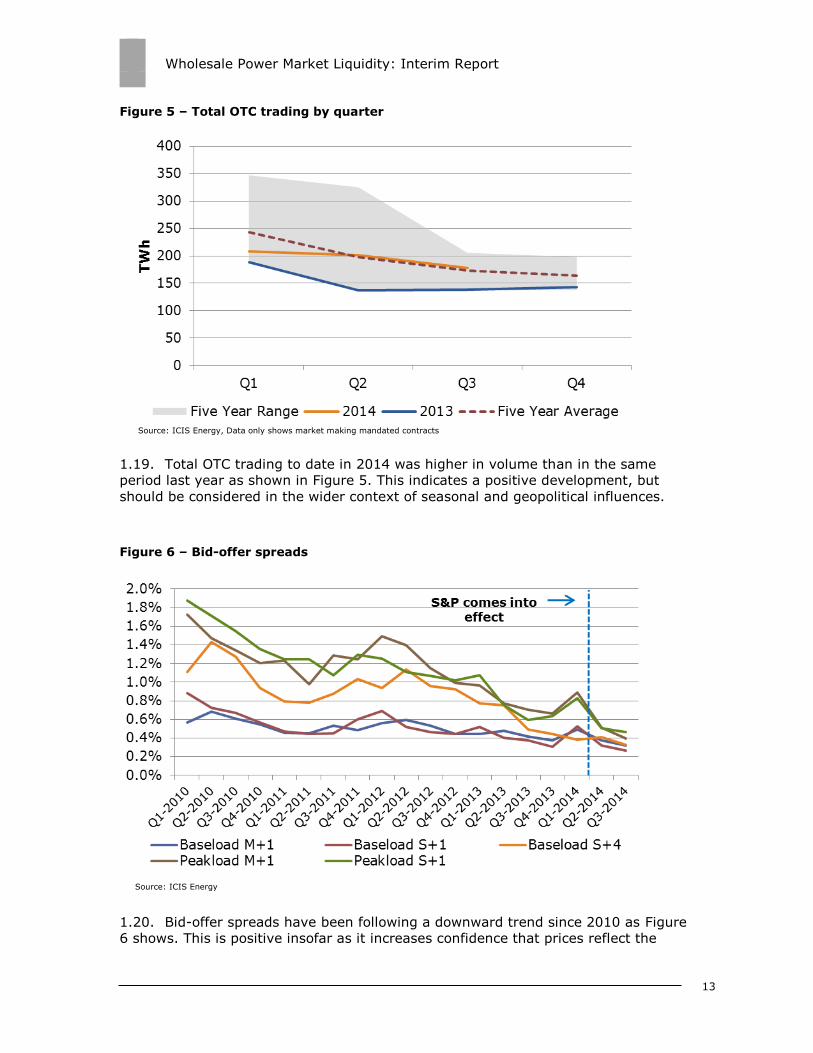
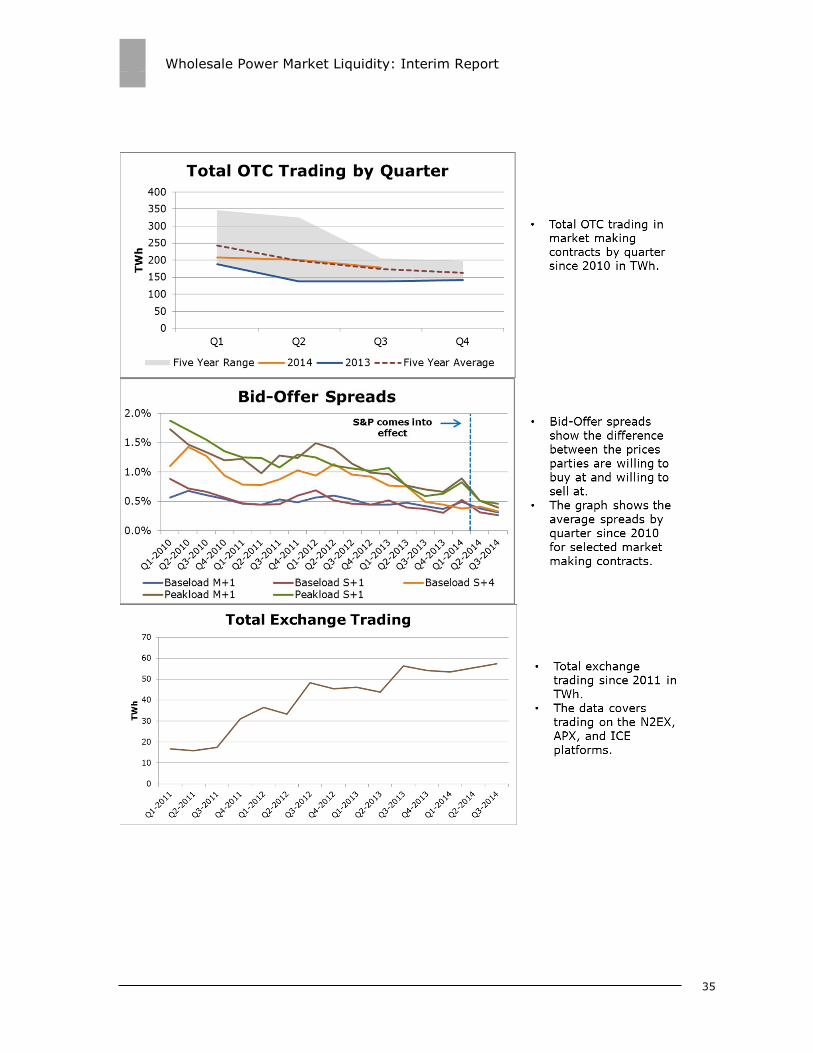
Figure 5 – Total OTC trading by quarter
1.19. Total OTC trading to date in 2014 was higher in volume than in the same
period last year as shown in Figure 5. This indicates a positive development, but
should be considered in the wider context of seasonal and geopolitical influences.
Figure 6 – Bid-offer spreads
1.20. Bid-offer spreads have been following a downward trend since 2010 as Figure
6 shows. This is positive insofar as it increases confidence that prices reflect the
Source: ICIS Energy, Data only shows market making mandated contracts
Source: ICIS Energy
Wholesale Power Market Liquidity: Interim Report
14
underlying demand and supply conditions. However, we note that our data is based
on spreads assessed at the close of trade, and as such reflects the mandated spreads
in the afternoon market making window. Bid-offer spreads throughout the day may
be different to those shown by our data, but we do not yet have adequate data to
assess this.
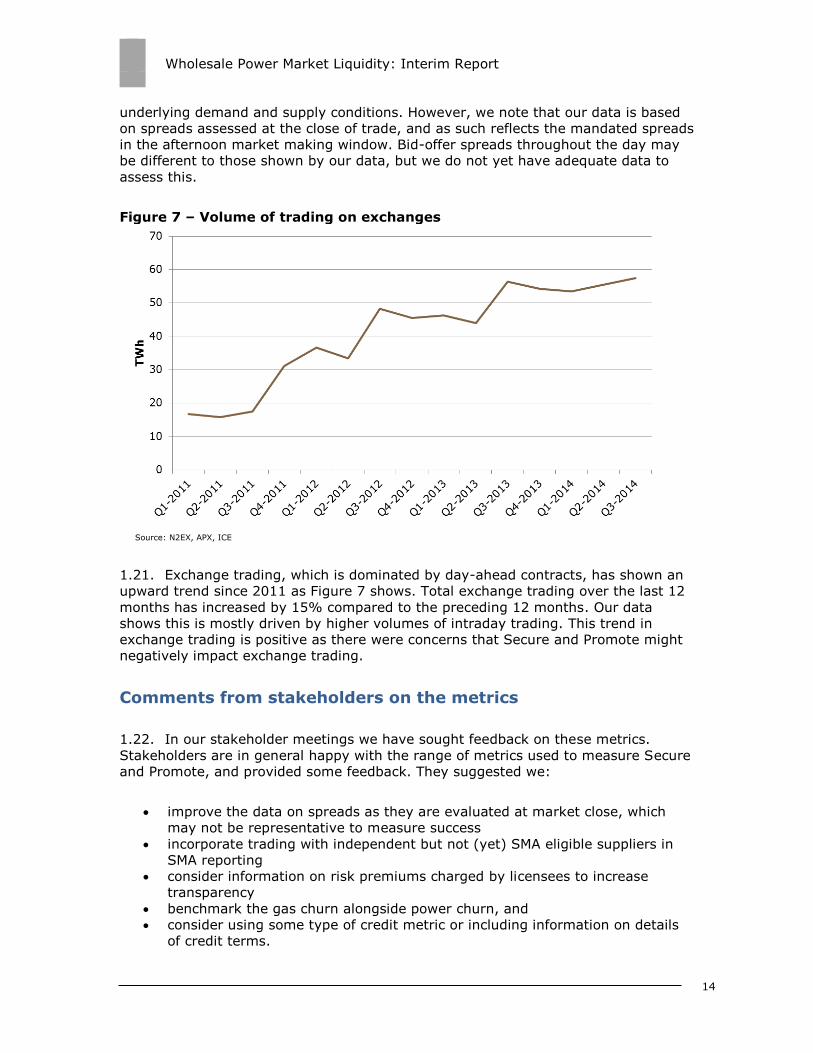
Figure 7 – Volume of trading on exchanges
1.21. Exchange trading, which is dominated by day-ahead contracts, has shown an
upward trend since 2011 as Figure 7 shows. Total exchange trading over the last 12
months has increased by 15% compared to the preceding 12 months. Our data
shows this is mostly driven by higher volumes of intraday trading. This trend in
exchange trading is positive as there were concerns that Secure and Promote might
negatively impact exchange trading.
Comments from stakeholders on the metrics
1.22. In our stakeholder meetings we have sought feedback on these metrics.
Stakeholders are in general happy with the range of metrics used to measure Secure
and Promote, and provided some feedback. They suggested we:
improve the data on spreads as they are evaluated at market close, which
may not be representative to measure success
incorporate trading with independent but not (yet) SMA eligible suppliers in
SMA reporting
consider information on risk premiums charged by licensees to increase
transparency
benchmark the gas churn alongside power churn, and
consider using some type of credit metric or including information on details
of credit terms.
Source: N2EX, APX, ICE
Wholesale Power Market Liquidity: Interim Report
15
1.23. We will take these comments into consideration for our annual report and we
may modify the charts or include new ones if the need arises.
1.24. In the next chapter, we look at the results and stakeholder feedback of the
three parts of Secure and Promote, and consider whether our objectives are being
met under these parts. In chapter 3, we discuss our next steps. The appendices
show the final design of Secure and Promote in more detail, the set of metrics we are
using, and explain key terms in the glossary.
Wholesale Power Market Liquidity: Interim Report
16
2. Secure and Promote Analysis
Chapter Summary
This chapter presents the results from our analysis and the comments that we have
received from stakeholders on the Supplier Market Access (SMA) and Market Making
part of the reforms. It also shows the data on liquidity in the near-term market,
which informs the progress of the third objective of Secure and Promote.
Our monitoring tells us the market is moving in a positive direction towards
achieving our objectives under the SMA rules and under market making but that
there are particular issues that we need to further consider as we continue our
monitoring. There has been an improvement for independent suppliers in trading
with the largest eight generators but some barriers remain that make it difficult to
access the products suppliers need. Price formation and product availability are both
features of the market making activity that were viewed positively in general by
stakeholders, but issues remain that require active monitoring, for example liquidity
being artificially forced into certain parts of the day.
The near term market is liquid and shows signs of improvement, particularly intraday
trading. Our data shows that near term liquidity has remained secured, so our
reforms have not had a negative impact in this regard. Day-ahead trading has shown
a slight improvement since Secure and Promote.
For all three parts of Secure and Promote, we will need at least a full year of data to
draw more meaningful conclusions.
Supplier Market Access (SMA)
2.1. The SMA part of Secure and Promote aims to ensure that independent
suppliers can gain access to the wholesale market on reasonable terms. This was
introduced because of repeated concerns that independent suppliers were having
problems setting up trading agreements through which to access the wholesale
market. This meant that these smaller market participants were struggling to enter
the market and compete effectively. Poor liquidity in this sense was preventing
consumers from fully realising the benefits that competition can deliver.
2.2. The SMA rules set out minimum service standards that eligible suppliers can
expect when negotiating trading agreements with the largest eight generators. By
ensuring that negotiating with eligible suppliers is not treated as a low priority,
enabling suppliers to gain access to smaller-sized products appropriate to their
needs, and ensuring the credit and collateral terms offered are transparent, the SMA
rules were intended to improve the ability of independent suppliers to trade and
compete.

Wholesale Power Market Liquidity: Interim Report
17
Summary of analysis
2.3. Stakeholder feedback from independent supplier stakeholders (discussed in
more detail below) showed that they were finding it easier to access products and
that the responsiveness of obligated licensees to trading requests had improved.
Stakeholders felt that the general improvement in trading conditions would benefit
new entrants who needed to trade power to hedge and meet their business needs.
We have also been told that credit and collateral costs remained the main barriers to
independent suppliers. The data shows that trading volumes with eligible suppliers
between April and September are low but are on an upward trend.
Stakeholder feedback
2.4. In our meetings with stakeholders we asked them what effect they had
noticed since the SMA rules had come into effect and what their experience had
been. We also asked them what factors might be limiting success under SMA.
2.5. The feedback that we have received on Supplier Market Access showed a
sentiment of cautious optimism. We were told that trading conditions had improved
for independent suppliers. They had seen improvements in the accessibility of
products and in negotiating contracts with the large generators. They also
appreciated the availability of smaller products and some suppliers wanted a larger
range of products under SMA. However, feedback from independent suppliers
suggested that there was a lack of consistency between the credit arrangements
required by the largest eight generators, which was limiting the range of products
they were able to access.
2.6. However, feedback from independent suppliers suggests that there continues
to be a lack of consistency between the credit arrangements required by the largest
eight generators, which is limiting the range of products they are able to access.
2.7. Many of the suppliers and large generators did not see a significant change in
the volume of trading under SMA or the amount of new agreements signed, but they
recognised that Secure and Promote was in its early days and take-up might increase
over time. One potential reason for this is that some independent suppliers informed
us that they had seen a significant change in approach from the eight obligated
generators from the time there was certainty regarding the SMA reforms. This had
meant that they were able to enter into contracts and trade agreements with these
parties without becoming eligible suppliers. As our monitoring only includes volumes
traded with eligible suppliers, stakeholders felt that our monitoring may not be
capturing the full impact of the reforms in this area. Stakeholders also felt that the
general improvement in trading conditions would benefit new entrants.
2.8. The largest generators told us that more feedback from independent suppliers
would be helpful, especially when trading agreements do not progress, and that the
burden of compliance under SMA is so far not commensurate with the level of
participation by independent suppliers.
Wholesale Power Market Liquidity: Interim Report
18
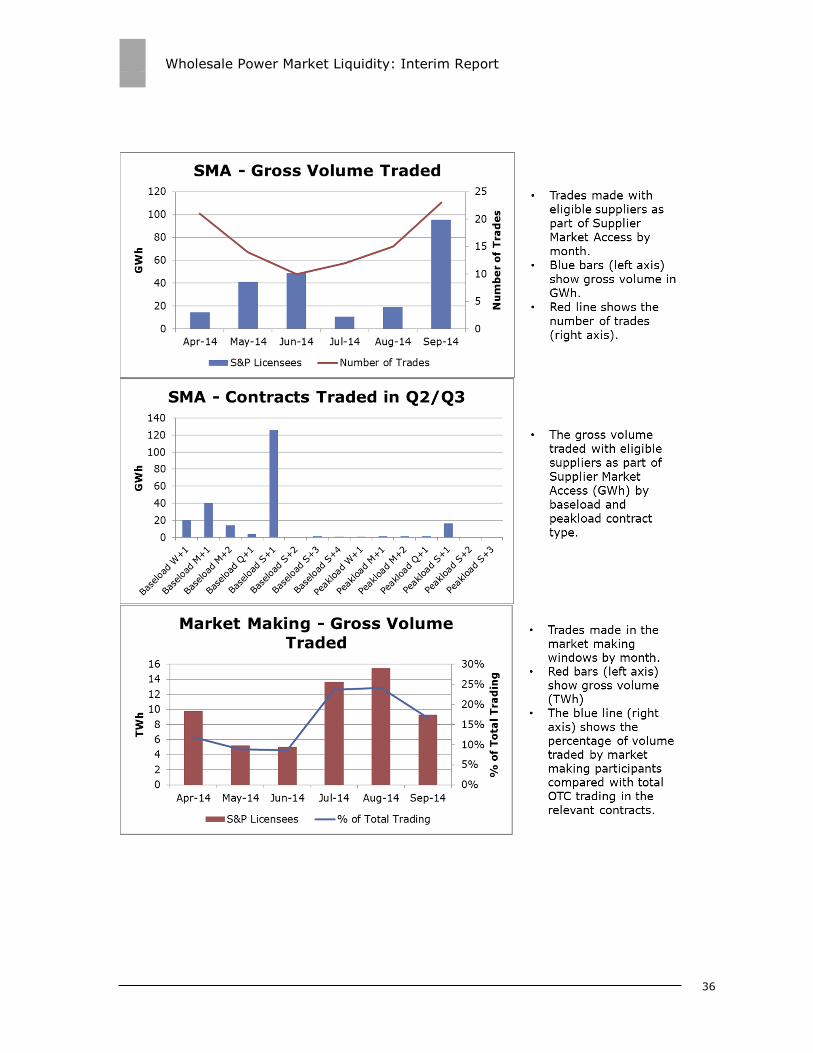
Supplier market access data
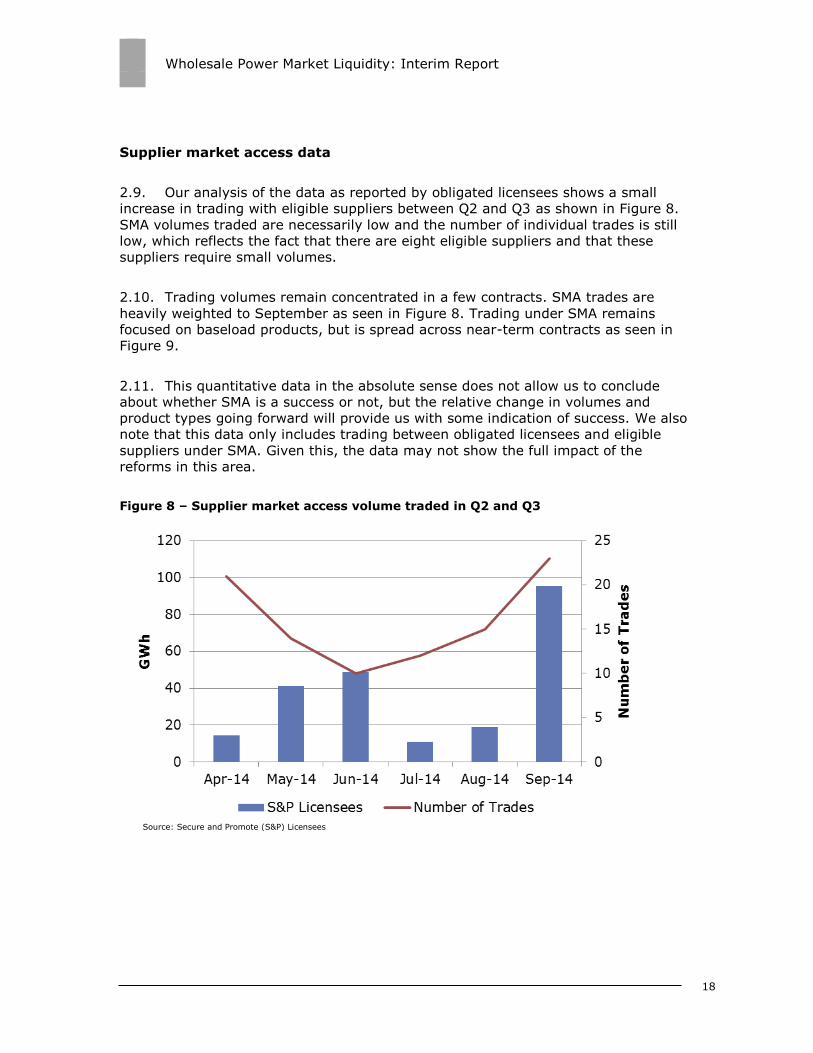
2.9. Our analysis of the data as reported by obligated licensees shows a small
increase in trading with eligible suppliers between Q2 and Q3 as shown in Figure 8.
SMA volumes traded are necessarily low and the number of individual trades is still
low, which reflects the fact that there are eight eligible suppliers and that these
suppliers require small volumes.
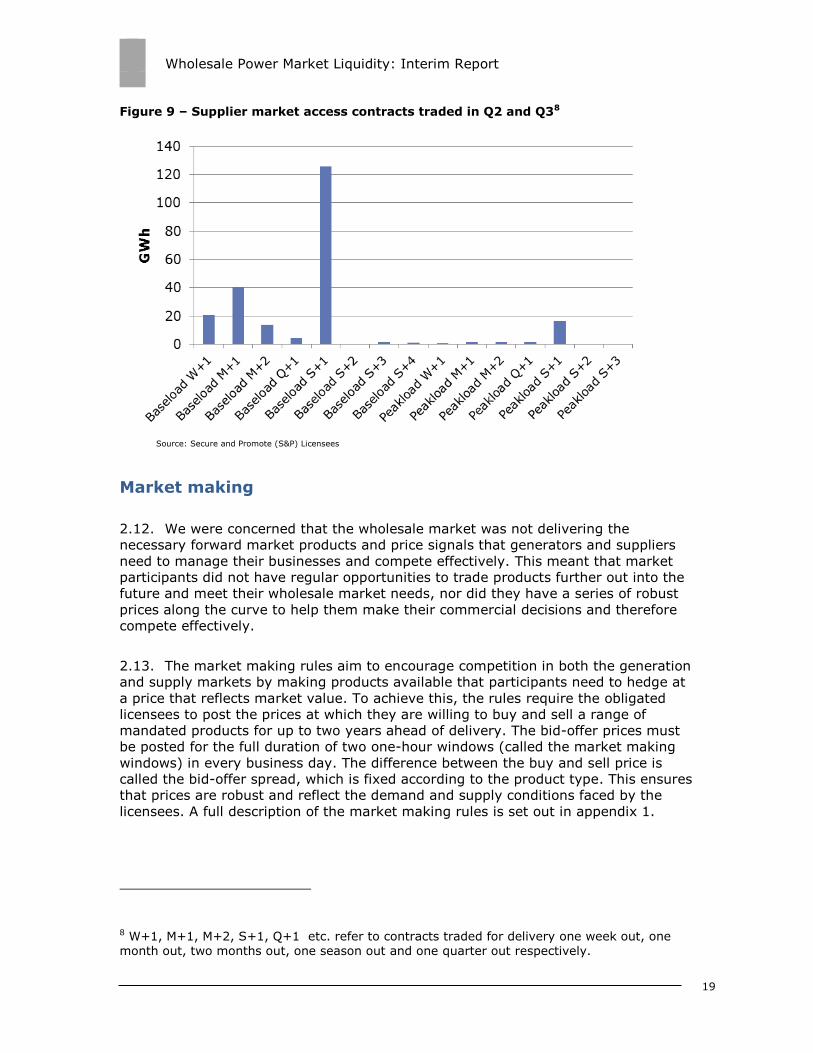
2.10. Trading volumes remain concentrated in a few contracts. SMA trades are
heavily weighted to September as seen in Figure 8. Trading under SMA remains
focused on baseload products, but is spread across near-term contracts as seen in
Figure 9.
2.11. This quantitative data in the absolute sense does not allow us to conclude
about whether SMA is a success or not, but the relative change in volumes and
product types going forward will provide us with some indication of success. We also
note that this data only includes trading between obligated licensees and eligible
suppliers under SMA. Given this, the data may not show the full impact of the
reforms in this area.
Figure 8 – Supplier market access volume traded in Q2 and Q3
Source: Secure and Promote (S&P) Licensees
Wholesale Power Market Liquidity: Interim Report
19
Figure 9 – Supplier market access contracts traded in Q2 and Q38
Market making
2.12. We were concerned that the wholesale market was not delivering the
necessary forward market products and price signals that generators and suppliers
need to manage their businesses and compete effectively. This meant that market
participants did not have regular opportunities to trade products further out into the
future and meet their wholesale market needs, nor did they have a series of robust
prices along the curve to help them make their commercial decisions and therefore
compete effectively.
2.13. The market making rules aim to encourage competition in both the generation
and supply markets by making products available that participants need to hedge at
a price that reflects market value. To achieve this, the rules require the obligated
licensees to post the prices at which they are willing to buy and sell a range of
mandated products for up to two years ahead of delivery. The bid-offer prices must
be posted for the full duration of two one-hour windows (called the market making
windows) in every business day. The difference between the buy and sell price is
called the bid-offer spread, which is fixed according to the product type. This ensures
that prices are robust and reflect the demand and supply conditions faced by the
licensees. A full description of the market making rules is set out in appendix 1.
8 W+1, M+1, M+2, S+1, Q+1 etc. refer to contracts traded for delivery one week out, one
month out, two months out, one season out and one quarter out respectively.
Source: Secure and Promote (S&P) Licensees
Wholesale Power Market Liquidity: Interim Report
20
How are the market making objectives progressing?
2.14. Our monitoring tells us that the market is moving towards achieving our
objectives under market making. The data shows that market making volumes are
following an upward trend. Feedback that we have received is largely positive and
points to improved availability of products along with more robust prices.
2.15. When we introduced the reforms, a number of participants were concerned
that the reforms might artificially force liquidity into the market making windows and
that liquidity would dry up outside of the windows. Our data does not support the
anecdotal comments from some stakeholders, but it does suggest slightly lower
trading volumes before the morning market making window since April. We do not
have enough historical data to confirm this shift but we are monitoring this carefully.
2.16. Our monitoring also tells us that there remain issues to monitor, namely the
concentration of liquidity in the market making windows, the types of players in the
market, and the spreads outside the windows. As for SMA, we will need a full year of
data to draw more meaningful conclusions.
Stakeholder feedback
2.17. We asked stakeholders what they had noticed since the market making rules
had come into effect. We also asked them if they thought that there were more
robust reference prices for the mandated products since Secure and Promote.
2.18. Stakeholders were generally fairly positive regarding the effect of the market
making reforms. There was general agreement that price formation and product
availability within the windows had improved. Stakeholders also agreed the overall
number of trades outside of the windows was largely constant over the year to date
so trading volumes had not been adversely affected. The six obligated market
makers had mixed views of Secure and Promote, ranging from active support (not
only posting bids and offers but also trying to trade) through to simple compliance
(posting bid-offer pairs in accordance with their obligation).
2.19. Some stakeholders thought that more depth9 was necessary in forward
products and that there was not yet a kick-start in liquidity, simply a shift. They said
price robustness had not been achieved throughout the day. Some also said that
there needed to be more financial players trading in the market to see a real
improvement in liquidity.
2.20. Many stakeholders said they thought that there was a concentration of
liquidity in the windows, although others recognised that the analysis demonstrated
that this had not been the case. There were impressions of reduced liquidity prior to
9 Market depth is a technical term used to describe the volume of bids to buy and offers to sell a single contract at a point in time. Large volumes of these ‘orders to trade’ at, or around, the
best bid and best offer prices are often associated with robust prices and higher liquidity.
Wholesale Power Market Liquidity: Interim Report
21
the morning trading window, but better product definition and activity in the
afternoon window.
2.21. There were conflicting views as to the potential benefits or harm that would
result from any shift of liquidity into the market making windows. Some
stakeholders said that there was no need for liquidity to be constant throughout the
day and if there was limited liquidity then having two very liquid windows is better
than low liquidity all day. Other stakeholders felt that compressing liquidity into
windows would limit the types of participants in the wholesale market. In particular,
it was felt that this might have a negative impact on the number of financial
organisations participating in the wholesale electricity market.
2.22. There were mixed opinions regarding the obligation of market makers to be
100% present during the two windows. Some stakeholders wanted windows of
longer duration with a less than 100% obligation while some welcomed the 100%
obligation based on their impression of better reference prices for products traded
less often.
2.23. There were also mixed opinions on the bid-offer spreads. Some stakeholders
were happy with the mandated spreads in the windows, but others thought they
were too wide both in and especially out of the windows. No supporting data has
been given and we are aware we need to measure this more accurately.
2.24. We continue to monitor and evaluate the impact on the market of the issues
raised from our stakeholder meetings, but we are keen to give time to Secure and
Promote to mature before deciding on what reaction is appropriate.
Market making data
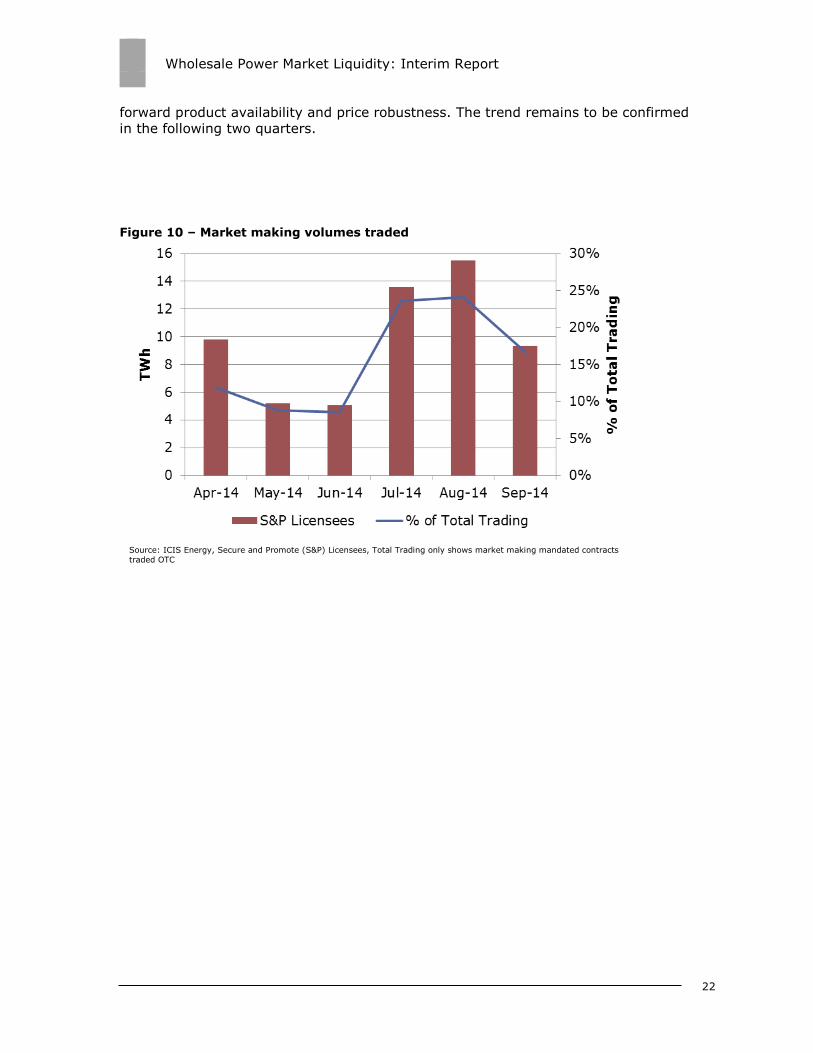
2.25. Our data, as reported by the licensees, shows an increasing trend in the
market making volumes between Q2 and Q3 2014.
2.26. Market making volumes increased from 20.1 TWh in Q2 to 38.4 TWh in Q3 as
shown in Figure 10. There are many reasons for this, for example the geopolitical
events in Ukraine, higher price volatility, the shift in relative attractiveness of spark
spreads in Q2-Q3, and several supply-side events in the GB market.
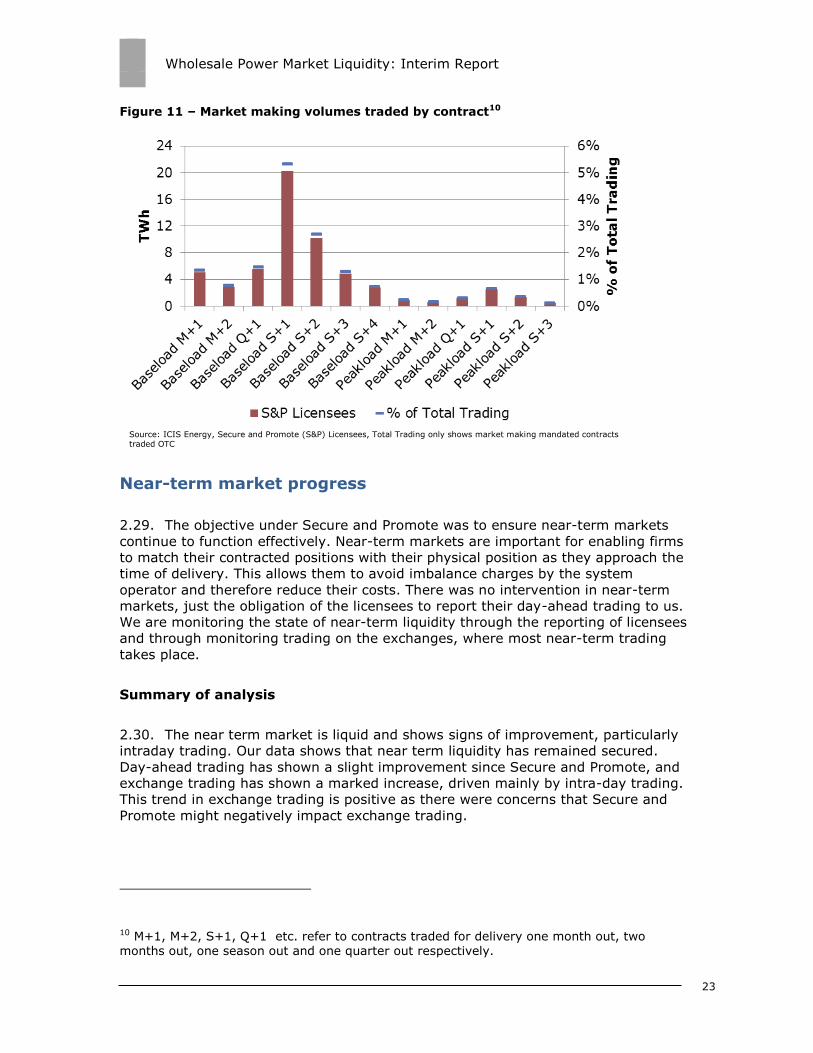
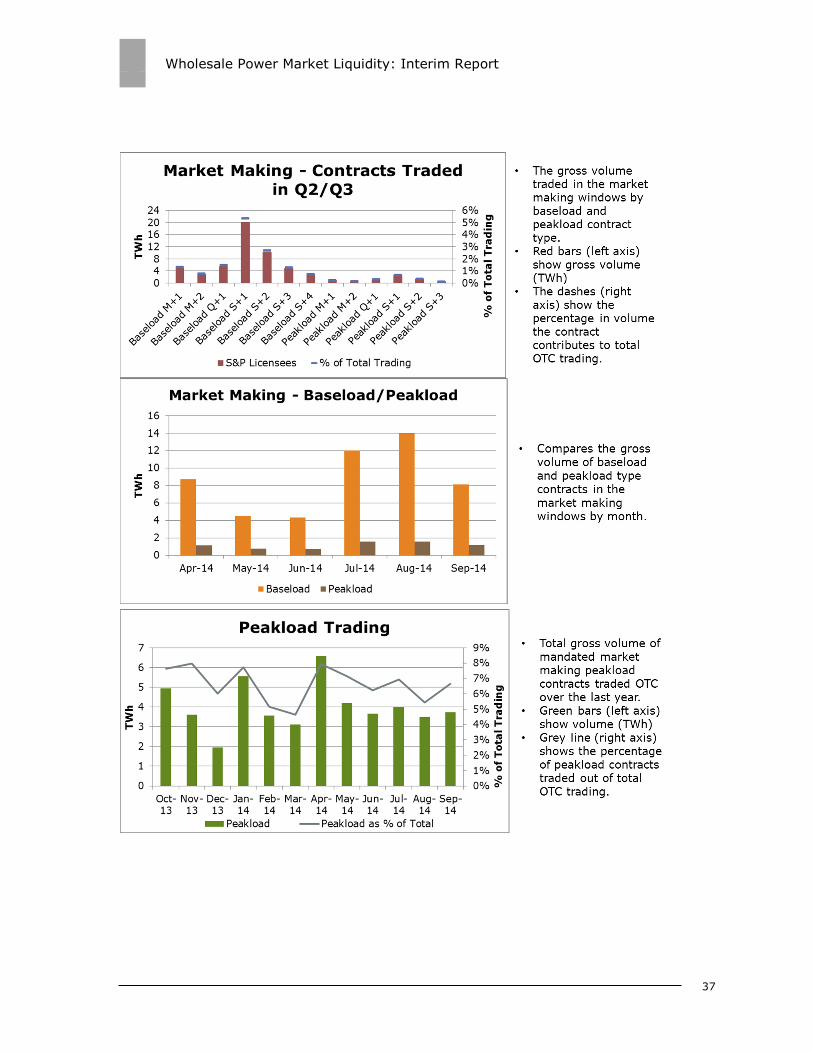
2.27. Trades remain focused on baseload products, in particular season ahead. The
data also shows that peakload products are traded more in the market making
windows compared to the market overall. Peakload products made up 11% of market
making products compared to only 6% of total OTC trading in Q3 2014, and
peakload volumes traded in the OTC market as whole are higher compared with the
same period in 2013 since Secure and Promote. Figure 11 shows the trading by
contract for market making volumes.
2.28. As for SMA data, the market making data does not allow us to conclude
whether market making is a success or not, but the relative change in volumes and
product types will allow us to understand the progress of the improvement in
Wholesale Power Market Liquidity: Interim Report
22
forward product availability and price robustness. The trend remains to be confirmed
in the following two quarters.
Figure 10 – Market making volumes traded
Source: ICIS Energy, Secure and Promote (S&P) Licensees, Total Trading only shows market making mandated contracts
traded OTC
Wholesale Power Market Liquidity: Interim Report
23
Figure 11 – Market making volumes traded by contract10
Near-term market progress
2.29. The objective under Secure and Promote was to ensure near-term markets
continue to function effectively. Near-term markets are important for enabling firms
to match their contracted positions with their physical position as they approach the
time of delivery. This allows them to avoid imbalance charges by the system
operator and therefore reduce their costs. There was no intervention in near-term
markets, just the obligation of the licensees to report their day-ahead trading to us.
We are monitoring the state of near-term liquidity through the reporting of licensees
and through monitoring trading on the exchanges, where most near-term trading
takes place.
Summary of analysis
2.30. The near term market is liquid and shows signs of improvement, particularly
intraday trading. Our data shows that near term liquidity has remained secured.
Day-ahead trading has shown a slight improvement since Secure and Promote, and
exchange trading has shown a marked increase, driven mainly by intra-day trading.
This trend in exchange trading is positive as there were concerns that Secure and
Promote might negatively impact exchange trading.
10 M+1, M+2, S+1, Q+1 etc. refer to contracts traded for delivery one month out, two
months out, one season out and one quarter out respectively.
Source: ICIS Energy, Secure and Promote (S&P) Licensees, Total Trading only shows market making mandated contracts traded OTC

Wholesale Power Market Liquidity: Interim Report
24
2.31. We remain vigilant on liquidity in near-term markets and consider day ahead
and intra-day liquidity to be important. We will continue to monitor these markets
closely to track progress.
Near-term liquidity data
2.32. Exchange trading, which is dominated by day-ahead trading, has shown an
upward trend since 2011 and a slight upward trend since Secure and Promote. Total
exchange trading over the last 12 months has increased by 15% compared to the
preceding 12 months. This has been driven mainly by an increase in intra-day
trading, which has increased by 18% over the last 12 months compared to the
preceding year.
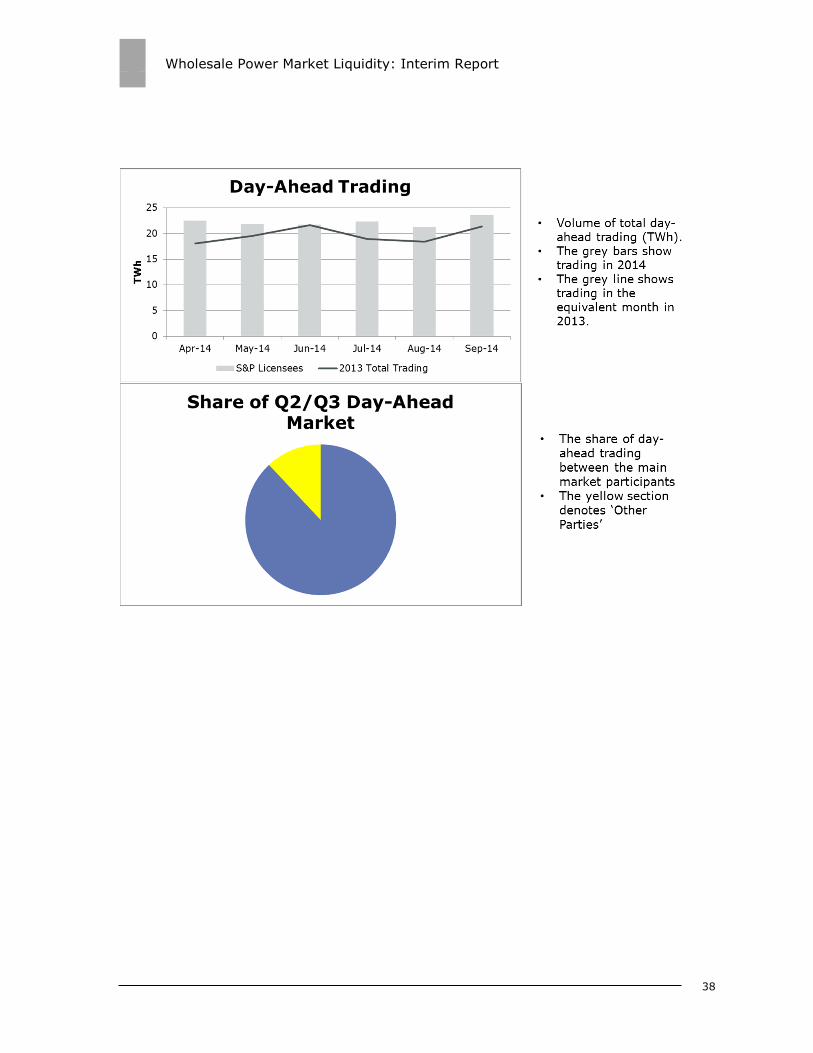
2.33. Day ahead trading is following a very slight upward trend, shown in Figure 12.
Many factors have influenced this, for example market coupling, which has seen
trading on the two day-ahead auction platforms brought together in a ‘GB hub’.
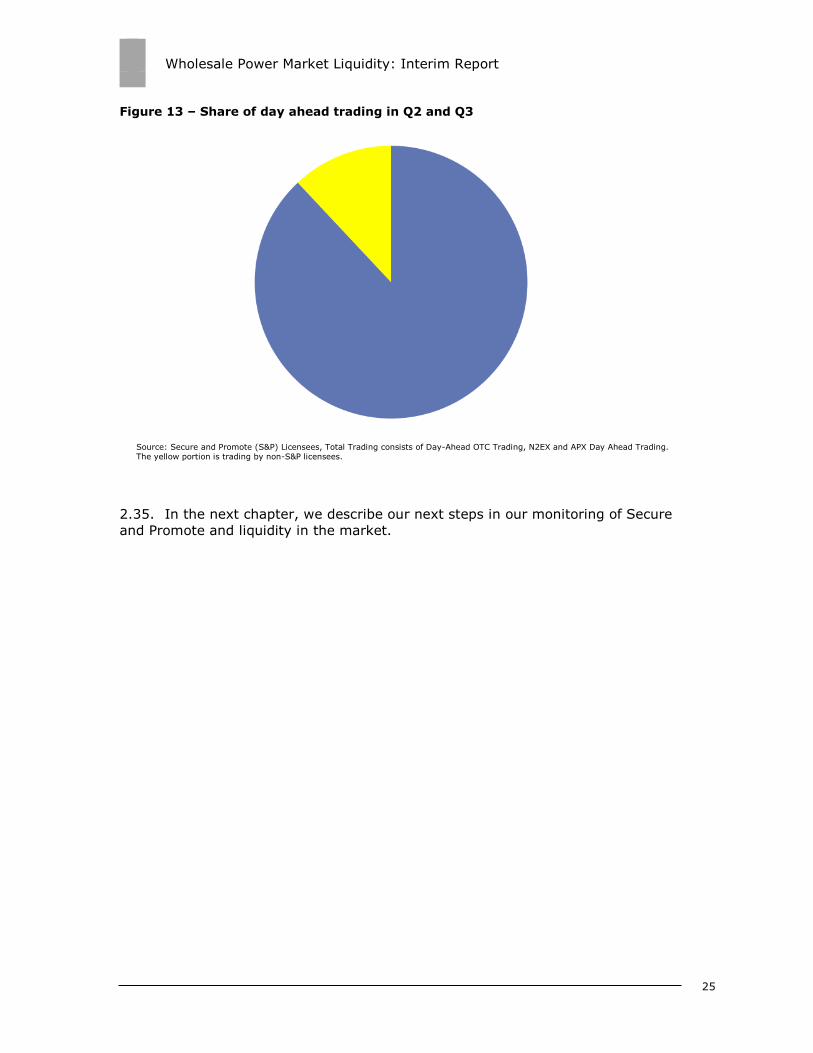
2.34. While day-ahead trading continues to be dominated by the six largest
vertically integrated companies and large independent generators, their share has
fallen from 94% of total trades in Q2 to 82% in Q3. The yellow wedge of the pie
chart in Figure 13 shows the part of trading by parties other than the six largest
vertically integrated companies and the two largest independent generators.
Figure 12 – Day ahead trading
Source: Secure and Promote (S&P) Licensees, Total Trading consists of Day-Ahead OTC Trading, N2EX and APX Day Ahead
Trading
Wholesale Power Market Liquidity: Interim Report
25
Figure 13 – Share of day ahead trading in Q2 and Q3
2.35. In the next chapter, we describe our next steps in our monitoring of Secure
and Promote and liquidity in the market.
Source: Secure and Promote (S&P) Licensees, Total Trading consists of Day-Ahead OTC Trading, N2EX and APX Day Ahead Trading. The yellow portion is trading by non-S&P licensees.
Wholesale Power Market Liquidity: Interim Report
26
3. Next Steps
We are seeking your feedback on Secure and Promote
3.1. As shown in this report, feedback from stakeholders is an essential component
of our monitoring and evaluation of the liquidity Secure and Promote reforms. We
will therefore be looking to continue our stakeholder engagement with interested
parties. We will continue to engage bilaterally with parties in Q1 and Q2 2015.
Policy developments
3.2. Alongside developments in the market, there are a number of issues, reforms
and work streams that may affect liquidity such as the Retail Market Review,
Electricity Market Reform, European financial legislation, and the accessibility of
credit. We will continue to monitor the impact of these.
Continued monitoring and enforcement
3.3. The Secure and Promote licence condition is subject to the normal
enforcement processes applicable to generation and supply licences, set out in
Ofgem’s Enforcement Guidelines on complaints and investigations.11 We are
monitoring compliance based on our wholesale market monitoring, information
collected from the licensees, broader consultation with other market participants,
and any complaints that we may receive.
3.4. As with all licence conditions, any decision to investigate a potential breach of
Secure and Promote would be made in accordance with the Enforcement Guidelines
and would take the facts of the case into account. Factors considered before
investigating a potential infringement include (but are not limited to) the extent of
the potential harm to consumers and whether the licensee addresses the situation.
Post-implementation review
3.5. To minimise uncertainty for market participants, we intend to leave Secure
and Promote in place for a period of three years before making fundamental
changes. After this period, we would expect to conduct a review of whether Secure
and Promote remains appropriate.
11 Ofgem (2014), Enforcement guidelines: https://www.ofgem.gov.uk/ofgem-
publications/89753/enforcementguidelines12september2014publishedversion.pdf
Wholesale Power Market Liquidity: Interim Report
27
Our forward timetable
3.6. We will publish an annual report by the end of summer every year while
Secure and Promote is in place. The first annual report will be published in summer
2015.

Wholesale Power Market Liquidity: Interim Report
28
4. Appendices
Index
Appendix Name of Appendix Page Number
1 Secure and Promote Special Licence Condition 29
2 Liquidity Metrics 34
3 Glossary 39

Wholesale Power Market Liquidity: Interim Report
29
Appendix 1 – The Secure and Promote
Special Licence Condition
This section summarises the Secure and Promote special licence condition. The
detailed obligations of Secure and Promote have been implemented through
schedules to the licence condition, which came into effect on 31 March 2014.
Structure of Secure and Promote
4.1. Figure 14 below summarises our final proposals for Secure and Promote:
Figure 14 – Structure and objectives of Secure and Promote
A Supplier Market Access obligation to meet objective one, with
explicit rules to respect when responding to requests from independent
suppliers.
A market making obligation to meet objective two, with the
option of nominating a third party to undertake the obligation.
Licensees can nominate a third party to undertake market making on
their behalf if they choose.

Wholesale Power Market Liquidity: Interim Report
30
No intervention in near-term markets, but reporting
requirements. Secure and Promote includes reporting requirements to
ensure that we can monitor liquidity in near-term markets effectively.
4.2. The list of licensees is different for the two obligations. The licensees are set
out in Figure 15 below:
Figure 15 – Obligated licensees under Secure and Promote
The detailed design of both the schedules is listed in the following tables.
Supplier Market Access rules Market making obligation
Centrica
Drax Power
EDF Energy
E.ON UK
GDF Suez
RWE Npower
ScottishPower
SSE Generation
Centrica
EDF Energy
E.ON UK
RWE Npower
ScottishPower
SSE Generation
Wholesale Power Market Liquidity: Interim Report
31
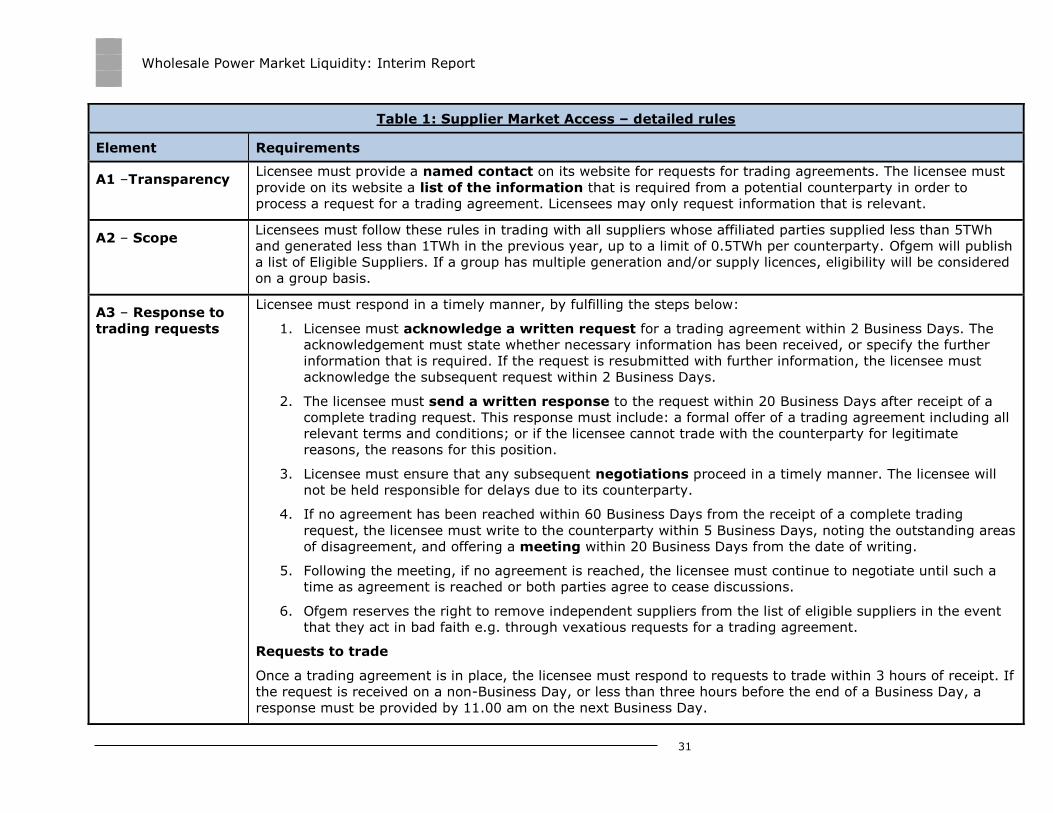
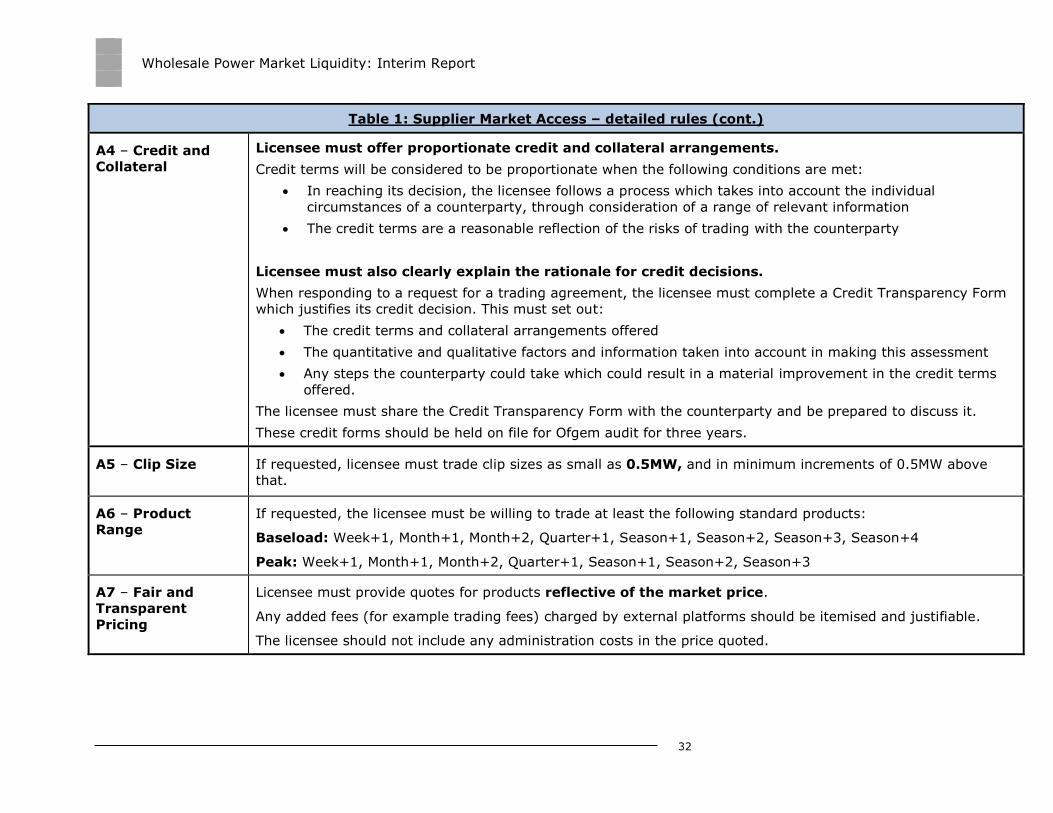
Table 1: Supplier Market Access – detailed rules
Element Requirements
A1 –Transparency Licensee must provide a named contact on its website for requests for trading agreements. The licensee must
provide on its website a list of the information that is required from a potential counterparty in order to
process a request for a trading agreement. Licensees may only request information that is relevant.
A2 – Scope Licensees must follow these rules in trading with all suppliers whose affiliated parties supplied less than 5TWh
and generated less than 1TWh in the previous year, up to a limit of 0.5TWh per counterparty. Ofgem will publish
a list of Eligible Suppliers. If a group has multiple generation and/or supply licences, eligibility will be considered
on a group basis.
A3 – Response to
trading requests
Licensee must respond in a timely manner, by fulfilling the steps below:
1. Licensee must acknowledge a written request for a trading agreement within 2 Business Days. The
acknowledgement must state whether necessary information has been received, or specify the further
information that is required. If the request is resubmitted with further information, the licensee must
acknowledge the subsequent request within 2 Business Days.
2. The licensee must send a written response to the request within 20 Business Days after receipt of a
complete trading request. This response must include: a formal offer of a trading agreement including all
relevant terms and conditions; or if the licensee cannot trade with the counterparty for legitimate
reasons, the reasons for this position.
3. Licensee must ensure that any subsequent negotiations proceed in a timely manner. The licensee will
not be held responsible for delays due to its counterparty.
4. If no agreement has been reached within 60 Business Days from the receipt of a complete trading
request, the licensee must write to the counterparty within 5 Business Days, noting the outstanding areas
of disagreement, and offering a meeting within 20 Business Days from the date of writing.
5. Following the meeting, if no agreement is reached, the licensee must continue to negotiate until such a
time as agreement is reached or both parties agree to cease discussions.
6. Ofgem reserves the right to remove independent suppliers from the list of eligible suppliers in the event
that they act in bad faith e.g. through vexatious requests for a trading agreement.
Requests to trade
Once a trading agreement is in place, the licensee must respond to requests to trade within 3 hours of receipt. If
the request is received on a non-Business Day, or less than three hours before the end of a Business Day, a
response must be provided by 11.00 am on the next Business Day.
Wholesale Power Market Liquidity: Interim Report
32
Table 1: Supplier Market Access – detailed rules (cont.)
A4 – Credit and
Collateral
Licensee must offer proportionate credit and collateral arrangements.
Credit terms will be considered to be proportionate when the following conditions are met:
In reaching its decision, the licensee follows a process which takes into account the individual
circumstances of a counterparty, through consideration of a range of relevant information
The credit terms are a reasonable reflection of the risks of trading with the counterparty
Licensee must also clearly explain the rationale for credit decisions.
When responding to a request for a trading agreement, the licensee must complete a Credit Transparency Form
which justifies its credit decision. This must set out:
The credit terms and collateral arrangements offered
The quantitative and qualitative factors and information taken into account in making this assessment
Any steps the counterparty could take which could result in a material improvement in the credit terms
offered.
The licensee must share the Credit Transparency Form with the counterparty and be prepared to discuss it.
These credit forms should be held on file for Ofgem audit for three years.
A5 – Clip Size If requested, licensee must trade clip sizes as small as 0.5MW, and in minimum increments of 0.5MW above
that.
A6 – Product
Range
If requested, the licensee must be willing to trade at least the following standard products:
Baseload: Week+1, Month+1, Month+2, Quarter+1, Season+1, Season+2, Season+3, Season+4
Peak: Week+1, Month+1, Month+2, Quarter+1, Season+1, Season+2, Season+3
A7 – Fair and
Transparent
Pricing
Licensee must provide quotes for products reflective of the market price.
Any added fees (for example trading fees) charged by external platforms should be itemised and justifiable.
The licensee should not include any administration costs in the price quoted.

Wholesale Power Market Liquidity: Interim Report
33
Table 2: Market making Obligation – detailed rules
B1 – Nominating
a third party
Licensee may nominate a third party to undertake their obligation on the same basis set out in this licence condition
(unless otherwise specified). The licensee must not nominate any party delivering more than one other licensee’s
obligation.
B2 – Platform The licensee is required to market make on any qualifying GB wholesale electricity market trading platform.
B3 – Products The licensee must post bids and offer prices in the following products:
Baseload: Month+1, Month+2, Quarter+1, Season+1, Season+2, Season+3, Season+4
Peak: Month+1, Month+2, Quarter+1, Season+1, Season+2, Season+3.
B4 – Availability For each of the listed products the licensee must post prices within the bid-offer spread limits specified for 100 per cent of
the two hour-long trading windows. A volume cap and a fast market rule exist that allow opting out of the window for the
applicable product(s).
B5 – Bid-offer
spreads
When market making, the licensee must maintain a spread between their bid and offer price narrower than:
Baseload Peak
Month+1
Month+2
Quarter+1
Season+1
Season+2
0.5%
Month+1
Month+2
Quarter+1
Season+1
Season+2
0.7%
Season+3
Season+4
0.6%
Season+3
1%
The allowed spreads were higher than the above by 2% for the first three months after the implementation of Secure and
Promote.
B6 – Trade size At any particular posted bid or offer price, licensee must be willing to trade in clip sizes of 5MW. The maximum trade size
the licensee must execute is 10MW, although they may trade larger volumes if they wish.

Wholesale Power Market Liquidity: Interim Report
34
Appendix 2 – Liquidity Metrics
Wholesale Power Market Liquidity: Interim Report
35
Wholesale Power Market Liquidity: Interim Report
36
Wholesale Power Market Liquidity: Interim Report
37
Wholesale Power Market Liquidity: Interim Report
38
Wholesale Power Market Liquidity: Interim Report
39
Appendix 3 – Glossary
A
Agency for the Cooperation of Energy Regulators (ACER)
ACER is a European Union body which cooperates with EU institutions and stakeholders,
notably National Regulatory Authorities (NRAs) and European Networks of Transmission
System Operators (ENTSOs), to deliver a series of instruments for the completion of a
single energy market.
APX
APX owns and operates energy exchange markets in the Netherlands, UK and Belgium.
APX provides a power spot exchange service in the UK.
B
Barrier to entry
A factor that may restrict entry into a market.
Baseload product
A product which provides for the delivery of a flat rate of electricity in each hourly
period over the period of the contract.
Bid-offer spread
The bid-offer spread shows the difference between the price quoted for an immediate
sale (offer) and an immediate purchase (bid) of the same product; it is often used as a
measure of liquidity.
Broker
A broker handles and intermediates between orders to buy and sell. For this service, a
commission is charged which, depending upon the broker and the size of the
transaction, may or may not be negotiated.
Wholesale Power Market Liquidity: Interim Report
40
C
Churn rate
Churn is typically measured as the volume traded as a multiple of the underlying
consumption or production level of a commodity.
Clearing
The process by which a central organisation acts as an intermediary and assumes the
role of a buyer and seller for transactions in order to reconcile orders between
transacting parties.
Clip size
The size (usually in MW) of the contract to be traded.
Collateral
A borrower will pledge collateral (securities, cash etc.) in order to demonstrate their
ability to meet their obligations to repay monies loaned. The collateral serves as
protection for a lender against a borrower's risk of default.
Contract for Difference (CfD)
A contract where the payoff is defined as the difference between a pre-agreed
‘strike’ price and a reference price (determined in relation to an underlying
commodity). The Government has proposed the use of CfDs as part of Electricity
Market Reform. CfDs under EMR are intended to encourage investment in low-carbon
generation by providing greater long-term revenue certainty to investors.
Credit line
An arrangement between two parties that establishes a maximum loan balance that the
licensee will permit the borrower to maintain.
D
Day-ahead market
A form of near-term market where products are traded for delivery in the following
day.
Wholesale Power Market Liquidity: Interim Report
41
Department of Energy and Climate Change (DECC)
The UK Government department responsible for energy and climate change policy.
E
Electricity Market Reform (EMR)
EMR is the Government’s approach to reforming the electricity system to ensure the
UK’s future electricity supply is secure, low-carbon and affordable.
Exchange
A type of platform on which power products are sold. Typically an exchange would
allow qualifying members to trade anonymously with other parties and the risks
between parties would be managed by a clearing service.
F
Financial Product
A contract that is settled financially at maturity rather than by the delivery of a physical
commodity.
Forward Curve
A series of sequential time segments within which it is possible to trade a particular
commodity and for which prices are available.
Forward trading
The trading of commodities to be delivered at a future date. Forward products may be
physically settled – by delivery – or financially settled.
G
Grid Trade Master Agreement
A Grid Trade Master Agreement (GTMA) is a legal agreement between the two parties
in a trade that sets out terms in relation to financially settling the contract and
physically delivering the power.

Wholesale Power Market Liquidity: Interim Report
42
H
Hedging
Transactions which fix the future price of a good or service, and thereby remove
exposure to the daily (or spot) price of a good or service. This enables those
purchasing a good or service to reduce the risk of short term price movements.
I
ICE
Intercontinental Exchange, an American financial company that operates Internet-
based marketplaces which trade futures and over-the-counter (OTC) energy and
commodity contracts as well as derivative financial products.
IFA
The electricity interconnector between GB and France.
Imbalance
The difference between a party’s contracted position and metered position measured on
a half-hourly basis.
Intra-day trading
Refers to the market in which products traded are on the same day as delivery.
L
Liquidity
Liquidity is the ability to quickly buy and sell a commodity without a significant change
in its price and without incurring significant transaction costs.
M
Market Coupling
Market coupling is a method for integrating electricity markets in different areas,
applied across a number of European countries.
Wholesale Power Market Liquidity: Interim Report
43
Market Maker
A firm which is regularly prepared to buy and sell in a commodities or financial market.
Market makers post two-sided (bid and ask) prices on a regular basis, encouraging
greater liquidity.
N
N2EX
The N2 Exchange, a GB electricity market platform, is operated by Nord Pool Spot AS.
Near-term market
The market in which the products are traded close to delivery (for example, on the day
of delivery or day-ahead of delivery.
Nord Pool
Nord Pool, the Nordic Power Exchange, a single power market for Norway, Denmark,
Sweden and Finland.
O
Off-peak product
A product which provides for the delivery of a flat rate of electricity for the period of the
day when demand is typically lowest for the duration of the contract.
Over the Counter (OTC)
Trading of financial instruments, including commodities, that takes place directly
between counterparties. This is in contrast to exchange-based trading where the
exchange acts as a counterparty to all trades.
P
Peak product
A product which provides for the delivery of a flat rate of electricity for the period of the
day when demand is typically highest for the duration of the contract.
Wholesale Power Market Liquidity: Interim Report
44
Physical settlement
A contract that, at maturity, results in an exchange of the contracted good for its
contracted value.
Product
The type of contract available. Examples include day-ahead, weekly, weekend, block
seasonal, year, etc. Standard products are those that are widely traded on well-
established terms, so exchanges generally deal in standard products. By contrast,
structured products are those where the terms are precisely tailored to match the
contract buyer’s requirements, and they usually involve variable contract volumes
and/or non-standard volumes and durations.
R
Reference price
A price for a product which has been revealed through enough trading for it to be
considered reflective of the product’s ‘true’ market value.
Retail Market Review (RMR)
Ofgem’s Retail Market Review aims to make the energy market simpler, clearer and
fairer for consumers, encouraging and equipping them to engage effectively so that
they can get the best deal.
S
Shaped product
A shaped product is a contract which specifies different amounts of electricity to be
delivered at different times. A bespoke shaped product with half-hour granularity could
specify a different volume for every half-hour period of the contract’s duration.
Spot market
Refers to the market in which products traded are delivered at (or close to) delivery.
T
Third Package
The Third Package is EU legislation on European electricity and gas markets that
entered into force on the 3rd September 2009. The purpose of the Third Package is to
Wholesale Power Market Liquidity: Interim Report
45
further liberalise European energy markets. DECC is primarily responsible for its
transposition in Great Britain and had to do this by 3rd March 2011.
V
Vertical Integration
Where one corporate group owns two or more parts of the energy supply chain. For
example, where the same group features both generation and supply businesses.
W
Window
Refers to one of the two one-hour windows starting at 10.30 am and 2.30 pm on
business days when the market making obligation applies.