Liquid-Liquid Equilibrium of Methyl Esters of Fatty Acid ... · Methanol / Glycerol and Fatty Acid...
5
Abstract—Biodiesel is a fuel commonly produced through the process of transesterification or alcoholysis. In this reaction, triglycerides react with short chain alcohols, producing a mixture of fatty acid esters (biodiesel) and glycerol. Esters of fatty acids and glycerol are partially miscible, forming two liquid phases in the separation of these products. The determination of equilibrium data for liquid-liquid (ELL) for these systems is essential to a better understanding of the reaction process, improving the reaction rate, selectivity, and simulation and optimization of the reactor and the system of separation of products. In this paper we experimentally measured data for ELL pseudo-ternary systems of fatty acid methyl esters (FAME)/methanol/glycerol and fatty acid ethyl esters (FAEE)/ethanol/glycerol at 30, 45 and 60 ° C. The biodiesel used in this work was produced by transesterification of cottonseed oil. The measured experimental data were used to evaluate the prediction of the UNIFAC method for such systems. Index Terms—Biodiesel, liquid-liquid equilibrium, UNIFAC. I. INTRODUCTION The production of biofuels derived from renewable sources is becoming an alternative to petroleum-based fuels due to high prices of fossil fuel, decreasing oil reserves and growing concerns about environmental issues [1]. In this context, biodiesel has become a potential alternative to reduce dependence on derivates from petroleum and decrease the emission of polluting gases such as CO 2, SOx and particulates. Furthermore, biodiesel is renewable, biodegradable and nontoxic. It can be produced from a reaction known as transesterification in which triacylglycerols from vegetable oil or animal fat reacts with short-chain alcohols to form a mixture of glycerol and fatty acid esters (biodiesel). Several sources of vegetable oil and animal fat can be used for biodiesel production. In the case of alcohol, are used short chain such as methanol and ethanol. Methanol is most commonly used alcohol to perform transesterification reaction due to lower cost and more favorable properties in the process. Since ethanol is an alcohol less toxic than the first and can be obtained from biomass, providing a biodiesel which production is completely renewable [2], [3]. Because of the reaction be reversible, the alcohol is used in excess. High conversions of esters are reported in the literature for a molar ratio alcohol/oil 6:1 [4]. Catalysts are generally added to the system to accelerate the reaction. The fatty acid esters and glycerol, obtained in the transesterification reaction are partially miscible, so that during the separation of these products, there is the formation of two liquid phases [5]. The denser phase is rich in glycerol and the less dense phase contains the fatty acid esters which will be used as biodiesel after the purification steps. The unreacted alcohol is distributed between two liquid phases [2]. Knowledge of phase equilibria of these systems is necessary for a better understanding of the process and optimization of the reactor and separation systems [1]. Thus, the adequate description of the distribution of the products of transesterification between the two phases, in a wide range of process conditions, is essential for the study and design of the equipment involved in the production and purification of biodiesel [6]. Furthermore, simulations for the development of new processes for such systems require thermodynamic models that can adequately describe these mixtures [5]. The thermodynamic modeling of phase liquid-liquid equilibrium requires that be determined, among the existing thermodynamic models, the most suitable to represent the excess Gibbs energy (GE). In this sense, the method UNIFAC (Universal Quasi-Chemical Functional Group Activity Coefficient) uses existing experimental data to predict the phase equilibrium of systems for which experimental data are not available. The UNIFAC is a group contribution method in which a liquid mixture can be considered a solution of structural units from which the molecules are formed [7]. In this work were determined the of liquid-liquid equilibrium (LLE) for the pseudo-ternary systems of fatty acid methyl ester (FAME)/methanol/glycerol and fatty acid ethyl ester (FAEE)/ethanol/glycerol at 30, 45 and 60 ° C. The measured data were used for evaluation of the performance of models UNIFAC and UNIFAC-Dortmund to prediction the LLE of this type of system. II. METHODOLOGY A. Materials and Methods To determine the LLE data were used glycerol (99.5% VETEC), methanol (≥ 99.9%, Merck), ethanol (≥ 99.9%, Merck) and methyl and ethyl biodiesel produced in two Liquid-Liquid Equilibrium of Methyl Esters of Fatty Acid / Methanol / Glycerol and Fatty Acid Ethyl Esters / Ethanol / Glycerol: A Case Study for Biodiesel Application Ana Carolina de Sousa Maia, Iury Sousa e Silva, and Luiz Stragevitch 285 International Journal of Chemical Engineering and Applications, Vol. 4, No. 5, October 2013 Manscript reveived July 1, 2013; revised September 5, 2013. The authors are with the Fuels Laboratory, Department of Chemical Engineering, Federal University of Pernambuco, Av Professor Arthur de Sá S/N, Cidade Universitá ria, 5070-521, Recife-PE, Brazil (e-mail: [email protected]). DOI: 10.7763/IJCEA.2013.V4.311
Transcript of Liquid-Liquid Equilibrium of Methyl Esters of Fatty Acid ... · Methanol / Glycerol and Fatty Acid...

Abstract—Biodiesel is a fuel commonly produced through the
process of transesterification or alcoholysis. In this reaction,
triglycerides react with short chain alcohols, producing a
mixture of fatty acid esters (biodiesel) and glycerol. Esters of
fatty acids and glycerol are partially miscible, forming two
liquid phases in the separation of these products. The
determination of equilibrium data for liquid-liquid (ELL) for
these systems is essential to a better understanding of the
reaction process, improving the reaction rate, selectivity, and
simulation and optimization of the reactor and the system of
separation of products. In this paper we experimentally
measured data for ELL pseudo-ternary systems of fatty acid
methyl esters (FAME)/methanol/glycerol and fatty acid ethyl
esters (FAEE)/ethanol/glycerol at 30, 45 and 60 ° C. The
biodiesel used in this work was produced by transesterification
of cottonseed oil. The measured experimental data were used to
evaluate the prediction of the UNIFAC method for such
systems.
Index Terms—Biodiesel, liquid-liquid equilibrium, UNIFAC.
I. INTRODUCTION
The production of biofuels derived from renewable
sources is becoming an alternative to petroleum-based fuels
due to high prices of fossil fuel, decreasing oil reserves and
growing concerns about environmental issues [1].
In this context, biodiesel has become a potential alternative
to reduce dependence on derivates from petroleum and
decrease the emission of polluting gases such as CO2, SOx
and particulates. Furthermore, biodiesel is renewable,
biodegradable and nontoxic. It can be produced from a
reaction known as transesterification in which
triacylglycerols from vegetable oil or animal fat reacts with
short-chain alcohols to form a mixture of glycerol and fatty
acid esters (biodiesel).
Several sources of vegetable oil and animal fat can be used
for biodiesel production. In the case of alcohol, are used short
chain such as methanol and ethanol. Methanol is most
commonly used alcohol to perform transesterification
reaction due to lower cost and more favorable properties in
the process. Since ethanol is an alcohol less toxic than the
first and can be obtained from biomass, providing a biodiesel
which production is completely renewable [2], [3].
Because of the reaction be reversible, the alcohol is used in
excess. High conversions of esters are reported in the
literature for a molar ratio alcohol/oil 6:1 [4]. Catalysts are
generally added to the system to accelerate the reaction.
The fatty acid esters and glycerol, obtained in the
transesterification reaction are partially miscible, so that
during the separation of these products, there is the formation
of two liquid phases [5]. The denser phase is rich in glycerol
and the less dense phase contains the fatty acid esters which
will be used as biodiesel after the purification steps. The
unreacted alcohol is distributed between two liquid phases
[2].
Knowledge of phase equilibria of these systems is
necessary for a better understanding of the process and
optimization of the reactor and separation systems [1]. Thus,
the adequate description of the distribution of the products of
transesterification between the two phases, in a wide range of
process conditions, is essential for the study and design of the
equipment involved in the production and purification of
biodiesel [6]. Furthermore, simulations for the development
of new processes for such systems require thermodynamic
models that can adequately describe these mixtures [5].
The thermodynamic modeling of phase liquid-liquid
equilibrium requires that be determined, among the existing
thermodynamic models, the most suitable to represent the
excess Gibbs energy (GE). In this sense, the method
UNIFAC (Universal Quasi-Chemical Functional Group
Activity Coefficient) uses existing experimental data to
predict the phase equilibrium of systems for which
experimental data are not available. The UNIFAC is a group
contribution method in which a liquid mixture can be
considered a solution of structural units from which the
molecules are formed [7].
In this work were determined the of liquid-liquid
equilibrium (LLE) for the pseudo-ternary systems of fatty
acid methyl ester (FAME)/methanol/glycerol and fatty acid
ethyl ester (FAEE)/ethanol/glycerol at 30, 45 and 60 ° C. The
measured data were used for evaluation of the performance
of models UNIFAC and UNIFAC-Dortmund to prediction
the LLE of this type of system.
II. METHODOLOGY
A. Materials and Methods
To determine the LLE data were used glycerol (99.5%
VETEC), methanol (≥ 99.9%, Merck), ethanol (≥ 99.9%,
Merck) and methyl and ethyl biodiesel produced in two
Liquid-Liquid Equilibrium of Methyl Esters of Fatty Acid /
Methanol / Glycerol and Fatty Acid Ethyl Esters / Ethanol /
Glycerol: A Case Study for Biodiesel Application
Ana Carolina de Sousa Maia, Iury Sousa e Silva, and Luiz Stragevitch
285
International Journal of Chemical Engineering and Applications, Vol. 4, No. 5, October 2013
Manscript reveived July 1, 2013; revised September 5, 2013.
The authors are with the Fuels Laboratory, Department of Chemical
Engineering, Federal University of Pernambuco, Av Professor Arthur de Sá
S/N, Cidade Universitária, 5070-521, Recife-PE, Brazil (e-mail:
DOI: 10.7763/IJCEA.2013.V4.311
different ways. For the pseudo-ternary system
FAME/methanol/glycerol was used a biodiesel of industrial
origin, produced by methanolysis of cottonseed oil. For the
pseudo-ternary system FAEE / ethanol / glycerol, ethyl
biodiesel cotton was produced by ethanolysis of refined
cottonseed oil with the following reaction conditions: molar
ratio alcohol/oil 6/1; catalyst NaOH (≥ 99.0 %, Merck), mass
fraction of catalyst in relation to the mass of oil 0.75%,
stirring 300 rpm and reaction temperature 50 ° C. The ester
content in the methyl biodiesel was 99.1% and in the ethyl
biodiesel 97.2%, determined by gas chromatography
according to EN 14103.
The composition of each phase was performed by gas
chromatography with flame ionization detector using a
capillary column chromatography DB-1 (J & W) with a
length of 30 m, internal diameter 0.32 mm and thickness of
film of 0.3 micrometers. Hydrogen (99.999%) was used as
carrier gas and isopropanol (≥ 99.8%, Merck) was used as
solvent for homogenization of samples.
B. Experimental Procedure
Glass cells with a volume of 100 mL and mechanical
stirrers were used to perform LLE measures at atmospheric
pressure. The ternary mixtures ester/alcohol/glycerol were
prepared gravimetrically and the three components of the
mixture were added directly to the LLE cell. To maintain
cells at constant temperature, was used a thermostatic bath
(Julabo TE-184) using water as the heating fluid. The system
was maintained at the desired temperature with an accuracy
of ± 0.2 ° C. To measure the temperature of the mixture in the
cell was used a calibrated temperature sensor PT100.
To promote contact between the phases, the system was
kept under vigorous stirring by mechanical stirrer for one
hour and then the system was allowed to stand to reach
equilibrium after the phase separation. After equilibrium
attained, aliquots of each phase were collected with a glass
syringe and the mass fraction of each determined by gas
chromatography.
C. Thermodynamic Modeling
The prediction of LLE for the systems experimentally
evaluated was performed using a liquid-liquid flash
calculation (LLF) isotherm at 30, 45 and 60 ° C and the
activity coefficients were predicted by group contribution
methods UNIFAC and UNIFAC-Dortmund. The comparison
between experimental and calculated values by UNIFAC was
performed using the average deviation given by
PC
1 1
2calII,expII,2calI,expI,
2100
P C
NN
wwww
w
N
j
N
i
ijijijij
(1)
where wij is the mass fraction of component i in the point j, I
and II are the phases in equilibrium, exp and cal denote
measured and calculated values, respectively, NC is the
number of components and NP is the number of experimental
points.
III. RESULTS AND DISCUSSION
The experimental data of LLE for the systems methyl
esters/methanol/glycerol and ethyl esters/ethanol/glycerol at
30, 45 and 60 ° C are shown in Tables 1 and 2, respectively.
The results show, as expected, that the glycerol phase is
richer in alcohol (methanol or ethanol) than the ester phase.
For the ethyl systems, the results show that although ethanol
found in greater quantity in the glycerol rich phase, the
presence of this component in the ester rich phase is greater
than that observed for methanol. In the case of ethyl systems,
the presence of ethanol in this system also contributes to the
presence of higher amount of glycerol in the ester rich phase
since this alcohol promotes a greater dispersion of glycerin in
the biodiesel.
For both systems studied, the increase in temperature
promotes increased miscibility of the components and the
phase rich in ester has a higher amount of alcohol.
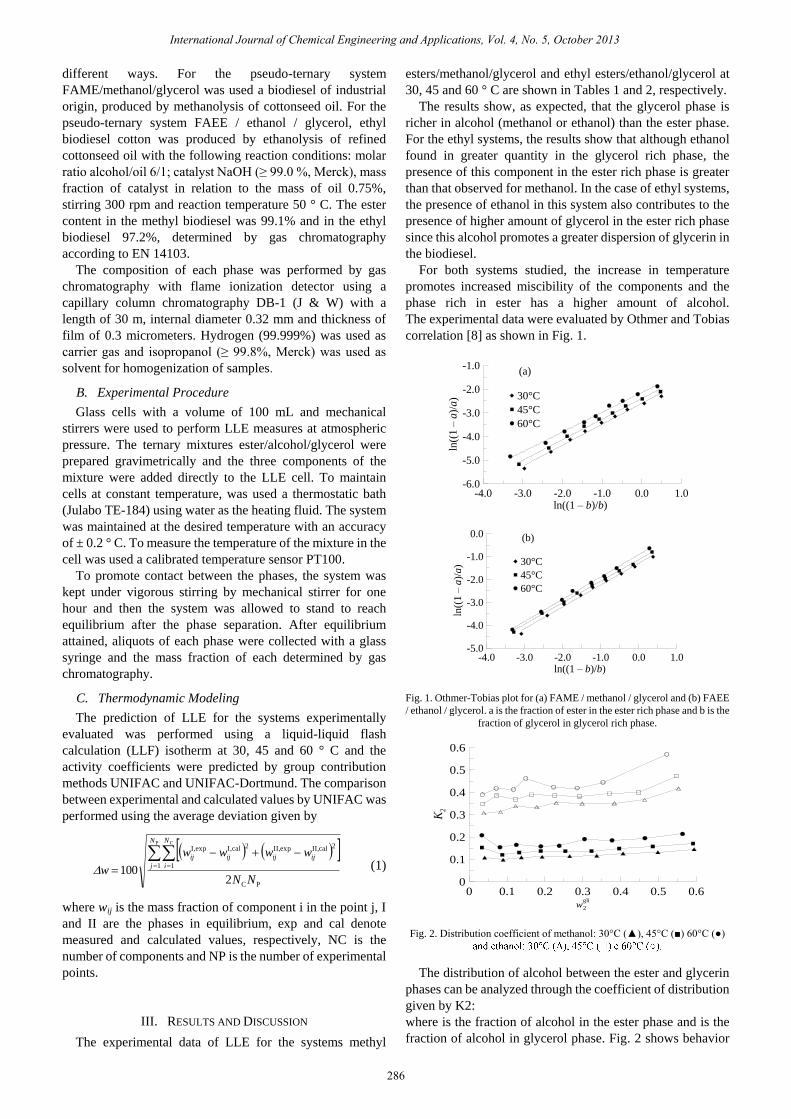
The experimental data were evaluated by Othmer and Tobias
correlation [8] as shown in Fig. 1.
-4.0 -3.0 -2.0 -1.0 0.0 1.0ln((1 – b)/b)
-6.0
-5.0
-4.0
-3.0
-2.0
-1.0
ln((
1 –
a)/
a)
(a)
30°C
45°C
60°C
-4.0 -3.0 -2.0 -1.0 0.0 1.0ln((1 – b)/b)
-5.0
-4.0
-3.0
-2.0
-1.0
0.0
ln((
1 –
a)/
a)
(b)
30°C
45°C
60°C
Fig. 1. Othmer-Tobias plot for (a) FAME / methanol / glycerol and (b) FAEE
/ ethanol / glycerol. a is the fraction of ester in the ester rich phase and b is the
fraction of glycerol in glycerol rich phase.
0 0.1 0.2 0.3 0.4 0.5 0.6
w2
gli
0
0.1
0.2
0.3
0.4
0.5
0.6
K2
Fig. 2. Distribution coefficient of methanol: 30°C (▲), 45°C (■) 60°C (●)
The distribution of alcohol between the ester and glycerin
phases can be analyzed through the coefficient of distribution
given by K2:
where is the fraction of alcohol in the ester phase and is the
fraction of alcohol in glycerol phase. Fig. 2 shows behavior
286
International Journal of Chemical Engineering and Applications, Vol. 4, No. 5, October 2013

of the distribution coefficient of methanol and ethanol.
As can be seen in Fig. 2, the coefficient of distribution of
ethanol is smaller than 1, indicating higher concentration of
alcohol in glycerol phase than in the ester phase. The effect is
expected since methanol, ethanol and glycerol have similar
structures with O-H groups. The attractive interaction of
these molecules is by hydrogen bonding which means that
alcohol will be distributed preferentially in the glycerol
phase.
The experimental results show that the distribution
coefficient of alcohol increases with increasing temperature
in both systems. This result is also expected since the
association effects will decrease with temperature (Andreatta
et al., 2008).
IV. LIQUID-LIQUID EQUILIBRIUM PREDICTION
Biodiesel is composed of a mixture of fatty acid esters of
different chains, but the system can be approximated as a
pseudo ternary system (Zhou et al., 2006, Cheng et al., 2009).
The biodiesel can then be considered as consisting of a single
ester (ester representative), which best represents the
biodiesel used.
In this work, the methyl biodiesel was represented by
methyl linoleate, and the ethyl biodiesel was represented by
ethyl linoleate because these esters represent over 50% of the
composition of the biodiesel. The methyl biodiesel presented
57.9% of methyl linoleate and the ethyl biodiesel 53.8% of
ethyl linoleate.
TABLE I: DISTRIBUTION OF GROUPS FOR UNIFAC AND UNIFAC-DORTMUND
METHODS (CH3, CH2, CH, CH=CH)
Component CH3 CH2 CH CH=CH
Methyl Linoleatea,b 2 11 0 2
Ethyl Linoleatea,b 2 12 0 2
Methanola 1 0 0 0
Methanolb 0 0 0 0
Ethanola,b 1 1 0 0
Glycerola 0 2 1 0
Glycerolb 0 2 1 0
a UNIFAC; b UNIFAC-Dortmund;
TABLE II: DISTRIBUTION OF GROUPS FOR UNIFAC AND UNIFAC-DORTMUND
METHODS (OH/OH-P, OH-S, CH2COO, CH3OH)
Component OH/OH-p OH-s CH2COO CH3OH
Methyl Linoleatea,b 2 11 0 2
Ethyl Linoleatea,b 2 12 0 2
Methanola 1 0 0 0
Methanolb 0 0 0 0
Ethanola,b 1 1 0 0
Glycerola 0 2 1 0
Glycerolb 0 2 1 0 a UNIFAC; b UNIFAC-Dortmund
Table I and Table II shows the distribution of groups of
system components for the UNIFAC and
UNIFAC-Dortmund methods. Figs. 3-8 show a comparison
between experimental data and predictions by the UNIFAC
and UNIFAC-Dortmund methods for the systems methyl
esters/methanol/glycerol and ethyl esters/ethanol/glycerol
with different equilibrium temperatures (30, 45 and 60 ° C).
Figs. 3-5 show the experimental data for liquid-liquid
equilibrium of methyl esther/methanol/glycerol with
different temperatures, 30, 45 and 60ºC, and the
thermodynamic modeling with UNIFAC and UNIFAC
Dortmund models.
Fig. 3. Liquid-liquid equilibrium diagram system of methyl
ester/methanol/glycerol at 30ºC
Fig. 4. Liquid-liquid equilibrium diagram system of methyl
ester/methanol/glycerol at 45ºC
Fig. 5. Liquid-liquid equilibrium diagram system of methyl
ester/methanol/glycerol at 60ºC
Figs. 6-8 show the experimental data for liquid-liquid
equilibrium of ethyl esther/ethanol/glycerol with different
temperatures, 30, 45 and 60ºC, and the thermodynamic
modeling with UNIFAC and UNIFAC Dortmund models.
287
International Journal of Chemical Engineering and Applications, Vol. 4, No. 5, October 2013
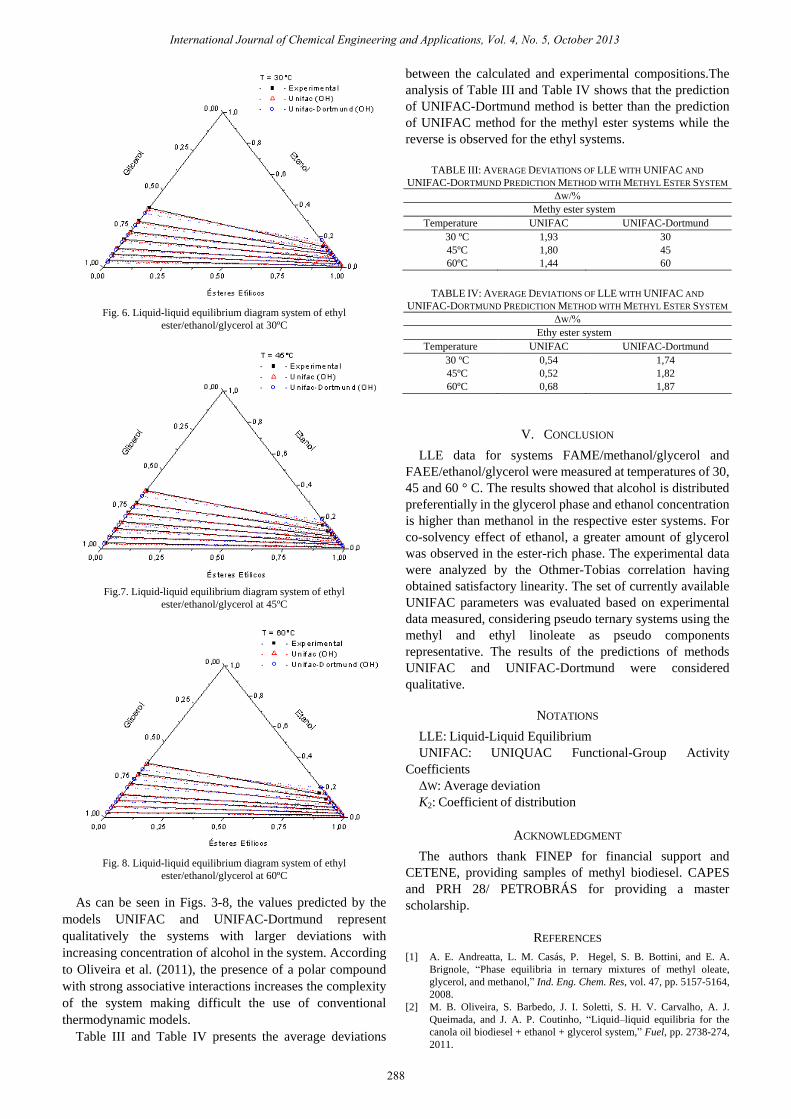
Fig. 6. Liquid-liquid equilibrium diagram system of ethyl
ester/ethanol/glycerol at 30ºC
Fig.7. Liquid-liquid equilibrium diagram system of ethyl
ester/ethanol/glycerol at 45ºC
Fig. 8. Liquid-liquid equilibrium diagram system of ethyl
ester/ethanol/glycerol at 60ºC
As can be seen in Figs. 3-8, the values predicted by the
models UNIFAC and UNIFAC-Dortmund represent
qualitatively the systems with larger deviations with
increasing concentration of alcohol in the system. According
to Oliveira et al. (2011), the presence of a polar compound
with strong associative interactions increases the complexity
of the system making difficult the use of conventional
thermodynamic models.
Table III and Table IV presents the average deviations
TABLE III: AVERAGE DEVIATIONS OF LLE WITH UNIFAC AND
UNIFAC-DORTMUND PREDICTION METHOD WITH METHYL ESTER SYSTEM
Δw/%
Methy ester system
Temperature UNIFAC UNIFAC-Dortmund
30 ºC 1,93 30
45ºC 1,80 45
60ºC 1,44 60
TABLE IV: AVERAGE DEVIATIONS OF LLE WITH UNIFAC AND
UNIFAC-DORTMUND PREDICTION METHOD WITH METHYL ESTER SYSTEM
Δw/%
Ethy ester system
Temperature UNIFAC UNIFAC-Dortmund
30 ºC 0,54 1,74
45ºC 0,52 1,82
60ºC 0,68 1,87
V. CONCLUSION
LLE data for systems FAME/methanol/glycerol and
FAEE/ethanol/glycerol were measured at temperatures of 30,
45 and 60 ° C. The results showed that alcohol is distributed
preferentially in the glycerol phase and ethanol concentration
is higher than methanol in the respective ester systems. For
co-solvency effect of ethanol, a greater amount of glycerol
was observed in the ester-rich phase. The experimental data
were analyzed by the Othmer-Tobias correlation having
obtained satisfactory linearity. The set of currently available
UNIFAC parameters was evaluated based on experimental
data measured, considering pseudo ternary systems using the
methyl and ethyl linoleate as pseudo components
representative. The results of the predictions of methods
UNIFAC and UNIFAC-Dortmund were considered
qualitative.
ACKNOWLEDGMENT
The authors thank FINEP for financial support and
CETENE, providing samples of methyl biodiesel. CAPES
and PRH 28/ PETROBRÁS for providing a master
scholarship.
REFERENCES
[1] A. E. Andreatta, L. M. Casás, P. Hegel, S. B. Bottini, and E. A.
Brignole, “Phase equilibria in ternary mixtures of methyl oleate,
glycerol, and methanol,” Ind. Eng. Chem. Res, vol. 47, pp. 5157-5164,
2008.
[2] M. B. Oliveira, S. Barbedo, J. I. Soletti, S. H. V. Carvalho, A. J.
Queimada, and J. A. P. Coutinho, “Liquid–liquid equilibria for the
canola oil biodiesel + ethanol + glycerol system,” Fuel, pp. 2738-274,
2011.
288
International Journal of Chemical Engineering and Applications, Vol. 4, No. 5, October 2013
between the calculated and experimental compositions.The
analysis of Table III and Table IV shows that the prediction
of UNIFAC-Dortmund method is better than the prediction
of UNIFAC method for the methyl ester systems while the
reverse is observed for the ethyl systems.
NOTATIONS
LLE: Liquid-Liquid Equilibrium
UNIFAC: UNIQUAC Functional-Group Activity
Coefficients
ΔW: Average deviation
K2: Coefficient of distribution

[3] A. B. Machado, Y. C. Ardila, L. H. Oliveira, M. Aznar, and M. R. W.
Maciel, “Liquid_Liquid Equilibrium Study in Ternary Castor Oil
Biodiesel + Ethanol + Glycerol and Quaternary Castor Oil Biodiesel +
Ethanol + Glycerol + NaOH Systems at (298.2 and 333.2) K.,” J. Chem.
Eng. Data., vol. 56, pp. 2196-2201, 2011.
[4] U. Rashid, F. Anwar, and G. Knothe, “Evaluation of biodiesel obtained
from cottonseed oil,” Fuel Proc. Tech, vol. 90, pp. 1157-1163, 2009
[5] D. S. Negi, F. Sobotka, T. Kimmel, G. Wonzny, and R. Schomcker,
“Liquid-liquid phase equilibrium in glycerol-methanol-methyl oleate
and glycerol-monoolein-methyl oleate ternary systems,” Ind. Eng.
Chem. Res., vol. 45, pp. 3693-3696, 2006.
[6] A. B. Machado, Y. C. Ardila, L. H. Oliveira, M. Aznar, and M. R. W.
Maciel, “Liquid_liquid equilibrium study in ternary castor oil biodiesel
+ ethanol + glycerol and quaternary castor oil biodiesel + ethanol +
glycerol + NaOH systems at (298.2 and 333.2) K.,” J. Chem. Eng.
Data., vol. 56, pp. 2196-2201, 2011.
[7] J. M. Prausnitz, B. E. Poling, and J. P. O’Connell, The Properties of
Gases and Liquids, McGraw-Hill Book Company, New York, 2001.
[8] D. T. Othmer and P. E. Tobias, “Tie line correlation,” Ind. Eng. Chem.,
vol. 34, pp. 693-69, 1942.
289
International Journal of Chemical Engineering and Applications, Vol. 4, No. 5, October 2013
Iury Sousa e Silva was born on July 15, 1988. He got
his bachelor's degree in Chemical Engineering from
Federak University od Pernambuco (UFPE), between
2006 to 2010. Process Engineer between 2010 to 2012
at M&G Fibers. Major Field of study is
thermodynamics and phase equilibrium. Master in
Chemical Engineering program sponsored by
PRH28/Petrobrás.