LIQUID CHROMATOGRAPHY- MASS SPECTROMETRY LIQUID CHROMATOGRAPHY- MASS SPECTROMETRY 1.
A P P L I C A T I O N N O T E
Introduction
Naphthenic acids (NAs) are water soluble weak acids, with the general chemical formula CnH2n+zO2, where n is the carbon number,
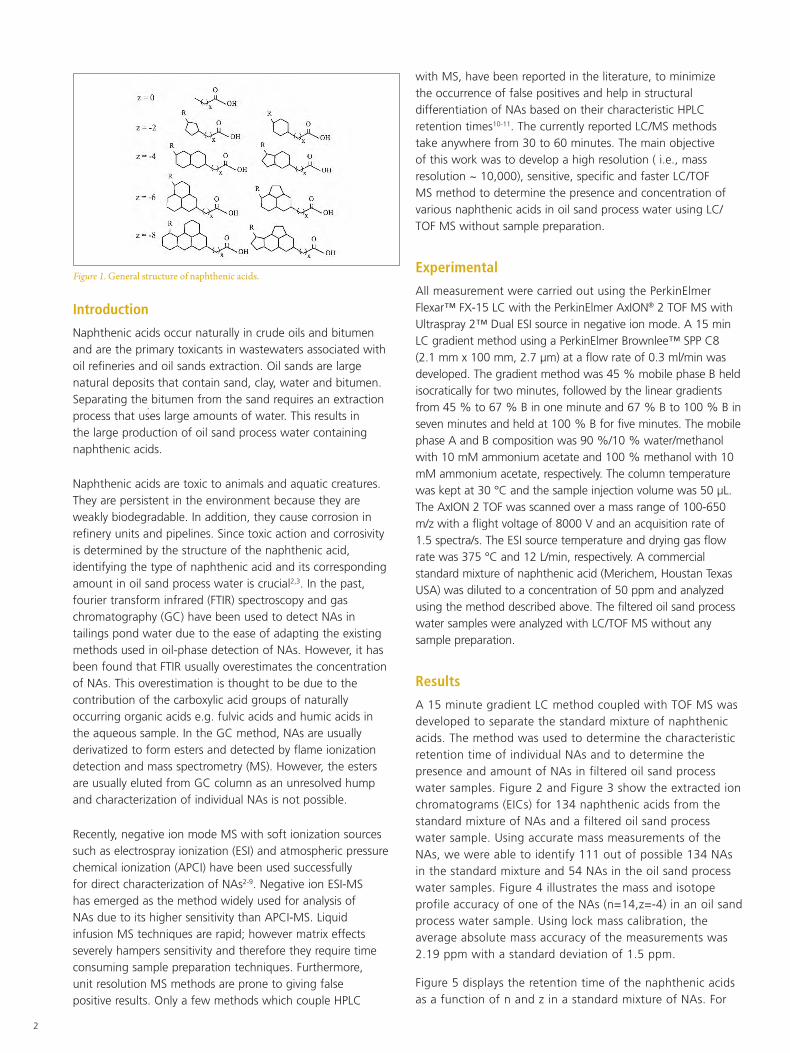
z is referred to as hydrogen deficiency, is a negative even integer and is the number of hydrogen atoms that are lost as the number of rings in naphthenic acid increases. More than one isomer will exist for a given z homolog and the molecular weights differ by 2 mass units (H2) between z-series and by 14 mass units (CH2) between n-series. The number of possible naphthenic acids, with the same molecular composition, are 134 with n ranging from 6 to 30 and the number of saturated rings ranging from 0 to 6. Fig.1 shows examples of the general structures of naphthenic acids which have a different number of rings1.
Analysis of Naphthenic Acids in Filtered Oil Sands Process Water (OSPW) using LC/TOF with No Sample Preparation
Liquid Chromatography/Mass Spectrometry
Authors:
Avinash Dalmia
PerkinElmer, Inc. Shelton, CT USA
2
Introduction
Naphthenic acids occur naturally in crude oils and bitumen and are the primary toxicants in wastewaters associated with oil refineries and oil sands extraction. Oil sands are large natural deposits that contain sand, clay, water and bitumen. Separating the bitumen from the sand requires an extraction process that uses large amounts of water. This results in the large production of oil sand process water containing naphthenic acids.
Naphthenic acids are toxic to animals and aquatic creatures. They are persistent in the environment because they are weakly biodegradable. In addition, they cause corrosion in refinery units and pipelines. Since toxic action and corrosivity is determined by the structure of the naphthenic acid, identifying the type of naphthenic acid and its corresponding amount in oil sand process water is crucial2,3. In the past, fourier transform infrared (FTIR) spectroscopy and gas chromatography (GC) have been used to detect NAs in tailings pond water due to the ease of adapting the existing methods used in oil-phase detection of NAs. However, it has been found that FTIR usually overestimates the concentration of NAs. This overestimation is thought to be due to the contribution of the carboxylic acid groups of naturally occurring organic acids e.g. fulvic acids and humic acids in the aqueous sample. In the GC method, NAs are usually derivatized to form esters and detected by flame ionization detection and mass spectrometry (MS). However, the esters are usually eluted from GC column as an unresolved hump and characterization of individual NAs is not possible.
Recently, negative ion mode MS with soft ionization sources such as electrospray ionization (ESI) and atmospheric pressure chemical ionization (APCI) have been used successfully for direct characterization of NAs2-9. Negative ion ESI-MS has emerged as the method widely used for analysis of NAs due to its higher sensitivity than APCI-MS. Liquid infusion MS techniques are rapid; however matrix effects severely hampers sensitivity and therefore they require time consuming sample preparation techniques. Furthermore, unit resolution MS methods are prone to giving false positive results. Only a few methods which couple HPLC
with MS, have been reported in the literature, to minimize the occurrence of false positives and help in structural differentiation of NAs based on their characteristic HPLC retention times10-11. The currently reported LC/MS methods take anywhere from 30 to 60 minutes. The main objective of this work was to develop a high resolution ( i.e., mass resolution ~ 10,000), sensitive, specific and faster LC/TOF MS method to determine the presence and concentration of various naphthenic acids in oil sand process water using LC/TOF MS without sample preparation.
Experimental
All measurement were carried out using the PerkinElmer Flexar™ FX-15 LC with the PerkinElmer AxION® 2 TOF MS with Ultraspray 2™ Dual ESI source in negative ion mode. A 15 min LC gradient method using a PerkinElmer Brownlee™ SPP C8 (2.1 mm x 100 mm, 2.7 µm) at a flow rate of 0.3 ml/min was developed. The gradient method was 45 % mobile phase B held isocratically for two minutes, followed by the linear gradients from 45 % to 67 % B in one minute and 67 % B to 100 % B in seven minutes and held at 100 % B for five minutes. The mobile phase A and B composition was 90 %/10 % water/methanol with 10 mM ammonium acetate and 100 % methanol with 10 mM ammonium acetate, respectively. The column temperature was kept at 30 °C and the sample injection volume was 50 µL. The AxION 2 TOF was scanned over a mass range of 100-650 m/z with a flight voltage of 8000 V and an acquisition rate of 1.5 spectra/s. The ESI source temperature and drying gas flow rate was 375 °C and 12 L/min, respectively. A commercial standard mixture of naphthenic acid (Merichem, Houstan Texas USA) was diluted to a concentration of 50 ppm and analyzed using the method described above. The filtered oil sand process water samples were analyzed with LC/TOF MS without any sample preparation.
Results
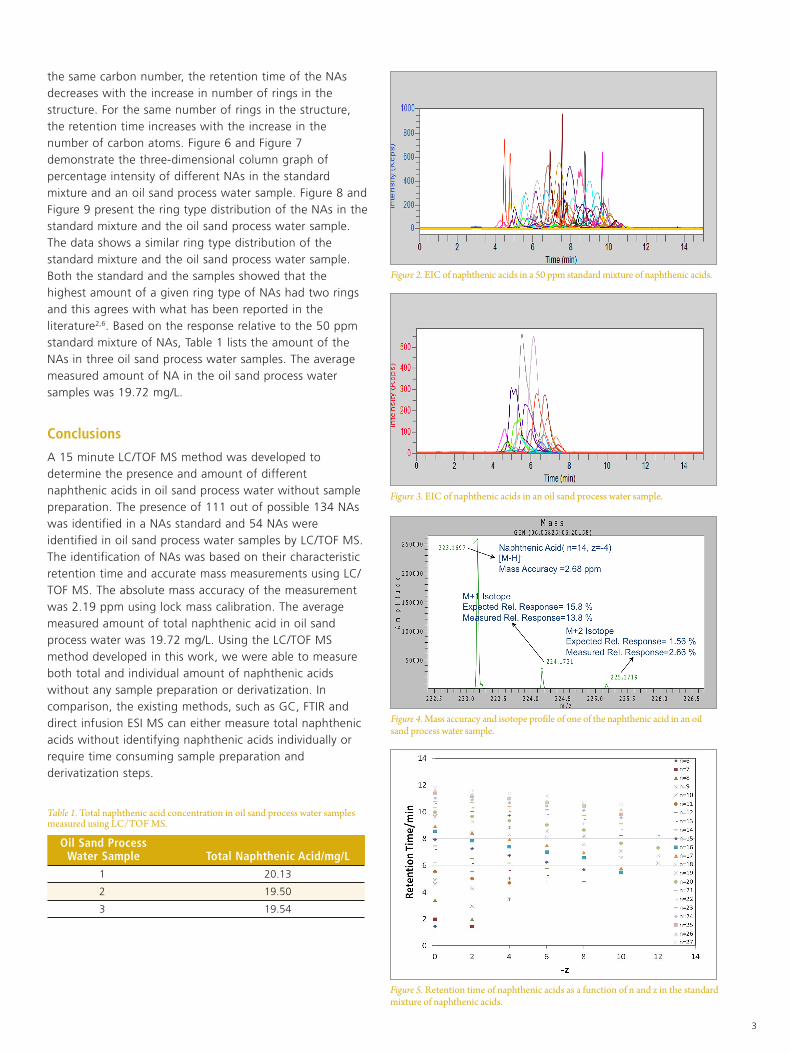
A 15 minute gradient LC method coupled with TOF MS was developed to separate the standard mixture of naphthenic acids. The method was used to determine the characteristic retention time of individual NAs and to determine the presence and amount of NAs in filtered oil sand process water samples. Figure 2 and Figure 3 show the extracted ion chromatograms (EICs) for 134 naphthenic acids from the standard mixture of NAs and a filtered oil sand process water sample. Using accurate mass measurements of the NAs, we were able to identify 111 out of possible 134 NAs in the standard mixture and 54 NAs in the oil sand process water samples. Figure 4 illustrates the mass and isotope profile accuracy of one of the NAs (n=14,z=-4) in an oil sand process water sample. Using lock mass calibration, the average absolute mass accuracy of the measurements was 2.19 ppm with a standard deviation of 1.5 ppm.
Figure 5 displays the retention time of the naphthenic acids as a function of n and z in a standard mixture of NAs. For
Figure 1. General structure of naphthenic acids.
3
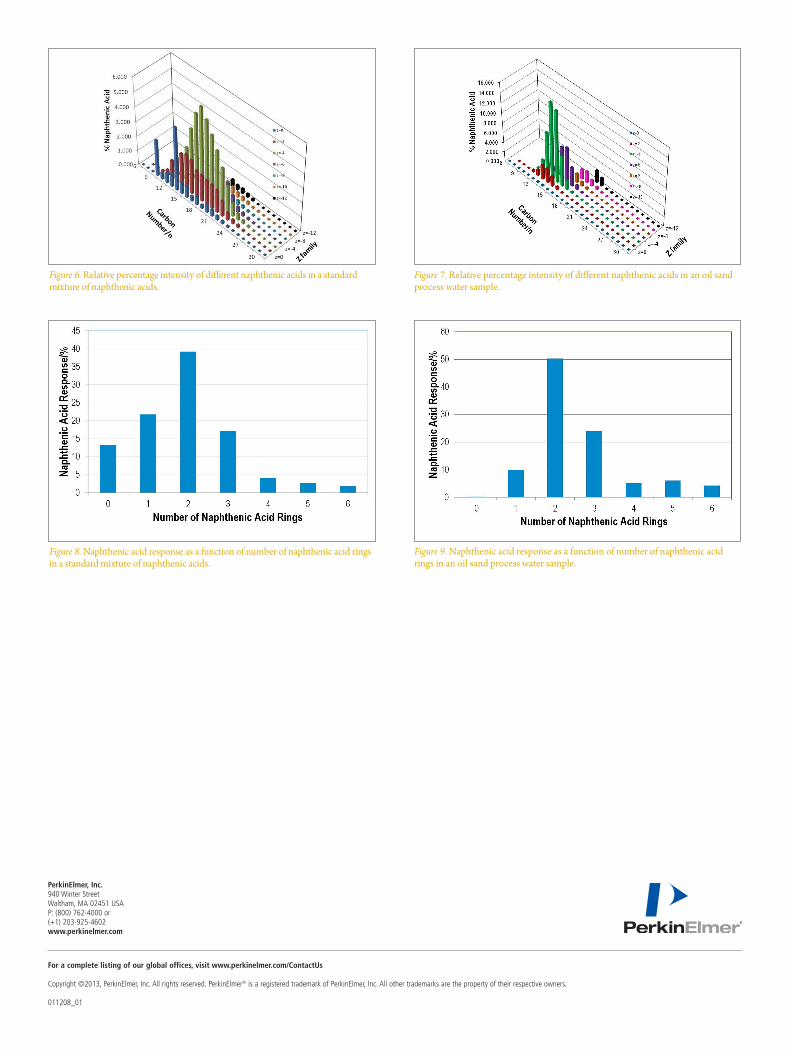
the same carbon number, the retention time of the NAs decreases with the increase in number of rings in the structure. For the same number of rings in the structure, the retention time increases with the increase in the number of carbon atoms. Figure 6 and Figure 7 demonstrate the three-dimensional column graph of percentage intensity of different NAs in the standard mixture and an oil sand process water sample. Figure 8 and Figure 9 present the ring type distribution of the NAs in the standard mixture and the oil sand process water sample. The data shows a similar ring type distribution of the standard mixture and the oil sand process water sample. Both the standard and the samples showed that the highest amount of a given ring type of NAs had two rings and this agrees with what has been reported in the literature2,6. Based on the response relative to the 50 ppm standard mixture of NAs, Table 1 lists the amount of the NAs in three oil sand process water samples. The average measured amount of NA in the oil sand process water samples was 19.72 mg/L.
Conclusions
A 15 minute LC/TOF MS method was developed to determine the presence and amount of different naphthenic acids in oil sand process water without sample preparation. The presence of 111 out of possible 134 NAs was identified in a NAs standard and 54 NAs were identified in oil sand process water samples by LC/TOF MS. The identification of NAs was based on their characteristic retention time and accurate mass measurements using LC/TOF MS. The absolute mass accuracy of the measurement was 2.19 ppm using lock mass calibration. The average measured amount of total naphthenic acid in oil sand process water was 19.72 mg/L. Using the LC/TOF MS method developed in this work, we were able to measure both total and individual amount of naphthenic acids without any sample preparation or derivatization. In comparison, the existing methods, such as GC, FTIR and direct infusion ESI MS can either measure total naphthenic acids without identifying naphthenic acids individually or require time consuming sample preparation and derivatization steps.
Figure 2. EIC of naphthenic acids in a 50 ppm standard mixture of naphthenic acids.
Figure 3. EIC of naphthenic acids in an oil sand process water sample.
Figure 4. Mass accuracy and isotope profile of one of the naphthenic acid in an oil sand process water sample.
Figure 5. Retention time of naphthenic acids as a function of n and z in the standard mixture of naphthenic acids.
Table 1. Total naphthenic acid concentration in oil sand process water samples measured using LC/TOF MS.
Oil Sand Process Water Sample Total Naphthenic Acid/mg/L 1 20.13
2 19.50
3 19.54
4
Acknowledgements
The author would like to thank Emergencies, Operational Analytical Laboratories and Research Support Division of Environment Canada for providing oil sand process water samples.
References
1. J.V. Headley, K.M. Peru, M. P. Barrow, Mass spectrometric characterization of naphthenic acids in environmental samples: A review, Mass Spec. Rev., 28, 121-134 (2009).
2. C. C. Lo, B. G. Brownlee, N. J. Bunce, Mass spectrometric and toxicological assays of Athabasca oil sands naphthenic acids, Water Research, 40, 655-664 (2006).
3. C. S. Hsu, G. J. Dechert, W. K. Robbins and E. K. Fukuda, Naphthenic acids in crude oils characterized by mass spectrometry, Energy & Fuels, 14, 217-223 (2000).
4. E. Ruszinski, L. Oehlers, Y. Zhang, Tandem mass spectrometric characterization of commercial naphthenic acids and a Maya crude oil, Energy & Fuels, 16, 1178-1185 (2002).
5. J. V. Headley, K. M. Peru, D. W. McMartin, M. Winkler, Determination of dissolved naphthenic acids in natural waters by using negative-ion electrospray mass spectrometry, J. AOAC Inter., 85, 182-187 (2002).
6. C. C. Lo, B. G. Brownlee, N. G. Bunce, Electrospray-mass spectrometric analysis of reference carboxylic acids and Athabasca oil sands naphthenic acids, Anal. Chem., 75, 6394- 6400 (2003).
7. J. V. Headley, K. M. Peru, Characterization of naphthenic acids from Athabasca oil sands using electrospray ionization: the significant influence of solvents, Anal. Chem., 79, 6222-6229 (2007).
8. M. P. Barrow, J. V. Headley, K. M. Peru, P. J. Derrick, Fourier transform ion cyclotron resonance mass spectrometry of principal components in oil sands naphthenic acids, J. Chrom. A, 1058, 51-59 (2004).
9. K. Qian, K. E. Edwards, G. J. Dechert, S. B. Jaffe, L. A. Green, W. N. Olmstead, Measurement of total acid number (TAN) and TAN boiling point distribution in petroleum products by electrospray ionization mass spectrometry, Anal. Chem., 80, 849-855 (2008).
10. X. Wang, K. L. Kasperski, Analysis of naphthenic acids in aqueous solution using HPLC-MS/MS, Anal. Methods, 2, 1715-1722 (2010).
11. J. V. Headley, K. M. Peru and M. P. Barrow, Capillary HPLC/QTOF-MS for characterizing complex naphthenic acid mixtures and their microbial transformation, Anal. Chem., 78, 8354-8361 (2006).
For a complete listing of our global offices, visit www.perkinelmer.com/ContactUs
Copyright ©2013, PerkinElmer, Inc. All rights reserved. PerkinElmer® is a registered trademark of PerkinElmer, Inc. All other trademarks are the property of their respective owners. 011208_01
PerkinElmer, Inc. 940 Winter Street Waltham, MA 02451 USA P: (800) 762-4000 or (+1) 203-925-4602www.perkinelmer.com
Figure 7. Relative percentage intensity of different naphthenic acids in an oil sand process water sample.
Figure 9. Naphthenic acid response as a function of number of naphthenic acid rings in an oil sand process water sample.
Figure 6. Relative percentage intensity of different naphthenic acids in a standard mixture of naphthenic acids.
Figure 8. Naphthenic acid response as a function of number of naphthenic acid rings in a standard mixture of naphthenic acids.