Liquid Chromatography Fundamentals - Theory · 2018/06/04 · high-pressure liquid...
38
For teaching purpose only March 23, 2015 1 BUILDING BETTER SCIENCE AGILENT AND YOU High Performance Liquid Chromatography Fundamentals - Theory
Transcript of Liquid Chromatography Fundamentals - Theory · 2018/06/04 · high-pressure liquid...
For teaching purpose only
March 23, 2015
1
BUILDING BETTER SCIENCE
AGILENT AND YOU
High Performance Liquid Chromatography
Fundamentals - Theory

For teaching purpose only
March 23, 2015
2
Agilent Technologies is committed
to the educational community and
is willing to provide access to
company-owned material.
This slide set is created by Agilent Technologies. The
usage of the slides is limited to teaching purpose only.
In case pictures, sketches or drawings should be used
for any other purpose please contact Agilent
Technologies a priori.

March 23, 2015
For teaching purpose only
3
Introduction
High-performance liquid chromatography (HPLC; formerly referred to as
high-pressure liquid chromatography), is a technique in analytical chemistry
used to separate components in a mixture, to identify each component, and
to quantify components.
HPLC relies on pumps to pass a pressurized liquid solvent containing the
sample mixture through a column filled with a solid adsorbent material. Each
component in the sample interacts slightly differently with the adsorbent
material, causing different flow rates for the different components and
leading to the separation of the components as they flow out the column.
Source: Wikipedia

March 23, 2015
For teaching purpose only
4
Table of Content (ToC)
Introduction
• What happens inside the column?
Key Parameters
• Retention Time & Peak Width
• Resolution – Baseline Separation
• Resolution – The Fundamental Equation
• Efficiency or Number of Theoretical Plates
• Retention Factor
• Selectivity or Separation Factor
How to Influence Selectivity?
• Selectivity – Example 1
• Selectivity – Example 2
• Selectivity – Example 3
• Plate Number
Van Deemter Equation
• Eddy Diffusion
• Axial Diffusion
• Resistance to Mass Transfer
• More on Van Deemter
Peak Capacity
• Gradient Analysis
• Definition
• Calculation of Peak Capacity
• Peak Width
• Example

March 23, 2015
For teaching purpose only
5
Introduction What happens inside the column?
Time t
Separation tr2-tr1
Peak width Wb1,2
ToC

March 23, 2015
For teaching purpose only
6
Introduction What happens inside the column?
tr2-tr1
Superior separation Inferior separation
Superior separation Inferior separation
Wb1 Wb2 Wb1 Wb2
vs
vs
tr2-tr1
ToC

March 23, 2015
Confidentiality Label
7
Time t
Separation tr2-tr1
Peak width Wb1,2
Introduction What happens inside the column?
Resolution describes the ability of a
column to separate the peaks of
interest.
Resolution describes whether you
have achieved base line separation or
not.
ToC
)(2/1 12
12
bb
rrs
WW
ttR

March 23, 2015
For teaching purpose only
8
Key Parameters Retention Time & Peak Width
tr1
tr2
Wb1 Wb2
W1/2
h
t
tri Retention time compound i
W1/2 Peak width at half height
Wbi Peak width at baseline
ToC
March 23, 2015
For teaching purpose only
9
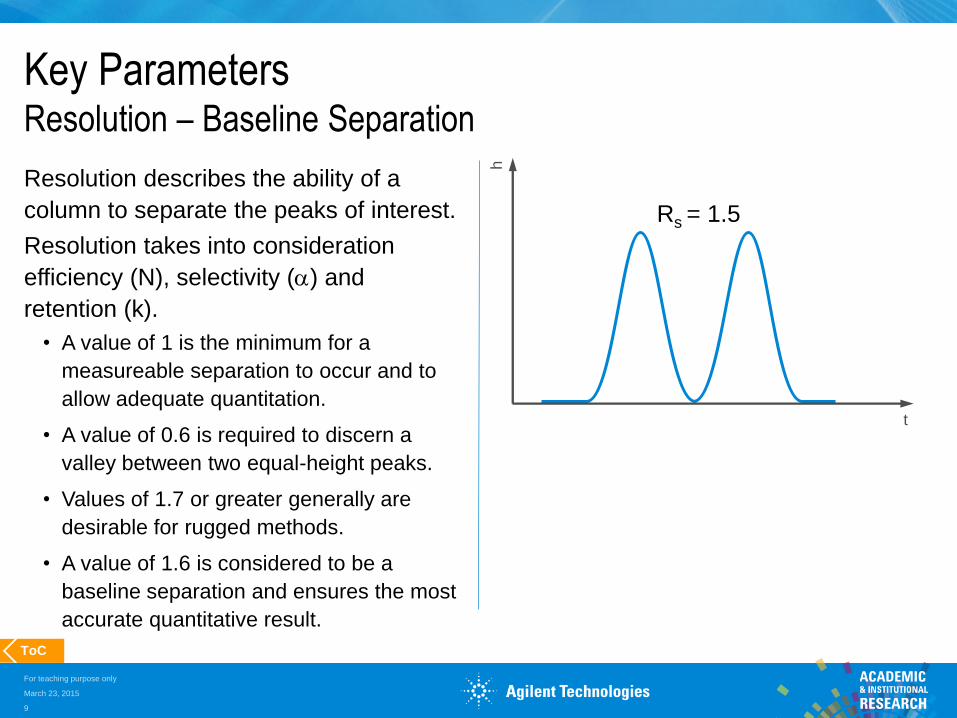
Key Parameters Resolution – Baseline Separation
Resolution describes the ability of a
column to separate the peaks of interest.
Resolution takes into consideration
efficiency (N), selectivity (a) and
retention (k).
• A value of 1 is the minimum for a
measureable separation to occur and to
allow adequate quantitation.
• A value of 0.6 is required to discern a
valley between two equal-height peaks.
• Values of 1.7 or greater generally are
desirable for rugged methods.
• A value of 1.6 is considered to be a
baseline separation and ensures the most
accurate quantitative result.
h
t
Rs = 1.5
ToC
March 23, 2015
For teaching purpose only
10
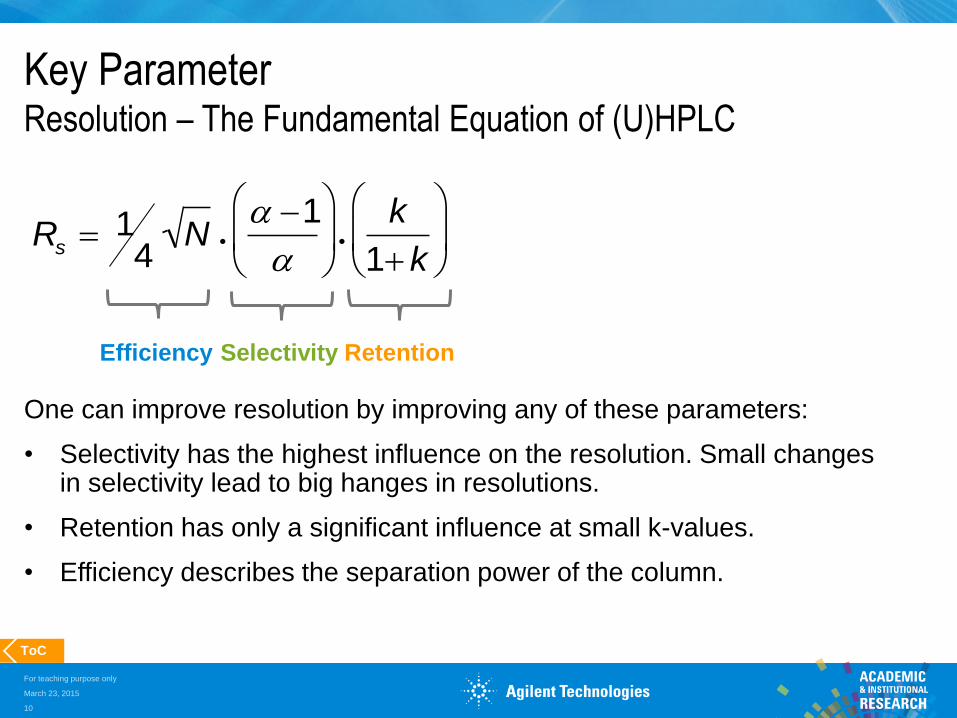
Rs 14
N
a 1
a
k
1k
Key Parameter Resolution – The Fundamental Equation of (U)HPLC
Selectivity Efficiency Retention
One can improve resolution by improving any of these parameters:
• Selectivity has the highest influence on the resolution. Small changes in selectivity lead to big hanges in resolutions.
• Retention has only a significant influence at small k-values.
• Efficiency describes the separation power of the column.
ToC

March 23, 2015
For teaching purpose only
11
Key Parameter Resolution – The Fundamental Equation of (U)HPLC
The figure explains resolution as a function of selectivity, column efficiency or retention.
ToC
Selectivity impacts resolution most
• Change stationary phase
• Change mobile phase
Plates are easiest to increase

March 23, 2015
For teaching purpose only
12
Key Parameter Efficiency or Number of Theoretical Plates (N)
Column efficiency is used to compare the performance of different columns. It is expressed as the theoretical plate number, N.
Columns with high plate numbers are more efficient. A column with a high N will lead to narrower peak at a given retention time than a column with a lower N number.
Parameters influencing column efficiency:
• Column length (increasing colum length increases efficiency)
• Particle size (decreasing particle size increases efficiency)
ToC
2
2/1
54.5
W
tN r
2
16
b
r
W
tN

March 23, 2015
For teaching purpose only
13
Key Parameter Retention Factor (k)
k =tr - t0
t0
æ
è ç
ö
ø ÷
The retention factor measures the time that the sample component resides in a stationary phase relative to the time it resides in the mobile phase. It is calculated from the retention time divided by the time for an unretained peak (t0).
Parameters influencing retention factor:
• Stationary phase
• Mobile phase
• Gradient slope*
• System dwell volume* *gradient elution only
ToC

March 23, 2015
For teaching purpose only
14
The equation shows how the retention factor is influenced by flow rate (F), gradient time (tG), gradient range (ΔΦ), and column volume (Vm).
Remember: To keep the retention factor constant, changes in the denominator need to be offset by proportional changes in the numerator, and vice versa.
Key Parameter Retention Factor (k) – Gradient Elutions
ToC
m
G
VS
Ftk
`
March 23, 2015
For teaching purpose only
15
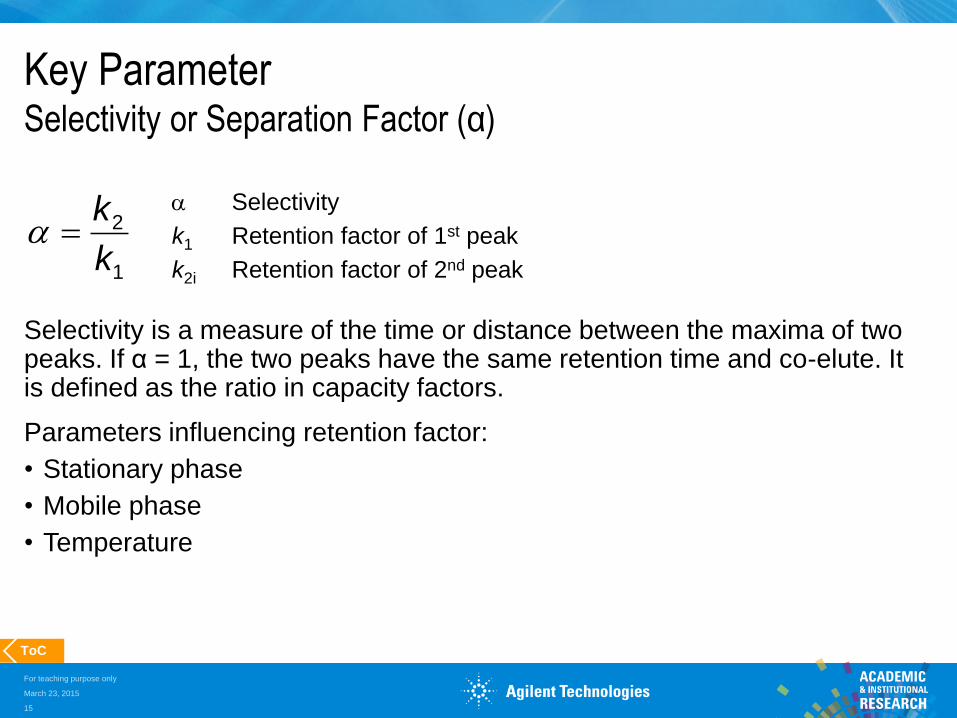
Key Parameter Selectivity or Separation Factor (α)
Selectivity is a measure of the time or distance between the maxima of two peaks. If α = 1, the two peaks have the same retention time and co-elute. It is defined as the ratio in capacity factors.
Parameters influencing retention factor:
• Stationary phase
• Mobile phase
• Temperature
ToC
a Selectivity
k1 Retention factor of 1st peak
k2i Retention factor of 2nd peak 1
2
k
ka

March 23, 2015
For teaching purpose only
16
Key Parameter Influence of N, α, and k on Resolution
ToC

March 23, 2015
For teaching purpose only
17
How to Influence Separation?
Same sample, analyzed with different stationary phases but always same
temperature, mobile phase and gradient.
ToC

March 23, 2015
For teaching purpose only
18
How to Influence Separation?
Same sample, analyzed with same stationary phase and temperature but with different mobile phases (same gradient).
ToC
March 23, 2015
For teaching purpose only
19
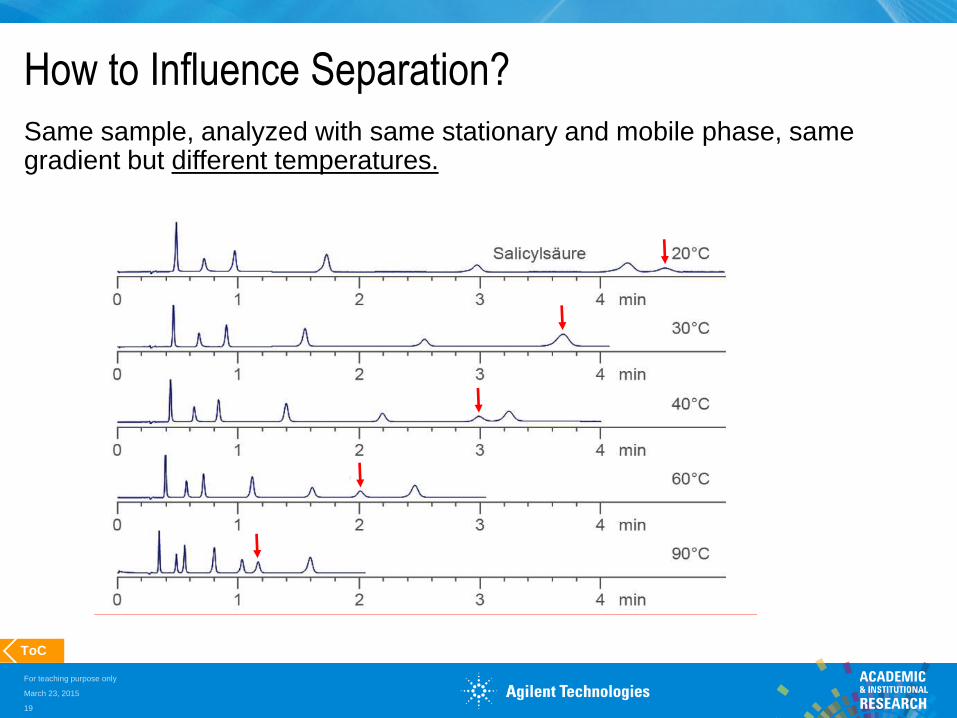
Same sample, analyzed with same stationary and mobile phase, same gradient but different temperatures.
How to Influence Separation?
ToC

March 23, 2015
For teaching purpose only
20
How to Influence Separations? What is a “plate” in HPLC?
A theoretical plate is the hypothetical stage in which two phases of a substance (its liquid and vapor phase) establish an equilibrium.
ToC
LC Column length
dp Particle size
h Reduced height of a theoretical plate
N4
1~Rs
p
c
dh
L4
1~H
L4
1~R cs

March 23, 2015
For teaching purpose only
21
How to Influence Separations?
High plate number (N) provides:
• Sharp and narrow peaks
• Better detection
• Peak capacity to resolve complex samples
But resolution increases only with the square root of the plate number.
• RS ~ N
Plate number increase is limited by experimental conditions
• Analysis time, pressure
ToC

March 23, 2015
For teaching purpose only
22
How to Influence Separations? Bringing It Together – Peak Width and Reduced Height of a Theoretical Plate
h: reduced height of a theoretical plate
ToC
)WW(2/1
ttR
1b2b
2r1rs
p
cs
dh
L4
1~R
)w(fh
)www(fh Caxeddy

March 23, 2015
For teaching purpose only
23
Van Deemter Equation Eddy Diffusion
weddy ~ λ dp λ: Quality of column packing
Differences in diffusion paths due to:
Different paths Poor column packing Broad particle size
distribution
ToC

March 23, 2015
For teaching purpose only
24
Van Deemter Equation Axial or Longitudinal Diffusion
Increase in peak width due to self-diffusion of the analyte
At low flow the analyte remains in the mobile phase for a long time
• High increase in peak width
• Increased height of a theoretical plate
Flow
ToC

March 23, 2015
For teaching purpose only
25
Van Deemter Equation “Resistance to Mass Transfer”
wC ~ dp2
Different diffusion paths
Porous particle
Stationary layer of mobile phase
ToC

March 23, 2015
For teaching purpose only
26
Van Deemter Equation
The Van Deemter equation relates the variances per unit length of a separation column to the linear mobile phase velocity by considering physical, kinetic and thermodynamic properties of a separation (Wikipedia).
h = f ( weddy + wax + wC )
h = A + B/u + C u
• Eddy diffusion
• Diffusion coefficient
• Resistance to mass transfer
ToC

March 23, 2015
For teaching purpose only
27
Van Deemter Equation R
ed
uce
d h
eig
ht o
f a
th
eo
r. P
late
(h)
Flow
Sum curve: Van Deemter
Axial diffusion
Eddy diffusion
Resistance to mass transfer
h = A + B/u + C u
ToC

March 23, 2015
For teaching purpose only
28
Van Deemter Equation Measured for Different Particle Sizes
5.0 m
3.5 m
1.8 m
ToC
• Small particles lead to lower heights of theoretical plates and therefore higher separation efficiency
• For smaller particles the separation efficiency suffers less when increasing the flow

March 23, 2015
For teaching purpose only
29
Van Deemter Equation Real Curves for Different Analytes
P. Petersson et al (AZ), J.Sep.Sci, 31, 2346-2357, 2008
• Van Deemter equation for isocratic runs only
• Compound and instrument specific
• Even for sub-2-μm particles not horizontal
• Optimum flowrate depends on compound
ToC

March 23, 2015
For teaching purpose only
30
Isocratic run: Peak width depends on diffusion processes only.
Gradient run: Peak width depends on diffusion processes and gradient focusing on the column head.
Peak Capacity Gradient Analyses
ToC
Reduced height of theoretical
plate as function of peak width )w(fh 2

March 23, 2015
For teaching purpose only
31
Peak capacity is the number of peaks (n) that can be separated in a given time with a given resolution.
The peak capacity depends on different factors like column length and particle size.
Peak Capacity Definition
Peak capacity: 32 peaks in 2.5 min
ToC

March 23, 2015
For teaching purpose only
32
Peak Capacity The Meaning
“… using the statistical theory of peak overlap …”
“… peak resolution is severely compromised when the number of components present in a sample overrates 1/3 of the peak capacity.”
J.M. DAVIS, J.C. GIDDINGS, ANAL. CHEM. 55 (1983) 418
“…in order to resolve 98% of the components, the peak capacity must exceed the number of components by a factor of 100.”
J.C. GIDDINGS, J. CHROMATOGR. A 703 (1995) 3
ToC

March 23, 2015
For teaching purpose only
33
Peak Capacity Calculation of Peak Capacity
Simplification:
ToC
wav Average peak width
n Number of peaks
tG Gradient time
w Peak width of selected peak
w
t1P G
av
G
n
1
G
w
t1
wn
1
t1P

March 23, 2015
For teaching purpose only
34
Peak Capacity Peak Width
Peak width according to tangent method
Peak width at half height
Peak width at 5 % height
Peak width at 4.4 % height (5σ)
ToC

March 23, 2015
For teaching purpose only
35
Peak Capacity Example
min 20 40 60 80 100
mAU
0
10
20
30
40
50
min 10 20 30 40 50
mAU
0
20
40
60
Column: 2.1 x 150 mm, 1.8 µm
Back pressure: 402 bar
Peak capacity: 313
Column: 2.1 x 300 mm*, 1.8 µm
Back pressure: 598 bar
Peak capacity: 406
*300 mm column by coupling two 150 mm columns ToC

March 23, 2015
For teaching purpose only
36
Further Information
For more information on products from Agilent visit www.agilent.com or
www.agilent.com/chem/academia
Have questions or suggestions to this presentation? Contact [email protected]
Publication Title Pub. No.
Primer The LC Handbook 5990-7595EN
Application note The influence of silica pore size on efficiency, resolution and loading in Reversed-
Phase HPLC 5990-8298EN
Application note Increasing resolution using longer columns while maintaining analysis time 5991-0513EN
Article reprint A simple approach to performance optimization in HPLC and its application in ultrafast
separation development
Poster Study of physical properties of superficially porous silica on its superior
chromatographic performance
Application note Maximizing chromatographic peak capacity with the Agilent 1290 Infinity LC system
using gradient parameters 5990-6933EN
Application note Maximizing chromatographic peak capacity with the Agilent 1290 Infinity LC 5990-6932EN
Application note Increased peak capacity for peptide analysis with the Agilent 1290 Infinity LC system 5990-6313EN
Web CHROMacademy – free access for students and university staff to online courses
ToC

For teaching purpose only
March 23, 2015
37
ToC
THANK YOU
Publication number 5991-5411EN

March 23, 2015
For teaching purpose only
38
Abbreviations
Abbreviation Definition
α Selectivity
dp Particle size
ΔΦ Gradient range
F Flow rate
h Reduced height of a theoretical plate,
a measure of the resolving power of
a column
k Retention factor (formerly known:
k` - capacity factor)
Lc Column length
λ Quality of column packing
N Efficiency or column plate number
P Peak capacity
R Resolution
Abbreviation Definition
t Time
tr Retention time
t0 Column dead-time
tG Gradient time
Vm Colum volume
w Peak width
W1/2 Peak width at half height
Wbi Peak width at baseline
weddy Eddy diffusion
wax Axial or longitudinal diffusion
wC Resistance to mass transfer
wav Average peak width
ToC