Liquefaction of Lignosulfonate in Supercritical Ethanol...
15
General rights Copyright and moral rights for the publications made accessible in the public portal are retained by the authors and/or other copyright owners and it is a condition of accessing publications that users recognise and abide by the legal requirements associated with these rights. Users may download and print one copy of any publication from the public portal for the purpose of private study or research. You may not further distribute the material or use it for any profit-making activity or commercial gain You may freely distribute the URL identifying the publication in the public portal If you believe that this document breaches copyright please contact us providing details, and we will remove access to the work immediately and investigate your claim. Downloaded from orbit.dtu.dk on: Oct 12, 2019 Liquefaction of Lignosulfonate in Supercritical Ethanol Using Alumina-Supported NiMo Catalyst Ghafarnejad Parto, Soheila; Christensen, Jakob Munkholt; Pedersen, Lars Saaby; Hansen, Asger Baltzer; Tjosås, Freddy; Spiga, Cristiano; Damsgaard, Christian Danvad; Larsen, Daniel Bo; Duus, Jens Øllgaard; Jensen, Anker Degn Published in: Energy and Fuels Link to article, DOI: 10.1021/acs.energyfuels.8b03519 Publication date: 2019 Document Version Publisher's PDF, also known as Version of record Link back to DTU Orbit Citation (APA): Ghafarnejad Parto, S., Christensen, J. M., Pedersen, L. S., Hansen, A. B., Tjosås, F., Spiga, C., ... Jensen, A. D. (2019). Liquefaction of Lignosulfonate in Supercritical Ethanol Using Alumina-Supported NiMo Catalyst. Energy and Fuels, 33(2), 1196-1209. https://doi.org/10.1021/acs.energyfuels.8b03519
Transcript of Liquefaction of Lignosulfonate in Supercritical Ethanol...
General rights Copyright and moral rights for the publications made accessible in the public portal are retained by the authors and/or other copyright owners and it is a condition of accessing publications that users recognise and abide by the legal requirements associated with these rights.
Users may download and print one copy of any publication from the public portal for the purpose of private study or research.
You may not further distribute the material or use it for any profit-making activity or commercial gain
You may freely distribute the URL identifying the publication in the public portal If you believe that this document breaches copyright please contact us providing details, and we will remove access to the work immediately and investigate your claim.
Downloaded from orbit.dtu.dk on: Oct 12, 2019
Liquefaction of Lignosulfonate in Supercritical Ethanol Using Alumina-Supported NiMoCatalyst
Ghafarnejad Parto, Soheila; Christensen, Jakob Munkholt; Pedersen, Lars Saaby; Hansen, AsgerBaltzer; Tjosås, Freddy; Spiga, Cristiano; Damsgaard, Christian Danvad; Larsen, Daniel Bo; Duus, JensØllgaard; Jensen, Anker DegnPublished in:Energy and Fuels
Link to article, DOI:10.1021/acs.energyfuels.8b03519
Publication date:2019
Document VersionPublisher's PDF, also known as Version of record
Link back to DTU Orbit
Citation (APA):Ghafarnejad Parto, S., Christensen, J. M., Pedersen, L. S., Hansen, A. B., Tjosås, F., Spiga, C., ... Jensen, A. D.(2019). Liquefaction of Lignosulfonate in Supercritical Ethanol Using Alumina-Supported NiMo Catalyst. Energyand Fuels, 33(2), 1196-1209. https://doi.org/10.1021/acs.energyfuels.8b03519

Liquefaction of Lignosulfonate in Supercritical Ethanol UsingAlumina-Supported NiMo CatalystSoheila Ghafarnejad Parto,† Jakob Munkholt Christensen,† Lars Saaby Pedersen,‡ Asger Baltzer Hansen,‡
Freddy Tjosås,§ Cristiano Spiga,∥ Christian Danvad Damsgaard,∥ Daniel Bo Larsen,⊥
Jens Øllgaard Duus,⊥ and Anker Degn Jensen*,†
†Chemical and Biochemical Engineering, Technical University of Denmark, 2800 Kgs. Lyngby, Denmark‡Haldor Topsøe A/S, Haldor Topsøes Alle 1, 2800 Kgs. Lyngby, Denmark§Borregaard A/S, Hjalmar Wesselsvei 2, NO-1721 Sarpsborg, Norway∥Center for Electron Nanoscopy, Technical University of Denmark, 2800 Kgs. Lyngby, Denmark⊥Department of Chemistry, Technical University of Denmark, 2800 Kgs. Lyngby, Denmark
*S Supporting Information
ABSTRACT: Lignosulfonate was subjected to a reductive catalytic degradation in ethanol medium at 310 °C in the presenceof alumina supported NiMo catalysts and H2. The liquid and solid products were analyzed with size exclusion chromatography(SEC), gas chromatography mass spectrometry (GC−MS), two-dimensional gas chromatography (GC × GC), heteronuclearsingle quantum coherence nuclear magnetic resonance (HSQC NMR) and elemental analysis. The highest oil yield and thelowest char yield obtained was 88 and 15 wt %, respectively. The liquefied species were mainly dimers and oligomers with minoryields of monomers. The catalyst was important for stabilization of reactive intermediates either by hydrogenation or couplingwith ethanol. Simultaneous deoxygenation and desulfurization reactions took place in the presence of the catalyst; the oxygenand sulfur content in the oil fraction obtained after 4 h reaction time were 11.2 and 0.1 wt %, indicating considerabledeoxygenation and desulfurization compared to the lignosulfonate feedstock (O, 30.8 wt %; S, 3.1 wt %). The effect of thereaction parameters such as temperature, reaction time and catalyst mass was studied. It was observed that by increasing thetemperature from 260 to 310 °C the degradation increased, however, the SEC analysis showed that the degradation progressedonly to a certain size range dimers to oligomers in the reaction temperatures studied. Investigating the effect of reaction time of1, 2, 3, and 4 h indicated that degradation, deoxygenation, desulfurization and alkylation reactions progressed over time. Thereusability of the catalyst without any pretreatment was confirmed by an almost constant oil yield in three repeated experimentswith the same catalyst batch. The results show that alumina supported NiMo catalysts are very promising catalysts forconversion of lignosulfonate to liquid products.
1. INTRODUCTIONThe depletion of fossil fuels, along with the increase of theglobal population and therefore the increase of the energydemand, has stimulated the interest in development of non-fossil-based and renewable sources of energy and chemicals.Moreover, increasing awareness of CO2 emission andassociated environmental issues, such as global warming,encourages the utilization of carbon neutral and sustainableenergy resources.1 Among different renewable energies,biomass is the only source of organic carbon that can beemployed for production of chemicals.2 Lignocellulosicbiomass is comprised of cellulose, hemicellulose and lignin.The cellulose and hemicellulose are mainly used in the pulpand paper industry, where lignin is left as byproduct, and ismainly combusted to supply the energy for the process. Therecent development of second-generation bioethanol plantsalso produces considerable amounts of lignin as byproduct.Lignin is mainly composed of three building blocks; coumarylalcohol, coniferyl alcohol, and synapyl alcohol connected viaC−C and C−O bonds3 and could be a source of aromaticchemicals, if the interbuilding block bonds are selectivelycleaved. The most available types of technical lignins are kraft
lignin, sulfite lignin (lignosulfonate), soda lignin (alkali lignin),enzymatically extracted lignin, and organosolv lignin. Despitethe high potential of lignin as a source of chemicals, only 1−2%is commercially used, which are mostly related to theapplications of lignosulfonate.4 Vanillin5 and additives forbatteries are some of the high value products produced fromlignosulfonate. However, the development of liquid fuels andperhaps even other high-value chemicals from this feedstock isof interest. Reductive solvolysis of lignin is a promising step inthe production of low oxygen content fuel and chemicals viahydrogenolysis and hydrodeoxygenation (HDO). A solventcan solubilize lignin, contribute to the cleavage of the C−Obonds and stabilize the reactive intermediates.6,7 The reductiveconversion may be accompanied by presence of a heteroge-neous catalyst. Transition metals and hydrotreating catalystsare among those investigated.8−11
One of the advantages of biomass as an energy source is itslow sulfur content.12 However, sulfur can be introduced into
Received: October 8, 2018Revised: December 13, 2018Published: January 15, 2019
Article
pubs.acs.org/EFCite This: Energy Fuels 2019, 33, 1196−1209
© 2019 American Chemical Society 1196 DOI: 10.1021/acs.energyfuels.8b03519Energy Fuels 2019, 33, 1196−1209
This is an open access article published under an ACS AuthorChoice License, which permitscopying and redistribution of the article or any adaptations for non-commercial purposes.
Dow
nloa
ded
via
DT
IC N
AT
L T
EC
H I
NFO
RM
AT
ION
CT
R o
n Fe
brua
ry 2
8, 2
019
at 0
8:52
:52
(UT
C).
Se
e ht
tps:
//pub
s.ac
s.or
g/sh
arin
ggui
delin
es f
or o
ptio
ns o
n ho
w to
legi
timat
ely
shar
e pu
blis
hed
artic
les.

the structure of lignin in conventional pulping processes: kraftlignin and sulfite lignin, as the major types of technical lignin,contain thiol and sulfonate groups, respectively (see Figure 1).The poisoning effects of sulfur on noble and non-nobletransition metal catalysts are known.13,14 Therefore, employinga sulfur resistant catalyst for catalytic degradation of kraft ligninand lignosulfonate is essential.The sulfur resistant nickel- (Ni) or cobalt- (Co) promoted
molybdenum- (Mo) and tungsten- (W) based catalysts areindustrially used for hydrotreating purposes including HDO,hydrodesulfurization (HDS) and hydrodenitrogenation(HDN).17 The promotion with Ni or Co increases the activityof the edge sites in MoS2 slabs.18,19 Nickel-promoted Mo(NiMo) and cobalt-promoted Mo (CoMo) catalysts areinitially in oxide form and therefore should be activated priorto use by sulfidation and formation of the active NiMoS andCoMoS phases. Such bimetallic catalysts have gained interestin solvothermal conversion of biomass and lignin. A recentpatent reports20 reductive conversion of biomass in solventssuch as ethanol and ethylene glycol over supported catalystscomprised of S, Mo/W, and Co, Ni or a mixture of them at180−300 °C. Narani and co-workers21 studied conversion ofkraft lignin in the presence of NiW/AC, NiMo/AC, andCoMo/AC catalysts in methanol as solvent at 320 °C. Theyobserved 28 wt % monomer yields over the sulfided NiW/ACcatalyst, with alkyl phenols and guaiacols being the mainproducts.21 Cattelan et al.22 observed higher yields ofaromatics from conversion of kraft lignin in the presence ofan MoS2-based catalyst compared to noncatalytic conversion insupercritical ethanol and nitrogen atmosphere at 280 °C:While almost similar conversions were obtained in the absenceand presence of catalyst (85−86 wt %), the yield of aromaticcompounds increased from 10.2 wt % to 17.8 wt % in catalyticconditions.22 Joffres et al.23,24 observed cleavage of β-O-4 andα-O-4 bonds in reductive degradation of wheat straw sodalignin over NiMoS/Al2O3 at 350 °C in tetralin solvent.According to them23 demethoxylation reactions via cleavage ofaryl alkyl ether bonds, hydrogenation of aliphatic double bondsand dehydroxylation of aliphatic OH groups took place duringtransformation of the lignin.Despite the fact that lignosulfonate is a major commercial
type of technical lignin, only a few studies have targetedconversion of lignosulfonate.25,26 Horacek et al.27 investigated
conversion of sodium lignosulfonate (Na-LS) over aluminasupported reduced Ni and NiMo catalyst in 5 wt % aqueoussolution at 320 °C in a tubular reactor with hydrogen flow of 5N mL/min. They observed formation of alkyl substitutedguaiacols and phenols in the products, with a guaiacol yield of1.8 and 1.5 wt % over Ni/Al2O3 and NiMo/Al2O3,respectively.27 A drawback of using water as reaction mediumis its poor performance in inhibiting condensation reactionsbetween radical fragments.28 It was previously shown byHuang et al.7 that ethanol can inhibit repolymerizationreactions by O- and C- alkylation reactions.7
In this work, we investigated the conversion of lignosulfo-nate in ethanol medium in the presence of a NiMo catalystsupported on Al2O3 in the presence of 26 bar H2. Thecomposition and properties of the liquid, solid and gaseouscompounds was comprehensively evaluated and the role ofsolvent was elaborated on. Analytical techniques such as GC−MS, GC × GC, GC equipped with thermal conductivitydetector (GC-TCD), SEC, HSQC NMR, elemental analysisand ion-coupled plasma-optical emission spectroscopy (ICP-OES) were used for analysis of the products. The presence ofthe catalyst increased the yield of liquefied fraction andpromoted ethanol end-capping reactions. Moreover, thenecessity of presulfidation of the NiMo catalyst for conversionof the lignosulfonate, which contains 3.1 wt % sulfur, wasinvestigated. Additionally, we studied the effect of reactionparameters such as reaction temperature, reaction time andcatalyst loading to maximize the yield of the liquefied fraction.
2. EXPERIMENTAL SECTION2.1. Materials. Spruce based Na-LS was provided by Borregaard
A/S. According to Mortensen et al.,29 potassium is detrimental to theHDO activity of supported NiMoS, and sodium is expected to have asimilar effect. The original Na-LS contained 7.3 wt % Na and 0.01 wt% K, and therefore, the Na+ and K+ were exchanged with H+ ions, byion-exchange using Amberlite 120 H resin as described elsewhere,30 inorder to avoid potential interactions with the catalyst. The sulfonicacid form of lignosulfonate is denoted H-LS. After the ion-exchange,the amount of Na+ and K+ decreased to 0.1 and 0.001 wt % on a drymatter basis, respectively. The solvent used in the conversion of ligninwas ethanol (VWR, 99.9%). Other chemicals including the gases forGC analysis were of analytical grade and used without anypretreatment.
Figure 1. Proposed structures for (a) kraft lignin and (b) sulfite lignin, reprinted (adopted) with permission from Zakzeski et al.,15 Copyright 2010American Chemical Society, and Mahmmod et al.,16 Copyright 2016 Elsevier.
Energy & Fuels Article
DOI: 10.1021/acs.energyfuels.8b03519Energy Fuels 2019, 33, 1196−1209
1197
2.2. Catalyst. Two catalyst samples were used in the experiments.The catalyst used in most of the tests was a commercial NiMo/Al2O3provided by Haldor Topsøe A/S (named NiMo-Ι). For studies on thesulfidation state of the catalyst by transmission electron microscopyenergy-dispersive X-ray spectroscopy (TEM-EDX) analysis, a batch of10 g alumina supported NiMo sample was prepared in-house (namedNiMo-ΙΙ). The support of this catalyst was γ-Al2O3 from Saint-Gobainwith a surface area of 254.7 m2/g and pore volume of 1.11 mL/g. Thesupport material was crushed to 150−300 μm. The catalyst wasprepared by successive incipient wetness impregnation stages: Firstthe support was impregnated with 15 wt % nominal concentration ofMo using an aqueous solution of ammonium heptamolybdatetetrahydrate (NH4)6Mo7O24.4H2O (Sigma-Aldrich, purity ≥99%) asprecursor. The precursor solution was subsequently added dropwiseto the support. The water was later evaporated in an oven at 50 °C,overnight. A 3 wt % nominal concentration of Ni was then added in asecond impregnation step, using an aqueous solution of nickel nitratehexahydrate Ni(NO3).6H2O (Sigma-Aldrich purity ≥99.999%),followed by evaporation of water. The in-house synthesized catalystwas calcined by heating to 500 °C at a rate of 5 °C/min in 2.5 L/minflow of 20 vol % O2 and 80 vol % N2 and holding at this temperaturefor 3 h.31 The Mo and Ni content of the calcined catalyst wasmeasured by ICP analysis being 12.8 and 2.3 wt %, respectively, whichcorresponds to a Ni/Mo molar ratio of 0.3. This molar ratio isrecognized as the optimal value for HDS activity.32 The catalyst wasused in oxide form in most of the experiments, however, in a fewexperiments the catalyst was presulfided. Presulfidation of NiMocatalyst was achieved using 1−5 mL dimethyl disulfide (DMDS) inreductive atmosphere (30 bar H2, loaded at RT) at 400 °C, overnight.The sulfur content of the presulfided home-synthesized NiMo-IIcatalyst was 10.0 wt % as determined by ICP analysis, whichcorresponds to the formation of MoS2, NiS, and Ni2S3.2.3. Lignosulfonate Depolymerization Reactions. The experi-
ments were conducted in a 4566 series Parr reactor (volume of 0.3 L)with the loadings in most of the experiments being 1 g of catalyst, 10 gof H-LS, and 100 mL of ethanol as solvent. In a few experiments, 0.5 gof catalyst, 5 g of H-LS, and 50 mL of solvent were loaded. Thereactor was flushed with N2 for three times and subsequently chargedwith 26 bar H2 at room temperature (RT). Then the reactor washeated to the desired temperature (typically 310 °C) while stirringwith an approximate heating rate of 8.5 °C/min. Stirring wasimportant to avoid that lignin deposited at the reactor bottom andwas exposed to high temperature causing severe charring. Theinitiation of reaction time was considered from the moment that thetemperature inside the reactor reached the set point. At the end of thereaction time (typically 3 h), the reactor was quickly cooled byquenching the reactor vessel in an ice bath. Once the temperatureinside the reactor reached ambient condition, gas samples werecollected using Tedlar gas bags. Before opening the reactor, the gasphase was discharged to the vent and the reactor was flushed with N2gas. The effect of adding a sulfur source was studied in an experimentby adding 1 mL of DMDS to the reaction medium before reaction. Afew experiments were also conducted in the absence of catalyst forcomparison.At the end of each experiment, the solid and the liquid products of
the reactions were separated by vacuum filtration over a preweighedfilter paper. The filter cake was washed with 100 mL ethanol to ensureremoval of the light products. The filtrate and ethanol used for rinsingthe cake were collected and the solid phase was dried overnight at 60°C. The solid phase was comprised of spent catalyst, ash, char andpossibly unreacted/repolymerized lignin. The heavy and lightfractions in the liquid phase were separated using a rotary evaporatorat 35 °C, 5 mbar vacuum and a rotation speed of 130 rpm. Ethanoland the light products were evaporated (light phase), and a thickliquid phase remained unevaporated, regarded as “oil” (heavy liquidphase). During the workup procedure, the masses of the differentfractions were carefully measured. A mass loss of 6−15 wt % wasobserved during the workup procedure, mainly in the filtration stepand was likely mainly due to loss of solvent.
The yields of the oil and solid fractions were calculated based onthe dry and ash free (DAF) H-LS (eq 1 and 2, respectively). The massof the solid organics (originating from lignin) was calculated bysubtracting the mass of ash and loaded catalyst from the total solidmass obtained from filtration.
= ×‐
mm
oil yield 100Oil
DAFH LS (1)
=− −
×‐
m m m
msolid yield 100solid residue ash catalyst
DAFH LS (2)
2.4. Characterizations and Analytical Techniques. Themolecular weight distribution of lignin, solid and oil fractions wasevaluated by SEC using an Agilent 1100 series HPLC equipped with aUV−vis detector. The precolumn (50 × 8 mm, 5 μm) and column(300 × 8 mm, 5 μm) were purchased from polymer Standard ServiceCompany Polarsil. A 90/10 wt % dimethyl sulfoxide (DMSO)/watersolution containing 0.05 M LiBr was used as solvent. The sampleswere dissolved in the solvent with a concentration of approximately 2mg/mL and 10 μL of sample was injected for each analysis. Thecolumn oven temperature was set to 80 °C to facilitate the elution ofsolvent and the elution flow rate was set to 1 mL/min. Phenol (Mw:94 g/mol), guaiacylglycerol β-guaiacyl ether (GGGE) (Mw: 320 g/mol), and tannic acid (Mw: 1701 g/mol) were used as representativestandards for lignin monomers, dimers and polymers. The wavelengthdetected by the UV−vis detector was 280 nm, which is thewavelength suitable for detection of aromatic species. The compoundswith higher molecular weight are expected to be detected at lowerretention times compared to the compounds with lower molecularweight.
The oil and light fractions were analyzed using a Shimadzu QP2010 Ultra GC−MS-FID apparatus equipped with a Supelco Equity 5column. Identification and quantification of the samples wereperformed by the MS and flame ionization detector (FID),respectively. For each analysis, a weighed amount of oil sample wasdiluted in 10 mL ethanol. The initial temperature for the GC columnwas set to 40 °C and the column was heated to 250 °C with a heatingrate of 10 °C/min and kept at this temperature for 5 min. A split ratioof 90 was used in the injection section. The MS was intentionallyturned off between 2.4 to 4.0 min in order to avoid saturation by thehigh concentration of ethanol. Product identification was performedusing the NIST 8 library. The selectivity of the compounds that weresufficiently volatile to pass through the GC column was calculated bythe ratio of the FID-area of each compound relative to the total FID-area.
HSQC NMR experiments were performed on a 400 MHz BrukerAscend magnet with an Avance II console and equipped with aProdigy cryoprobe, at 400.13 MHz for 1H and 100.61 for 13C usingthe standard Bruker pulse sequence. The samples were prepared bydissolving them in DMSO-d6. The experiments were recorded with asweep width of 12 ppm in 1H and 2048 points and 256 increments inthe indirect dimension (13C) covering 165 ppm. The delay formagnetization transfer delay was calculated to be optimal for a one-bond coupling for 145 Hz. Data were processed and plotted usingMnova software.
An Agilent 7890A series GC-TCD detector was used foridentification and quantification of gaseous products. The gasinjection into the GC was achieved using a fixed pressure pump. H2was analyzed with an arrangement of a 6 ft Haysep Q and 5 Åmolecular sieve columns, where Ar was the carrier gas. The gases N2,O2, CO, CO2, CH4, C2H4, and C2H6, were detected in a line whereHe was the carrier gas with a column arrangement of 3 ft Haysep Q,HP-Plot and 5 Å. The calibration curves were created using certifiedgas mixtures from AGA. The moles of each gas were calculated by thegas phase analysis from the GC and the cold pressure of the autoclaveat the end of each experiment assuming ideal gas behavior.
The oil phases from both noncatalytic and catalytic reactions wereanalyzed with GC × GC analysis on a LECO Pegasus GC × GC-TOFMS equipped with two columns: The first column was a 25 m ×0.25 mm i.d. and 0.25 μm film of ZB-1701 connected to a second
Energy & Fuels Article
DOI: 10.1021/acs.energyfuels.8b03519Energy Fuels 2019, 33, 1196−1209
1198

column which was a 1.5 m × 0.18 mm i.d. and 0.18 μm film of Rtx-5.The oven temperature of the first column was set to 40 °C for 2 min,then heated to 300 °C with a heating rate of 5 °C/min and was keptat 300 °C for 5 min. The second oven had an offset of 5 °C from firstcolumn. Pulsed split with split ratio of 25 and pressure of 20 psi for 2min was applied. The carrier gas was He with constant flow of 1.5mL/min. The modulation time was 8 s throughout the run. The MSacquisition was acquired with mass range of 41−441 m/z at 100. Theion source temperature was set to 225 °C. The MS plots wereanalyzed using LECO ChromaTOF software, version 4.50.The content of organic carbon, hydrogen, sulfur and nitrogen in H-
LS, oil and solid fractions were analyzed using a EuroVector EA 3000CHNS analyzer. The measurement was done by combustion of a 1mg encapsulated sample at 980 °C and further quantification ofevolved CO2, H2O, N2 and SO2 by GC-TCD. The oxygen percentagewas calculated by subtraction of the C, H, N, S and ash percentages ofeach sample. The ash content of H-LS and also solid residues wasdetermined by combusting an aliquot of approximately 1 g in an ovenat 600 °C. The solid residues from the catalytic experiments weremixed with spent catalyst. It was assumed that the catalyst is notcombustible and is left with the ash after the combustion. Oxidationof sulfides to oxides may be expected by combustion, however, theminor differences caused by this was not taken into account.ICP-OES was used for quantification of the Ni, Mo and S content
in NiMo-II catalyst samples. The samples were melted together withpotassium pyrosulfate, dissolved in a solution of water and HCl andanalyzed with optical emission spectroscopy. Moreover, the sulfurcontent in the oil fractions was measured by ICP-OES. The sampleswere prepared by dilution of a weighed amount of oil samples inethanol.The presulfided NiMo-II catalyst before reaction, spent presulfided
NiMo-II after reaction, and also spent non-presulfided NiMo-II afterreaction were analyzed with TEM-EDX analysis. The samples weredispersed on a grid and mounted on an FEI single tilt holder. TheTEM images were obtained using a FEI Tecnai T20 G2 S-TEMmicroscope operating at 200 keV. The EDX spectra were acquiredwith an Oxford X-max silicon-drift detector (SDD) with an active areaof 80 mm2.
3. RESULTS AND DISCUSSION
3.1. Depolymerization of Lignosulfonate. The resultsfrom conversion of H-LS are summarized in Table 1. Thereproducibility was confirmed by repeating selected experi-ments. A high yield of 67 ± 2 wt % oil phase was obtainedfrom conversion of H-LS over the NiMo-I catalyst at 310 °C(Table 1, entry 1) and the yield of solid fraction was 38 ± 2 wt%. The catalyst was used in its oxide form, and it was assumedthat it may become sulfided in situ by reaction with sulfur fromlignosulfonate. This will be discussed later based on the resultsfrom the NiMo-II catalyst. Noticeably, the sum of the solid andoil yields exceeded 100%, most likely due to the solventincorporation. This has been observed before by Ma et al.,33
where 164 wt % oil yield was reported from ethanolysis of kraftlignin over α-MoC1−x/AC at 280 °C, indicating considerableethanol conversion and incorporation to the liquid products.The observed oil yield in this work at 310 °C and 3 h reactiontime is among the highest yields reported from one-pot mildsolvothermal conversion of lignin [21,27,34]; 57 wt %methanol soluble oil was reported from reductive conversionof kraft lignin in methanol at 320 °C and 8 h reaction time.21
Oregui-Bengoechea reported maximum oil yield of 65 wt %from conversion of rice-straw lignin in ethanol/formic acidsolution over sulfated alumina-supported NiMo catalyst athigher temperature and reaction time of 340 °C and 6 h.34
To assess the sulfidation state of the non-presulfided catalystafter reaction, an experiment was made at 310 °C using the
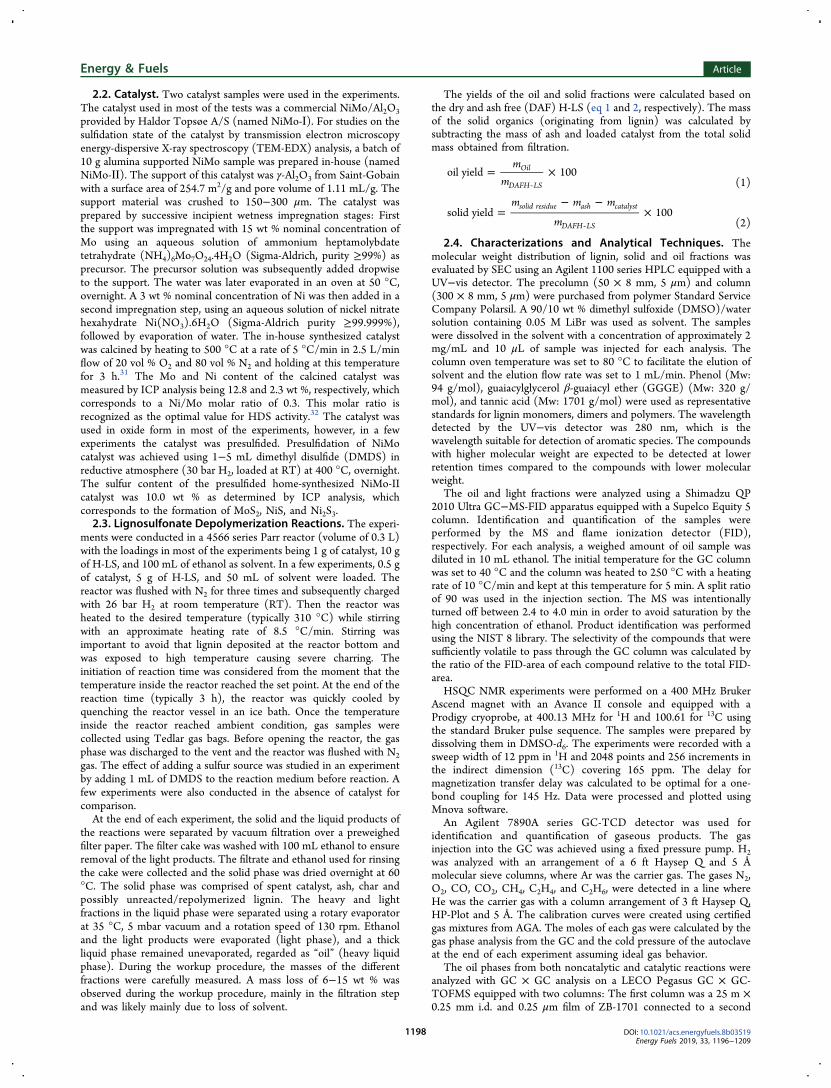
homemade non-presulfided NiMo-II catalyst (0.5 g of catalyst,5 g of H-LS, 50 mL of ethanol, 3 h, no DMDS addition) andsubsequently the TEM-EDX analysis of the spent NiMo-IIcatalyst was obtained. Moreover, the TEM-EDX analysis offresh presulfided NiMo-II and spent presulfided NiMo-II afterreaction (0.5 g of catalyst, 5 g of H-LS, 50 mL of ethanol, 310°C, 3 h, no DMDS addition) were obtained as reference. Theoil yields observed using NiMo-II catalyst in the non-presulfided and presulfided forms were 79 and 81 wt %,respectively, and were comparable with those obtained usingnon-presulfided and presulfided NiMo-I with similar catalyst,lignin and solvent loading (Table 1, entries 7 and 8).The MoS2 slabs were clearly visible in the TEM images of
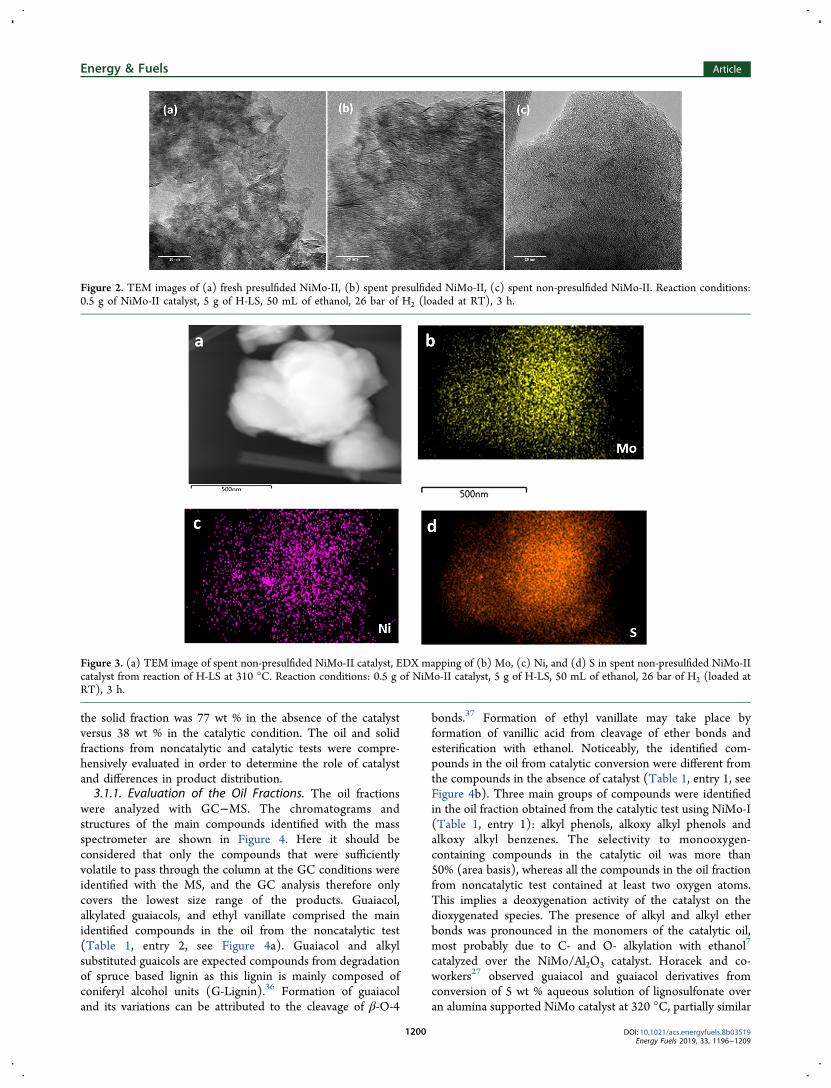
the fresh presulfided NiMo-II (Figure 2a) and the spentpresulfided NiMo-II (Figure 2b). Regarding the spent non-presulfided NiMo-II (Figure 2, c), linear features were detectedwhich were consistent with MoS2 slabs, however, in a lessdeveloped state compared to the presulfided NiMo-II catalystsamples. The EDX analysis of the spent non-presulfided NiMo-II showed a homogeneous distribution of Ni, Mo and S(shown in Figure 3). 10.0 wt % sulfur was determined by ICPin the sulfided home-synthesized NiMo-II catalyst, which issufficient to convert Mo and Ni atoms to the sulfided state. Onthe basis of the TEM and EDX results, we therefore concludethat the catalyst was sulfided in situ from the sulfur present inthe structure of lignin. In some EDX images, localaccumulation of Ni and S was observed (shown in theSupporting Information, Figure S1), which is most likely dueto formation of Ni3S2 along with NiMoS.35
The role of the catalyst was studied by conversion of H-LSin the absence of catalyst (Table 1, entry 2). The presence ofthe catalyst clearly promoted formation of the liquefiedfragments as only 26 wt % oil was obtained in noncatalyticcondition compared to 67 wt % with the catalyst. Conversely,
Table 1. Results from Conversion of H-LSa
entry
catalyst:presulfided/
oxidecatalystmass [g]
reactiontime [h] T [°C]
oil yield(wt %)
solidyield(wt %)
1 oxide 1 3 310 67 382 noncatalytic 0 3 310 26 773b oxide 1 3 310 45 644 noncatalytic 0 3 260 17 815 oxide 1 3 260 29 726 presulfided 1 3 260 46 567c oxide 0.5 3 310 76 248c presulfided 0.5 3 310 76 259d presulfided 1 3 260 44 5110 presulfided 1 3 290 53 4511 presulfided 1 3 300 62 4012 oxide 1 1 310 53 4913 oxide 1 2 310 61 4214 oxide 1 4 310 79 2515 oxide 0.5 3 310 57 4716 oxide 2 3 310 88 1517 oxide 3 3 310 87 1618e spent catalyst NA 3 310 65 3519f spent catalyst NA 3 310 61 36
aReaction condition: NiMo-I catalyst, 10 g H-LS, 100 mL ethanol, 26bar H2 (loaded at RT). bExperiment in N2 atmosphere (8 bar N2loaded at RT), c0.5 g catalyst, 5 g lignin, 50 mL solvent, dWithaddition of 1 mL DMDS, eReusing catalyst from entry 1, fReusingcatalyst from entry 18.
Energy & Fuels Article
DOI: 10.1021/acs.energyfuels.8b03519Energy Fuels 2019, 33, 1196−1209
1199
the solid fraction was 77 wt % in the absence of the catalystversus 38 wt % in the catalytic condition. The oil and solidfractions from noncatalytic and catalytic tests were compre-hensively evaluated in order to determine the role of catalystand differences in product distribution.3.1.1. Evaluation of the Oil Fractions. The oil fractions
were analyzed with GC−MS. The chromatograms andstructures of the main compounds identified with the massspectrometer are shown in Figure 4. Here it should beconsidered that only the compounds that were sufficientlyvolatile to pass through the column at the GC conditions wereidentified with the MS, and the GC analysis therefore onlycovers the lowest size range of the products. Guaiacol,alkylated guaiacols, and ethyl vanillate comprised the mainidentified compounds in the oil from the noncatalytic test(Table 1, entry 2, see Figure 4a). Guaiacol and alkylsubstituted guaicols are expected compounds from degradationof spruce based lignin as this lignin is mainly composed ofconiferyl alcohol units (G-Lignin).36 Formation of guaiacoland its variations can be attributed to the cleavage of β-O-4
bonds.37 Formation of ethyl vanillate may take place byformation of vanillic acid from cleavage of ether bonds andesterification with ethanol. Noticeably, the identified com-pounds in the oil from catalytic conversion were different fromthe compounds in the absence of catalyst (Table 1, entry 1, seeFigure 4b). Three main groups of compounds were identifiedin the oil fraction obtained from the catalytic test using NiMo-I(Table 1, entry 1): alkyl phenols, alkoxy alkyl phenols andalkoxy alkyl benzenes. The selectivity to monooxygen-containing compounds in the catalytic oil was more than50% (area basis), whereas all the compounds in the oil fractionfrom noncatalytic test contained at least two oxygen atoms.This implies a deoxygenation activity of the catalyst on thedioxygenated species. The presence of alkyl and alkyl etherbonds was pronounced in the monomers of the catalytic oil,most probably due to C- and O- alkylation with ethanol7
catalyzed over the NiMo/Al2O3 catalyst. Horacek and co-workers27 observed guaiacol and guaiacol derivatives fromconversion of 5 wt % aqueous solution of lignosulfonate overan alumina supported NiMo catalyst at 320 °C, partially similar
Figure 2. TEM images of (a) fresh presulfided NiMo-II, (b) spent presulfided NiMo-II, (c) spent non-presulfided NiMo-II. Reaction conditions:0.5 g of NiMo-II catalyst, 5 g of H-LS, 50 mL of ethanol, 26 bar of H2 (loaded at RT), 3 h.
Figure 3. (a) TEM image of spent non-presulfided NiMo-II catalyst, EDX mapping of (b) Mo, (c) Ni, and (d) S in spent non-presulfided NiMo-IIcatalyst from reaction of H-LS at 310 °C. Reaction conditions: 0.5 g of NiMo-II catalyst, 5 g of H-LS, 50 mL of ethanol, 26 bar of H2 (loaded atRT), 3 h.
Energy & Fuels Article
DOI: 10.1021/acs.energyfuels.8b03519Energy Fuels 2019, 33, 1196−1209
1200

to the compounds observed in the noncatalytic oil in this work.The difference between the products observed in our catalyticoil and the catalytic oil in the work from Horacek et al.27 isascribed to the role of ethanol compared to water in alkylationof reactive intermediate.7 It was assumed that saturation ofaromatics did not take place since aliphatic cyclic compoundswere not detected by GC analysis in the oil samples.Moreover, the oil fractions from noncatalytic and catalytic
conversion of H-LS at 310 °C were qualitatively analyzed withGC × GC analysis for identification of the main compoundgroups in the oil fractions (Figure 5). Guaiacol and alkylguaiacols (methyl-, ethyl-, and propyl-substituted guaiacol) andcatechol and alkyl catechols (methyl- and ethyl-substitutedcatechols) were the major identified compounds in the oilfraction obtained in the noncatalytic condition, whereas alkylphenols, alkyl benzenes, and alkyl catechols were identifiedcompound groups in the catalytic oil. Ethanol incorporation inform of alkylation was clearly observed over the catalyst, wherebis and tert alkyl compounds were detected. Oxygen-freecompounds such as alkyl benzene were only detected in the oil
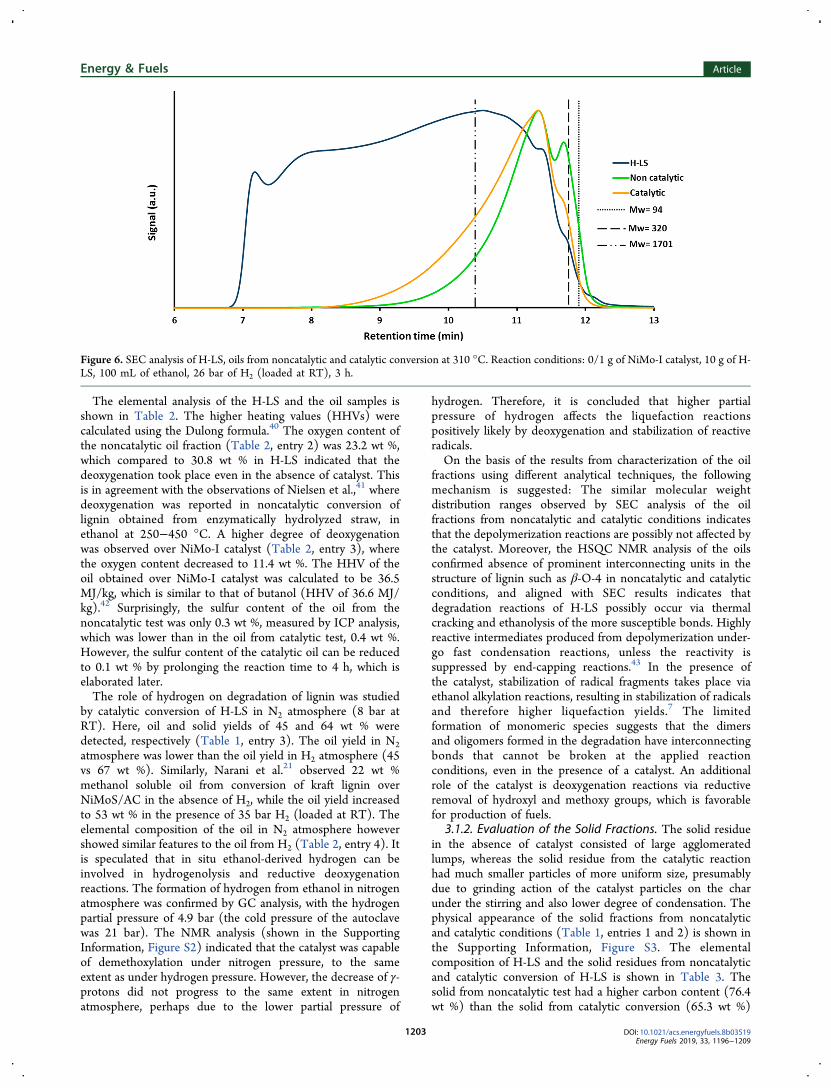
from catalytic conversion of H-LS. Deoxygenation andalkylation reactions in the presence of the catalyst weretherefore confirmed by GC × GC, which is consistent with theGC−MS results. Vanillic acid derivatives were the otheridentified group in noncatalytic condition, while the intensitiescorresponding to this group considerably decreased in thecatalytic oil, presumably by the deoxygenation activity of thecatalyst in removing the carboxyl groups. Moreover, vanillinderivatives with a low intensity were detected in the oil fromnoncatalytic condition only.The SEC analysis of the noncatalytic and catalytic oils are
shown in Figure 6 and the SEC of H-LS is shown forcomparison. The retention times of phenol, GGGE and tannicacid are further shown as standards. According to the SECresults, H-LS is highly degraded to liquefied compounds,however, the conversion of H-LS over the NiMo catalyst didnot result in formation of compounds with a higher degree ofdepolymerization as both oil fractions had the same retentiontime range. The oil from noncatalytic test showed a bimodalelution, while the oil from the catalytic condition had a more
Figure 4. GC−MS analysis of the oil fractions from conversion of H-LS at 310 °C: (a) noncatalytic; (b) catalytic. Reaction conditions: 0/1 g ofNiMo-I catalyst, 10 g of H-LS, 100 mL of ethanol, 26 bar of H2 (loaded at RT), 3 h.
Energy & Fuels Article
DOI: 10.1021/acs.energyfuels.8b03519Energy Fuels 2019, 33, 1196−1209
1201

uniform molecular weight distribution. The main peaks in bothoil samples had elution times within the range of dimers tooligomers, however, the catalytically produced oil had a greaterfraction of larger compounds. The formation of a higherfraction of monomers perhaps requires higher reactiontemperature to break the highly stable C−C bonds and maythen lead to too light products. The potential reasons for thesimilar sizes of the oil fractions are elaborated later with themechanism of the lignin degradation.In order to get a better insight into the functional groups in
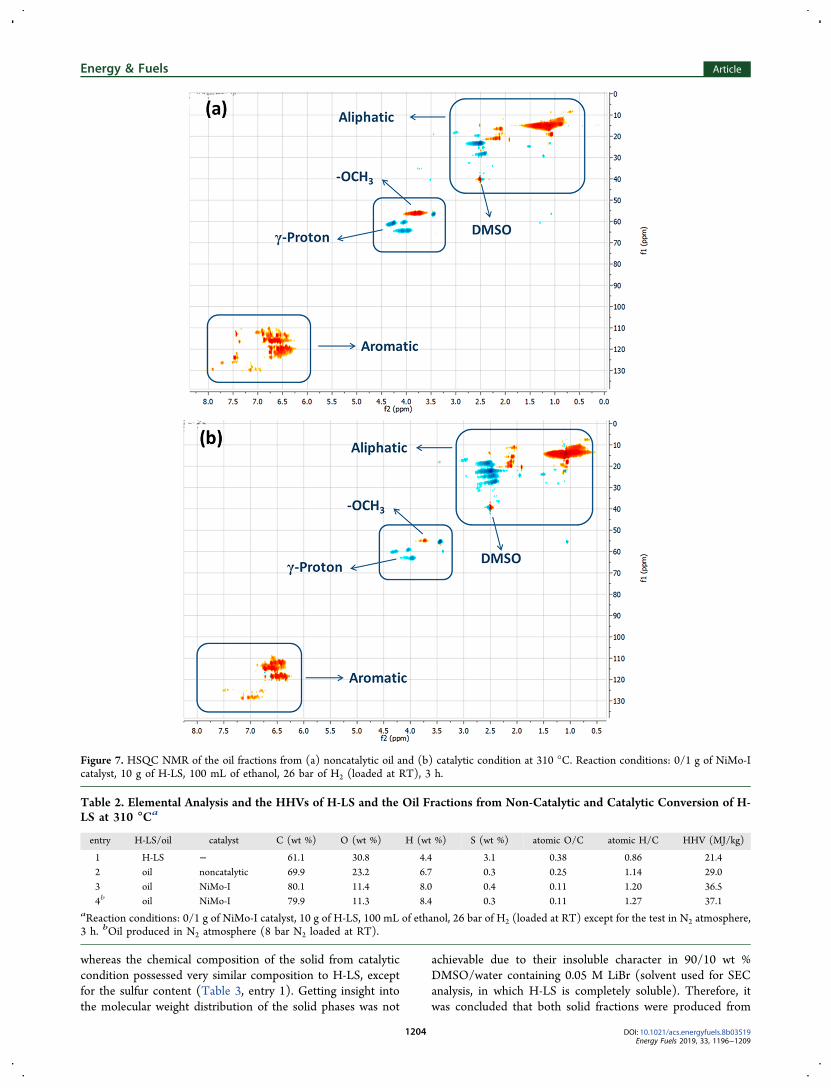
the oil fractions HSQC NMR was utilized. The NMR analysisof the oil fractions from noncatalytic and catalytic reactionsover NiMo-I at 310 °C are shown in Figure 7. The signalscorresponding to the aliphatic and aromatic regions and theside chains are specified according to the literature.38,39 Theprominent interconnecting units in the structure of lignin suchas β-O-4 and α-O-4 were not detected, indicating that thedegradation in the absence and presence of catalyst perhaps
resulted in the cleavage of these bonds. Compared to thenoncatalytic oil, a pronounced decrease in methoxy protons(δC/δH 56.2/3.75) relative to the aromatic protons wasobserved in the catalytic oil. In agreement with the GC−MSresults, this indicates the catalytic hydrogenolysis anddeoxygenation of methoxy groups. Additionally, 9 timesmore CH4 was evolved in the gas phase from the catalytictest which can partially be from hydrogenolysis of -OCH3 toCH4, along with solvent decomposition. A decrease in alcoholneighboring -γ-protons (δC/δH 62.9/3.76, 61.3/4.27), wasobserved in catalytically produced oil. This indicated theremoval of the hydroxyl group on the aliphatic carbon in thepresence of the catalyst. Higher intensities in the aliphaticregion were detected in the oil from catalytic conversion whichcorresponds to CH3/CH in α position connected to anaromatic ring and is consistent with the observed ethanolalkylation reactions catalyzed over the NiMo catalyst.
Figure 5. GC × GC analysis of the oil fractions from (a) noncatalytic and (b) catalytic condition at 310 °C. Reaction conditions: 0/1 g of NiMo-Icatalyst, 10 g of H-LS, 100 mL of ethanol, 26 bar of H2 (loaded at RT), 3 h.
Energy & Fuels Article
DOI: 10.1021/acs.energyfuels.8b03519Energy Fuels 2019, 33, 1196−1209
1202
The elemental analysis of the H-LS and the oil samples isshown in Table 2. The higher heating values (HHVs) werecalculated using the Dulong formula.40 The oxygen content ofthe noncatalytic oil fraction (Table 2, entry 2) was 23.2 wt %,which compared to 30.8 wt % in H-LS indicated that thedeoxygenation took place even in the absence of catalyst. Thisis in agreement with the observations of Nielsen et al.,41 wheredeoxygenation was reported in noncatalytic conversion oflignin obtained from enzymatically hydrolyzed straw, inethanol at 250−450 °C. A higher degree of deoxygenationwas observed over NiMo-I catalyst (Table 2, entry 3), wherethe oxygen content decreased to 11.4 wt %. The HHV of theoil obtained over NiMo-I catalyst was calculated to be 36.5MJ/kg, which is similar to that of butanol (HHV of 36.6 MJ/kg).42 Surprisingly, the sulfur content of the oil from thenoncatalytic test was only 0.3 wt %, measured by ICP analysis,which was lower than in the oil from catalytic test, 0.4 wt %.However, the sulfur content of the catalytic oil can be reducedto 0.1 wt % by prolonging the reaction time to 4 h, which iselaborated later.The role of hydrogen on degradation of lignin was studied
by catalytic conversion of H-LS in N2 atmosphere (8 bar atRT). Here, oil and solid yields of 45 and 64 wt % weredetected, respectively (Table 1, entry 3). The oil yield in N2atmosphere was lower than the oil yield in H2 atmosphere (45vs 67 wt %). Similarly, Narani et al.21 observed 22 wt %methanol soluble oil from conversion of kraft lignin overNiMoS/AC in the absence of H2, while the oil yield increasedto 53 wt % in the presence of 35 bar H2 (loaded at RT). Theelemental composition of the oil in N2 atmosphere howevershowed similar features to the oil from H2 (Table 2, entry 4). Itis speculated that in situ ethanol-derived hydrogen can beinvolved in hydrogenolysis and reductive deoxygenationreactions. The formation of hydrogen from ethanol in nitrogenatmosphere was confirmed by GC analysis, with the hydrogenpartial pressure of 4.9 bar (the cold pressure of the autoclavewas 21 bar). The NMR analysis (shown in the SupportingInformation, Figure S2) indicated that the catalyst was capableof demethoxylation under nitrogen pressure, to the sameextent as under hydrogen pressure. However, the decrease of γ-protons did not progress to the same extent in nitrogenatmosphere, perhaps due to the lower partial pressure of
hydrogen. Therefore, it is concluded that higher partialpressure of hydrogen affects the liquefaction reactionspositively likely by deoxygenation and stabilization of reactiveradicals.On the basis of the results from characterization of the oil
fractions using different analytical techniques, the followingmechanism is suggested: The similar molecular weightdistribution ranges observed by SEC analysis of the oilfractions from noncatalytic and catalytic conditions indicatesthat the depolymerization reactions are possibly not affected bythe catalyst. Moreover, the HSQC NMR analysis of the oilsconfirmed absence of prominent interconnecting units in thestructure of lignin such as β-O-4 in noncatalytic and catalyticconditions, and aligned with SEC results indicates thatdegradation reactions of H-LS possibly occur via thermalcracking and ethanolysis of the more susceptible bonds. Highlyreactive intermediates produced from depolymerization under-go fast condensation reactions, unless the reactivity issuppressed by end-capping reactions.43 In the presence ofthe catalyst, stabilization of radical fragments takes place viaethanol alkylation reactions, resulting in stabilization of radicalsand therefore higher liquefaction yields.7 The limitedformation of monomeric species suggests that the dimersand oligomers formed in the degradation have interconnectingbonds that cannot be broken at the applied reactionconditions, even in the presence of a catalyst. An additionalrole of the catalyst is deoxygenation reactions via reductiveremoval of hydroxyl and methoxy groups, which is favorablefor production of fuels.
3.1.2. Evaluation of the Solid Fractions. The solid residuein the absence of catalyst consisted of large agglomeratedlumps, whereas the solid residue from the catalytic reactionhad much smaller particles of more uniform size, presumablydue to grinding action of the catalyst particles on the charunder the stirring and also lower degree of condensation. Thephysical appearance of the solid fractions from noncatalyticand catalytic conditions (Table 1, entries 1 and 2) is shown inthe Supporting Information, Figure S3. The elementalcomposition of H-LS and the solid residues from noncatalyticand catalytic conversion of H-LS is shown in Table 3. Thesolid from noncatalytic test had a higher carbon content (76.4wt %) than the solid from catalytic conversion (65.3 wt %)
Figure 6. SEC analysis of H-LS, oils from noncatalytic and catalytic conversion at 310 °C. Reaction conditions: 0/1 g of NiMo-I catalyst, 10 g of H-LS, 100 mL of ethanol, 26 bar of H2 (loaded at RT), 3 h.
Energy & Fuels Article
DOI: 10.1021/acs.energyfuels.8b03519Energy Fuels 2019, 33, 1196−1209
1203
whereas the chemical composition of the solid from catalyticcondition possessed very similar composition to H-LS, exceptfor the sulfur content (Table 3, entry 1). Getting insight intothe molecular weight distribution of the solid phases was not
achievable due to their insoluble character in 90/10 wt %DMSO/water containing 0.05 M LiBr (solvent used for SECanalysis, in which H-LS is completely soluble). Therefore, itwas concluded that both solid fractions were produced from
Figure 7. HSQC NMR of the oil fractions from (a) noncatalytic oil and (b) catalytic condition at 310 °C. Reaction conditions: 0/1 g of NiMo-Icatalyst, 10 g of H-LS, 100 mL of ethanol, 26 bar of H2 (loaded at RT), 3 h.
Table 2. Elemental Analysis and the HHVs of H-LS and the Oil Fractions from Non-Catalytic and Catalytic Conversion of H-LS at 310 °Ca
entry H-LS/oil catalyst C (wt %) O (wt %) H (wt %) S (wt %) atomic O/C atomic H/C HHV (MJ/kg)
1 H-LS − 61.1 30.8 4.4 3.1 0.38 0.86 21.42 oil noncatalytic 69.9 23.2 6.7 0.3 0.25 1.14 29.03 oil NiMo-I 80.1 11.4 8.0 0.4 0.11 1.20 36.54b oil NiMo-I 79.9 11.3 8.4 0.3 0.11 1.27 37.1
aReaction conditions: 0/1 g of NiMo-I catalyst, 10 g of H-LS, 100 mL of ethanol, 26 bar of H2 (loaded at RT) except for the test in N2 atmosphere,3 h. bOil produced in N2 atmosphere (8 bar N2 loaded at RT).
Energy & Fuels Article
DOI: 10.1021/acs.energyfuels.8b03519Energy Fuels 2019, 33, 1196−1209
1204
condensation reactions. The higher oxygen content in the solidfrom catalytic condition compared to the noncatalytic solidsuggests that it probably experienced a lower degree ofcondensation.3.2. Effect of Catalyst Presulfidation on Products. As
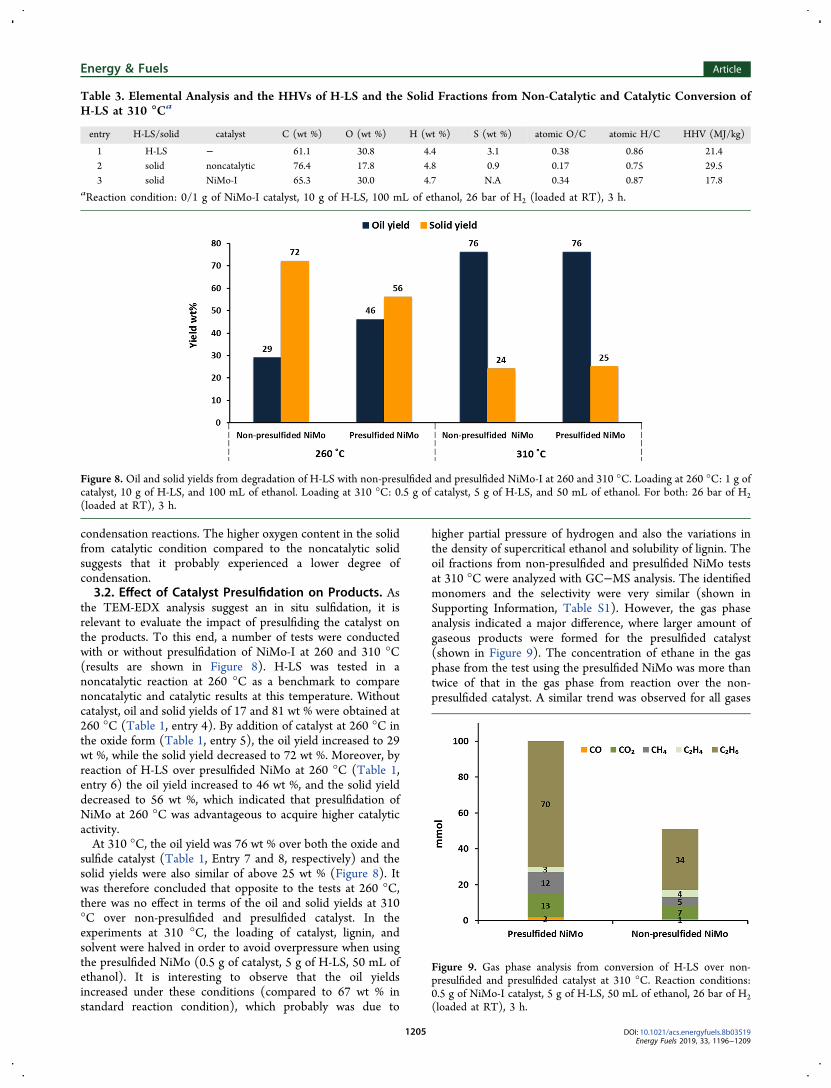
the TEM-EDX analysis suggest an in situ sulfidation, it isrelevant to evaluate the impact of presulfiding the catalyst onthe products. To this end, a number of tests were conductedwith or without presulfidation of NiMo-I at 260 and 310 °C(results are shown in Figure 8). H-LS was tested in anoncatalytic reaction at 260 °C as a benchmark to comparenoncatalytic and catalytic results at this temperature. Withoutcatalyst, oil and solid yields of 17 and 81 wt % were obtained at260 °C (Table 1, entry 4). By addition of catalyst at 260 °C inthe oxide form (Table 1, entry 5), the oil yield increased to 29wt %, while the solid yield decreased to 72 wt %. Moreover, byreaction of H-LS over presulfided NiMo at 260 °C (Table 1,entry 6) the oil yield increased to 46 wt %, and the solid yielddecreased to 56 wt %, which indicated that presulfidation ofNiMo at 260 °C was advantageous to acquire higher catalyticactivity.At 310 °C, the oil yield was 76 wt % over both the oxide and
sulfide catalyst (Table 1, Entry 7 and 8, respectively) and thesolid yields were also similar of above 25 wt % (Figure 8). Itwas therefore concluded that opposite to the tests at 260 °C,there was no effect in terms of the oil and solid yields at 310°C over non-presulfided and presulfided catalyst. In theexperiments at 310 °C, the loading of catalyst, lignin, andsolvent were halved in order to avoid overpressure when usingthe presulfided NiMo (0.5 g of catalyst, 5 g of H-LS, 50 mL ofethanol). It is interesting to observe that the oil yieldsincreased under these conditions (compared to 67 wt % instandard reaction condition), which probably was due to
higher partial pressure of hydrogen and also the variations inthe density of supercritical ethanol and solubility of lignin. Theoil fractions from non-presulfided and presulfided NiMo testsat 310 °C were analyzed with GC−MS analysis. The identifiedmonomers and the selectivity were very similar (shown inSupporting Information, Table S1). However, the gas phaseanalysis indicated a major difference, where larger amount ofgaseous products were formed for the presulfided catalyst(shown in Figure 9). The concentration of ethane in the gasphase from the test using the presulfided NiMo was more thantwice of that in the gas phase from reaction over the non-presulfided catalyst. A similar trend was observed for all gases
Table 3. Elemental Analysis and the HHVs of H-LS and the Solid Fractions from Non-Catalytic and Catalytic Conversion ofH-LS at 310 °Ca
entry H-LS/solid catalyst C (wt %) O (wt %) H (wt %) S (wt %) atomic O/C atomic H/C HHV (MJ/kg)
1 H-LS − 61.1 30.8 4.4 3.1 0.38 0.86 21.42 solid noncatalytic 76.4 17.8 4.8 0.9 0.17 0.75 29.53 solid NiMo-I 65.3 30.0 4.7 N.A 0.34 0.87 17.8
aReaction condition: 0/1 g of NiMo-I catalyst, 10 g of H-LS, 100 mL of ethanol, 26 bar of H2 (loaded at RT), 3 h.
Figure 8. Oil and solid yields from degradation of H-LS with non-presulfided and presulfided NiMo-I at 260 and 310 °C. Loading at 260 °C: 1 g ofcatalyst, 10 g of H-LS, and 100 mL of ethanol. Loading at 310 °C: 0.5 g of catalyst, 5 g of H-LS, and 50 mL of ethanol. For both: 26 bar of H2(loaded at RT), 3 h.
Figure 9. Gas phase analysis from conversion of H-LS over non-presulfided and presulfided catalyst at 310 °C. Reaction conditions:0.5 g of NiMo-I catalyst, 5 g of H-LS, 50 mL of ethanol, 26 bar of H2(loaded at RT), 3 h.
Energy & Fuels Article
DOI: 10.1021/acs.energyfuels.8b03519Energy Fuels 2019, 33, 1196−1209
1205

except for C2H4, which was converted over the presulfidedcatalyst to the alkane form (C2H6). This was consistent withthe rapid initial pressure increase over the presulfided catalyst.This initial gas formation most likely occurred from the solventand stopped when the catalyst surface was partially coveredwith the lignin decomposition products. For the non-presulfided catalyst, however, the sulfidation and initial ligninbreakdown occurred simultaneously and therefore much lessactive free sites were available for solvent consumption in theearly stages of the experiment.Since in situ sulfidation of the oxide precursor does occur,
the effect of presulfidation could suggest that the sulfide phaseis the active form of the catalyst. At 260 °C, the in situsulfidation generating the active phase may occur with asignificant delay in the 3 h reaction time, and thereforepresulfidation is beneficial, but at 310 °C in situ sulfidation iskinetically fast enough that presulfidation is without substantialeffect. Hereafter, the catalytic experiments at 310 °C wereconducted using NiMo-I catalyst without presulfidation, unlessspecified.The presence of a sulfur source in catalytic conversions using
NiMo and CoMo catalysts is required in order to maintaincatalyst activity. According to Mortensen et al.29 whenhydrodeoxygenation of phenol takes place over NiMoScatalyst, both H2S and H2O compete for the catalyst active
sites29 and in the absence of sulfur, the edge sulfur atoms canbe replaced by oxygen. In a test, 1 mL of DMDS was added tothe reactor for conversion of H-LS over presulfided NiMo-I at260 °C (Table 1, entry 9) to ensure sufficient partial pressureof H2S inside the reactor. Almost similar results to the test inthe absence of DMDS were observed, which indicated that thesulfidation state of catalyst can be maintained by organic sulfurfrom lignosulfonate or that the operating time was too short tolose significant amounts of sulfur from the catalyst.
3.3. Parameter Study. A parameter study on the reactiontemperature, reaction time and catalyst loading was conductedin order to evaluate the role of each on the degradation of H-LS.
3.3.1. Effect of the Reaction Temperature. The effect ofreaction temperature on the degradation of H-LS waselaborated by including the reaction temperatures 290(Table 1, entry 10) and 300 °C (Table 1, entry 11). Thecatalysts for the tests at 290 and 300 °C were presulfided toensure catalytic activity. The oil and solid yields fromconversion of H-LS and the atomic H/C and O/C ratios areshown in Figure 10. The rise in the oil yield, increase in H/Cratio and decrease in O/C ratio shows the increase in lignindegradation and HDO reactions at higher temperature. Thepartial pressures of CO and CO2 in the gas phase fromcatalytic reaction at 260 °C were 1.08 and 1.7 bar, while at 310
Figure 10. Oil and solid yields and atomic H/C and O/C ratios as a function of temperature. Reaction conditions: 1 g of NiMo-I catalyst, 10 g ofH-LS, 100 mL of ethanol, 26 bar of H2 (loaded at RT), 3 h.
Figure 11. Oil and solid yields as a function of reaction time. Reaction conditions: 1 g of NiMo-I catalyst, 10 g of H-LS, 100 mL of ethanol, 26 barof H2 (loaded at RT).
Energy & Fuels Article
DOI: 10.1021/acs.energyfuels.8b03519Energy Fuels 2019, 33, 1196−1209
1206

°C the partial pressures were 1.4 and 2.3 bar, respectively,indicating the prominent role of temperature on cleavage ofC−O bond, decarbonylation and decarboxylation. The oilyield increased with a relatively higher rate when thetemperature increased from 290 to 300 °C. The temperaturerequired for high rate of degradation and cleavage of stable C−C and C−O bonds depends on the type of biomass andtreatment method. Yuan et al.44 observed an increase of thedepolymerization over 5% Ru/C in acetone for kraft ligninwhen the reaction temperature increased from 250 to 275 °C.However, they did not observe the same trend for organosolvlignin, as it originally had lower molecular weight distributionand much better solubility in ethanol at lower temperatures.44
Surprisingly, the SEC analysis of the oil fractions at 260 and310 °C showed similar molecular weight distribution range(shown in the Supporting Information, Figure S4). Though theoil yield obtained at 310 °C was higher than the yield at 260°C, the degree of depolymerization is limited to the specificmolecular weight distribution. These observations indicate thatat higher temperatures more degradation occurred, however,the degradation progressed only to a certain size rangecentered in the dimers to oligomers, and little degradation tomonomers took place.3.3.2. Effect of the Reaction Time. The effect of reaction
time was studied by tests lasting 1, 2, and 4 h at 310 °C (Table1, entries 12−14) and comparing to the test in 3 h. The oil andsolid yields are shown in Figure 11. The oil yield increasedfrom 53 wt % in 1 h reaction time to 79 wt % in 4 h while thesolid yield decreased from 49 wt % after 1 h reaction to 25 wt% after 4 h.The elemental analysis and the atomic O/C and H/C ratio
in the oil fractions are presented in Table 4. The atomic O/Cratio gradually decreased by increasing the reaction time. TheNMR analysis of the oil fractions indicated that demethox-ylation occurred progressively (shown in the SupportingInformation, Figure S5−S7). In addition, a gradual increasein the partial pressure of methane indicated that hydro-genolysis continued throughout the reaction. However, thedecrease of the methoxy groups leveled off after 3 h. The gasphase analysis indicated that the CO production was nearlyconstant at different reaction time and the CO2 productionincreased by increase of the reaction time from 1 to 2 h, butflattened by further increase of the reaction time indicating thatdecarbonylation and decarboxylation reactions progressed inthe early stages of the reactions. The sulfur content,determined by ICP analysis, decreased from 0.5 wt % after 1h reaction to 0.1 wt % after 4 h, which if compared to thelignosulfonate with 3.1 wt % sulfur content, indicates 97%sulfur removal in the oil fraction after 4 h. This shows thatsulfur is removed from the liquid product over time asexpected since the NiMoS is an efficient HDS catalyst.The oil fractions were analyzed by GC−MS in order to get
insight on evolution of the liquefied monomers. In the oilfraction from the 1 h test, guaiacol and ethyl vanillate (shown
in Figure 4, compounds no. 1 and 4) were the maincompounds detected which shared similarities with thenoncatalytic oil fraction. Almost similar compounds weredetected in the oil fraction obtained after 2 h. However, in theoil from 3 h reaction time, the guaiacol and ethyl vanillatepeaks disappeared and peaks corresponding to alkyl phenols,alkoxy alkyl phenols, and alkoxy alkyl benzenes were detectedinstead (shown in Figure 4). Similar compounds were detectedin the oil after 4 h, indicating that demethoxylation andalkylation progressed over time. Narani et al.21 observed that inconversion of kraft lignin, by prolonging the reaction time from4 to 8 h, guaiacol and substituted guaiacols transformed toalkyl phenols while the oil yield increased from 40 to 82 wt %.In our experiments 79 wt % oil was achievable with aconsiderably shorter reaction time of 4 h and the oil iscomprised mainly of alkyl phenolic and alkoxy alkyl benzenecompounds. The molecular weight distribution of the oilfractions after 2, 3, and 4 h reaction time indicated a similarpattern (detected by SEC analysis), while the oil fraction from1 h reaction time showed formation of slightly lower molecularweight oil (shown in the Supporting Information, Figure S8).Similar to the observations on the reaction temperature, it wasobserved that the molecular weight distribution of the oil didnot decrease by increasing the reaction times and thereforefurther decrease in the molecular weight of the oil fraction mayrequire more severe conditions compared to those employed.
3.3.3. Effect of the Catalyst Loading. The effect of catalystmass was investigated by varying the loading of catalyst with afixed amount of H-LS (10 g). The solid and oil yields areshown in Table 1 (entries 15−17). The oil yield increasedfrom 57 to 88 wt % by increasing the catalyst mass from 0.5 to2 g and the solid yield decreased from 47 wt % to 15 wt %.However, by increasing the catalyst mass from 2 to 3 g nofurther increase of the oil yield was observed. At this stage, theconversion of the original lignin seems to have stopped and theremaining solid was likely a highly cross-linked char from e.g.repolymerization reactions and therefore the oil yield did notchange further as this solid could not be converted. The SECanalysis showed almost similar elution pattern, except for theoil from 0.5 g catalyst test. This oil was composed of smallermolecular weight fractions (shown in the SupportingInformation, Figure S9). Similar to what was observed byincreasing the reaction temperature and reaction time, furtherdegradation of dimers and oligomers to monomers did notoccur even with the highest catalyst loading. This supports theproposed mechanism for lignin degradation.
3.4. Catalyst Reusability. Catalyst reusability is a criticalfactor for catalytic processes. The spent catalyst from catalyticconversion of H-LS was mixed with solid char residue.Separation of the catalyst from the char was not possible;therefore, the entire solid residue fraction from a standardexperiment (Table 1, entry 1) was used as a catalyst for asubsequent experiment, without any pretreatment. The oilyields decreased slightly from 67 wt % to 65 and 61 wt %, by
Table 4. Elemental Analysis of the Oil Fractions from Conversion of H-LS for Different Reaction Timesa
reaction time [h] C (wt %) O (wt %) H (wt %) S (wt %) atomic O/C atomic H/C HHV (MJ/kg)
1 73.7 18.4 7.3 0.5 0.19 1.19 32.12 78.8 13.2 7.5 0.5 0.12 1.15 35.03 80.1 11.4 8.0 0.4 0.11 1.20 36.54 80.6 11.2 8.0 0.1 0.10 1.20 36.7
aReaction conditions: 1 g of NiMo-I catalyst, 10 g of H-LS, 100 mL of ethanol, 26 bar H2 (loaded at RT)
Energy & Fuels Article
DOI: 10.1021/acs.energyfuels.8b03519Energy Fuels 2019, 33, 1196−1209
1207

reusing catalyst for the first and second time (Table 1, entries18 and 19) which may be due to the loss of catalyst in workupprocedure. Moreover, coke may have formed on the catalyst.Considering the reasonably high oil yields, it was concludedthat the catalyst is reusable for at least two times without anypretreatment.
4. CONCLUSIONLignosulfonate in the acid form was successfully degraded inthe presence of alumina supported NiMo catalysts attemperature ranges of 260−310 °C in ethanol. The presenceof the catalyst resulted in a considerable increase of theliquefied fractions, which was attributed to stabilization ofreactive compounds with reductive ethanol incorporation overcatalytic sites. 67 wt % oil yield was obtained from conversionof H-LS at standard reaction condition at 310 °C (1 g ofcatalyst: 10 g of H-LS: 100 mL of solvent, Initial H2 loading of26 bar, 3 h). It was observed that at 310 °C, in situ activationof the catalyst to NiMoS was achievable by reaction with sulfurfrom the lignosulfonate. However, presulfidation of the catalystwas required at lower temperatures e.g. 260 °C. The yield ofliquefied fraction increased to 88 wt % by doubling the catalystloading at 310 °C. The reusability of the catalyst without anypretreatment was confirmed for at least two times with only aminor loss in the oil yield.
■ ASSOCIATED CONTENT*S Supporting InformationThe Supporting Information is available free of charge on theACS Publications website at DOI: 10.1021/acs.energy-fuels.8b03519.
Figure S1, EDX mapping of the spent non-presulfidedNiMo-II catalyst from reaction of H-LS at 310 °C andaccumulation of Ni and formation of Ni3S2; Figure S2,HSQC NMR of the oil fraction from catalyticconversion of H-LS in nitrogen atmosphere at 310 °C;Figure S3, physical appearance of the solid fractionsfrom noncatalytic and catalytic conversion of H-LS at310 °C; Table S1, selectivity of the compoundsidentified by GC−MS-FID analysis of the oil fractionsfrom conversion of H-LS over non-presulfided andpresulfided NiMo-I at 310 °C; Figure S4, SEC results ofthe oil fractions obtained from catalytic conversion of H-LS at 260 and 310 °C; Figure S5, HSQC NMR of the oilfraction from catalytic conversion of H-LS at 310 °C and1 h reaction time; Figure S6, HSQC NMR of the oilfraction from catalytic conversion of H-LS at 310 °C and2 h reaction time; Figure S7, HSQC NMR of the oilfraction from catalytic conversion of H-LS at 310 °C and4 h reaction time; Figure S8, SEC of the oil fractionsfrom catalytic conversion of H-LS at 310 °C for differentreaction times; Figure S9, SEC of the oil fractions fromcatalytic conversion of H-LS at 310 °C with variedcatalyst loadings (PDF)
■ AUTHOR INFORMATIONCorresponding Author*(A.D.J.) E-mail: [email protected]. Telephone: +45 45 25 2841.ORCIDDaniel Bo Larsen: 0000-0002-8647-536XJens Øllgaard Duus: 0000-0003-3625-1250
Anker Degn Jensen: 0000-0002-7341-4859Author ContributionsThe manuscript was written through contributions of allauthors. All authors have given approval to the final version ofthe manuscript. Authors specified with the same symbolcontributed equally.NotesThe authors declare no competing financial interest.
■ ACKNOWLEDGMENTSThis research was funded by Bio-Value SPIR, which iscofounded by The Innovation Fund Denmark, Grant No.0603-00522B. We are grateful to Haldor Topsøe A/S andBorregaard A/S for supplying the catalyst and lignosulfonate,respectively. The NMR Center at Chemistry Department,DTU, is thanked for access to the 400 MHz spectrometer.Provision of the catalyst support material by Saint Gobain isacknowledged. The authors C.S. and C.D.D. acknowledgefunding from the Danish Research Council for Technologyand Production (FTP), Grant No. 4005-00293.
■ ABBREVIATIONSCoMo, cobalt-promoted Mo; DAF, dry and ash free; DMDS,dimethyl disulfide; DMSO, dimethyl sulfoxide; FID, flameionization detector; GC, gas chromatography; GGGE,guaiacylglycerol β-guaiacyl ether; HDN, hydrodenitrogenation;HDO, hydrodeoxygenation; HDS, hydrodesulfurization; HHV,high heating value; H-LS, sulfonic acid lignosulfonate; HSQCNMR, heteronuclear single quantum coherence nuclearmagnetic resonance; ICP-OES, ion-coupled plasma-opticalemission spectroscopy; MS, mass spectrometry; NiMo, Nipromoted Mo; RT, room temperature; SEC, size exclusionchromatography; TCD, thermal conductivity detector;
■ REFERENCES(1) Brunner, G. Processing of biomass with hydrothermal andsupercritical water. Supercritical Fluid Science and Technology 2014, 5,395−509.(2) Isikgor, F. H.; Becer, C. R. Lignocellulosic biomass: Asustainable platform for production of bio-based chemicals andpolymers. Polym. Chem. 2015, 6, 4497−4559.(3) Dutta, S.; Wu, KC-W; Saha, B. Emerging strategies for breakingthe 3D amorphous network of lignin. Catal. Sci. Technol. 2014, 4,3785−99.(4) Aro, T.; Fatehi, P. Production and application of lignosulfonatesand sulfonated Lignin. ChemSusChem 2017, 10, 1861−77.(5) Rinaldi, R.; Jastrzebski, R.; Clough, M. T.; Ralph, J.; Kennema,M.; Bruijnincx, P. C. A.; et al. Paving the Way for Lignin Valorisation:Recent Advances in Bioengineering, Biorefining and Catalysis. Angew.Chem., Int. Ed. 2016, 55, 8164−215.(6) Nielsen, J. B.; Jensen, A.; Schandel, C. B.; Felby, C.; Jensen, A.D. Solvent consumption in non-catalytic alcohol solvolysis ofbiorefinery lignin. Sustain Energy Fuels 2017, 1, 2006−15.(7) Huang, X.; Koranyi, T. I.; Boot, M. D.; Hensen, E. J. M. Ethanolas capping agent and formaldehyde scavenger for efficientdepolymerization of lignin to aromatics. Green Chem. 2015, 17,4941−50.(8) Chen, P.; Zhang, Q.; Shu, R.; Xu, Y.; Ma, L.; Wang, T. Catalyticdepolymerization of the hydrolyzed lignin over mesoporous catalysts.Bioresour. Technol. 2017, 226, 125−31.(9) Wang, X.; Rinaldi, R. Solvent effects on the hydrogenolysis ofdiphenyl ether with raney nickel and their implications for theconversion of lignin. ChemSusChem 2012, 5, 1455−66.(10) Kim, J.-Y.; Park, J.; Hwang, H.; Kim, J. K.; Song, I. K.; Choi, J.W. Catalytic depolymerization of lignin macromolecule to alkylated
Energy & Fuels Article
DOI: 10.1021/acs.energyfuels.8b03519Energy Fuels 2019, 33, 1196−1209
1208

phenols over various metal catalysts in supercritical tert-butanol. J.Anal. Appl. Pyrolysis 2015, 113, 99−106.(11) Kumar, C. R.; Anand, N.; Kloekhorst, A.; Cannilla, C.; Bonura,G.; Frusteri, F.; et al. Solvent free depolymerization of Kraft lignin toalkyl-phenolics using supported NiMo and CoMo catalysts. GreenChem. 2015, 17, 4921−4930.(12) Klass, D. L. Biomass for renewable energy, fuels, and chemicals.Encycl Energy 2004, 1, 193−212.(13) Maxted, E. B. The poisoning of metallic catalysts. Adv. Catal.1951, 3, 129−78.(14) Li, M-F.; Sun, S-N.; Xu, F.; Sun, R-C. Organosolv fractionationof lignocelluloses for fuels, chemicals and materials: a biorefineryprocessing perspective. Biomass Convers. - interface Biotechnol. Chem.Mater. Sci. 2012, 341−379.(15) Zakzeski, J.; Bruijnincx, P. C. A.; Jongerius, A. L.; Weckhuysen,B. M. The catalytic valorization of lignin for the production ofrenewable chemicals. Chem. Rev. 2010, 110, 3552−99.(16) Mahmood, N.; Yuan, Z.; Schmidt, J.; Xu, C. Depolymerizationof lignins and their applications for the preparation of polyols andrigid polyurethane foams: A review. Renewable Sustainable Energy Rev.2016, 60, 317−329.(17) Busca, G. Catalysts for hydrogenations, dehydrogenations andmetathesis: Sulfides and oxides. Heterog. Catal. Mater. 2014, 345−374.(18) Lauritsen, J. V.; Kibsgaard, J.; Olesen, G. H.; Moses, P. G.;Hinnemann, B.; Helveg, S.; et al. Location and coordination ofpromoter atoms in Co- and Ni-promoted MoS2-based hydrotreatingcatalysts. J. Catal. 2007, 249, 220−33.(19) Zhu, Y.; Ramasse, Q. M.; Brorson, M.; Moses, P. G.; Hansen, L.P.; Topsøe, H.; et al. Location of Co and Ni promoter atoms in multi-layer MoS2 nanocrystals for hydrotreating catalysis. Catal. Today2016, 261, 75−81.(20) Boon, A. Q. M.; Powell, J. B. Method of extending biomassconversion catalyst life. WO2017/106228A1, 2017.(21) Narani, A.; Chowdari, R. K.; Cannilla, C.; Bonura, G.; Frusteri,F.; Heeres, H. J.; et al. Efficient catalytic hydrotreatment of Kraftlignin to alkylphenolics using supported NiW and NiMo catalysts insupercritical methanol. Green Chem. 2015, 17, 5046−57.(22) Cattelan, L.; Yuen, A. K. L.; Lui, M. Y.; Masters, A. F.; Selva,M.; Perosa, A.; et al. Renewable aromatics from kraft lignin withmolybdenum-based catalysts. ChemCatChem 2017, 9, 2717−26.(23) Joffres, B.; Lorentz, C.; Vidalie, M.; Laurenti, D.; Quoineaud,A.-A.; Charon, N.; et al. Catalytic hydroconversion of a wheat strawsoda lignin : Characterization of the products and the lignin residue.Appl. Catal., B 2014, 145, 167−76.(24) Joffres, B.; Nguyen, M. T.; Laurenti, D.; Lorentz, C.; Souchon,V.; Charon, N.; et al. Lignin hydroconversion on MoS2-basedsupported catalyst: Comprehensive analysis of products and reactionscheme. Appl. Catal., B 2016, 184, 153−62.(25) Shu, R.; Xu, Y.; Ma, L.; Zhang, Q.; Wang, T.; Chen, P.; et al.Hydrogenolysis process for lignosulfonate depolymerization usingsynergistic catalysts of noble metal and metal chloride. RSC Adv.2016, 6, 88788−88796.(26) Song, Q.; Wang, F.; Xu, J. Hydrogenolysis of lignosulfonateinto phenols over heterogeneous nickel catalysts. Chem. Commun.2012, 48, 7019−21.(27) Horacek, J.; Mikkola, J.-P.; Samikannu, A.; St’Avova, G.;Larsson, W.; Hora, L.; et al. Studies on sodium lignosulfonatedepolymerization over Al2O3 supported catalysts loaded with metalsand metal oxides in a continuous flow reactor. Top. Catal. 2013, 56,794−9.(28) Brand, S.; Hardi, F.; Kim, J.; Suh, D. J. Effect of heating rate onbiomass liquefaction: Differences between subcritical water andsupercritical ethanol. Energy 2014, 68, 420−7.(29) Mortensen, P. M.; Gardini, D.; Damsgaard, C. D.; Grunwaldt,J.; Jensen, P. A.; Wagner, J. B.; et al. Deactivation of Ni-MoS2 by bio-oil impurities during hydrodeoxygenation of phenol and octanol. Appl.Catal., A 2016, 523, 159−70.
(30) Fredheim, G. E.; Braaten, S. M.; Christensen, B. E. Molecularweight determination of lignosulfonates by size-exclusion chromatog-raphy and multi-angle laser light scattering. J. Chromatogr A 2002,942, 191−9.(31) Dabros, T. M. H.; Gaur, A.; Pintos, D. G.; Sprenger, P.; Høj,M.; Hansen, T. W.; et al. Influence of H2O and H2S on thecomposition, activity, and stability of sulfided Mo, CoMo, and NiMosupported on MgAl2O4 for hydrodeoxygenation of ethylene glycol.Appl. Catal., A 2018, 551, 106−21.(32) Medici, L.; Prins, R. The influence of chelating ligands on thesulfidation of Ni and Mo in NiMo/SiO2 hydrotreating catalysts. J.Catal. 1996, 163, 38−49.(33) Ma, R.; Hao, W.; Ma, X.; Tian, Y.; Li, Y. Catalytic ethanolysis ofkraft lignin into high-value small-molecular chemicals over ananostructured a-molybdenum carbide catalyst. Angew. Chem., Int.Ed. 2014, 53, 7310−5.(34) Oregui-Bengoechea, M.; Gandarias, I.; Miletic, N.; Simonsen, S.F.; Kronstad, A.; Arias, P. L.; et al. Thermocatalytic conversion oflignin in an ethanol/formic acid medium with NiMo catalysts: Role ofthe metal and acid sites. Appl. Catal., B 2017, 217, 353−64.(35) Hamabe, Y.; Jung, S.; Suzuki, H.; et al. Quasi in situ Ni K -edgeEXAFS investigation of the spent NiMo catalyst from ultra-deephydro- desulfurization of gas oil in a commercial plant researchpapers. J. Synchrotron Radiat. 2010, 17, 530−539.(36) Wadenback, J.; Clapham, D.; Gellerstedt, G.; von Arnold, S.Variation in content and composition of lignin in young wood ofNorway spruce. Holzforschung 2004, 58, 107−15.(37) Hicks, J. C. Advances in C-O bond transformations in lignin-derived compounds for biofuels production. J. Phys. Chem. Lett. 2011,2, 2280−7.(38) Wen, J.-L.; Sun, S.-L.; Yuan, T.-Q.; Sun, R.-C. Structuralelucidation of whole lignin from Eucalyptus based on preswelling andenzymatic hydrolysis. Green Chem. 2015, 17, 1589−96.(39) Yin, H.-S.; Liu, H.-M.; Liu, Y.-L. Structural characterization oflignin in fruits and stalks of Chinese quince. Molecules 2017, 22, 890−903.(40) Zhang, T.; Zhou, Y.; Liu, D.; Petrus, L. Qualitative analysis ofproducts formed during the acid catalyzed liquefaction of bagasse inethylene glycol. Bioresour. Technol. 2007, 98, 1454−9.(41) Nielsen, J. B.; Jensen, A.; Madsen, L. R.; Larsen, F. H.; Felby,C.; Jensen, A. D. Noncatalytic direct liquefaction of biorefinery ligninby ethanol. Energy Fuels 2017, 31, 7223−33.(42) Demirel, Y. Energy and Energy Types. Energy. Green EnergyTechnol. First 2012, 27−70.(43) Van den Bosch, S.; Renders, T.; Kennis, S.; Koelewijn, S.-F.;Van den Bossche, G.; Vangeel, T.; et al. Integrating lignin valorizationand bio-ethanol production: on the role of Ni-Al2O3 catalyst pelletsduring lignin-first fractionation. Green Chem. 2017, 19, 3313−26.(44) Yuan, Z.; Tymchyshyn, M.; Xu, C. Reductive depolymerizationof kraft and organosolv lignin in supercritical acetone for chemicalsand materials. ChemCatChem 2016, 8, 1968−1976.
Energy & Fuels Article
DOI: 10.1021/acs.energyfuels.8b03519Energy Fuels 2019, 33, 1196−1209
1209