LIPOLYTIC ENZYMES - Journal of Biological Chemistry · LIPOLYTIC ENZYMES I. STUDIES ON THE...
22
LIPOLYTIC ENZYMES I. STUDIES ON THE MECHANISM OF LIPOLYTIC ENZYME ACTIONS* BY HARRY SOROTKA AND DAVID GIJCKt (From the Laboratories of the Mount Sinai Ilospital, New York) (Received for publication, October 25, 1933) Pancreas and liver are the chief sources of lipolyt,ic enzymes in the animal body. Pancreas lipase and liver e&erase differ from each other in many regards, and t,he st,udy of their differentiating characteristics is necessary for the uhimate decision as to their identit,y or genetic relationship. An understanding of t,hese differences must be based on the essential contrast, in purpose between the groups of digestive enzymes excreted into the gast,rointestinal tract and the group of intracellular enzymes whose function in metabolism is not, as well recognized at present. The case with which an enzyme can be mobilized, the strength of its bond to t,he cell protoplasm, and its chemical character arc relat,ed to its physiological purpose. The transition of cell-bound desmoenzymes inho soluble lyoenzymes, and the release of cell-confined endoenzymes, profoundly influences their mode of action (Willstiitter, 1933). The mechanism of enzymatic lipolysis depends also on t,he degree of purity of the catalyst; for inst’ance, elimination of concomit,ant, substances by preparative procedures modifies the suscepl,ibility towards inhibiting factors or the pH optimum (Willstgtter, Haurowitz, and Memmen, 1924; Sobotka and Glick, 1934), while the addition of foreign proteins modifies the specificity (Palk, 1932). The authors will show in the following publication, that the pH-activity curves are essentially the same for liver and pan- creas but vary with the nature of the buffer, the degree of enzy- * Read before the Division of Biological Chemistry of the American Chemical Society at Chicago, Scptcmbcr, 1033. t Isidorc Hcrnshcim Rcscarch Pcllow. 199 by guest on August 11, 2018 http://www.jbc.org/ Downloaded from
Transcript of LIPOLYTIC ENZYMES - Journal of Biological Chemistry · LIPOLYTIC ENZYMES I. STUDIES ON THE...

LIPOLYTIC ENZYMES
I. STUDIES ON THE MECHANISM OF LIPOLYTIC ENZYME ACTIONS*
BY HARRY SOROTKA AND DAVID GIJCKt
(From the Laboratories of the Mount Sinai Ilospital, New York)
(Received for publication, October 25, 1933)
Pancreas and liver are the chief sources of lipolyt,ic enzymes in the animal body. Pancreas lipase and liver e&erase differ from each other in many regards, and t,he st,udy of their differentiating characteristics is necessary for the uhimate decision as to their identit,y or genetic relationship.
An understanding of t,hese differences must be based on the essential contrast, in purpose between the groups of digestive enzymes excreted into the gast,rointestinal tract and the group of intracellular enzymes whose function in metabolism is not, as well recognized at present. The case with which an enzyme can be mobilized, the strength of its bond to t,he cell protoplasm, and its chemical character arc relat,ed to its physiological purpose. The transition of cell-bound desmoenzymes inho soluble lyoenzymes, and the release of cell-confined endoenzymes, profoundly influences their mode of action (Willstiitter, 1933).
The mechanism of enzymatic lipolysis depends also on t,he degree of purity of the catalyst; for inst’ance, elimination of concomit,ant, substances by preparative procedures modifies the suscepl,ibility towards inhibiting factors or the pH optimum (Willstgtter, Haurowitz, and Memmen, 1924; Sobotka and Glick, 1934), while the addition of foreign proteins modifies the specificity (Palk, 1932). The authors will show in the following publication, that the pH-activity curves are essentially the same for liver and pan- creas but vary with the nature of the buffer, the degree of enzy-
* Read before the Division of Biological Chemistry of the American Chemical Society at Chicago, Scptcmbcr, 1033.
t Isidorc Hcrnshcim Rcscarch Pcllow.
199
by guest on August 11, 2018
http://ww
w.jbc.org/
Dow
nloaded from

200 Lipolytic Enzymes. I
matic purity, and the constitution of the substrate. Observations of this nature suggest the possibility of a genetic relationship be- t.ween the lipases of pancreas, stomach, intestinal mucosa, serum, milk, etc. The properties of an enzyme, elaborated in one organ, may be changed by transition into another organ or body fluid.
TABLE I
Relative Velocity oj Hydrolysis by L&Y and Pancreas Enzyme
Amount of 0.1 N acid formed from 0.25 cc. of substrate in 10 cc. of total volume extrapolated for 1 cc. of enzyme solution and 1 hour at 25” with 2 cc. of N NH1-NH&l buffer; initial
Acid
Rutyric ......................... Valerie. ......................... Caproic. ........................ Heptylic ........................ Caprylic. ........................ Pelargonic. ...................... Capric .......................... Stearic*. ........................ Oleic ............................ Isovaleric ....................... Malonic. ........................ Succinic. ........................ Clutaric ......................... Adipic .......................... Pimelic .......................... Suberic .......................... Azelaic .......................... Sebacic .......................... Dibutyrin ....................... Monobutyrin. ...................
* Emulsified with gum arabic.
PH -
I -
- -
Ethyl ester
Liver
5.76 13.28 2.33
2.67 1.20 0.40
1.00 0.96 0.18 0.22 0.20 0.05 0.00
13.52 0.30 10.00 0.21 8.32 0.24 4.00 0.11 4.00 0.00 2.08 0.22 1.00 0.09 1.00 0.04
Triplgcrridc
Liver
3.60 7.12 4.48 2.80 1.00 3.40 1.00 5.00 0.24 4.54
0.00 0.00 1.40
0.005 0.17 0.80
2.40 4.00 1.76 2.06
Virtanen and Suomalainen (1933) observed considerable increases of liver esterase when injecting pancreatic lipase into rabbits. On the other hand, the preservation of such characteristics as suscepti- bility to alkaloid poisons has been employed to decide the pan- creatic or hepatic origin of serum lipase.
Specificity of Lipasc and Estc~asc-The rclativc specificity of
by guest on August 11, 2018
http://ww
w.jbc.org/
Dow
nloaded from

H. Sobotka and D. Glick 201
pancreas for fats and of liver for simple esters is the chief point of discrimination between the two enzymes, which accordingly have been designated as liver esterase and pancreas lipase. The assumption that an enzyme, such as lipase, is a mixture of a great many enzymes, each specific for a single substrate, has generally been abandoned; especially since one could hardly assume that the organism would elaborate individual enzymes for the great many non-physiological substrates known to be hydrolyzed in vitro. On the other hand,, it seems peculiar that the body should avail itself of various enzymes, as lipase and esterase, for the hydrolysis of any one substrate. But such seems to be the case, as may be seen from Table I, where a comparison between the action of liver and that of pancreas is given for a number of substrates.
Data, such as those given in Table I, are an inadequate basis for conclusions as to enzyme specificity. When comparing the action of enzymes from various sources on a set of substrates, one cannot content oneself with the cross-section obtained by measurements of reaction velocities under a single arbitrary standard condition. Michaelis and Menten (1913) and Kuhn (1923) have demonstrated the important r&e of substrate concentration. The mathe- matical relationship between substrate concentration and enzy- matic activity, as verified in many instances by the typical sigmoidal activity-p8 curves, is most easily explained by the assumption of a stoichiometric substrate-enzyme combination (pS = negative logarithm of substrate concentration). This hypoth- esis permits the characterization of the action of an enzyme on a given substrate by two constants, (1) the affinity and dissociation constant (Michaelis constant) of the enzyme substrate compound, (2) a constant, characteristic for the rate at which the end-products of the reaction are formed from this enzyme-substrate compound. Apparent differences in specificity, as illustrated in Table I, have been explained in several other cases by variations in affinity; from this, the ratio of the extrapolated maximal reaction velocities of the various substrates revealed the intrinsic identity of enzymes from different sources, previously suspected of being distinct entities (Willstatter, Kuhn, and Sobotka, 1923, 1924). When the actions of lipolytic enzymes are treated in this manner, the inhibi- tion of enzyme by excess substrate, due to the formation of an inactive or less active ES, or ES,, compound, has to be reckoned
by guest on August 11, 2018
http://ww
w.jbc.org/
Dow
nloaded from

202 Lipolytic Enzymes. I
with (Murray, 1929; Bamann and Schmeller, 1931; Albers, 1933). An experimental limitation for the evaluation of affinity, in the case of substances of higher molecular weight, is their solubility, which is often so low that the necessary measurement of reaction speed at varying substrate concentrations cannot be carried out. Another problem, which involves the stepwise progress of hydroly- sis in the case of glycol or glycerol esters, will be considered below.
Substrates and Enzymes Used in This Investigation--The but,yrins offer several advantages as substrates for the study of the mecha- nism of enzymatic lipolysis. They stand as border-land com- pounds between the natural lipase substrates and those simple esters for which liver esterase is most specific, and besides they are sufficiently water-soluble to allow enzymatic measurements in a homogeneous solution.
From the preparative experiences of Glick and King (1932-33) it seems that pancreas lipase is associated with globulin. We have found liver esterase to be contained largely in the albumin fraction. Accordingly, the globulin portion of pancreas and the albumin of liver, both obtained by ammonium sulfate fractionation of am- moniacal extracts of the acetonedried hog organs, were employed.
Kinetics-The kinetics of liver esterase action may be described simply as a linear or 0 molecular reaction, a direct outcome of its high affinity for substrate. The linear course of the reaction, which is maintained even after 90 per cent of the substrate has been hydrolyzed, excludes the exist,ence of any inhibitory effect by cleavage products.
The kinetics of pancreas lipase action offer an entirely different picture (Fig. 1). The reaction curves for all substrates flatten within a short time after a steep rise and follow an almost hori- zontal course when a few per cent of the total possible hydrolysis has been effected. This peculiarity in pancreas lipase kinetics cannot be ascribed to a low affinity for subst,rates, since this affinity -although lower than that of liver-is so great, t,hat one would expect a time-reaction curve resembling that of liver esterase. Neither can any inhibition by split-products be responsible for the flattening of the curve, since the influence of butyric acid and the alcohols including glycerol, in those amounts formed during the reaction, was found to be negligible by separate control experi- ments. In the case of polyvalent subst.rates, one might suspect
by guest on August 11, 2018
http://ww
w.jbc.org/
Dow
nloaded from

H. Sobotka and D. Glick
that the reaction stops after hydrolysis of 1 equivalent. While this case has been verified for the diesters of dicarboxylic acids (unpublished experiments; cf. Christ,man and Lewis, 1921; Hyde and Lewis, 1923), it cert,ainly does not hold for the glycerides, since di- and monobutyrin are hydrolyzed with a velocity of the same order of magnitude (cj. Murray, 1929). The primary split- product of a triglyceride may be either the a,Bdiglyceride or the cx , y-diglyceride. The enzymatic hydrolysis of Q , P-diglyc- erides has not been investigated, since t.heir preparation has not been accomplished due to intervening acyl migration (Averill, Roche, and King, 1929). It is not known whether this acyl migration proceeds as quickly under biological conditions as in preparative attempts. However, the percentage of hydrolysis, at which pancreatic lipase action comes to a standstill, is essentially below the value expected even if only 1 acid equivalent were hydrolyzed. Addition of more pancreas enzyme, after the curve has flattened, is wit,hout effect on the slow course of the reaction (Curves C and D in Fig. 1); this observation excludes enzyme destruction as a cause for the greatly diminished reaction rate Furthermore, it is very improbable that the unusual kinetic curves can be accounted for by a true equilibrium with the synt,het.ic reaction at these low percentages of t,he possible hydrolysis. However, an explanation was afforded by a consideration of the r61e of the inact,ive areas on the colloidal enzyme particles.
Inactive Areas on%nzyme ParticlesWhen an additional amount of substrate is added after the react,ion has reached its sluggish state, a new spurt ensues, and this phenomenon may be repeated, as shown in Curve A, Fig. 1. This suggests that a great port’ion of the substrate has disappeared from the solution without being hydrolyzed. One might feel induced to qualify t.his disappearance as irreversible, were it not for the observation that, addition of liver enzyme causes a progress of the reaction. These fact,s can be cxplaincd besl, we believe, by the hypothesis, that the substrate is bound to inactive areas of colloidal pancreas globulin part,icles in such a manner that it, is not accessible to the active groups of the pancreatic enzyme itself, but remains available to added liver esterase If this hypothesis is correct,, the combination of large amount,s of substrate with inactive areas or ‘Ldead spofs” on the lipase particles or with altoget’hcr inactive globulin particles
by guest on August 11, 2018
http://ww
w.jbc.org/
Dow
nloaded from

204 Lipolytic Enzymes. I
evidently would diminish the actual concentration of substrate in the aqueous phase. This, in turn, would increase the apparent solubility of the substrate; such was found to be the case experi- mentally (Table II).
JOO-
-227
P ,o
-I8 *
u,
: - 9.0
60 80 IO0 IL0 I40 I60 180 .?oo MINUTEJ
FIG. 1. Kinetics of monobutyrin hydrolysis by pancreatic lipase. Curve A, hydrolysis of 0.9 mM monobutyrin in 50 cc. reaction volume at 28” by 0.1 cc. of pancreas globulin solution. Addition of 0.9 mM monobutyrin after 50 and 130 minutes. Curve B, hydrolysis of 1.8 mM monobutyrin under the same conditions. Curve C, hydrolysis of 3.4 mM monobutyrin in 50 cc. (i.e. saturation for enzyme solution used, cf. Table II) by 0.1 cc. of pancreas gIobuIin. Addition of 0.1 cc. of pancreas globulin after 140 minutes and of 0.1 cc. of liver albumin solution after 150 minutes. Curve 11, hydrolysis of 4.5 mM monobut,yrin in 50 rc. (emulsion) hyO.1 cc. of pancreasglobulin. Ad- dition ofO.1 cc. ofpancreasglohulin after 195 minutes. Titration with 0.01 N
NaOH according to Knaffl-Lenz. The horizontal lines at the right margin indicate 2 per cent hydrolysis of the total amounts of monobutyrin given.
Increased Solubility in Enzyme Solutions-As shown in Table I I, the solubility of the butyrins is increased as high as 20 times in solutions of pancreas lipase, and to a lesser degree in liver esterase solution, as compared to t,he solubility in water. This signal in- crease in subskate solubility explains t hc paradoxical observat,ion that t,he enzymatic saponification of saturated solutions of mono-
by guest on August 11, 2018
http://ww
w.jbc.org/
Dow
nloaded from

H. Sobotka and II. Glick
butyrin is surpassed by the reaction velocity of an emulsion of the est.er under equal conditions (Fig. 1, Curve B against Curve D). The concentration of the saturated aqueous solution drops after addition of the enzyme much below its original level, while in the case of an emulsion, saturation of the aqueous phase is maintained at the expense of the ester phase.
Asnities of Butyrins-The affinities of the enzyme preparations for tri-, di-, and monobutyrin were determined. The dissociation constants of the enzyme-substrate compound are a reciprocal measure of the affinity, and they represent that substrate concen- tration at which the enzyme used reacts with one-half of its maxi- mum velocity, indicating that at this substrat,e concentration one-half of the enzyme is effectively bound with the substrate.
TABLE II
Solubilil,y of BtLlyrins and Oct!yl Alcohol in Waler and in Empx Solulions al 30”
Tributy- Dihuty- Till rin
water .............................. 0.2 cc. pancreas globulin. ........... 1.0 “ “ “ ............ 0.2 “ liver albumin. ............... 1.0 “ ‘( “ ................
cc. per cc. per cc. per 100 cc. 100 cc. 100 cc.
0.0115 0.348 0.750 0.055 0.696 1.098 0.220 1.196 3.990 0.032 0.588 1.000 0.110 1.080 1.812
(MyI alcohol
cc. per 100 cc.
0.093 0.111
0.104
Determination of affinities of lipolytic enzymes have been almost, completely confined to the problem of optical selectivity. How- ever, Bamann and Schmeller (1929) measured the affinity of liver esterase from a number of animals for methyl butyrate. The constants ranged between 0.0010 for rabbit, 0.008 for man, and > 0.030 for horse liver. The high degree of substrate affinity, as indicat,ed by values of the order of magnitude 10m3 is not reached by any other hydrolytic enzyme, and its bearing on the kinetics of esterase action has been referred to above.
The authors found (Table III) the Michaelis constant of hog liver esterase for methyl butyrate equal to 200 X 10P5, i.e. in t.he same range as t,hat of rabbit., sheep (O.OOlS), and dog (0.0028). These affinities are greatly surpassed by that of tributyrin for hog
by guest on August 11, 2018
http://ww
w.jbc.org/
Dow
nloaded from

206 Lipolytic Enzymes. I
liver e&erase, with a dissociation constant of 35 X 10m5, represent- ing an extremely high affinity. The affinity of the liver enzyme for dibutyrin is 5 times, and that for monobutyrin is 25 times smaller than that for tributyrin.’
All of these substrates have less affinity for pancreas than for liver enzyme. The ratio of affinity for pancreas to that for liver is 1: 2 for tributyrin, 1: 5 for dibutyrin, 1:s for monobutyrin, and about 1: 50 for methyl butyrate.
The quantitative estimation of the amounts of substrate bound t,o inactive areas is not possible with the present data, but one may put it at a value of the same magnitude as the increment of solu- bility. The proportion of inactive to active area on the enzyme is a matter of conjecture, although it must be a very high figure. Likewise, the affinity or adsorption constant between substrate and inactive area can only be surmised. The above observations modify even our interpretation of the enzyme-substrate dissocia- tion constant as a measure of affinity between substrate and active enzyme. The apparent substrate concentration, on which the computation of the affinity was based, equals the total amount of subst,rat)e added. This is greater than the amount of substrate actually in true solution. The numerical value of the rat,io of total to dissolved substrate will approach, perhaps, the ratio of the amount taken up in enzyme solution to that in. water. The same factor of correction would apply to the dissociation constant. Hence, the true affinity of pancreas lipase for tributyrin will be about 20 times higher than the apparent affinity of pancreas globulin, and the Michaelis constant would approach 3 X 1O-5 inst.ead of 60 X 10P5.
Maximum Velocities of Butyrin Hydrolyses-On the basis of these data, one can compare the maximal velocity of hydrolysis for each substrate-enzyme couple. This maximum yelocity may be calcu- lated by doubling the value of the velocity at a substrate concen- tration, numerically equal to the dissociation constant. These theoretical maximum velocities afford a comparison regardless of substrate concentration (Willst%tter and Kuhn, 1923). When
1 The fact that the affinity of lipolytic enzymes decreases from tri- to di- to monobutyrin will cause, in dilute solutions, an accumulation of the diglyccride. This factor is significant. for the rcgulntion of lccithin syn- thesis by intcrvcning phosphorylation.
by guest on August 11, 2018
http://ww
w.jbc.org/
Dow
nloaded from
H. Sobotka and D. Glick 207
referred to tributyrin = 1, they are 3.15 for the action of liver on dibutyrin, and 2.10 for liver on monobutyrin, 0.61 for pancreas on dibutyrin, and 1.80 for pancreas on monobutyrin. The ratio tributyrin to monobutyrin is the same for liver and pancreas within the limits of error, and suggests a similarity between the two enzymes, despite the variation in affinity. However, since this does not hold for the ratio to dibutyrin, further st)udy of this question is required.
TABLE III
Ayinities of Butyrins for Liver Albumin and Pancreas Globulin, Expressed b?y Dissociation Constants K, X IO6 without and with Addition of Octyl
Alcohol
Concentration of octyl alcohol 0
Liver albumin Tributyrin. 35 Dibutyrin 180 Monobutyrin 903 Me‘thyl butyrate 200
Maximum velocities extrspol&ed for substrate
concentrstion = cc referred to tributyrin
20 28 1 15 1.00 0.99 1.07 0.48 260 450 800 3.15 3.27 3.33 2.00 900 2200 i ~~ / f:~ 1.85 2.10 :::“5
7.5 10.5
30 1400 3500
Octyl alcohol.. Pancreas globulin
Tributyrin.. _. 60 25 35 Dibutyrin 1000 1000 1300 Monobutyrin 7500 7500 6300 Methyl butyrate.. >9Ooo*
* See Willstiltter and Memmen (1924). - -
1.00 0.71 0.74 0.53 0.61 0.61 0.60 0.51 1.80 1.80 1.73 0.91
InJuence of Octyl AZcohoZ-Glick and King (1932) had studied the influence of surface-active substances on the action of pancreas lipase and liver esterase. We determined the apparent affinity constant of liver and of pancreas enzyme for the three butyrins in the presence of rising amounts of octyl alcohol (Table III).
Non-competitive inhibition, probably the effect of inhibitor combining with the inactive enzyme areas, results in no change of the Michaelis constant (same number of active groups available), but the theoretical maximum velocity is reduced (Waldschmidt- Leitz, 1929; Haldane, 1930). A few affinity+ curves, representn-
by guest on August 11, 2018
http://ww
w.jbc.org/
Dow
nloaded from
208 Lipolytic Enzymes. I
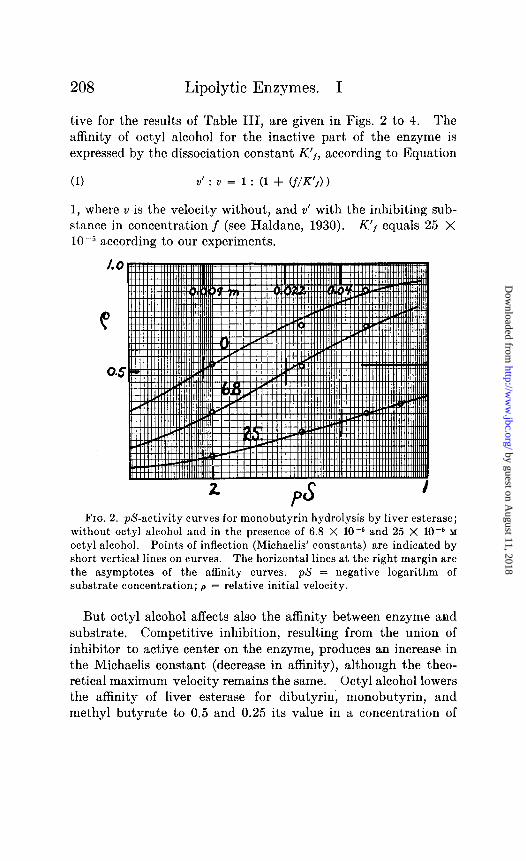
tive for the results of Table III, are given in Figs. 2 to 4. The affinity of octyl alcohol for the inactive part of the enzyme is expressed by the dissociation constant K’,, according to Equation
(1) v’ : v = 1 : (1 + V/R’,))
1, where v is the velocity without, and v’ with the inhibiting sub- stance in concentration f (see Haldane, 1930). K’f equals 25 X lo-” according to our experiments.
FIG. 2. p&activity curves for monobutyrin hydrolysis by liver e&erase; without octyl alcohol and in the presence of 6.8 X 10e6 and 25 X 10m5 M octyl alcohol. Points of inflection (Michaelis’ constants) are indicated by short vertical lines on curves. The horizontal lines at the right margin are the asymptotes of the affinity curves. pS = negative logarithm of substrate concentration; p = relative initial velocity.
But octyl alcohol affects also the affinity between enzyme and substrate. Competitive inhibition, resulting from the union of inhibitor to active center on the enzyme, produces an increase in the Michaelis constant (decrease in affinity), although the theo- retical maximum velocity remains the same. Oct,yl alcohol lowers the affinity of liver esterase for dibutyrin, monobutyrin, and methyl butyrate to 0.5 and 0.25 its value in a concentration of
by guest on August 11, 2018
http://ww
w.jbc.org/
Dow
nloaded from

H. Sobotka and D. Click 209
6.8 X lo-” and 25 X 10m5 respectively.* As shown for the case of monobutyrin in Fig. 2, the affinity curve shifts towards higher substrate concentrations (lower $3) with increasing amounts of octyl alcohol. A competitive inhibitor (Michaelis and Menten, 1913), of an affinity constant for the enzyme of l/K,, present in
FIQ. 3. p&activity curves for tributyrin hydrolysis with liver esterase; without and with 1.6 X 10T6 and 25 X 10m5 M octyl alcohol. Broken lines indicate part of curves not verified experimentally because of limited solubility of substrate. pS = negative logarithm of substrate conrrntrn- tion; p = relative initial velocity.
concentration f, reduces the hydrolysis of a substrate of affinity constant l/K, and concentration x, in the ratio
where u. signifies the rate of hydrolysis without, and u with in- hibitor. Thus, the apparent dissociation constant K, :,,,,,. is increased according to3
(3) K qapI,. = K, (1 + (f/K,))
* The inhibit,ory effect of acetophenone and other substances on the hydrolysis of ethyl butyrate by pancreas enzyme has been recognized by -Murray (1929) as a case of competitive inhibition.
3 For the derivation of these formulas consult Haldane (1930), p. 46.
by guest on August 11, 2018
http://ww
w.jbc.org/
Dow
nloaded from

210 Lipolytic Enzymes. I
by guest on August 11, 2018
http://ww
w.jbc.org/
Dow
nloaded from

H. Sobotka and D. Glick 211
This type of inhibition allows the computation of the affinity of the active group of the’enzyme for the inhibitor according to Equation 2. However, a correction for the simultaneous non-competitive inhibition according to Equation 1 must be introduced. The effect of non-competitive inhibition is mathematically eliminated by introducing, instead of v’,
(4) lJ = ?J’ (1 + (f/K’,) 1
as the v in Equation 3. The values of K, for octyl alcohol with liver esterase, obtained from various sets of experiments, varied between 7.3 X 1O-5 and 10.4 X 10⁻⁵.
The addition of octyl alcohol to tributyrin with either enzyme, and to monobutyrin with pancreas enzyme, allowed a novel obser- vation to be made. In these instances, the affinity of the enzyme for the substrate seemed to be increased; it was doubled in the presence of 25 X 1O-5 M octyl alcohol. This is the reason for the accelerating effect of the alcohol in moderate substrate and octyl alcohol concentration. In higher concentrations, both of substrate and inhibitor, the increase of substrate affinity is counterbalanced, and even overbalanced by the non-competitive inhibition.
These conditions can be understood best by inspection of Figs. 3 and 4. Here the points of inflection of the pS-affinity curves shift to the region of lower substrate concentration as the octyl alcohol concentration is increased. This results in an acceleration by 1.6 X 1O-5 octyl alcohol for liver enzyme with tributyrin. With a higher concentration of the alcohol, non-competitive inhi- bition prevails, as manifested by t,he lower parameter of the affinity curve. In the case of pancreatic enzyme, Fig. 4, the drop of the parameter, caused by 1.6 X lo-” M octyl alcohol, is sufficient to overcome the increased affinity for tributyrin (pS 3.22 -+ 3.60) in concentrations above 0.0007 M tributyrin. This is the abscissa of the point where the two curves cross, and it separates the region of acceleration from that of retardation for this concentration of octyl alcohol. Loevenhart and Peirce (1906-07) have shown that small amounts of NaF accelerate enzymatic lipolysis, while larger amounts produce inhibition.
Mechanism of Octyl Alcoh,ol Acceleration-The previous observa- tions on the kinetics of pancreas lipase and on the increased solu-
by guest on August 11, 2018
http://ww
w.jbc.org/
Dow
nloaded from

212 Lipolytic Enzymes. I
bility of substrate offer an explanation for this unprecedented increase of affinity. The surface-active alcohol competes with substrate not only for the active areas on the enzyme, but also for the inactive “dead spots.” Thus the presence of octyl alcohol actually diminishes the amount of tributyrin taken up by these inactive enzyme areas, so that more of the substrate remains in true solution. Hence, more hydrolysis is effected and accelera- tion is observed.
Inhibition by Excess Substrate-The dissociation constants K, and K’, for octyl alcohol and liver esterase bear the ratio 1: 3. These constants have a bearing on Haldane and Murray’s theory of inhibition by excess substrate (Murray, 1930), according to which a substrate such as ethyl butyrate combines with sheep liver esterase in two proportions, ES and EL%. The dissociation con- stants of these compounds are K, = 0.00114 and K’, = 0.00971. ES is the labile product which decomposes spontaneously, yield- ing ethyl alcohol, butyric acid, and regenerated catalyst. The ES2 is stable and is decomposed at a considerably reduced rate, if at all (Bamann and Laeverenz, 1931; and Schwab, Bamann, and Laeverenz, 1933).
We propose that the area of the enzyme molecule, from which emanates the weaker force of affinity for the second substrate molecule, be identical with that area where attachment of octyl alcohol causes non-competitive inhibition. The second substrat,e molecule, then, would exert the same type of retarding influence as the octanol in its non-competitive function. The reduced rate of saponification of (ES)S and (ES)F (F = foreign substance) compared to that of (ES) is thus based not only on formal, but also on st,ructural analogy (cf. Bamann and Laeverenz, 1931).
EXPERIMENTAL
h’nzymc Solutions10 gm. of acetone-ether-dried hog gland pow- der were digested with 300 cc. of 0.025 N ammonium hydroxide for 3 hours at 37”. The supernatant liquid, after being centri- fuged, was neutralized with acetic acid to brom-thymol blue, and the solution was made up to 400 cc. The globulin fraction was obtained by adding an equal volume of saturat)ed ammonium sul- fate solution. The precipitate was taken up in water and dialyzed
by guest on August 11, 2018
http://ww
w.jbc.org/
Dow
nloaded from

H. Sobotka and D. Glick 213
in so called fish-skins (animal gut) at 0” against distilled water until free from sulfate. The liquid in the bag was made up to 350 cc. The solution contained 1.46 mg. of total solids in 1 cc. for the pancreas preparation used in the experiments.
The albumin fraction was prepared by saturation of the filtrate from the globulin precipitate with ammonium sulfate. The precipitate formed was dissolved, dialyzed, and made up to volume as in the case of the globulin. Total solids, in the case of the liver preparation used, were 2.50 mg. in 1 cc.
Xolubility of Substrates-Solubilities of mono-, di-,4 and tri- butyrin and of octyl alcohol were determined by the method of Sobotka and Kahn (1931). The results, expressed in cc. of solute per 100 cc. of solvent, are given in Table II for water and for enzyme solutions diluted 100 and 500 times. The interference by hydrolysis of the substrate was negligible under the conditions of the determination.
The mutual interference between octyl alcohol and tribuhyrin is demonstrated by the following figures: The amount of octyl alco- hol taken up by 100 cc. of pancreas globulin solution, diluted 1: 500 (total solids 0.29 mg. per 100 cc.) and saturated with tributyrin, was 0.053 cc. instead of 0.111 cc., as taken up by the same enzyme solution without tributyrin. The amount of octyl alcohol taken up by 100 cc. of saturated tributyrin solution without enzyme is 0.050 cc.
Methods of Determination of Enzymatic Hydrolysis-The stalag- mometric estimation of tributyrin hydrolysis, in spite of its merits, could not be used for kinetic studies, since preliminary experiments showed that the decrease in drop number is not proportional, but much greater than the percentage hydrolysis by titration. These discrepancies appear to be inherent to surface tension methods, as t.hey were confirmed by the more accurate stat,ic method with a platinum ring and a torsion balance.
The measurement of enzymatic activity for the data recorded in Table I was performed with 2 cc. of N ammonia-ammonium chloride buffer (1:2), 0.25 cc. or 0.50 cc. of the original enzyme solution in a total volume of 10 cc., and 0.25 cc. of substrate. After shaking in a shaking machine at 25’ for a given length of time
4 (Y, r-IXbutyrin was prcparcd from 8-iodohydrin with butyryl-rhloride; WC Avcrill, Rochc, and King (1929).
by guest on August 11, 2018
http://ww
w.jbc.org/
Dow
nloaded from

214 Lipolytic Enzymes. I
(30 to 120 minutes with the exception of olive oil and tristearin which were run for 24 hours), the reaction was stopped by the addition of 100 cc. of ethyl alcohol, and the resultant solution was titrated with 0.2 N sodium hydroxide, 10 drops of 1 per cent thymolphthalein being used as indicator. The figures in Table I are extrapolated for 1 cc. of enzyme and 60 minutes duration of the reaction.
The measurements recorded in Table IV were carried out at room temperature (25-28’) by the method of Knaffl-Lenz (1923). 0.1 cc. of enzyme solution was added to 50 cc. of ester solution containing 4 drops of 0.04 per cent aqueous brom-thymol blue (Bamann and Schmeller, 1931). The pH was kept at 7.0 by add- ing dropwise 0.01 N sodium hydroxide to neutralize the acid liberated by the enzymatic hydrolysis as fast as it was formed. The effect of non-enzymatic hydrolysis, determined in parallel experiments, was found to be negligible. The number of drops (40 drops per 1 cc. with the special burette used throughout these determinations) required in each 5 minute interval was recorded.
Reaction curves obtained by this procedure are given in Fig. 1. The data on which the affinity calculations are based were obtained by the same method. v in Table IV represents the initial velocity as measured by the number of drops required for maintenance of constant pH during the first 10 minutes. v was constant over a prolonged period in the case of liver esterase, while it decreased rapidly for the ensuing period in the case of pancreas lipase. In some cases, with lower substrate concent,rat,ions, the number of drops during the first 5 minutes was doubled instead of using the number for the first 10 minutes because of the early retardat,ion.
Computation of Michaelis Constants-The Michaelis theory postulates that the velocities of hydrolysis at various substrate concentrations ml, m2 . . bear the same ratios as the vslues of the term m/(m + K,). This term represents the fraction p of the enzyme, combined with substrate, K, being the dissociation constant of this compound The relative velocities vl, v2 . . have to be multiplied by a characteristic factor c, in order to ob- tain the percentage of combined enzyme (loop observed). Values of K, and c are chosen to yield a p&activity curve on which the observed point,s could be fit,ted. In Icigs. 2 to 4 t)he curves arc constructed according t,o the culculatcd thcorctical values (loop
by guest on August 11, 2018
http://ww
w.jbc.org/
Dow
nloaded from

H. Sobotka and D. Glick 215
TABLE IV
Comparison of Enzymatic Hydrolysis ,with T/arious Substrate and Octyl Alcohol Concentrations. Computation OJ” Michaelis Constant
m = molarity of substrate, v = velocity (number of drops of 0.01 N in 10 minutes), j = concentration of octyl alcohol, c = factor for conversion of tr into loop, p = m/(m + K,), K, = Michaelis constant, A = 100~ observed minus 100~ calculated. Bold-faced figures in column “a” indicate accelera- tion by octanol.
Tributyrin and liver albumin, / = 0. c = 4.5, K, X 105 = 35
f = 1.6 X 10⁻⁵, c = 4.55, K. x lo6 = 20
/=6.8X10-5,c=4.2,K,X105= 28
f=25X10-5,c=g.3,~,XlO5= 15
Tributyrin and pancreas globulin / = 0, c = 2.6, K, x 10’ = 60
f = 1.6 X 1O-5, c = 3.65, K. X lo5 = 25
f = 6.8 X lo-&, c = 3.5, K, x 105 = 35
.f = 25 X lo-&, c = 4.9, K, X 106 = 30
t
,
n x 10’ v A Ob-
wved
2 8 36 36.5 -0.5 4 12 54 53.5 +0.5 8 15 67.5 69.5 -2
22 20 90 86.0 +4 2 11 50 50 0 4 14.6 65.5 66.5 -1 8 18 81.5 80 +1.5
22 20 91 91.5 -0.5 2 10 42 41.5 +0.5 4 14 59 59 0 8 18 75.5 74 +1.5
22 21 88 89 -1 2 6 56 57 -1 4 8 74.5 73 +1.5 8 9 84 ‘84 0
22 10 93 93.5 -0.5 2 10 26 25 +1 4 16 41.5 40 +1.5 8 23 60 57 +3
22 29 75.5 79 -3.5 2 12 44 44 0 4 17.6 64 62 +2 8 21 76.5 76 +0.5
22 24 88 90 -2 2 10 35 36.5 -1.5 4 16 56 53.5 +2.5 8 20 70 69.5 +0.5
22 24.5 86 86 0 2 8 39 40 -1 4 12 59 57 +2
22 18 88 88 0
--
by guest on August 11, 2018
http://ww
w.jbc.org/
Dow
nloaded from

216 Lipolytic Enzymes. I
TABLE IV-Continued T
Dibutyrin and liver albumin,j = 0, c = 1.43, K. X lo5 = 180
f = 1.6 X 10⁻⁵, c = 1.37, K, x 10” = 260
f = 6.8 X IO-&, c = 1.35, K. X lo6 = 450
f = 25 X 1O-6, c = 2.25, K, x lo6 =800
Dibutyrin and pancreas globulin, f = 0, and 1.6 X 10m5, c = 4.25, K,
x 106 = 1000 f = 6.8 X 10⁻⁵, c = 4.3, K, x lo6
= 1300
f = 25 X 1O-5, c = 5.1, K, X lo5 = 1400
Monobutyrin and liver albumin, f = 0, c = 2.2, K, X 10’ = 900
f = 1.6 X 10⁻⁵, c = 2.45, K, X lo5 =900
f = 6.8 X 1O-6, c = 2.3, K, X lo5 =22OO
f = 25 x 10-5, c = 4.0, I<, X 105 =4000
Monobutyrin and pancreas globu- lin, f = 0 and 1.6 X lo-&, c = 1.45, K, x 10’ = 7500
I n x 10 D
Ob- CSICU- served lated
A
18 35 50 50 0
180 64 91.5 91 +0.5 320 63 90 95 -5
18 30 41 41 0 180 64* 88 88 0 320 60 82 92.5 -10.5
18 21 28.5 28.5 0 180 59* 80 80 0
18 9 20 18.5 -1.5 36 13 29.5 31 +1.5
180 32 72 69.5 -2.5 36 6 26.5 26.5 -1
180 16 68 64 +4 320 17 72.5 76 -3.5
36 5 21.5 22 -0.5 180 14 60 58 +2 320 16 69 71 -2
36 4 20.5 20.5 0 180 11 56 56 0 100 24.5 54 52.5 +1.5 260 32 70.5 74 -3.5 520 40 88 85.5 $2.5 100 22 54 52.5 $1.5 260 28 68.5 74 -5.5 520 36.5 88.5 85.5 +3 100 13 30.5 31.5 -1 260 24 56 54 +2 520 30 70 70.5 -0.5 100 5 20 20 0 260 10 40 39.5 +0.5 520. 14 56 56.5 -0.5 750 16 64 65 -1 100 8 11.5 12 -0.5 260 17 25 25.5 -0.5 520 29 42 41 +1 750 35 51 50 +1
by guest on August 11, 2018
http://ww
w.jbc.org/
Dow
nloaded from

H. Sobotka and D. Glick 217
TABLE IV-Concluded
f = 6.8 X 10⁻⁵, c = 1.5, K, X IO5 = 6300
f = 25 X 10-5, c = 2.85, K, X IO& = 3500
Methyl butyrate and liver albumin, f = 0, c = 2.25, K, X lo5 = 200
f = 25 X 1O-6, c = 3.1, K, X lo6 = 700
I ,I x 10’ u
~-
100 8 260 16 520 32 750 33 100 8 260 15 520 21 750 24
1.75 11 17.5 20.5 45 30* 90 32
1.75 1 17.5 6 45 12.5* 90 20.5
-
-
Ob- srrved
12 24 48 49.5 23 43 60 68.5 24.5 46.5 67.5 72
3 18.5 39 57.5
CdCU- lsted
--
13.5 23 45 54.5 22 42.5 60 68
8 46.5 68 82
2.5 20 39 55.5
-
A
-1.5 -I-l +3 -5 +1 +0.5
0 +0.5
+16.5 0
-0.5 -10
+0.5 -1.5
0 +2
* Determinations used in examples on p. 218 for computation of the hlirhaelis constant of octyl alcohol.
calculated = m/(m + KJ), while the experiment,al points were plotted with the ordinates ZJ X c = 100~ observed. The values of the Michaelis constants K, obtained in this manner are listed in Table III. The maximum velocities for infinite substrate concen- tration, as given in the right half of Table III, were obtained by the following extrapolation.
(5) 01 :vz:...um::pl:pz:...l
Since u = loop/c, v, becomes 100/c. All values v, were then referred to v, of tributyrin = 1 for each enzyme.
The Michaelis constant of liver esterase for octyl alcohol was derived according to equation
(6) K, = f x IL
where v is inserted from Equation 4. B.8. for methyl butyrate (K, X lo5 = 200) in the concentra-
tion 45 X 10-4. ~0 was 30, v’ was 12.5 for octyl alcohol conccntra-
by guest on August 11, 2018
http://ww
w.jbc.org/
Dow
nloaded from

218 Lipolytic Enzymes. I
tion f = 25 X 10-5. K’, X lo6 was estimated at 25; thus V= 17.25 and K, X lo5 becomes 10.4, as
25 X 1O-6 x 0.0020
((30/17.25) - 1) x (0.0045 + 0.0020) = oB00104
For dibutyrin in the molar concentration 0.00180 (K, X 10” = 18), the experiment with 6.8 X 1O-5 octyl alcohol yields K, X lo5 = 7.3, since
6.8 X IO-” X 0.00018
(@A/59) - 1) x (0.00180 + 0.00018) = om0073
SUMMARY
The activity of liver and pancreas lipolyt.ic enzymes on a series of simple esters, diesters, and triglycerides was measured. The affinities and kinetics of both enzymes for tri-, di-, and monobuty- rin were determined. The relative theoretical maximum velocities of hydrolysis were calculated. The solubilities of the butyrins in enzyme solutions were measured and compared with their water solubilities. The influence of octyl alcohol on the speed of hydrolysis, and on the affinity of the above substrates for the enzyme was investigated.
Liver esterase and pancreatic lipase differ from each other (1) by their physiological function, (2) by the nature of the protein fract,ion in which they are found, (3) by their substrate specificity, (4) by the type of their kinetics, (5) by the difference of affinity for a given substrate, and (6) by the influence of a foreign substance on their action.
Liver esterase and pancreatic lipase, however, follow similar pH-activity curves (cf. following paper); some of the differences in specificity can be explained on the basis of differences in affinity which may vary because of factors associated with, but not identi- cal to the catalytically active groups. One such factor was shown to be the presence of a surface-active substance such as octyl alcohol. The accelerating and retarding action of octyl alcohol can be demonstrated for both enzymes by varying the concentra- tion of subst,rate and of octyl alcohol. The underlying mechanism of the effect of o&y1 alcohol can be symbolized by t,he following formulas. (ES) normal enzyme-substrate compound, Michaelis constant = I<,; (EF) enzyme-inhibitor compound, Michaelis
by guest on August 11, 2018
http://ww
w.jbc.org/
Dow
nloaded from

H. Sobotka and D. Glick 219
constant = I;/, reduction of available active enzyme groups, competitive inhibition; (ES)S second substrate molecule bound with lesser affinity, K’,, reducing rate of hydrolysis for first sub- strate molecule, inhibition by excess substrate; (ES)F non-com- petitive inhibition by foreign substance, attached to inactive por- tion of enzyme with affinity K',.
The existence of inactive areas on the enzyme gives a basis for the understanding of the differences in kinetics between pancreas and liver enzyme, indicates a correction of the Michaelis constant, offers an explanation of non-competitive and excess substrate inhibition, and makes clearer the mechanism of acceleration.
BIBLIOGRAPHY
Albers, H., Z. physiol. Chem., 218, 113 (1933). Averill, H. P., Roche, J. N., and King, C. G., J. Am. Chem. Sot., 61, 866
(1929). Bamann, E., and Laeverenz, P., Ber. them. Ges., 64, 897 (1931). Bamann, E., and Schmeller, M., 2. physiol. Chem., 188, 149 (1929); 194, 1
(1931). Christman, A. A., and Lewis, H. B., J. Biol. Chem., 47, 495 (1921). Falk, K. G., J. Biol. Chem., 96, 53 (1932). Glick, D., and King, C. G., J. Biol. Chem., 97,675 (1932); J. Am. Chem. SOL,
66, 2445 (1932-33). Haldane, J. B. S., Enzymes, New York and London, 46 (1930). Hyde, E. C., and Lewis, H. B., J. Biol. Chem., 66, 7 (1923). Knaffl-Lenz, E., Arch. Exp. Path. u. Pharmakol., 97, 242 (1923). Kuhn, R., 2. physiol. Chem., 126, 1 (1923). Loevenhart, A. S., and Peirce, G., J. Biol. Chem., 2, 397 (1906-07). Michaelis, L., and Menten, M. L., Biochem. Z., 49, 333 (1913). Murray, D. R. P., Biochem. J., 23, 292 (1929); 24, 1890 (1930). Schwab, G. M., Bamann, E., and Laeverenz, P., 2. physiol. Chem., 216, 121
(1933). Sobotka, H., and Glick, D., J. Biol. Chem., 106,221 (1934). Sobotka, H., and Kahn, J., J. Am. Chem. Sot., 63,2935 (1931). Virtanen, A. I., and Suomalainen, P., 2. physiol. Chem., 219, 1 (1933). Waldschmidt-Leitz, E., Enzyme actions and properties, New York, 40
(1929). Willstatter, R., Chem. Rev., 13, 501 (1933). Willstatter, R., Haurowitz, F., and Memmen, F., 2. physiol. Chem., 140,
203 (1924). Willstatter, R., and Kuhn, R., Ber. them. Ges., 66, 509 (1923). Willstatter, R., Kuhn, R., and Sobotka, H., 2. physiol. Chem., 129, 33
(1923); 134, 224 (1924). Willstatter, R., and Memmen, F., 2. physiol. Chem., 133, 229 (1924).
by guest on August 11, 2018
http://ww
w.jbc.org/
Dow
nloaded from

Harry Sobotka and David GlickENZYME ACTIONS
THE MECHANISM OF LIPOLYTIC LIPOLYTIC ENZYMES: I. STUDIES ON
1934, 105:199-219.J. Biol. Chem.
http://www.jbc.org/content/105/1/199.citation
Access the most updated version of this article at
Alerts:
When a correction for this article is posted•
When this article is cited•
alerts to choose from all of JBC's e-mailClick here
tml#ref-list-1
http://www.jbc.org/content/105/1/199.citation.full.haccessed free atThis article cites 0 references, 0 of which can be
by guest on August 11, 2018
http://ww
w.jbc.org/
Dow
nloaded from