Linyphiid spider populations in sustainable wheat-clover...
12
Linyphiid spider populations in sustainable wheat-clover bi-cropping compared to conventional wheat-growing practice E. Gravesen VGT, 6880 Tarm, Denmark Introduction The presence of mulch in cereal crops (Schmidt et al. 2004) as well as the integration of non-crop, perennial habitats in crop fields seem to be optimal choices when the intention is to increase the spider population density in cereal fields (Sunderland and Samu 2000), and Schmidt et al. (2004) showed that enhanced densities of spiders in mulched plots pre- sumably resulted in a 25% reduction in the aphid densities in June, and their results indicate that a scarcity of ground-dwelling predators and bare soil surface renders crops more susceptible to arthropod pests, particularly aphids. Growing wheat in leguminous living mulch (bi-cropping) such as white clover, therefore, seems to be a promising alternative to conventional wheat- growing practice with ploughing every year, which results in bare soil surfaces between the crop plants during the growing season. In this experiment, win- ter wheat was grown in a permanent vegetation layer consisting of white clover. The purpose of growing wheat in living mulch such as white clover is to reduce the use of fossil fuel energy for tillage and other agricultural operations as well as reducing the consumption of fertilizers. The goal is to mini- mize, or completely avoid, the use of pesticides while preventing losses of nutrients and increasing soil biological activity. This increases the diversity of the sward (Harwood and Obrycki 2005). Alderweireldt (1994) has shown that increasing the diversity of Belgian crop fields increased spider densities. More specifically, Bathyphantes gracilis Blackwall 1841 and Tenuiphantes Keywords Isotoma anglicana, agrobiont spiders, non- crop habitat, path diagram, reproduction Correspondence Ejgil Gravesen (corresponding author), VGT, 6880 Tarm, Denmark. E-mail: [email protected] Received: December 3, 2007; accepted: May 5, 2008. doi: 10.1111/j.1439-0418.2008.01303.x Abstract Linyphiid web densities in wheat-clover bi-crop systems where winter wheat was grown in an under-storey of white clover were compared with web densities estimated in conventional wheat-growing systems. The web densities in the wheat-clover bi-crop systems were on average between 200 and 250 webs per square-metre when the densities peaked, while the estimated average web density peak levels under con- ventional growing practices were 100–150 webs per square-metre. Repeated Measure anova tests show significant differences between the estimated mean web density levels of the bi-crop systems compared to the mean density levels of the conventional growing systems in two consecutive growing seasons. Particularly, Bathyphantes gracilis and Tenui- phantes tenuis took advantage of the more heterogeneous conditions with high secondary vegetation layer density and high food animal supply in the bi-crop plots compared to the more homogeneous conditions under conventional wheat-growing practices with low food animal supply. Structural equation modelling with a data set pooled from four different wheat-growing practices shows that the linyphiid juvenile production is influenced by the number of collembolans accessible as food animals for the adult females. The modelling demonstrates the importance of the detritus food chain, particularly for the juvenile recruitment. J. Appl. Entomol. J. Appl. Entomol. 132 (2008) 545–556 ª 2008 The Author Journal compilation ª 2008 Blackwell Verlag, Berlin 545
-
Upload
trinhnguyet -
Category
Documents
-
view
214 -
download
0
Transcript of Linyphiid spider populations in sustainable wheat-clover...

Linyphiid spider populations in sustainable wheat-cloverbi-cropping compared to conventional wheat-growing practiceE. Gravesen
VGT, 6880 Tarm, Denmark
Introduction
The presence of mulch in cereal crops (Schmidt
et al. 2004) as well as the integration of non-crop,
perennial habitats in crop fields seem to be optimal
choices when the intention is to increase the spider
population density in cereal fields (Sunderland and
Samu 2000), and Schmidt et al. (2004) showed that
enhanced densities of spiders in mulched plots pre-
sumably resulted in a 25% reduction in the aphid
densities in June, and their results indicate that a
scarcity of ground-dwelling predators and bare soil
surface renders crops more susceptible to arthropod
pests, particularly aphids.
Growing wheat in leguminous living mulch
(bi-cropping) such as white clover, therefore, seems
to be a promising alternative to conventional wheat-
growing practice with ploughing every year, which
results in bare soil surfaces between the crop plants
during the growing season. In this experiment, win-
ter wheat was grown in a permanent vegetation
layer consisting of white clover. The purpose of
growing wheat in living mulch such as white clover
is to reduce the use of fossil fuel energy for tillage
and other agricultural operations as well as reducing
the consumption of fertilizers. The goal is to mini-
mize, or completely avoid, the use of pesticides
while preventing losses of nutrients and increasing
soil biological activity.
This increases the diversity of the sward (Harwood
and Obrycki 2005). Alderweireldt (1994) has
shown that increasing the diversity of Belgian crop
fields increased spider densities. More specifically,
Bathyphantes gracilis Blackwall 1841 and Tenuiphantes
Keywords
Isotoma anglicana, agrobiont spiders, non-
crop habitat, path diagram, reproduction
Correspondence
Ejgil Gravesen (corresponding author), VGT,
6880 Tarm, Denmark.
E-mail: [email protected]
Received: December 3, 2007; accepted: May
5, 2008.
doi: 10.1111/j.1439-0418.2008.01303.x
Abstract
Linyphiid web densities in wheat-clover bi-crop systems where winter
wheat was grown in an under-storey of white clover were compared
with web densities estimated in conventional wheat-growing systems.
The web densities in the wheat-clover bi-crop systems were on average
between 200 and 250 webs per square-metre when the densities
peaked, while the estimated average web density peak levels under con-
ventional growing practices were 100–150 webs per square-metre.
Repeated Measure anova tests show significant differences between the
estimated mean web density levels of the bi-crop systems compared to
the mean density levels of the conventional growing systems in two
consecutive growing seasons. Particularly, Bathyphantes gracilis and Tenui-
phantes tenuis took advantage of the more heterogeneous conditions with
high secondary vegetation layer density and high food animal supply in
the bi-crop plots compared to the more homogeneous conditions under
conventional wheat-growing practices with low food animal supply.
Structural equation modelling with a data set pooled from four different
wheat-growing practices shows that the linyphiid juvenile production is
influenced by the number of collembolans accessible as food animals for
the adult females. The modelling demonstrates the importance of the
detritus food chain, particularly for the juvenile recruitment.
J. Appl. Entomol.
J. Appl. Entomol. 132 (2008) 545–556 ª 2008 The Author
Journal compilation ª 2008 Blackwell Verlag, Berlin 545

tenuis Blackwall 1852 (formerly Lepthyphantes tenuis)
took advantage of habitat manipulation, where the
soil surface was made more heterogeneous.
Increasing the abundance of under-storey vegeta-
tion – particularly clover mulch – seems to
increase both density and numbers of linyphiid
spider species within different farming systems
(Altieri et al. 1985; Feber et al. 1998).
Research using isotope analysis suggests that the
detritivores represent a key food resource for lin-
yphiid spiders (McNabb et al. 2001; Wise et al.
2006), and Marcussen et al. (1999) concluded that a
high abundance of the Collembola species Isotoma
anglicana Fjellberg 1980 can support a high repro-
ductive output for Erigone atra Blackwall 1841. This
puts a focus on the link between collembolans and
the detritus food chain in cereal fields. Input of
organic material to the soil surface as well as under
sown clover grass may increase the densities of
collembolans (Axelsen and Kristensen 2000).
This supports the idea that bi-cropping with a per-
manent, secondary vegetation layer consisting of
white clover may enhance the organic matter con-
tent in the topsoil, which may have a beneficial
impact on the Collembola density at the soil surface.
Moreover, enhanced Collembola densities may
further support higher reproductive outputs of the
agrobiont linyphiid spiders in the cereal fields.
To get a better understanding of the relationships
between the different factors involved in the popula-
tion dynamics of agrobiont linyphiid spiders, the
multivariate statistic analysis procedure called struc-
tural equation modelling (Arbuckle and Wothke
1999; Shipley 2000) was used in this study for
exploratory purposes. Structural equation modelling
(SEM) is a powerful statistical technique that is used
to estimate, analyse and test models that specify
relationships among variables. The view of SEM was
first articulated by the geneticist Wright (1921), but
the statistical method was largely ignored by the
biology community up through the twentieth cen-
tury (Shipley 2000).
The SEM procedure usually starts with a hypo-
thesis considering the relationships between the
involved variables. In this study, exploratory model-
ling is specified on the basis of theory, which is
supported by information from the available litera-
ture. Supported by this information, a model is built
on the basis of hypothesized relationships among the
sampled variables. The relationships between five
variables are analysed and a model is tested by using
the statistical programme amos (Analysis of Moment
Structures; Arbuckle and Wothke 1999).
Methods
Site
Field research was carried out at the agricultural
Research Centre Foulum (9�34¢E, 56�30¢N), approxi-
mately 10 km east of Viborg, Denmark. The soil type
in the experimental area at Research Centre Foulum
is a sandy soil with 8% clay. The experimental area
was surrounded by areas of permanent white clover
(cv. Donna) vegetation, sown simultaneously with
the white clover (cv. Donna) in the experimental
wheat-clover bi-crop plots. The establishment of the
white clover was performed in the spring of 1994.
The first winter wheat crop (cv. Hereward) was
established in September 1994, the second winter
wheat crop in September 1995 and the third winter
wheat crop in September 1996.
The winter wheat in the bi-crop plots was directly
drilled into a defoliated white clover sward using a
combined cultivator and sowing machine (Hunter
Rotary Strip Seeder, Hunters Machinery, Tarporley,
Cheshire, UK) that drilled 7.5 cm wide slots in the
clover sward with a drilling distance of 23 cm
between each wheat row. This left some dead plant
material and just a short clover layer when the new
wheat crop was established. Establishment of the
winter wheat crop in the conventionally grown plots
was done by sowing the wheat into a conventionally
ploughed seedbed with a row distance of 23 cm.
Experimental design
Field research was carried out in May–October 1995
as well as June–September 1996 and in July 1997 in
16 experimental plots (each 12 · 50 m), representing
four different growing systems. The experimental
plots were located in a randomized complete block
design with the four agricultural treatments repli-
cated four times. Web distance measuring to estimate
the linyphiid web densities as well as other sampling
procedures was done inside a 10 · 10 m quadratic
area in the middle of each of the experimental plots.
The four agricultural treatments were either wheat-
clover bi-cropping – BU without nitrogen fertilization
and BL with nitrogen fertilization (50 kg/ha) – or con-
ventional wheat-growing – CL with low nitrogen
(50 kg/ha) and CH with high nitrogen (160 kg/ha)
input. The BU, BL and CL plots did not receive any
pesticide treatment, whereas the CH plots received
‘normal’ pesticide treatment that is common in inten-
sively grown Danish winter wheat fields: Bentazon
1200 g active ingredient (AI) per hectare (Basagran
Linyphiid spider populations in sustainable wheat-clover bi-cropping E. Gravesen
546J. Appl. Entomol. 132 (2008) 545–556 ª 2008 The Author
Journal compilation ª 2008 Blackwell Verlag, Berlin
480, BASF, Ludwigshafen, Germany) herbicide to
control dicotyledons in the spring of 1995, 1996 and
1997; propiconazol 90 g AI/ha + fenpropimorph
210 g AI/ha (Tilt Megaturbo, Syngenta, Basel,
Switzerland) fungicide to control fungi in the wheat
crop in June 1995, propiconazol 90 g AI/ha + fen-
propimorph 260 g AI/ha (Tilt Top, Syngenta, Basel,
Switzerland) fungicide to control fungi in the wheat
crop in June 1996 and prochloraz 450 g AI/ha (Spor-
tak, BASF, Ludwigshafen, Germany) fungicide to
control fungi in the wheat crop in late May 1997;
pirimicarb 125 g AI/ha (Pirimor, Syngenta, Basel,
Switzerland) insecticide to control aphids in July 1995;
and glyphosate 900 g AI/ha (RoundupBio, Monsanto,
St Louis, MO, USA) herbicide to control grass weeds
before harvest in August in both 1995 and 1996.
Sampling procedure
In our use of the web distance measuring procedure,
we followed the sampling procedure given by Toft
et al. (1995). A bamboo stick was placed at a ran-
dom point (sampling point) within the experimental
plot. To make the webs more easily observable, the
area around the sampling point was sprayed with
white talcum powder. The area was then searched
for webs, which were marked one by one with thin
metal marker sticks. The metal sticks were placed in
the centre of each web, and the distances from
the sampling point to each of the metal sticks were
measured. The distances to 10 web centres were
measured, and the web density was estimated on
basis of the distance from the sampling point to the
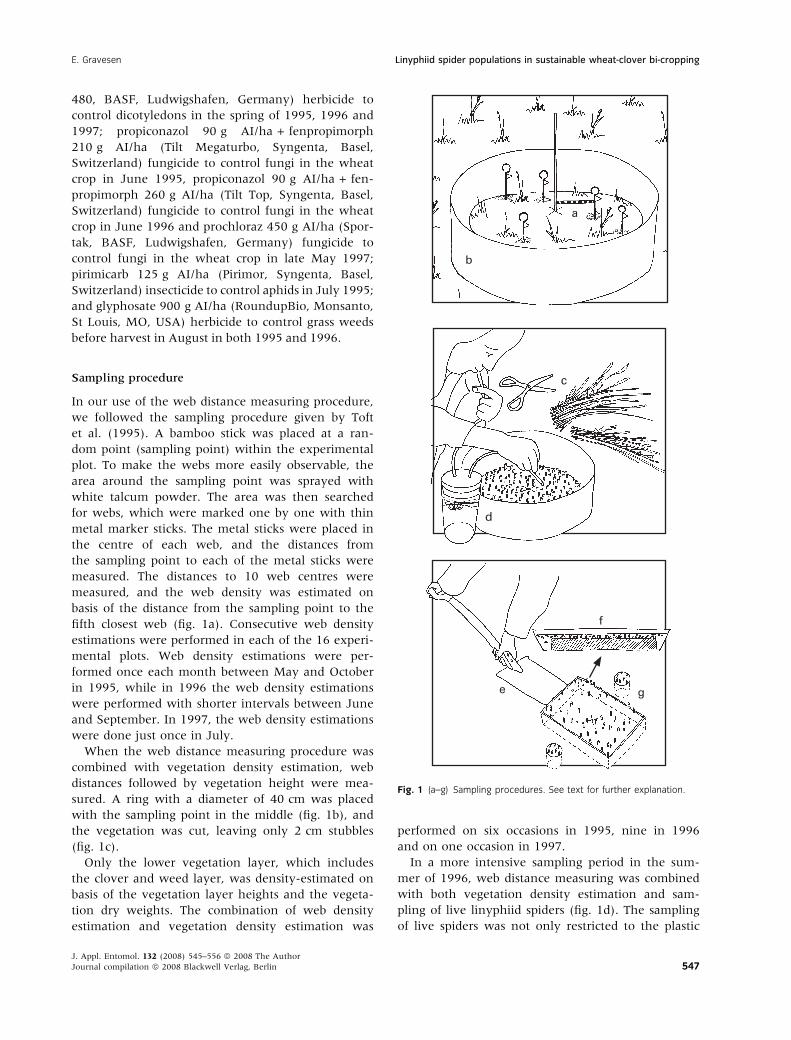
fifth closest web (fig. 1a). Consecutive web density
estimations were performed in each of the 16 experi-
mental plots. Web density estimations were per-
formed once each month between May and October
in 1995, while in 1996 the web density estimations
were performed with shorter intervals between June
and September. In 1997, the web density estimations
were done just once in July.
When the web distance measuring procedure was
combined with vegetation density estimation, web
distances followed by vegetation height were mea-
sured. A ring with a diameter of 40 cm was placed
with the sampling point in the middle (fig. 1b), and
the vegetation was cut, leaving only 2 cm stubbles
(fig. 1c).
Only the lower vegetation layer, which includes
the clover and weed layer, was density-estimated on
basis of the vegetation layer heights and the vegeta-
tion dry weights. The combination of web density
estimation and vegetation density estimation was
performed on six occasions in 1995, nine in 1996
and on one occasion in 1997.
In a more intensive sampling period in the sum-
mer of 1996, web distance measuring was combined
with both vegetation density estimation and sam-
pling of live linyphiid spiders (fig. 1d). The sampling
of live spiders was not only restricted to the plastic
Fig. 1 (a–g) Sampling procedures. See text for further explanation.
E. Gravesen Linyphiid spider populations in sustainable wheat-clover bi-cropping
J. Appl. Entomol. 132 (2008) 545–556 ª 2008 The Author
Journal compilation ª 2008 Blackwell Verlag, Berlin 547
ring but was also extended to an enlarged area
around the ring. To prevent the spiders from escap-
ing, a plastic barrier was placed around the enlarged
area. The vegetation inside the ring was cut and
used for the vegetation density estimation. The vege-
tation in the enlarged area was also cut, and all har-
vested vegetation as well as bare soil was searched
for live spiders, which were sampled with a pooter.
The area inside the plastic ring plus the enlarged
area around the ring, enclosed by the plastic barrier,
had a total area of 0.48 m2.
In the intensive sampling period, soil surface sam-
ples for collembolans as well as soil samples for soil
water and organic matter contents were taken on
both sides (north–south) of the sampling point. The
soil surface sampling for collembolans was done by
shovelling the soil surface to a depth of 1 cm inside
an iron frame measuring 10 · 20 cm (fig. 1e), and
soil with collembolans was afterwards kept in alco-
hol (concentration 40%) (fig. 1f). Soil samples for
measuring soil water and organic matter content
were finally taken with a cylindrical soil sampler
(diameter 5 cm) to a depth of 5 cm in the topsoil
(fig. 1g).
All the coordinated sampling procedures (in the
intensive sampling period) were completed within
1 h at each experimental plot, thereby ensuring con-
sistency for comparative purposes. Sampling was
done between 10 am and 4 pm. The sampling in
each experimental plot was performed with a new
sampling point at least 1.5 m from former sampling
points to ensure optimum independence of former
samplings. Consecutive samplings in the 16 experi-
mental plots were performed within 1 day – always
starting at the northern end of the row of experi-
mental plots and finishing at the southern end of
the row. All sampling procedures in the intensive
sampling period were performed consecutively
through all 16 experimental plots at seven occasions
within 8 weeks starting in week 25 in June 1996
and ending in week 32 in August 1996.
Sample Analysis
Webs
The web density estimation requires the webs to
have a random dispersion pattern. The dispersion
pattern was tested using Eberhardt’s index for point-
to-nearest web distances: IE = (s/avg)2 + 1, where s
is the standard deviation and avg is the average of
the distances from the sampling point to the nearest
web (Krebs 1989). The expected value of IE in a
random population is 1.27. Values below this suggest
a regular pattern, and larger values indicate clump-
ing. See also critical values for Hines Test Statistics
hT (Krebs 1989).
On basis of point-to-nearest web distance mea-
surements in a period from May 1995 till September
1996, calculated values of the Eberhardt’s index
indicate random dispersal of linyphiid webs on 13
out of 14 sampling dates in the bi-crop plots and on
11 out of 14 sampling dates in the conventional
plots. The index values were calculated on the basis
of pooled data sets for both the bi-crop systems and
the conventional systems together. In June 1995,
the web dispersal pattern in the bi-crop plots as well
as in the conventional plots indicated a clumped dis-
persal pattern. In the conventional plots, the Eber-
hardt’s index values indicate uniform dispersal on
two dates – in August 1995 as well as in July 1996.
In general, the assumption of random distribution
seems fulfilled, and therefore the density estimation
formula can be applied.
The web density is estimated on the basis of a dis-
tance method where the distance from a randomly
selected point to the nth nearest individual has been
measured (Keuls et al. 1963; Southwood and Hen-
derson 2000). As Toft et al. (1995) showed, there is
little to be gained by extending the observations past
the fifth web. We used the distance to the fifth clos-
est web from the randomly placed sampling point
and then estimated the web density by a formula
provided by Keuls et al. (1963): the estimate of the
density N4 = (q-1)/prq2. In this study, N4 = 4/prq2,
when q = 5 and r is the distance to the fifth closest
web.
Spiders caught alive
All spiders caught alive were kept in individual plas-
tic containers for 1 week, each with a code number
used to identify the adult spiders as to species. If the
spiders produced cocoons, the containers were kept
until juveniles hatched. The juveniles were counted,
and on basis of this procedure it was possible to esti-
mate the absolute juvenile production per square-
metre on the basis of the counts and the area of the
enclosure where the adults were caught (Sunderland
and Topping 1995).
During the intensive sampling period in the sum-
mer of 1996, the total linyphiid juvenile production
was estimated for each sampling occasion, and the
values were used in the multivariate statistic analysis
and data sets of total numbers of adult spiders
caught in each of the 16 experimental plots were
Linyphiid spider populations in sustainable wheat-clover bi-cropping E. Gravesen
548J. Appl. Entomol. 132 (2008) 545–556 ª 2008 The Author
Journal compilation ª 2008 Blackwell Verlag, Berlin

constructed for B. gracilis and T. tenuis, and were
used in the variance analysis in relation to the four
different agricultural practices.
Vegetation
The secondary vegetation layer, consisting of clover
and weed plants, was density-estimated on the basis
of the height of the secondary vegetation layer and
the vegetation dry weight. The dry vegetation was
weighed after it was dried out to a constant weight
in an oven for at least 24 h.
The secondary vegetation layer densities were esti-
mated on the basis of sampling done at seven dates
during the intensive sampling period in the summer
of 1996. On basis of the samplings in each of the 16
experimental plots, the average secondary vegetation
layer density for each plot was calculated. The data
set with the 16 average values of secondary vegeta-
tion layer densities was used to compare the mean
secondary vegetation layer densities in relation to
the four different growing practices.
The total lower vegetation layer density was esti-
mated on the basis of the secondary vegetation layer
density plus the wheat crop density. The wheat crop
was density-estimated on the basis of that part of
the wheat plants present in the secondary vegetation
layer. The wheat crop density was estimated in a
similar way as the secondary vegetation layer den-
sity. The total lower vegetation layer density estima-
tions were used in the correlation test as well as in
the multivariate statistic analysis.
Collembola
Collembolans in soil samples with alcohol were sepa-
rated from the soil using glycerine to drive out the
animals from soil pores, and the collembolans were
roughly identified and counted. On the basis of the
sampling procedure using an iron frame with an
area of 200 cm2, it was possible to estimate the Col-
lembola density in the soil surface.
The Collembola densities in the soil surface were
estimated on the basis of sampling done at seven
dates during the intensive sampling period in the
summer of 1996. On the basis of the samplings in
each of the 16 experimental plots, the average Col-
lembola density during the intensive sampling period
was calculated for each plot. The data set with the
16 mean values of Collembola densities were used to
compare the mean Collembola densities in relation
to the four different growing practices, and the esti-
mated Collembola density values of each sampling
occasion were used in the multivariate statistic anal-
ysis.
Soil
The soil water content was calculated by first mea-
suring the fresh weight of the soil samples, after
which the soil samples were dried out to a constant
weight at 105�C for 2–3 days. On the basis of the
difference between the fresh weight and the dry
weight divided by the fresh weight, it was possible
to calculate the percentage content of soil water in
the upper 5 cm of the topsoil (Schierup and Jensen
1981).
Soil samples dried out to a constant weight were
burned in an oven at 550–600�C for 6–8 h. The per-
centage content of organic matter in the topsoil was
then calculated in a similar way as with the soil
water content by calculating the dry weight of the
soil samples minus the burned weight divided by the
dry weight. Calculated organic matter and soil water
content were used to compare mean organic matter
as well as mean soil water content in relation to the
different growing practices. The calculated organic
matter and soil water content values of each
sampling occasion were also used in the multivariate
statistic analysis.
Arthropod identification
Spiders were identified in agreement with Roberts
(1987), and collembolans were identified in agree-
ment with Fjellberg (1980).
Statistical Analysis
Transformations
On the basis of normality tests with raw variables, the
estimated vegetation densities used in the correlation
test as well as the numbers of adult linyphiid spiders
used in the variance test were left as untransformed
data sets while other data sets were transformed
before the statistical analysis. The estimated web den-
sities, numbers of Collembola in the soil surface and
numbers of produced juveniles were log-transformed.
The percentages of soil water and organic matter con-
tent were arcsine-transformed, and the estimated
vegetation densities used in the multivariate statistic
analysis were transformed as reciprocal transforma-
tions. The results of these transformations are data
sets approximately normally distributed and with
equal variances between treatments.
E. Gravesen Linyphiid spider populations in sustainable wheat-clover bi-cropping
J. Appl. Entomol. 132 (2008) 545–556 ª 2008 The Author
Journal compilation ª 2008 Blackwell Verlag, Berlin 549
Finally, the multivariate data set used in the SEM
was evaluated using a multivariate normality test,
which shows a multivariate kurtosis value of 1.58
(Mardia’s coefficient). Values of 1.96 or less mean
there is non-significant kurtosis. Values >1.96 mean
there is significant kurtosis, which means significant
non-normality.
Repeated Measure anova
Repeated Measure anova was performed using the
Mixed Procedure (PROC MIXED) in sas/stat�.
Because of asymmetric development of the linyphiid
web densities estimated during the growing seasons
of 1995 as well as 1996, the data exploring proce-
dure revealed that third-degree polynomial models
best explained the data sets.
Correlations
The correlations between the estimated vegetation
densities and the estimated web densities were tested
in relation to the four different growing practices
using the Pearson’s correlation test. Performing a
general linear modelling test by the use of jmp�
(SAS Institute, NC, USA, 1989–2007) showed no
interaction between vegetation density and growing
practice, which means that the relationship between
the estimated vegetation density and the estimated
web density is independent of the growing practice.
This allows for the pooling of the data from all four
different growing practices in a single correlation
test.
Structural equation modelling
The relationships between the estimated linyphiid
juvenile production, Collembola density in the soil
surface, total lower vegetation layer density as well
as organic matter and soil water content in the top-
soil were analysed using SEM on the basis of a
pooled data set from all four different growing sys-
tems. The analysis procedure – by choosing the best
significant model – follows the guidelines for the sta-
tistical programme amos 4.0 given by Arbuckle and
Wothke (1999).
In the SEM analysis procedure, the model was
improved by decreasing the Chi-squared statistic fas-
ter than the degrees of freedom. In trying to improve
upon a model, we were aware that a modification
must only be considered if it makes theoretical or
common sense. In contrast to most other statistical
tests, the null hypothesis, not the alternative, is the
biologically interesting hypothesis, and a probability
below the chosen significant level means that the
predicted model is wrong and should be rejected
(i.e. the null hypothesis should be rejected).
The path coefficients in path analysis are partial
regression coefficients, which measure the extent of
effect of one variable on another in the path model
and are defined as the strength of the relationship.
In Amos, the path coefficients are labelled regres-
sion weights. Based on the analysis, the standard-
ized regression weights are shown in the path
diagram. The model is identified by fixing the path
coefficient between each variable and a latent vari-
able to unity, which means a regression weight of
one.
Results
Linyphiid webs
The web densities in the wheat-clover bi-crop sys-
tems were on average between 200 and 250 webs
per square-metre when the densities peaked in 1995
and in 1996, while the estimated average web den-
sity peak levels under conventional growing practice
with a high input of fertilizers and pesticides (CH)
were 100–150 webs per square-metre in both years.
In the low-level fertilized conventional growing sys-
tem with no use of pesticides (CL), the estimated
web densities showed peak levels between 150 and
200 webs per square-metre (fig. 2).
The Tukey–Kramer multiple comparisons test per-
formed with the data set for the growing season of
1995 showed that the mean web density level of the
unfertilized, bi-crop system (BU) was significantly
higher (P < 0.0001) than the mean web density level
of the high-input, conventional growing system
(CH) as well as significantly higher (P < 0.001) than
the mean web density level of the low-input, con-
ventional growing system (CL). Moreover, the mean
web density of the low-level fertilized, bi-crop
system (BL) was significantly higher (P < 0.0001)
than the mean web density level of the high-input,
conventional growing system (CH) as well as signi-
ficantly higher (P < 0.05) than the mean web
density level of the low-input, conventional growing
system (CL). The number of Repeated Measure
observations in 1995 was 88.
The Tukey–Kramer multiple comparisons test per-
formed with the data set for the growing season of
1996 showed that the mean web density level of the
unfertilized, bi-crop system (BU) was significantly
higher (P < 0.0001) than the mean web density level
Linyphiid spider populations in sustainable wheat-clover bi-cropping E. Gravesen
550J. Appl. Entomol. 132 (2008) 545–556 ª 2008 The Author
Journal compilation ª 2008 Blackwell Verlag, Berlin

of the high-input, conventional growing system
(CH) as well as significantly higher (P < 0.001) than
the mean web density level of the conventional,
low-input growing system (CL). Moreover, the mean
web density of the low-level fertilized, bi-crop sys-
tem (BL) was significantly higher (P < 0.05) than
the mean web density level of the conventional,
high-input growing system (CH). The number of
Repeated Measure observations in 1996 was 288.
Linyphiid adults
One-way anova tests showed significant differences
in the mean numbers of adult B. gracilis
(F3,12 = 8.64; P < 0.01; n = 16) and T. tenuis
(F3,12 = 8.82; P < 0.01; n = 16) caught in relation to
the four different agricultural practices. The Bonfer-
roni test showed that significantly (P < 0.01) more
adults of B. gracilis were found in both bi-crop
systems compared with the high-input, conventional
growing system (CH), and significantly (P < 0.01)
more adults of T. tenuis were caught in the
low-input, bi-crop system (BL) compared with the
averages caught in both conventional growing
systems (fig. 3).
Vegetation
The mean secondary vegetation layer densities were
significantly different between the four different
growing systems (one-way anova; F3,12 = 34.61;
P < 0.001; n = 16). The Bonferroni test showed that
the mean secondary vegetation density levels of both
bi-crop systems were significant higher (P < 0.001)
than the mean density level in the high-input,
conventional growing system (CH). The mean
density level in the unfertilized, bi-crop system (BU)
was also significantly higher (P < 0.01) than the
mean secondary vegetation density level of the con-
ventional, low-input growing system (CL) (fig. 4).
Positive correlations were found between the
estimated web densities and the total vegetation
densities of the lower vegetation layer for all four
wheat-growing systems using the Pearson’s correla-
tion test on the basis of the coordinated samplings
done in 1995, 1996 and 1997; BU: r = 0.452,
P < 0.001, n = 59; BL: r = 0.333, P < 0.05, n = 59;
CL: r = 0.489, P < 0.001, n = 59; CH: r = 0.513,
P < 0.001, n = 58. The correlation between the
estimated web densities in relation to the total lower
vegetation layer densities on the basis of a pooled
data set representing all four different growing
systems was also positive (r = 0.468; P < 0.001;
n = 235).
Collembola
The majority of the identified collembolans
belong to the species Isotoma anglicana Lubbock 1862
(Fjellberg 1980). The mean Collembola densities in
the soil surface were significantly different between
the four different growing systems (one-way anova;
F3,12 = 18.60; P < 0.001; n = 16). The Bonferroni test
showed that the mean Collembola density in the
low-level fertilized, bi-crop system (BL) was signifi-
cantly higher (P < 0.001) than the mean density
level in the high-input, conventional growing system
(CH), and the mean density in the unfertilized,
bi-crop system (BU) as well as the mean density in
the low-level fertilized, conventional growing system
Fig. 2 Mean estimated web densities in the two sampling periods, May–October 1995 and June–September 1996 for the four different growing
practices; ‘Sowing’: Wheat establishing operations in September 1995; ‘Harvest’: Harvesting operations 17 August 1995 and 23 August 23 1996; F:
Fungicide treatments 27 June 1995 and 25 June 1996; H: Herbicide treatments in spring both years as well as before harvest in both 1995 and
1996; I: Insecticide treatment 14 July 1995.
E. Gravesen Linyphiid spider populations in sustainable wheat-clover bi-cropping
J. Appl. Entomol. 132 (2008) 545–556 ª 2008 The Author
Journal compilation ª 2008 Blackwell Verlag, Berlin 551

(CL) was also significantly higher (P < 0.01) than
the mean Collembola density in the high-input, con-
ventional growing system (CH) (fig. 5).
Organic matter and soil water
Both mean values of organic matter content and soil
water content in the topsoil were significantly differ-
ent between the four different growing practices.
One-way anova showed a significant difference
between the mean values of the organic matter con-
tent (F3,12 = 58.45; P < 0.001; n = 16) as well as a
significant difference between the mean values of
the soil water content (F3,12 = 11.52; P < 0.01;
n = 16) in the topsoil in relation to the different
growing practices (fig. 5).
The Bonferroni tests showed significantly higher
average organic matter content and soil water con-
tent in the topsoil with the bi-crop systems
compared with the conventional growing systems.
The Bonferroni test showed that the mean organic
matter content in the experimental plots of both bi-
crop systems were significantly higher (P < 0.001)
compared with the mean organic matter content in
the experimental plots of both conventional growing
systems. The Bonferroni test also showed signifi-
cantly higher (P < 0.01) mean soil water content
in the experimental plots of both bi-crop systems
Fig. 3 Estimated mean (mean � SE) adult densities of Bathyphantes
gracilis and Tenuiphantes tenuis in relation to the four different grow-
ing practices. Horizontal bars show significant differences between the
mean adult densities in relation to the four different growing prac-
tices; *P < 0.05; **P < 0.01; ***P < 0.001.
Fig. 4 Estimated mean (mean � SE) secondary vegetation density as
gram dry weight per cubic decimetre in relation to the four different
growing practices. Horizontal bars show significant differences
between the mean secondary vegetation densities in relation to the
four different growing practices; *P < 0.05; **P < 0.01; ***P < 0.001.
Linyphiid spider populations in sustainable wheat-clover bi-cropping E. Gravesen
552J. Appl. Entomol. 132 (2008) 545–556 ª 2008 The Author
Journal compilation ª 2008 Blackwell Verlag, Berlin
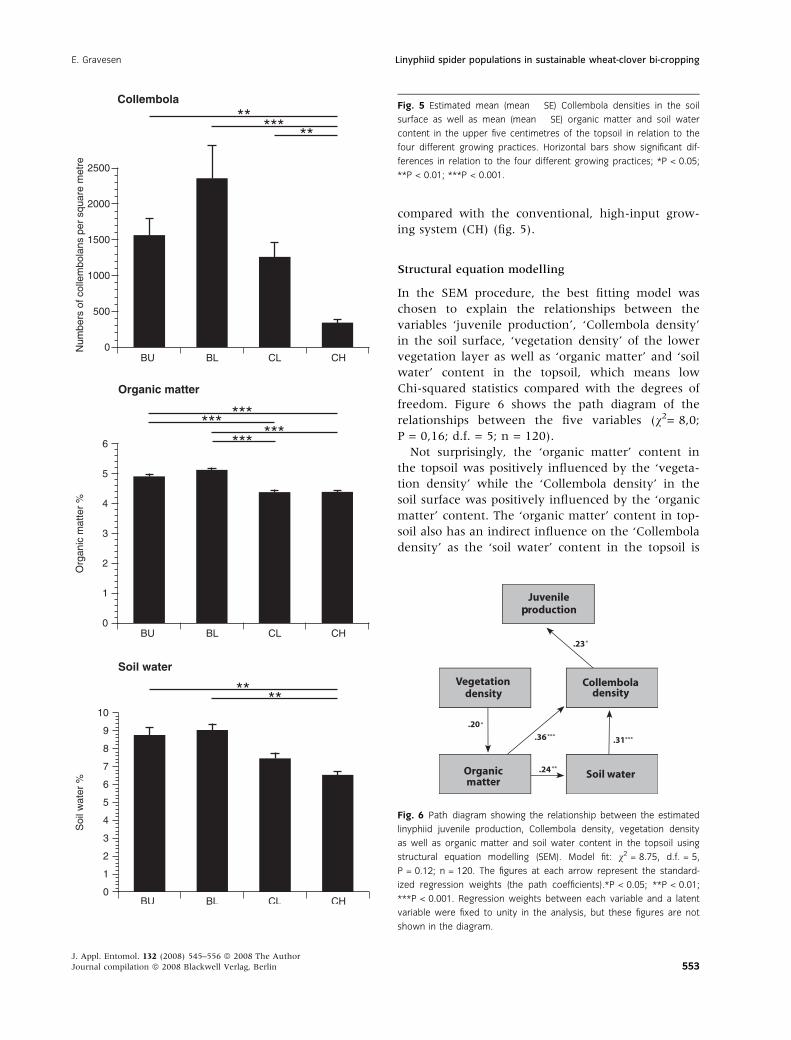
compared with the conventional, high-input grow-
ing system (CH) (fig. 5).
Structural equation modelling
In the SEM procedure, the best fitting model was
chosen to explain the relationships between the
variables ‘juvenile production’, ‘Collembola density’
in the soil surface, ‘vegetation density’ of the lower
vegetation layer as well as ‘organic matter’ and ‘soil
water’ content in the topsoil, which means low
Chi-squared statistics compared with the degrees of
freedom. Figure 6 shows the path diagram of the
relationships between the five variables (v2= 8,0;
P = 0,16; d.f. = 5; n = 120).
Not surprisingly, the ‘organic matter’ content in
the topsoil was positively influenced by the ‘vegeta-
tion density’ while the ‘Collembola density’ in the
soil surface was positively influenced by the ‘organic
matter’ content. The ‘organic matter’ content in top-
soil also has an indirect influence on the ‘Collembola
density’ as the ‘soil water’ content in the topsoil is
Fig. 6 Path diagram showing the relationship between the estimated
linyphiid juvenile production, Collembola density, vegetation density
as well as organic matter and soil water content in the topsoil using
structural equation modelling (SEM). Model fit: v2 = 8.75, d.f. = 5,
P = 0.12; n = 120. The figures at each arrow represent the standard-
ized regression weights (the path coefficients).*P < 0.05; **P < 0.01;
***P < 0.001. Regression weights between each variable and a latent
variable were fixed to unity in the analysis, but these figures are not
shown in the diagram.
Fig. 5 Estimated mean (mean � SE) Collembola densities in the soil
surface as well as mean (mean � SE) organic matter and soil water
content in the upper five centimetres of the topsoil in relation to the
four different growing practices. Horizontal bars show significant dif-
ferences in relation to the four different growing practices; *P < 0.05;
**P < 0.01; ***P < 0.001.
E. Gravesen Linyphiid spider populations in sustainable wheat-clover bi-cropping
J. Appl. Entomol. 132 (2008) 545–556 ª 2008 The Author
Journal compilation ª 2008 Blackwell Verlag, Berlin 553
dependent on the ‘organic matter’ content while the
‘Collembola density’ has a positive influence on the
‘juvenile production’.
Discussion
The beneficial effects of the bi-crop technique is
evident even though the wheat-clover bi-crop
experiment from an agronomic point of view was
disappointing because the grain yields with the use
of a combination of winter wheat and white clover
were significantly lower than the grain yields of
conventional wheat production systems (Burke et al.
1998). In their bi-crop experiment in Ireland, the
grain yields were relatively stable between years
while lower levels of aphids and more earthworms
were found in the bi-crop system compared with
conventional production systems, which show that
bi-crop experiments have interesting preliminary
investigation potentials although further research is
needed before such a system can be presented to the
agricultural community.
In this study, the wheat-clover bi-crop technique
and the incorporation of a clover vegetation layer
together with the wheat crop plants have shown
obvious beneficial effects on the adult numbers of
the Linyphiinae species – B. gracilis and T. tenuis
(Harwood and Obrycki 2005). Moreover, the signifi-
cantly higher linyphiid web density levels of the
bi-crop system compared with the mean web density
level of the high-input, conventional growing system
is convincing. The beneficial effect of the bi-crop
technique is mainly based on the integration of the
perennial clover plants grown in narrow strips
between the wheat crop plants in the cereal fields
(Samu 2003; Schmidt and Tscharntke 2005).
The positive correlation between linyphiid web
density and vegetation density for all four investi-
gated farming systems can be related to the vegeta-
tion as a web attachment substrate (Balfour and
Rypstra 1998; Rypstra et al. 1999), which shows that
clover and weed plants between the crop plants
instead of just bare soil between the crop plants may
have a beneficial impact on linyphiid web densities
in cereal fields (Altieri et al. 1985; Feber et al. 1998).
Less tillage, more organic matter and higher soil
water content seem to increase densities of Collem-
bola in arable fields (Axelsen and Kristensen 2000;
Bandyopadhyaya et al. 2002; Miyazawa et al. 2002).
The reduced tillage practice and the significantly
higher average values of organic matter as well as
soil water content in the topsoil with the wheat-
clover bi-crop technique compared with the
conventional wheat-growing practice seems to have
beneficial impacts on the Collembola density.
The detritus food chain is left more or less undis-
turbed with the bi-crop technique compared with
the situation with conventional growing practice
where the detritus food chain is much more dis-
turbed and reduced at particularly the soil surface.
The relatively intact detritus food chain, and with
that the higher Collembola densities, is supposed to
be the important basis of the higher densities of the
ground-dwelling spiders in the bi-crop system com-
pared with the conventional wheat-growing practice
with a high input of fertilizers and use of pesticides.
This is in agreement with Wise et al. (2006), who
found higher densities of linyphiid spiders as well as
Collembola and Diptera as an effect of the addition
of detrital subsidy in field experiments, and Schmidt
et al. (2005) showed that organically managed win-
ter wheat fields fertilized with manure and with
mechanical weed control enhanced spider density by
62% compared with conventionally managed wheat
fields with high fertilization and pesticide treatment
levels.
The SEM demonstrates the importance of the
detritus food chain (McNabb et al. 2001; Wise et al.
2006) for the linyphiid population build up because
the linyphiid juvenile production is influenced by
the numbers of collembolans accessible as food ani-
mals for the adults. This points to the plant residue
decomposition process at the soil surface as being
crucial for the population build-up of collembolans
and, consequently, of the population build-up of the
linyphiid spiders as the organic matter content in
the topsoil seems to be a key factor.
By using a bi-crop technique with clover as living
mulch, the detritus food chain is left more or less
undisturbed. This results in higher organic matter
and soil water content in the topsoil to the benefit of
the collembolans, which is supposed to further sup-
port higher reproductive outputs of the linyphiid spi-
ders compared with the situation under conventional
growing regimes with bare soil between the crop
plants and a reduced detritus food chain. Under the
conventional growing regimes, this results in lower
organic matter and soil water content in the topsoil
with lower Collembola densities in the soil surface,
which is supposed to further result in relatively low
reproductive outputs of the linyphiid spiders.
A combination of ecological density estimation
techniques and SEM has in this study shown a
potential as a powerful data analysis procedure, and
similar procedures may give a better understanding
of the complexity of agro-ecosystems in the future
Linyphiid spider populations in sustainable wheat-clover bi-cropping E. Gravesen
554J. Appl. Entomol. 132 (2008) 545–556 ª 2008 The Author
Journal compilation ª 2008 Blackwell Verlag, Berlin

and in that way support the further development of
ecologically sustainable growing techniques.
Acknowledgements
This research project was funded by the Danish Min-
istry of the Environment as part of the ‘Pesticide
Package’, which was an integrated part of an
EU-sponsored research project ‘Exploitation of a
sustainable low-input and reduced output system
for arable crops’ focussing on entomological and
agronomical consequences of wheat-clover bi-crop
systems. The field research was performed at the
agricultural Research Centre Foulum in coordination
with the Department of Agroecology and Environ-
ment at the University of Aarhus. The Biological
Institute at the University of Aarhus performed the
arachnological part of the project. Special thanks are
due to Joergen Granfeldt Pedersen for the Repeated
Measure anova analysis, to Anne Mette Lykke for
performing the jmp test and to Charlotte Clausen,
Trine Poulsen and Kristine Kristiansen for the
graphic design.
References
Alderweireldt M, 1994. Habitat manipulations increasing
spider densities in agroecosystems – possibilities for bio-
logical control. J. Appl. Entomol. 118, 10–16.
Altieri MA, Wilson RC, Schmidt LL, 1985. The effects of
living mulches and weed cover on the dynamics of
foliage- and soil-arthropod communities in three crop
systems. Crop Prot. 4, 201–213.
Arbuckle JL, Wothke W, 1999. Amos 4.0 User’s Guide.
SmallWaters Corporation, Chicago.
Axelsen JA, Kristensen KT, 2000. Collembola and mites
in plots fertilised with different types of green manure.
Pedobiologia 44, 556–566.
Balfour RA, Rypstra AL, 1998. The influence of habitat
structure on spider density in no-till soybean agroeco-
system. J. Arachnol. 26, 221–226.
Bandyopadhyaya I, Choudhuri DK, Ponge JF, 2002.
Effects of some physical factors and agricultural prac-
tices on Collembola in a multiple cropping programme
in West Bengal (India). Eur. J. Soil Biol. 38, 111–117.
Burke JI, Thomas TM, Finnan JM, 1998. Bi-cropping of
winter wheat and white clover. Project Report 4316,
Teagasc, Carlow.
Feber RE, Bell J, Johnson PJ, Firbank LG, Macdonald
DW, 1998. The effects of organic farming on surface-
active spider (Araneae) assemblages in wheat in south-
ern England, UK. J. Arachnol. 26, 190–202.
Fjellberg A, 1980. Identification keys to Norwegian Col-
lembola. Norsk Entomologisk Forening, Oslo.
Harwood JD, Obrycki JJ, 2005. Web-construction behav-
iour of linyphiid spiders (Araneae, Linyphiidae): Com-
petition and co-existence within a generalist predator
guild. J. Insect Behav. 18, 593–607.
Keuls M, Over HJ, de Wit CT, 1963. The distance method
for estimating densities. Stat. Neerl. 17, 71–91.
Krebs CJ, 1989. Ecological methodology. Harper & Row,
New York.
Marcussen BM, Axelsen JA, Toft S, 1999. The value of
two Collembola species as food for a linyphiid spider.
Entomol. Exp. Appl. 92, 29–36.
McNabb DM, Halaj J, Wise DH, 2001. Inferring trophic
positions of generalist predators and their linkage to
the detrital food web in agroecosystems: a stable iso-
tope analysis. Pedobiologia 45, 289–297.
Miyazawa K, Tsuji H, Yamagata M, Nakano H, Nakamoto
T, 2002. The effects of cropping systems and fallow
managements on microarthropod populations. Plant
Prod. Sci. 5, 257–265.
Roberts MJ, 1987. The spiders of Great Britain and Ire-
land. Volume 2 (Linyphiidae). Harley Books, England.
Rypstra AL, Carter PE, Balfour RA, Marshall SD, 1999.
Architectural features of agricultural habitats and their
impact on the spider inhabitants. J. Arachnol. 27, 371–
377.
Samu F, 2003. Can field-scale habitat diversification
enhance the biocontrol of spiders? Pest Manag. Sci. 59,
437–442.
Schierup H-H, Jensen A, 1981. Vejledning i kemisk og
fysisk analyse af jordprøver og plantemateriale. Univer-
sity of Aarhus, Denmark.
Schmidt MH, Tscharntke T, 2005. The role of perennial
habitats for Central European farmland spiders. Agr.
Ecosyst. Environ. 105, 235–242.
Schmidt MH, Thewes U, Thies C, Tscharntke T, 2004.
Aphid suppression by natural enemies in mulched
cereals. Entomol. Exp. Appl. 113, 87–93.
Schmidt MH, Roschewitz I, Thies C, Tscharntke T, 2005.
Differential effects of landscape and management on
diversity and density of ground-dwelling farmland
spiders. J. Appl. Ecol. 42, 281–287.
Shipley B, 2000. Cause and correlation in biology. Cam-
bridge University Press, Cambridge.
Southwood TRE, Henderson PA, 2000. Ecological meth-
ods. 3rd edition. Blackwell Science, Oxford.
Sunderland K, Samu F, 2000. Effects of agricultural
diversification on the abundance, distribution, and pest
control potential of spiders: a review. Entomol. Exp.
Appl. 95, 1–13.
Sunderland KD, Topping CJ, 1995. Estimating population
densities of spiders in cereals. In: Arthropod natural
enemies in arable land. Proceedings of the First EU
Workshop on Enhancement, Dispersal and Population
Dynamics of Beneficial Insects in Integrated Agrosys-
tems: ‘Estimating population densities and dispersal
E. Gravesen Linyphiid spider populations in sustainable wheat-clover bi-cropping
J. Appl. Entomol. 132 (2008) 545–556 ª 2008 The Author
Journal compilation ª 2008 Blackwell Verlag, Berlin 555

rates of beneficial predators and parasitoids in
agroecosystems’ held at the University of Aarhus, Den-
mark, 1993. Ed. by Toft S, Riedel W, Aarhus University
Press, Denmark, 13–22.
Toft S, Vangsgaard C, Goldschmidt H, 1995. Distance
methods used to estimate densities of web spiders in
cereal fields. In: Arthropod natural enemies in arable
land. Proceedings of the First EU Workshop on
Enhancement, Dispersal and Population Dynamics
of Beneficial Insects in Integrated Agrosystems:
‘Estimating population densities and dispersal rates of
beneficial predators and parasitoids in agroecosystems’
held at the University of Aarhus, Denmark, 1993. Ed.
by Toft S, Riedel W, Aarhus University Press, Denmark,
33–45.
Wise DH, Moldenhauer DM, Halaj J, 2006. Using stable
isotopes to reveal shifts in prey consumption by gener-
alist predators. Ecol. Appl. 16, 865–876.
Wright S, 1921. Correlation and causation. J. Agr. Res.
10, 557–585.
Linyphiid spider populations in sustainable wheat-clover bi-cropping E. Gravesen
556J. Appl. Entomol. 132 (2008) 545–556 ª 2008 The Author
Journal compilation ª 2008 Blackwell Verlag, Berlin