Linking Philips Procurement’s Performance Measurement to ... · procurement KPI dashboard and...
101
Eindhoven University of Technology MASTER Linking Philips procurement's performance measurement to their stragetic objectives a Philips procurement KPI dashboard supporting executives in performance measurement van Etten, P.H.A.M. Award date: 2014 Link to publication Disclaimer This document contains a student thesis (bachelor's or master's), as authored by a student at Eindhoven University of Technology. Student theses are made available in the TU/e repository upon obtaining the required degree. The grade received is not published on the document as presented in the repository. The required complexity or quality of research of student theses may vary by program, and the required minimum study period may vary in duration. General rights Copyright and moral rights for the publications made accessible in the public portal are retained by the authors and/or other copyright owners and it is a condition of accessing publications that users recognise and abide by the legal requirements associated with these rights. • Users may download and print one copy of any publication from the public portal for the purpose of private study or research. • You may not further distribute the material or use it for any profit-making activity or commercial gain
Transcript of Linking Philips Procurement’s Performance Measurement to ... · procurement KPI dashboard and...
Eindhoven University of Technology
MASTER
Linking Philips procurement's performance measurement to their stragetic objectives
a Philips procurement KPI dashboard supporting executives in performancemeasurement
van Etten, P.H.A.M.
Award date:2014
Link to publication
DisclaimerThis document contains a student thesis (bachelor's or master's), as authored by a student at Eindhoven University of Technology. Studenttheses are made available in the TU/e repository upon obtaining the required degree. The grade received is not published on the documentas presented in the repository. The required complexity or quality of research of student theses may vary by program, and the requiredminimum study period may vary in duration.
General rightsCopyright and moral rights for the publications made accessible in the public portal are retained by the authors and/or other copyright ownersand it is a condition of accessing publications that users recognise and abide by the legal requirements associated with these rights.
• Users may download and print one copy of any publication from the public portal for the purpose of private study or research. • You may not further distribute the material or use it for any profit-making activity or commercial gain
LINKING PHILIPS PROCUREMENT’S PERFORMANCE
MEASUREMENT TO THEIR STRATEGIC OBJECTIVES
A Philips Procurement KPI Dashboard supporting Executives in Performance Measurement Master’s Thesis | Confidential | Paul van Etten

Confidential | Jan 28, 2014
1 Linking Philips Procurement’s Performance Measurement to their Strategic Objectives|
`
Master’s Thesis 1ZM96
Linking Philips Procurement’s Performance Measurement to their Strategic Objectives|
A Philips Procurement KPI dashboard supporting Executives in Performance measurement Philips Procurement, Programs, Processes & Systems
Confidential
January 28, 2014
Author: P.H.A.M. (Paul) van Etten BSc.
Supervisors Eindhoven University of Technology:
1st
Prof. Dr. A.J. (Arjan) van Weele 2
nd Dr. Ir. P.A.M. (Ad) Kleingeld
Supervisors Philips Procurement:
Ir. P.H.P (Paul) Joosten Ir. R.P. (Robert) Bijl
Confidential | Jan 28, 2014
2 | Abstract
January 28, 2014
Author:
P.H.A.M. (Paul) van Etten BSc. Student Master Innovation Management, Intern master graduation thesis Philips Procurement Department of Industrial Engineering & Innovation Sciences, Eindhoven University of Technology, 5600 MB, Eindhoven, The Netherlands Contact: M 06 40 91 82 63 E [email protected] Minckelersstraat 10-02, 5051 AN Tilburg
Supervisors Eindhoven University of Technology:
Prof. Dr. A.J. (Arjan) van Weele NEVI-Chair of Purchasing and Supply Management Department of Industrial Engineering & Innovation Sciences, Section: Innovations, Technology, Entrepreneurship & Marketing
Contact: [email protected] | Connector 1.30, P.O Box 513, 5600 MB Eindhoven
Dr. Ir. P.A.M. (Ad) Kleingeld Department of Industrial Engineering & Innovation Sciences, Section: Human Performance Management Group
Contact: [email protected] | Paviljoen J12, P.O Box 513, 5600 MB Eindhoven
Supervisors Philips Procurement:
Ir. P.H.P (Paul) Joosten Manager Programs Processes & Systems
Contact: [email protected] | Philips Procurement, High Tech Campus 5, 1
st floor, Eindhoven
Ir. R.P (Robert) Bijl Process & System Manager
Contact: [email protected] | Philips Procurement, High Tech Campus 5, 1
st floor, Eindhoven

Confidential | Jan 28, 2014
3 Linking Philips Procurement’s Performance Measurement to their Strategic Objectives|
Confidential | Jan 28, 2014
4 | Abstract
“Measure less, know more”
(Passioned Group, 2013)
“A successful system measures only what is important while still promoting individual initiative
and creativity, which may mean only focusing on 5 or 6 important, clearly defined measures
instead of 25 vague measures”
(Handfield, Monczka, Giunipero, & Patterson, 2011, p. 754)
”To steer into more strategic business waters, CPOs must abandon the cost savings myopia and
service mentality that tarnish procurement’s image”
Statement of Dick Russill (Rietveld, 2009, p. 35)

Confidential | Jan 28, 2014
5 Linking Philips Procurement’s Performance Measurement to their Strategic Objectives|
Confidential | Jan 28, 2014
6 | Abstract
Eindhoven, January 2014
Linking Philips Procurement’s
Performance Measurement
to their Strategic Objectives
A Philips Procurement KPI Dashboard
Supporting Executives in
Performance Measurement
By
P.H.A.M. (Paul) van Etten BSc.
BSc Industrial Engineering and Management Sciences — TU/e 2011
Student identity number: 0616683
in partial fulfillment of the requirements for the degree of Master of Science in Innovation Management
Supervisors: Prof. dr. A.J. (Arjan) van Weele TU/e, ITEM Dr. ir. P.A.M.(Ad) Kleingeld TU/e, HPM Ir. P.H.P. (Paul) Joosten Philips Procurement
Ir. R.P. (Robert) Bijl Philips Procurement

Confidential | Jan 28, 2014
7 Linking Philips Procurement’s Performance Measurement to their Strategic Objectives|
TUE. School of Industrial Engineering. Series Master Thesis Innovation Management
Subject headings: Purchasing, performance measurement, performance management,


Confidential | Jan 28, 2014
i Linking Philips Procurement’s Performance Measurement to their Strategic Objectives|

Confidential | Jan 28, 2014
ii | Abstract
I. ABSTRACT
Philips Procurement has failed to implement an effective PMS. This design-oriented study analyzed the current shortcomings and made suggestions for the future. One could perceive this design-oriented study as a business case, describing the first steps in the change from a traditional PMS towards a non-traditional PMS within less than one year.

Confidential | Jan 28, 2014
iii Linking Philips Procurement’s Performance Measurement to their Strategic Objectives|
Confidential | Jan 28, 2014
iv | Acknowledgement
II. ACKNOWLEDGEMENT
This thesis report is the finalization of my internship at Philips Procurement, located at the High Tech Campus (HTC) in Eindhoven. During this period, Philips procurement was under transformation. Some effects of the transformation were visible over time. But not only Philips was under transformation, I was too. Before this internship I had no experience with any organization over 100 employees, let alone a multinational like Philips. During the nine months of my internship, I have gone through an enormous learning curve; not only on the subjects of matter or the experiences at a multinational, but also (if not mainly) on a personal level.
Throughout my exciting graduation project, I was supported by several highly rewarded experts. For one, my supervising professor prof. dr. Arjan van Weele. I am thankful for both his coaching and counseling activities. He challenged me to attack this project’s topic from more than just the obvious perspectives. He also pushed the bar higher when possible, but perhaps more importantly: he pushed me back from preventing me to solve all of Philips issues in attempt to “save Philips”.
I also thank dr. ir. Ad Kleingeld for his highly rewarded critical feedback. He challenged me to rethink my project and apply the needed focus to safeguard the academic relevance.
Within Philips, there are many people with who I spend hours of brainstorming and analysis, discussing and tackling a wide variety of issues. It was during those moments, I figured out once more I enjoy collaboration and joined excellence. Or, in line with Philips principles: “team up to excel”. There are too many names and experts I should list here. But in special I need to name Paul Joosten for his role of initiating this project and enabling me by providing the required resources.
Special attention goes to Robert Bijl, who on a daily basis supported me in all my activities. He too challenged me time after time to attack issues from different perspectives and gave me direction within the organization. Moreover, he acted as a coach for me; supporting me in my struggle to deal with the bureaucracy and politics in a setting like Philips, but also in the quest to find balance in live. Or, as Robert likes to state: “waartoe zijn wij hier op aarde”.
The circle with people close-to-me throughout this project would not be complete without mentioning my love and support Michelle Hendriks. She supported me through all the times. With her, I could share both my enthusiasms and high’s, as well as the lows in the times I was frustrated, struggling or experiencing a lack of motivation. Thank you for your love, patience and support.
Closing, I hope my master’s thesis project scores high on “relevance”. Receiving compliments and confirmation on your contributions is deeply rewarding, but I also hope my thesis will make a contribution to Philips that lasts longer than the journey to the shredder.
Thank for you for the experience and I hope you enjoy reading my thesis report.
Kind regards,
Paul van Etten, Dec 2013
Confidential | Jan 28, 2014
v Linking Philips Procurement’s Performance Measurement to their Strategic Objectives|
III. MANAGEMENT SUMMARY
Under the leadership of Philips new CEO, a new strategic course has been developed for the corporation. Philips wants increase its financial results in all of its business sectors and in the countries where it is represented. Its marketing focus is going to be reinforced. Its business operations are realigned to fit specific business sector strategies. As a result, its procurement activities are going to be decentralized and realigned with these new business priorities. The current reorientation and reorganization of Philips procurement activities, calls for new ambitions, more efficient processes, and contributions to Philips bottom line and topline. Philips procurements mission has been reviewed and reformulated, as well as its procurement strategies. Procurement strategies need to be translated into purchasing actions, and these actions need to be measured and monitored in terms of the results that they accrue. The question is: how to monitor and measure these procurement results, both at the business unit level and the corporate level? This question was the basis for this assignment, which was stated as follows: ‘Analyze the 2013 procurement KPI dashboard and make suggestions for improvements that are executable for 2014’. This assignment resulted in our main research question;
“Which kpi’s should be incorporated in the Philips Procurement KPI Dashboard, what would their definition be and how should they be measured to give Management a more effective tool in their Performance Management?”
To answer this main research question, five sub questions were formulated:
1. How does the 2013 Procurement Performance measurement System look like? 2. What are the problems with the 2013 KPI dashboard? 3. What is a procurement performance measurement system and what conditions need to be in
place to make it work? 4. What should be done to improve the procurement performance measurement system? 5. What designs could help to bring improvements?
In order to be able to answer these questions, a research design was chosen for this study. The design was based on a thorough research framework, which was derived from academic literature. The research framework was used to structure our field research, which included structured and semi structured interviews, observations from practice, and information gathered through surveys. The results from these research activities were complemented with a study of internal documents.
The literature study revealed the success factors underlying modern procurement performance measurements systems. These factors were explored within Philips’ procurement context. This research indicated that several conditions for effective procurement performance measurement were not in place. More particularly, the researcher found the following:
targets and objectives that would need to guide Philips procurement performance activities are ambiguous and are not widely understood,
the 2013 procurement performance measurement system suffers from a lack of credibility and support of Philips procurement staff. This is particularly due to how the 2013 system has been designed and implemented,
important elements of Philips procurement performance are missing ie are not covered by KPI's
the 2013 purchasing performance measurement system seems to suffer from lack of management commitment which prevents its use as a vehicle to guide Philips procurement activities,
the 2013 KPIs are insufficiently supported by 2013 IT systems, which impedes regular and consistent reporting.
Taking Philips mission and business strategy as a point of departure, a new mission and strategy for procurement has been formulated. Based on this mission and strategy KPIs were suggested to guide and align Philips future procurement activities. These KPIs were the following:

Confidential | Jan 28, 2014
vi | Management Summary
Job-role Competence fit
Business Partner alignment and satisfaction
Supplier Relationship strength
Enabling effectiveness
These KPIs ie performance measures should allow managers to steer the procurement function and organization into its future strategic direction. As procurement is going through a rapid transformation, the researcher suggests to include a measure to track the effectiveness of the 2013 procurement transformation. Given the fact that people are extremely important to any procurement function, the researcher did also suggest to include a KPI to measure having the right talent in place. Therefore a measure that reflects the job-role fit has been suggested to include in the set of KPI's. Final suggestion contains to include supplier satisfaction indicators as part of the future dashboard.
However, having defined this future dashboard would not be sufficient for Philips procurement to succeed in realizing its ambitions and future strategies. The researcher feels that more needs to be done to accomplish that. More particularly, he recommends to:
define the role and purpose of procurement management unambiguously and communicate this clearly to all procurement staff worldwide
make performance measurement and the evaluation part of the procurement Plan Do Check Act cycle and to systematically record procurement performance on all of the suggested KPI's on a monthly basis
to communicate the new procurement performance management system to all procurement staff and to sound out probable obstacles and impediments as seen by senior procurement staff
to review the effectiveness and actuality of the suggested procurement performance measurement system in order to make sure that it dynamically fits Philips changing strategies and ambitions.
Implementing Philips new procurement performance measurement system should not be considered as a technical matter. More likely it's going to be the start of a cultural change among Philips procurement community. It is important that this cultural change is driven by a strong motivation of people to perform better, to contribute to Philips’ strategic ambitions and strategies and to contribute to its financial results. This will call for dedicated and consistent leadership.
Confidential | Jan 28, 2014
vii Linking Philips Procurement’s Performance Measurement to their Strategic Objectives|
IV. CONTENT
I. Abstract ......................................................................................................................................................... ii
II. Acknowledgement ....................................................................................................................................... iv
III. Management Summary ................................................................................................................................. v
IV. Content ....................................................................................................................................................... vii
V. Theoretical framework -chapter outline ....................................................................................................... ix
VI. List of Figures ................................................................................................................................................ x
VII. List of Tables................................................................................................................................................. xi
VIII. List of Abbreviations .................................................................................................................................... xii
1. Introduction .................................................................................................................................................. 2
1.1 Research context: Philips Procurement ....................................................................................................... 2
1.2 Motivation .................................................................................................................................................... 3
1.3 Problem statement and Research questions ............................................................................................... 4
1.4 Research methodology ................................................................................................................................ 7
1.5 Deliverables and outline .............................................................................................................................. 8
2. Literature review: Performance Measurement for purchasing’s top management...................................... 10
2.1 Purpose and deliverables of literature review ........................................................................................... 10
2.2 Definitions .................................................................................................................................................. 11
2.3 History and developments of PM with emphasizes on purchasing ........................................................... 12
2.4 Towards a Performance Measurement for Purchasing ............................................................................. 14
2.5 Selection of framework for designing a modern PMS ............................................................................... 18
2.6 Accompanied requirements, criteria and constraints ............................................................................... 20
2.7 Synthesis .................................................................................................................................................... 22
2.9 Concluding .................................................................................................................................................. 23
3. Performance Measurement Developments at Philips Procurement ............................................................ 24
3.1 Philips procurements Performance Measurement history ........................................................................ 24
3.2 Philips procurement 2013’s Performance Measurement .......................................................................... 24
3.3 2013 and future developments .................................................................................................................. 29
3.4 Analysis of findings ..................................................................................................................................... 29
3.5 Concluding .................................................................................................................................................. 30
3.6 Interpretation of findings ........................................................................................................................... 30
4. Design of KPI dashboard .............................................................................................................................. 32
4.1 Step 1&2: Procurements’ mission and Strategic Objectives ...................................................................... 32
4.2 Step 3: Understanding of Strategic objectives ........................................................................................... 35
4.3 Step 4: Global performance measures ....................................................................................................... 38
4.4 Concluding’s ............................................................................................................................................... 41

Confidential | Jan 28, 2014
viii | IV. Content
5. Conclusion, Discussion & Management insight ............................................................................................ 42
5.1 Conclusion .................................................................................................................................................. 42
5.2 Discussion ................................................................................................................................................... 45
5.3 Implications ................................................................................................................................................ 47
5.4 Limitations .................................................................................................................................................. 48
5.5 future research ........................................................................................................................................... 50
Note: Update December 2013 ............................................................................................................................. 52
References ........................................................................................................................................................... 53
Appendix 1: Procurement Transformation .............................................................................................................. 58
Appendix 2: Accelerate! .......................................................................................................................................... 59
Appendix 3: Philips High level organizational structure .......................................................................................... 59
Appendix 4: procurement kpi dashboard (June, 2013) ........................................................................................... 60
Appendix 5: 2013 Procurement kpi dashboard (June, 2013) .................................................................................. 62
Appendix 6: 2014 procurement kpi dashboard (Dec, 2013) .................................................................................... 63
Appendix 7: Summary of several iterations ............................................................................................................. 64
Appendix 8: review analysis desirable characteristics (Neely et al, 2000) .............................................................. 65
Appendix 9: 2013 Coverage strategic objectives by kpi’s ........................................................................................ 66
Appendix 10: Review analysis of (non) traditional measures .................................................................................. 67
Appendix 11: PM audit template ............................................................................................................................. 68
Appendix 12: PM audit data results ........................................................................................................................ 71
Appendix 13: PM audit explanation results ............................................................................................................. 72
Appendix 14: interview log ...................................................................................................................................... 74
Appendix 15: Interview templates .......................................................................................................................... 76
Appendix 16: Interview notes .................................................................................................................................. 79
Confidential | Jan 28, 2014
ix Linking Philips Procurement’s Performance Measurement to their Strategic Objectives|
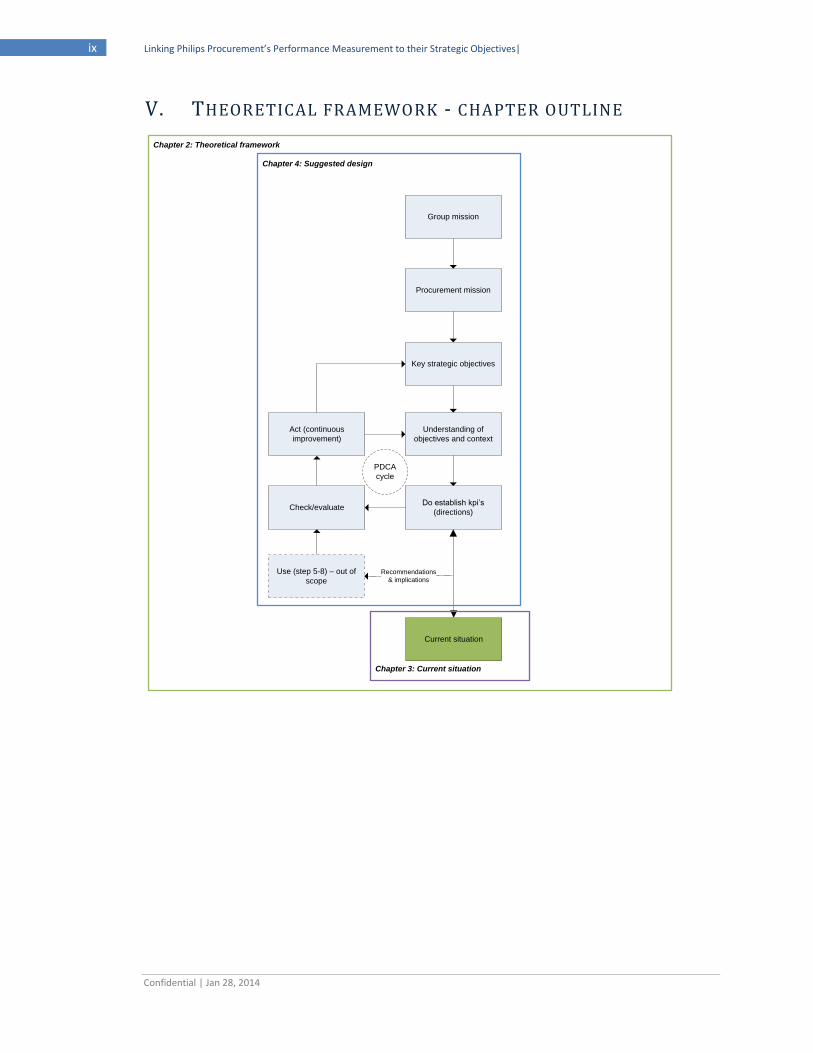
V. THEORETICAL FRAMEWORK - CHAPTER OUTLINE
Group mission
Procurement mission
Key strategic objectives
Understanding of
objectives and context
Do establish kpi’s
(directions)Check/evaluate
Act (continuous
improvement)
Use (step 5-8) – out of
scope
Recommendations
& implications
PDCA
cycle
Current situation
Chapter 4: Suggested design
Chapter 3: Current situation
Chapter 2: Theoretical framework
Confidential | Jan 28, 2014
x | VI. List of Figures
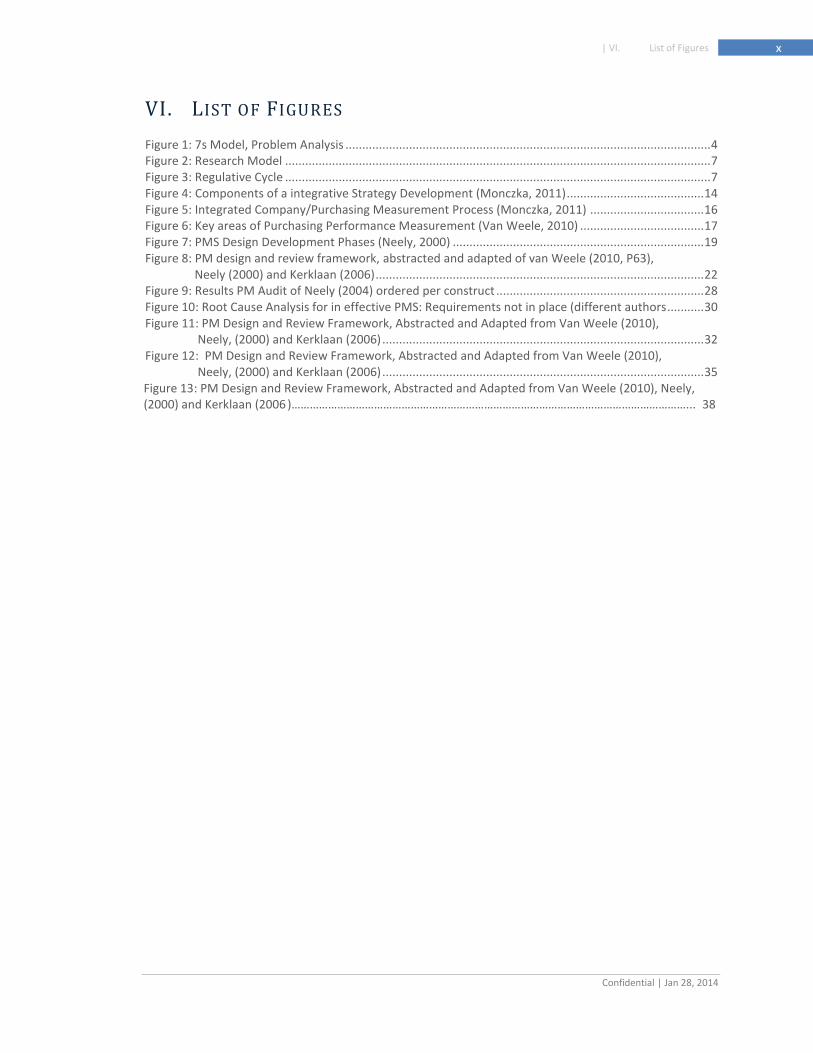
VI. LIST OF FIGURES
Figure 1: 7s Model, Problem Analysis ............................................................................................................. 4 Figure 2: Research Model ............................................................................................................................... 7 Figure 3: Regulative Cycle ............................................................................................................................... 7 Figure 4: Components of a integrative Strategy Development (Monczka, 2011) ......................................... 14 Figure 5: Integrated Company/Purchasing Measurement Process (Monczka, 2011) .................................. 16 Figure 6: Key areas of Purchasing Performance Measurement (Van Weele, 2010) ..................................... 17 Figure 7: PMS Design Development Phases (Neely, 2000) ........................................................................... 19 Figure 8: PM design and review framework, abstracted and adapted of van Weele (2010, P63),
Neely (2000) and Kerklaan (2006) .................................................................................................. 22 Figure 9: Results PM Audit of Neely (2004) ordered per construct .............................................................. 28 Figure 10: Root Cause Analysis for in effective PMS: Requirements not in place (different authors ........... 30 Figure 11: PM Design and Review Framework, Abstracted and Adapted from Van Weele (2010),
Neely, (2000) and Kerklaan (2006) ................................................................................................ 32 Figure 12: PM Design and Review Framework, Abstracted and Adapted from Van Weele (2010),
Neely, (2000) and Kerklaan (2006) ................................................................................................ 35 Figure 13: PM Design and Review Framework, Abstracted and Adapted from Van Weele (2010), Neely, (2000) and Kerklaan (2006 )…………………………………………………………………………………………………………………... 38
Confidential | Jan 28, 2014
xi Linking Philips Procurement’s Performance Measurement to their Strategic Objectives|
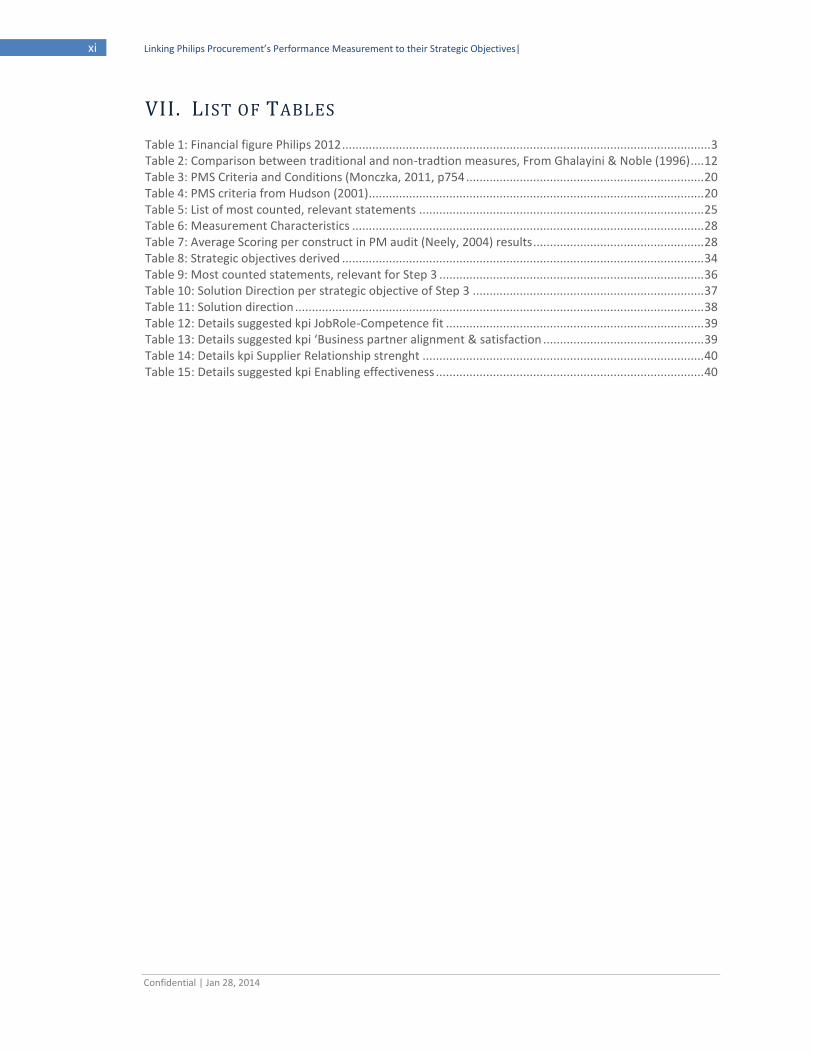
VII. LIST OF TABLES
Table 1: Financial figure Philips 2012 .............................................................................................................. 3 Table 2: Comparison between traditional and non-tradtion measures, From Ghalayini & Noble (1996) .... 12 Table 3: PMS Criteria and Conditions (Monczka, 2011, p754 ....................................................................... 20 Table 4: PMS criteria from Hudson (2001) .................................................................................................... 20 Table 5: List of most counted, relevant statements ..................................................................................... 25 Table 6: Measurement Characteristics ......................................................................................................... 28 Table 7: Average Scoring per construct in PM audit (Neely, 2004) results ................................................... 28 Table 8: Strategic objectives derived ............................................................................................................ 34 Table 9: Most counted statements, relevant for Step 3 ............................................................................... 36 Table 10: Solution Direction per strategic objective of Step 3 ..................................................................... 37 Table 11: Solution direction .......................................................................................................................... 38 Table 12: Details suggested kpi JobRole-Competence fit ............................................................................. 39 Table 13: Details suggested kpi ‘Business partner alignment & satisfaction ................................................ 39 Table 14: Details kpi Supplier Relationship strenght .................................................................................... 40 Table 15: Details suggested kpi Enabling effectiveness ................................................................................ 40
Confidential | Jan 28, 2014
xii | VIII. List of Abbreviations
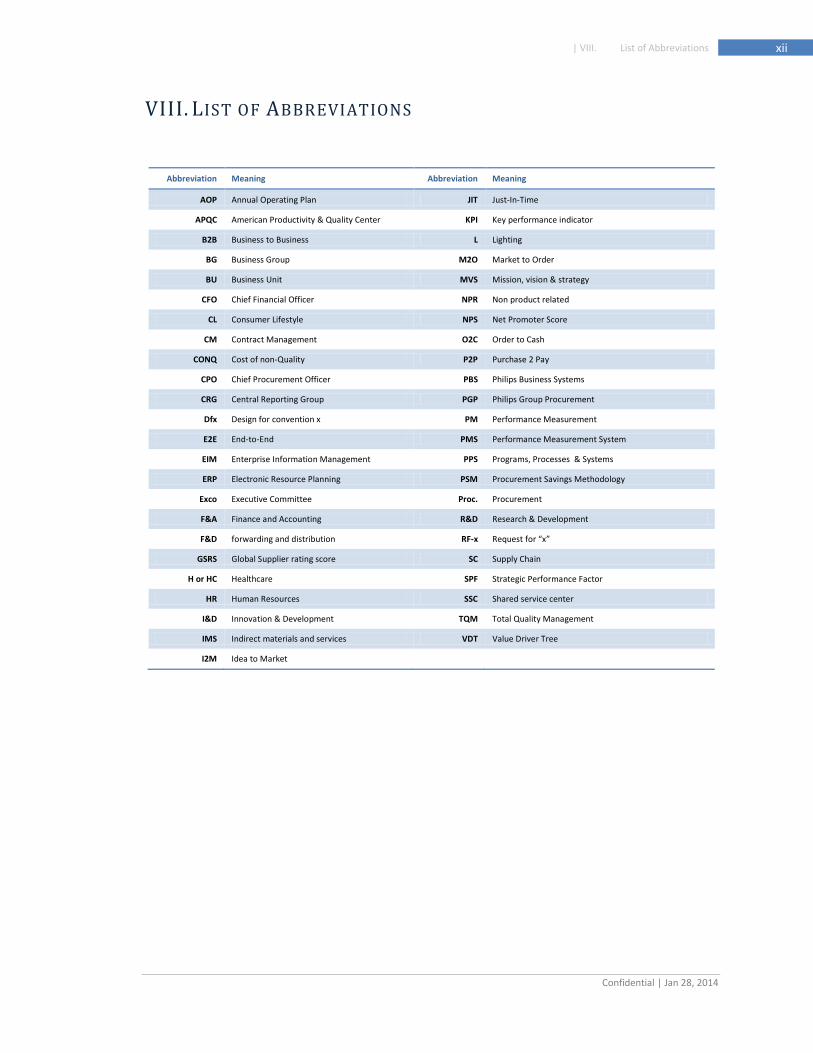
VIII. LIST OF ABBREVIATIONS
Abbreviation Meaning Abbreviation Meaning
AOP Annual Operating Plan JIT Just-In-Time
APQC American Productivity & Quality Center KPI Key performance indicator
B2B Business to Business L Lighting
BG Business Group M2O Market to Order
BU Business Unit MVS Mission, vision & strategy
CFO Chief Financial Officer NPR Non product related
CL Consumer Lifestyle NPS Net Promoter Score
CM Contract Management O2C Order to Cash
CONQ Cost of non-Quality P2P Purchase 2 Pay
CPO Chief Procurement Officer PBS Philips Business Systems
CRG Central Reporting Group PGP Philips Group Procurement
Dfx Design for convention x PM Performance Measurement
E2E End-to-End PMS Performance Measurement System
EIM Enterprise Information Management PPS Programs, Processes & Systems
ERP Electronic Resource Planning PSM Procurement Savings Methodology
Exco Executive Committee Proc. Procurement
F&A Finance and Accounting R&D Research & Development
F&D forwarding and distribution RF-x Request for “x”
GSRS Global Supplier rating score SC Supply Chain
H or HC Healthcare SPF Strategic Performance Factor
HR Human Resources SSC Shared service center
I&D Innovation & Development TQM Total Quality Management
IMS Indirect materials and services VDT Value Driver Tree
I2M Idea to Market

Confidential | Jan 28, 2014
1 Linking Philips Procurement’s Performance Measurement to their Strategic Objectives|
Confidential | Jan 28, 2014
2 | Introduction
1. INTRODUCTION
This master’s thesis graduation project has been executed at the global procurement function of Philips. It focusses on evaluating the 2013 Performance Measurement (PM) and making suggestions for improvements. In the academic literature, the term Performance Measurement is commonly used and could be defined as: “the process of quantifying the efficiency and effectiveness of actions, in order to compare results against expectations, with the intent to motivate, guide and improve decision making” (Lardenoije, Raaij, & Van Weele, 2005, p. 3). A kpi Dashboard is considered a driving tool; it allows decision makers to have a real-time synthetic vision of the main indicators characterizing business and to establish certain decisions, as part of Performance Measurement (PM) (Georgescu & Ciobanica, 2012). It contains a small number of indicators (10 to 25 indicators), presented in readable form, and related to important decisions and business objectives that are pursued by an official (Georgescu & Ciobanica, 2012). Performance measurement is high on many management agenda’s (Neely A., 1999).
These days, the importance of purchasing as an organizational function and its alignment with other functions has been acknowledged by both academics and practitioners (Knudsen, 2003; Wynstra, Weele, & Axelsson, 1999; Buxmann, Ahsen, & Dıaz, 2008). Senior management is becoming more and more familiar with the potential of purchasing to strategically influence both operational and financial performance (Saranga & Moser, 2010). With this increased awareness, the relevance of PM increases too, as it is a powerful tool in supporting performance management. The four main reasons for measuring and evaluating performances of purchasing according to leading purchasing authors are: support for better decision making, support better communication, provide performance feedback and motivate and direct behavior (Handfield, Monczka, Giunipero, & Patterson, 2011; Van Weele, 2010). Research has revealed that many organizations still today fail to implement an effective PMS (Bourne, 2008).
The next sections focus on introducing Philips procurement and the Philips organization, followed by the motivation to initiate this project and the introduction of the problem statement. Chapter 2 highlights the key findings of the preceding literature review. Chapter 3 zooms in on the Performance Measurement developments within Philips procurement. Chapter 4 contains the design solution directions and suggested kpi dashboard design. Finally in Chapter 5, the research questions will be answered. In addition, it puts the findings and research method under a broader discussion, discusses the management implications and research limitation as well future research.
1.1 RESEARCH CONTEXT : PHILIPS PROCUREMENT
Before describing Philips Procurement, Royal Philips of the Netherlands is described. Royal Philips of the Netherlands is a diversified health and well-being company, focused on improving people’s lives through meaningful innovation in the areas of Healthcare, Consumer Lifestyle and Lighting. Headquartered in the Netherlands, Philips posted 2012 sales of EUR 24.8 billion and employs approximately 118,000 employees with sales and services in more than 100 countries. The company is a leader in cardiac care, acute care and home healthcare, energy efficient lighting solutions and new lighting applications, as well as male shaving and grooming, home and portable entertainment and oral healthcare.
The mission of Philips is: “Improving people’s lives through meaningful innovation”. Philips adds to their mission (Philips, Philips Annual report 2012, 2012): “Innovation is core to everything we do. But innovation does not only mean “new technology”. It can also mean a new application, a new business model or a unique customer proposition brought about by an innovative partnership. By tracking global trends and understanding the challenges facing people in their daily lives, we ensure that people’s need and aspirations remain at the heart of our innovation endeavors.”
The accompanying vision includes: “At Philips, we strive to make the world healthier and more sustainable through innovation. Our goal is to improve the lives of 3 billion people a year by 2025. We will be the best
Confidential | Jan 28, 2014
3 Linking Philips Procurement’s Performance Measurement to their Strategic Objectives|
place to work for people who share our passion. Together we will deliver superior value for our customers and shareholders”.
In September 2007, Philips communicated its Vision 2010 strategic plan to further grow the company with increased profitability targets. As part of Vision 2010, the organizational structure was simplified per January 1, 2008 by forming three sectors: Healthcare, Lighting and Consumer Lifestyle. These steps further position Philips as a market-driven, people-centric company with a strategy and a structure that fully reflect the needs of its customer base. With this set of businesses, Philips aims to build the leading brand in Health and Well-being.
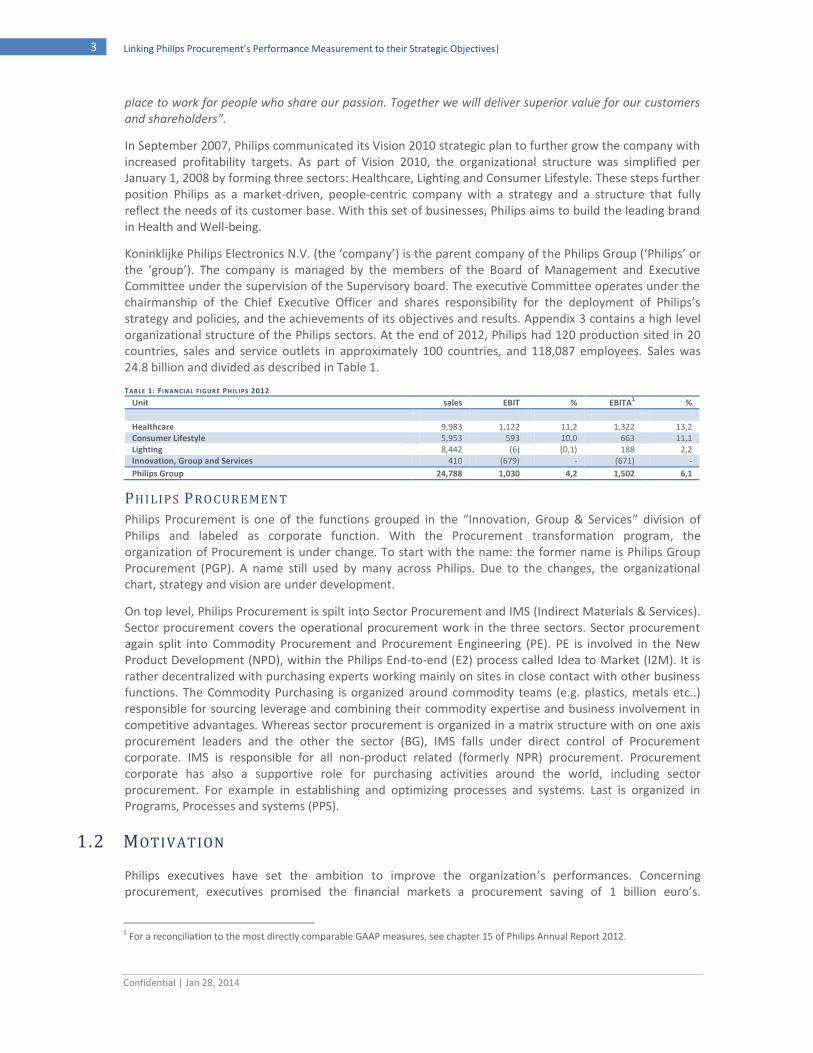
Koninklijke Philips Electronics N.V. (the ‘company’) is the parent company of the Philips Group (‘Philips’ or the ‘group’). The company is managed by the members of the Board of Management and Executive Committee under the supervision of the Supervisory board. The executive Committee operates under the chairmanship of the Chief Executive Officer and shares responsibility for the deployment of Philips’s strategy and policies, and the achievements of its objectives and results. Appendix 3 contains a high level organizational structure of the Philips sectors. At the end of 2012, Philips had 120 production sited in 20 countries, sales and service outlets in approximately 100 countries, and 118,087 employees. Sales was 24.8 billion and divided as described in Table 1.
TABLE 1: F INANCIAL FIGURE PHILIPS 2012
Unit sales EBIT % EBITA1 %
Healthcare 9,983 1,122 11,2 1,322 13,2 Consumer Lifestyle 5,953 593 10,0 663 11,1 Lighting 8,442 (6) (0,1) 188 2,2 Innovation, Group and Services 410 (679) - (671) -
Philips Group 24,788 1,030 4,2 1,502 6,1
PHI LIP S PRO CUR EMEN T
Philips Procurement is one of the functions grouped in the “Innovation, Group & Services” division of Philips and labeled as corporate function. With the Procurement transformation program, the organization of Procurement is under change. To start with the name: the former name is Philips Group Procurement (PGP). A name still used by many across Philips. Due to the changes, the organizational chart, strategy and vision are under development.
On top level, Philips Procurement is spilt into Sector Procurement and IMS (Indirect Materials & Services). Sector procurement covers the operational procurement work in the three sectors. Sector procurement again split into Commodity Procurement and Procurement Engineering (PE). PE is involved in the New Product Development (NPD), within the Philips End-to-end (E2) process called Idea to Market (I2M). It is rather decentralized with purchasing experts working mainly on sites in close contact with other business functions. The Commodity Purchasing is organized around commodity teams (e.g. plastics, metals etc..) responsible for sourcing leverage and combining their commodity expertise and business involvement in competitive advantages. Whereas sector procurement is organized in a matrix structure with on one axis procurement leaders and the other the sector (BG), IMS falls under direct control of Procurement corporate. IMS is responsible for all non-product related (formerly NPR) procurement. Procurement corporate has also a supportive role for purchasing activities around the world, including sector procurement. For example in establishing and optimizing processes and systems. Last is organized in Programs, Processes and systems (PPS).
1.2 MOTIVATION
Philips executives have set the ambition to improve the organization’s performances. Concerning procurement, executives promised the financial markets a procurement saving of 1 billion euro’s.
1 For a reconciliation to the most directly comparable GAAP measures, see chapter 15 of Philips Annual Report 2012.

Confidential | Jan 28, 2014
4 | Introduction
Throughout the whole organization, transformations and changes have taken place to further develop Philip and enable the realization of these ambitions.
Performance Management is an important element in realizing the ambitions. And as Performance Measurement is treated as a tool within performance management (Lardenoije, Raaij, & Weele, 2005; Halachmi, 2005), having a well-established PMS is key. Some PM Procurement managers were not convinced about the consistency of the PMS and the fit with Performance Management. Therefore, to check their proposition and receive recommendations, they preferred an objective analysis and design exercise on their PM.
The formal motivation, from Philips Procurement to initiate this project is the following (by vacancy): “To further develop and follow up on a solid Management dashboard and reporting for the Philips Procurement organization. Currently the definitions of and sources for various Key Performance Indicators (Kpi’s) are too diverse. Within the procurement organization a new governance and transformation team is being established to guide the transformation of the function. A well-defined and clear dashboard is key for this.” (Paul Joosten, vacancy description, 2013).
1.3 PROBLEM STATEMENT AND RESEARCH QUESTIONS
This section draws the focus towards the problem statement. As the previous paragraph indicated the responsible procurement managers wanted to check their PMS, a first quick scan indicated that there proposition might be true. The quick scan revealed that the role and purpose of PM were not clear, and that only a few actions were taken based on the reported performances. The quick scan also revealed a weak link between the measures and the strategic objectives. These observations preliminary supported the proposition of the managers that their PMS was not consistent and well fitted with Performance Management.
PROBLEM ANALYSI S
The problem context and problem mess concerned Performance Management within Procurement. A first observation proposed major improvements could be made, not only on the level of PM, but also on other relating factors to Performance Management. Factors such as cultural issues, behavioral issues, attitudes, reporting structure, how systems were used to manage performance, responsibilities, who uses the measures, and the performance management process itself (Bititci, Carrie, & McDevitt, 1997).
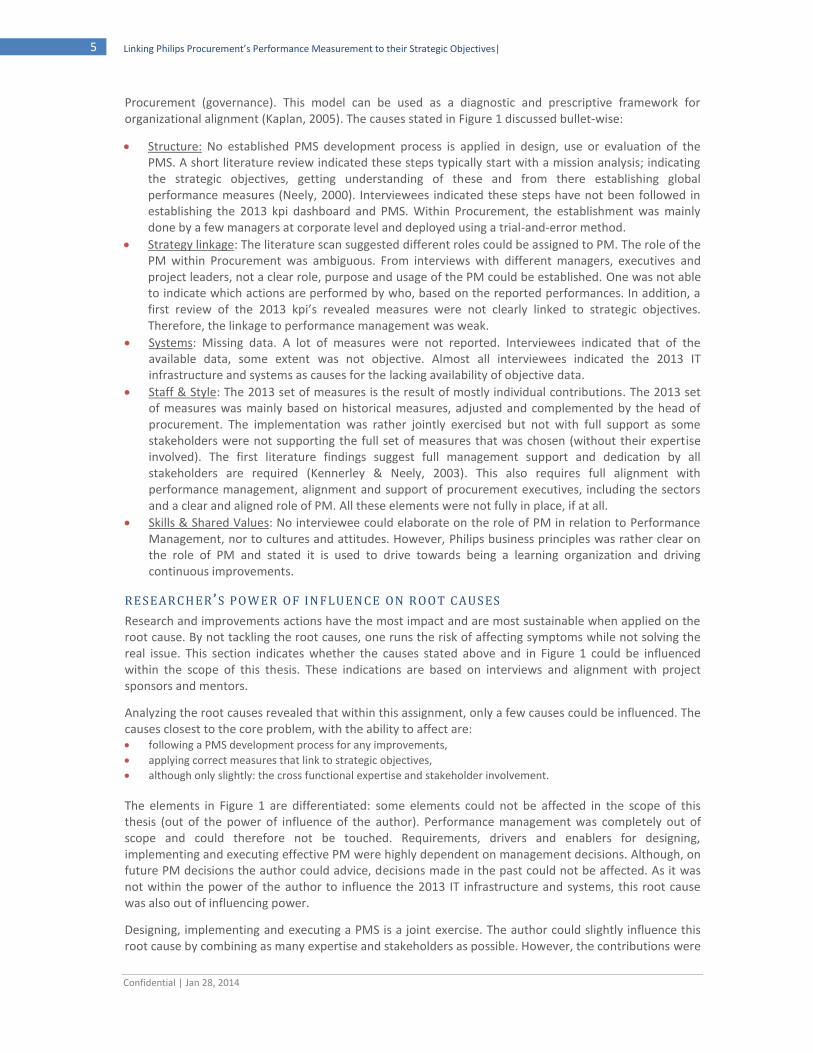
However, the scope of the assignment was explicitly limited to PM, which on itself still left plenty opportunity for research. To illustrate the causes and effect from the problem analysis, a diagram in Figure 1 is derived from the 7s model of McKinsey. The 7s model has a better fit for an organization like Philips
No Effective PM in supporting Performance management
Shared valuesSkillsStaff
Management commitment
Systems: Low feasibility
Variances in definitions
No (accurate) data available
Structure
Gap between procurement coroprate and sectors
Strategy linkage
Weak link between proc strategy and kpi’s
No clear role and purpse for PM
Speed of operations: trial and error
Resistance to transparancy and visibility
Lack of accountability, usage of PM to drive improvements
Ambiguous performance management
Learning organization
Style
Systems and IT not supporting
Unambiguous purpose of measures
Not everyoneinvolved
No clear PMS development process
No interviewee could clearly indicate the role of PM
F IGURE 1: 7S MODEL ,
PROBLEM ANALYSIS
Confidential | Jan 28, 2014
5 Linking Philips Procurement’s Performance Measurement to their Strategic Objectives|
Procurement (governance). This model can be used as a diagnostic and prescriptive framework for organizational alignment (Kaplan, 2005). The causes stated in Figure 1 discussed bullet-wise:
Structure: No established PMS development process is applied in design, use or evaluation of the PMS. A short literature review indicated these steps typically start with a mission analysis; indicating the strategic objectives, getting understanding of these and from there establishing global performance measures (Neely, 2000). Interviewees indicated these steps have not been followed in establishing the 2013 kpi dashboard and PMS. Within Procurement, the establishment was mainly done by a few managers at corporate level and deployed using a trial-and-error method.
Strategy linkage: The literature scan suggested different roles could be assigned to PM. The role of the PM within Procurement was ambiguous. From interviews with different managers, executives and project leaders, not a clear role, purpose and usage of the PM could be established. One was not able to indicate which actions are performed by who, based on the reported performances. In addition, a first review of the 2013 kpi’s revealed measures were not clearly linked to strategic objectives. Therefore, the linkage to performance management was weak.
Systems: Missing data. A lot of measures were not reported. Interviewees indicated that of the available data, some extent was not objective. Almost all interviewees indicated the 2013 IT infrastructure and systems as causes for the lacking availability of objective data.
Staff & Style: The 2013 set of measures is the result of mostly individual contributions. The 2013 set of measures was mainly based on historical measures, adjusted and complemented by the head of procurement. The implementation was rather jointly exercised but not with full support as some stakeholders were not supporting the full set of measures that was chosen (without their expertise involved). The first literature findings suggest full management support and dedication by all stakeholders are required (Kennerley & Neely, 2003). This also requires full alignment with performance management, alignment and support of procurement executives, including the sectors and a clear and aligned role of PM. All these elements were not fully in place, if at all.
Skills & Shared Values: No interviewee could elaborate on the role of PM in relation to Performance Management, nor to cultures and attitudes. However, Philips business principles was rather clear on the role of PM and stated it is used to drive towards being a learning organization and driving continuous improvements.
RES EAR CHER ’S POW ER OF IN FLUEN CE ON ROO T CAUS ES
Research and improvements actions have the most impact and are most sustainable when applied on the root cause. By not tackling the root causes, one runs the risk of affecting symptoms while not solving the real issue. This section indicates whether the causes stated above and in Figure 1 could be influenced within the scope of this thesis. These indications are based on interviews and alignment with project sponsors and mentors.
Analyzing the root causes revealed that within this assignment, only a few causes could be influenced. The causes closest to the core problem, with the ability to affect are: following a PMS development process for any improvements,
applying correct measures that link to strategic objectives,
although only slightly: the cross functional expertise and stakeholder involvement.
The elements in Figure 1 are differentiated: some elements could not be affected in the scope of this thesis (out of the power of influence of the author). Performance management was completely out of scope and could therefore not be touched. Requirements, drivers and enablers for designing, implementing and executing effective PM were highly dependent on management decisions. Although, on future PM decisions the author could advice, decisions made in the past could not be affected. As it was not within the power of the author to influence the 2013 IT infrastructure and systems, this root cause was also out of influencing power.
Designing, implementing and executing a PMS is a joint exercise. The author could slightly influence this root cause by combining as many expertise and stakeholders as possible. However, the contributions were
Confidential | Jan 28, 2014
6 | Introduction
highly dependent on the input and engagement of participants and stakeholders. Nevertheless, this root cause could be slightly affected by the author. In addition, in a suggested design the author could follow a design process provided by literature, apply PMS design requirements and establish correct measures that were linked to strategic objectives.
PROBLEM S TATEMEN T
Philips Procurement pronounced the need to analyze the 2013 PM and make possible recommendations for improvements. This pronunciation implied management is not convinced the 2013 PMS was perfect. Initial observations and interviews confirmed this implication. Therefore, based on the proposition that Philips Procurement did not have an effective performance measurement system, the following problem statement was stated:
“The 2013 PMS does not meet the main requirements set by both purchasing and PM theories to establish, implement and execute effective Performance Measurement, which creates an improvement potential”.
To have increased the impact of the assignment, the objective should have been to establish effective performance management. However, the scope was limited to PM. Even more, from the scope analysis it became clear only a very limited set of causes (symptoms) could be affected and influenced. Analyzing the 2013 PM(S) and making suggestions for improvement is the highest level of impact which could be achieved within this thesis. This problem statement focused on an assignment which is mainly in line with the original assignment descriptions from the vacancy.
RES EAR CH Q UES TION S
Next, the following assignment and research question can be derived. The assignment:
“Analyze the 2013 Procurement KPI dashboard and make suggestions for improvements that are executable for 2014 or are strategic for the future.”
With the Main Research Question:
“Which kpi’s should be incorporated in the Philips Procurement KPI Dashboard, what would their definition be and how should they be measured to give Management a more effective tool in their Performance Management?”
Such that: The indicators relate to the procurement strategy and targets
It supports both a mid-term operational perspective as well a transformation progress perspective
It gives management top-down actionable kpi’s
It follows the principles of a learning organization
An End2End process approach is leading
To answer the main research question, five underlying questions need to be answered. The research question can be split up in five research questions:
1. What does the 2013 Procurement Performance measurement System look like?
2. What is a procurement performance measurement system and what conditions need to be in place to make it
work?
3. What are the problems with the 2013 KPI dashboard?
4. What should be done to improve the procurement performance measurement system?
5. What designs could help to bring improvements?
Confidential | Jan 28, 2014
7 Linking Philips Procurement’s Performance Measurement to their Strategic Objectives|
1.4 RESEARCH METHODOLOGY
Previously, the motivation for this project, the problem description and research question have been defined. Subsequently, this section describes the research methodology.
RES EAR CH TYP E AN D DESI GN
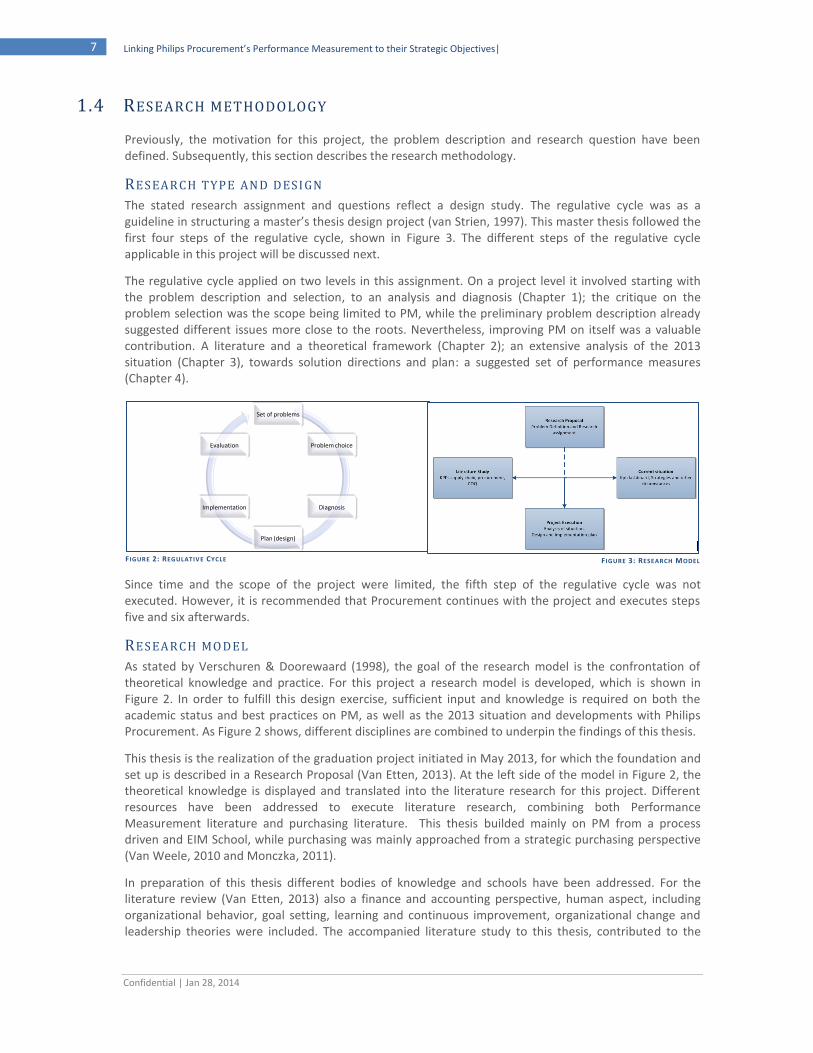
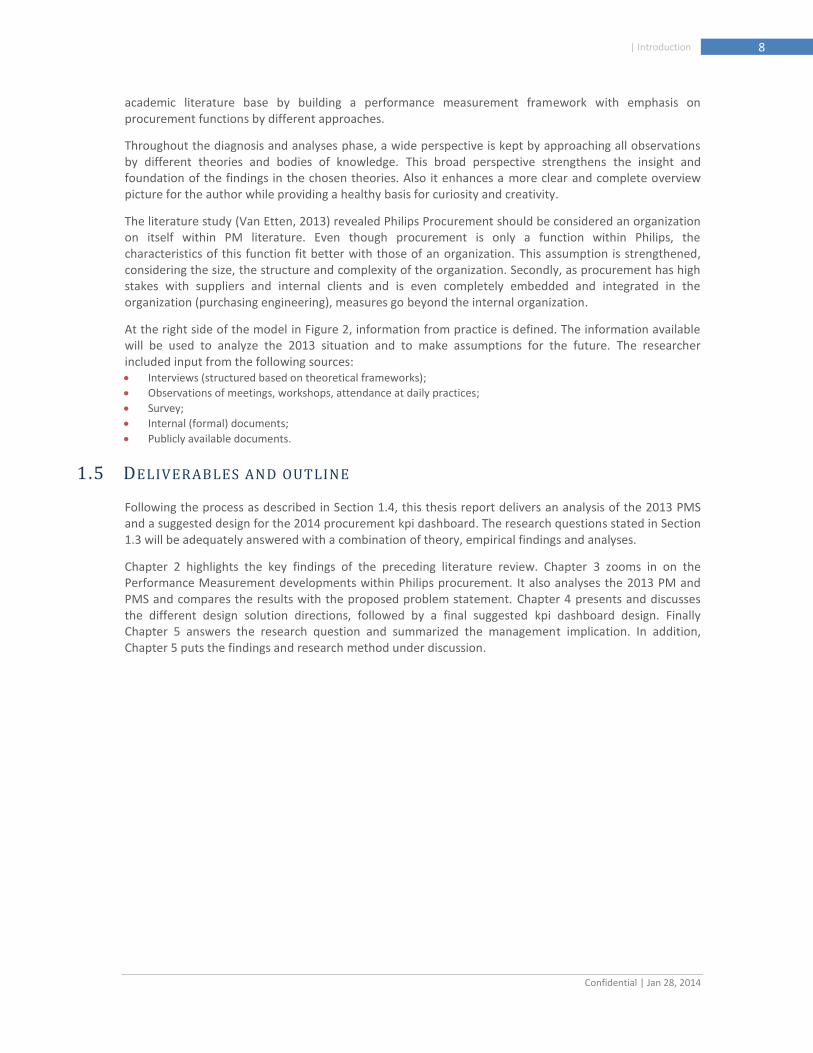
The stated research assignment and questions reflect a design study. The regulative cycle was as a guideline in structuring a master’s thesis design project (van Strien, 1997). This master thesis followed the first four steps of the regulative cycle, shown in Figure 3. The different steps of the regulative cycle applicable in this project will be discussed next.
The regulative cycle applied on two levels in this assignment. On a project level it involved starting with the problem description and selection, to an analysis and diagnosis (Chapter 1); the critique on the problem selection was the scope being limited to PM, while the preliminary problem description already suggested different issues more close to the roots. Nevertheless, improving PM on itself was a valuable contribution. A literature and a theoretical framework (Chapter 2); an extensive analysis of the 2013 situation (Chapter 3), towards solution directions and plan: a suggested set of performance measures (Chapter 4).
Since time and the scope of the project were limited, the fifth step of the regulative cycle was not executed. However, it is recommended that Procurement continues with the project and executes steps five and six afterwards.
RES EAR CH MO DEL
As stated by Verschuren & Doorewaard (1998), the goal of the research model is the confrontation of theoretical knowledge and practice. For this project a research model is developed, which is shown in Figure 2. In order to fulfill this design exercise, sufficient input and knowledge is required on both the academic status and best practices on PM, as well as the 2013 situation and developments with Philips Procurement. As Figure 2 shows, different disciplines are combined to underpin the findings of this thesis.
This thesis is the realization of the graduation project initiated in May 2013, for which the foundation and set up is described in a Research Proposal (Van Etten, 2013). At the left side of the model in Figure 2, the theoretical knowledge is displayed and translated into the literature research for this project. Different resources have been addressed to execute literature research, combining both Performance Measurement literature and purchasing literature. This thesis builded mainly on PM from a process driven and EIM School, while purchasing was mainly approached from a strategic purchasing perspective (Van Weele, 2010 and Monczka, 2011).
In preparation of this thesis different bodies of knowledge and schools have been addressed. For the literature review (Van Etten, 2013) also a finance and accounting perspective, human aspect, including organizational behavior, goal setting, learning and continuous improvement, organizational change and leadership theories were included. The accompanied literature study to this thesis, contributed to the
Set of problems
Problem choice
Diagnosis
Plan (design)
Implementation
Evaluation
F IGURE 2: REGULATIV E CYCLE F IGURE 3: RESEARCH MODEL
Confidential | Jan 28, 2014
8 | Introduction
academic literature base by building a performance measurement framework with emphasis on procurement functions by different approaches.
Throughout the diagnosis and analyses phase, a wide perspective is kept by approaching all observations by different theories and bodies of knowledge. This broad perspective strengthens the insight and foundation of the findings in the chosen theories. Also it enhances a more clear and complete overview picture for the author while providing a healthy basis for curiosity and creativity.
The literature study (Van Etten, 2013) revealed Philips Procurement should be considered an organization on itself within PM literature. Even though procurement is only a function within Philips, the characteristics of this function fit better with those of an organization. This assumption is strengthened, considering the size, the structure and complexity of the organization. Secondly, as procurement has high stakes with suppliers and internal clients and is even completely embedded and integrated in the organization (purchasing engineering), measures go beyond the internal organization.
At the right side of the model in Figure 2, information from practice is defined. The information available will be used to analyze the 2013 situation and to make assumptions for the future. The researcher included input from the following sources: Interviews (structured based on theoretical frameworks);
Observations of meetings, workshops, attendance at daily practices;
Survey;
Internal (formal) documents;
Publicly available documents.
1.5 DELIVERABLES AND OUTLINE
Following the process as described in Section 1.4, this thesis report delivers an analysis of the 2013 PMS and a suggested design for the 2014 procurement kpi dashboard. The research questions stated in Section 1.3 will be adequately answered with a combination of theory, empirical findings and analyses.
Chapter 2 highlights the key findings of the preceding literature review. Chapter 3 zooms in on the Performance Measurement developments within Philips procurement. It also analyses the 2013 PM and PMS and compares the results with the proposed problem statement. Chapter 4 presents and discusses the different design solution directions, followed by a final suggested kpi dashboard design. Finally Chapter 5 answers the research question and summarized the management implication. In addition, Chapter 5 puts the findings and research method under discussion.

Confidential | Jan 28, 2014
9 Linking Philips Procurement’s Performance Measurement to their Strategic Objectives|

Confidential | Jan 28, 2014
10 | 2. Literature review: Performance Measurement for purchasing’s top management
2. LITERATURE REVIEW : PERFORMANCE MEASUREMENT FOR
PURCHASING ’S TOP MANAGEMENT
The design of a performance measure is a process. Input, in the form of requirements are captured, and an output, in the form of a performance” (Neely A. , Richards, Mills, Platts, & Bourne, 1997)
To provide an academic foundation to this thesis, a literature study was conducted titled: Towards a Performance Measurement framework for Philips Procurement (Van Etten, 2013). The literature study served the purpose of being an introduction paper and establishing a point of reference and secondly, providing a framework for reviewing and designing the kpi Dashboard within the organization of interest.
From different schools, major research contributions have been made to describe the design of Performance Measurement, resulting in an extensive literature base. This chapter summarizes the key findings from leading authors from the proceeding literature review, resulting in a theoretical framework for designing PM in a purchasing function of a diversified multinational organization like Philips Procurement. This chapter contributes to answering:
Research question 2: “What is a procurement performance measurement system and what conditions need to be in place to make it work?”
This section starts with emphasizing the purpose and deliverables of the literature review, addresses the bodies of knowledge, the accompanied definitions and accordingly highlights the history and most important developments. From there, the requirements for the theoretical framework are identified. Following, the leading models within the scope of the purpose are introduced and a review and analysis templates derived. The result of this section is the introduction of a theoretical framework leading for this research.
2.1 PURPOSE AND DELIVERAB LES OF LITERATURE REVIEW
The purpose of this literature review was threefold: This review answered the third research question, to know: “What is a procurement performance measurement system and what conditions need to be in place to make it work?” Secondly, it had to provide a framework for reviewing, designing and analysis of kpi’s and kpi dashboard (PM and PMS) for executives as part of performance measurement. In addition, as the scope of this assignment focussed on Performance measurement within procurement, the third purpose of this review was to provide the necessary purchasing theory to support the purchasing performances.
To fulfill the purposes and deliverables stated, a number of bodies of knowledge has been addressed. For the purchasing insight, the work of leading authors as van Weele (2010), Monczka & Handfield (2011) was included. These authors made a substantive contribution to the purchasing and supply knowledge. In addition, these authors contributed to PM within purchasing and supply. However, as their main research scope is on a variety of purchasing and supply contributions, their contributions on PM give great insights and hands-on implications, but not enough up-to-date academic rigor for reviewing, designing and analysis of PM. For that aspect, leading authors on PM were included. Reviewing the 2013 PM literature, revealed leading authors on PM are Neely, Eccles, Bititci and Bourne. Most of these authors are linked to the Cambridge University. Authors from this institute devoted a lot of research to Performance measurement and are by many authors indicated as leading on PM (Pun & White, 2005). These leading authors follow a strong EIM (Enterprise Information Management) approach, which suits the intended process driven approach of this thesis perfectly.
Confidential | Jan 28, 2014
11 Linking Philips Procurement’s Performance Measurement to their Strategic Objectives|
2.2 DEFINITIONS
Most measures relating to performance can be categorized as an effectiveness or efficiency measure (Handfield et al, 2011; Van Weele, 2010). That has not changed much over time as traditionally, performance measures have been seen as a means of quantifying the efficiency and effectiveness of action (Flapper et al, 1996). Both Van Weele (2010) and Neely (1995) have stated clear definitions on Performance Measurement and Performance Measurement System. According to Neely (1995): ”Performance measurement can be defined as the process of quantifying the efficiency and effectiveness of action. A performance measure can be defined as a metric used to quantify the efficiency and/or effectiveness of an action.”
His definition might suggest that PM provides only feedback on a set action and is being applied for backward looking. However, his research contributions do imply a continuous management action loop. Van Weele (2005) does include this loop more explicitly by stating: “PM is the process of quantifying the efficiency and effectiveness of actions, in order to compare results against expectations, with the intent to motivate, guide and improve decision making” (Van Weele et al, 2005).
Next to performance measurement, literature uses the term performance measurement system (PMS). A PMS is the set of metrics used to quantify both the efficiency and effectiveness of actions (Neely; Gregory; Platts, 1995). Five main functions which, according to Van Weele et al. (2005) a PMS should address are:
1. Assessing, managing and improving performance, on all relevant factors (financial and non-financial) that drive profitability (Butler et al., 1997).
2. Strategy formulation and clarification (Kaplan & Norton, 1996; De Haas & Kleingeld, 1999). 3. Enhancing strategic dialogue (De Haas & Kleingeld, 1999; Bessire & Baker, 2004; Neely, 1999). 4. Improving decision making and prioritizing (Kennerley & Neely, 2002). 5. Stimulating motivation and learning (Dumond, 1994; Rouse & Putterill, 2003).
The Cambridge school did research on the dominating role of PM across different continents. They found that the dominating roles differ from “aligning employee behavior” (43.4%) in Japan and (36.6%) in the US. The other dominating role is Performance assessment (36.6%) in the UK to (77.6%) in China (Neely et al, 2007). Section 2.4 will continue on the role of PM.
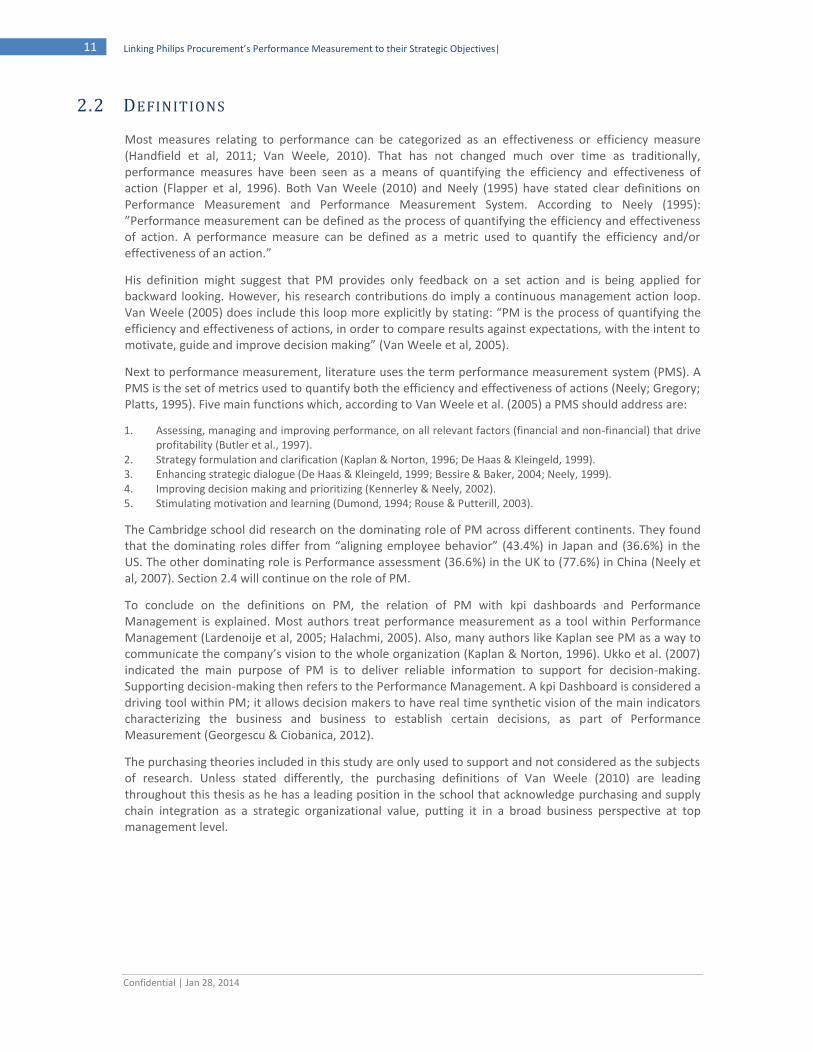
To conclude on the definitions on PM, the relation of PM with kpi dashboards and Performance Management is explained. Most authors treat performance measurement as a tool within Performance Management (Lardenoije et al, 2005; Halachmi, 2005). Also, many authors like Kaplan see PM as a way to communicate the company’s vision to the whole organization (Kaplan & Norton, 1996). Ukko et al. (2007) indicated the main purpose of PM is to deliver reliable information to support for decision-making. Supporting decision-making then refers to the Performance Management. A kpi Dashboard is considered a driving tool within PM; it allows decision makers to have real time synthetic vision of the main indicators characterizing the business and business to establish certain decisions, as part of Performance Measurement (Georgescu & Ciobanica, 2012).
The purchasing theories included in this study are only used to support and not considered as the subjects of research. Unless stated differently, the purchasing definitions of Van Weele (2010) are leading throughout this thesis as he has a leading position in the school that acknowledge purchasing and supply chain integration as a strategic organizational value, putting it in a broad business perspective at top management level.
Confidential | Jan 28, 2014
12 | 2. Literature review: Performance Measurement for purchasing’s top management
2.3 HISTORY AND DEVELOPMENTS OF PM WITH EMPHASIZES ON PURCHASING
Historically, measuring and evaluating performances had certain problems and limitations (Handfield, et al, 2011). Nevertheless still today, measuring performance and achieving the objective is not easy, and most practices are far from perfect (Neely, et al, 2007; Barret, 2004). Following from the work of Neely (1999), according to Chandler (1977), already in 1910 the basic methods for managing a business today, were in place. And in 1962, Barnard acknowledged the importance of performance measures being an integral part of the planning and control cycle (Neely, 1999). In 1931, the National Association of Purchasing Agents (NAPA) organized a best paper contest on the subject of purchasing performance measurement (Lardenoije, et al, 2005).
During the 80s, the work of Monczka, Carter & Hoagland (1979) and Van Weele (1984) gained renewed interest in the subject of purchasing’s’ Performance Measurement (Lardenoije, et al, 2005). So, if this topic is of interest for over 100 years and the basics were known in 1910, why are then still so many problems with performance measures used by organizations today (Neely, 1999)?
FROM T R ADI TION AL MEAS UR ES TO EFFECTIV E ST R AT EGY EXECUTIO N : EVO LUTION
For decades, financial measures such as profit and return on investment have been prominent parameters of performances (Ghalayini & Noble, 1996; Lardenoije et al, 2005; Neely, 1999). The focus used to be mainly on these tangible and lagging indicators. This was due to a focus and a measuring basis by management accounting. In the 70s and 80s, authors started to express a dissatisfaction with this traditional backward looking accounting based PMS (Bourne, et al, 2000).
Although some academics in the early 80s realized that due to changing circumstances like complexity and competing markets, financial measures were no longer appropriate (Lardenoije, et al, 2005), a real change occurred in the late 1980s (Bourne, 2008) or early 90s (Bourne, et al, 2000). Some even call this change a revolution (Eccles, 1991; Neely & Bourne, 2000; Lardenoije, et al, 2005; Nudurupati, et al, 2011). As organizations acknowledged they were failing to achieve their desired results, a shift was made towards a more integrated and strategy linked performance measurement system (Srivastava & Sushil, 2013). Eccles (1991) described the occurrence of a radical shift from treating financial figures as the basis for performance measurement towards a broader set of measures.
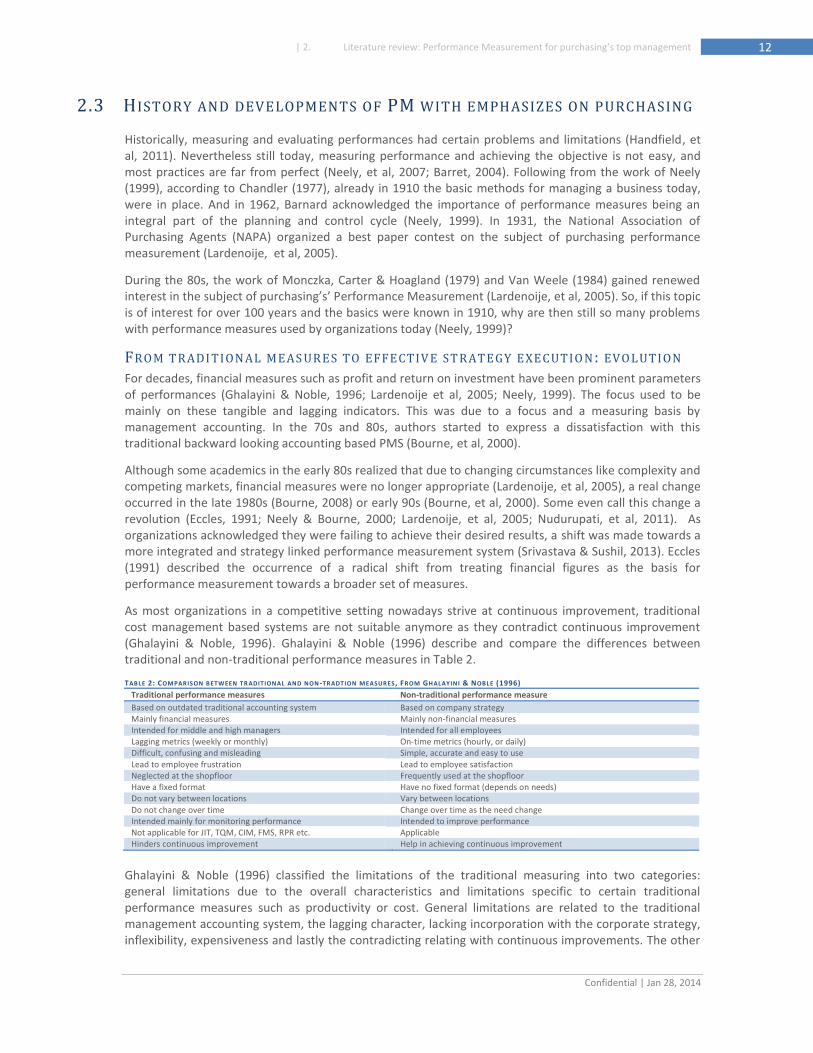
As most organizations in a competitive setting nowadays strive at continuous improvement, traditional cost management based systems are not suitable anymore as they contradict continuous improvement (Ghalayini & Noble, 1996). Ghalayini & Noble (1996) describe and compare the differences between traditional and non-traditional performance measures in Table 2.
TABLE 2: COMPARISON BETWEEN TR ADITIONAL AND NON -TRADTION MEASURES , FROM GHALAYINI & NOBLE (1996)
Traditional performance measures Non-traditional performance measure
Based on outdated traditional accounting system Based on company strategy Mainly financial measures Mainly non-financial measures Intended for middle and high managers Intended for all employees Lagging metrics (weekly or monthly) On-time metrics (hourly, or daily) Difficult, confusing and misleading Simple, accurate and easy to use Lead to employee frustration Lead to employee satisfaction Neglected at the shopfloor Frequently used at the shopfloor Have a fixed format Have no fixed format (depends on needs) Do not vary between locations Vary between locations Do not change over time Change over time as the need change Intended mainly for monitoring performance Intended to improve performance Not applicable for JIT, TQM, CIM, FMS, RPR etc. Applicable Hinders continuous improvement Help in achieving continuous improvement
Ghalayini & Noble (1996) classified the limitations of the traditional measuring into two categories: general limitations due to the overall characteristics and limitations specific to certain traditional performance measures such as productivity or cost. General limitations are related to the traditional management accounting system, the lagging character, lacking incorporation with the corporate strategy, inflexibility, expensiveness and lastly the contradicting relating with continuous improvements. The other
Confidential | Jan 28, 2014
13 Linking Philips Procurement’s Performance Measurement to their Strategic Objectives|
limitations of specific traditional performance measures are the excessively focus on efficiency and productivity costs, detracting attention on improvements and other strategic topics. Last limitation is the cost focus. Although cost reductions are very useful in a competitive context, lots of customers demand other competitive advantages like quality, reliability, speed and service (Ghalayini & Noble, 1996).
New strategies and competitive realities demand for shifting from these financial figures towards a broader set of measurements (Eccles, 1991); Non-financial measures such as quality, customer satisfaction, on time delivery, innovation measures, and on the attainment of strategic objectives (Lambert, 2001). Even more, Lambert (2001) indicated that using the wrong measures, like these traditional accounting performance measures motivate “dysfunctional behavior”, due to the focus by management. This could be corrected by introducing alternative measures (Abernethy, Bouwens, & Lent, not published yet) which should not be preferred as it increases the number of metrics. An increase in the number of metrics will result in detraction to the real objectives due to the limited focus of people (Lambert, 2001).
GAP BETW EEN PM AND EFFECTIV E STR AT E GY EX ECUTION
Srivatava & Sushil (2013) state there is still a gap between performance measurement systems and effective strategy execution. They conclude there is a missing link between measuring and managing the right things, i.e. “strategic performance factors” (SPFs). Their study argues that organizations should go beyond operational measures (both financial and non-financial) and also focus on structural relationship among the SPFs such as situation and actors, which actually leads to the other SPFs (Srivastava & Sushil, 2013).
Some of the most common shortcomings in practice on performance measures are (Neely, et al., 2007): Measurements are still tactical, not strategic; Financial measures still dominate; Delivering the vision of enterprise performance management: The execution gap; The enabling structure and knowing what success constitutes.
A DYN AMI C PMS
Both Neely (2005) and Ghalayini & Noble (1996) acknowledge there still is a need for an integrated dynamic performance measurement system. Dynamic measurement systems, instead of static, “ensure an appropriate focus on enterprise performance management, rather than simple performance measurement” (Neely, 2005). A system that contains (Ghalayini & Noble, 1996):
A clearly defined set of improvement areas and associated performance measures that are related to the company strategy and objectives;
Stresses the role of time as a strategic performance measure;
Allows dynamic updating of the improvement areas, performance measures and performance measures standards;
Links the areas of improvement and performance measurement to the factory shop floor;
Is used as an improvement tool rather than just a monitoring and controlling tool;
Considers process improvements efforts as a basic integrated part of the system;
Utilizes any improvements in performance (i.e. going beyond just achieving improvement and actively planning for the utilization of benefits from an overall company perspective);
Uses historical data of the company to set improvement objectives and to help achieve such objectives;
Guards against sub-optimization; and provides practical tools that could be used to achieve all of the above
PERFO R MAN CE MEAS UR EME NT R ES EAR CH IN T HE F UT UR E :
Performance measurement is high on many management agenda’s (Neely, 1999). The increased interest over the last 30 years, both from academics and practitioners, combined with the technological developments raises expectations around performance measurement of being a rather matured research subject. However, Bourne (2008) concluded that performance measurement is still far from a matured subject, both as a research subject as well in practice. He states that in the academic world too little attention is paid to longitudinal studies showing the actual effects of performance measurement and in
Confidential | Jan 28, 2014
14 | 2. Literature review: Performance Measurement for purchasing’s top management
practice a variety of academic developments has not been accepted in practice (Bourne, 2008). There is a substantial research agenda and while many substantive questions yet need to be answered, there is only a limited set of influential works (Neely, 2005).
In addition, within the performance measurement literature base only a fraction of attention is devoted on performance measurement for procurement functions, let alone performance measurement for a procurement function approached from different perspectives. Different authors like Knudsen (2003), Van Weele (1984, 2010), (Wynstra, et al., 1999), Axelson (1999) and Buxmann et al. (2008) emphasized the importance and alignment of purchasing within any supply chain process. Also, different well reputed authors approached the importance of performance measurement for procurement, but contributed by studying only from a general point like the work of Lardenoije et al. (2005) or very specific point of view like a strategic alignment in the work of Neely et al. (1994). Or as Bourne (2008) addresses, the big-pictures problems are not addressed through academic research. Van Weele (2010, p316) addresses the need for future research on strategic measures for purchasing.
Over the last decade a substantial contribution has been made to the performance measurement agenda. The questions yet to be answered according to Neely (2005) are:
How to design and deploy enterprise performance management rather than measurement systems?
How to measure performance across supply chains and networks rather than within organizations?
How to measure intangible as well as tangible assets for external disclosure as well as internal management?
How to develop dynamic rather than static measurement systems?
How to enhance the flexibility of measurement systems so they can cope with organizational changes.
Concerning the second question of Neely (2005), he indicates the academic world has not yet found an answer on how to measure outside the organization. One, the procurement function of Philips can and should be considered an organization on itself. This is a valid argument considering the size, organizational structure and diversity of the organization. Secondly, as procurement has high stakes with suppliers and internal clients and is even completely embedded and integrated in the organization (purchasing engineering), measures go beyond the internal organization.
Same for question three; how to create closure on measures both internal and external. As this is already hard for traditional tangible measures, this suggests being even more complicated for intangible measures. So, although literature suggests to use dynamic PMS with a complete view including both tangible and intangible measures, linked to the strategic objectives, literature also confirms the gaps on validated approached and best practices to realize these objectives (Bourne, 2008).
2.4 TOWARDS A PERFORMANCE MEASUREMENT FOR PURCHASING
Before going into more detail on performance measurement for purchasing, the role and position of PM for purchasing is examined. Starting with the role of PM within a purchasing environment, followed by key measurement areas and closing with a suitable PM for purchasing.
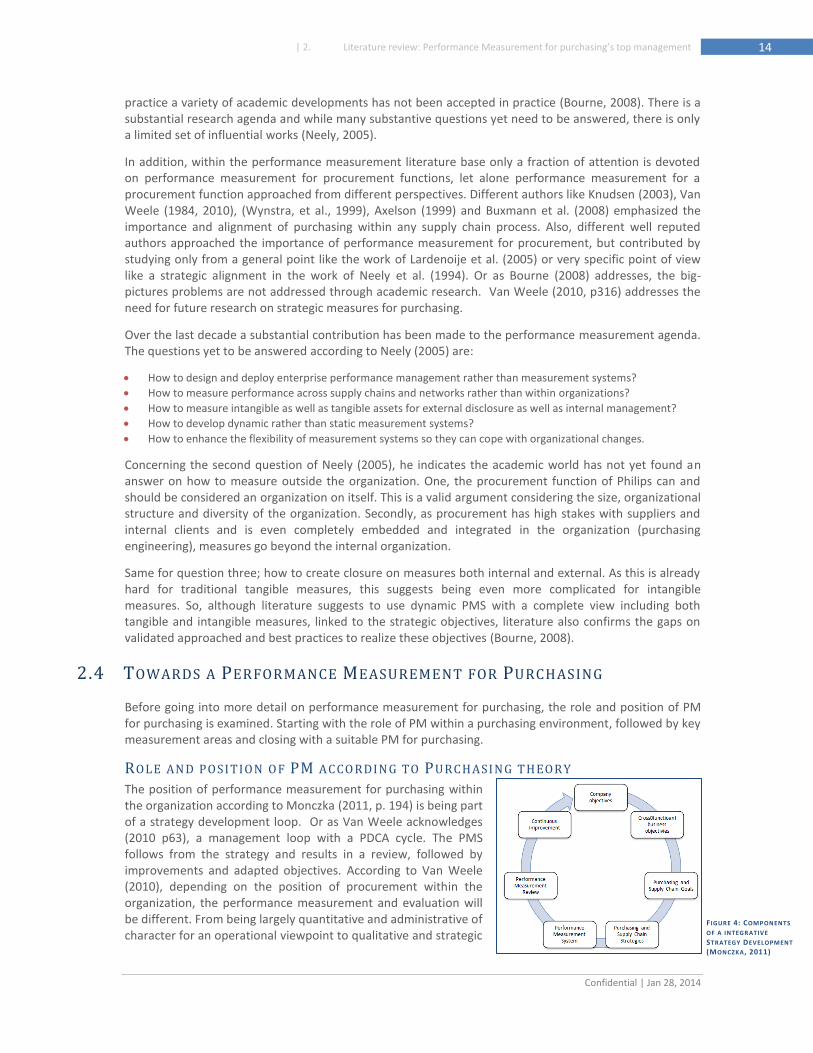
ROLE AN D POSI TION O F PM ACCO RDIN G TO PURCHASI NG T HEOR Y
The position of performance measurement for purchasing within the organization according to Monczka (2011, p. 194) is being part of a strategy development loop. Or as Van Weele acknowledges (2010 p63), a management loop with a PDCA cycle. The PMS follows from the strategy and results in a review, followed by improvements and adapted objectives. According to Van Weele (2010), depending on the position of procurement within the organization, the performance measurement and evaluation will be different. From being largely quantitative and administrative of character for an operational viewpoint to qualitative and strategic
F IGURE 4: COMPONENTS
OF A INTEGR ATIVE
STRATEGY DEVELOPMENT
(MONCZKA, 2011)
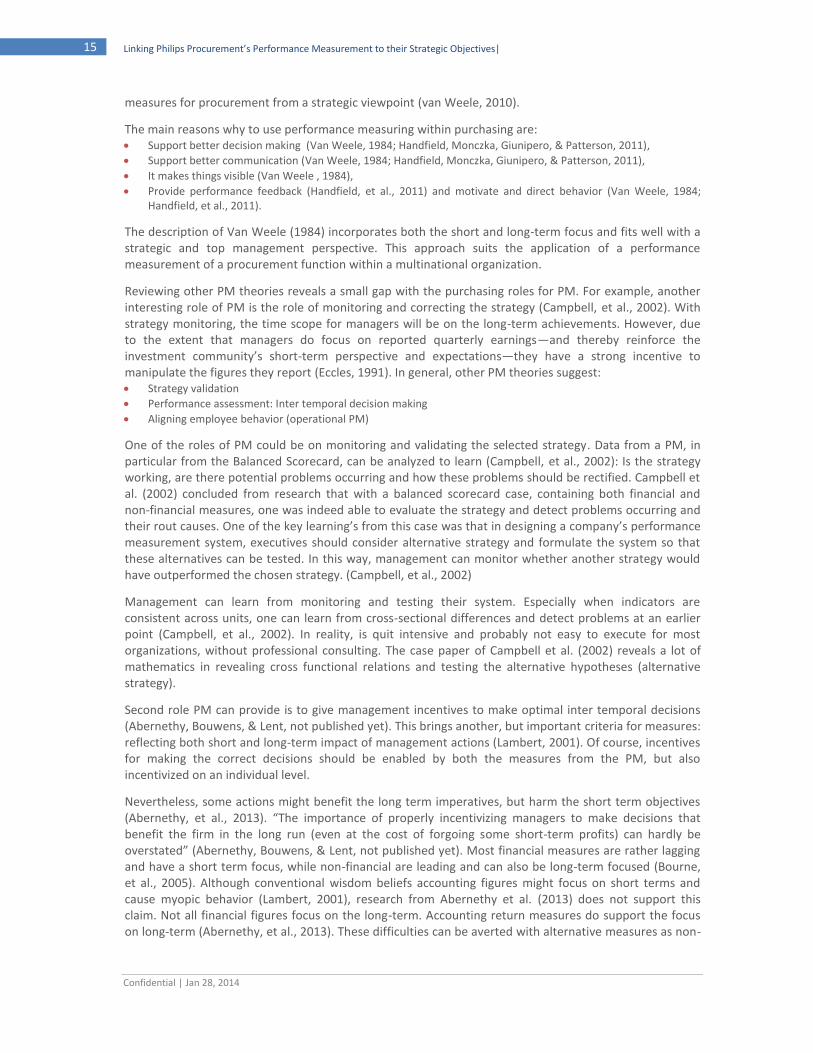
Confidential | Jan 28, 2014
15 Linking Philips Procurement’s Performance Measurement to their Strategic Objectives|
measures for procurement from a strategic viewpoint (van Weele, 2010).
The main reasons why to use performance measuring within purchasing are: Support better decision making (Van Weele, 1984; Handfield, Monczka, Giunipero, & Patterson, 2011),
Support better communication (Van Weele, 1984; Handfield, Monczka, Giunipero, & Patterson, 2011),
It makes things visible (Van Weele , 1984),
Provide performance feedback (Handfield, et al., 2011) and motivate and direct behavior (Van Weele, 1984; Handfield, et al., 2011).
The description of Van Weele (1984) incorporates both the short and long-term focus and fits well with a strategic and top management perspective. This approach suits the application of a performance measurement of a procurement function within a multinational organization.
Reviewing other PM theories reveals a small gap with the purchasing roles for PM. For example, another interesting role of PM is the role of monitoring and correcting the strategy (Campbell, et al., 2002). With strategy monitoring, the time scope for managers will be on the long-term achievements. However, due to the extent that managers do focus on reported quarterly earnings—and thereby reinforce the investment community’s short-term perspective and expectations—they have a strong incentive to manipulate the figures they report (Eccles, 1991). In general, other PM theories suggest: Strategy validation
Performance assessment: Inter temporal decision making
Aligning employee behavior (operational PM)
One of the roles of PM could be on monitoring and validating the selected strategy. Data from a PM, in particular from the Balanced Scorecard, can be analyzed to learn (Campbell, et al., 2002): Is the strategy working, are there potential problems occurring and how these problems should be rectified. Campbell et al. (2002) concluded from research that with a balanced scorecard case, containing both financial and non-financial measures, one was indeed able to evaluate the strategy and detect problems occurring and their rout causes. One of the key learning’s from this case was that in designing a company’s performance measurement system, executives should consider alternative strategy and formulate the system so that these alternatives can be tested. In this way, management can monitor whether another strategy would have outperformed the chosen strategy. (Campbell, et al., 2002)
Management can learn from monitoring and testing their system. Especially when indicators are consistent across units, one can learn from cross-sectional differences and detect problems at an earlier point (Campbell, et al., 2002). In reality, is quit intensive and probably not easy to execute for most organizations, without professional consulting. The case paper of Campbell et al. (2002) reveals a lot of mathematics in revealing cross functional relations and testing the alternative hypotheses (alternative strategy).
Second role PM can provide is to give management incentives to make optimal inter temporal decisions (Abernethy, Bouwens, & Lent, not published yet). This brings another, but important criteria for measures: reflecting both short and long-term impact of management actions (Lambert, 2001). Of course, incentives for making the correct decisions should be enabled by both the measures from the PM, but also incentivized on an individual level.
Nevertheless, some actions might benefit the long term imperatives, but harm the short term objectives (Abernethy, et al., 2013). “The importance of properly incentivizing managers to make decisions that benefit the firm in the long run (even at the cost of forgoing some short-term profits) can hardly be overstated” (Abernethy, Bouwens, & Lent, not published yet). Most financial measures are rather lagging and have a short term focus, while non-financial are leading and can also be long-term focused (Bourne, et al., 2005). Although conventional wisdom beliefs accounting figures might focus on short terms and cause myopic behavior (Lambert, 2001), research from Abernethy et al. (2013) does not support this claim. Not all financial figures focus on the long-term. Accounting return measures do support the focus on long-term (Abernethy, et al., 2013). These difficulties can be averted with alternative measures as non-
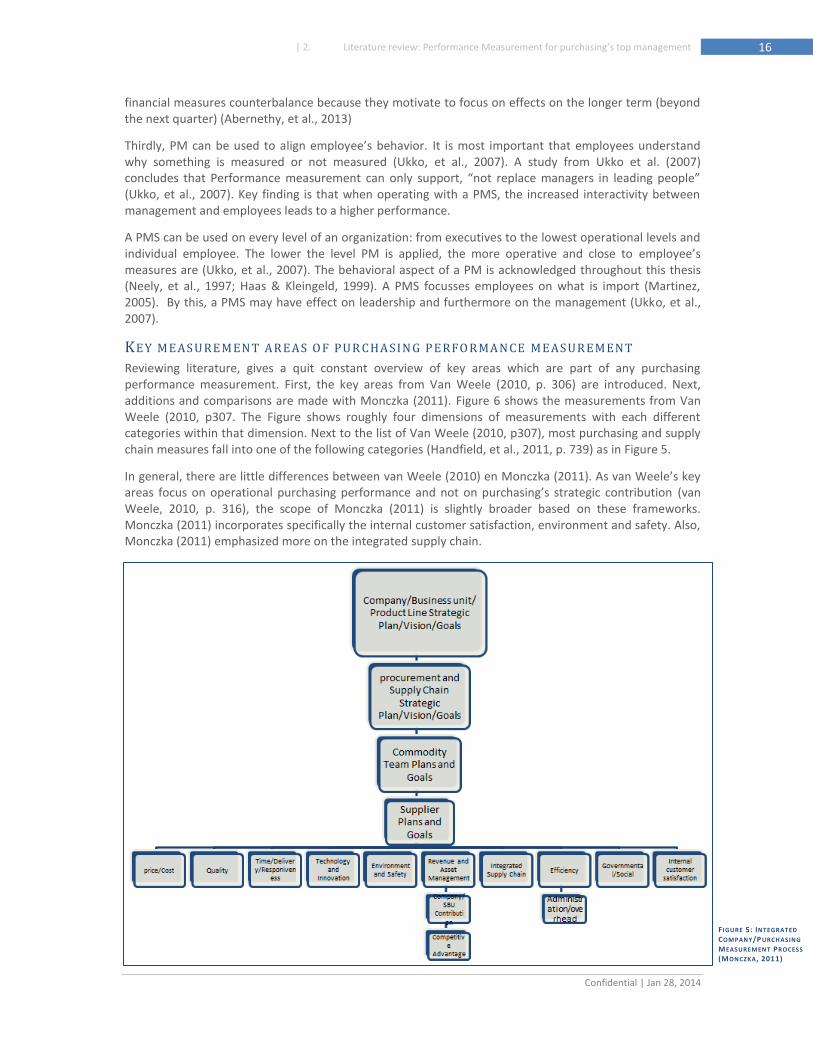
Confidential | Jan 28, 2014
16 | 2. Literature review: Performance Measurement for purchasing’s top management
financial measures counterbalance because they motivate to focus on effects on the longer term (beyond the next quarter) (Abernethy, et al., 2013)
Thirdly, PM can be used to align employee’s behavior. It is most important that employees understand why something is measured or not measured (Ukko, et al., 2007). A study from Ukko et al. (2007) concludes that Performance measurement can only support, “not replace managers in leading people” (Ukko, et al., 2007). Key finding is that when operating with a PMS, the increased interactivity between management and employees leads to a higher performance.
A PMS can be used on every level of an organization: from executives to the lowest operational levels and individual employee. The lower the level PM is applied, the more operative and close to employee’s measures are (Ukko, et al., 2007). The behavioral aspect of a PM is acknowledged throughout this thesis (Neely, et al., 1997; Haas & Kleingeld, 1999). A PMS focusses employees on what is import (Martinez, 2005). By this, a PMS may have effect on leadership and furthermore on the management (Ukko, et al., 2007).
KEY MEAS UREMEN T AR EAS O F PUR CHASIN G P ERFO R MAN CE MEAS UR EMENT
Reviewing literature, gives a quit constant overview of key areas which are part of any purchasing performance measurement. First, the key areas from Van Weele (2010, p. 306) are introduced. Next, additions and comparisons are made with Monczka (2011). Figure 6 shows the measurements from Van Weele (2010, p307. The Figure shows roughly four dimensions of measurements with each different categories within that dimension. Next to the list of Van Weele (2010, p307), most purchasing and supply chain measures fall into one of the following categories (Handfield, et al., 2011, p. 739) as in Figure 5.
In general, there are little differences between van Weele (2010) en Monczka (2011). As van Weele’s key areas focus on operational purchasing performance and not on purchasing’s strategic contribution (van Weele, 2010, p. 316), the scope of Monczka (2011) is slightly broader based on these frameworks. Monczka (2011) incorporates specifically the internal customer satisfaction, environment and safety. Also, Monczka (2011) emphasized more on the integrated supply chain.
F IGURE 5: INTEGRATED
COMPANY/P URCHASING
MEASUREMENT PROCESS
(MONCZKA, 2011)
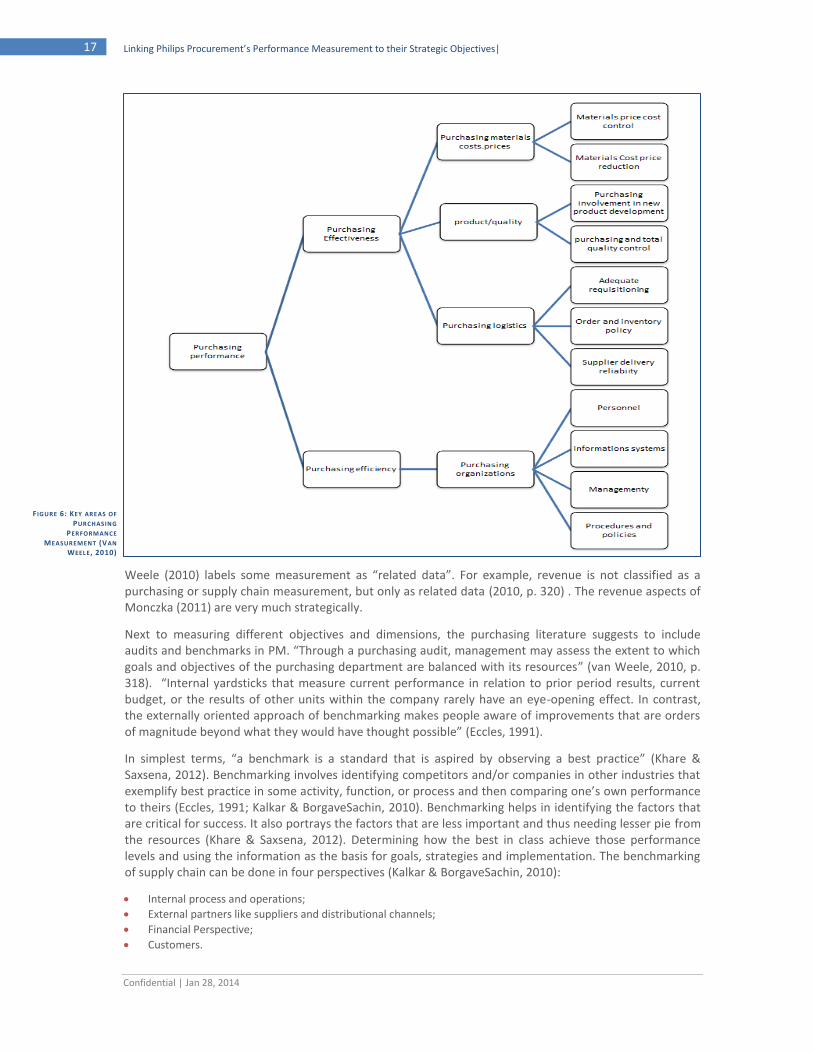
Confidential | Jan 28, 2014
17 Linking Philips Procurement’s Performance Measurement to their Strategic Objectives|
Weele (2010) labels some measurement as “related data”. For example, revenue is not classified as a purchasing or supply chain measurement, but only as related data (2010, p. 320) . The revenue aspects of Monczka (2011) are very much strategically.
Next to measuring different objectives and dimensions, the purchasing literature suggests to include audits and benchmarks in PM. “Through a purchasing audit, management may assess the extent to which goals and objectives of the purchasing department are balanced with its resources” (van Weele, 2010, p. 318). “Internal yardsticks that measure current performance in relation to prior period results, current budget, or the results of other units within the company rarely have an eye-opening effect. In contrast, the externally oriented approach of benchmarking makes people aware of improvements that are orders of magnitude beyond what they would have thought possible” (Eccles, 1991).
In simplest terms, “a benchmark is a standard that is aspired by observing a best practice” (Khare & Saxsena, 2012). Benchmarking involves identifying competitors and/or companies in other industries that exemplify best practice in some activity, function, or process and then comparing one’s own performance to theirs (Eccles, 1991; Kalkar & BorgaveSachin, 2010). Benchmarking helps in identifying the factors that are critical for success. It also portrays the factors that are less important and thus needing lesser pie from the resources (Khare & Saxsena, 2012). Determining how the best in class achieve those performance levels and using the information as the basis for goals, strategies and implementation. The benchmarking of supply chain can be done in four perspectives (Kalkar & BorgaveSachin, 2010):
Internal process and operations;
External partners like suppliers and distributional channels;
Financial Perspective;
Customers.
F IGURE 6: KEY AREAS OF
PURCHASING
PERFORMANCE
MEASUREMENT (VAN
WEEL E, 2010)
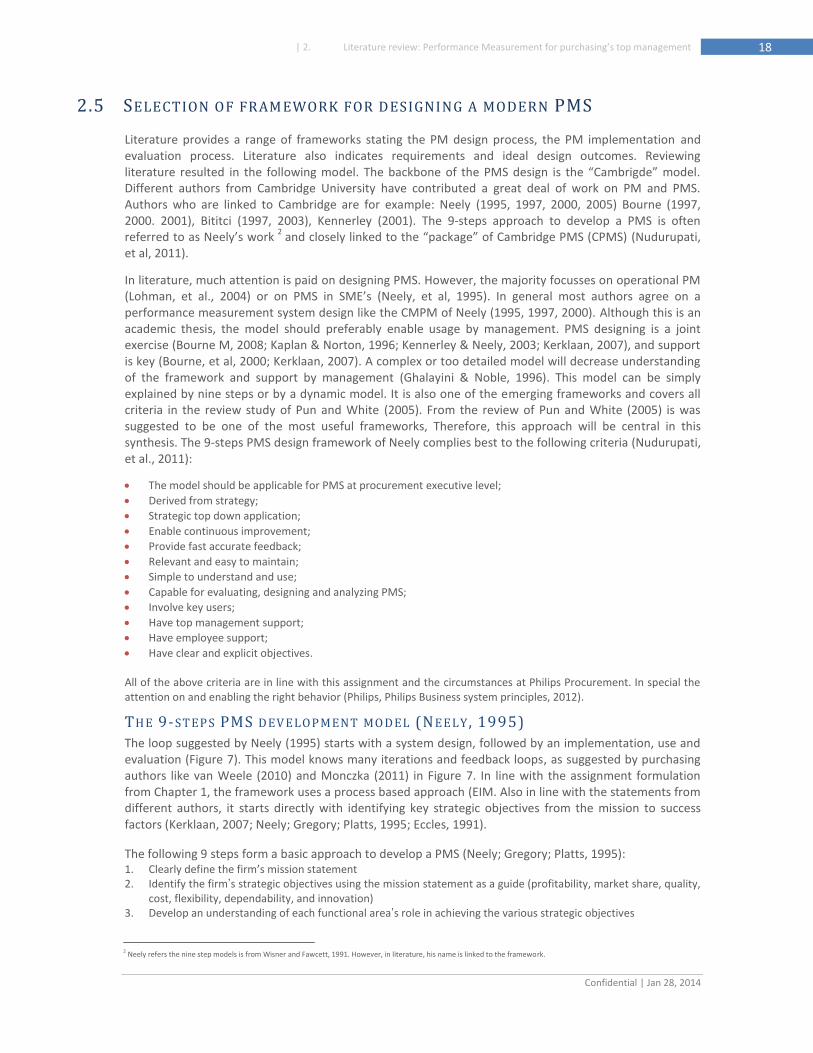
Confidential | Jan 28, 2014
18 | 2. Literature review: Performance Measurement for purchasing’s top management
2.5 SELECTION OF FRAM EWORK FOR DESIGNING A MODERN PMS
Literature provides a range of frameworks stating the PM design process, the PM implementation and evaluation process. Literature also indicates requirements and ideal design outcomes. Reviewing literature resulted in the following model. The backbone of the PMS design is the “Cambrigde” model. Different authors from Cambridge University have contributed a great deal of work on PM and PMS. Authors who are linked to Cambridge are for example: Neely (1995, 1997, 2000, 2005) Bourne (1997, 2000. 2001), Bititci (1997, 2003), Kennerley (2001). The 9-steps approach to develop a PMS is often referred to as Neely’s work
2 and closely linked to the “package” of Cambridge PMS (CPMS) (Nudurupati,
et al, 2011).
In literature, much attention is paid on designing PMS. However, the majority focusses on operational PM (Lohman, et al., 2004) or on PMS in SME’s (Neely, et al, 1995). In general most authors agree on a performance measurement system design like the CMPM of Neely (1995, 1997, 2000). Although this is an academic thesis, the model should preferably enable usage by management. PMS designing is a joint exercise (Bourne M, 2008; Kaplan & Norton, 1996; Kennerley & Neely, 2003; Kerklaan, 2007), and support is key (Bourne, et al, 2000; Kerklaan, 2007). A complex or too detailed model will decrease understanding of the framework and support by management (Ghalayini & Noble, 1996). This model can be simply explained by nine steps or by a dynamic model. It is also one of the emerging frameworks and covers all criteria in the review study of Pun and White (2005). From the review of Pun and White (2005) is was suggested to be one of the most useful frameworks, Therefore, this approach will be central in this synthesis. The 9-steps PMS design framework of Neely complies best to the following criteria (Nudurupati, et al., 2011):
The model should be applicable for PMS at procurement executive level;
Derived from strategy;
Strategic top down application;
Enable continuous improvement;
Provide fast accurate feedback;
Relevant and easy to maintain;
Simple to understand and use;
Capable for evaluating, designing and analyzing PMS;
Involve key users;
Have top management support;
Have employee support;
Have clear and explicit objectives. All of the above criteria are in line with this assignment and the circumstances at Philips Procurement. In special the attention on and enabling the right behavior (Philips, Philips Business system principles, 2012).
THE 9-ST EP S PMS DEV ELOP MENT MO DEL (NEELY , 1995)
The loop suggested by Neely (1995) starts with a system design, followed by an implementation, use and evaluation (Figure 7). This model knows many iterations and feedback loops, as suggested by purchasing authors like van Weele (2010) and Monczka (2011) in Figure 7. In line with the assignment formulation from Chapter 1, the framework uses a process based approach (EIM. Also in line with the statements from different authors, it starts directly with identifying key strategic objectives from the mission to success factors (Kerklaan, 2007; Neely; Gregory; Platts, 1995; Eccles, 1991).
The following 9 steps form a basic approach to develop a PMS (Neely; Gregory; Platts, 1995): 1. Clearly define the firm’s mission statement 2. Identify the firm’s strategic objectives using the mission statement as a guide (profitability, market share, quality,
cost, flexibility, dependability, and innovation) 3. Develop an understanding of each functional area’s role in achieving the various strategic objectives
2 Neely refers the nine step models is from Wisner and Fawcett, 1991. However, in literature, his name is linked to the framework.
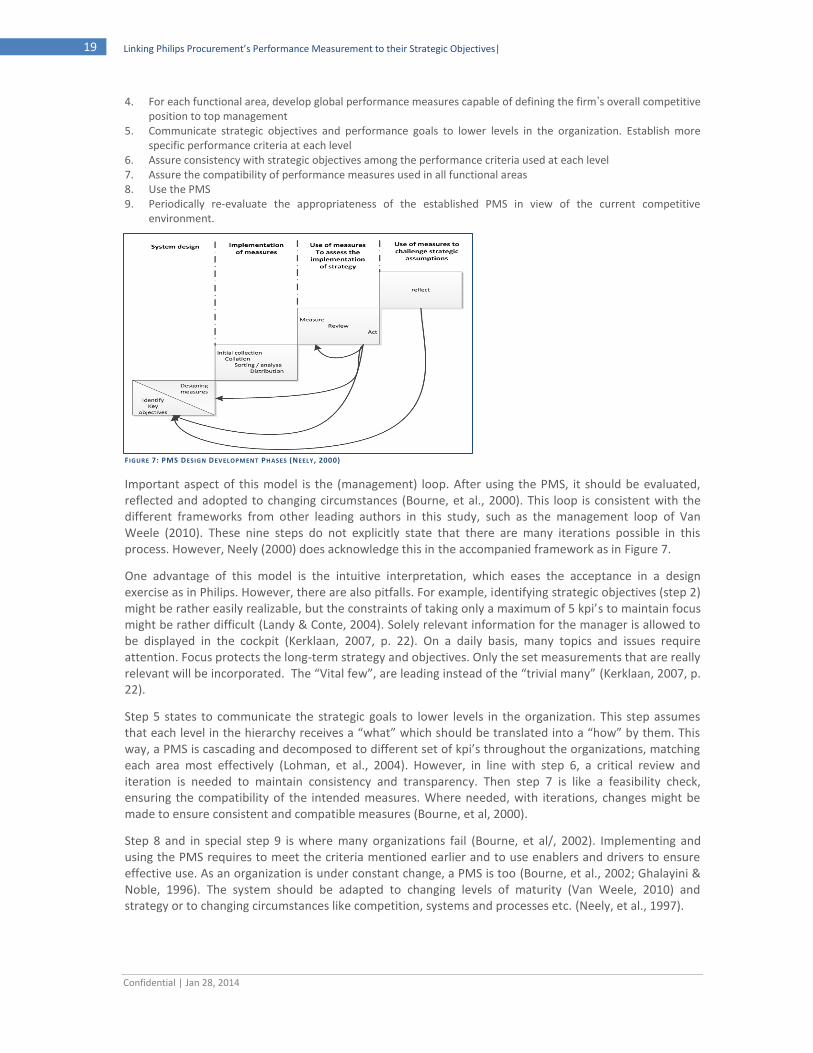
Confidential | Jan 28, 2014
19 Linking Philips Procurement’s Performance Measurement to their Strategic Objectives|
4. For each functional area, develop global performance measures capable of defining the firm’s overall competitive position to top management
5. Communicate strategic objectives and performance goals to lower levels in the organization. Establish more specific performance criteria at each level
6. Assure consistency with strategic objectives among the performance criteria used at each level 7. Assure the compatibility of performance measures used in all functional areas 8. Use the PMS 9. Periodically re-evaluate the appropriateness of the established PMS in view of the current competitive
environment.
F IGURE 7: PMS DESIGN DEVELOPMENT PHASES (NEELY , 2000)
Important aspect of this model is the (management) loop. After using the PMS, it should be evaluated, reflected and adopted to changing circumstances (Bourne, et al., 2000). This loop is consistent with the different frameworks from other leading authors in this study, such as the management loop of Van Weele (2010). These nine steps do not explicitly state that there are many iterations possible in this process. However, Neely (2000) does acknowledge this in the accompanied framework as in Figure 7.
One advantage of this model is the intuitive interpretation, which eases the acceptance in a design exercise as in Philips. However, there are also pitfalls. For example, identifying strategic objectives (step 2) might be rather easily realizable, but the constraints of taking only a maximum of 5 kpi’s to maintain focus might be rather difficult (Landy & Conte, 2004). Solely relevant information for the manager is allowed to be displayed in the cockpit (Kerklaan, 2007, p. 22). On a daily basis, many topics and issues require attention. Focus protects the long-term strategy and objectives. Only the set measurements that are really relevant will be incorporated. The “Vital few”, are leading instead of the “trivial many” (Kerklaan, 2007, p. 22).
Step 5 states to communicate the strategic goals to lower levels in the organization. This step assumes that each level in the hierarchy receives a “what” which should be translated into a “how” by them. This way, a PMS is cascading and decomposed to different set of kpi’s throughout the organizations, matching each area most effectively (Lohman, et al., 2004). However, in line with step 6, a critical review and iteration is needed to maintain consistency and transparency. Then step 7 is like a feasibility check, ensuring the compatibility of the intended measures. Where needed, with iterations, changes might be made to ensure consistent and compatible measures (Bourne, et al, 2000).
Step 8 and in special step 9 is where many organizations fail (Bourne, et al/, 2002). Implementing and using the PMS requires to meet the criteria mentioned earlier and to use enablers and drivers to ensure effective use. As an organization is under constant change, a PMS is too (Bourne, et al., 2002; Ghalayini & Noble, 1996). The system should be adapted to changing levels of maturity (Van Weele, 2010) and strategy or to changing circumstances like competition, systems and processes etc. (Neely, et al., 1997).
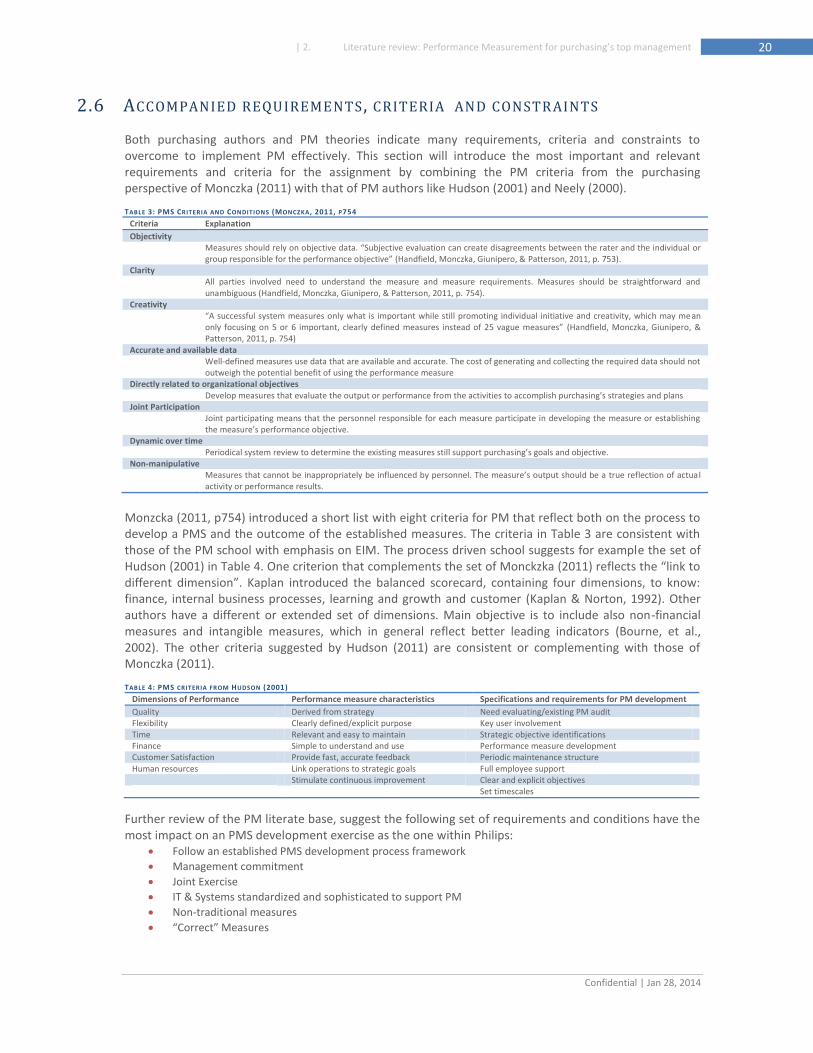
Confidential | Jan 28, 2014
20 | 2. Literature review: Performance Measurement for purchasing’s top management
2.6 ACCOMPANIED REQUIREMENTS , CRITERIA AND CONSTRAINTS
Both purchasing authors and PM theories indicate many requirements, criteria and constraints to overcome to implement PM effectively. This section will introduce the most important and relevant requirements and criteria for the assignment by combining the PM criteria from the purchasing perspective of Monczka (2011) with that of PM authors like Hudson (2001) and Neely (2000).
TABLE 3: PMS CRITERIA AND CONDITIONS (MONCZKA, 2011, P754
Criteria Explanation
Objectivity Measures should rely on objective data. “Subjective evaluation can create disagreements between the rater and the individual or
group responsible for the performance objective” (Handfield, Monczka, Giunipero, & Patterson, 2011, p. 753). Clarity All parties involved need to understand the measure and measure requirements. Measures should be straightforward and
unambiguous (Handfield, Monczka, Giunipero, & Patterson, 2011, p. 754). Creativity
“A successful system measures only what is important while still promoting individual initiative and creativity, which may mean only focusing on 5 or 6 important, clearly defined measures instead of 25 vague measures” (Handfield, Monczka, Giunipero, & Patterson, 2011, p. 754)
Accurate and available data Well-defined measures use data that are available and accurate. The cost of generating and collecting the required data should not
outweigh the potential benefit of using the performance measure Directly related to organizational objectives
Develop measures that evaluate the output or performance from the activities to accomplish purchasing’s strategies and plans Joint Participation
Joint participating means that the personnel responsible for each measure participate in developing the measure or establishing the measure’s performance objective.
Dynamic over time Periodical system review to determine the existing measures still support purchasing’s goals and objective.
Non-manipulative Measures that cannot be inappropriately be influenced by personnel. The measure’s output should be a true reflection of actua l
activity or performance results.
Monzcka (2011, p754) introduced a short list with eight criteria for PM that reflect both on the process to develop a PMS and the outcome of the established measures. The criteria in Table 3 are consistent with those of the PM school with emphasis on EIM. The process driven school suggests for example the set of Hudson (2001) in Table 4. One criterion that complements the set of Monckzka (2011) reflects the “link to different dimension”. Kaplan introduced the balanced scorecard, containing four dimensions, to know: finance, internal business processes, learning and growth and customer (Kaplan & Norton, 1992). Other authors have a different or extended set of dimensions. Main objective is to include also non-financial measures and intangible measures, which in general reflect better leading indicators (Bourne, et al., 2002). The other criteria suggested by Hudson (2011) are consistent or complementing with those of Monczka (2011).
TABLE 4: PMS CRITERIA FROM HUDSON (2001)
Dimensions of Performance Performance measure characteristics Specifications and requirements for PM development
Quality Derived from strategy Need evaluating/existing PM audit Flexibility Clearly defined/explicit purpose Key user involvement Time Relevant and easy to maintain Strategic objective identifications Finance Simple to understand and use Performance measure development Customer Satisfaction Provide fast, accurate feedback Periodic maintenance structure Human resources Link operations to strategic goals Full employee support
Stimulate continuous improvement Clear and explicit objectives Set timescales
Further review of the PM literate base, suggest the following set of requirements and conditions have the most impact on an PMS development exercise as the one within Philips:
Follow an established PMS development process framework
Management commitment
Joint Exercise
IT & Systems standardized and sophisticated to support PM
Non-traditional measures
“Correct” Measures
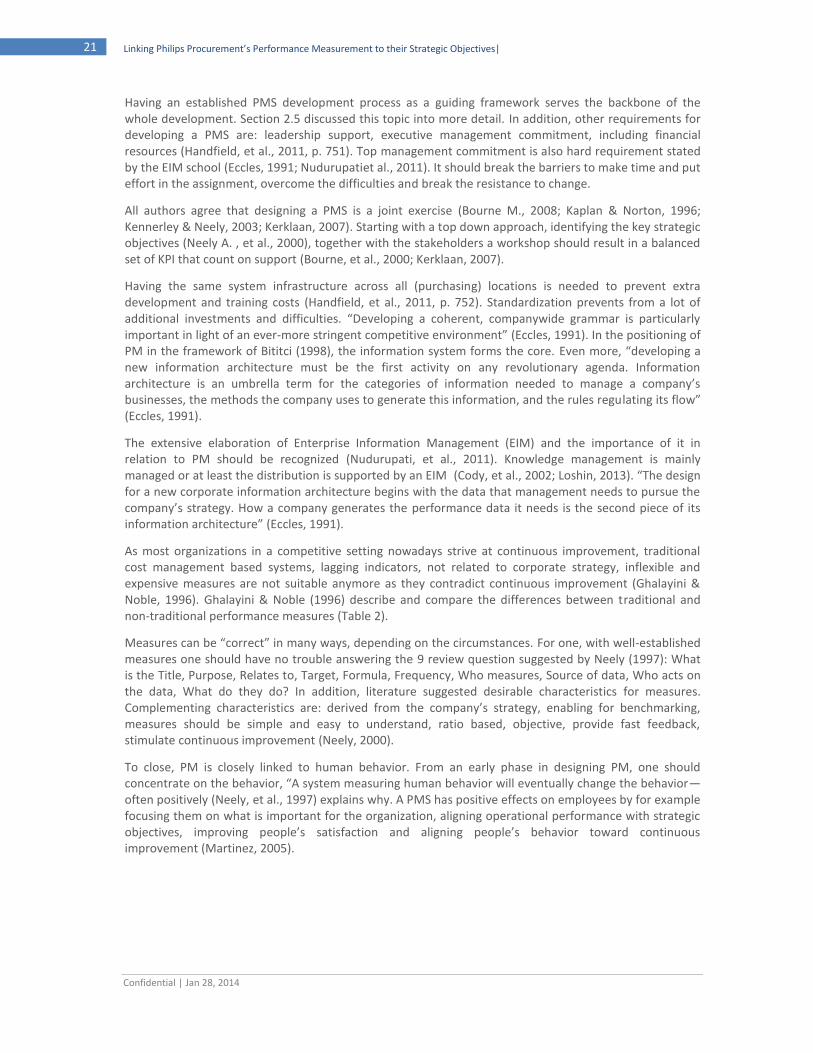
Confidential | Jan 28, 2014
21 Linking Philips Procurement’s Performance Measurement to their Strategic Objectives|
Having an established PMS development process as a guiding framework serves the backbone of the whole development. Section 2.5 discussed this topic into more detail. In addition, other requirements for developing a PMS are: leadership support, executive management commitment, including financial resources (Handfield, et al., 2011, p. 751). Top management commitment is also hard requirement stated by the EIM school (Eccles, 1991; Nudurupatiet al., 2011). It should break the barriers to make time and put effort in the assignment, overcome the difficulties and break the resistance to change.
All authors agree that designing a PMS is a joint exercise (Bourne M., 2008; Kaplan & Norton, 1996; Kennerley & Neely, 2003; Kerklaan, 2007). Starting with a top down approach, identifying the key strategic objectives (Neely A. , et al., 2000), together with the stakeholders a workshop should result in a balanced set of KPI that count on support (Bourne, et al., 2000; Kerklaan, 2007).
Having the same system infrastructure across all (purchasing) locations is needed to prevent extra development and training costs (Handfield, et al., 2011, p. 752). Standardization prevents from a lot of additional investments and difficulties. “Developing a coherent, companywide grammar is particularly important in light of an ever-more stringent competitive environment” (Eccles, 1991). In the positioning of PM in the framework of Bititci (1998), the information system forms the core. Even more, “developing a new information architecture must be the first activity on any revolutionary agenda. Information architecture is an umbrella term for the categories of information needed to manage a company’s businesses, the methods the company uses to generate this information, and the rules regulating its flow” (Eccles, 1991).
The extensive elaboration of Enterprise Information Management (EIM) and the importance of it in relation to PM should be recognized (Nudurupati, et al., 2011). Knowledge management is mainly managed or at least the distribution is supported by an EIM (Cody, et al., 2002; Loshin, 2013). “The design for a new corporate information architecture begins with the data that management needs to pursue the company’s strategy. How a company generates the performance data it needs is the second piece of its information architecture” (Eccles, 1991).
As most organizations in a competitive setting nowadays strive at continuous improvement, traditional cost management based systems, lagging indicators, not related to corporate strategy, inflexible and expensive measures are not suitable anymore as they contradict continuous improvement (Ghalayini & Noble, 1996). Ghalayini & Noble (1996) describe and compare the differences between traditional and non-traditional performance measures (Table 2).
Measures can be “correct” in many ways, depending on the circumstances. For one, with well-established measures one should have no trouble answering the 9 review question suggested by Neely (1997): What is the Title, Purpose, Relates to, Target, Formula, Frequency, Who measures, Source of data, Who acts on the data, What do they do? In addition, literature suggested desirable characteristics for measures. Complementing characteristics are: derived from the company’s strategy, enabling for benchmarking, measures should be simple and easy to understand, ratio based, objective, provide fast feedback, stimulate continuous improvement (Neely, 2000).
To close, PM is closely linked to human behavior. From an early phase in designing PM, one should concentrate on the behavior, “A system measuring human behavior will eventually change the behavior—often positively (Neely, et al., 1997) explains why. A PMS has positive effects on employees by for example focusing them on what is important for the organization, aligning operational performance with strategic objectives, improving people’s satisfaction and aligning people’s behavior toward continuous improvement (Martinez, 2005).
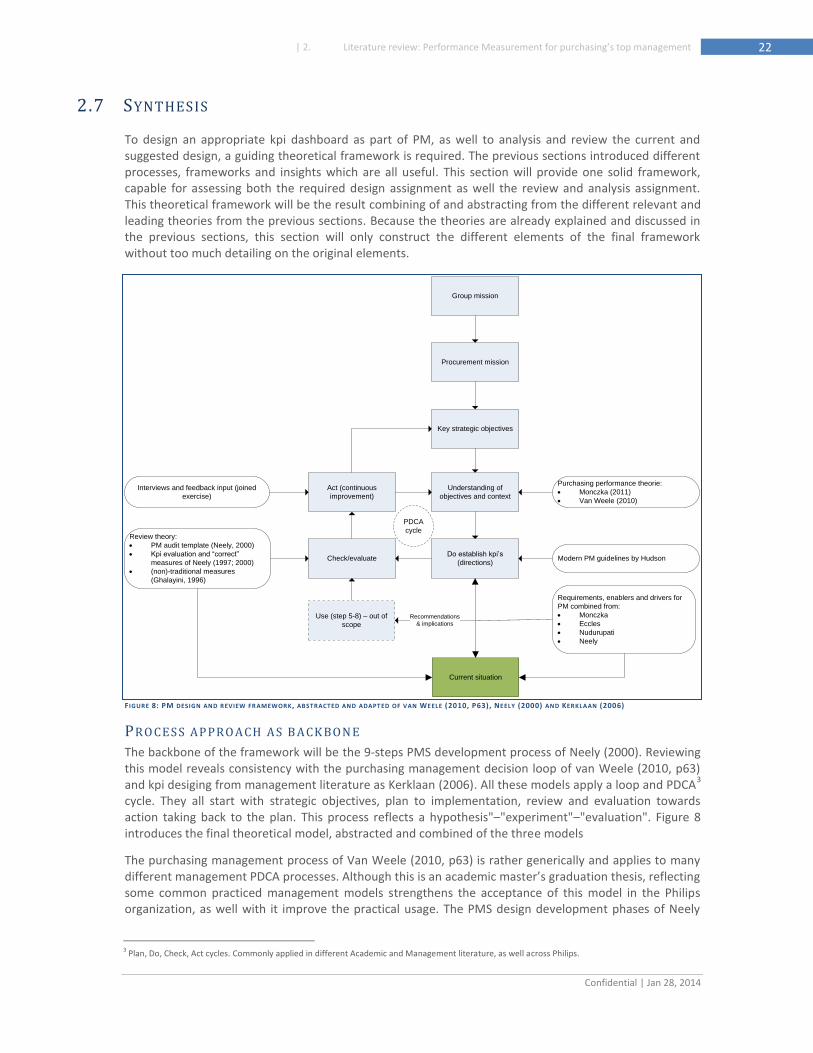
Confidential | Jan 28, 2014
22 | 2. Literature review: Performance Measurement for purchasing’s top management
2.7 SYNTHESIS
To design an appropriate kpi dashboard as part of PM, as well to analysis and review the current and suggested design, a guiding theoretical framework is required. The previous sections introduced different processes, frameworks and insights which are all useful. This section will provide one solid framework, capable for assessing both the required design assignment as well the review and analysis assignment. This theoretical framework will be the result combining of and abstracting from the different relevant and leading theories from the previous sections. Because the theories are already explained and discussed in the previous sections, this section will only construct the different elements of the final framework without too much detailing on the original elements.
F IGURE 8: PM DESIGN AND REVIEW FR AMEWORK , ABSTRACTED AND ADAPT ED OF VAN WEELE (2010, P63), NEELY (2000) AND KERKLAAN (2006)
PRO CES S AP PRO ACH AS B ACK BON E
The backbone of the framework will be the 9-steps PMS development process of Neely (2000). Reviewing this model reveals consistency with the purchasing management decision loop of van Weele (2010, p63) and kpi desiging from management literature as Kerklaan (2006). All these models apply a loop and PDCA
3
cycle. They all start with strategic objectives, plan to implementation, review and evaluation towards action taking back to the plan. This process reflects a hypothesis"–"experiment"–"evaluation". Figure 8 introduces the final theoretical model, abstracted and combined of the three models
The purchasing management process of Van Weele (2010, p63) is rather generically and applies to many different management PDCA processes. Although this is an academic master’s graduation thesis, reflecting some common practiced management models strengthens the acceptance of this model in the Philips organization, as well with it improve the practical usage. The PMS design development phases of Neely
3 Plan, Do, Check, Act cycles. Commonly applied in different Academic and Management literature, as well across Philips.
Group mission
Procurement mission
Key strategic objectives
Understanding of
objectives and context
Do establish kpi’s
(directions)Check/evaluate
Act (continuous
improvement)
Use (step 5-8) – out of
scope
Recommendations
& implications
Review theory:
PM audit template (Neely, 2000)
Kpi evaluation and “correct”
measures of Neely (1997; 2000)
(non)-traditional measures
(Ghalayini, 1996)
PDCA
cycle
Purchasing performance theorie:
Monczka (2011)
Van Weele (2010)
Modern PM guidelines by Hudson
Requirements, enablers and drivers for
PM combined from:
Monczka
Eccles
Nudurupati
Neely
Interviews and feedback input (joined
exercise)
Current situation
Confidential | Jan 28, 2014
23 Linking Philips Procurement’s Performance Measurement to their Strategic Objectives|
(2000) cover the whole PMs lifecycle. The design assignment in this project stops before actual implementation and usage. However, the current PMS can be reviewed and analyzed. Those steps are included in the final framework.
The model in Figure 8 suggests two loops: a short loop reflects the design of measures, while the larger loop reflects to the evaluation of the whole PMS system. Deriving measures from strategic objectives requires different iterations (PDCA cycles). The “improvement step” combines the review with input from the stakeholders towards a new iteration. During these iterations possible solutions (hypotheses) are proposed, which are tested and reflected and afterwards changed or rejected. “Rejection” could mean no feasible measures could be or should be established. “Changed” could mean a measures needs to be improved. The larger loop reflects the whole PMS Lifecycle. Process steps 5-8 from Neely (2000) are out of scope in this study.
DETAI LIN G T HE PRO CESS ST EP S WIT H THEO RY
Although the process framework is now established, the model is not complete. The previous sections in this chapter discussed different elements of PM like for example drivers and enablers for effective implementation, as well as establishing correct and accurate measures. Next, the necessary theory is attached to the just presented backbone.
Working clockwise with the model Figure 8, starting in the upper right corner with “understanding of objectives and context”. For the understanding of the procurement’s strategic objectives, the literature of leading purchasing authors is included (section 2.4). The leading authors are van Weele (2010) and Handfield, Monczka, Giunipero, & Patterson (2011).
In section 2.6, Monczka (2011), Hudson (2001) and Neely (1997; 2000) have given clear direction for “establishing the correct set of measures” and the conditions required to be in place to support effective PMS. Many authors have contributed to the theory of implementing and driving effective PM. For the implementation aspects which are mainly out of scope but relevant for recommendations, theory of Eccles (1991), Monckza (2011), Nudruputi et al. (2011) and Neely (2000) are included.
L INKING T HE FR AMEW ORK WIT H THE T HESIS OUT L IN E
For analyzing and evaluating the current Procurement PM situation in Chapter 3, a combination of the different theories is applied with the “check’ theories as leading. The design of the suggested set of measures is presented in Chapter 4 and builds mostly on the “Plan, Do and Act” steps. The recommendations and management implications build forward on a combination of findings and implementation theories.
2.9 CONCLUDING
This thesis follows the terminology and definitions of leading authors and therefore will use the term performance measurement as leading. This thesis empathizes the definitions of Landernoije, et al. (2005) in combination with Neely (1995). The somewhat mechanistic view is complemented by the widespread recognition that performance measures also have a behavioral impact (Neely, et al., 1997; Halachmi, 2005).
The framework provided in the synthesis closes the literature review and provided a solid framework for designing and evaluation PMS within a procurement function of a Dutch multinational, like Philips. Due to the challenges faced and gaps in literature, the author needs to seek for some “extra” guidance, which can be founded by a combination of models. The framework results from a combination of different leading purchasing as well PM theories and frameworks.

Confidential | Jan 28, 2014
24 | 3. Performance Measurement Developments at Philips Procurement
3. PERFORMANCE MEASUREMENT DEVELOPMENTS AT PHILIPS
PROCUREMENT
This section describes the purchasing performance measurement developments and analyses the 2013 situation. The findings from this chapter contribute to answering the following research questions:
Research question 1: “What does the 2013 Procurement Performance measurement System look like?”
Research question 3: “What are the problems with the 2013 KPI dashboard?”
Research question 4 (only partly): “What should be done to improve the procurement performance measurement system?”
This chapter starts with shortly introducing the developments over the last years (Section 3.1), followed by an analysis of the 2013 situation (Section 3.2). To continue, Section 3.3 emphasizes the most important current and future developments affecting purchasing PM. To close, Section 3.4 analyzes the findings of this chapter and confronts these with theory. Section 3.5 answers the above stated research questions by drawing conclusions. Finally, Section 3.6 interprets the results and the impact of them on this study.
3.1 PHILIPS PROCUREMENTS PERFORMANCE MEASUREMENT HISTORY
The description of the PM developments within Procurement over the last decade was based on only a limited set of sources, so caution on these findings is required. Based on findings from interviews and retrieved documents, the suggestion arised that the PM developments over the last years were rather absent. Some interviewees highlighted the development of previous leaders shrinking the procurement organization. With this downsizing, one also suggested that it reduced some of the function’s knowledge and professionalism.
Reviewing the kpi dashboard from the last few years revealed great parallels with the 2013 procurement kpi dashboard, which raises questions. Firstly, PM should be closely linked to strategic objectives. Secondly, organizations and strategic objectives are under constant changes. This would suggest the developments of the set of measures over the last years might have been negligible and the 2013 PM is not up-to-date.
3.2 PHILIPS PROCUREMENT 2013 ’S PERFORMANCE MEASUREMENT
Having highlighted leading aspects from performance measurement over the last years, this section describes in more depth the 2013 procurement performance measurement. To structure this description, the following section starts with the very basic question on the role and use of PM, followed by a description based on the PM audit framework of Neely (2004). Afterwards, an in-depth review and analysis on these development and outcomes will be discussed.
This sections reviews and analyses the 2013 PM, according to the theory from Chapter 2 in three ways: PM Audit template from Neely (2000),
Review and analysis of PMS development process,
Review and analysis of outcome.
The input for these steps consists of: PM Audit template from Neely (2000),
Interviews,
Observations and attended meetings,
Attended workshops,
The PM audit template results from Chapter 3.
Before the reviews and analyses, a short introduction on the general main findings from the input. Worth mentioning is the critical mindset regarding performance measurement of many interviewees. The
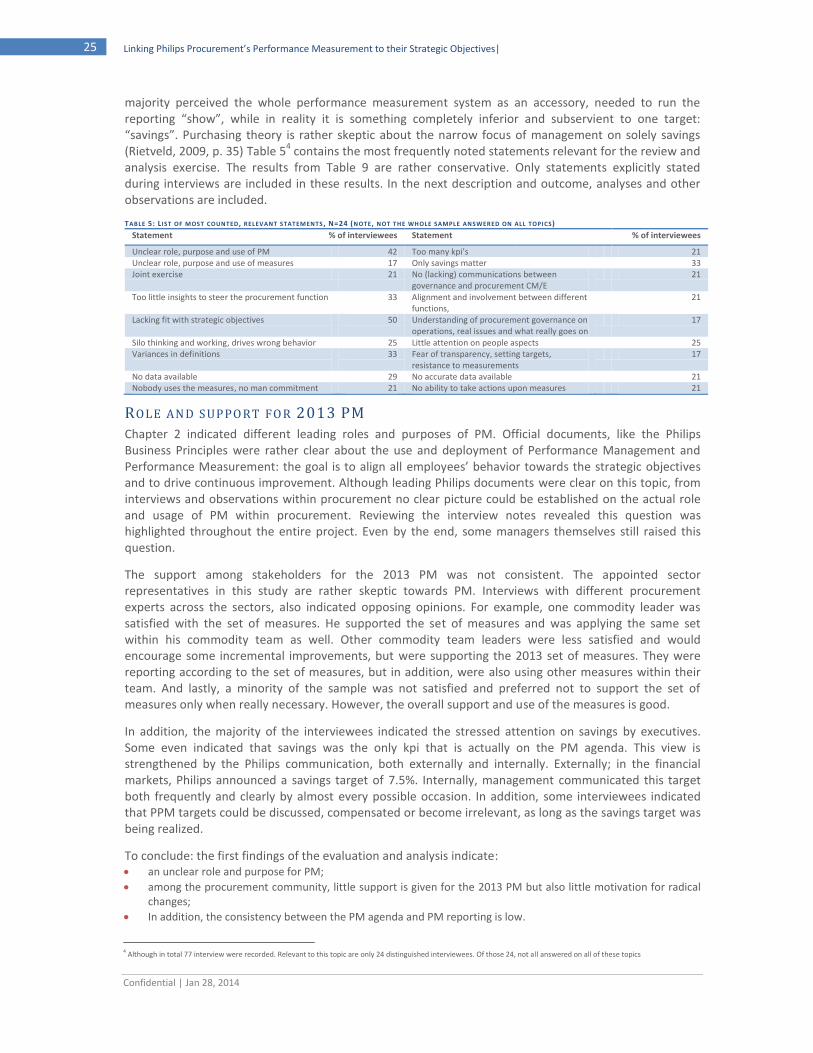
Confidential | Jan 28, 2014
25 Linking Philips Procurement’s Performance Measurement to their Strategic Objectives|
majority perceived the whole performance measurement system as an accessory, needed to run the reporting “show”, while in reality it is something completely inferior and subservient to one target: “savings”. Purchasing theory is rather skeptic about the narrow focus of management on solely savings (Rietveld, 2009, p. 35) Table 5
4 contains the most frequently noted statements relevant for the review and
analysis exercise. The results from Table 9 are rather conservative. Only statements explicitly stated during interviews are included in these results. In the next description and outcome, analyses and other observations are included.
TABLE 5: L IST OF MOST COUNTED , RELEVANT STATEMENTS , N=24 (NOTE, NOT THE WHOLE SAMPLE ANSWERED ON ALL TOPI CS)
Statement % of interviewees Statement % of interviewees
Unclear role, purpose and use of PM 42 Too many kpi’s 21 Unclear role, purpose and use of measures 17 Only savings matter 33 Joint exercise 21 No (lacking) communications between
governance and procurement CM/E 21
Too little insights to steer the procurement function 33 Alignment and involvement between different functions,
21
Lacking fit with strategic objectives
50 Understanding of procurement governance on operations, real issues and what really goes on
17
Silo thinking and working, drives wrong behavior 25 Little attention on people aspects 25 Variances in definitions
33 Fear of transparency, setting targets,
resistance to measurements 17
No data available 29 No accurate data available 21 Nobody uses the measures, no man commitment 21 No ability to take actions upon measures 21
ROLE AN D S UPPO RT FO R 2013 PM
Chapter 2 indicated different leading roles and purposes of PM. Official documents, like the Philips Business Principles were rather clear about the use and deployment of Performance Management and Performance Measurement: the goal is to align all employees’ behavior towards the strategic objectives and to drive continuous improvement. Although leading Philips documents were clear on this topic, from interviews and observations within procurement no clear picture could be established on the actual role and usage of PM within procurement. Reviewing the interview notes revealed this question was highlighted throughout the entire project. Even by the end, some managers themselves still raised this question.
The support among stakeholders for the 2013 PM was not consistent. The appointed sector representatives in this study are rather skeptic towards PM. Interviews with different procurement experts across the sectors, also indicated opposing opinions. For example, one commodity leader was satisfied with the set of measures. He supported the set of measures and was applying the same set within his commodity team as well. Other commodity team leaders were less satisfied and would encourage some incremental improvements, but were supporting the 2013 set of measures. They were reporting according to the set of measures, but in addition, were also using other measures within their team. And lastly, a minority of the sample was not satisfied and preferred not to support the set of measures only when really necessary. However, the overall support and use of the measures is good.
In addition, the majority of the interviewees indicated the stressed attention on savings by executives. Some even indicated that savings was the only kpi that is actually on the PM agenda. This view is strengthened by the Philips communication, both externally and internally. Externally; in the financial markets, Philips announced a savings target of 7.5%. Internally, management communicated this target both frequently and clearly by almost every possible occasion. In addition, some interviewees indicated that PPM targets could be discussed, compensated or become irrelevant, as long as the savings target was being realized.
To conclude: the first findings of the evaluation and analysis indicate: an unclear role and purpose for PM;
among the procurement community, little support is given for the 2013 PM but also little motivation for radical changes;
In addition, the consistency between the PM agenda and PM reporting is low.
4 Although in total 77 interview were recorded. Relevant to this topic are only 24 distinguished interviewees. Of those 24, not all answered on all of these topics
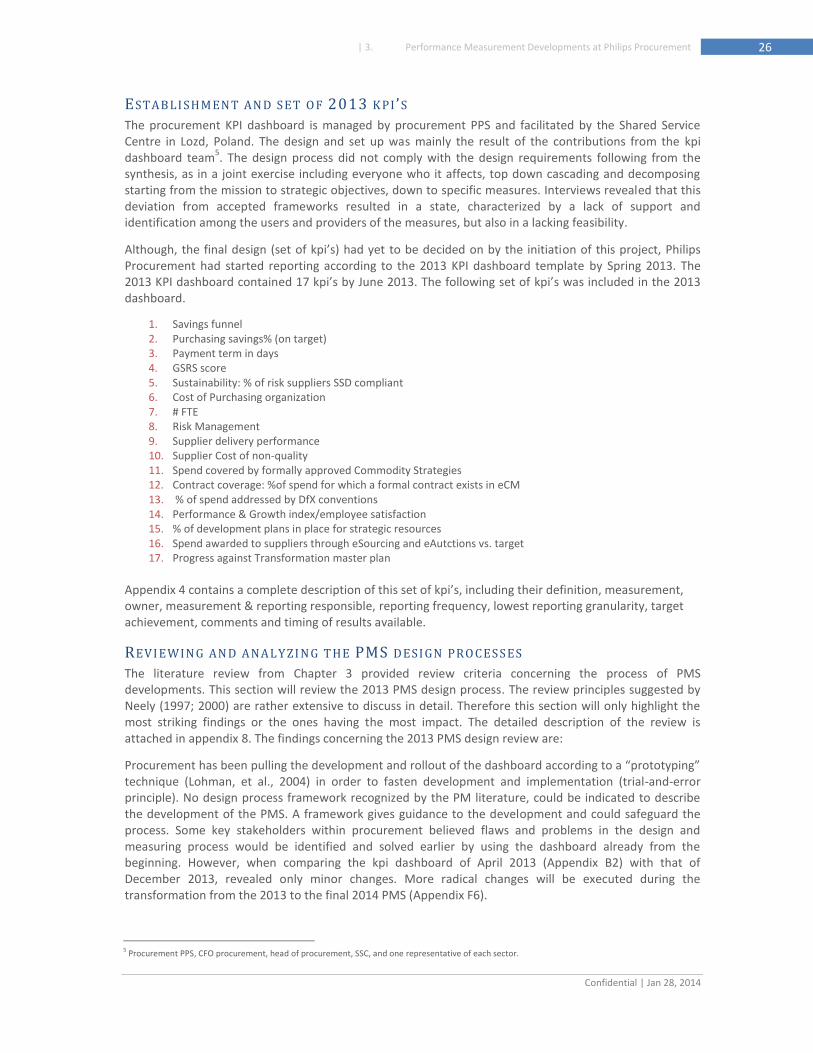
Confidential | Jan 28, 2014
26 | 3. Performance Measurement Developments at Philips Procurement
ESTABLI SHMEN T AN D S ET O F 2013 K PI ’S
The procurement KPI dashboard is managed by procurement PPS and facilitated by the Shared Service Centre in Lozd, Poland. The design and set up was mainly the result of the contributions from the kpi dashboard team
5. The design process did not comply with the design requirements following from the
synthesis, as in a joint exercise including everyone who it affects, top down cascading and decomposing starting from the mission to strategic objectives, down to specific measures. Interviews revealed that this deviation from accepted frameworks resulted in a state, characterized by a lack of support and identification among the users and providers of the measures, but also in a lacking feasibility.
Although, the final design (set of kpi’s) had yet to be decided on by the initiation of this project, Philips Procurement had started reporting according to the 2013 KPI dashboard template by Spring 2013. The 2013 KPI dashboard contained 17 kpi’s by June 2013. The following set of kpi’s was included in the 2013 dashboard.
1. Savings funnel 2. Purchasing savings% (on target) 3. Payment term in days 4. GSRS score 5. Sustainability: % of risk suppliers SSD compliant 6. Cost of Purchasing organization 7. # FTE 8. Risk Management 9. Supplier delivery performance 10. Supplier Cost of non-quality 11. Spend covered by formally approved Commodity Strategies 12. Contract coverage: %of spend for which a formal contract exists in eCM 13. % of spend addressed by DfX conventions 14. Performance & Growth index/employee satisfaction 15. % of development plans in place for strategic resources 16. Spend awarded to suppliers through eSourcing and eAutctions vs. target 17. Progress against Transformation master plan
Appendix 4 contains a complete description of this set of kpi’s, including their definition, measurement, owner, measurement & reporting responsible, reporting frequency, lowest reporting granularity, target achievement, comments and timing of results available.
REVI EWIN G AN D ANALY ZI N G T HE PMS DESI GN PRO CES S ES
The literature review from Chapter 3 provided review criteria concerning the process of PMS developments. This section will review the 2013 PMS design process. The review principles suggested by Neely (1997; 2000) are rather extensive to discuss in detail. Therefore this section will only highlight the most striking findings or the ones having the most impact. The detailed description of the review is attached in appendix 8. The findings concerning the 2013 PMS design review are:
Procurement has been pulling the development and rollout of the dashboard according to a “prototyping” technique (Lohman, et al., 2004) in order to fasten development and implementation (trial-and-error principle). No design process framework recognized by the PM literature, could be indicated to describe the development of the PMS. A framework gives guidance to the development and could safeguard the process. Some key stakeholders within procurement believed flaws and problems in the design and measuring process would be identified and solved earlier by using the dashboard already from the beginning. However, when comparing the kpi dashboard of April 2013 (Appendix B2) with that of December 2013, revealed only minor changes. More radical changes will be executed during the transformation from the 2013 to the final 2014 PMS (Appendix F6).
5 Procurement PPS, CFO procurement, head of procurement, SSC, and one representative of each sector.

Confidential | Jan 28, 2014
27 Linking Philips Procurement’s Performance Measurement to their Strategic Objectives|
Although some authors acknowledge this technique (Lohman, et al., 2004), leading PM frameworks do not suggest to apply it (Bourne, et al., 2000). Philips Procurement was striving to fully report according to the new template by end of 2013. It is unclear how Procurement will handle future suggestions to adjust (improve) the Procurement Dashboard.
Secondly, although most of the set of kpi’s were yet established by Fall 2013, at the beginning of the project in May 2013, not all kpi’s had a clear uniform definition. Almost all interviewees indicated that unambiguous definitions and unclear purposes were an issue. Nor are kpi’s not measured in the same way across the different sectors and even within the sectors. In addition, not all kpi’s could be measured accurately, if measured at all (see kpi dashboard from April 2013; missing data, appendix 5). Literature clearly indicated performance measures should be derived from the company’s strategic objectives (Neely, et al., 2000; Hudson et al., 2001; Ghalayini & Noble, 1996). Concerning the 2013 process, appendix 9 reveals that the strategic objectives are weakly coveraged by the kpi’s
6. The set of kpi’s for 2013
contains measures that do not have a clear role and purpose. At least for the added measures, this is not the case for the suggested 2014 design.
In addition, figures in the Procurement kpi dashboard were based upon consolidated data, with many different resources. Some sources are different SAP/ERP systems. Data from the different IT systems were extracted and consolidated by the central reporting group (CRG/SSC). Other data were being delivered by the sectors. Currently, only a fraction of the data was extracted automatically from IT systems. Manually interventions were mostly required. In addition, some data were not available at all. Due to the fact that the IT-infrastructure was not build to support these measurements or due to the intensive manual labor.
Fourthly, based on interviews, the development of the 2013 PMS was not a joint exercise (Neely A. , et al., 2000), involving all who it affects (Lohman et al., 2004). Closing, during the problem analysis a lacking management commitment was suggested. Compared to suggestions and best practices by literature (Eccles, 1991), the level of management commitment in relation to PM was not perfect, but also not absent.
To conclude, the establishment of the 2013 PM is characterized by:
No process step followed s as suggested by any leading PMS development framework.;
Lacking consistency and ambiguity in definitions and measures;
Many measures could not be accurately reported, if at all, due to issues with IT and systems;
No joint exercise;
No full management commitment.
REV IEW AN D EVALU ATI ON O F T HE S ET O F MEASUR EMENTS
The literature review from Chapter 2, introduced two review criteria of two different authors. For one, the desirable outcome characteristics of the measures (Neely, 1996, 2000), as a complement of Neely’s (1996) process review criteria of the previous section. The other criteria are presented by Ghalayini & Noble (1996): a comparison on traditional and non-traditional measures from Ghalayini & Noble (1996). This review section will compare and review both the 2013 and suggested design on the both review frameworks. Appendix 8 contains the complete results of the review analysis. Here, the main findings of this review will be discussed.
The review criteria imply measures could be roughly categorized (inter alia) as leading or lagging, tangible or intangible (Neely, 1996, 2000); tactical versus strategic (Ghalayini & Noble, 1996), effective or efficiency focusing (Van Weele, 2010), financial or non-financial (Eccles, 1991) and typical traditional/non-traditional. Reviewing and analyzing on these criteria resulted in the following findings as presented in Table 8. The next paragraphs will relate to this table and describe the results in the context of the criteria frameworks.
6 The strategic objectives were stated in 2012, but only slightly supported by executives throughout 2013. Halfway the project, the 2012 strategic
objecives would be considered as no longer valid, leaving the organization without any stated strategy.
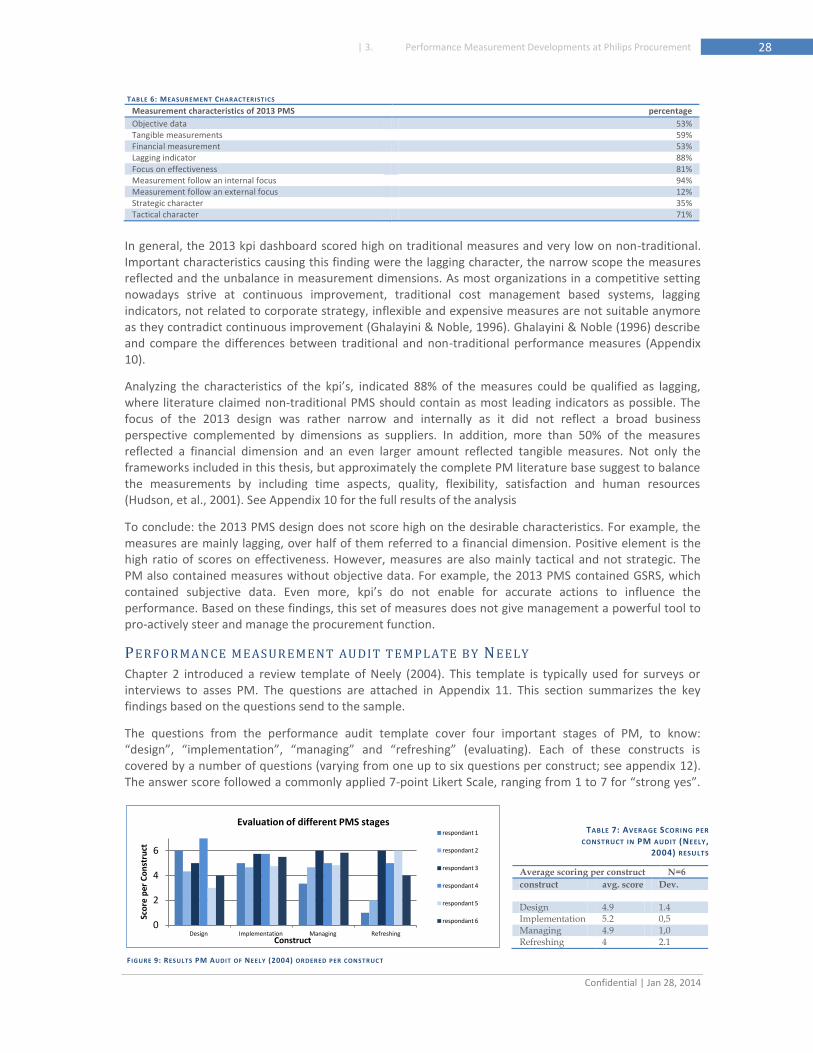
Confidential | Jan 28, 2014
28 | 3. Performance Measurement Developments at Philips Procurement
TABLE 6: MEASUREMENT CHARACTERISTICS
Measurement characteristics of 2013 PMS percentage
Objective data 53% Tangible measurements 59% Financial measurement 53% Lagging indicator 88% Focus on effectiveness 81% Measurement follow an internal focus 94% Measurement follow an external focus 12% Strategic character 35% Tactical character 71%
In general, the 2013 kpi dashboard scored high on traditional measures and very low on non-traditional. Important characteristics causing this finding were the lagging character, the narrow scope the measures reflected and the unbalance in measurement dimensions. As most organizations in a competitive setting nowadays strive at continuous improvement, traditional cost management based systems, lagging indicators, not related to corporate strategy, inflexible and expensive measures are not suitable anymore as they contradict continuous improvement (Ghalayini & Noble, 1996). Ghalayini & Noble (1996) describe and compare the differences between traditional and non-traditional performance measures (Appendix 10).
Analyzing the characteristics of the kpi’s, indicated 88% of the measures could be qualified as lagging, where literature claimed non-traditional PMS should contain as most leading indicators as possible. The focus of the 2013 design was rather narrow and internally as it did not reflect a broad business perspective complemented by dimensions as suppliers. In addition, more than 50% of the measures reflected a financial dimension and an even larger amount reflected tangible measures. Not only the frameworks included in this thesis, but approximately the complete PM literature base suggest to balance the measurements by including time aspects, quality, flexibility, satisfaction and human resources (Hudson, et al., 2001). See Appendix 10 for the full results of the analysis
To conclude: the 2013 PMS design does not score high on the desirable characteristics. For example, the measures are mainly lagging, over half of them referred to a financial dimension. Positive element is the high ratio of scores on effectiveness. However, measures are also mainly tactical and not strategic. The PM also contained measures without objective data. For example, the 2013 PMS contained GSRS, which contained subjective data. Even more, kpi’s do not enable for accurate actions to influence the performance. Based on these findings, this set of measures does not give management a powerful tool to pro-actively steer and manage the procurement function.
PERFO R MAN CE MEAS UR EME NT AUDIT T EMP LAT E BY NEELY
Chapter 2 introduced a review template of Neely (2004). This template is typically used for surveys or interviews to asses PM. The questions are attached in Appendix 11. This section summarizes the key findings based on the questions send to the sample.
The questions from the performance audit template cover four important stages of PM, to know: “design”, “implementation”, “managing” and “refreshing” (evaluating). Each of these constructs is covered by a number of questions (varying from one up to six questions per construct; see appendix 12). The answer score followed a commonly applied 7-point Likert Scale, ranging from 1 to 7 for “strong yes”.
Average scoring per construct N=6
construct avg. score Dev. Design 4.9 1.4 Implementation 5.2 0,5 Managing 4.9 1,0 Refreshing 4 2.1
TABLE 7: AVERAGE SCORING PER
CONSTRUCT IN PM AUDIT (NEELY,
2004) RESULTS
0
2
4
6
Design Implementation Managing Refreshing
Sco
re p
er C
on
stru
ct
Construct
Evaluation of different PMS stages respondant 1
respondant 2
respondant 3
respondant 4
respondant 5
respondant 6
F IGURE 9: RESULTS PM AUDIT OF NEELY (2004) ORDERED PER CONSTRUC T
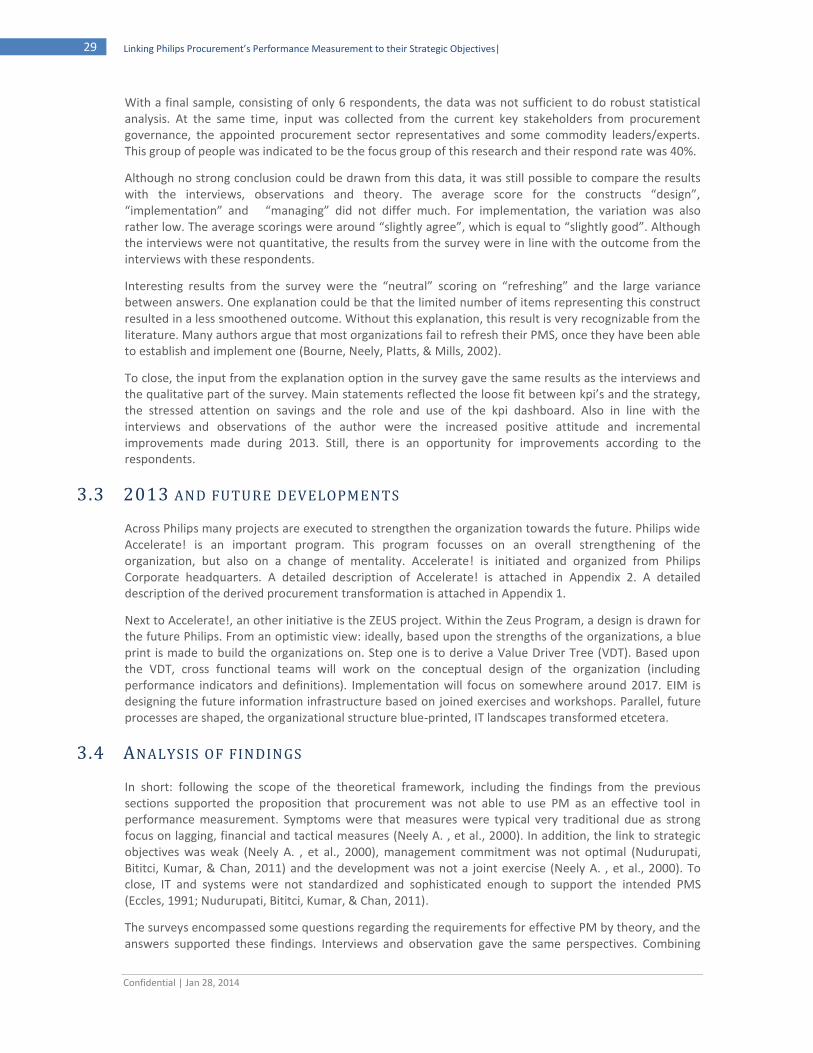
Confidential | Jan 28, 2014
29 Linking Philips Procurement’s Performance Measurement to their Strategic Objectives|
With a final sample, consisting of only 6 respondents, the data was not sufficient to do robust statistical analysis. At the same time, input was collected from the current key stakeholders from procurement governance, the appointed procurement sector representatives and some commodity leaders/experts. This group of people was indicated to be the focus group of this research and their respond rate was 40%.
Although no strong conclusion could be drawn from this data, it was still possible to compare the results with the interviews, observations and theory. The average score for the constructs “design”, “implementation” and “managing” did not differ much. For implementation, the variation was also rather low. The average scorings were around “slightly agree”, which is equal to “slightly good”. Although the interviews were not quantitative, the results from the survey were in line with the outcome from the interviews with these respondents.
Interesting results from the survey were the “neutral” scoring on “refreshing” and the large variance between answers. One explanation could be that the limited number of items representing this construct resulted in a less smoothened outcome. Without this explanation, this result is very recognizable from the literature. Many authors argue that most organizations fail to refresh their PMS, once they have been able to establish and implement one (Bourne, Neely, Platts, & Mills, 2002).
To close, the input from the explanation option in the survey gave the same results as the interviews and the qualitative part of the survey. Main statements reflected the loose fit between kpi’s and the strategy, the stressed attention on savings and the role and use of the kpi dashboard. Also in line with the interviews and observations of the author were the increased positive attitude and incremental improvements made during 2013. Still, there is an opportunity for improvements according to the respondents.
3.3 2013 AND FUTURE DEVELOPMENTS
Across Philips many projects are executed to strengthen the organization towards the future. Philips wide Accelerate! is an important program. This program focusses on an overall strengthening of the organization, but also on a change of mentality. Accelerate! is initiated and organized from Philips Corporate headquarters. A detailed description of Accelerate! is attached in Appendix 2. A detailed description of the derived procurement transformation is attached in Appendix 1.
Next to Accelerate!, an other initiative is the ZEUS project. Within the Zeus Program, a design is drawn for the future Philips. From an optimistic view: ideally, based upon the strengths of the organizations, a blue print is made to build the organizations on. Step one is to derive a Value Driver Tree (VDT). Based upon the VDT, cross functional teams will work on the conceptual design of the organization (including performance indicators and definitions). Implementation will focus on somewhere around 2017. EIM is designing the future information infrastructure based on joined exercises and workshops. Parallel, future processes are shaped, the organizational structure blue-printed, IT landscapes transformed etcetera.
3.4 ANALYSIS OF FINDINGS
In short: following the scope of the theoretical framework, including the findings from the previous sections supported the proposition that procurement was not able to use PM as an effective tool in performance measurement. Symptoms were that measures were typical very traditional due as strong focus on lagging, financial and tactical measures (Neely A. , et al., 2000). In addition, the link to strategic objectives was weak (Neely A. , et al., 2000), management commitment was not optimal (Nudurupati, Bititci, Kumar, & Chan, 2011) and the development was not a joint exercise (Neely A. , et al., 2000). To close, IT and systems were not standardized and sophisticated enough to support the intended PMS (Eccles, 1991; Nudurupati, Bititci, Kumar, & Chan, 2011).
The surveys encompassed some questions regarding the requirements for effective PM by theory, and the answers supported these findings. Interviews and observation gave the same perspectives. Combining
Confidential | Jan 28, 2014
30 | 3. Performance Measurement Developments at Philips Procurement
these different sources strengthens the conclusion that some key requirements for effective PM were not present.
Analyzing the root causes reveals that within this assignment, only a few causes could be influenced (Figure 9). The causes closest to the core problem, with the ability to affect are: following the design process steps, applying correct measurement requirements and establishing a non-traditional PMS and also, although only slight: the cross functional expertise and stakeholder involvement.
3.5 CONCLUDING
The research questions concerned in this chapter were: “What does the 2013 Procurement Performance measurement System look like?”, “What are the 2013 problems with the present KPI dashboard?” and partly: “What should be done to improve the procurement performance measurement system?
The 2013 PMS contained 17 kpi’s. Not all measures could be reported up to standard. The 2013 problems in short were related to conditions and requirements not being met or in place to enable the development and use of an effective PMS in supporting Performance Management. Concerning the topics of this chapter, improvements would relate to ensuring these conditions and requirements are in place.
3.6 INTERPRETATION OF FIN DINGS
The previous analysis supported the proposition that procurement is not able to use PM as an effective tool in performance measurement. Reviewing the problem description even revealed that the initial problem descriptions indicated some root causes that are leading requirements for designing and implementing an effective PM, according to literature. As these findings were in line with the problem description and assignment, there is no need to redirect or change the next steps in this thesis.
F IGURE 10: ROOT CAUSE
ANALYSIS FOR IN EFFECTIVE
PMS: REQUIREMENTS NOT IN
PLACE (DIFFER ENT AUTHORS
IT standardization and sophistication
Management commitment
Joint exercise
Non-traditional PM
Following PMS design principles
and requirements
Performance management
Requirements, drivers and enblers
in place for effective PM
Following all design pocess
steps
Role and Purpose and usage of PM
Correct measuresfollowing kpi requirements
Root cause: out of power of
influence
Weak rootcause
Root cause:in power of influence
Root cause:weak power of
influence
Role and Purpose and usage of PM
Main problem effect

Confidential | Jan 28, 2014
31 Linking Philips Procurement’s Performance Measurement to their Strategic Objectives|
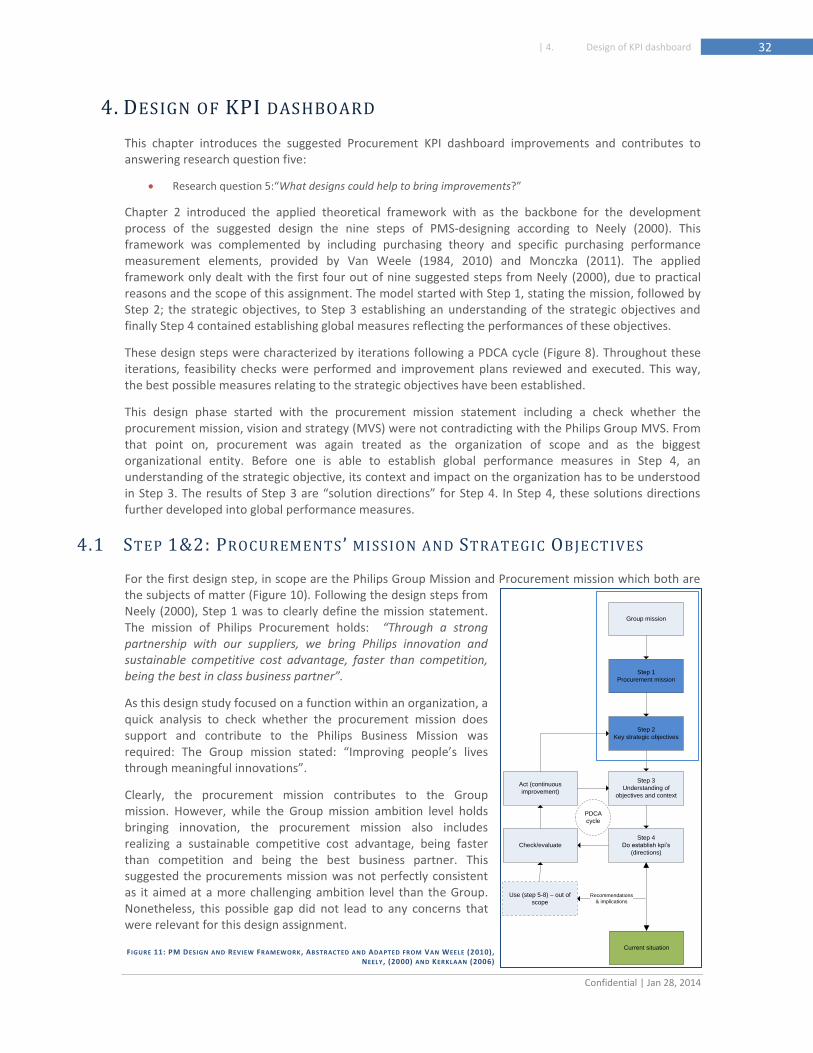
Confidential | Jan 28, 2014
32 | 4. Design of KPI dashboard
4. DESIGN OF KPI DASHBOARD
This chapter introduces the suggested Procurement KPI dashboard improvements and contributes to answering research question five:
Research question 5:“What designs could help to bring improvements?”
Chapter 2 introduced the applied theoretical framework with as the backbone for the development process of the suggested design the nine steps of PMS-designing according to Neely (2000). This framework was complemented by including purchasing theory and specific purchasing performance measurement elements, provided by Van Weele (1984, 2010) and Monczka (2011). The applied framework only dealt with the first four out of nine suggested steps from Neely (2000), due to practical reasons and the scope of this assignment. The model started with Step 1, stating the mission, followed by Step 2; the strategic objectives, to Step 3 establishing an understanding of the strategic objectives and finally Step 4 contained establishing global measures reflecting the performances of these objectives.
These design steps were characterized by iterations following a PDCA cycle (Figure 8). Throughout these iterations, feasibility checks were performed and improvement plans reviewed and executed. This way, the best possible measures relating to the strategic objectives have been established.
This design phase started with the procurement mission statement including a check whether the procurement mission, vision and strategy (MVS) were not contradicting with the Philips Group MVS. From that point on, procurement was again treated as the organization of scope and as the biggest organizational entity. Before one is able to establish global performance measures in Step 4, an understanding of the strategic objective, its context and impact on the organization has to be understood in Step 3. The results of Step 3 are “solution directions” for Step 4. In Step 4, these solutions directions further developed into global performance measures.
4.1 STEP 1&2: PROCUREMENTS ’ MISSION AND STRATEGIC OBJECTIVES
For the first design step, in scope are the Philips Group Mission and Procurement mission which both are the subjects of matter (Figure 10). Following the design steps from Neely (2000), Step 1 was to clearly define the mission statement. The mission of Philips Procurement holds: “Through a strong partnership with our suppliers, we bring Philips innovation and sustainable competitive cost advantage, faster than competition, being the best in class business partner”.
As this design study focused on a function within an organization, a quick analysis to check whether the procurement mission does support and contribute to the Philips Business Mission was required: The Group mission stated: “Improving people’s lives through meaningful innovations”.
Clearly, the procurement mission contributes to the Group mission. However, while the Group mission ambition level holds bringing innovation, the procurement mission also includes realizing a sustainable competitive cost advantage, being faster than competition and being the best business partner. This suggested the procurements mission was not perfectly consistent as it aimed at a more challenging ambition level than the Group. Nonetheless, this possible gap did not lead to any concerns that were relevant for this design assignment.
Group mission
Step 1
Procurement mission
Step 2
Key strategic objectives
Step 3
Understanding of
objectives and context
Step 4
Do establish kpi’s
(directions)
Check/evaluate
Act (continuous
improvement)
Use (step 5-8) – out of
scope
Recommendations
& implications
PDCA
cycle
Current situationF IGURE 11: PM DESIGN AND REVIEW FRAMEWORK , ABSTRACTED AND ADAPTED FROM VAN WEELE (2010),
NEELY , (2000) AND KERKLAAN (2006)

Confidential | Jan 28, 2014
33 Linking Philips Procurement’s Performance Measurement to their Strategic Objectives|
Step 2 of Neely’s model (2000), concerns identifying the firm’s (procurement) strategic objectives. In addition to the procurement mission, management formulated a vision and a strategy formulation. From these (internal) documents, the strategic objectives were retrieved. Because the strategy formulation was only tentative, the retrieved strategic objectives were checked for completeness. This was done by both interviews, observations and checking the PM agenda. This step was “extra”, compared to the models suggested by theory, but relevant under the described circumstances. To close, the retrieved strategic objectives were analyzed and compared with the 2013 PMS and the 2013 PM agenda. This paragraph describes in sequential order:
Strategic objectives, retrieved from written documents
Strategic objectives, retrieved from interviews and observations
Strategic objectives, compared with purchasing theory
Gap analysis: comparison of current strategic objectives with the 2013 PMs and PM agenda.
STRAT EGI C O BJECTIV ES FRO M W RITT EN DO CUMEN T S
The following strategy is a tentative strategy statement. By November 2013, the tentative strategy was already reviewed and considered by both procurement executives and Philips Group Board of Directors. However, it was not formally approved and signed off. Next, the vision and strategy are stated, followed by a short analysis to identify the strategic objectives.
Procurement’s vision states:
“At Philips Procurement we are the best in class business partner working across business functions and teams to ensure our approach is End2End driven and to build an outstanding procurement competence. Our goal is to contribute to an additional €1B savings (2.5% over 3 years) by 2015 and leverage our supplier base to drive meaningful innovation. Our team is entrepreneurial and works with a fearless spirit, giving us a unique procurement x-factor.” The retrieved strategic objectives are cursive in the next text and listed in Table 8. In addition, stakeholders are underlined and the higher level strategic objective (mission) is bold.
The tentative7 Procurement strategy states:
“As an integrated and enabling function, we generate additional value in two ways. For one, we contribute to margin by realizing a sustainable cost advantage. Secondly, we partner up with all business functions. Together with them and our suppliers we enable meaningful innovations. Towards our suppliers, we continue to leverage our supply base and sustain strong partnerships. Towards other business functions, we continue to transform and integrate procurement. Along with programs like MPP and DfX, we ensure our combined knowledge is early integrated and diffused throughout the whole E2E process. Following standardized and transparent processes with programs like PMT, we respond quick and adequate to all our stakeholders, generating value faster than our competition. With programs on CONQ, we assure an increase in cost effectiveness and quality transparency. With attention to our people, we attract, retain and develop talent. To fully enrich our internal capabilities, we work as one team with an entrepreneurial and fearless spirit, making Philips’ procurement function the best in class. With effective and balanced performance management, aligned with the Philips Business System Principles and Value Drivers, we enhance a growth and performance culture to strive at improving ourselves every day. Only with an outstanding procurement competence will we be able to outperform our competitors!”
STRAT EGI C O BJECTIV ES FRO M INT ERVI EW S AN D OBS ERV ATIO NS
From observations, it became clear the written statement did focus on future strategic objectives, but did not embrace all 2013 strategic objectives that were still to be valid in the nearby future. From interviews, observations and analysis the list with strategic objectives was complemented and later evaluated and confirmed by procurement managers. The complete list with strategic objectives is displayed in Table 8.
7 Under consideration and approval by Philips executives. The stated strategy is high-level informally approved.
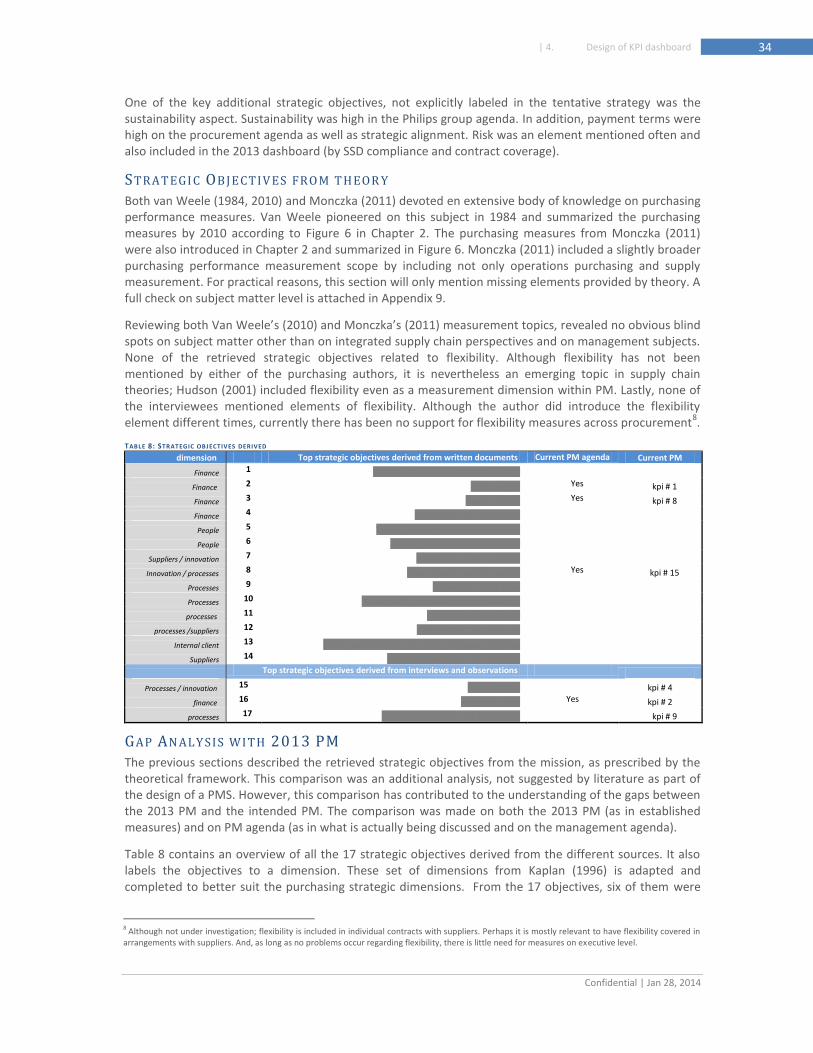
Confidential | Jan 28, 2014
34 | 4. Design of KPI dashboard
One of the key additional strategic objectives, not explicitly labeled in the tentative strategy was the sustainability aspect. Sustainability was high in the Philips group agenda. In addition, payment terms were high on the procurement agenda as well as strategic alignment. Risk was an element mentioned often and also included in the 2013 dashboard (by SSD compliance and contract coverage).
STRAT EGI C OBJECTIV ES FRO M T HEOR Y
Both van Weele (1984, 2010) and Monczka (2011) devoted en extensive body of knowledge on purchasing performance measures. Van Weele pioneered on this subject in 1984 and summarized the purchasing measures by 2010 according to Figure 6 in Chapter 2. The purchasing measures from Monczka (2011) were also introduced in Chapter 2 and summarized in Figure 6. Monczka (2011) included a slightly broader purchasing performance measurement scope by including not only operations purchasing and supply measurement. For practical reasons, this section will only mention missing elements provided by theory. A full check on subject matter level is attached in Appendix 9.
Reviewing both Van Weele’s (2010) and Monczka’s (2011) measurement topics, revealed no obvious blind spots on subject matter other than on integrated supply chain perspectives and on management subjects. None of the retrieved strategic objectives related to flexibility. Although flexibility has not been mentioned by either of the purchasing authors, it is nevertheless an emerging topic in supply chain theories; Hudson (2001) included flexibility even as a measurement dimension within PM. Lastly, none of the interviewees mentioned elements of flexibility. Although the author did introduce the flexibility element different times, currently there has been no support for flexibility measures across procurement
8.
TABLE 8: STRATEGIC OBJECTIVES DERIVED
dimension Top strategic objectives derived from written documents Current PM agenda Current PM
Finance 1 Effective Procurement cost leadership
Finance 2 1 bln savings Yes kpi # 1
Finance 3 Reduce CONQ Yes kpi # 8
Finance 4 Sustainable cost advantage
People 5 Talent, Entrepreneurial fearless spirit
People 6 Attract, retain and develop talent
Suppliers / innovation 7 Innovations from suppliers
Innovation / processes 8 Procurement Transformation Yes kpi # 15
Processes 9 Leveraged supply base
Processes 10 “Outstanding procurement competence”
processes 11 Faster than competition
processes /suppliers 12 Early supplier involvement
Internal client 13 Strong partnerships with Philips business functions
Suppliers 14 Strong partnerships with suppliers
Top strategic objectives derived from interviews and observations
Processes / innovation 15 Sustainability kpi # 4
finance 16 Payment terms Yes kpi # 2
processes 17 Strategic alignment with businesses kpi # 9
GAP AN ALY SIS WI TH 2013 PM
The previous sections described the retrieved strategic objectives from the mission, as prescribed by the theoretical framework. This comparison was an additional analysis, not suggested by literature as part of the design of a PMS. However, this comparison has contributed to the understanding of the gaps between the 2013 PM and the intended PM. The comparison was made on both the 2013 PM (as in established measures) and on PM agenda (as in what is actually being discussed and on the management agenda).
Table 8 contains an overview of all the 17 strategic objectives derived from the different sources. It also labels the objectives to a dimension. These set of dimensions from Kaplan (1996) is adapted and completed to better suit the purchasing strategic dimensions. From the 17 objectives, six of them were
8 Although not under investigation; flexibility is included in individual contracts with suppliers. Perhaps it is mostly relevant to have flexibility covered in arrangements with suppliers. And, as long as no problems occur regarding flexibility, there is little need for measures on executive level.
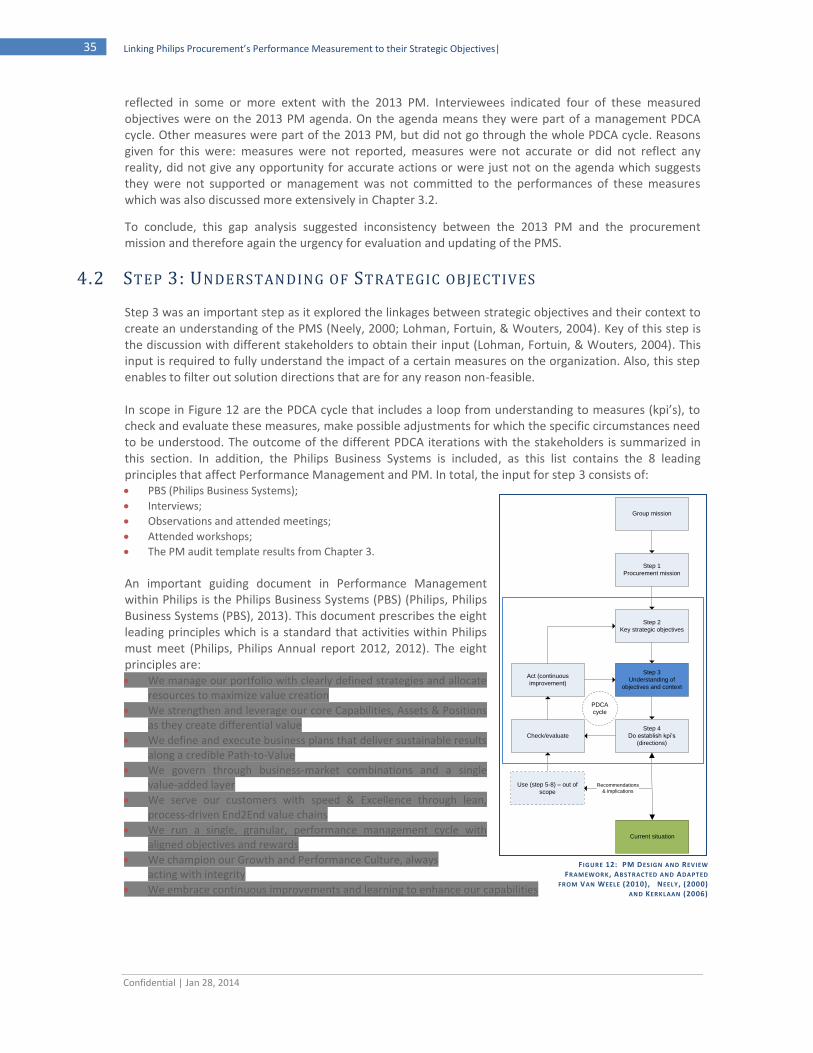
Confidential | Jan 28, 2014
35 Linking Philips Procurement’s Performance Measurement to their Strategic Objectives|
F IGURE 12: PM DESIGN AND REVIEW
FRAMEWORK , ABSTRACTED AND ADAPTED
FROM VAN WEELE (2010), NEELY , (2000)
AND KERKLAAN (2006)
reflected in some or more extent with the 2013 PM. Interviewees indicated four of these measured objectives were on the 2013 PM agenda. On the agenda means they were part of a management PDCA cycle. Other measures were part of the 2013 PM, but did not go through the whole PDCA cycle. Reasons given for this were: measures were not reported, measures were not accurate or did not reflect any reality, did not give any opportunity for accurate actions or were just not on the agenda which suggests they were not supported or management was not committed to the performances of these measures which was also discussed more extensively in Chapter 3.2.
To conclude, this gap analysis suggested inconsistency between the 2013 PM and the procurement mission and therefore again the urgency for evaluation and updating of the PMS.
4.2 STEP 3: UNDERSTANDING OF STRATEGIC OBJECTIVES
Step 3 was an important step as it explored the linkages between strategic objectives and their context to create an understanding of the PMS (Neely, 2000; Lohman, Fortuin, & Wouters, 2004). Key of this step is the discussion with different stakeholders to obtain their input (Lohman, Fortuin, & Wouters, 2004). This input is required to fully understand the impact of a certain measures on the organization. Also, this step enables to filter out solution directions that are for any reason non-feasible. In scope in Figure 12 are the PDCA cycle that includes a loop from understanding to measures (kpi’s), to check and evaluate these measures, make possible adjustments for which the specific circumstances need to be understood. The outcome of the different PDCA iterations with the stakeholders is summarized in this section. In addition, the Philips Business Systems is included, as this list contains the 8 leading principles that affect Performance Management and PM. In total, the input for step 3 consists of: PBS (Philips Business Systems);
Interviews;
Observations and attended meetings;
Attended workshops;
The PM audit template results from Chapter 3.
An important guiding document in Performance Management within Philips is the Philips Business Systems (PBS) (Philips, Philips Business Systems (PBS), 2013). This document prescribes the eight leading principles which is a standard that activities within Philips must meet (Philips, Philips Annual report 2012, 2012). The eight principles are: We manage our portfolio with clearly defined strategies and allocate
resources to maximize value creation
We strengthen and leverage our core Capabilities, Assets & Positions as they create differential value
We define and execute business plans that deliver sustainable results along a credible Path-to-Value
We govern through business-market combinations and a single value-added layer
We serve our customers with speed & Excellence through lean, process-driven End2End value chains
We run a single, granular, performance management cycle with aligned objectives and rewards
We champion our Growth and Performance Culture, always acting with integrity
We embrace continuous improvements and learning to enhance our capabilities
Group mission
Step 1
Procurement mission
Step 2
Key strategic objectives
Step 3
Understanding of
objectives and context
Step 4
Do establish kpi’s
(directions)
Check/evaluate
Act (continuous
improvement)
Use (step 5-8) – out of
scope
Recommendations
& implications
PDCA
cycle
Current situation
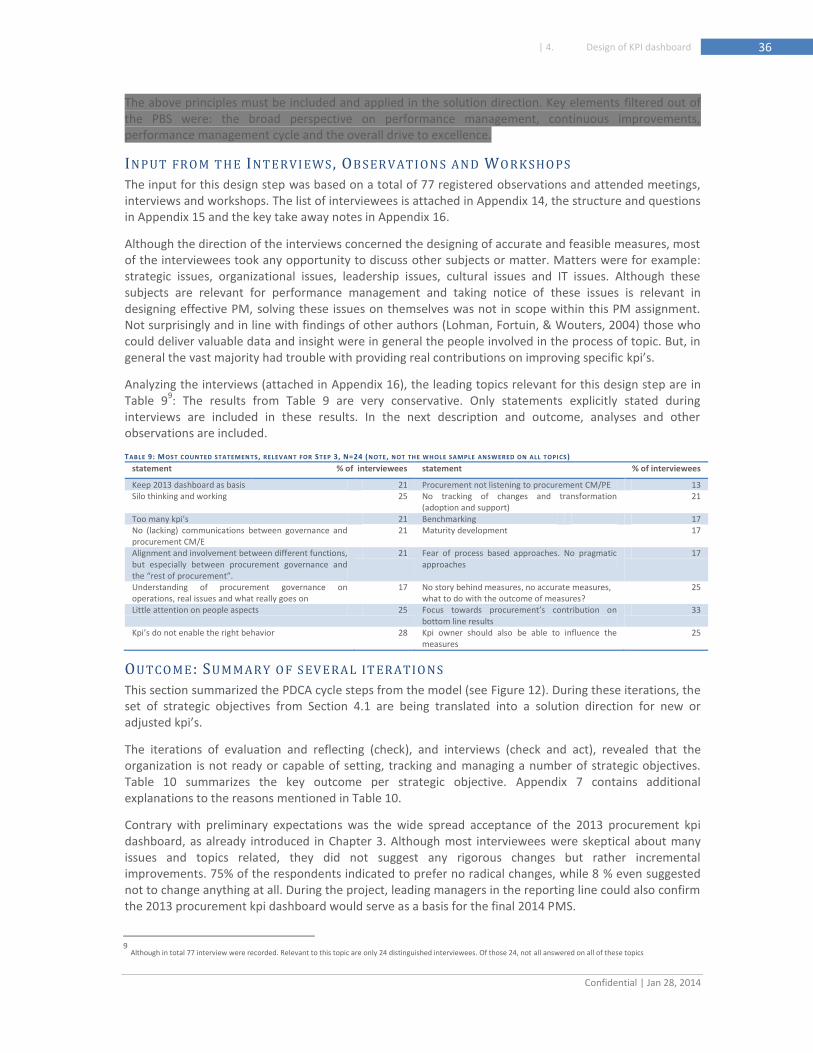
Confidential | Jan 28, 2014
36 | 4. Design of KPI dashboard
The above principles must be included and applied in the solution direction. Key elements filtered out of the PBS were: the broad perspective on performance management, continuous improvements, performance management cycle and the overall drive to excellence.
INP UT FRO M T HE INT ERVI EWS , OBS ER VATI ON S AN D WO RK SHO PS
The input for this design step was based on a total of 77 registered observations and attended meetings, interviews and workshops. The list of interviewees is attached in Appendix 14, the structure and questions in Appendix 15 and the key take away notes in Appendix 16.
Although the direction of the interviews concerned the designing of accurate and feasible measures, most of the interviewees took any opportunity to discuss other subjects or matter. Matters were for example: strategic issues, organizational issues, leadership issues, cultural issues and IT issues. Although these subjects are relevant for performance management and taking notice of these issues is relevant in designing effective PM, solving these issues on themselves was not in scope within this PM assignment. Not surprisingly and in line with findings of other authors (Lohman, Fortuin, & Wouters, 2004) those who could deliver valuable data and insight were in general the people involved in the process of topic. But, in general the vast majority had trouble with providing real contributions on improving specific kpi’s.
Analyzing the interviews (attached in Appendix 16), the leading topics relevant for this design step are in Table 9
9: The results from Table 9 are very conservative. Only statements explicitly stated during
interviews are included in these results. In the next description and outcome, analyses and other observations are included.
TABLE 9: MOST COUNTED STATEMEN TS , RELEVANT FOR STEP 3, N=24 (NOTE, NOT THE WHOLE SAMPLE ANSWERED ON ALL TOPI CS)
statement % of interviewees statement % of interviewees
Keep 2013 dashboard as basis 21 Procurement not listening to procurement CM/PE 13 Silo thinking and working 25 No tracking of changes and transformation
(adoption and support) 21
Too many kpi’s 21 Benchmarking 17 No (lacking) communications between governance and procurement CM/E
21 Maturity development
17
Alignment and involvement between different functions, but especially between procurement governance and the “rest of procurement”.
21 Fear of process based approaches. No pragmatic approaches
17
Understanding of procurement governance on operations, real issues and what really goes on
17 No story behind measures, no accurate measures, what to do with the outcome of measures?
25
Little attention on people aspects 25 Focus towards procurement’s contribution on bottom line results
33
Kpi’s do not enable the right behavior 28 Kpi owner should also be able to influence the measures
25
OUTCO ME : SUMMAR Y O F S EV ERAL IT ER ATIO NS
This section summarized the PDCA cycle steps from the model (see Figure 12). During these iterations, the set of strategic objectives from Section 4.1 are being translated into a solution direction for new or adjusted kpi’s.
The iterations of evaluation and reflecting (check), and interviews (check and act), revealed that the organization is not ready or capable of setting, tracking and managing a number of strategic objectives. Table 10 summarizes the key outcome per strategic objective. Appendix 7 contains additional explanations to the reasons mentioned in Table 10.
Contrary with preliminary expectations was the wide spread acceptance of the 2013 procurement kpi dashboard, as already introduced in Chapter 3. Although most interviewees were skeptical about many issues and topics related, they did not suggest any rigorous changes but rather incremental improvements. 75% of the respondents indicated to prefer no radical changes, while 8 % even suggested not to change anything at all. During the project, leading managers in the reporting line could also confirm the 2013 procurement kpi dashboard would serve as a basis for the final 2014 PMS.
9 Although in total 77 interview were recorded. Relevant to this topic are only 24 distinguished interviewees. Of those 24, not all answered on all of these topics
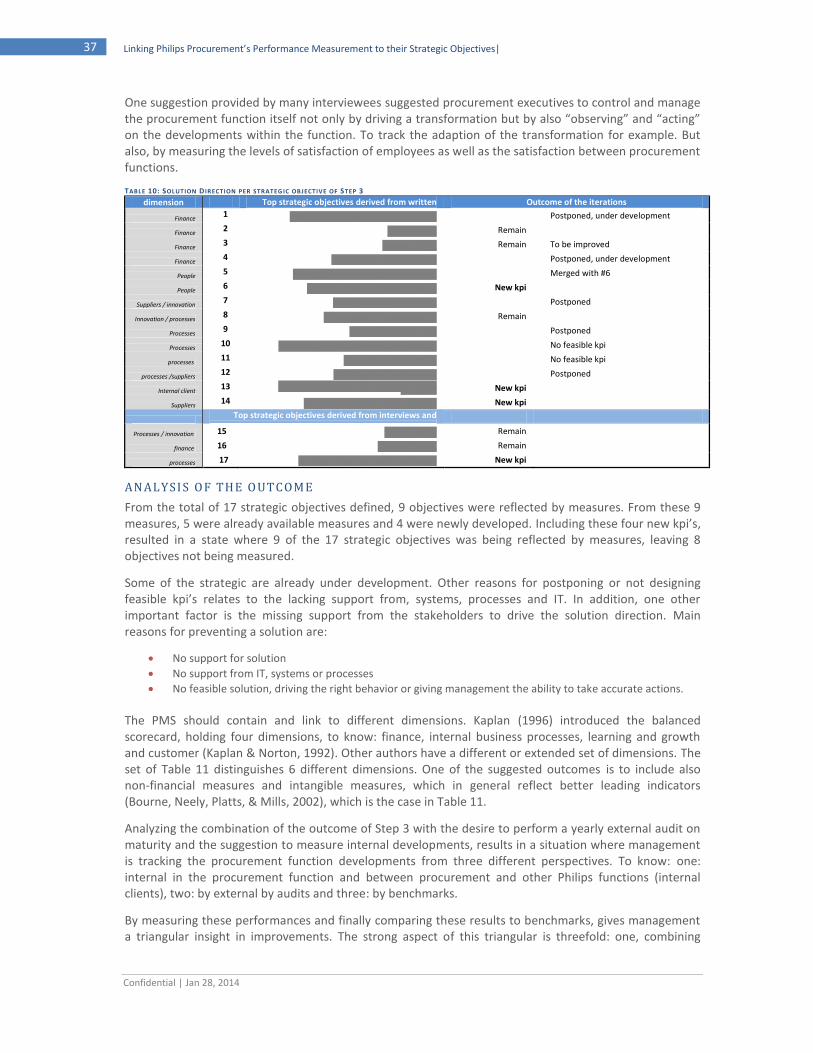
Confidential | Jan 28, 2014
37 Linking Philips Procurement’s Performance Measurement to their Strategic Objectives|
One suggestion provided by many interviewees suggested procurement executives to control and manage the procurement function itself not only by driving a transformation but by also “observing” and “acting” on the developments within the function. To track the adaption of the transformation for example. But also, by measuring the levels of satisfaction of employees as well as the satisfaction between procurement functions.
TABLE 10: SOLUTION D IRECTION PER STRATEG IC OBJECTIVE OF STEP 3
dimension Top strategic objectives derived from written documents
Outcome of the iterations Outcome of iterations
Finance 1 Effective Procurement cost leadership Postponed, under development
Finance 2 1 bln savings Remain
Finance 3 Reduce CONQ Remain To be improved
Finance 4 Sustainable cost advantage Postponed, under development
People 5 Talent, Entrepreneurial fearless spirit Merged with #6
People 6 Attract, retain and develop talent New kpi
Suppliers / innovation 7 Innovations from suppliers Postponed
Innovation / processes 8 Procurement Transformation Remain
Processes 9 Leveraged supply base Postponed
Processes 10 “Outstanding procurement competence” No feasible kpi
processes 11 Faster than competition No feasible kpi
processes /suppliers 12 Early supplier involvement Postponed
Internal client 13 Strong partnerships with Philips business
functions New kpi
Suppliers 14 Strong partnerships with suppliers New kpi
Top strategic objectives derived from interviews and
observations
Processes / innovation 15 Sustainability Remain
finance 16 Payment terms Remain
processes 17 Strategic alignment with businesses New kpi
AN ALYSI S O F THE O UT COME
From the total of 17 strategic objectives defined, 9 objectives were reflected by measures. From these 9 measures, 5 were already available measures and 4 were newly developed. Including these four new kpi’s, resulted in a state where 9 of the 17 strategic objectives was being reflected by measures, leaving 8 objectives not being measured.
Some of the strategic are already under development. Other reasons for postponing or not designing feasible kpi’s relates to the lacking support from, systems, processes and IT. In addition, one other important factor is the missing support from the stakeholders to drive the solution direction. Main reasons for preventing a solution are:
No support for solution
No support from IT, systems or processes
No feasible solution, driving the right behavior or giving management the ability to take accurate actions.
The PMS should contain and link to different dimensions. Kaplan (1996) introduced the balanced scorecard, holding four dimensions, to know: finance, internal business processes, learning and growth and customer (Kaplan & Norton, 1992). Other authors have a different or extended set of dimensions. The set of Table 11 distinguishes 6 different dimensions. One of the suggested outcomes is to include also non-financial measures and intangible measures, which in general reflect better leading indicators (Bourne, Neely, Platts, & Mills, 2002), which is the case in Table 11.
Analyzing the combination of the outcome of Step 3 with the desire to perform a yearly external audit on maturity and the suggestion to measure internal developments, results in a situation where management is tracking the procurement function developments from three different perspectives. To know: one: internal in the procurement function and between procurement and other Philips functions (internal clients), two: by external by audits and three: by benchmarks.
By measuring these performances and finally comparing these results to benchmarks, gives management a triangular insight in improvements. The strong aspect of this triangular is threefold: one, combining
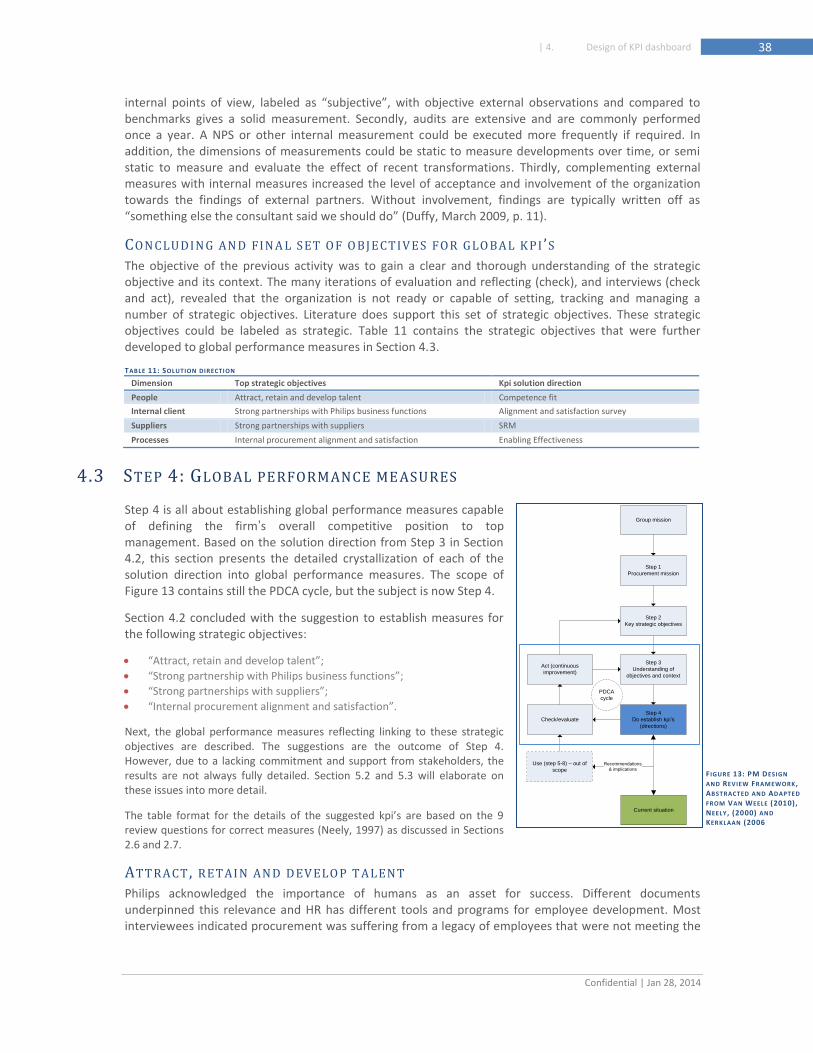
Confidential | Jan 28, 2014
38 | 4. Design of KPI dashboard
internal points of view, labeled as “subjective”, with objective external observations and compared to benchmarks gives a solid measurement. Secondly, audits are extensive and are commonly performed once a year. A NPS or other internal measurement could be executed more frequently if required. In addition, the dimensions of measurements could be static to measure developments over time, or semi static to measure and evaluate the effect of recent transformations. Thirdly, complementing external measures with internal measures increased the level of acceptance and involvement of the organization towards the findings of external partners. Without involvement, findings are typically written off as “something else the consultant said we should do” (Duffy, March 2009, p. 11).
CON CLUDIN G AN D FIN A L S ET O F O BJECTIV ES FOR GLO BAL K PI ’S
The objective of the previous activity was to gain a clear and thorough understanding of the strategic objective and its context. The many iterations of evaluation and reflecting (check), and interviews (check and act), revealed that the organization is not ready or capable of setting, tracking and managing a number of strategic objectives. Literature does support this set of strategic objectives. These strategic objectives could be labeled as strategic. Table 11 contains the strategic objectives that were further developed to global performance measures in Section 4.3.
TABLE 11: SOLUTION DIRECTION
Dimension Top strategic objectives Kpi solution direction
People Attract, retain and develop talent Competence fit
Internal client Strong partnerships with Philips business functions Alignment and satisfaction survey
Suppliers Strong partnerships with suppliers SRM
Processes Internal procurement alignment and satisfaction Enabling Effectiveness
4.3 STEP 4: GLOBAL PERFORMANCE ME ASURES
Step 4 is all about establishing global performance measures capable of defining the firm’s overall competitive position to top management. Based on the solution direction from Step 3 in Section 4.2, this section presents the detailed crystallization of each of the solution direction into global performance measures. The scope of Figure 13 contains still the PDCA cycle, but the subject is now Step 4.
Section 4.2 concluded with the suggestion to establish measures for the following strategic objectives:
“Attract, retain and develop talent”;
“Strong partnership with Philips business functions”;
“Strong partnerships with suppliers”;
“Internal procurement alignment and satisfaction”.
Next, the global performance measures reflecting linking to these strategic objectives are described. The suggestions are the outcome of Step 4. However, due to a lacking commitment and support from stakeholders, the results are not always fully detailed. Section 5.2 and 5.3 will elaborate on these issues into more detail.
The table format for the details of the suggested kpi’s are based on the 9 review questions for correct measures (Neely, 1997) as discussed in Sections 2.6 and 2.7.
ATT RACT , RETAI N AN D DEV ELO P T ALEN T
Philips acknowledged the importance of humans as an asset for success. Different documents underpinned this relevance and HR has different tools and programs for employee development. Most interviewees indicated procurement was suffering from a legacy of employees that were not meeting the
Group mission
Step 1
Procurement mission
Step 2
Key strategic objectives
Step 3
Understanding of
objectives and context
Step 4
Do establish kpi’s
(directions)
Check/evaluate
Act (continuous
improvement)
Use (step 5-8) – out of
scope
Recommendations
& implications
PDCA
cycle
Current situation
F IGURE 13: PM DESIGN
AND REVIEW FRAMEWORK ,
ABSTRACTED AND ADAPTED
FROM VAN WEELE (2010),
NEELY , (2000) AND
KERKLAAN (2006
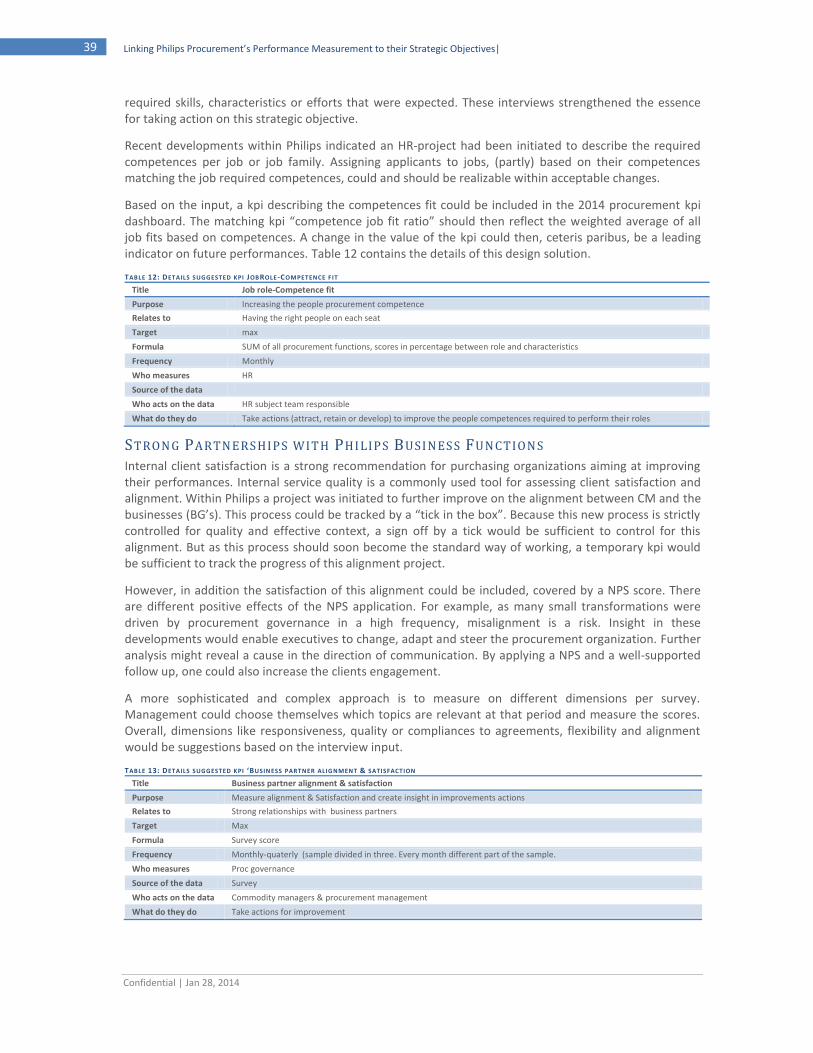
Confidential | Jan 28, 2014
39 Linking Philips Procurement’s Performance Measurement to their Strategic Objectives|
required skills, characteristics or efforts that were expected. These interviews strengthened the essence for taking action on this strategic objective.
Recent developments within Philips indicated an HR-project had been initiated to describe the required competences per job or job family. Assigning applicants to jobs, (partly) based on their competences matching the job required competences, could and should be realizable within acceptable changes.
Based on the input, a kpi describing the competences fit could be included in the 2014 procurement kpi dashboard. The matching kpi “competence job fit ratio” should then reflect the weighted average of all job fits based on competences. A change in the value of the kpi could then, ceteris paribus, be a leading indicator on future performances. Table 12 contains the details of this design solution.
TABLE 12: DETAILS SUGGESTED KPI JOBROLE-COMPETENCE F IT
Title Job role-Competence fit
Purpose Increasing the people procurement competence
Relates to Having the right people on each seat
Target max
Formula SUM of all procurement functions, scores in percentage between role and characteristics
Frequency Monthly
Who measures HR
Source of the data
Who acts on the data HR subject team responsible
What do they do Take actions (attract, retain or develop) to improve the people competences required to perform their roles
STRON G PARTN ERS HIP S WIT H PHI LIP S BUSI N ES S FUN CTION S
Internal client satisfaction is a strong recommendation for purchasing organizations aiming at improving their performances. Internal service quality is a commonly used tool for assessing client satisfaction and alignment. Within Philips a project was initiated to further improve on the alignment between CM and the businesses (BG’s). This process could be tracked by a “tick in the box”. Because this new process is strictly controlled for quality and effective context, a sign off by a tick would be sufficient to control for this alignment. But as this process should soon become the standard way of working, a temporary kpi would be sufficient to track the progress of this alignment project.
However, in addition the satisfaction of this alignment could be included, covered by a NPS score. There are different positive effects of the NPS application. For example, as many small transformations were driven by procurement governance in a high frequency, misalignment is a risk. Insight in these developments would enable executives to change, adapt and steer the procurement organization. Further analysis might reveal a cause in the direction of communication. By applying a NPS and a well-supported follow up, one could also increase the clients engagement.
A more sophisticated and complex approach is to measure on different dimensions per survey. Management could choose themselves which topics are relevant at that period and measure the scores. Overall, dimensions like responsiveness, quality or compliances to agreements, flexibility and alignment would be suggestions based on the interview input.
TABLE 13: DETAILS SUGGESTED KPI ‘BUSIN ESS PARTNER ALIG NMENT & SATISFACTION
Title Business partner alignment & satisfaction
Purpose Measure alignment & Satisfaction and create insight in improvements actions
Relates to Strong relationships with business partners
Target Max
Formula Survey score
Frequency Monthly-quaterly (sample divided in three. Every month different part of the sample.
Who measures Proc governance
Source of the data Survey
Who acts on the data Commodity managers & procurement management
What do they do Take actions for improvement
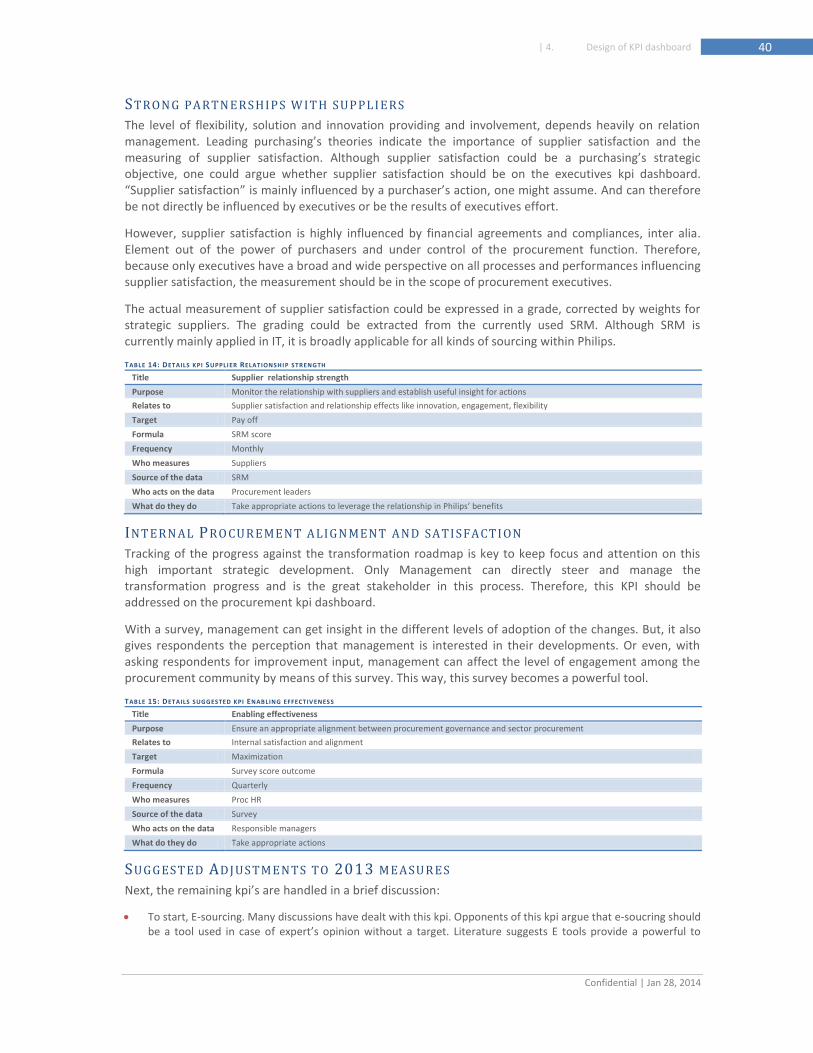
Confidential | Jan 28, 2014
40 | 4. Design of KPI dashboard
STRON G PARTN ERS HIP S W IT H S UP PLI ERS
The level of flexibility, solution and innovation providing and involvement, depends heavily on relation management. Leading purchasing’s theories indicate the importance of supplier satisfaction and the measuring of supplier satisfaction. Although supplier satisfaction could be a purchasing’s strategic objective, one could argue whether supplier satisfaction should be on the executives kpi dashboard. “Supplier satisfaction” is mainly influenced by a purchaser’s action, one might assume. And can therefore be not directly be influenced by executives or be the results of executives effort.
However, supplier satisfaction is highly influenced by financial agreements and compliances, inter alia. Element out of the power of purchasers and under control of the procurement function. Therefore, because only executives have a broad and wide perspective on all processes and performances influencing supplier satisfaction, the measurement should be in the scope of procurement executives.
The actual measurement of supplier satisfaction could be expressed in a grade, corrected by weights for strategic suppliers. The grading could be extracted from the currently used SRM. Although SRM is currently mainly applied in IT, it is broadly applicable for all kinds of sourcing within Philips.
TABLE 14: DETAILS KPI SUPPLIER RELATIONSHIP STRENGTH
Title Supplier relationship strength
Purpose Monitor the relationship with suppliers and establish useful insight for actions
Relates to Supplier satisfaction and relationship effects like innovation, engagement, flexibility
Target Pay off
Formula SRM score
Frequency Monthly
Who measures Suppliers
Source of the data SRM
Who acts on the data Procurement leaders
What do they do Take appropriate actions to leverage the relationship in Philips’ benefits
INT ERN AL PRO CUR EMENT ALIGN MENT AND SATIS FACTI ON
Tracking of the progress against the transformation roadmap is key to keep focus and attention on this high important strategic development. Only Management can directly steer and manage the transformation progress and is the great stakeholder in this process. Therefore, this KPI should be addressed on the procurement kpi dashboard.
With a survey, management can get insight in the different levels of adoption of the changes. But, it also gives respondents the perception that management is interested in their developments. Or even, with asking respondents for improvement input, management can affect the level of engagement among the procurement community by means of this survey. This way, this survey becomes a powerful tool.
TABLE 15: DETAILS SUGGESTED KPI ENABLING EFFECTIV ENES S
Title Enabling effectiveness
Purpose Ensure an appropriate alignment between procurement governance and sector procurement
Relates to Internal satisfaction and alignment
Target Maximization
Formula Survey score outcome
Frequency Quarterly
Who measures Proc HR
Source of the data Survey
Who acts on the data Responsible managers
What do they do Take appropriate actions
SUGGES T ED ADJUS TMENTS TO 2013 MEASUR ES
Next, the remaining kpi’s are handled in a brief discussion:
To start, E-sourcing. Many discussions have dealt with this kpi. Opponents of this kpi argue that e-soucring should be a tool used in case of expert’s opinion without a target. Literature suggests E tools provide a powerful to
Confidential | Jan 28, 2014
41 Linking Philips Procurement’s Performance Measurement to their Strategic Objectives|
realize savings under certain conditions. The usage of E sourcing tools could therefore be in indicator for a potential saving.
GSRS is a useless measure, which does not create any functional behavior or accurate actions and has therefore no usage. However, the idea behind GSRS is strong. No one interviewee was able to suggest any better alternatives for the 2013 GSRS.
Contract coverage has no purpose as long as the issues with ID’s and parent companies is not solved, nor as it is possible that outdated contracts are counted for. In addition, as there are many different levels and forms of contracts (full complete contracts versus Purchase Order), this should be sorted out. One solution would be to establish guidelines for a certain component, product or group and prescribe the required type of contract. The ratio into which the preset compliance is achieved would be the kpi. The target should be 100% appropriate contracts in place. This would then approach “the level of appropriate contracts in place”.
The suggested kpi for competence would replace the 2013 “people” kpi’s.
For CONQ, the Philips approach should be adopted. However, CONQ has little context and is not holistically approached when the “appraisal and prevention” costs are not taken into account (as suggested by Philips).
AS SUMPTION S
There are no real assumptions in place for the different inputs. As many constraints and barriers have been taken into account by the input from experts. Some of the assumptions worthwhile mentioning:
From the original research proposal, the system feasibility should be a process and EIM-kind of exercise. However, renewed insight during proceedings, changed the perspective from a clear process perspective towards a more strategic one. This feasibility check too, becomes more strategic
10 than process oriented.
From the information gathered, no indication is given that Procurement engineering should be on the agenda for improvements.
Reviewing the input and the sample, the emphasis in the analysis is put on the business model “products” (instead of services, software and IT).
Combing the acknowledged consideration of a yearly external audit as maturity testing with the suggestion from literature, internal customer satisfaction/Net promoter score (business cases) with benchmarking gives a triangle to evaluate and self-reflect.
With respect to the behavioral issues. PM could be used for aligning people’s behavior. With that purpose, the measures should control and correct for the current behaviors. Issue here would then be that the behaviors and attitudes are too way off to be corrected by a PMS on itself. For sure additional actions would be needed to correct the behavior and secondly, the gap to the intended behavior is too width to be bridged at once.
4.4 CONCLUDING ’S
Combining all input, results in the following input: Keep the 2013 and add a few required strategic measures that reflect the strategic objectives. Incorporating the strategic measures gives executives direction on which they can steer the procurement function. For that, input is required on the “needs” and “perceptions” of the organization. In addition, to continuous improve procurement; input is required on the effectiveness and supportive role of procurement in combination with internal customer satisfaction. To close, procurement should ensure they have the best people on each position, which is measured by the “competence-role” kpi.
10 A concern with regards to the strategic objectives reflects the required level of maturity of procurement. The strategic objectives require a rather high level of maturity. Analyzing the current situation indicates the selected strategy is not in line with A) the level of maturity of Procurement’s systems, processes and IT; and B) not in line with the current behavior.
Confidential | Jan 28, 2014
42 | 5. Conclusion, Discussion & Management insight
5. CONCLUSION , DISCUSSION & MANAGEMENT INSIGHT
This chapter answers the research questions and provides additional insight by putting the applied process and findings of this thesis under discussion. Next, this chapter presents the management implications and closes by addressing the research limitations and future research directions.
The objective of this thesis was to analyze the 2013 Procurement KPI dashboard and make suggestions for improvements that were executable for 2014 or were strategic for future implications. The three distinct and sequential steps performed to get to these findings consisted of: a literature study, an analysis to evaluate the 2013 PM and PMS, and thirdly a design exercise to improve the PM. This thesis covered a period of 9 months during which the researcher was present in the organization and did numerous observations. In addition, he performed 77 interviews, analyzed internal documents, attended many different meetings and presentations, including workshops. The main research question:
“Which kpi’s should be incorporated in the Philips Procurement KPI Dashboard, what would their definition be and how should they be measured to give Management a more effective tool in their Performance Management?”
To answer the main research question, five sub questions needed to be answered:
1) What does the 2013 Procurement Performance measurement System look like? 2) What is a procurement performance measurement system and what conditions need to be in place to make it
work? 3) What are the problems with the 2013 KPI dashboard? 4) What should be done to improve the procurement performance measurement system? 5) What designs could help to bring improvements?
5.1 CONCLUSION
This sections will first answer each of the five research questions before answering the main research question.
Research question 1: What does the 2013 Procurement Performance measurement System look like?
The Procurement performance measurement systems for procurement top management consists of 17 kpi’s. These kpi’s are monthly reported by the SSC and the ambition is to track and measure uniform across the three sectors and IMS. The 2013 set is established according to a prototype technique by a few procurement stakeholders. Many of the 17 measures cannot be fully reported (May 2013).
Research question 2: What is a procurement performance measurement system and what conditions need to be in place to make it work?
A PMS is the set of metrics used to quantify both the efficiency and effectiveness of actions (Neely; Gregory; Platts, 1995). In general, the purpose is to compare results against expectations, with the intention to motivate, guide and improve decision making” (Lardenoije, Raaij, & Van Weele, 2005). A kpi Dashboard is considered a driving tool; it allows decision makers to have a real-time synthetic vision of the main indicators characterizing business and to establish certain decisions, as part of Performance Measurement (PM) (Georgescu & Ciobanica, 2012). It contains a small number of indicators (10 to 25 indicators), presented in readable form, and relate to important decisions and business objectives that are pursued by an official (Georgescu & Ciobanica, 2012).
The literature review indicated a few conditions are required to ensure a well-established set of metrics that is effective in driving PM. For one, the 9-step PMS development process of Neely (2000) is best suitable to safeguard the development process of the PMS. Two, A joint exercise should ensure that all stakeholders who are affected by the PMS are involved. Thirdly, full management commitment is required. Also, literature assumes that management has stated a clear role and purpose for their PMS.

Confidential | Jan 28, 2014
43 Linking Philips Procurement’s Performance Measurement to their Strategic Objectives|
Fourthly, IT and systems need to be standardized and sophisticated to support the PMS. Next, the outcome of the development process should be a set of measures being preferably non-traditional and also be “correct” measures. “Correct” measures are explained by Neely (2000) as measures that comply with the list of measurement requirements. This ensures the kpi’s role is for example unambiguous and strongly linked to a strategic objective and that accurate actions can be taken to influence the performance. Non-traditional measures in addition are also more dynamic and include also leading and intangible measures that cover more dimensions than finance alone.
The 9-step development model of Neely (2000) suggests a loop to plan, do, check and act to improve and update the system regularly to ensure a well fit with the strategic objectives and circumstances of the organization.
Research question 3: What are the problems with the 2013 PMS and KPI dashboard?
The PMS is suffering from the absence of key requirement not being in place: As a results, the 2013 PMS is has little effectiveness in supporting Performance Management. By May 2013, the development of the 2013 PMS is characterized as “prototyping”, which means a kind of “trial-and-error” technique. At that time, many of the measures cannot be accurately reported, if at all. The support among stakeholders for the PMS is low and within Philips Procurement only a few managers actively use and deploy the PMS. Although the PMS contains 17 kpi’s, the agenda focusses almost solely on savings, creating a gap between management reporting and the management agenda. In addition, many managers are skeptical about the drive of executives to enhance transparency in performances which creates resistance for further developments.
The causes for the ineffectiveness lie in the establishment of the PMS. The scope of this assignment allowed to indicate a set of the causes concerning the development of a PMS. To know, most of the requirements and conditions stated to ensure a PMS becomes well established and effective, are not in place. Firstly: the role and purpose of the PMS is not clear and unambiguously stated. Secondly, nor is full management commitment present. Thirdly, the development process is not in line with that of any of the suggested processes by leading authors, including the 9-step PMS development process by Neely (2000). Fourthly, the development process has also not taken place as a joint exercise. Five: IT and systems are not supporting the PMS and to close: Measures are typically traditional and also not “correct” in the way that they have an unclear role that is not strongly linked to a strategic objective, demonstrated by the fact that only 6 of the 2013 strategic objectives are measured in the 2013 PMS.
Not complying with these just listed conditions and requirements, resulted in a state where Performance Measurement is an ineffective tool in supporting executives in Performance Management.
Research question 4: What should be done to improve the procurement performance measurement system?
Improvements concern roughly three dimensions: Strategic, process-wise and outcome: Strategically concerning, management should clearly and unambiguously state the role and purpose of PM. The Philips Group has stated that performance Measurement is used to support a granular Performance Management that is driven by continuously improvements. Procurement executives should for their function be clear to enhance the trust issue and overcome the resistance. In addition, procurement executives should give their full commitment to make their PMS effective and successful. Next, the PMS development process should be a joint exercise. Together with the previously two mentioned recommendations would this enhance the overall alignment, support and consensus among stakeholders to not only use the PMS but to commit to it and further drive the effectiveness of it as a tool in Performance Management.
Process-wise: Procurement could apply the PMS development process as defined by Neely (2000). This process is easy to use and apply in an organization like Philips Procurement. By including all the 9 steps a

Confidential | Jan 28, 2014
44 | 5. Conclusion, Discussion & Management insight
continuous improvement loop is incorporated ensuring the PMS will always be up-to-date and strongly linked to strategic objectives.
Concerning the outcome; following this framework and guiding criteria, should result in an outcome that contains correct measures, being typically non-traditional. Leading measures that cover different dimensions would enable managers to take accurate actions and enhance the PMS to become a powerful management tool.
The success or failure of these recommendations depends heavily on the supporting role of IT & Systems. Currently, even the typical traditional measures cannot be reported accurately, if at all. Management will need to address this at a high level with EIM experts.
Research question 5: What designs could help to bring improvements?
Next to the recommendations related to research questions 4, a new design could bring improvements. A design that complements the 2013 set of measures with ones that are strategic, leading and mainly intangible measures (non-traditional) that give top management direction to steer the procurement function and organization itself. As procurement is going through a rapid transformation, top management could use measures to track the support and effectiveness of the transformation. Next, as the role of talented and motivated people is according to some the most important kpi of all, this should be included in the PMS. In addition, suppliers relationship strengths and satisfaction is important, as the affect many of the successes in innovation for Philips. Internal client satisfaction is also important, as procurement is a supporting and enabling function in the whole E2E process. To close, the alignment between procurement governance, the Businesses and Commodity Procurement should be safeguarded. This could be done with a simple ‘tick-in-the-box’ but also be measured in different dimensions to enhance the accuracy and power of actions and thus the effectiveness of the PMS.
This thesis started with the proposition that Procurement might not have an effective PMS in supporting Performance Management. Based on the findings in this study the proposition is valid. The explanation is already discussed in the different research questions above. The main research question:
“Which kpi’s should be incorporated in the Philips Procurement KPI Dashboard, what would their definition be and how should they be measured to give Management a more effective tool in their Performance Management?”
The outcome of the PMS design exercise suggests complementing the 2013 PMS with four new measures as described under research question 5. The four kpi’s are:
Job-role Competence fit
Business Partner alignment and satisfaction
Supplier Relationship strength
Enabling effectiveness
Although the role and purpose of some measures in the 2013 PMS are under discussion, overall the interviewees indicated not to make too radical changes. Therefore, most support was given to keep the 2013 kpi dashboard as the basis and to complement it with the suggestions.
Together with the recommendation to ensure the listed key requirements and conditions are in place, the suggested measurements will contribute to improve Performance Measurement in becoming an effective tool in Performance Management.
Confidential | Jan 28, 2014
45 Linking Philips Procurement’s Performance Measurement to their Strategic Objectives|
5.2 DISCUSSION
This section will elaborate of the whole process, research set up, findings and contextual discussion from the author’s point of view.
The absence of the introduced requirements to drive effective PMS, lead to an unclear system with little effectively. One could argue why to apply such an ineffective PMS as the costs for running it, are substantial in an organization like Philips. Interesting observation within Philips is that due to the highly traditional character is PMS, the investments might be less substantial. As the traditional measures are mainly financial performances, they are driven by finance. And finance uses these measures mainly for financial management reporting or for controlling purposes. This means the data is available anyway. Perhaps, this might also be one of the causes for the tendency for traditional measures when PMS is driven by finance (Eccles, 1991). Why should one invest the collection of different data, as already so much (financial) data is available.
Philips Group commitments and business systems principles emphasize on Philips-as-a-learning-organization and indicate to drive continuous improvement. Recently, within procurement the attention for benchmarking has increased. The ambition is to use kpi’s that are benchmark-able to assess Philips performance to that of other organizations. The benchmarking ambition is major and seems to overshadow, or perhaps even contradict with, the Philips Group commitment to drive continuous improvement. However, a too strong focus on benchmarking and incorporating mainly typically benchmarkable kpi’s increases the risk of silo thinking and working. Most commonly applied and reported benchmarkable kpi’s are straightforward kpi’s, measuring operational purchasing performances. They do not give much direction for a mature purchasing organization to drive continuous improvement, to further integrate and embed procurement throughout the organization and to enable a next level of innovation driving with suppliers.
About the PM and management agenda: The 1 billion savings objective is currently the most important kpi for procurement as it is an outspoken commitment to the financial markets. A focus on pure hard savings is typically the scope of a purchasing and supply maturity phase level 2. A focus on margin contribution and net result serves a more mature purchasing organization. The current scope contradicts the overall intended maturity level and strategic targets. However, processes and systems are not in place to fully support a more sophisticated cost modeling. The need for margin contribution, or even “sustainable margin contribution is high”. It would serve both the human aspects issues as well the focus on a more holistic and broad scope: company profit. Current savings methodologies are rather complex but also rather sophisticated. On a high level they give the incentive to realize hard savings. But, many purchasers are aware of the too narrow scope of the savings definition and realize they might not add to “netto margin contribution”. And if they do not only add savings, but also margin by enabling total supply chain optimization by incorporating flexibility for example, this effort is not acknowledged or registered by the systems. A more sophisticated cost modeling will create this transparency and increase a sense of commitment and engagement in contribution to the overall Philips performances.
Continuing on the maturity development: The level of maturity is not the same across all procurement’s functionalities. A maturity stage is not something static. Nor is the maturity development a linear process (Weele A. J., 2010). Procurement is eager to increase its performances. Literature suggests the potential value of procurement increases parallel with its maturity development. Therefore, the eagerness to perform should be coincided with the eagerness to transform. Literature suggest, with every maturity stage, a different strategy should be served with different kpi’s. More matured functions or departments can focus on the next development steps, while less mature can focus on the main transformation towards the next maturity level. Following the discrepancies between the maturity levels and the selected strategy, there is a major concern of a strategic nature. Due to the gaps in the maturity model, not only are the measures linked to the strategic objectives mostly not measureable, they are also not relevant as Key PI. From a strategic perspective, the organization should first transform and develop to the required level of maturity and adapt its kpi’s to that strategic objectives. Only after reaching the objective level of
Confidential | Jan 28, 2014
46 | 5. Conclusion, Discussion & Management insight
maturity on all critical dimensions (IT, processes and systems), management can move the focus on the KPI linked to the selected strategy. So, for one the kpi’s do not match the maturity level, secondly the focus should be on kpi’s making the transformation successful, and thirdly some kpi’s should not at all be in focus during the current maturity phase and fourthly, some kpi’s are not measurable at all. Bridging this gap demands an intensive transformation, especially when taking into account aspects like the current culture and attitude. As both Philips and Philips procurement executives acknowledge the need to change the organization to a higher maturity level, transformation and change management is required to bridge the gaps.
From that perspective, the current leadership style could be explained to a large extent. The current procurement executives could be labeled as authentic change managers. They are the “engineering” style leaders: very intelligent, fast analyzers and highly rational, but with a large amount of passion. Their leadership style is rather hard and could be labeled as “telling”, needed to unfreeze the organization (Jones, 2007). Taken into account the Philips legacy, where employees feel save, dialogue and consensus are key and a lack of accountability is commonly accepted, one understands the resistance to change is high. The leaders are perceived as slightly intimidating by their passion, engineering way of thinking and speed of operations.
While the objective strategy typically encompasses a performance driven leadership style with consensus and dialogue, the needed change requires a hard leadership style to break to the resistance. As Van Weele (2010) indicated, the maturity model is not something static where organizations develop themselves from one stage to the next over time, reality shows shift are more continuous and improvements might even be made by taking one step back to make two steps forward. So, the leadership style can be explained, as taking one step back to overcome the resistance to be able to build on the new organization which enables and support the stated strategy.
Although, from this model the leadership style can be explained and may seem logical, from a rational point of view it does not match the architecture of the organization, nor the stated strategy. This creates some tendencies. For one, for procurement to be fully supporting and enabling for the businesses, the hard leadership style undermines this full potential. Both for the purchasers, the internal client and the suppliers, a solid and balanced organization is needed to build forward on adding value by driving innovation from procurement (as stated). Under the current circumstances, these objectives can hardly be realized as the organization strives at highly standardized processes, is centralized led, is under transformation and uncertainties are high.
Strangely enough, prior to the author’s contributing efforts to derive a clear and written 2014 procurement strategy, there was not such a document. In addition, from interviews with different procurement managers, at varies times and locations reveals an image of unclarity about “the road procurement is heading”. Besides the key strategic objective concerning savings, there is a lot of fuzz, strengthened or caused by the ongoing transformation. Last element also results in a state of uncertainty for many employees and managers as they know not clearly what the organization will be like in one or two years, what their function will be of there is one at all. A state of uncertainty is commonly a side effect of a transformation. However interestingly, this uncertainty is contradicting with the objective continuous improvement.
A lot of lack of clarity can be explained by the transformation taking place. However, communication could leverage that to a certain level. As is for example for the current organization structure; even within procurement governance, some managers are not up-to-date on the changes taking place in the organizational structure. Therefore, the structure, one other element in Bititci’s (1997) model cannot be clearly filled in. But communication is scarce. Partly explainable by the leadership style. The leaders currently execute according to a typical human-as-machine metaphor. Governance is setting the rules, the objectives and even the way how to achieve the objectives (telling). Humans only have to-do. From this perspective, there is little need to share all developments and align everyone on the changes. “People should only do what they are told to do without playing difficult.”
Confidential | Jan 28, 2014
47 Linking Philips Procurement’s Performance Measurement to their Strategic Objectives|
Another interesting element to mention is the culture and attitudes. Although, these elements are not in scope or subject under investigation, they explain a lot and have an effect on the performance management style. Typically, based on observations, the culture and attitudes seem to be labeled as incongruent on a procurement function level. Across the different procurement functions and sites, the culture and attitudes would be labeled differently.
Not mentioned explicitly enough concerns joint target setting. As bottom line results depend heavily on the cooperation and alignment between different business functions, it is strange each of them has their own island when it comes to performance measurement. Procurement has no measures that concern any matter that is not 100% within the responsibility of procurement. There are plenty of situations in which joint exercises should be combined by joint target setting. One examples: procurement is dedicated to achieve savings. Even so strongly, the functions delays production by not ordering parts due the ambition to only purchase under savings conditions. The marginal saving realized by procurement is completely diminished due to extra operational costs due to delays, opportunity costs and lost sales. Take for example inventory costs. Having a joint target like time to market + margin would resolve situations like these.
Most of the just addressed issues relate (indirectly) to PM, but they do relate to Performance Management even more. Most of the issues addresses are factors or conditions that affect Performance Management. This underlines even more that improving the PMS only will only contribute to quick and unsustainable improvements as the real root causes are not tackled. The most impact will probably be made with a different culture. A performance culture in which silo thinking is not done and joint achievements are the standard. A soft transformation will most likely not be sufficient to achieve this needed change in mentality.
Yet, Philips leaders are aware of this threat. The internal slogan acknowledges the need by pushing the behaviors; “Eager to win, Take ownership and team up to excel”
Although, already during the assignment the change in attitude and mentality was recognizable, there are also subparts of procurement that resist to the aimed increase in transparency. Reasons for this resistance are the lack of faith in governance to understand the very specific circumstances of that subpart. They fear a performance management style, based on figures, without facts from the context. Some of these subparts just fear interference and a decrease of their autonomy.
Nevertheless, important improvements have been established during 2013. The suggested design of this study is a compromises of possibilities on one hand and support on the other. Nevertheless, following these recommendations would lead to improvements within the scope of the set framework in chapter two.
The final 2014 implemented PMS is aligned and “handshaked” with sectors’ procurement, but the establishment and proposals are dominantly driven by procurement. Surprisingly is the final implemented 2014 kpi dashboard and the improvements it shows compared to the 2013 dashboard. The balance in measurements dimensions has improved, the characteristics of the measures have improved and it reflects mostly the strategic objectives for the upcoming period. The measures are 100% expressed in ratios, like literature suggests.
5.3 IMPLICATIONS
The findings of this study contribute modestly to the existing theory, but mostly to practical implications for management teams like Philips Procurement. First, the theoretical findings are elaborated, followed by the management implications.
THEO R ETI CAL FIN DIN GS
The findings of this thesis are in line with that of many studies on PM, PMS and performance management. Business cases demonstrate a wide variety of organizations still fails to apply PM in their full
Confidential | Jan 28, 2014
48 | 5. Conclusion, Discussion & Management insight
benefit (Bourne, Neely, Platts, & Mills, 2002). Philips procurement is not exception to that. It seems obvious, but the very basic requirements, in line with common sense, are still not in place. The absence of these requirements leads to an unclear system with little effectively.
This study is one of the few that describes a business case in a dynamic environment such as the Philips Procurement in transformation organization, in so many details. This study also showed the difficulties of designing and establishing a new, tailored and up to the highest standards PMS.
This study contributes to theory as it explores the complementation and usage of leading PM and purchasing theories at top management level within a complex multinational organizational function. The findings and suggestions from both bodies of knowledge, considering requirements, drivers and pitfalls for establishing effective PM, are found and supported in this study by practice.
MANAGEMENT I MP LI CATIO NS
The findings in this study clearly give direction for management to take actions and improve their PMS, regardless of the maturity status of it. Management without any PMS experience could consider the potential added value of it for their situation, compared to the investments, requirements and barriers which might need to be overcome. For organizations along the way towards using PMS could review whether the basic requirements are in place to establish a possible effective PMS. And for organization who do, they could consider any continuous improvements and further sophistication of their PMS. For those organizations who have already everything elements towards successful and effective PMS in place: congratulations! You might just very well be very unique.
Based on the findings of this thesis, fulfilling a few basic requirements concerning PMS could transform an ineffective PMS into a possible powerful tool in performance management. However, managers should first take a higher level perspective on this subject: As PM is a tool supporting performance management, it might be beneficial to consider to analysis the performance management context also. It might just be, that the absence of a few requirements to drive effective PMS are just a symptom of higher level issues. The impact of any solution is always bigger closer to the root cause.
One other perspective, management might consider is the following suggestion of Nudurupati et al. (2011): “Providing performance information is not sufficient to improve business performance results. The real success lies in peoples’ behavior in using this performance information. Many executives and academics believe that the main reason, why performance measurement is short-lived is because of people’s behavior with the information (Nudurupati, et al., 2011; Eccles, 1991). Meekings (1995) argues that making people use measures properly not only delivers performance improvement but also becomes a vehicle for a cultural change, which helps in liberating the power of the organization.
For the future PMS design exercises or radical evaluations, management could be personally more involved in the PMS design process to stress the importance of it and who their commitment. At the same time, everybody who is affected by the PMS should be involved in the design process, which creates a challenge in large, diversified multinational like Philips.
Considering the improvements Philips Procurement has been able to make during 2013, concerning PM, creates confidence for future developments and performances. However, important to state, taking notice of a common pitfall that has affected the majority of the organizations able to implement and use PMS effectively, is to constantly evaluate and update the PMS. Because, as markets, technologies and organizations change, so should the PMS change.
5.4 LIMITATIONS
The objective of this thesis was to academically review the current PM and make suggestions for future improvements. Theory states clearly the design of PM should be a joined exercise, involving everyone it affects. And as some requirements to drive effective PM are not being met, the author attempted to fulfill these requirements as much as possible. However, this resulted in two drawbacks: for one, the many
Confidential | Jan 28, 2014
49 Linking Philips Procurement’s Performance Measurement to their Strategic Objectives|
interviews and brainstorm sessions with one or two stakeholders simultaneously during different iterations, cannot replace a well-organized set of workshops where everyone who it affects is joining simultaneously. And two, the chosen compromise is very time consuming and demands for many iterations. In addition, the author cannot substitute for the absence of full management commitment. Together with the just mentioned limitations of joined exercise, raises the risk of not finding the required alignment and support for the aspired improvement suggestions.
Eventually, the outcome of the thesis was not the aspired unambiguously and commonly supported set of measures for improvements. This was probably partly due to the above mentioned limitations. However, there are more factors causing limitations. For one, these are the time schedule and the coaching and consulting qualities of the author.
Bourne, Wilcox et al (2000) analyzed different business cases in which two experienced academic facilitators were taking senior management through an analysis of their business to initiate these PM design project. The process involved five half day workshops with senior management. On average it took four months to go through these analyses. The implementation phase to actual usage of the PMS took on average another 9 to 13 months (Bourne, Wilcox, Neely, & Platts, 2000).
During the workshops the facilitators took the roles of “process consultant” which resulted in the performance measured developed by the management team were from their own analysis, instead of being the result of a third party “expert” (Bourne, Wilcox, Neely, & Platts, 2000) which increased the level of identification with the outcome and engagement to further drive the outcomes.
Taken into account the author was unexperienced on the field of PM and PMS designing by the initiation of this project, it took him several months to acquire the necessary knowledge on these subjects. This consumed already up to almost 4 months of the project, which is not uncommon for a graduation project like this. However, is left only a short period of time for the actual design phase. As described above, the comprise on the design phase resulted in a heavy time consuming process in which a lot of alignment and attentions was required to ensure a solid supported and alignment outcome.
Another compromise is the inexperience of the author to coach and consult senior management, while executing a master’s thesis project. It takes experience or talent to combine a hands-on attitude that is appealing to senior management, while securing the academic relevance for the thesis. In reality, management and other stakeholders did not let themselves be coached or consulted in the way that the academic literature describes. Most of the stakeholders in this project expected only the solution and answers from the author, instead of asking them all kinds of difficult questions.
Having taken notice of these limitations, it might be surprising the outcome of this thesis is a solution direction that is being supported by all stakeholders, not taking into account the full procurement executive board. Last stakeholders did not provide full outspoken support for the final solution direction.
About the last identified limitation; not the full procurement top managements is part of the sample. Although the PMS is for the use of procurement executives and their direct line of subordinate managers, the sample of this thesis only includes two of the procurement executives. This limitation might even be more severe as the input from these two important stakeholders (both VP) is not fully aligned.
The used framework focusses on the design process of PMS and is taken account of the relevant purchasing context. But the scope is limited to the first design steps and leaves out a few important aspects. For one, it leaves out the actual implementation, cascading and communicating of the PMS towards the usage, reporting and review of the PMS. Secondly, PM is a tool supporting performance management and a complete holistic approach on this broader subject would probably improve the quality of the findings from this research. The broader business scope would create an even more integrated and granular perspective on the different observations and findings.
Other small limitations to name are: this thesis does not take into account the split in different operating models (Products, Service, IT and Software) like some Philips principles do. As It does not take into

Confidential | Jan 28, 2014
50 | 5. Conclusion, Discussion & Management insight
account performance management, it does also not take into account elements like Bititci (1997) indicated, like culture, attitudes and other elements labeled in appendix D12. Input is gathered from different stakeholders holding central positions within procurement
11, and although the stakeholders all
gave input in the same directions, it is questionable whether this sample is representative enough to cover the whole procurement organization consisting of 2000 employees.
5.5 FUTURE RESEARCH
This thesis has contributed to PM within a purchasing environment by reviewing the academic proceedings on this topic over the last 30 years, by reviewing the latest different theories from leading authors and complementing these into one framework applicable for a review and design exercise like this thesis did.
PM is a tool supporting performance management and a complete holistic approach on this broader subject would probably improve the quality of the findings from this research. The broader business scope would create an even more integrated and granular perspective on the different observations and findings. The author did perform a broader business perspective exercises, and based on these observation a preliminary findings would suggest there are subjects of matter at a higher organizational level that would bottom line outperform the impact of all the PM efforts
FUT UR E RESEAR CH FO R PHI LIP S
Out of scope for this thesis, but capable of explaining some more observations and findings from this thesis, is the purchasing and supply maturity development model (Weele, et al., 1998). This model distinguishes six different maturity development stages for a purchasing and supply chain functions, from a “transactional orientation” in phase 1 to a “value chain integration” in phase 6. Just based on observations, the author detects discrepancies in this development model between the variables: Note, there is no good or right in this model. Roughly, the author can indicate three different points of stages. A) the procurement function is build and supported by processes and IT in somewhere in the middle (II). Procurement strategy states the function should be in phase (III). However, in general the function operates according to phase (I). These discrepancies create some challenges and ineffectiveness. With each different phase of maturity, a different strategy is leading, supported by a different and aligned kpi dashboard. Phase (I) should be focused on cost savings, phase II on mediocre leverage and sourcing, some level integration and decentralized driven function, and initial (IT) standardization. Level (III) monitors the integration with supplier, effectiveness of procurement, innovation and revenue contribution. It might be worthwhile to consider analyzing these preliminary findings into more detail.
With respect to the behavioral issues. PM could be used for aligning people’s behavior. With that purpose, the measures should control and correct for the current behaviors. Issue here would then be that the behaviors and attitudes are too way off to be corrected by a PMS on itself. For sure additional actions would be needed to correct the behavior and secondly, the gap to the intended behavior is too width to be bridged at once. The author suggests to take these observation into account and consider further analysis.
FUT UR E ACADEMI C RESEAR CH
As this is one the few studies to describe a business case on PMS development in detail, future research could focus on deducting more of these business cases. In the future, research should then, better than now, provide leading factors to establish effective PMS in dynamic environments like Philips Procurement.
Although the findings from this design-oriented study are in line with that of the current literature base, because this detailed business case reflects only one function, more studies are required to reflect and evaluate these findings with respect to the complemented theories. It is unclear into what extent the findings from this business case are generalizable.
11
Agreed in Research Proposal: 1 representative per sector, Procurement PPS and Procurement CFO.

Confidential | Jan 28, 2014
51 Linking Philips Procurement’s Performance Measurement to their Strategic Objectives|
Confidential | Jan 28, 2014
52 | Note: Update December 2013
NOTE: UPDATE DECEMBER 2013
By December 2013, the final implemented 2014 procurement kpi dashboard is signed off. Although procurement executives did not fully support the solution directions as presented in November 2013, all the solution directions are captured into some extent in the final dashboard.
The competence fit is captured in kpi number 15, the “capability analysis”.
The internal effectiveness survey is captured by kpi number 13, the “change adoption survey”.
The alignment and satisfaction between commodities and the sectors is captured by kpi number 17, “Commodity Strategy Coverage”. This kpi was already measured, but with the developments and improvements, this kpi might result in a better fit than the 2013 version.
The addressed maturity issues (out of scope) are captured by kpi 14, “maturity development” and measures by external audits
Next to these kpi’s, procurement announced two other new kpi’s, number 10 “S-CONQ” and number 19 “Strategic versus tactical resources”. The final 2014 set contains 21 kpi’s. Details can be found in appendix B3.
Confidential | Jan 28, 2014
53 Linking Philips Procurement’s Performance Measurement to their Strategic Objectives|
REFERENCES
Abernethy, Bouwens, & Lent, v. (not published yet). The Role of Performance Measures in the Intertemporal Decisions of Business Unit Managers. Contemporary Accounting Research, n.a.
Bahill, A. T., & Botta, R. (2008). Fundamental Principles of Good System Design. Engineering Management Journal, 9-17.
Baker. (2002). Distortion and risk in optimal incentive contracts. The journal of human resources, 728-751.
Barret, R. (2004). Hype and reality in performance management. Measuring Business excellence , 9-14.
Bititci, U. S., Carrie, A. S., & McDevitt, L. (1997). Integrated Performance measurement systems: an audit and development guide. The TQM Magazine, 46-53.
Bourne. (2008). Performance measurement: learning from the past and projecting the future. Measuring bussines excellence, 67-72.
Bourne, M., Kennerley, M., & Francos-Santos, M. (2005). Managing through measuring: a study of impact on performance. Journal of Manufacturing Technology Management, 373-395.
Bourne, M., Neely, A., Platts, K., & Mills, J. (2002). The succes and failure of performance measurement initiatives. International Journal of Operations & Production Management, 1288-1210.
Bourne, M., Wilcox, M., Neely, A., & Platts, K. (2000). Designing, implementing and updating performance measuremnt systems. International Journal of Operations & Produiction Management, 754-771.
Bouwens, J. (2013, aug 7). input literature review. (P. v. Etten, Interviewer)
Brandmeier, R. A., & Rupp, F. (2010). Benchmarking procurement functions: causes for superios performance. benchmarking: An international Journal (benchmarking procurement functions), 5-26.
Briciu, S., & Căpuşneanu, S. (2010). EFFECTIVE COST ANALYSIS TOOLS OF THE ACTIVITY-BASED COSTING (ABC) METHOD. Annales Universitatis Apulensis Series Oeconomica, 25-35.
Buxmann, P., Ahsen, A. v., & Dıaz, L. M. (2008). Economic evaluation of cooperation scenarios in supply chains. Journal of Enterprise Information Management, 247-262.
Cameron, K. S., & Quin, R. E. (2006). Diagnosing and Changing Organizational Culture. San Fransisco: A Wiley Imprint.
Campbell, D., Datar, S., Kulp, S. C., & Narayanan, V. (2002). Using the balanced Scorecard as a control system for monitoring and rivising corporate strategy. Harvard NOM Research paper No. 02-35.
Chan, T. C., Ng, K. Y., & Casimir, G. (2010). he diminished effect of psychological empowerment on the self-empowered. Managing Service Quality, 531-543.
Chandler, A. D. (1977). The visible hand. Cambridge: Harvard University Press.
Cody, W., Kreulen, J., Krishna, V., & Spangler, W. (2002). The integration of business intelligence and knowlegde management. IBM systems journal, 697-713.
Collins, J. (2001). Good to Great. New York: Random House Busisess.
Cravens, K. S., & Oliver, E. G. (2006). Employees: The key link to corporate reputation management. Kelley School of Business, 293-302.
Confidential | Jan 28, 2014
54 | References
Cravens, K. S., & Oliver, E. G. (2006). Employees: The key link to corporate reputation management. Business Horizons, 293-302.
Daniels, B. (1990). Performance Indicators. Worl Study , 22-26.
Datar, S., Kulp, S. C., & Lambart, R. A. (2001). Balancing performance measures. Journal of Accounting Research, 75-92.
Duffy, R. J. (March 2009). Critical issues report: Measuring purchasing's effectiveness. Arizona: CAPS Research.
Eccles. (1991). The performance measurement manifesto. Harvard Business Review.
Elbashir, M. Z., Collier, P. A., & Davern, M. J. (2008). Measuring the effects of business intelligence systems: The relationship between business process and organizational performance. International Journal of Accounting Information Systems, 135–153.
Evans, J. (2004). An exploratory study of performance measurement systems and relationships with performance results. Journal of Operations Management, 219-232.
Evans, J. R. (2007). Impacts of information management on business performance. Benchmarking: An international Journal, 517-533.
Flapper, S. D., Fortuin, L., & Stoop, P. P. (1996). Towards consistent performance management systems. International Journal of Operarions & Production Management, 27-37.
Flatt, S. J., & Kowalczyk, S. J. (2008). Creating competitive advantage through intangible assets: The direct and indirect effects of corporate culture and reputation. Advances in competitiveness Research, 13-30.
Francos-Santos, M., Kennerley, M., Micheli, P., Martinez, V., Mason, S., Marr, B., et al. (2007). Towards a definition of a business performance measurement system. International Journal of Operations & Production Management, 784-801.
Georgescu, L. S., & Ciobanica, M.-L. (2012). MONITORING ORGANIZATIONAL PERFORMANCE THROUGH SCOREBOARD. Economics, Management, and Financial Markets, 711-715.
Ghalayini, & Noble. (1996). The changing basis for performance meaurement. International Journal of Operationa and Prpoduction Management, 63-80.
Haas, M. d., & Kleingeld, A. (1999). Multilevel design of performance measurement systems: enhancing strategic dialogue throughout the organization. Management Accounting Reserach, 233-261.
Halachmi, A. (2005). Performance measurement is only one way of managing performance. International Journal of Productivity and Performance Management, 502-516.
Handfield, Monczka, Giunipero, & Patterson. (2011). Sourcing and Supply Chain Management. South-Western: Cengage.
Hemsworth, D., Sanchez-Rodriguez, C., & Bidgood, B. (2005). performance, Determining the impact of quailty managemeng practices in purchasing- related information systems on purchasing. Journal of Enterprise information Management, 169-194.
Henri, J.-F. (2006). Organizational culture and performance measurement systems. Accounting, Organizations and Society, 77-103.
Hudson, M., Smart, A., & Bourne, M. (2001). Theory and practice in SME performance measurement systems. International Journal of Operations & Production Management, 1096-1115.
Confidential | Jan 28, 2014
55 Linking Philips Procurement’s Performance Measurement to their Strategic Objectives|
Humphreys, P. (2001). Designing a management development programme for procurement executives. Journal of Management Development, 604-623.
intranet, P. (2011, may). Accelerate story.
Jones, G. R. (2007). Organizational theory, design and change. Upper saddle River, New Yersey: Pearson Prentice Hall.
Kalkar, P., & BorgaveSachin. (2010). Benchmarking supply chain with balanced scorecard:A conceptual framework. Journal of Business Excellence, 1-5.
Kaplan, R. S., & Norton, D. P. (2001). Transforming the Balanced Scorecard from Performance Measurement to Strategic Management. Accounting Horizons, 87-104.
Kaplan, R. S. (2005). How the balanced Scorecard complements the McKinsey 7-S model. Strategy and Leadership, 41-46.
Kaplan, R. S., & Norton, D. P. (1992). The balaced scorecard- Measures that drive performance. Harvard Business Review.
Kaplan, R. S., & Norton, D. P. (1993). Putting the balanced scorecard to work. Harvard Business Review.
Kaplan, R. S., & Norton, D. P. (1996). The balanced scorecard: Translating Strategy into Action. Harvard Business School.
Kennerley, M., & Neely, A. (2003). Measuring Performance in a changing business environment. International Journal of Operations and Production Management, 213-229.
Kennerley, M., Neely, A., & Adams, C. (2003). Survival of the fittest: measuring performance in a changing business environment. Measuring Business Exellence, 37-43.
Kerklaan, L. (2007). De cockpit van de organisatie. Deventer: Kluwer.
Khare, A., & Saxsena, A. (2012). Supply Chain Performance Measures for gaining Competitive Advantage: A review. Journal of Management and Strategy, 25-33.
Kibbeling, M., & Weele, A. v. (2010). Waarde creeren in de keren: de effecten van marktgerichtheid, duurzaamheid en innovatie. Holland Belgium Management review, 2-12.
Knudsen, D. (2003). Aligning corporate strategy, procurement strategy and e-procurement tools. International Journal of Physical Distribution & Logistics Management, 720-734.
Kotter, J. P., & Heskett, J. L. (1992). Corporate culture and performance. New York: The Free Press.
Lambert, R. (2001). Contracting theory and accounting. Journal of Accounting and Economics, 3-87.
Landy, F. J., & Conte, J. M. (2004). Work in the 21st century. New-York: McGrwa-Hill.
Lardenoije, Raaij, & Van Weele. (2005). Performance Management Models and Purchasing: Relevance Still Lost. Researches in Purchasing and supply management, the 14th ISPERA Conference.
Lohman, C., Fortuin, L., & Wouters, M. (2004). Designing a performance measurement system: A case study. European Journal of Operational Research, 267-286.
Loshin, D. (2013). Business Intelligence The Savvy Manager's Guide, second edition. Waltham: Elsevier Inc.
Low, J., & Siesfeld, T. (1998). measures that matter: non-financial performance. Strategy and Leadership, 24-38.

Confidential | Jan 28, 2014
56 | References
Martinez. (2005). What is the value of using Performance Management sSstems. Perspectives on performance, 16-18.
Meekings, A., Povey, S., & Neely, A. (2009). Performance plumbing: installing performance management systems to deliver lasting value. Meausring Business Excellence, 13-19.
Monczka, R. M., Carter, P. L., & Hoagland, J. H. (1979). Purchasing performance : measurement and control . East Lansing: Michigan State University.
Neels, A., Mills, J., Platts, K., Gregory, M., & Richards, H. (1994). Realizing Strategy through Measurement. International Journal of Operations & Production Management, 140-152.
Neely, & Bourne. (2000). Why measurement initiatives fail. Measuring Business Excellence, 3-6.
Neely, A. (1999). the performance measurement revolution: why now and what next. International Journal of Operations & Production Management, 205-228.
Neely, A. (2005). The evolution of performance measurement research Developments in the last decade and a research agenda for the next. International Journal of Operations & Production Management, 1264-1277.
Neely, A., Bourne, M., Kennerley, M., Mills, J., Platts, K., Richards, H., et al. (2000). Performance measurement system design: developing and testing a process-based approach. International Journal of Operations & Production Management, 1119-1145.
Neely, A ., Richards, H., Mills, J., Platts, K., & Bourne, M. (1997). Designing performance measures: a structured approach. International Journal of Operarions & Production Management, 1131-1152.
Neely, A., Yaghi, B., & Youell, N. (2007). Enterprise Performance Management: The global state of arts. Cranfield: Cranfield University School of Management & Oracle.
Neely; Gregory; Platts. (1995). Performance measurement system design. International Journal of Operations & Production Management, 80-116.
Nudurupati, S., Bititci, U., Kumar, V., & Chan, F. (2011). State of the art literature review on performance measurement. Computers & Industrial Engineering, 279-290.
Passioned Group, d. c. (2013). The KPI Resolver. Retrieved 9 3, 2013, from Passioned Group: http://www.passionned.com/performance-management/key-performance-indicators-kpis/the-kpi-resolver-measure-less-know-more/
Philips. (2012). Philips Annual report 2012. Amsterdam: Philips.
Philips. (2012). Philips Business system principles. intranet: Philips.
Philips. (2013). Philips Business Systems (PBS). Amsterdam: Philips.
Philips. (2013, march 25). Accelerate. Retrieved juni 5, 2013, from Philips intranet: http://pww.philips.com/apps/g_dir/e1607001.nsf/pages/accelerate-sixposters201303
Pooler, V. H., Pooler, D. J., & Farney, S. D. (2004). Global Purchasing and Supply Management. Dordrecht: Kluwer Academic Publishers.
Pun, K. F., & White, A. S. (2005). A performance measurement paradigm for integrating strategy formulation: a review of systems and frameworks. International Journal of Management Reviews, 49-71.
Rietveld, G. (2009). Inkoop een nieuw paradigma. Den Haag: Sdu Uitgevers.
Rose, C., & Thomsen, S. (2004). The impact of Corporate Reputation on Performance. European Management Journal, 201-210.

Confidential | Jan 28, 2014
57 Linking Philips Procurement’s Performance Measurement to their Strategic Objectives|
Rozemeijer, F. A., Weele, A. v., & Weggeman, M. (2003). Creating Corporate Advantage through purchasing: Toward a contingency model. The Journal of Supply Chain Management: A global review of purchasing and supply, 4-12.
Rozemijer, F. (2013, 06 17). Blogs. Retrieved 08 30, 2013, from Supply Chain Magazine: http://www.supplychainmagazine.nl/inkoop-het-nieuwe-verkopen/
Ruth, T. (1996). The attributes of leadership. Leadership & Organization Development Journal, 27-31.
Saranga, H., & Moser, R. (2010). Performance evaluation of purchasing ans supply management using value chain DEA approach. European Journal of Operational Research, 197-205.
Scheer, A.-W., Jost, W., Hess, H., & Kronz, A. (2005). Corporate Performance Management. Berlin Heidelberg: Springer .
Sinclair, D., & Zairi, M. (1995). Performance measurement as an obstacle to TQM. The TQM Magazine, 42-45.
Srivastava, A. K., & Sushil. (2013). Modeling strategic performance factors for effective strategy execution. International Journal of Productivity and Performance Management, 554-582.
Supply-Business. (2012, spring). Supply Business. Retrieved aug 22, 2013, from Supply business Articles: http://www.supplybusiness.com/previous-articles/january-2013/any-other-business/executive-coach-dick-russill/
Ukko, J., Tenhunen, J., & Rantanen, H. (2007). Performance measurement impacts on management and leadership: Perspectives of management and employees. International Journal of Production economics, 39-51.
Van Etten. (2013). Towards a Performance Measurement framework for Philips Procurement. unpublished.
Van Weele, A.J. (2010). Purchasing and supply chain management. Hampshire: Cengage Learning.
Van Weele, A.J. (1984). Purchasing Control Performance Measurement of the Industrial Purchasing Function,. dissertation Eindhoven University of Technology.
Van Weele, A.J., Rozemeijer, F., Rietveld, G. (1998). Professionalising purchasing in organisations: towards a purchasing development model. Proceedings for 7th international annual IPSERA conference, 513-523.
Waal, A. A., Heijden, B. I., & Meyer, C. S. (2012). Characteristics of high Performing Managers in The Netherlands. Leadership & Organization Development Journal, 131-148.
Wilson, J., & Neely, A. (1992). Measuring Product Goal Congruence: An Exploratory Case Study. International Journal of Operations & Production Management, 45-52.
Wynstra, F., Van Weele, A. J., Axelson, B. (1999). Purchasing involvemen in product development: a framework. European Journal of Purchasing and Supply Chain Management, 129-141.
Yigitbasioglu, O. M., & Velcu, O. (2012). A review of dashboards in performance management: Implications for design and research. International Journal of Accounting Information Systems, 41-59.
Confidential | Jan 28, 2014
58 | References
APPENDIX 1: PROCUREMENT TRANSFORMATION
To contribute and comply with the Accelerate! Program, Procurement has initiated a program called Procurement Transformation. According to the Philips Intranet, this program contains two key elements:
Additional Cost savings
New Procurement Model
The first element, additional cost savings, is translated to the Dfx conventions program. This initiative is added to the existing savings targets. Executed parallel with the first element, the second element of the Procurement Transformation Program is about a new Procurement Operating Model. Incorporating best practices from outside and inside Philips, this will establish a unified, standardized way of working for all our company. Overall, Philips aims to take a more strategic approach to procurement, with best practices embedded in our End-to-End processes, including Idea to Market (I2M) and Market to Order (M2O).
From a web broadcast from the CPO, the following goals were presented, “Key goals of the Procurement organization transformation
12:
Explore full synergies between products and businesses by establishing a fully verticalized Commodity Management organization which
o Owns the commodity sourcing strategy o Is located at the center of gravity of their supply base o Has deep technical commodity expertise
Establish strategic horizontal Procurement Engineering roles to support Early Involvement (I2M) and project sourcing (M2O)
o Institutionalize a new holistic DfX approach with main focus on optimization of TCO over lifetime and obtain the mandate to act as neutral value chain assessor
o Act as one-stop shop for BG/BU regarding Procurement related matter, to ensure smooth transition for business leaders
Ensure clear separation between strategic and tactical roles
Establish a Procurement Excellence culture around a functional process house and a strong value proposition for talent attraction and retention.
These ongoing transformations are important to keep in mind. They could explain observations as “being-in-between-statuses” or some aspects might to be yet taken place and be relevant to be considered in designing the suggested kpi dashboards.
12
Philips Intranet
Confidential | Jan 28, 2014
59 Linking Philips Procurement’s Performance Measurement to their Strategic Objectives|
APPENDIX 2: ACCELERATE!13
Accelerate! is a Philips worldwide transformation program to unlock Philips' full potential, making Philips a more agile, entrepreneurial and innovative company and bringing us closer to our customers.
To be truly successful Philips needs to change. Philips needs faster innovation, increased speed and excellence of execution, more collaboration between markets and businesses and to equip teams with the right resources to be successful. The changes as defined in our Accelerate! journey are being driven through 5 key initiatives:
Customer Centricity
Resource to Win
End2End
Operating Model
Growth and Performance Culture.
Citation from the Accelerate presentation available on Philips intranet, see figure 1 in appendix E. See also Appendix E, figure 2 for management commitment, which has a close connection with the Accelerate Program.
“By driving performance with transparency accountability for granular business market plans and empowering and strengthening our customer-facing teams to win profitable market share. We will reduce complexity and deliver our innovations faster along the end-to-end highway to the customer. And carry through our strategies with the resources to win our critical market battles” (intranet, 2011).
Some key elements:
Philips Group Strategy: manage portfolio with clearly defined strategies and allocate resources to maximize value creation
Strengthen and leverage core Capabilities, Assets & Positions as they create differential value
Philips Excellence: Deliver excellence by applying our operating principles
Philips PATH-TO-VALUE: Define and execute business plans that deliver sustainable results along a credible Path-to-Value
In addition, a statement from the Accelerate program gives a clear description about the nearby future direction in relation to performance management: “We are a learning organization that applies common operating principles to deliver Philips Excellence. We govern through Business-Market Combinations and a single value-added layer. We serve our customers with speed & excellence through lean, process-driven End2End value chains. We run a single, granular, performance management cycle with aligned objectives and rewards. We champion our Growth and Performance Culture, always acting with integrity. We embrace continuous improvement and learning to enhance our capabilities” (Philips K. , 2013)
APPENDIX 3: PHILIPS HIGH LEVEL ORGANIZATIONAL STRUCTURE
13 Philips intranet
Executive Committee
Healthcare Consumer Lifestyle
Lighting Innovation, Group & Services

Confidential | Jan 28, 2014
60 | References
APPENDIX 4: PROCUREMENT KPI DASHBOARD (JUNE , 2013)
CONFIDENTIAL

Confidential | Jan 28, 2014
61 Linking Philips Procurement’s Performance Measurement to their Strategic Objectives|
CONFIDENTIAL

Confidential | Jan 28, 2014
62 | References
APPENDIX 5: 2013 PROCUREMENT KPI DASHBOARD (JUNE , 2013)
CONFIDENTIAL

Confidential | Jan 28, 2014
63 Linking Philips Procurement’s Performance Measurement to their Strategic Objectives|
APPENDIX 6: 2014 PROCUREMENT KPI DASHBOARD (DEC , 2013)
CONFIDENTIAL
Confidential | Jan 28, 2014
64 | References
APPENDIX 7: SUMMARY OF SEVERAL IT ERATIONS
RE M A I N C U R R E N T KPI’S
As Section 4.2 already indicated, a few of the stated strategic objectives are already reflected by measures in the current PM. Although for some measures, improvements are possible, in general they remain the same.
1 bln savings: no changes required on the kpi itself. Note, discussion on the sustainable margin contribution
Procurement transformation: Note, the widely supported suggestion for executives to measure and manage the effectiveness of the transformation.
Reduce S-CONQ: under development.
Sustainability: No improved feasible measurement found
Payment terms: remain
PO S T P O N E D O R N O F E A S I B L E M E A S U R E P O S S I B L E
On some other strategic objectives, stakeholders are working to realize a situation where the strategic objectives can reflected by measurer. For example:
Effective Procurement Cost leadership: under development by the Procurement CFO.
Sustainable cost advantage: developments on short term by the Procurement CFO.
Innovation with Suppliers: postponed, no feasible kpi found that is being supported, drives the right behaviour and gives opportunity to take accurate actions
Leveraged supply base: postponed, no feasible kpi found that is being supported and gives opportunity to take accurate actions
Outstanding Procurement Competence: no feasible kpi found that measures the objective and gives opportunity to take accurate actions
Faster than competition: no feasible kpi found. However, alternative would be to improve throughput and cycle times in the whole procurement E2E process.
Early supplier involvement: postponed, no feasible kpi found that drives the right behavior and gives opportunity to take accurate actions
Talent, Entrepreneurial and fearless spirit: no feasible kpi: covered mostly by “attract, Retain and develop talent”
NE W K P I ’S
Attract, retain and develop talent
Strong Partnerships with business
Strong partnerships with suppliers
Strategic alignment with business
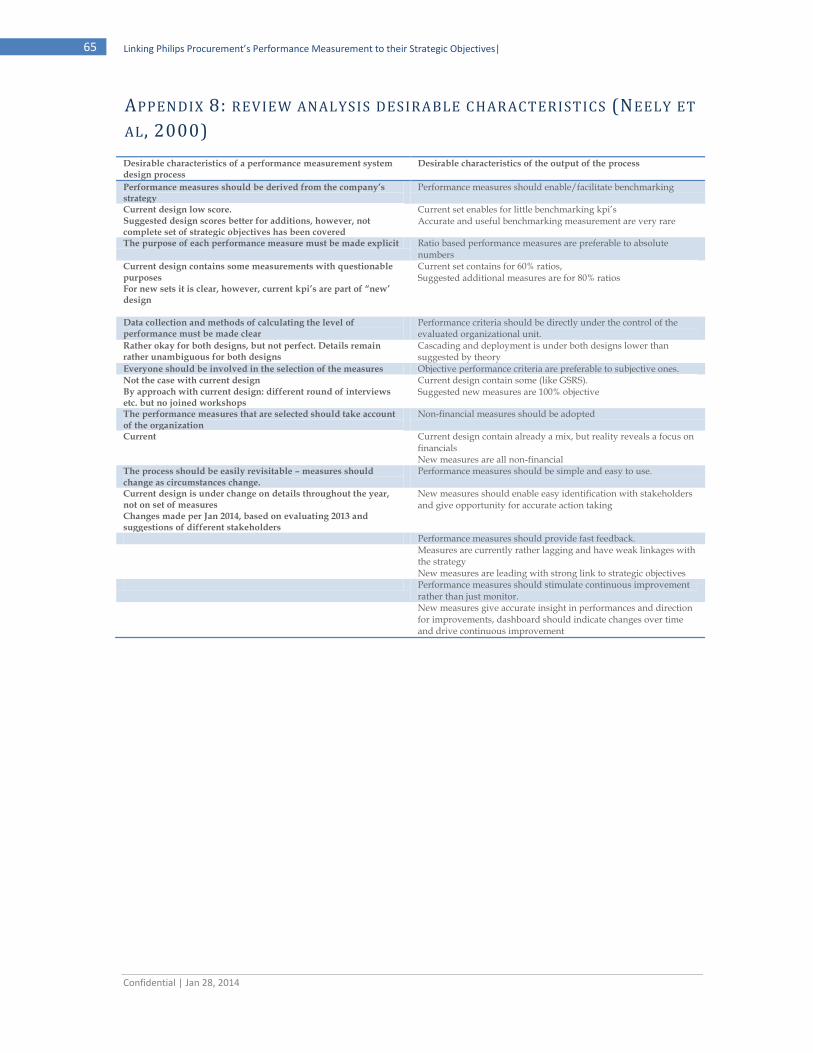
Confidential | Jan 28, 2014
65 Linking Philips Procurement’s Performance Measurement to their Strategic Objectives|
APPENDIX 8: REVIEW ANALYSIS DESIRABLE CHARACTERISTICS (NEELY ET
AL , 2000)
Desirable characteristics of a performance measurement system design process
Desirable characteristics of the output of the process
Performance measures should be derived from the company’s strategy
Performance measures should enable/facilitate benchmarking
Current design low score. Suggested design scores better for additions, however, not complete set of strategic objectives has been covered
Current set enables for little benchmarking kpi’s Accurate and useful benchmarking measurement are very rare
The purpose of each performance measure must be made explicit Ratio based performance measures are preferable to absolute numbers
Current design contains some measurements with questionable purposes For new sets it is clear, however, current kpi’s are part of “new’ design
Current set contains for 60% ratios, Suggested additional measures are for 80% ratios
Data collection and methods of calculating the level of performance must be made clear
Performance criteria should be directly under the control of the evaluated organizational unit.
Rather okay for both designs, but not perfect. Details remain rather unambiguous for both designs
Cascading and deployment is under both designs lower than suggested by theory
Everyone should be involved in the selection of the measures Objective performance criteria are preferable to subjective ones. Not the case with current design By approach with current design: different round of interviews etc. but no joined workshops
Current design contain some (like GSRS). Suggested new measures are 100% objective
The performance measures that are selected should take account of the organization
Non-financial measures should be adopted
Current Current design contain already a mix, but reality reveals a focus on financials New measures are all non-financial
The process should be easily revisitable – measures should change as circumstances change.
Performance measures should be simple and easy to use.
Current design is under change on details throughout the year, not on set of measures Changes made per Jan 2014, based on evaluating 2013 and suggestions of different stakeholders
New measures should enable easy identification with stakeholders and give opportunity for accurate action taking
Performance measures should provide fast feedback. Measures are currently rather lagging and have weak linkages with
the strategy New measures are leading with strong link to strategic objectives
Performance measures should stimulate continuous improvement rather than just monitor.
New measures give accurate insight in performances and direction for improvements, dashboard should indicate changes over time and drive continuous improvement

Confidential | Jan 28, 2014
66 | References
APPENDIX 9: 2013 COVERAGE STRATEGIC OB JECTIVES BY KPI ’S
CONFIDENTIAL
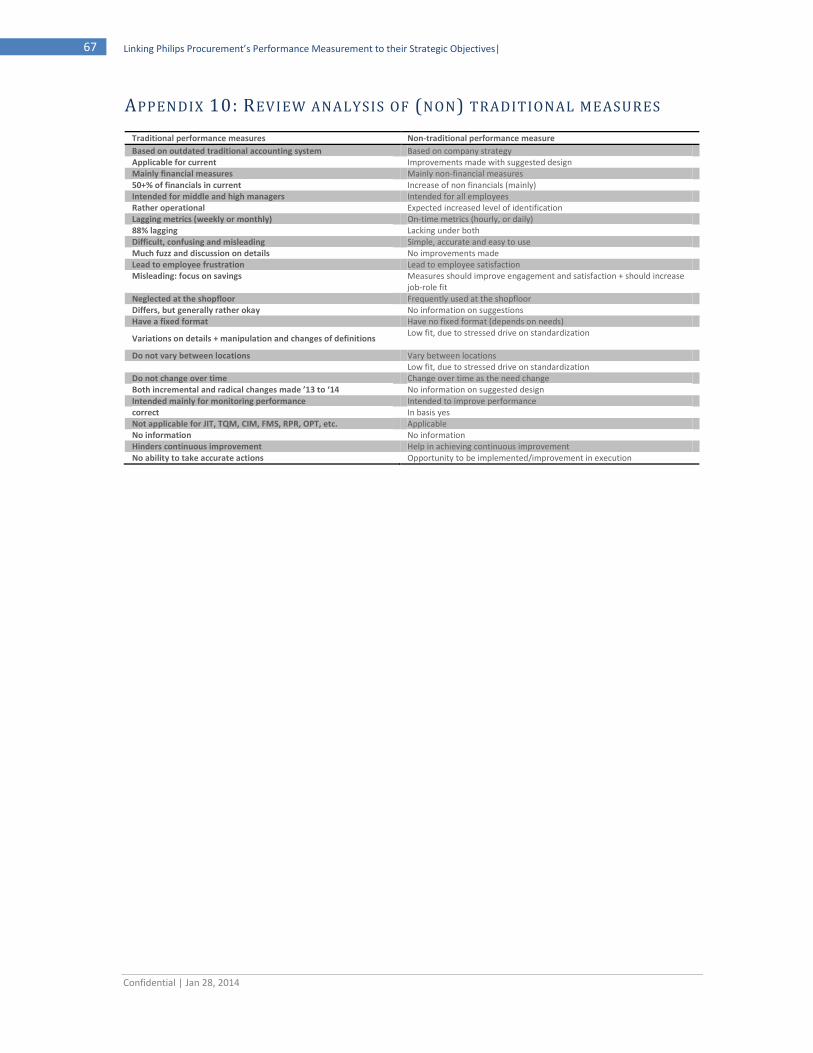
Confidential | Jan 28, 2014
67 Linking Philips Procurement’s Performance Measurement to their Strategic Objectives|
APPENDIX 10: REVIEW ANALYSIS OF (NON) TRADITIONAL MEASURES
Traditional performance measures Non-traditional performance measure
Based on outdated traditional accounting system Based on company strategy Applicable for current Improvements made with suggested design Mainly financial measures Mainly non-financial measures 50+% of financials in current Increase of non financials (mainly) Intended for middle and high managers Intended for all employees Rather operational Expected increased level of identification Lagging metrics (weekly or monthly) On-time metrics (hourly, or daily) 88% lagging Lacking under both Difficult, confusing and misleading Simple, accurate and easy to use Much fuzz and discussion on details No improvements made Lead to employee frustration Lead to employee satisfaction Misleading: focus on savings
Measures should improve engagement and satisfaction + should increase job-role fit
Neglected at the shopfloor Frequently used at the shopfloor Differs, but generally rather okay No information on suggestions Have a fixed format Have no fixed format (depends on needs)
Variations on details + manipulation and changes of definitions Low fit, due to stressed drive on standardization
Do not vary between locations Vary between locations Low fit, due to stressed drive on standardization Do not change over time Change over time as the need change Both incremental and radical changes made ’13 to ‘14 No information on suggested design Intended mainly for monitoring performance Intended to improve performance correct In basis yes Not applicable for JIT, TQM, CIM, FMS, RPR, OPT, etc. Applicable No information No information Hinders continuous improvement Help in achieving continuous improvement No ability to take accurate actions Opportunity to be implemented/improvement in execution
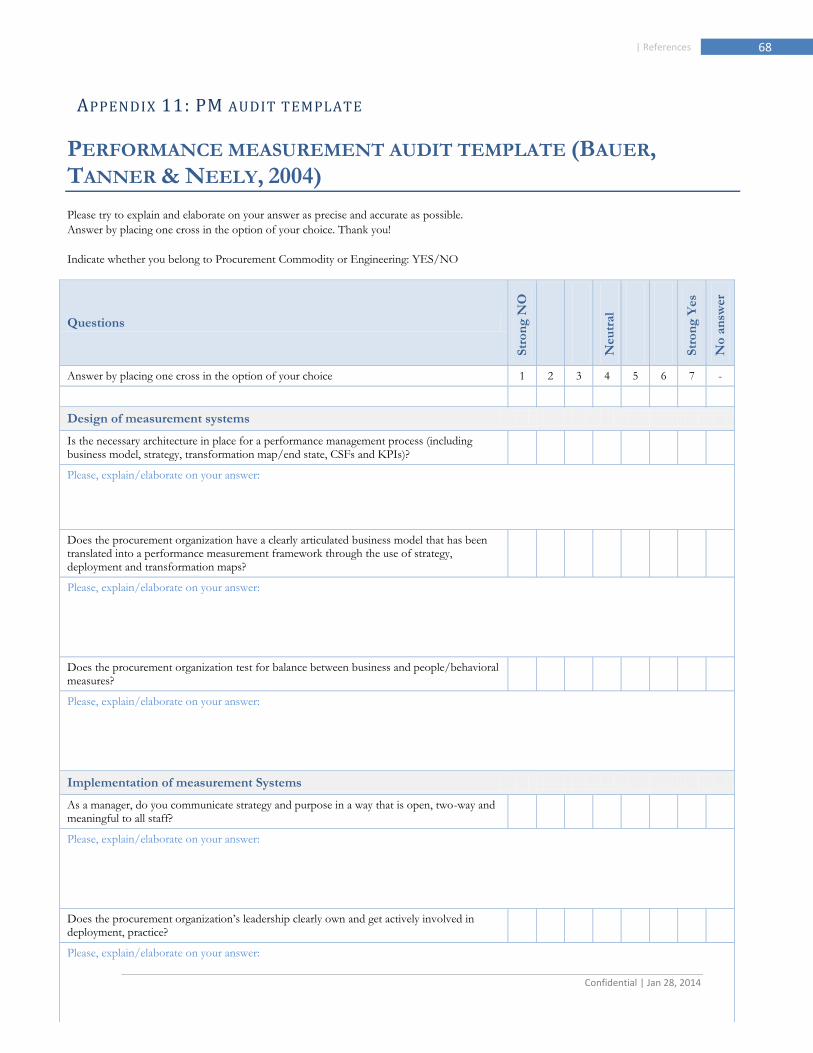
Confidential | Jan 28, 2014
68 | References
APPENDIX 11: PM AUDIT TEMPLATE
PERFORMANCE MEASUREMENT AUDIT TEMPLATE (BAUER, TANNER & NEELY, 2004)
Please try to explain and elaborate on your answer as precise and accurate as possible.
Answer by placing one cross in the option of your choice. Thank you!
Indicate whether you belong to Procurement Commodity or Engineering: YES/NO
Questions
Str
on
g N
O
Neu
tral
Str
on
g Y
es
No
an
swer
Answer by placing one cross in the option of your choice 1 2 3 4 5 6 7 -
Design of measurement systems
Is the necessary architecture in place for a performance management process (including business model, strategy, transformation map/end state, CSFs and KPIs)?
Please, explain/elaborate on your answer:
Does the procurement organization have a clearly articulated business model that has been translated into a performance measurement framework through the use of strategy, deployment and transformation maps?
Please, explain/elaborate on your answer:
Does the procurement organization test for balance between business and people/behavioral measures?
Please, explain/elaborate on your answer:
Implementation of measurement Systems
As a manager, do you communicate strategy and purpose in a way that is open, two-way and meaningful to all staff?
Please, explain/elaborate on your answer:
Does the procurement organization’s leadership clearly own and get actively involved in deployment, practice?
Please, explain/elaborate on your answer:
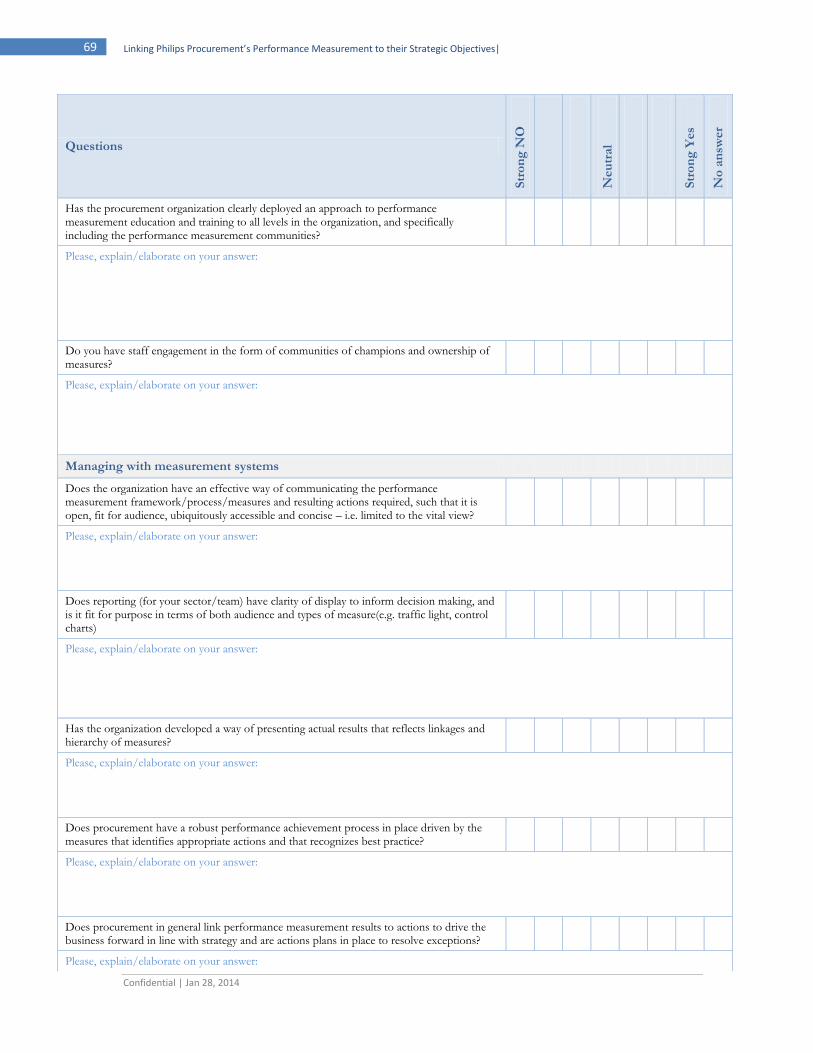
Confidential | Jan 28, 2014
69 Linking Philips Procurement’s Performance Measurement to their Strategic Objectives|
Questions
Str
on
g N
O
Neu
tral
Str
on
g Y
es
No
an
swer
Has the procurement organization clearly deployed an approach to performance measurement education and training to all levels in the organization, and specifically including the performance measurement communities?
Please, explain/elaborate on your answer:
Do you have staff engagement in the form of communities of champions and ownership of measures?
Please, explain/elaborate on your answer:
Managing with measurement systems
Does the organization have an effective way of communicating the performance measurement framework/process/measures and resulting actions required, such that it is open, fit for audience, ubiquitously accessible and concise – i.e. limited to the vital view?
Please, explain/elaborate on your answer:
Does reporting (for your sector/team) have clarity of display to inform decision making, and is it fit for purpose in terms of both audience and types of measure(e.g. traffic light, control charts)
Please, explain/elaborate on your answer:
Has the organization developed a way of presenting actual results that reflects linkages and hierarchy of measures?
Please, explain/elaborate on your answer:
Does procurement have a robust performance achievement process in place driven by the measures that identifies appropriate actions and that recognizes best practice?
Please, explain/elaborate on your answer:
Does procurement in general link performance measurement results to actions to drive the business forward in line with strategy and are actions plans in place to resolve exceptions?
Please, explain/elaborate on your answer:
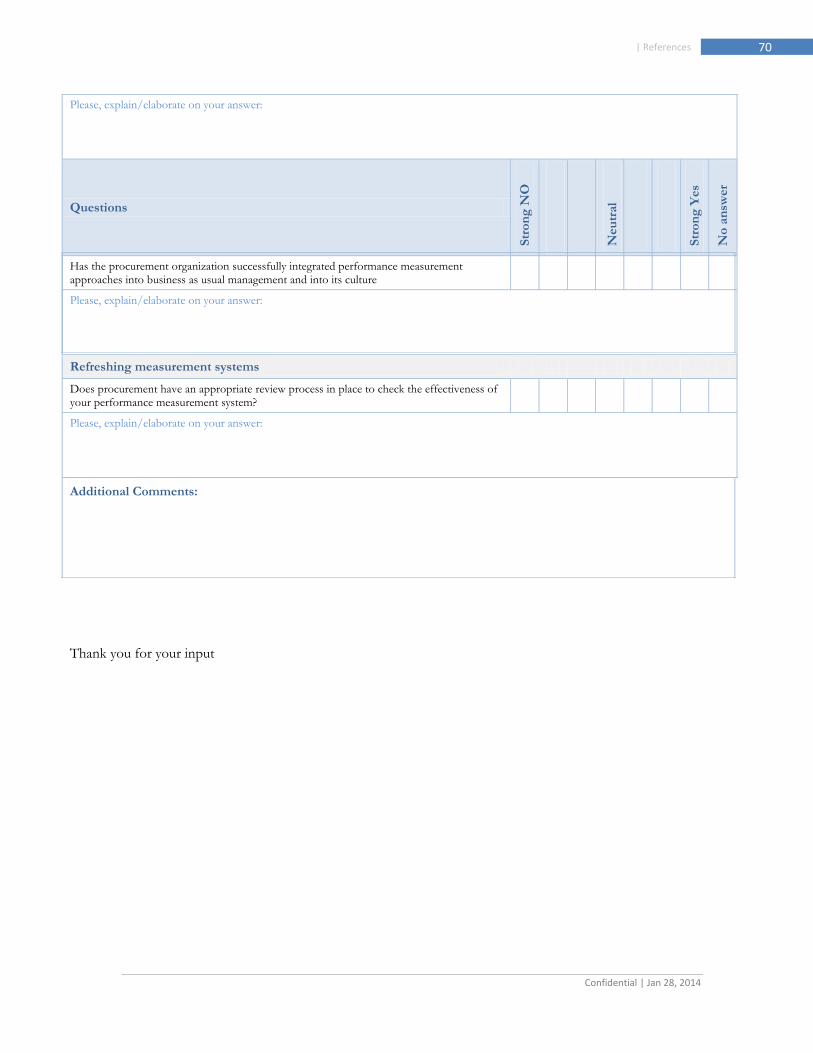
Confidential | Jan 28, 2014
70 | References
Thank you for your input
Please, explain/elaborate on your answer:
Questions
Str
on
g N
O
Neu
tral
Str
on
g Y
es
No
an
swer
Has the procurement organization successfully integrated performance measurement approaches into business as usual management and into its culture
Please, explain/elaborate on your answer:
Refreshing measurement systems
Does procurement have an appropriate review process in place to check the effectiveness of your performance measurement system?
Please, explain/elaborate on your answer:
Additional Comments:
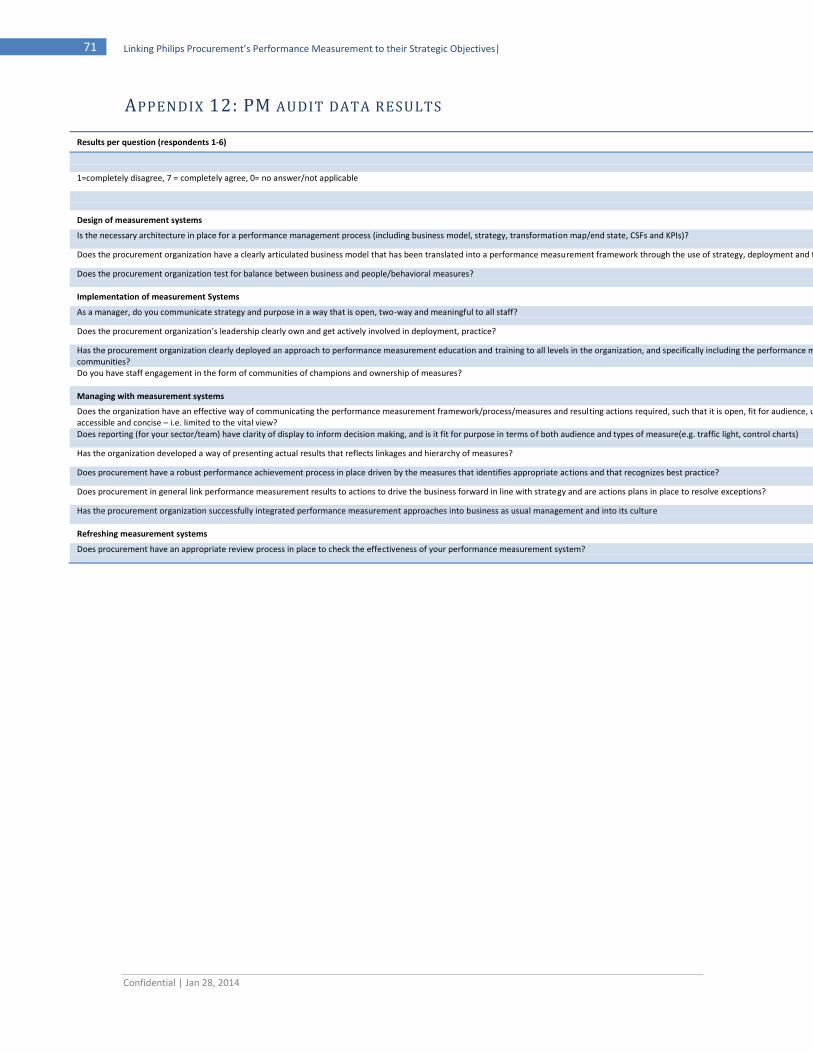
Confidential | Jan 28, 2014
71 Linking Philips Procurement’s Performance Measurement to their Strategic Objectives|
APPENDIX 12: PM AUDIT DATA RESULTS
Results per question (respondents 1-6) 1 2 3 4 5 6
1=completely disagree, 7 = completely agree, 0= no answer/not applicable
Design of measurement systems
Is the necessary architecture in place for a performance management process (including business model, strategy, transformation map/end state, CSFs and KPIs)? 6 5 3 7 3 6
Does the procurement organization have a clearly articulated business model that has been translated into a performance measurement framework through the use of strategy, deployment and transformation maps? 6 5 6 7 3 4
Does the procurement organization test for balance between business and people/behavioral measures? 6 3 6 7 3 2
Implementation of measurement Systems
As a manager, do you communicate strategy and purpose in a way that is open, two-way and meaningful to all staff? 0 0 5 6 6 6
Does the procurement organization’s leadership clearly own and get actively involved in deployment, practice? 5 6 7 5 5 7
Has the procurement organization clearly deployed an approach to performance measurement education and training to all levels in the organization, and specifically including the performance measurement communities?
5 3 5 6 4 2
Do you have staff engagement in the form of communities of champions and ownership of measures? 5 5 6 6 4 7
Managing with measurement systems
Does the organization have an effective way of communicating the performance measurement framework/process/measures and resulting actions required, such that it is open, fit for audience, ubiquitously accessible and concise – i.e. limited to the vital view?
2 5 6 4 4 7
Does reporting (for your sector/team) have clarity of display to inform decision making, and is it fit for purpose in terms of both audience and types of measure(e.g. traffic light, control charts) 7 5 7 4 4 7
Has the organization developed a way of presenting actual results that reflects linkages and hierarchy of measures? 2 5 6 5 6 3
Does procurement have a robust performance achievement process in place driven by the measures that identifies appropriate actions and that recognizes best practice? 3 5 5 6 5 4
Does procurement in general link performance measurement results to actions to drive the business forward in line with strategy and are actions plans in place to resolve exceptions? 3 2 7 4 5 7
Has the procurement organization successfully integrated performance measurement approaches into business as usual management and into its culture 3 6 5 7 5 7
Refreshing measurement systems
Does procurement have an appropriate review process in place to check the effectiveness of your performance measurement system? 1 2 6 5 6 4
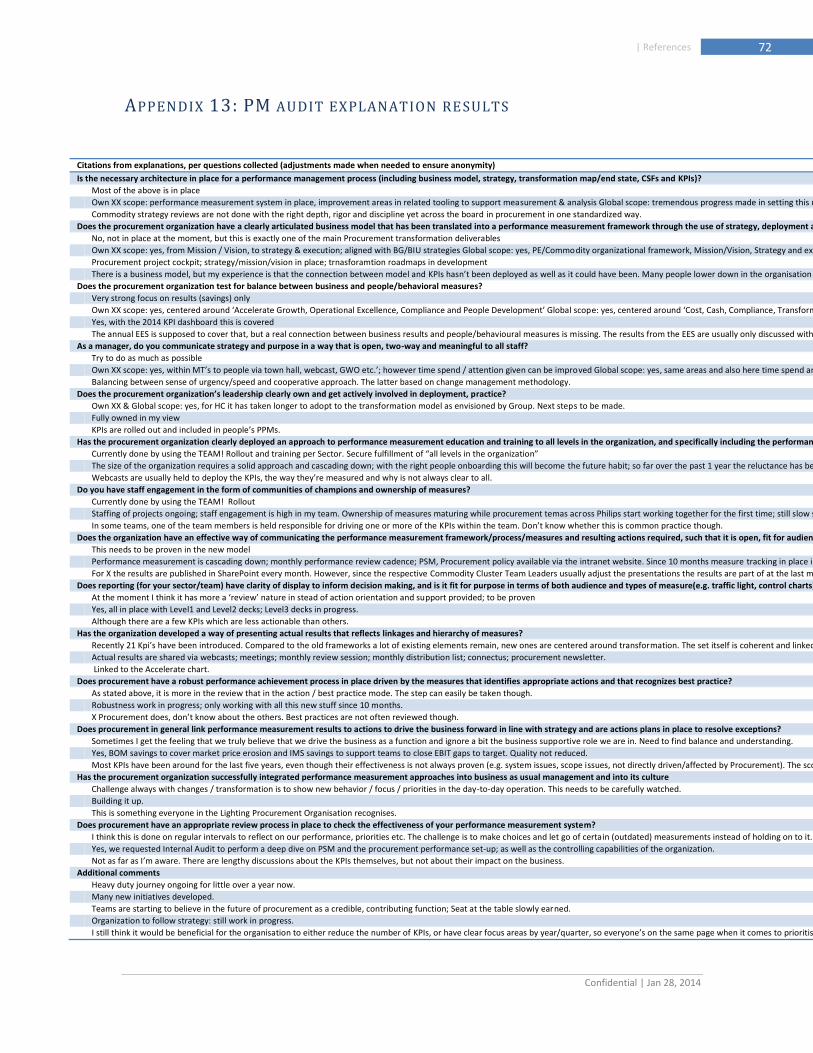
Confidential | Jan 28, 2014
72 | References
APPENDIX 13: PM AUDIT EXPLANATION RESULTS
Citations from explanations, per questions collected (adjustments made when needed to ensure anonymity)
Is the necessary architecture in place for a performance management process (including business model, strategy, transformation map/end state, CSFs and KPIs)?
Most of the above is in place
Own XX scope: performance measurement system in place, improvement areas in related tooling to support measurement & analysis Global scope: tremendous progress made in setting this up, improvement areas in related tooling to support measurement & analysis
Commodity strategy reviews are not done with the right depth, rigor and discipline yet across the board in procurement in one standardized way.
Does the procurement organization have a clearly articulated business model that has been translated into a performance measurement framework through the use of strategy, deployment and transformation maps?
No, not in place at the moment, but this is exactly one of the main Procurement transformation deliverables
Own XX scope: yes, from Mission / Vision, to strategy & execution; aligned with BG/BIU strategies Global scope: yes, PE/Commodity organizational framework, Mission/Vision, Strategy and execution.
Procurement project cockpit; strategy/mission/vision in place; trnasforamtion roadmaps in development
There is a business model, but my experience is that the connection between model and KPIs hasn’t been deployed as well as it could have been. Many people lower down in the organisation seem to be unaware of the links between the two.
Does the procurement organization test for balance between business and people/behavioral measures?
Very strong focus on results (savings) only
Own XX scope: yes, centered around ‘Accelerate Growth, Operational Excellence, Compliance and People Development’ Global scope: yes, centered around ‘Cost, Cash, Compliance, Transformation, People, Commodity’
Yes, with the 2014 KPI dashboard this is covered
The annual EES is supposed to cover that, but a real connection between business results and people/behavioural measures is missing. The results from the EES are usually only discussed within the various teams because they have to be discussed. Actions (both to be taken by management and by lower level employees) which could address this balance are not often followed up.
As a manager, do you communicate strategy and purpose in a way that is open, two-way and meaningful to all staff?
Try to do as much as possible
Own XX scope: yes, within MT’s to people via town hall, webcast, GWO etc.’; however time spend / attention given can be improved Global scope: yes, same areas and also here time spend and attention can be improved (secure full deployment throughout)
Balancing between sense of urgency/speed and cooperative approach. The latter based on change management methodology.
Does the procurement organization’s leadership clearly own and get actively involved in deployment, practice?
Own XX & Global scope: yes, for HC it has taken longer to adopt to the transformation model as envisioned by Group. Next steps to be made.
Fully owned in my view
KPIs are rolled out and included in people’s PPMs.
Has the procurement organization clearly deployed an approach to performance measurement education and training to all levels in the organization, and specifically including the performance measurement communities?
Currently done by using the TEAM! Rollout and training per Sector. Secure fulfillment of “all levels in the organization”
The size of the organization requires a solid approach and cascading down; with the right people onboarding this will become the future habit; so far over the past 1 year the reluctance has been overcome and we see the positive mindset coming into play.
Webcasts are usually held to deploy the KPIs, the way they’re measured and why is not always clear to all.
Do you have staff engagement in the form of communities of champions and ownership of measures?
Currently done by using the TEAM! Rollout
Staffing of projects ongoing; staff engagement is high in my team. Ownership of measures maturing while procurement temas across Philips start working together for the first time; still slow start, but visible
In some teams, one of the team members is held responsible for driving one or more of the KPIs within the team. Don’t know whether this is common practice though.
Does the organization have an effective way of communicating the performance measurement framework/process/measures and resulting actions required, such that it is open, fit for audience, ubiquitously accessible and concise – i.e. limited to the vital view?
This needs to be proven in the new model
Performance measurement is cascading down; monthly performance review cadence; PSM, Procurement policy available via the intranet website. Since 10 months measure tracking in place in each sector/IMS.
For X the results are published in SharePoint every month. However, since the respective Commodity Cluster Team Leaders usually adjust the presentations the results are part of at the last moment before the Review meetings, the final review deck, including comments and actions, is not always uploaded as well.
Does reporting (for your sector/team) have clarity of display to inform decision making, and is it fit for purpose in terms of both audience and types of measure(e.g. traffic light, control charts)
At the moment I think it has more a ‘review’ nature in stead of action orientation and support provided; to be proven
Yes, all in place with Level1 and Level2 decks; Level3 decks in progress.
Although there are a few KPIs which are less actionable than others.
Has the organization developed a way of presenting actual results that reflects linkages and hierarchy of measures?
Recently 21 Kpi’s have been introduced. Compared to the old frameworks a lot of existing elements remain, new ones are centered around transformation. The set itself is coherent and linked
Actual results are shared via webcasts; meetings; monthly review session; monthly distribution list; connectus; procurement newsletter.
Linked to the Accelerate chart.
Does procurement have a robust performance achievement process in place driven by the measures that identifies appropriate actions and that recognizes best practice?
As stated above, it is more in the review that in the action / best practice mode. The step can easily be taken though.
Robustness work in progress; only working with all this new stuff since 10 months.
X Procurement does, don’t know about the others. Best practices are not often reviewed though.
Does procurement in general link performance measurement results to actions to drive the business forward in line with strategy and are actions plans in place to resolve exceptions?
Sometimes I get the feeling that we truly believe that we drive the business as a function and ignore a bit the business supportive role we are in. Need to find balance and understanding.
Yes, BOM savings to cover market price erosion and IMS savings to support teams to close EBIT gaps to target. Quality not reduced.
Most KPIs have been around for the last five years, even though their effectiveness is not always proven (e.g. system issues, scope issues, not directly driven/affected by Procurement). The scope is altered every now and then and new KPIs are introduced to drive focus areas. Old/ineffective KPIs are not always taken out to improve the focus on the new/effective KPIs.
Has the procurement organization successfully integrated performance measurement approaches into business as usual management and into its culture
Challenge always with changes / transformation is to show new behavior / focus / priorities in the day-to-day operation. This needs to be carefully watched.
Building it up.
This is something everyone in the Lighting Procurement Organisation recognises.
Does procurement have an appropriate review process in place to check the effectiveness of your performance measurement system?
I think this is done on regular intervals to reflect on our performance, priorities etc. The challenge is to make choices and let go of certain (outdated) measurements instead of holding on to it.
Yes, we requested Internal Audit to perform a deep dive on PSM and the procurement performance set-up; as well as the controlling capabilities of the organization.
Not as far as I’m aware. There are lengthy discussions about the KPIs themselves, but not about their impact on the business.
Additional comments
Heavy duty journey ongoing for little over a year now.
Many new initiatives developed.
Teams are starting to believe in the future of procurement as a credible, contributing function; Seat at the table slowly earned.
Organization to follow strategy: still work in progress.
I still think it would be beneficial for the organisation to either reduce the number of KPIs, or have clear focus areas by year/quarter, so everyone’s on the same page when it comes to prioritising. It is simply impossible to focus on all KPIs at the same time.

Confidential | Jan 28, 2014
73 Linking Philips Procurement’s Performance Measurement to their Strategic Objectives|
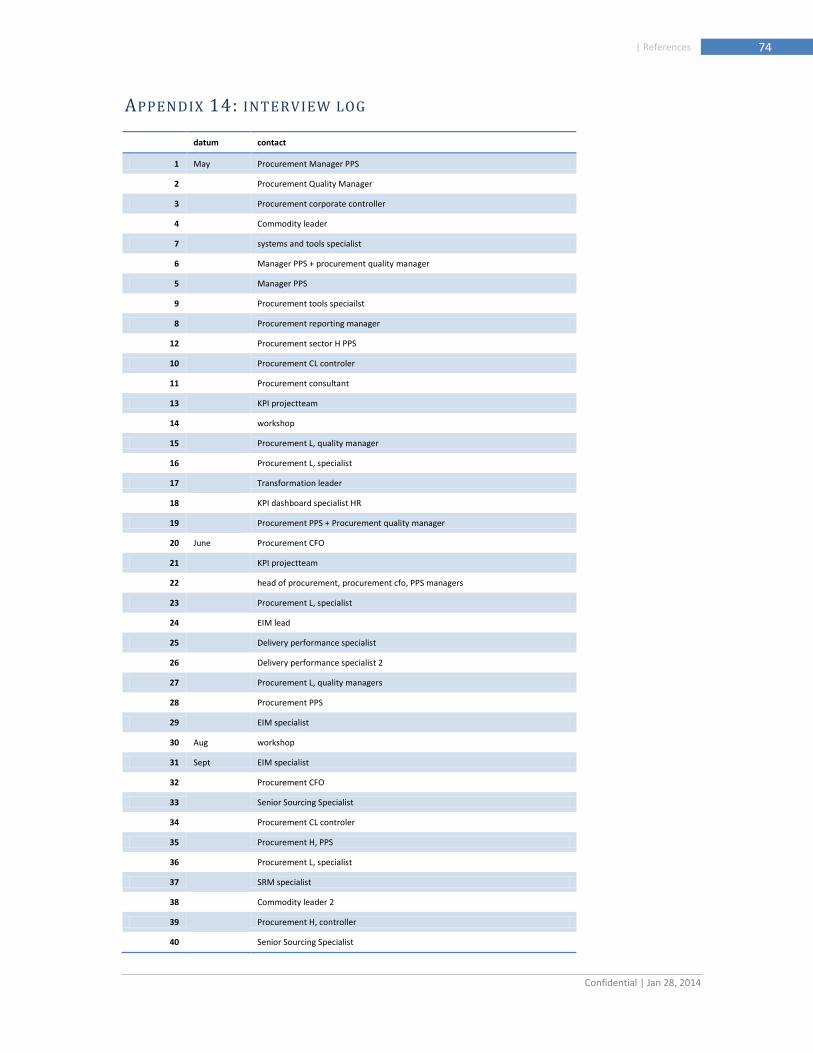
Confidential | Jan 28, 2014
74 | References
APPENDIX 14: INTERVIEW LOG
datum contact
1 May Procurement Manager PPS
2
Procurement Quality Manager
3
Procurement corporate controller
4
Commodity leader
7
systems and tools specialist
6
Manager PPS + procurement quality manager
5
Manager PPS
9
Procurement tools speciailst
8
Procurement reporting manager
12
Procurement sector H PPS
10
Procurement CL controler
11
Procurement consultant
13
KPI projectteam
14
workshop
15
Procurement L, quality manager
16
Procurement L, specialist
17
Transformation leader
18
KPI dashboard specialist HR
19
Procurement PPS + Procurement quality manager
20 June Procurement CFO
21
KPI projectteam
22
head of procurement, procurement cfo, PPS managers
23
Procurement L, specialist
24
EIM lead
25
Delivery performance specialist
26
Delivery performance specialist 2
27
Procurement L, quality managers
28
Procurement PPS
29
EIM specialist
30 Aug workshop
31 Sept EIM specialist
32
Procurement CFO
33
Senior Sourcing Specialist
34
Procurement CL controler
35
Procurement H, PPS
36
Procurement L, specialist
37
SRM specialist
38
Commodity leader 2
39
Procurement H, controller
40
Senior Sourcing Specialist

Confidential | Jan 28, 2014
75 Linking Philips Procurement’s Performance Measurement to their Strategic Objectives|
41
Commodity leader 3
42 Oct zeus kpi workshop team
43
Commodity leader 4
44
Robert Bijl
45
head of procurement
46
PPS Manager
47
Senior Sourcing Specialist
48
EIM lead and specialist
49
Procurement cfo
50
zeus kpi workshop team
51
PPS specialist
52
MBRM HC
53
Procurment consultancy lead
54
EIM Lead
55
procurment cfo
56
zeus project
57
HR intern
58
Internal client specialst
59
Procurement corporate manager
60
Commodity leader 4
61
Procurement sustainability manager
62
Procurement project manager
63
Procurement corporate manager 2
64
Procurement supplier innovation specialist
65
Procurement L specialist
66
Procurement CL controler
67 Nov P2P manager
68
Procurement H, PPS
69
I2M sector specialist
70
Senior Sourcing Specialist
71
Head of procurement + procurement cfo
72
I2M sector specialist
73
lunch CPO
74
Proc Enginering tour
75 Dec kpi monthly review
76
change adoption survey
77
kpi monthly review
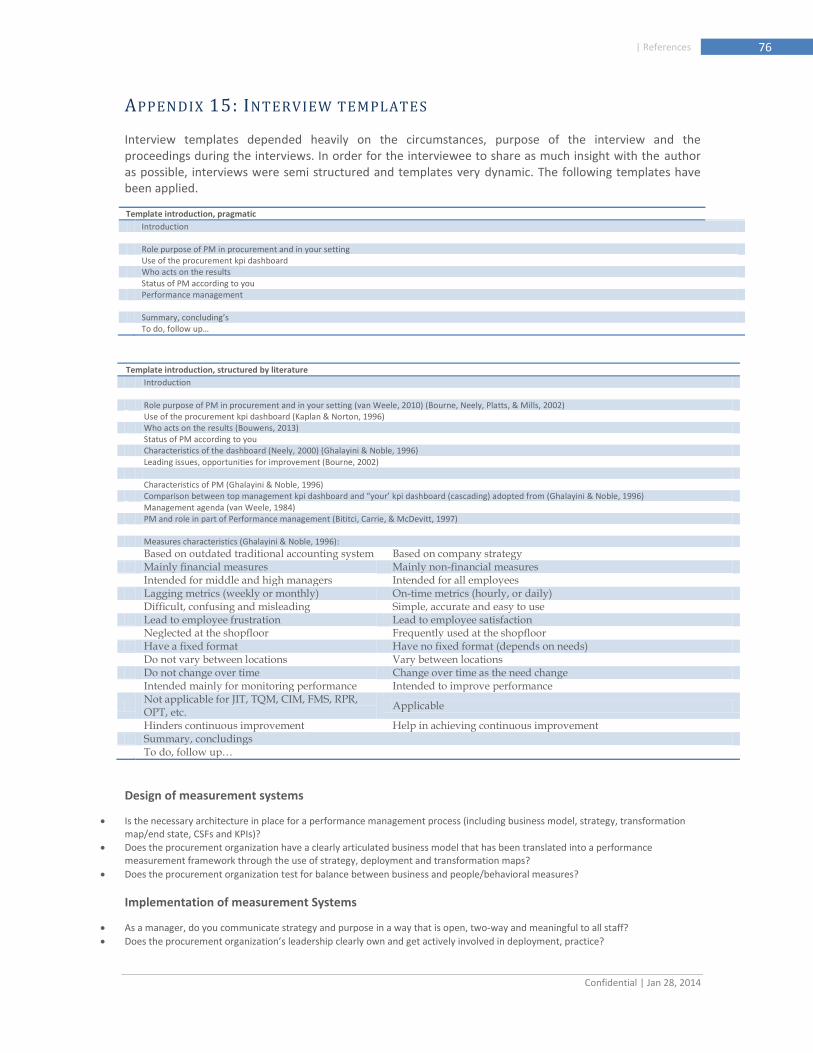
Confidential | Jan 28, 2014
76 | References
APPENDIX 15: INTERVIEW TEMPLATES
Interview templates depended heavily on the circumstances, purpose of the interview and the proceedings during the interviews. In order for the interviewee to share as much insight with the author as possible, interviews were semi structured and templates very dynamic. The following templates have been applied.
Template introduction, pragmatic
Introduction Role purpose of PM in procurement and in your setting Use of the procurement kpi dashboard Who acts on the results Status of PM according to you Performance management Summary, concluding’s To do, follow up…
Template introduction, structured by literature
Introduction Role purpose of PM in procurement and in your setting (van Weele, 2010) (Bourne, Neely, Platts, & Mills, 2002) Use of the procurement kpi dashboard (Kaplan & Norton, 1996) Who acts on the results (Bouwens, 2013) Status of PM according to you Characteristics of the dashboard (Neely, 2000) (Ghalayini & Noble, 1996) Leading issues, opportunities for improvement (Bourne, 2002) Characteristics of PM (Ghalayini & Noble, 1996) Comparison between top management kpi dashboard and “your’ kpi dashboard (cascading) adopted from (Ghalayini & Noble, 1996) Management agenda (van Weele, 1984) PM and role in part of Performance management (Bititci, Carrie, & McDevitt, 1997) Measures characteristics (Ghalayini & Noble, 1996):
Based on outdated traditional accounting system Based on company strategy Mainly financial measures Mainly non-financial measures Intended for middle and high managers Intended for all employees Lagging metrics (weekly or monthly) On-time metrics (hourly, or daily) Difficult, confusing and misleading Simple, accurate and easy to use Lead to employee frustration Lead to employee satisfaction Neglected at the shopfloor Frequently used at the shopfloor Have a fixed format Have no fixed format (depends on needs) Do not vary between locations Vary between locations Do not change over time Change over time as the need change Intended mainly for monitoring performance Intended to improve performance
Not applicable for JIT, TQM, CIM, FMS, RPR, OPT, etc.
Applicable
Hinders continuous improvement Help in achieving continuous improvement Summary, concludings To do, follow up…
Design of measurement systems
Is the necessary architecture in place for a performance management process (including business model, strategy, transformation map/end state, CSFs and KPIs)?
Does the procurement organization have a clearly articulated business model that has been translated into a performance measurement framework through the use of strategy, deployment and transformation maps?
Does the procurement organization test for balance between business and people/behavioral measures?
Implementation of measurement Systems
As a manager, do you communicate strategy and purpose in a way that is open, two-way and meaningful to all staff?
Does the procurement organization’s leadership clearly own and get actively involved in deployment, practice?
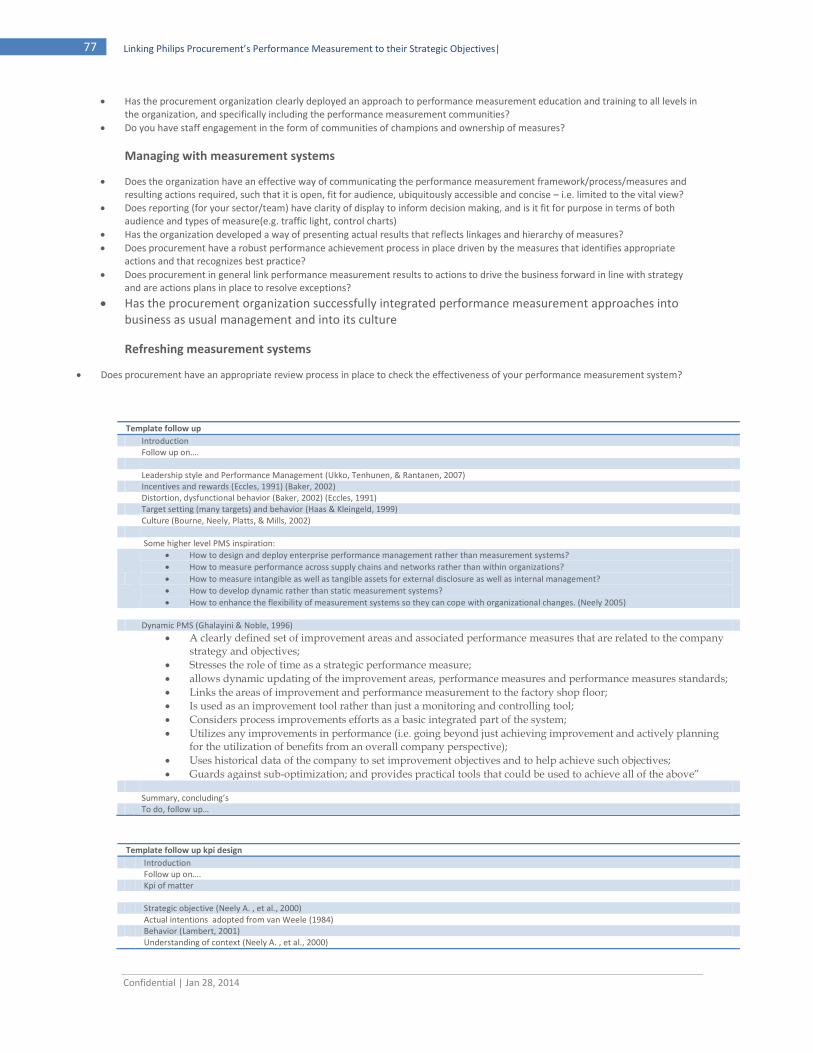
Confidential | Jan 28, 2014
77 Linking Philips Procurement’s Performance Measurement to their Strategic Objectives|
Has the procurement organization clearly deployed an approach to performance measurement education and training to all levels in the organization, and specifically including the performance measurement communities?
Do you have staff engagement in the form of communities of champions and ownership of measures?
Managing with measurement systems
Does the organization have an effective way of communicating the performance measurement framework/process/measures and resulting actions required, such that it is open, fit for audience, ubiquitously accessible and concise – i.e. limited to the vital view?
Does reporting (for your sector/team) have clarity of display to inform decision making, and is it fit for purpose in terms of both audience and types of measure(e.g. traffic light, control charts)
Has the organization developed a way of presenting actual results that reflects linkages and hierarchy of measures?
Does procurement have a robust performance achievement process in place driven by the measures that identifies appropriate actions and that recognizes best practice?
Does procurement in general link performance measurement results to actions to drive the business forward in line with strategy and are actions plans in place to resolve exceptions?
Has the procurement organization successfully integrated performance measurement approaches into business as usual management and into its culture
Refreshing measurement systems
Does procurement have an appropriate review process in place to check the effectiveness of your performance measurement system?
Template follow up
Introduction Follow up on…. Leadership style and Performance Management (Ukko, Tenhunen, & Rantanen, 2007) Incentives and rewards (Eccles, 1991) (Baker, 2002) Distortion, dysfunctional behavior (Baker, 2002) (Eccles, 1991) Target setting (many targets) and behavior (Haas & Kleingeld, 1999) Culture (Bourne, Neely, Platts, & Mills, 2002) Some higher level PMS inspiration:
How to design and deploy enterprise performance management rather than measurement systems?
How to measure performance across supply chains and networks rather than within organizations?
How to measure intangible as well as tangible assets for external disclosure as well as internal management?
How to develop dynamic rather than static measurement systems?
How to enhance the flexibility of measurement systems so they can cope with organizational changes. (Neely 2005) Dynamic PMS (Ghalayini & Noble, 1996)
A clearly defined set of improvement areas and associated performance measures that are related to the company strategy and objectives;
Stresses the role of time as a strategic performance measure;
allows dynamic updating of the improvement areas, performance measures and performance measures standards;
Links the areas of improvement and performance measurement to the factory shop floor;
Is used as an improvement tool rather than just a monitoring and controlling tool;
Considers process improvements efforts as a basic integrated part of the system;
Utilizes any improvements in performance (i.e. going beyond just achieving improvement and actively planning for the utilization of benefits from an overall company perspective);
Uses historical data of the company to set improvement objectives and to help achieve such objectives;
Guards against sub-optimization; and provides practical tools that could be used to achieve all of the above” Summary, concluding’s To do, follow up…
Template follow up kpi design
Introduction Follow up on…. Kpi of matter Strategic objective (Neely A. , et al., 2000) Actual intentions adopted from van Weele (1984) Behavior (Lambert, 2001) Understanding of context (Neely A. , et al., 2000)
Confidential | Jan 28, 2014
78 | References
Solution direction, feasibility (Neely A. , et al., 2000) Possible constraints (Eccles, 1991) Desirable characteristics of the output of the process
Performance measures should enable/facilitate benchmarking Ratio based performance measures are preferable to absolute numbers Performance criteria should be directly under the control of the evaluated organizational unit. Objective performance criteria are preferable to subjective ones. Non-financial measures should be adopted Performance measures should be simple and easy to use. Performance measures should provide fast feedback. Performance measures should stimulate continuous improvement rather than just monitor. (Neely A. , et al., 2000)
Desirable characteristics of a performance measurement system design process
Performance measures should be derived from the company’s strategy The purpose of each performance measure must be made explicit Data collection and methods of calculating the level of performance must be made clear Everyone should be involved in the selection of the measures The performance measures that are selected should take account of the organization The process should be easily revisitable – measures should change as circumstances change. (Neely A. , et al., 2000)
Findings, proceedings, to do

Confidential | Jan 28, 2014
79 Linking Philips Procurement’s Performance Measurement to their Strategic Objectives|
APPENDIX 16: INTERVIEW NOTES
The following pages describe the most important formal meetings the author organized with the stakeholders or he was invited to. The notes reflect only the formal meetings and interviews. In reality, the author met and spoke with most interviewees on a daily or weekly basis. These meeting were informally or during gatherings at other meetings.
CONFIDENTIAL


![Executable Architectures using Cuckoo Search Optimization ... › IMG › pdf › Executable... · [18]. Executable systems architectures are created using CPN models and their simulations](https://static.fdocuments.in/doc/165x107/5f19f7f12b86e719d713bde6/executable-architectures-using-cuckoo-search-optimization-a-img-a-pdf-a.jpg)