Linking Mathematics and Nutrition - healthiersf.org S… · Linking Mathematics and Nutrition was...
17
Linking Mathematics and Nutrition Lessons and Resources for Integrated Instruction FOURTH GRADE How Sweet Is It?
-
Upload
truonghanh -
Category
Documents
-
view
215 -
download
0
Transcript of Linking Mathematics and Nutrition - healthiersf.org S… · Linking Mathematics and Nutrition was...
Linking Mathematics and NutritionLessons and Resources for Integrated Instruction
FOURTH GRADE
How Sweet Is It?

Linking Mathematics and Nutrition was developed by the California Healthy Kids Resource Center with funding by the California Department of Public Health, Network for a Healthy California. The contents do not necessarily reflect the position or policy of the California Department of Public Health.
Project Administration Deborah Wood, Ph.D., Executive Director (Retired)California Healthy Kids Resource Center
Nora Zamora, M.S., Interim Executive DirectorCalifornia Healthy Kids Resource Center
Christine Bilbrey, M.S., R.D., C.L.E.Network for a Healthy California Cancer Control BranchCalifornia Department of Public Health
Project Coordinator Jacquelyn Russum, M.P.H., R.D., Program ManagerCalifornia Healthy Kids Resource Center
Writers Lily Jones, M.A.North Oakland Community Charter School
Ruth Leader, B.A.Ross Valley School District
Reviewers and Teacher ConsultantsMichael Bessonette, Brookside ElementaryLaura Graham, Brookside ElementaryDenise Walsh-Fong, Brookside ElementaryJudy Echeandia, Lesson Editor
California Department of Public HealthNetwork for a Healthy California1616 Capitol Avenue, Suite 74.516, MS 7204Sacramento, CA 95814Phone: (916) 449-5400Web site: http://networkforahealthycalifornia.net
© 2011, California Department of Public Health. This material may not be reproduced or disseminated without prior written permission from the California Department of Public Health.
This material was produced by the California Department of Public Health’s Network for a Healthy California with funding from USDA SNAP, known in California as CalFresh (formerly Food Stamps). These institutions are equal opportunity providers and employers. CalFresh provides assistance to low-income households and can help buy nutritious foods for better health. For CalFresh information, call 1-877-847-3663. For important nutrition information, visit www.cachampionsforchange.net..
Acknowledgments

F O U R T H G R A D E
How Sweet Is It?
AcTIvITy OvERvIEw
• Students will create a bar graph to show the amount of teaspoons of sugar contained in a variety
of beverages.
• Students will convert grams to teaspoons and identify the mode(s), median, and apparent outlier(s).
MatheMatics Goal
Students will organize, represent, and interpret numerical data on a bar graph; and identify the mode(s),
median, and apparent outlier(s).
NutritioN Goal
Students will use food labels to compare and contrast nutrient and sugar content in a variety of drinks.
Students will use this information to demonstrate making healthy beverage choices. Students create a
“Drink Journal” to log their weekly consumption of drinks.
hoMe coMpoNeNt
Students will bring home the “How Sweet is It?” homework assignment and work with their family to start
a “ReThink Your Drink Journal” at home.
staNdards aNd skills supported iN this lessoN
• california Mathematics content standards
Fourth Grade
Number Sense 2.0, and 3.0
• 2.2 Round two-place decimals to one decimal or to the nearest whole number and judge the
reasonableness of the rounded number.
• 3.2 Demonstrate an understanding of, and ability to use, standard algorithms for the addition and
subtraction of multi-digit numbers.
• 3.3 Solve problems involving division of multi-digit numbers by one-digit numbers.
Statistics, Data Analysis, and Probability 1.0
• 1.0 Students organize, represent, and interpret numerical and categorical data and clearly
communicate their findings.
• 1.2 Identify the mode(s) for sets of categorical data and the mode(s), median, and any apparent
outliers for numerical data sets.
• california health education content standards
Nutrition and Physical Activity Content Area – Fourth Grade
Standard 1: Essential Concepts
• 1.2.N State the recommended number of servings and serving sizes for different food groups.
Linking Mathematics and Nutrition 1

Linking Mathematics and Nutrition 2
MATERIAlS NEEDED
• Graph paper or 1-cm grid paper (one per pair)
• Colored pencils (two colors per pair)
• Highlighters (one per pair)
• “How Sweet is It? Nutrition Facts” worksheet
(one per pair)
• “How Sweet is It? Table” (one per pair)
• “How Sweet is It? Table” answer key
(for teacher use)
• “Nutrition Facts Label” transparency or other
technology to review the label with the class
(for teacher use)
• “How Sweet is It?” homework (one per student)
• Sugar cubes or granulated sugar, measuring
spoons (for teacher use)
• Optional: Bring packages of the various drinks
for student review.
Standard 3: Accessing Valid Information
• 3.2.N Use food labels to determine nutrient and sugar content.
Standard 5: Decision Making
• 5.1.N Describe how to use a decision-making process to select nutritious food and beverages.
cross-discipliNary skills
• Evaluating
• Communicating Results
• Decision Making
• Goal Setting
preparatioN tiMe
• 15 minutes
preparatioN activities
• Photocopy worksheets, transparency, and homework
• Gather sugar and measuring spoons for demonstration
• Set out colored pencils, highlighters, and graph paper
activity tiMe
• 100 minutes
• This activity can be divided into two class periods:
• Steps “Warm-Up” to “Activity” on day one (65 minutes)
• Steps “Activity Results” to “Closing” on day two (35 minutes)

Linking Mathematics and Nutrition 3
BackGrouNd
According to the Robert Wood Johnson Foundation (2009) there has been an increase in the consump-
tion of sugar-sweetened beverages such as sodas, fruit drinks and punches, and sports drinks among
American children and adolescents. Increasing intake of sugar-sweetened drinks has been linked with
health risks in children, including increased dental decay and excess weight gain, headaches, anxiety,
and decreased bone density. In addition, sugar-sweetened drinks add sugar and calories without
providing other important nutrients. Consuming smaller amounts or fewer sugar-sweetened beverages
makes room for increased intake of water and nutrient-dense foods while keeping calories in balance.
recoMMeNdatioNs
The Dietary Guidelines for Americans, 2010 and MyPlate outline the daily recommended intake of sugar.
Quantities vary for age, level of activity, and gender. General recommendations for sugar intake for
children ages nine to twelve are no more than 10 teaspoons (40 grams) per day based on a 2,000
calorie diet. This guidance refers to extra sugars, included as added sugars in foods, The recommenda-
tion is intended to provide an upper limit for sugar consumption, not a recommended amount to consume
each day.
teachiNG tips
Before this lesson, students should have knowledge of constructing a bar-graph and graphing terminol-
ogy. Students should also have knowledge of rounding a decimal to a whole number. This lesson can
be modified to construct a double-bar graph to analyze sugar and caffeine content. Students can analyze
serving size in relationship to sugar content, for example, the relationship between 8 ounces and 12
ounces. If possible, complete this lesson before lunch so students can analyze the beverages they plan
to consume and they can apply what they have learned by reading and interpreting the nutrition labels.
vocaBulary
Bar Graph – A graph that uses horizontal or vertical bars to represent data.
coordinate grid – A grid formed by a horizontal line, called the x-axis; and a vertical line, called
the y-axis.
data – Information that is gathered by counting, measuring, questioning, or observing.
Mean – The number found by dividing the sum of a set of numbers by the number of addends.
Median – The middle number in an ordered set of data.
Mode – The number(s) or item(s) that occur most often in a set of data.
Nutrients – Substances that support growth and good health. Plants absorb nutrients from the soil in the
form of minerals and other compounds, and animals obtain nutrients from ingested foods. Common
nutrients found in food are: vitamin A, vitamin C, calcium, and iron.
outlier – A value(s) separated from the rest of the data.
scale – The numbers placed at fixed distances on a graph to help label the graph.
sugar – A substance that tastes sweet and can be found naturally or added to foods.
It is one source of energy from foods, however, too much added sugar can lead to tooth decay and other
health problems.
X-axis – The horizontal line on a coordinate grid.
y-axis – The vertical line on a coordinate grid.

steps for classrooM activity
Warm-up (5 minutes)
• Poll students to see what kind of beverages they consumed in the past week. Write responses on
the board.
• Poll students to see if they know anyone who is not allowed to drink soda. Record responses.
Ask students what they are allowed to drink instead of soda. Record responses.
• Ask students to estimate the number of teaspoons of sugar in a 12-ounce can of root beer and in an
8-ounce carton of low-fat chocolate milk. Show students a sugar cube or pour out a teaspoon of sugar.
Write responses on the board. Do not provide any answers at this time
Before the activity (15 minutes)
• Explain that sodas, as well as fruit punches and drinks, and sports drinks are also called sugar-
sweetened beverages. Unlike 100 percent fruit juices, sugar-sweetened beverages have sugar added
to them.
• Tell students that scientists have found connections between drinking too much sugar-sweetened
beverages and increasing risk of diabetes and obesity in youths. Sugar-sweetened drinks are also
linked to tooth decay. Sodas and other sugar drinks are often high in calories and low in nutrients and
replace other foods and drinks that have nutrients that our body needs.
• Tell students that sugar is a form of carbohydrate, which is needed by the body for energy. There are
two types of sugars. One occurs naturally in certain food products, while the other is added to some
food products during processing or preparation. Common foods and beverages with natural sugar
include milk and fruit juice and those with added sugar are soft drinks, candy, cakes, cookies, pies,
fruit drinks, and milk-based desserts. Added sugar has many names that appear on the Nutrition Facts
label: high-fructose corn syrup, other syrups, glucose, fructose, lactose, maltose, brown sugar, honey,
molasses, fruit juice concentrates, and raw sugar.
• The daily recommended added sugar intake for the average child ages nine to twelve years old is no
more than 10 teaspoons based on a 2,000-calorie diet.
• Tell students they will use the Nutrition Facts label to calculate the number of teaspoons of sugar in
some popular drinks: milk, chocolate milk, cola, energy drink, orange soda, fruit juice drink, vegetable
juice blend, and orange juice.
• Students will graph and compare the sugar content of these drinks. Review bar graph concepts with
students. Graphs are a way to represent data. Review the parts of a graph: title, labels for x-axis and
y-axis, interval, and scale.
activity (45 minutes)
• Display the “Nutrition Facts Label” overhead for class review. Ask students to identify components they
see on the label. Point out serving size and nutrients.
• Use the Nutrition Facts label to show students that the sugar content of a drink or food is found
under “Total Carbohydrate.” The Nutrition Facts label shows sugar content in grams. Students will
use this information to change grams to teaspoons. This will allow students to see the amount of sugar
in a drink.
• Write the expression 4 grams of sugar equals 1 teaspoon of sugar on the board. Use the root beer
sample used during the “Warm-Up.” If this drink has 32 grams of sugar, how many teaspoons would
that be? What mathematical operation would you use to determine the number of teaspoons?
Linking Mathematics and Nutrition 4

Linking Mathematics and Nutrition 5
• Demonstrate how many teaspoons are in 32 grams of sugar using the above conversion. Tell students
ere would be 8 teaspoons of sugar.
daily recommended intake for added
additional teaspoons of sugar
this beverage. Briefly discuss the
e root beer with the amount the
Facts” worksheet to each pair. Ask
ydrate section and highlight the
complete the table using information
rsion rate from grams of sugar to
ed the table.
f graph paper or 1-centimeter grid
tudents will use the data from the
the drinks.
ients, and the other color for
legend on the graph to show the
estigation.
drinks.
mine which mathematical operation to
resents subtraction.)
changed, how would that affect the
advertising.
dents that having nutrients in a drink
tain calcium, but they also contain
l to children, so it is not a
that to determine the teaspoons, they would divide 32 by 4 and th
Measure out 8 teaspoons or 8 sugar cubes. Remind students that
sugar is no more than 10 teaspoons. Ask the students how many
they would be able to consume for the rest of the day if they drink
differences between the actual number of teaspoons of sugar in th
class predicted.
• Assign student pairs and distribute one “How Sweet is It? Nutrition
students to find the sugar content for each drink under the carboh
amount of sugar in grams.
• Distribute “How Sweet is It? Table” worksheet and tell students to
from the nutrition facts worksheet. Remind students that the conve
teaspoons is grams of sugar divided by four.
• Instruct students to answer the questions after they have complet
• After students complete the table, give each student pair a piece o
paper and two colored pencils.
• Tell students to graph the sugar in teaspoons of each beverage. S
worksheet to design a bar graph to compare the sugar content of
• Tell students to use one color, if the beverage has one or less nutr
beverages with more than one nutrient. Students should create a
color coding.
activity results (15 minutes)
• Ask the class questions from the worksheet.
• Ask pairs to share their graphs and discuss the results of their inv
• Have students discuss what they found out about sugar content in
Mathematics and Nutrition discussion (15 minutes)
• Ask students what phrase in questions 2 and 5 helped them deter
use (Responses may include: The phrase “How many more?” rep
• Ask students what would happen if the intervals on the graph were
representation of the data? Discuss how this technique is used in
• Ask students to identify the drinks that contained nutrients. Tell stu
does not always make it a nutritious drink. Energy drinks may con
added sugars, caffeine, and other ingredients that may be harmfu
nutritious drink.
• Have them work in pairs and compare the beverages they chose in
number 11 and ask students to share why they made this decision
with their partner.

• Ask students to describe the decision-making process they used to choose a drink. Write down the
decision-making steps given by the students. Explain that the best way to make a decision is to first
find accurate information, just as they did during the investigation. Summarize the other steps in the
decision-making process as:
1. Identify the decision and list options/choices.
2. Compare the pros and cons of the options.
3. Consider your values and your family’s values.
4. Make a decision.
5. Reflect and learn from the consequences of the decision.
• Discuss the last question and the suggestions they would give to other students to help them
make decisions to stay healthy and reduce their risk of tooth decay and unhealthy weight gain.
(Recommendations may include to use the decision-making process, get accurate information about
the beverages, and to think about the connection of sugar-sweetened beverages to their health.)
closing (5 minutes)
• Ask students how they could use the information about sugar in beverages and the decision-making
process to make healthy beverage choices.
• Discuss the “How Sweet is It?” homework assignment. The assignment will allow students to share
what they learned about drinks with their family.
• Have students also start a “Drink Journal” and record their drinks for one week and the times they used
a decision-making process to make their beverage choice. Students should discuss whether the journal
and using the decision-making process helped to reduce the number of sugar-sweetened drinks
consumed in a week.
assessment
• Complete and discuss the “How Sweet is It?” homework assignment. Have students share what
they learned about drinks with their family. Ask students to brainstorm ways to communicate about
making healthier beverage decisions with their family.
Linking Mathematics and Nutrition 6

Linking Mathematics and Nutrition 7
activity After tasting Harvest of the Month (HOTM) fruits or vegetables, have students develop
a recipe for a healthy beverage option that is low in added sugar. Ask the class to brain-
storm recipe ideas, for example sparkling water with lemon and orange slices or fresh
strawberries blended with ice and orange juice. Each student writes the ingredients and
portions for one serving of their recipe using pictures or writing fractions. Have students
write the ingredients and portions for making the recipe to serve one portion for each
student in the class. Students post and review the class recipes. They analyze their “Drink
Journal” and note the recipes they would like to substitute for sugar-sweetened beverages.
resource Harvest of the Month (CHKRC ID #5798) or access other Harvest of the Month
resources online at http://www.harvestofthemonth.com
standards Mathematics health
Number Sense 1.6, 1.7 Essential Concepts
Grade 4 1.3.N
Goal Setting
Grade 4 6.1.N
Practicing Health-Enhancing Behaviors
Grade 4 7.2.N
Grade 4 7.3.N
activity Introduce advertising techniques and slogans using The Power of Advertising lesson
from the Children’s Power Play! Campaign, grade four resource. Based on student’s
analyses of drinks in the classroom and at home, have them create Healthy Choice
posters to encourage healthy beverage options. Encourage students to include graphs to
illustrate and compare healthy and less healthy options.
resource Children's Power Play! Campaign – School Idea and Resource Kit, Grade 4 (#1364) –
Activity 8: The Power of Advertising or access other Children's Power Play! Campaign
resources online at the Network for a Healthy California Web site.
standards Mathematics
Statistics, Data Analysis, and
Probability 1.0
health
Essential Concepts
Grade 4 1.2.N
Grade 4 1.3.N
Accessing Valid Information
Grade 4 3.2.N
Analyzing Influences
Grade 4 2.2.N
Health Promotion
Grade 4 8.1.N
ideas aNd resources for eXteNdiNG the lessoN
The activities listed below include resources that are available for free, four-week loan from the California
Healthy Kids Resource Center (CHKRC). Additional nutrition and physical activity DVDs, curricula,
references, and displays can also be borrowed. To order materials or for other resource suggestions,
check the CHKRC Web site at http://www.californiahealthykids.org or call toll free (888) 318-8188.
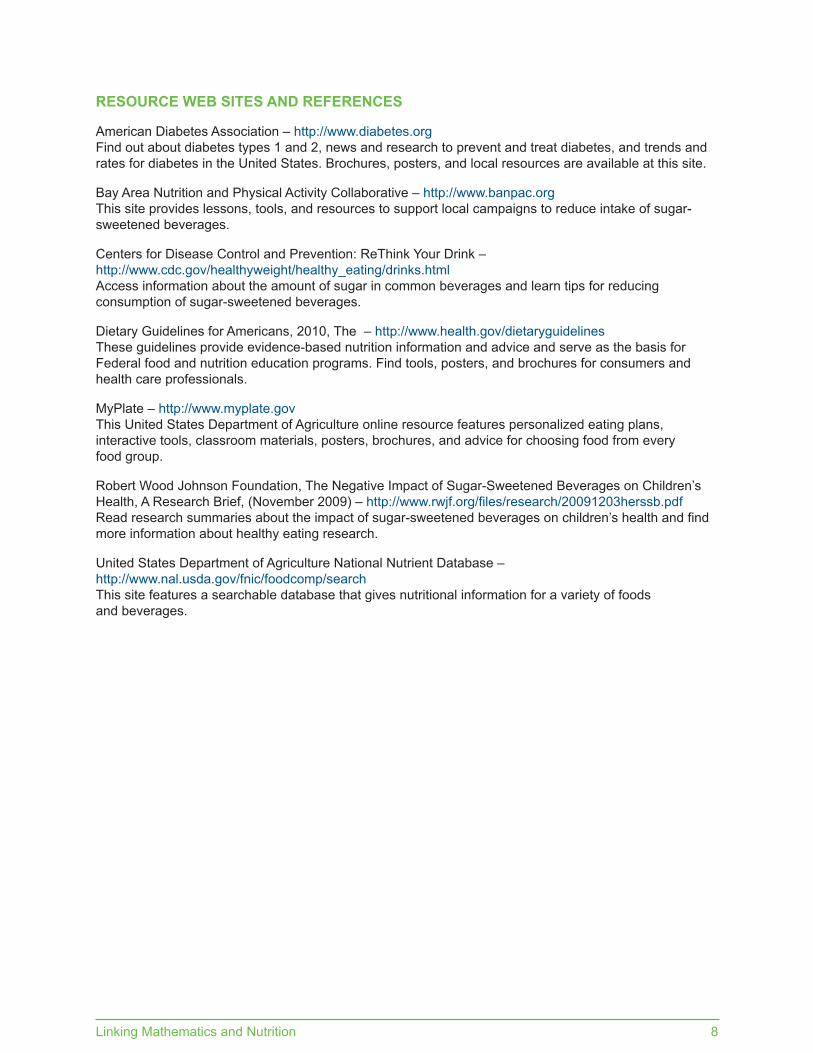
resource WeB sites aNd refereNces
American Diabetes Association – http://www.diabetes.org
Find out about diabetes types 1 and 2, news and research to prevent and treat diabetes, and trends and
rates for diabetes in the United States. Brochures, posters, and local resources are available at this site.
Bay Area Nutrition and Physical Activity Collaborative – http://www.banpac.org
This site provides lessons, tools, and resources to support local campaigns to reduce intake of sugar-
sweetened beverages.
Centers for Disease Control and Prevention: ReThink Your Drink –
http://www.cdc.gov/healthyweight/healthy_eating/drinks.html
Access information about the amount of sugar in common beverages and learn tips for reducing
consumption of sugar-sweetened beverages.
Dietary Guidelines for Americans, 2010, The – http://www.health.gov/dietaryguidelines
These guidelines provide evidence-based nutrition information and advice and serve as the basis for
Federal food and nutrition education programs. Find tools, posters, and brochures for consumers and
health care professionals.
MyPlate – http://www.myplate.gov
This United States Department of Agriculture online resource features personalized eating plans,
interactive tools, classroom materials, posters, brochures, and advice for choosing food from every
food group.
Robert Wood Johnson Foundation, The Negative Impact of Sugar-Sweetened Beverages on Children’s
Health, A Research Brief, (November 2009) – http://www.rwjf.org/files/research/20091203herssb.pdf
Read research summaries about the impact of sugar-sweetened beverages on children’s health and find
more information about healthy eating research.
United States Department of Agriculture National Nutrient Database –
http://www.nal.usda.gov/fnic/foodcomp/search
This site features a searchable database that gives nutritional information for a variety of foods
and beverages.
Linking Mathematics and Nutrition 8

9
How Sweet is It?Nutrition facts Worksheet – page 1 of 2
Nutrition FactsServing Size: 8 fl. ozCalories 60 Calories from Fat 0
% Daily Value*
Total Fat 0g 0%
Saturated Fat 0g 0%
Trans Fat 0g
Cholesterol 0mg 0%
Sodium 460mg 19%
Total Carbohydrate 12g 4%
Dietary Fiber 0g 0%
Sugars 9g
Protein 3g
Vitamin A 60% Calcium 6%Vitamin C 210% Iron 4%
*Percent Daily Values are based on a 2,000 calorie diet. Your daily values may be higher or lower depending on your calorie needs.
Nutrition FactsServing Size: 12 fl. ozCalories 170 Calories from Fat 0
% Daily Value*
Total Fat 0g 0%
Saturated Fat 0g 0%
Trans Fat 0g
Cholesterol 0mg 0%
Sodium 65mg 3%
Total Carbohydrate 46g 15%
Dietary Fiber 0g 0%
Sugars 46g
Protein 0g
Vitamin A 0% Calcium 0%Vitamin C 0% Iron 0%
*Percent Daily Values are based on a 2,000 calorie diet. Your daily values may be higher or lower depending on your calorie needs.
Nutrition FactsServing Size: 12 fl. ozCalories 140 Calories from Fat 0
% Daily Value*
Total Fat 0g 0%
Saturated Fat 0g 0%
Trans Fat 0g
Cholesterol 0mg 0%
Sodium 50mg 2%
Total Carbohydrate 39g 13%
Dietary Fiber 0g 0%
Sugars 39g
Protein 0g
Vitamin A 0% Calcium 0%Vitamin C 0% Iron 0%
*Percent Daily Values are based on a 2,000 calorie diet. Your daily values may be higher or lower depending on your calorie needs.
Nutrition FactsServing Size: 8.3 fl. ozCalories 112 Calories from Fat 0
% Daily Value*
Total Fat 0.2g 0%
Saturated Fat 0g 0%
Trans Fat 0g
Cholesterol 0mg 0%
Sodium 209mg 9%
Total Carbohydrate 27.24g 9%
Dietary Fiber 0g 0%
Sugars 25.05g
Protein 0.62g
Vitamin A 0% Calcium 3%Vitamin C 0% Iron 0%
*Percent Daily Values are based on a 2,000 calorie diet. Your daily values may be higher or lower depending on your calorie needs.
vegetable Juice Blend orange Juice
cool cola Zap energy drink
Directions: Highlight the sugar grams for each drink.
This material was produced by the California Department of Public Health’s Network for a Healthy California with funding from
USDA SNAP, known in California as CalFresh (formerly Food Stamps). These institutions are equal opportunity providers and
employers. CalFresh provides assistance to low-income households and can help buy nutritious foods for better health.
For CalFresh information, call 1-877-847-3663. For important nutrition information, visit www.cachampionsforchange.net.

10
How Sweet is It?Nutrition Facts Worksheet – Page 2 of 2
Orange Juicy Soda Berry Fruit Sparkler
Chocolate Milk, Low Fat 1% Milk, Low Fat 1%
Nutrition FactsServing Size: 12 fl. ozCalories 125 Calories from Fat 0
% Daily Value*
Total Fat 0g 0%
Saturated Fat 0g 0%
Trans Fat 0g
Cholesterol 0mg 0%
Sodium 0mg 0%
Total Carbohydrate 31g 10%
Dietary Fiber 0g 0%
Sugars 27g
Protein 0g
Vitamin A 0% Calcium 0%Vitamin C 40% Iron 0%
*Percent Daily Values are based on a 2,000 calorie diet. Your daily values may be higher or lower depending on your calorie needs.
Nutrition FactsServing Size: 8 fl. ozCalories 157 Calories from Fat 22
% Daily Value*
Total Fat 3g 4%
Saturated Fat 2g 8%
Trans Fat 0g
Cholesterol 8mg 3%
Sodium 152mg 6%
Total Carbohydrate 26g 9%
Dietary Fiber 1g 5%
Sugars 25g
Protein 8g
Vitamin A 10% Calcium 29%Vitamin C 4% Iron 3%
*Percent Daily Values are based on a 2,000 calorie diet. Your daily values may be higher or lower depending on your calorie needs.
Nutrition FactsServing Size: 8 fl. ozCalories 102 Calories from Fat 2
% Daily Value*
Total Fat 2g 8%
Saturated Fat 0g 0%
Trans Fat 0g
Cholesterol 12mg 4%
Sodium 107mg 4%
Total Carbohydrate 13g 4%
Dietary Fiber 0g 0%
Sugars 13g
Protein 8g
Vitamin A 10% Calcium 29%Vitamin C 0% Iron 0%
*Percent Daily Values are based on a 2,000 calorie diet. Your daily values may be higher or lower depending on your calorie needs.
1%1%Chocola
te
This material was produced by the California Department of Public Health’s Network for a Healthy California with funding from
SDA SNAP, known in California as CalFresh (formerly Food Stamps). These institutions are equal opportunity providers and
mployers. CalFresh provides assistance to low-income households and can help buy nutritious foods for better health.
or CalFresh information, call 1-877-847-3663. For important nutrition information, visit www.cachampionsforchange.net.
U
e
F

11
How Sweet is It?table – page 1 of 2
Directions: Work with a partner to complete the table using the nutritional information from the
“How Sweet is It? Nutrition Facts” worksheet. Answer the questions and create a bar graph.
Step 1: Record serving size and sugar grams for each drink.
Step 2: Convert sugar grams to teaspoons of sugar using the formula:
Total grams of sugar ÷ 4 = 1 teaspoon of sugar
Step 3: Record the number of nutrients found in the drink.
Step 4: Answer the questions.
Step 5: Create a bar graph to display the sugar content of each drink.
1. Name the drink with the most added sugar:
2. How many more teaspoons of sugar does the Orange Juicy Drink have than the Orange Juice?
drinkounces per Grams of
teaspoons of sugar Number of
serving sugardifferentsugar Grams ÷ 4 =Nutrientsteaspoons
Vegetable Juice Blend
Orange Juice
Cool Cola
Zap Energy Drink
Orange Juicy Soda
Berry Fruit Sparkler
Chocolate Milk, Low Fat 1%
Milk, Low Fat 1%
This material was produced by the California Department of Public Health’s Network for a Healthy California with funding from
USDA SNAP, known in California as CalFresh (formerly Food Stamps). These institutions are equal opportunity providers and
employers. CalFresh provides assistance to low-income households and can help buy nutritious foods for better health.
For CalFresh information, call 1-877-847-3663. For important nutrition information, visit www.cachampionsforchange.net.

3. If you drank two colas in one day, by how much would you exceed the daily-added sugar intake for
children?
4. Name the drink(s) with one or less nutrients:
5. How many more teaspoons of sugar does chocolate milk have than white milk?
6. Which drink has the least amount of sugar per serving?
7. Is there a mode for number of teaspoons in a beverage? If so, what is it?
8. What is the median for teaspoons of sugar?
9. Is there an outlier(s)?
10. If you add 4 ounces of bubbly water (which contains no sugar) to 4 ounces of Orange Juice, by how much
would you reduce the teaspoons of sugar for an 8-ounce glass of Orange Juice blend/mix?
11. You are deciding between these four drink options:
• Orange Juicy Soda
• Berry Fruit Sparkler
• Water
• Milk
Which would you choose?
Why?
12. You are at the store with some friends and some of them really like soda. What could you say to help them
make a healthy drink purchase?
12
How Sweet is It?table – page 2 of 2
This material was produced by the California Department of Public Health’s Network for a Healthy California with funding from
USDA SNAP, known in California as CalFresh (formerly Food Stamps). These institutions are equal opportunity providers and
employers. CalFresh provides assistance to low-income households and can help buy nutritious foods for better health.
For CalFresh information, call 1-877-847-3663. For important nutrition information, visit www.cachampionsforchange.net.

How Sweet is It?table answer key
1. Name the drink with the most added sugar for its serving size: Orange Juicy Soda
2. How many more teaspoons of sugar does Orange Juicy Soda have than Orange Juice? 6 teaspoons
3. If you drank two colas in one day, by how much would you exceed the daily-added sugar intake for children?
Exceed by 10 teaspoons
4. Name the drink(s) with one or less nutrients: Cool Cola, Zap Energy Drink, Orange Juicy Soda, and Berry Juice Sparkler
5. How many more teaspoons of sugar does chocolate milk have than white milk? 3 teaspoons
6. Which drink has the least amount of sugar per serving? Vegetable juice
7. Is there a mode for number of teaspoons in a beverage? Yes. If so, what is it? 6
8. What is the median for teaspoons of sugar? 6
9. Is there an outlier(s)? If so, what is it and for what beverage(s)? Yes, 2 and 3 may be considered outliers or Vegetable
Juice Blend and Milk, Low Fat 1%
10. If you add 4 ounces of bubbly water (which contains no sugar) to 4 ounces of orange juice, by how much would you reduce the
teaspoons of sugar for an 8-ounce glass of orange juice blend/mix? Reduce by 3 teaspoons of sugar
11. and 12. These questions include a variety of answers and are discussed in pairs and as a class.
13
drink ounces per Grams of teaspoons of sugar Number ofserving sugar different
sugar Grams ÷ 4 =Nutrients
teaspoons
Vegetable Juice Blend 8 9 2.25 or 2 4
Orange Juice 8 22 5.5 or 6 7
Cool Cola 12 39 9.75 or 10 0
Zap Energy Drink 8.3 25.05 6.26 or 6 1
Orange Juicy Soda 12 46 11.5 or 12 0
Berry Fruit Sparkler 12 27 6.75 or 7 1
Chocolate Milk, Low Fat 1% 8 25 6.25 or 6 4
Milk, Low Fat 1% 8 13 3.25 or 3 2
This material was produced by the California Department of Public Health’s Network for a Healthy California with funding from
USDA SNAP, known in California as CalFresh (formerly Food Stamps). These institutions are equal opportunity providers and
employers. CalFresh provides assistance to low-income households and can help buy nutritious foods for better health.
For CalFresh information, call 1-877-847-3663. For important nutrition information, visit www.cachampionsforchange.net.

14
Overhead
United States Food and Drug Administration, 2009 H h
Nutrition Facts Labeloverhead
Nutrition Facts Label
Source: United States Food and Drug Administration, 2009 How to Understand and Use the Nutrition Facts
label. http://www.fda.gov/Food/LabelingNutrition/ConsumerInformation (accessed July 25, 2010).
This material was produced by the California Department of Public Health’s Network for a Healthy California with funding from
USDA SNAP, known in California as CalFresh (formerly Food Stamps). These institutions are equal opportunity providers and
employers. CalFresh provides assistance to low-income households and can help buy nutritious foods for better health.
For CalFresh information, call 1-877-847-3663. For important nutrition information, visit www.cachampionsforchange.net.

How Sweet is It?Homework
Sugar-sweetened drinks add sugar and calories without providing other important nutrients. Drinking smaller
amounts or fewer sugar-sweetened beverages makes room for increased intake of water and nutrient-dense
foods while keeping calories in balance. The Dietary Guidelines for Americans, 2010 and MyPlate generally
recommend that sugar intake for children includes no more than 10 teaspoons (40 grams) per day based on
a 2,000 calorie diet.
Today, you learned to read a Nutrition Facts label and change grams of sugar to teaspoons of sugar.
Tonight, please find four items at home that have Nutrition Facts labels and complete the chart below. remember to
convert sugar grams to teaspoons of sugar by dividing the total number of sugar grams by four. Show all
your work on the back of the paper. Examples of nutrients are: iron, calcium, vitamins, and potassium. Have your
parent sign the bottom of the paper and return it.
Did the sugar content of any of the items surprise you? If yes, describe which ones, and why they surprised you.
Write a brief paragraph that compares which drinks you thought were nutritious before and after you looked at
the Nutrition Facts label. How can the food label help you “see through” advertising claims and make
better decisions about the drinks you choose?
Parent Signature: Student Name:
Comments:
15
ounces sugar sugarcontains
food or drink itemper serving (grams) (teaspoons)
Nutrients
yes or No
This material was produced by the California Department of Public Health’s Network for a Healthy California with funding from
USDA SNAP, known in California as CalFresh (formerly Food Stamps). These institutions are equal opportunity providers and
employers. CalFresh provides assistance to low-income households and can help buy nutritious foods for better health.
For CalFresh information, call 1-877-847-3663. For important nutrition information, visit www.cachampionsforchange.net.