Linked Data Visualization Model - KEG VŠE
33
LDVM implementation Ji ří Helmich, Jakub Klímek Department of Software Engineering Faculty of Mathematics and Physics Charles University
-
Upload
jiri-helmich -
Category
Software
-
view
107 -
download
0
Transcript of Linked Data Visualization Model - KEG VŠE

LDVM implementationJiří Helmich, Jakub Klímek
Department of Software Engineering
Faculty of Mathematics and Physics
Charles University

Linked Data
u Tim Berners-Lee: The next web
u http://www.ted.com/talks/tim_berners_lee_on_the_next_web
u “I want you to put your data on the Web!”
u Web of data
u Use HTTP URIs to denote things so that these things can be dereferenced by people and user agents.
u Provide useful information about the thing when its URI is dereferenced(RDF, SPARQL).
u Include links to other related things when publishing data on the Web.
LDVM IMPLEMENTATION 2

Linked Open Data
LDVM IMPLEMENTATION 3
It’s often very hard to obtain any data, especially governmental. That’s the first star. The second one reminds me of a way how public contracts were published in my hometown, Liberec – printed, scanned and the image placed into a PDF file.

So, we have Linked Data…
LDVM IMPLEMENTATION 4
DBPedia is still the center of the Linked Data universe. You can see that the density of links is higher in its neighbourhood. Anyway, it’s great to see a vast amount of Linked Data! But having it published is not enough…
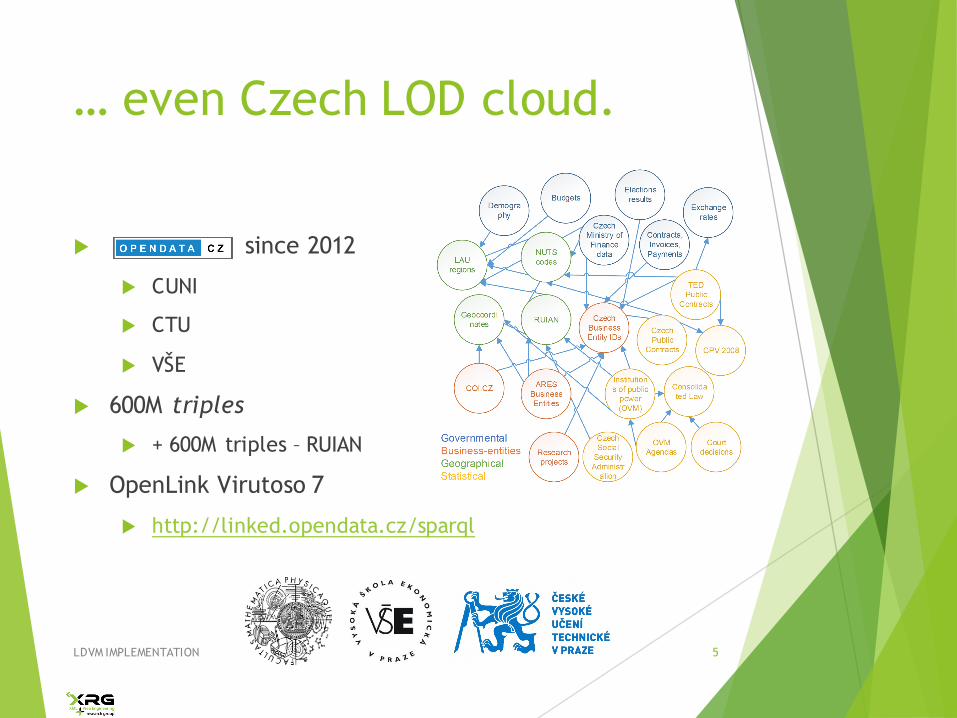
… even Czech LOD cloud.
u since 2012
u CUNI
u CTU
u VŠE
u 600M triples
u + 600M triples – RUIAN
u OpenLink Virutoso 7
u http://linked.opendata.cz/sparql
LDVM IMPLEMENTATION 5

So, I published a vast amount of data …
u What about getting something in return?
u Consuming data
u Presenting it in a standard way (charts, maps, …)
u Linked Data
u Integration with other datasets
u reasoning
LDVM IMPLEMENTATION 6
But it’s still hard to tell, whether you can use some dataset or directly combine it with yours. You don’t know, what a node in LOD represents. You don’t know how to visualize it, how to use it. Even if those dataset are similar and cover the same topic, they may use different schemas to describe those concepts (e.g. schema.org duplicates some vocabularies). Reasoning is forgotten, not implemented by many tools.

… but!
u What’s in there?
u How can I use some dataset to enrich mine?
u Is it even compatible with my dataset?
u Can I use some of those to prepare a cool visualization for my boss?
LDVM IMPLEMENTATION 7

Catalogues - CKAN
u A good way to start
u datahub.io: “finance”
u The Public Finances Databank is a compilation of published data covering the main aspects of the Government Finances including receipts, expenditure, borrowing and debt.
u linked.opendata.cz
u Too high-level
LDVM IMPLEMENTATION 8

Reality
LDVM IMPLEMENTATION 9
You start asking SPARQL queries. Top concepts, top queries. That’s the appropriate level, but …

Not very helpful.
LDVM IMPLEMENTATION 10

Visualizations
u Human is a visual being
u Best way how to involve people
u This is not visual:
LDVM IMPLEMENTATION 11

Basic LDVM use-case
u Show me, how I could VISUALIZE my data!
u Could I combine another datasets with mine?
LDVM IMPLEMENTATION 12
http://my.sparql.endpoint/http://some.named.graph

DEMO
LDVM IMPLEMENTATION 13
https://goo.gl/r5Ln89

Linked Data Visualization Model
LDVM IMPLEMENTATION 14
LDVM descripton, read e.g. http://events.linkeddata.org/ldow2014/papers/ldow2014_paper_13.pdf

LDVM pipeline
LDVM IMPLEMENTATION 15
RUIAN
OVM.ttlTowns extractor
RUIAN geocoder
Google Maps
This is the pipeline you saw in our first demo. How is it possible that we are able to discover it automatically? Let’s assume that the fragment ending with RUIAN geocoder was already assembled by our discovery algorithm.

LDVM compatibility check
LDVM IMPLEMENTATION 16
RUIAN geocoder
Google Maps
[] ruianlink:obec <ex1>;s:geo [
s:longitude "14.417780" ;s:latitude "50.084552" .
] .
Output data sample
ASK {?s s:geo ?g .?g a s:GeoCoordinates ;
s:latitude ?lat ;s:longitude ?lng .
}
Input descriptor
We use compatibility checking. Each output has an output data sample, sample RDF data that covers the possible output as well as possible, being as small as possible. Each input has a set of descriptors, SPARQL ASK queries, that describes an expected input. If descriptors match data samples, corresponding components are compatible and can be chained into a visualization pipeline.

LDVM discovery
u Iterative process
u Chaining registered LDVM components
u Starts with pipeline fragments based on available data sources
LDVM IMPLEMENTATION 17
Towns extractor
Google Maps
RUIAN geocoder
RUIAN OVM.ttl

LDVM discovery – before iteration 1
LDVM IMPLEMENTATION 18
RUIAN OVM.ttl
Towns extractor
Google MapsRUIAN geocoder
Pipeline fragments
Available components

LDVM discovery – iteration 1
LDVM IMPLEMENTATION 19
RUIAN OVM.ttl
Towns extractor
Google MapsRUIAN geocoder
Towns extractor
Google MapsRUIAN geocoder
For every input, every descriptor query is asked against every available datasource. If the datasource answers TRUE, it’s possible for the component to use that datasource via one of its inputs. Original slides contains animation where some inputs turn green and some red, based on compatibility checking.
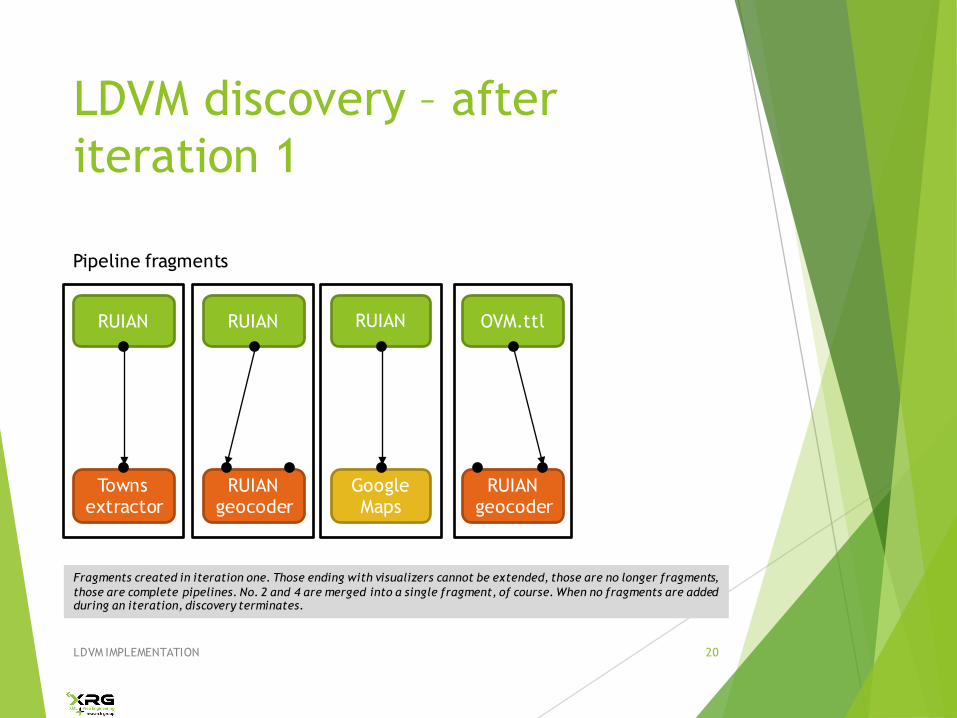
LDVM discovery – after iteration 1
LDVM IMPLEMENTATION 20
RUIAN OVM.ttl
Towns extractor
Google Maps
RUIAN geocoder
Pipeline fragments
RUIAN RUIAN
RUIAN geocoder
Fragments created in iteration one. Those ending with visualizers cannot be extended, those are no longer fragments, those are complete pipelines. No. 2 and 4 are merged into a single fragment, of course. When no fragments are added during an iteration, discovery terminates.

LDVM discovery – after iteration 4
LDVM IMPLEMENTATION 21
RUIAN
OVM.ttlTowns extractor
RUIAN geocoder
Google Maps

DEMO
LDVM IMPLEMENTATION 22
https://goo.gl/CEiZpR

LDVM features
LDVM IMPLEMENTATION 23
To display a marker on a map is just one of the visualizer`s features. It is also able to provide facets, display labels and descriptions. Those features could be described formally by means of LDVM and assigned their own descriptors.

LDVM features
LDVM IMPLEMENTATION 24
?s s:geo ?g .?g a s:GeoCoordinates ;
s:latitude ?lat ;s:longitude ?lng .
?s s:geo ?g ;?p ?o .
?o a skos:Concept.
?o s:name ?n .
?o s:description ?d .
A dataset must contain some coordinates. If it does not, the maps visualizer is not a good candidate. Therefore that feature is a mandatory one. Facets are generated using skos:Concept, but that’s an optional feature. The same holds for labels and descriptions. Based on feature coverage, we will be able to rank both datasets and visualization pipelines.

LDVM vocabulary
u Define your component or pipeline in RDF
u http://lov.okfn.org/dataset/lov/vocabs/ldvm
u https://github.com/payola/ldvm
LDVM IMPLEMENTATION 25

LDVMi
u http://ldvm.opendata.cz
u https://github.com/payola/LDVMi
LDVM IMPLEMENTATION 26
Running instance of our tool, formerly known as Payola. Currently supporting just our components. Work in progress ;-)

Examples
LDVM IMPLEMENTATION
27
Lates achievements. Note that the filtering is not enough in this case, we’ll have to introduce something more clever.

Examples
LDVM IMPLEMENTATION
28
Backstage: When a LOD guy tries to work with map projections. The black shape should be Slovakia.
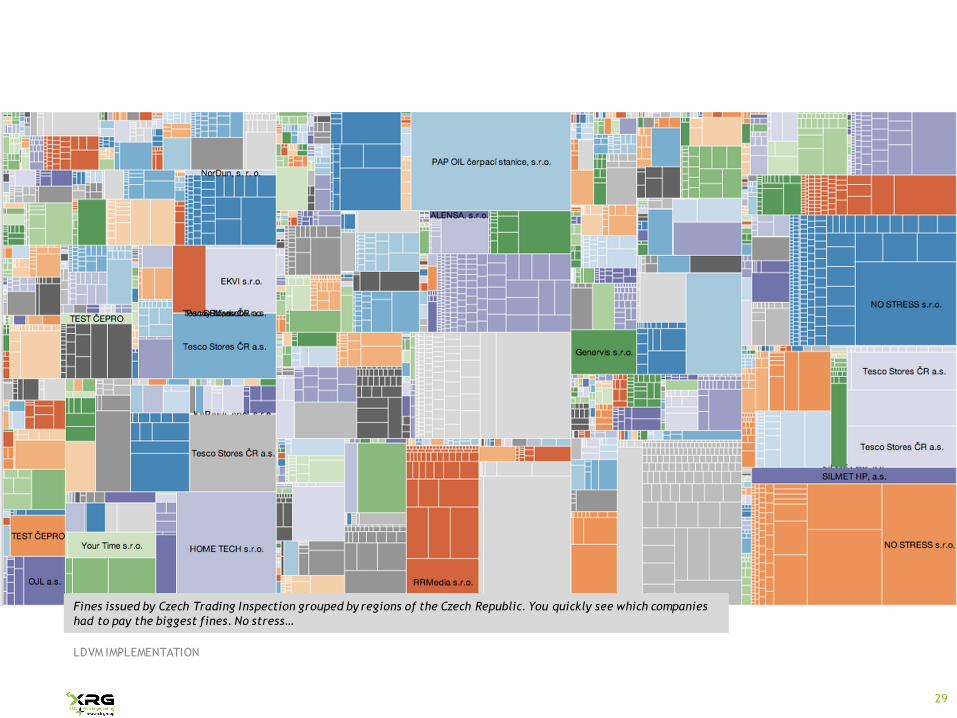
Examples
LDVM IMPLEMENTATION
29
Fines issued by Czech Trading Inspection grouped by regions of the Czech Republic. You quickly see which companies had to pay the biggest fines. No stress…

Advertisement
u http://vysledkykontrol.cz
LDVM IMPLEMENTATION 30

Examples
LDVM IMPLEMENTATION
31
The most advanced visualizer we currently have is the DataCube visualizer. Bosses love charts.
Available components
u Datasourcesu Easy to create
u Analyzersu Just SPARQL queries right now
u Transformersu Easy to implement, SPARQL queries
u Hard to check compatibility
u Visualizersu Google Maps, OpenLayers, Treemap, Sunburst, PackLayout,
DataCube
u Do your own!u Even now, you can implement your own and extend our library.
LDVM IMPLEMENTATION 32

Thank you!
?LDVM IMPLEMENTATION 33