![UCLA Chakravarty Talk[1]](https://static.fdocuments.in/doc/165x107/621ec7a8c7909d1d840a588a/ucla-chakravarty-talk1.jpg)
Linkages between Water, Sanitation and Hygiene with Food Safety and Nutrition Prof. Indira...
34
Linkages between Water, Sanitation and Hygiene with Food Safety and Nutrition Prof. Indira Chakravarty, PhD, DSC Chief Advisor Public Health Engineering Department, Govt. of West Bengal Member National Drinking Water and Sanitation Council, MDWS, Govt. of India Board Member United Nations University - IIGH Ex-Member Food Safety and Standards Authority of India, Ministry of Health and Family Welfare, Govt. of India Former Regional Director, South Asia MI, IDRC, Canada Former Addl. DGHS, Director and Dean All India Institute of Hygiene and Public Health, Ministry of Health and Family Welfare, Govt. of India Former Director Chittaranjan National Cancer Institute, Ministry of Health and Family Welfare, Govt. of India Former Regional Advisor Nutrition(Act) WHO, SEARO
-
Upload
gordon-skinner -
Category
Documents
-
view
217 -
download
1
Transcript of Linkages between Water, Sanitation and Hygiene with Food Safety and Nutrition Prof. Indira...

Linkages between Water, Sanitation and Hygiene with Food
Safety and Nutrition
Prof. Indira Chakravarty, PhD, DSCChief Advisor
Public Health Engineering Department, Govt. of West BengalMember
National Drinking Water and Sanitation Council, MDWS, Govt. of India
Board MemberUnited Nations University - IIGH
Ex-MemberFood Safety and Standards Authority of India,
Ministry of Health and Family Welfare, Govt. of IndiaFormer Regional Director, South Asia
MI, IDRC, CanadaFormer Addl. DGHS, Director and Dean
All India Institute of Hygiene and Public Health, Ministry of Health and Family Welfare, Govt. of IndiaFormer Director
Chittaranjan National Cancer Institute, Ministry of Health and Family Welfare, Govt. of IndiaFormer Regional Advisor Nutrition(Act)
WHO, SEARO
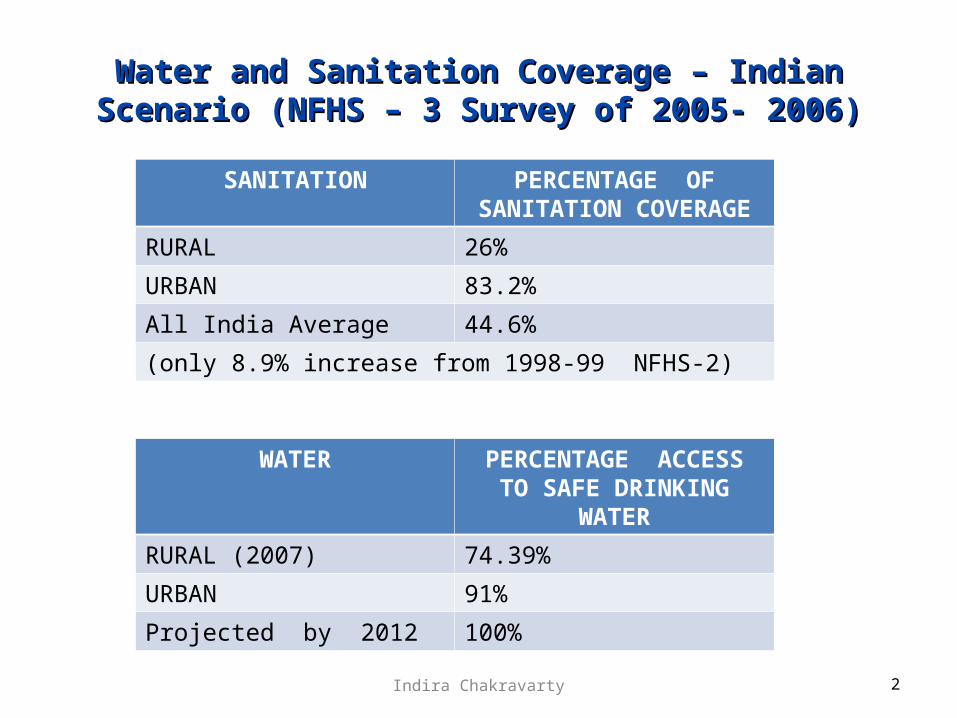
Water and Sanitation Coverage – Indian Scenario Water and Sanitation Coverage – Indian Scenario (NFHS – 3 Survey of 2005- 2006)(NFHS – 3 Survey of 2005- 2006)
2
SANITATION PERCENTAGE OF SANITATION COVERAGE
RURAL 26%
URBAN 83.2%
All India Average 44.6%
(only 8.9% increase from 1998-99 NFHS-2)
WATER PERCENTAGE ACCESSTO SAFE DRINKING WATER
RURAL (2007) 74.39%
URBAN 91%
Projected by 2012 100%
Indira Chakravarty
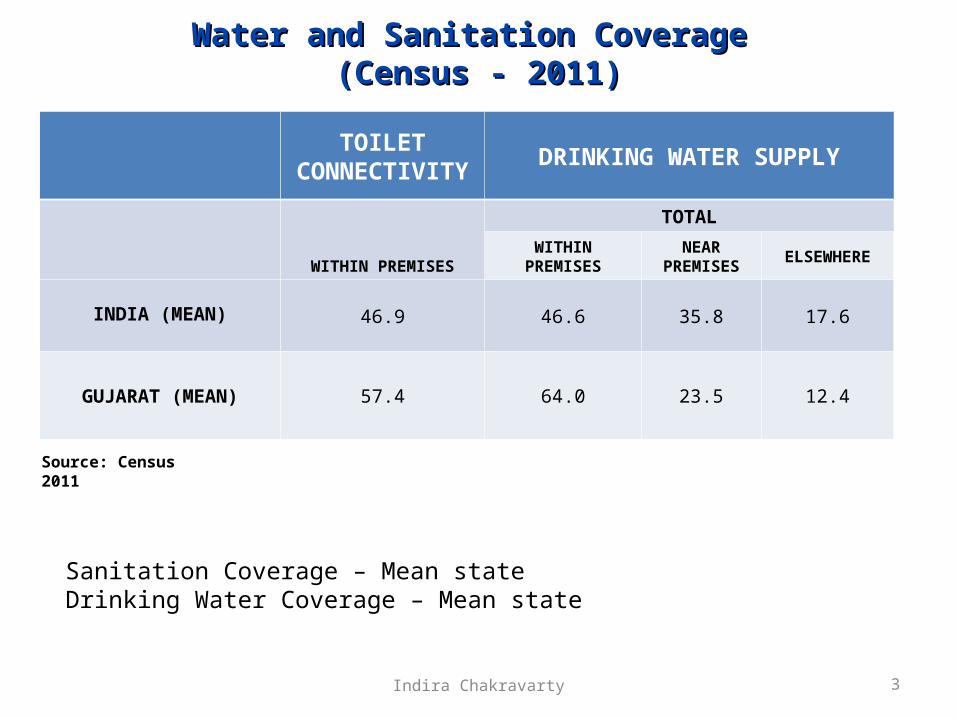
Water and Sanitation Coverage Water and Sanitation Coverage (Census - 2011)(Census - 2011)
TOILET CONNECTIVITY DRINKING WATER SUPPLY
WITHIN PREMISES
TOTAL
WITHIN PREMISES NEAR PREMISES ELSEWHERE
INDIA (MEAN) 46.9 46.6 35.8 17.6
GUJARAT (MEAN) 57.4 64.0 23.5 12.4
Source: Census 2011
Sanitation Coverage – Mean stateDrinking Water Coverage – Mean state
3Indira Chakravarty
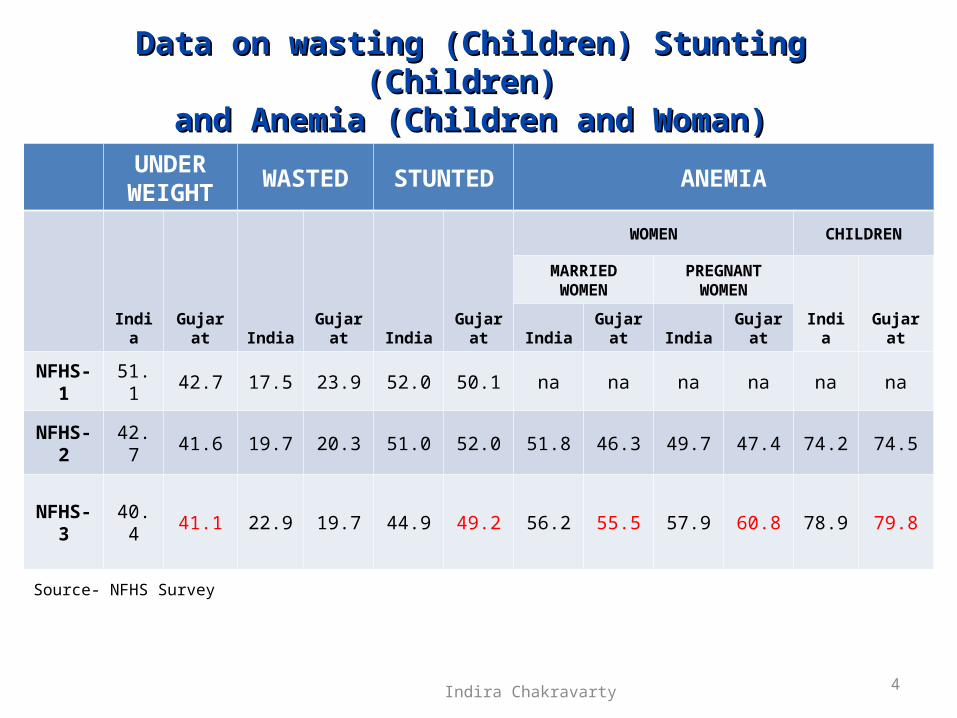
Data on wasting (Children) Stunting (Children) Data on wasting (Children) Stunting (Children) and Anemia (Children and Woman)and Anemia (Children and Woman)
UNDER WEIGHT WASTED STUNTED ANEMIA
India Gujarat India Gujarat India Gujarat
WOMEN CHILDREN
MARRIED WOMEN
PREGNANT WOMEN
India GujaratIndia Gujarat India Gujarat
NFHS-1 51.1 42.7 17.5 23.9 52.0 50.1 na na na na na na
NFHS-2 42.7 41.6 19.7 20.3 51.0 52.0 51.8 46.3 49.7 47.4 74.2 74.5
NFHS-3 40.4 41.1 22.9 19.7 44.9 49.2 56.2 55.5 57.9 60.8 78.9 79.8
Source- NFHS Survey
Indira Chakravarty 4
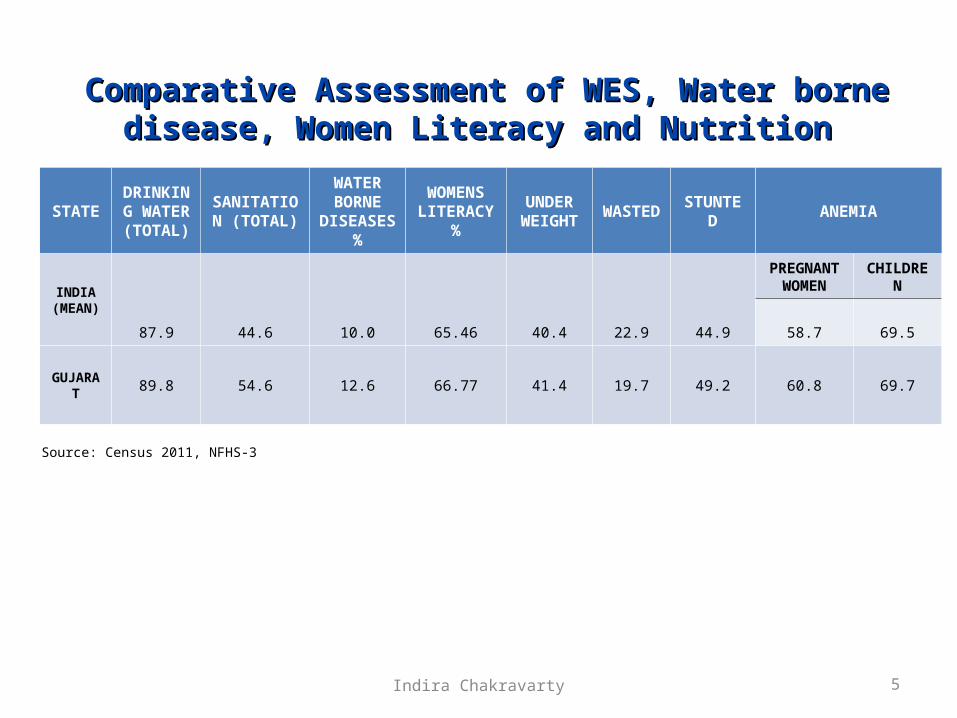
STATEDRINKING
WATER (TOTAL)
SANITATION (TOTAL)
WATER BORNE
DISEASES %
WOMENS LITERACY %
UNDER WEIGHT WASTED STUNTED ANEMIA
INDIA (MEAN)
87.9 44.6 10.0 65.46 40.4 22.9 44.9
PREGNANT WOMEN CHILDREN
58.7 69.5
GUJARAT 89.8 54.6 12.6 66.77 41.4 19.7 49.2 60.8 69.7
Source: Census 2011, NFHS-3
Comparative Assessment of WES, Water borne disease, Comparative Assessment of WES, Water borne disease, Women Literacy and Nutrition Women Literacy and Nutrition
5Indira Chakravarty
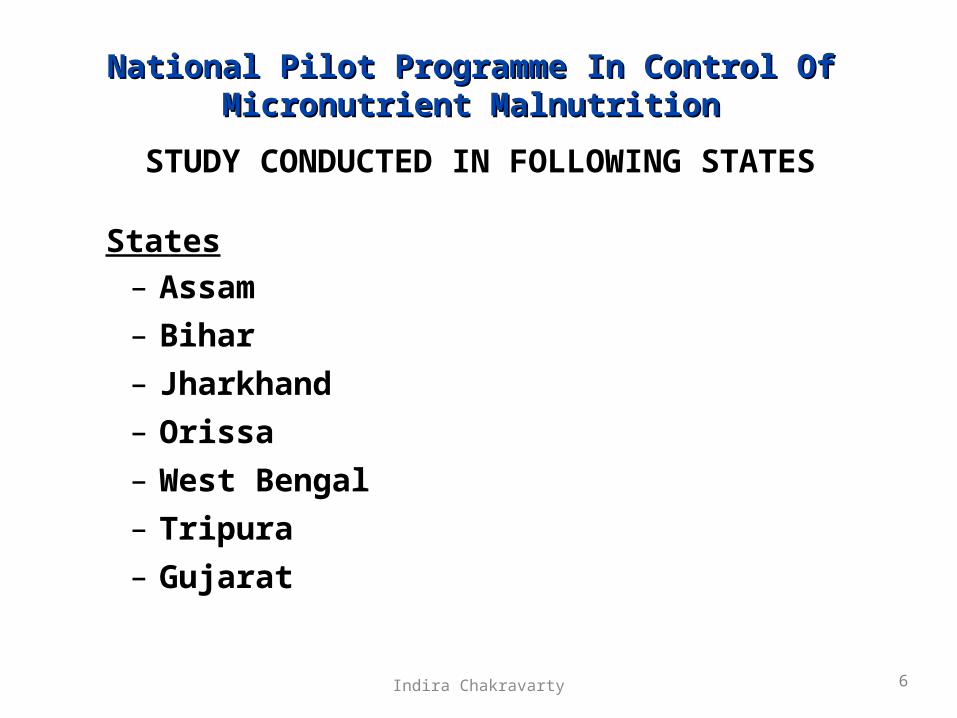
National Pilot Programme In Control Of Micronutrient National Pilot Programme In Control Of Micronutrient MalnutritionMalnutrition
States– Assam
– Bihar
– Jharkhand
– Orissa
– West Bengal
– Tripura
– Gujarat
6
STUDY CONDUCTED IN FOLLOWING STATES
Indira Chakravarty

Prevalence of Anemia in women over life – Prevalence of Anemia in women over life – Compiled data from 7 statesCompiled data from 7 states
(The National Pilot Programme on Control of Micronutrient Malnutrition, AIIH&PH, 1995-2008)
7
AGE GROUP
ANEMIA IN FEMALES
MILD & MODERATE SEVERE
RANGE (%) MEAN (%) RANGE (%) MEAN (%)
6 m – 6 y 49.2 - 86.5 68.2 1.2 - 4.5 2.8
6 – 12 y 61.9 - 87.1 81.3 0.6 - 11.0 6.0
12 – 19 y 79.5 - 89.3 82.7 3.2 - 9.1 6.4
19 – 45 y 70.8 - 90.4 82.7 3.6 - 9.3 6.4
45 – 60 y 68.0 - 88.0 79.1 3.0 - 9.4 5.9
60 y AND ABOVE 64.8 - 88.2 78.0 2.2 - 4.5 3.3
PREGNANT WOMAN
68.0 - 89.0 79.7 3.3 - 15.0 11.2
Indira Chakravarty

12.8
7.3
55.5
9.8
51
21.5 20.5
0.4
32.8
19.8
39.8
0.3
4.7
28.8
60.9
2.8
20.5
3.3
51.5
21.1
11.1
0.2
30.7
24.3
0
10
20
30
40
50
60
70
Pe
rce
nta
ge
Kumrup (A) Gumla (J) Jajpur (O) Bankura (W.B.) West Dist. (T) Sabarkantha(G)
Districts
Percentage distribution of families according to drinking water sources (others sources such as pond, river, any other have not been shown)
Well Kuchha
Well Pucca
Tubewell
Municipal supply
8Indira Chakravarty

Op
en f
ield
Lat
rin
es (
pri
vate
)
Lat
rin
es (
com
mu
nit
y)
An
y o
ther
Ku
mru
p (
A)
Gu
mla
(J
)
Ja
jpu
r (O
)
Ba
nk
ura
(W
.B.)
We
st
Dis
t. (
T)
Sa
ba
rka
nth
a(G
)
77.7
21.7
0.6 0.1
1222.3
0.7
65.6
90.9
8.70.3 0.2
85.6
13.9
0 0.6
94.4
4.70.3 0.6
47.344.1
5.82.80
10
20
30
40
50
60
70
80
90
100
Pe
rce
nta
ge
Human excreta disposal practice
Districts
Percentage distribution of families according to practices of human excreta disposal
9Indira Chakravarty
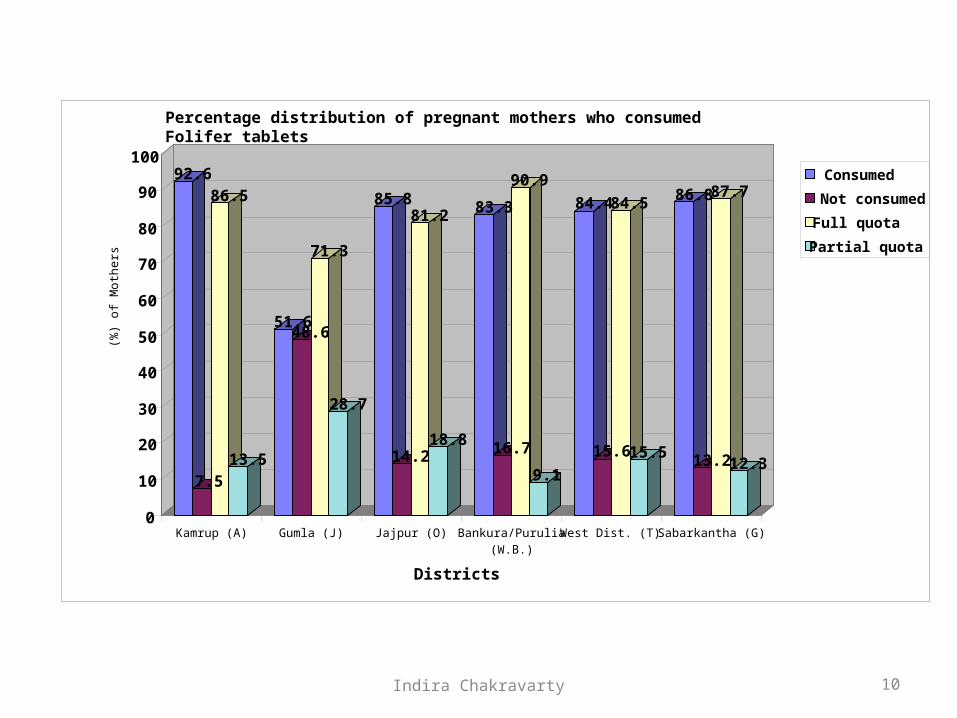
92.6
7.5
86.5
13.5
51.648.6
71.3
28.7
85.8
14.2
81.2
18.8
83.3
16.7
90.9
9.1
84.4
15.6
84.5
15.5
86.8
13.2
87.7
12.3
0
10
20
30
40
50
60
70
80
90
100
(%)
of
Mo
the
rs
Kamrup (A) Gumla (J) Jajpur (O) Bankura/Purulia(W.B.)
West Dist. (T) Sabarkantha (G)
Districts
Percentage distribution of pregnant mothers who consumed Folifer tablets
Consumed
Not consumed
Full quota
Partial quota
10Indira Chakravarty

0
100
200
300
400
500
600
700
800
900
Vita
min
A (u
g)
Kamrup(A) Gumla(J ) J ajpur(O) Bankura/P urulia(W.B) West.Dist.(T) Sabarkantha (G) RDA
Districts
Mean dietary Vitamin A (ug/acu/day) intake from Diet Survey
Vitamin A
11Indira Chakravarty
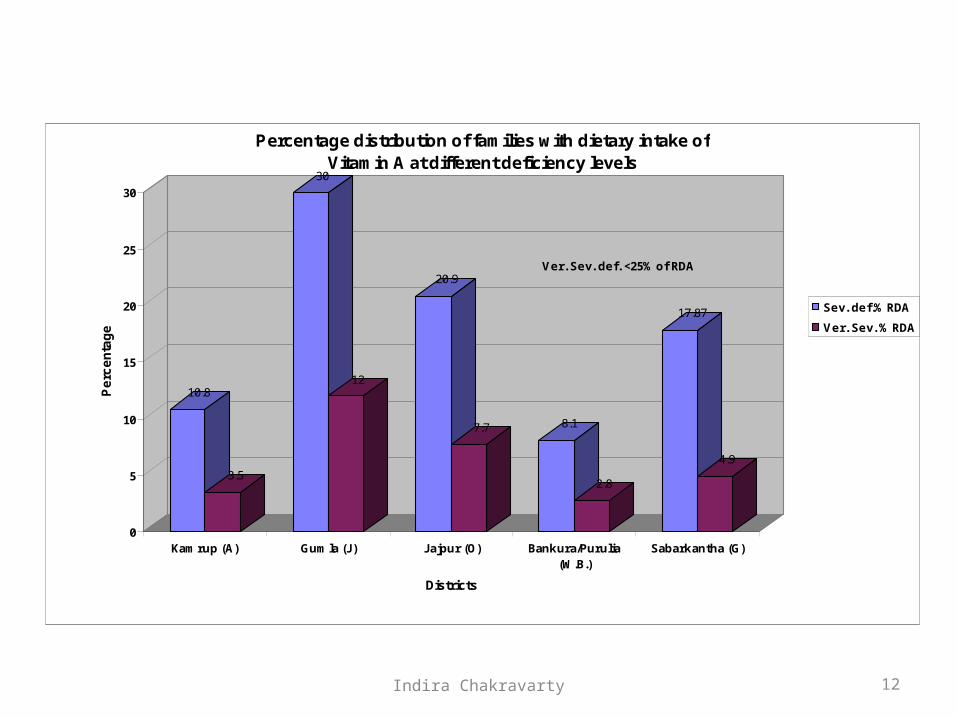
10.8
3.5
30
12
20.9
7.7 8.1
2.8
17.87
4.9
0
5
10
15
20
25
30
Pe
rce
nta
ge
Kamrup (A) Gumla (J) Jajpur (O) Bankura/Purulia(W.B.)
Sabarkantha (G)
Districts
Percentage distribution of families with dietary intake of Vitamin A at different deficiency levels
Sev. def.% RDA
Ver. Sev. % RDA
Note - Sev. def. <50% of RDA Ver. Sev. def. <25% of RDA
12Indira Chakravarty

0
10
20
30
40
50
60
70
80
Pe
rce
nta
ge
Kamrup (A) Gumla (J) Jajpur (O) Bankura/Purulia (WB) Sabarkantha (G)
Districts
Percentage distribution of families with dietary intake of Iron at different deficiency levels
Sev. def.% RDA
Ver. Sev. % RDA
Note - Sev. def. < 50% of RDA Ver. Sev. def. < 25% of RDA
13Indira Chakravarty

8.19
7.5
9.38.6
15
0
2
4
6
8
10
12
14
16
Zin
c (
mg
)
Kamrup (A) Gumla (J) Jajpur (O) Bankura/Purulia(W.B.)
Sabarkantha (G) RDA
Districts
Average Consumption (mg/acu/day) of dietary Zinc intake
14Indira Chakravarty

Impact of Water, Impact of Water, Sanitation and Hygiene Sanitation and Hygiene on Nutritional status.on Nutritional status.
15Indira Chakravarty
16Indira Chakravarty
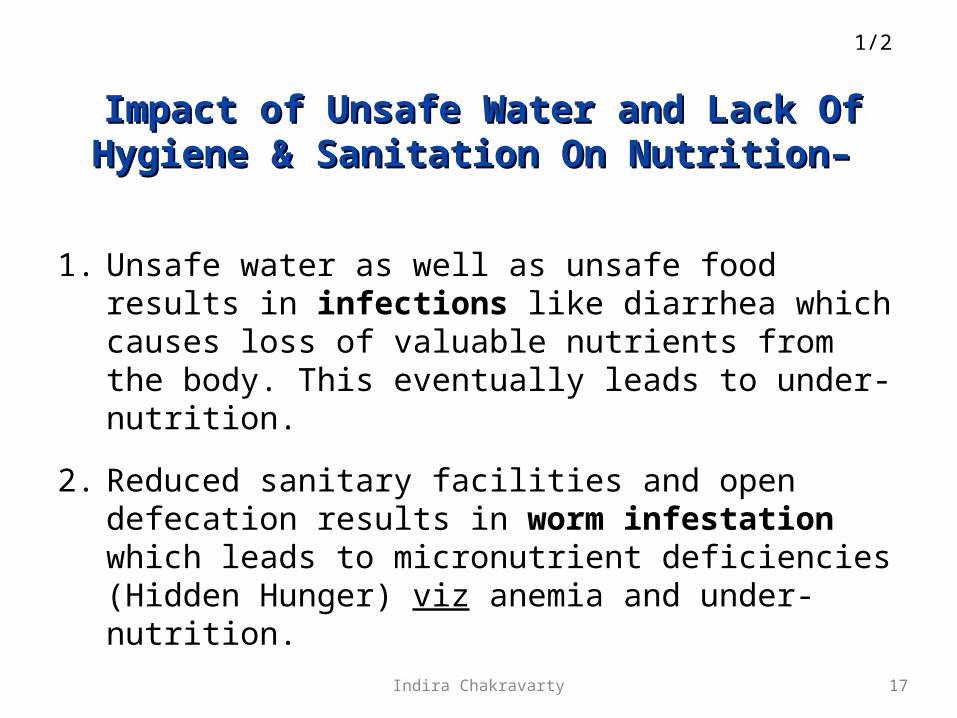
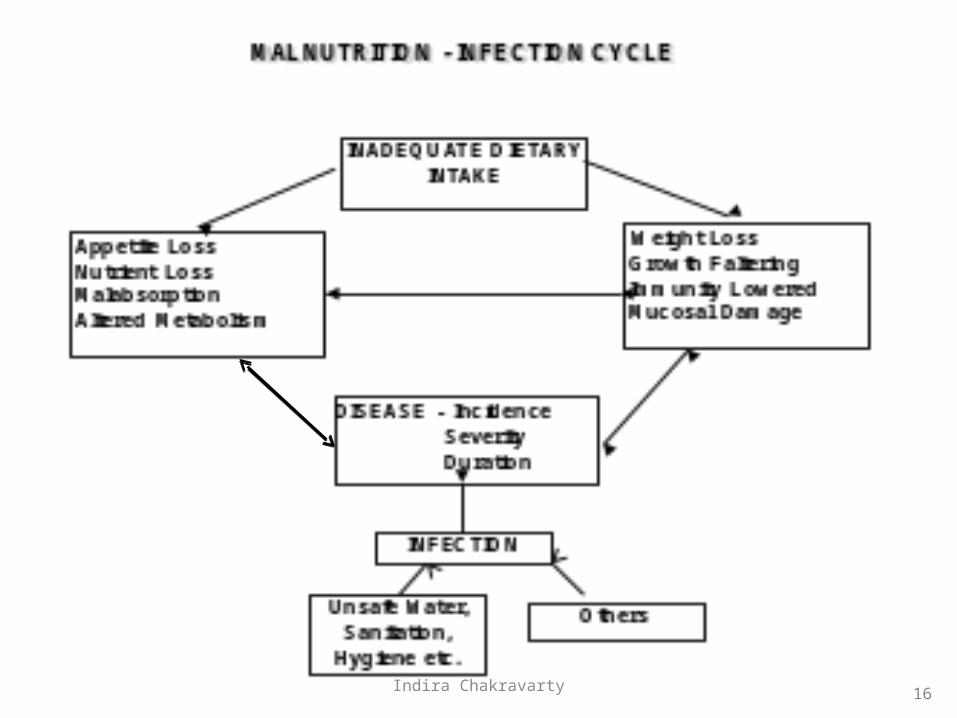
1. Unsafe water as well as unsafe food results in infections like diarrhea which causes loss of valuable nutrients from the body. This eventually leads to under-nutrition.
2. Reduced sanitary facilities and open defecation results in worm infestation which leads to micronutrient deficiencies (Hidden Hunger) viz anemia and under-nutrition.
Impact of Unsafe Water and Lack Of Impact of Unsafe Water and Lack Of Hygiene & Sanitation On Nutrition– Hygiene & Sanitation On Nutrition–
1/2
17Indira Chakravarty
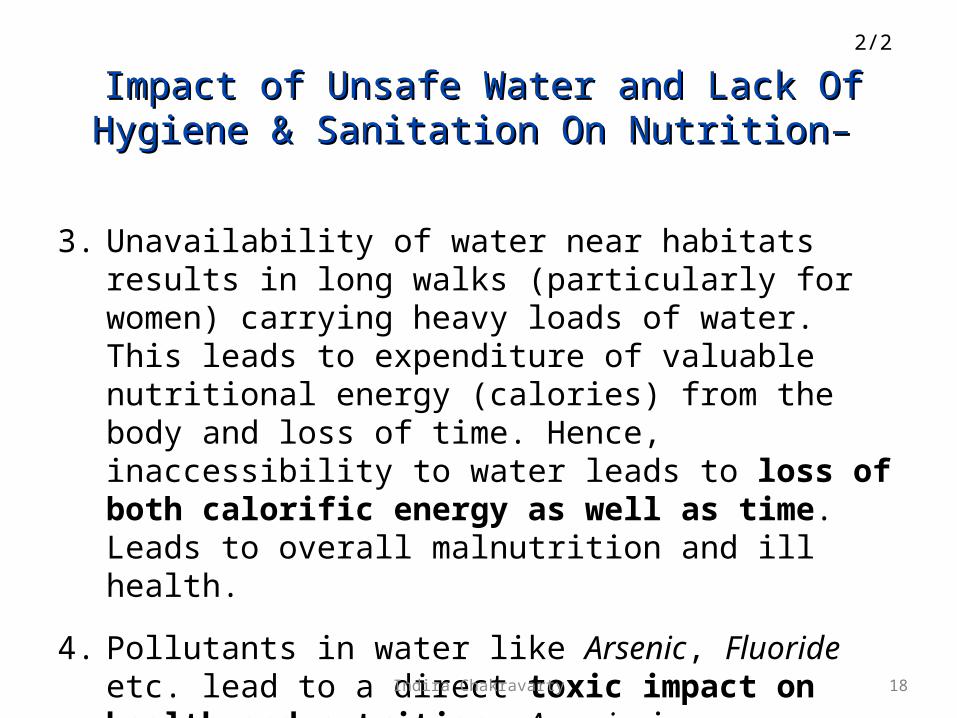
3. Unavailability of water near habitats results in long walks (particularly for women) carrying heavy loads of water. This leads to expenditure of valuable nutritional energy (calories) from the body and loss of time. Hence, inaccessibility to water leads to loss of both calorific energy as well as time. Leads to overall malnutrition and ill health.
4. Pollutants in water like Arsenic, Fluoride etc. lead to a direct toxic impact on health and nutrition. Arsenic in particular also enter the food chain at several points.
Impact of Unsafe Water and Lack Of Hygiene Impact of Unsafe Water and Lack Of Hygiene & Sanitation On Nutrition–& Sanitation On Nutrition–
2/2
18Indira Chakravarty

1. Under-nutrition in the entire community, especially in children.
2. Anemia, especially in children and women. This may lead to Low Birth Weight (LBW) Babies, higher Maternal Mortality Rate (MMR), low work capacity, tiredness etc.
3. Disability – Both under-nutrition as well as unsafe environment are the causes of disability in many cases, specially in children.
The most significant impact of poor The most significant impact of poor WES On NutritionWES On Nutrition
19Indira Chakravarty
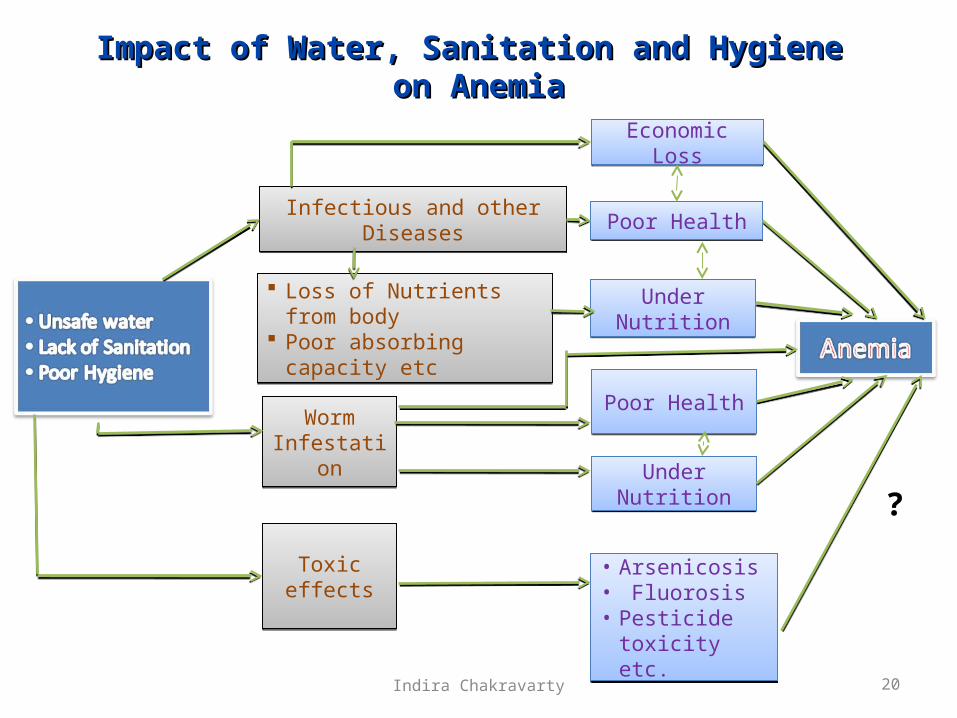
Impact of Water, Sanitation and Hygiene Impact of Water, Sanitation and Hygiene on Anemiaon Anemia
20
Economic LossEconomic Loss
Poor HealthPoor HealthInfectious and other DiseasesInfectious and other Diseases
Loss of Nutrients from body Poor absorbing capacity etc Loss of Nutrients from body Poor absorbing capacity etc
Under NutritionUnder Nutrition
Worm Infestation
Worm Infestation
Toxic effectsToxic effects
Under NutritionUnder Nutrition
• Arsenicosis• Fluorosis• Pesticide toxicity
etc.
• Arsenicosis• Fluorosis• Pesticide toxicity
etc.
Poor HealthPoor Health
?
Indira Chakravarty

21
CASECASE
STUDIESSTUDIESIndira Chakravarty
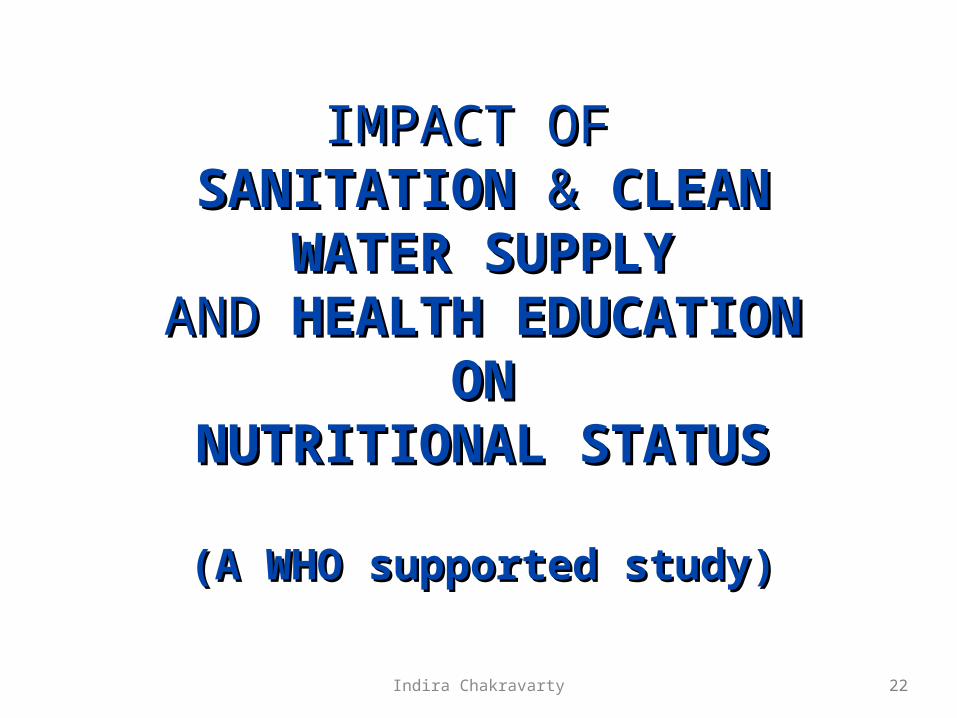
IMPACT OFIMPACT OF SANITATION SANITATION && CLEAN CLEAN
WATER SUPPLYWATER SUPPLYANDAND HEALTH EDUCATION HEALTH EDUCATION
ONONNUTRITIONAL STATUSNUTRITIONAL STATUS
(A WHO supported study)(A WHO supported study)
22Indira Chakravarty

23
STUDY AREASTUDY AREA
Village : Daharpur
District : Midnapore
State : West Bengal
Period : 3 years
Indira Chakravarty
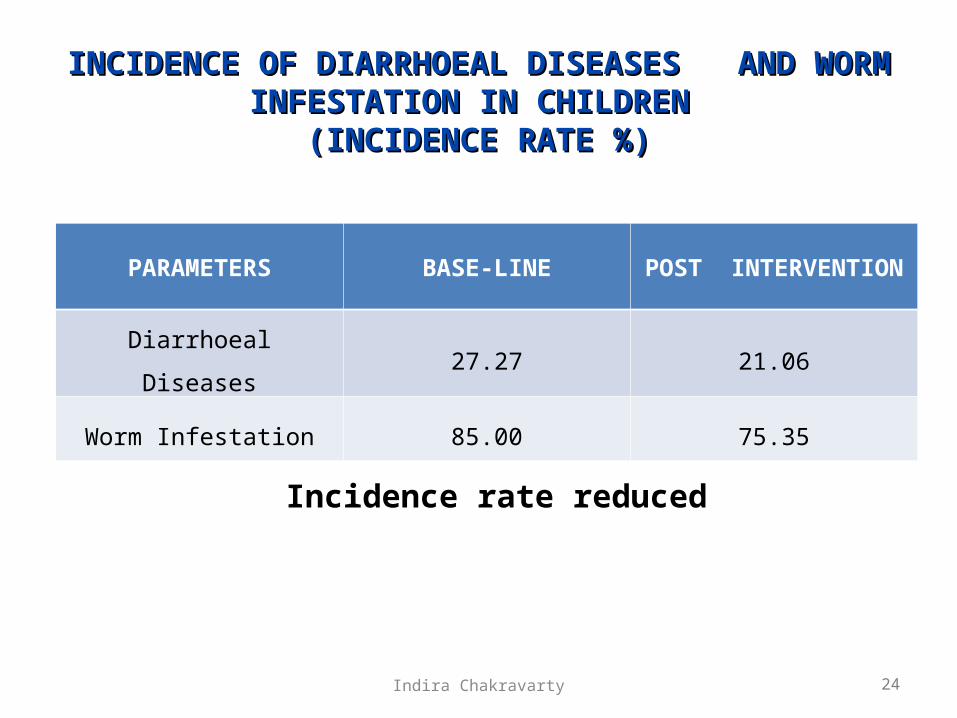
INCIDENCE OF DIARRHOEAL DISEASES AND WORM INCIDENCE OF DIARRHOEAL DISEASES AND WORM INFESTATION IN CHILDREN INFESTATION IN CHILDREN
(INCIDENCE RATE %)(INCIDENCE RATE %)
24
Incidence rate reduced
PARAMETERS BASE-LINE POST INTERVENTION
Diarrhoeal Diseases 27.27 21.06
Worm Infestation 85.00 75.35
Indira Chakravarty

25
CHANGE IN NUTRITIONAL STATUS OF CHILDREN CHANGE IN NUTRITIONAL STATUS OF CHILDREN AFTER PROVISION OF WES AFTER PROVISION OF WES
[Weight for Age ][Weight for Age ]
Significant improvement
NUTRITIONAL STATUS BASE LINE POST INTERVENTION (%)
NORMAL5.27 13.46
GRADE – I 26.31 38.46
GRADE – II 57.89 38.46
GRADE – III 10.83 9.62
Indira Chakravarty

26
• Significant Reduction in diarrheal and and worm
infestation rate.
• Significant improvement in weight for age
(nutritional status).
After provision of WES for 3 years
CONCLUSIONCONCLUSION
*-Based on values of Normal.
Indira Chakravarty
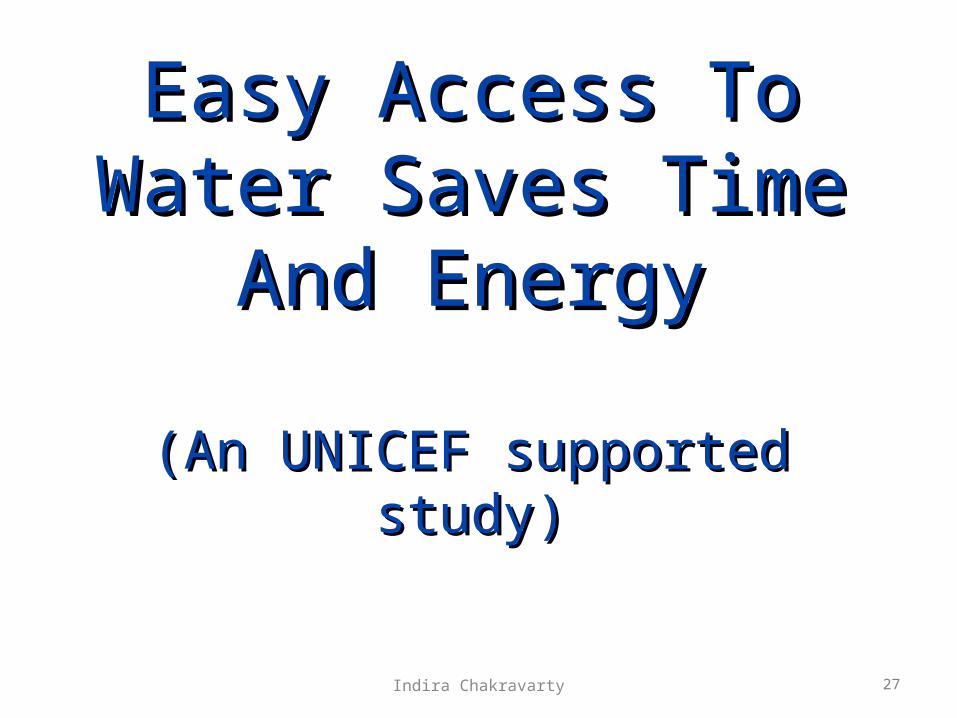
Easy Access To Easy Access To Water Saves Time Water Saves Time
And EnergyAnd Energy
(An UNICEF supported study)(An UNICEF supported study)
27Indira Chakravarty
28
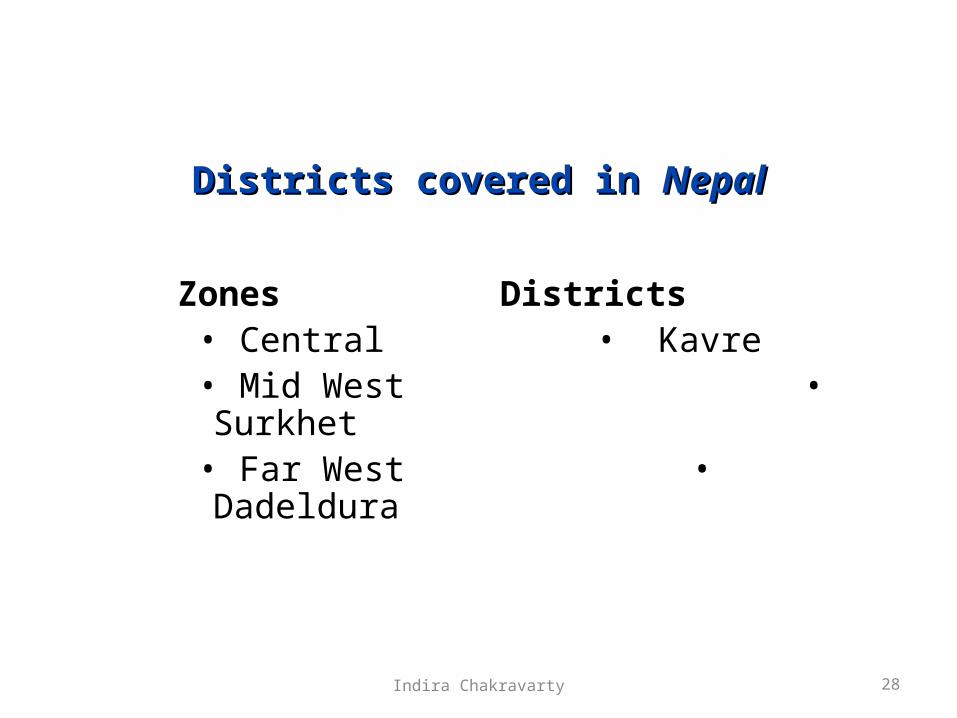
Districts covered in Districts covered in NepalNepal
Zones Districts • Central • Kavre • Mid West • Surkhet • Far West • Dadeldura
Indira Chakravarty
29
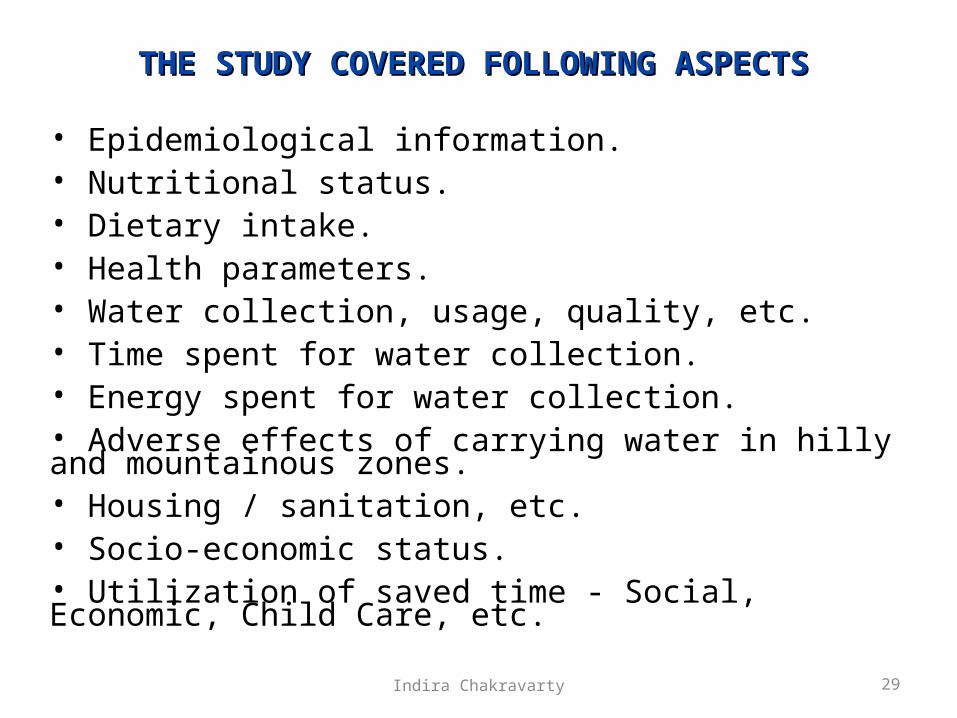
THE STUDY COVERED FOLLOWING ASPECTS THE STUDY COVERED FOLLOWING ASPECTS
• Epidemiological information.• Nutritional status.• Dietary intake.• Health parameters.• Water collection, usage, quality, etc.• Time spent for water collection.• Energy spent for water collection.• Adverse effects of carrying water in hilly and mountainous zones.• Housing / sanitation, etc.• Socio-economic status.• Utilization of saved time - Social, Economic, Child Care, etc.
Indira Chakravarty
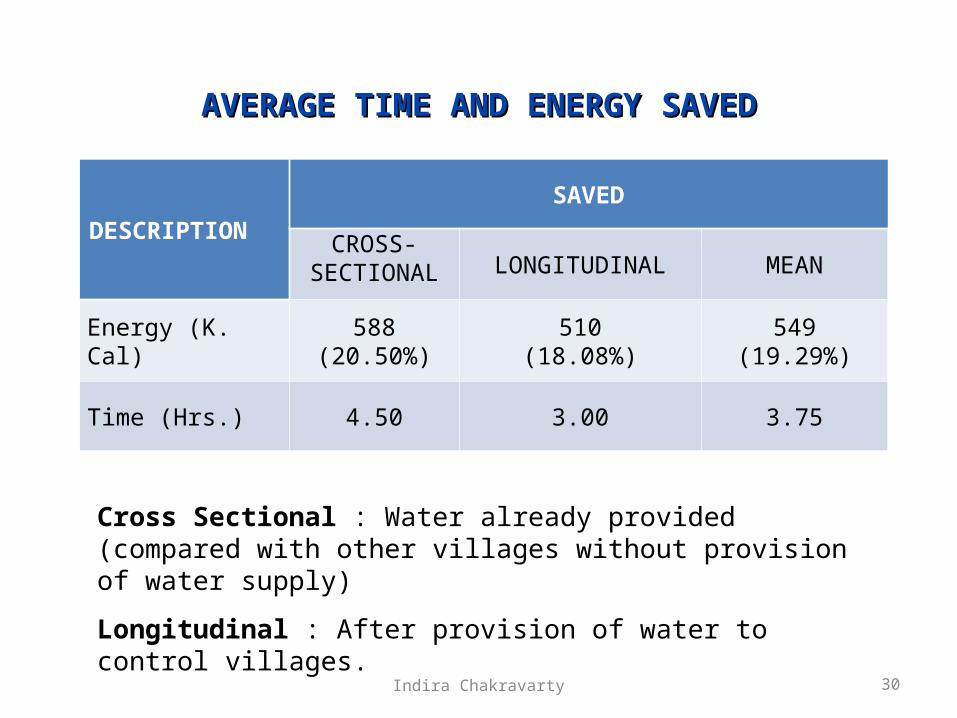
30
AVERAGE TIME AND ENERGY SAVEDAVERAGE TIME AND ENERGY SAVED
Cross Sectional : Water already provided (compared with other villages without provision of water supply)
Longitudinal : After provision of water to control villages.
DESCRIPTIONSAVED
CROSS-SECTIONAL LONGITUDINAL MEAN
Energy (K. Cal) 588(20.50%)
510(18.08%)
549(19.29%)
Time (Hrs.) 4.50 3.00 3.75
Indira Chakravarty

31
IMPROVEMENT IN NUTRITIONAL STATUS OF IMPROVEMENT IN NUTRITIONAL STATUS OF CHILDREN* CHILDREN*
(WEIGHT FOR AGE)
* 0-5 YEARS
Pooled = Central, Mid-west, Far-west.
Significant improvement of nutritional status
Sl ZONE STATUS NUTRITIONAL STATUS OF CHILDREN (%)
NORMAL GRADE-I GRADE-II GRADE-III
1. POOLED CONTROL 20.4 32.7 26.6 20.4
EXPERIMENTAL 26.3 34.2 26.3 13.2
Indira Chakravarty
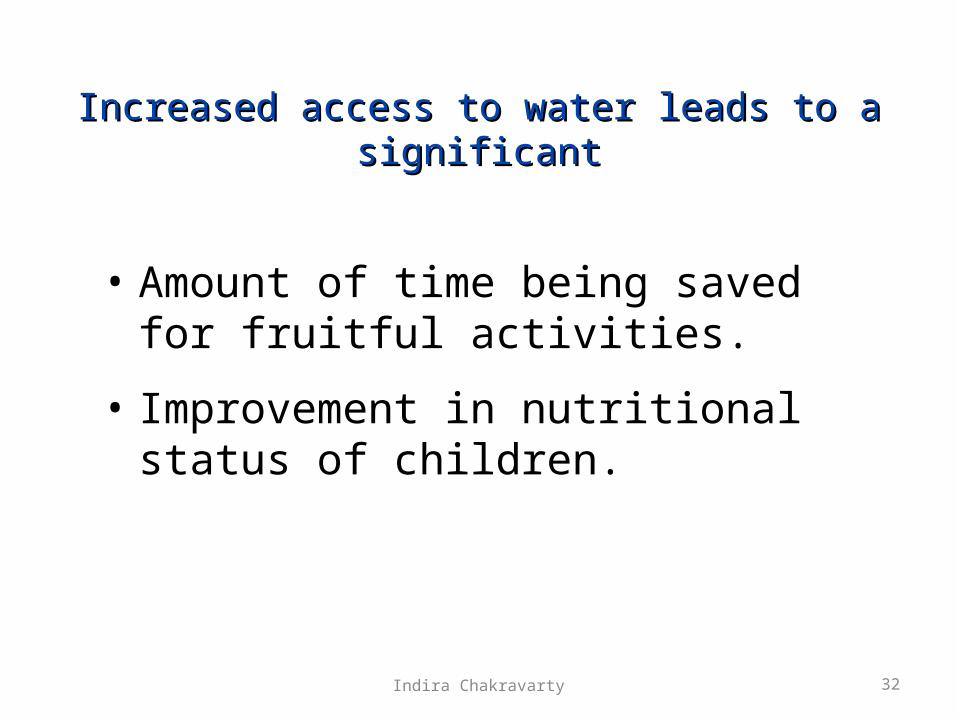
Increased access to water leads to a Increased access to water leads to a significantsignificant
• Amount of time being saved for fruitful activities.
• Improvement in nutritional status of children.
32Indira Chakravarty
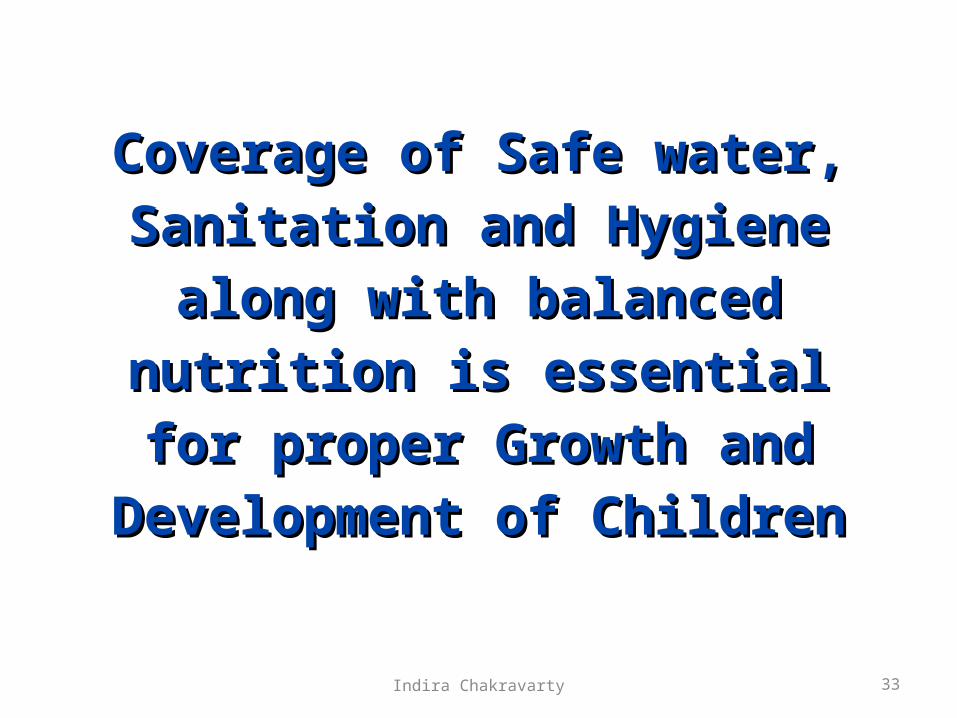
Coverage of Safe water, Coverage of Safe water,
Sanitation and Hygiene along Sanitation and Hygiene along
with balanced nutrition is with balanced nutrition is
essential for proper Growth essential for proper Growth
and Development of Childrenand Development of Children
33Indira Chakravarty

34Indira Chakravarty