Linkages between cookstoves and REDD+ 4While demand- and supply-side interventions are equivalent in...
50
1 March 2015 Linkages between cookstoves and REDD+ A report for the Global Alliance for Clean Cookstoves Charlie Parker Paul Keenlyside Hilda Galt Franziska Haupt Theodore Varns
Transcript of Linkages between cookstoves and REDD+ 4While demand- and supply-side interventions are equivalent in...

1
March 2015
Linkages between cookstoves and REDD+ A report for the Global Alliance for Clean Cookstoves
Charlie Parker Paul Keenlyside Hilda Galt Franziska Haupt Theodore Varns

Executive Summary
2
Linkages between cookstoves and REDD+ A report for the Global Alliance for Clean Cookstoves 1 March 2015 Authors: Charlie Parker Paul Keenlyside Hilda Galt Franziska Haupt Theodore Varns 1730 Rhode Island Ave NW Suite 601 Washington DC, 20036 USA

Executive Summary
3
Contents
Executive Summary 4
1. Introduction 6 1.1 Layout of the paper 6 1.2 Methodology 7
2. Woodfuel use in developing countries 8 2.1 Woodfuel consumption by country and region 8 2.2 Emissions from household woodfuel use 13 2.3 Comparison with total GHG emissions 15
3. Linking emissions from woodfuel use and REDD+ 17 3.1 Woodfuel emissions compared to emissions from deforestation 20 3.2 Woodfuel emissions as a proportion of forest carbon stocks 22
4. Mitigation potential from clean technologies 24 4.1 Overview of intervention options 24 4.2 Methodology 26 4.3 Demand-side mitigation potential 27 4.4 Supply-side mitigation potential 30 4.5 Comparing demand- and supply-side potential 34 4.6 Priority countries for woodfuel interventions 35
5. Policy options to align REDD+ and cookstoves 37 5.1 Traditional financing options for cookstoves 37 5.2 Synergies between REDD+ and cookstoves 40 5.3 Recommendations for future development 46
6. Annexes 49

Executive Summary
4
Across large parts of the world, woodfuel remains a primary source of energy, relied on by more than a third of the global population for their cooking and heating needs. Collectively, households in the developing world consume approximately 1.5 billion tonnes of woodfuel annually, leading to emissions of roughly 0.8 GtCO2 per year, equivalent to 2% of global greenhouse gas (GHG) emissions. While this may seem like a small percentage of total emissions, woodfuel emissions are equivalent to around a quarter of gross emissions from deforestation in the tropics. Where harvested unsustainably, woodfuel consumption can lead to localized degradation of forests – and with rising populations and increased urbanization, these localized pressures are likely to increase. To date, however, mitigating forest degradation caused by woodfuel consumption has not been a main feature of schemes designed to reduce emissions from deforestation and forest degradation (REDD+). Using a combination of demand- and supply-side interventions, our research indicates that woodfuel emissions could be reduced by around 450 MtCO2 per year in the best-case scenario. This scenario is in line with the target of the Global Alliance for Clean Cookstoves for 100 million households to adopt efficient cookstoves by 2020. The remaining 350 MtCO2 per year of woodfuel emissions could be balanced by carbon sequestered in new plantation forests. While demand- and supply-side interventions are equivalent in terms of their impact on forest loss and climate change, however, only demand side interventions are suited to achieving positive health outcomes (an important co-benefit in clean cookstove projects). In presenting the results of this study, we acknowledge the uncertainties and gaps in both woodfuel and forest carbon data. First, household consumption data is of variable quality, as developing country governments with limited budgets have little incentive to collect quantified data on the sector. Though the three main sources used for this paper broadly align at the global level, significant differences exist at the country level. Nevertheless, it is possible to conclude that a) most woodfuel is consumed in a small number of countries (including China, India, Indonesia, Brazil and Ethiopia), b) countries with the highest household reliance on woodfuel are generally located in Sub-Saharan Africa, and c) of those households consuming woodfuel, the average amount consumed per household per year varies greatly between countries.
Executive Summary

Executive Summary
5
The second area of uncertainty is the fraction of biomass that is non-renewable (fNRB), or beyond the regenerative capacity of the resource. Though rudimentary country specific values have been established under the Clean Development Mechanism, this paper uses fNRB values recently recalculated by a Yale / National Autonomous University of Mexico (UNAM) study based on spatially explicit data. This data significantly reduces the estimates of fNRB values and therefore provides a more conservative assessment of total woodfuel emissions. A third challenge arises in the relation between non-renewable woodfuel consumption and deforestation and forest degradation. It can be argued that all non-renewable woodfuel consumption can be seen as contributing to forest loss whether it is harvested from what is traditionally understood as ‘forest’ land or ‘non-forest’ land. However, woodfuel harvesting typically contributes to forest degradation, and reliable data on forest degradation is still very scarce. For this paper, we compare non-renewable woodfuel emissions with emissions from deforestation provided by Harris et al. (2012), and above ground biomass in tropical countries provided by Baccini et al. (2012). These comparisons reveal that woodfuel emissions, particularly in East Africa, can often dwarf deforestation emissions, and due to the absence of reporting of woodfuel emissions in national inventories can be 50% or more of nationally reported GHG emissions. The international mechanisms known as REDD+ offers a new source of finance for cleaner cookstoves and improved woodfuel supply. Under existing REDD+ programs a significant amount of effort is already underway to support sustainable woodfuel supply chains: over half of the countries engaged in the Forest Carbon Partnership Facility Readiness Fund have identified cookstoves, sustainable woodlots, or fuel switching technologies as a primary intervention in their national REDD+ strategies; four of the eight pilot countries under the Forest Investment Program specifically integrate reduced woodfuel use in their proposed investment plans; and six of the eleven countries accepted into the FCPF Carbon Fund pipeline refer to improved woodfuel use in their program design documents.
While cookstoves and sustainable woodlots are being considered within national REDD+ programs, the finance being channeled towards these investments is still far below the scale required. We recommend three areas that could be addressed to improve linkages between REDD+ and cookstoves. Firstly, greater alignment and coordination is needed between cookstove and REDD+ agendas. To date the majority of REDD+ programs addressing woodfuel use are not being implemented in high priority countries. Coordination would help both to align cookstove and REDD+ priorities and to improve communication and knowledge sharing between sectors. Secondly, alignment is needed in accounting methodologies between REDD+ and woodfuel consumption; these methodologies have progressed along separate paths, making it difficult to align REDD+ financing with emissions reductions from cookstove projects. And finally, we recommend an analysis of impacts of current cookstove programs on REDD+ and the development of improved monitoring systems for the clean cooking sector.

Introduction
6
The use of woodfuel for cooking and heating is a vital source of energy for an estimated two and a half billion people in developing countries.1 It has also become an increasingly important topic in climate change mitigation, both within the international climate change negotiations on reducing emissions from deforestation and forest degradation (REDD+), and within the Clean Development Mechanism (CDM) and voluntary carbon markets which has seen an increase in clean cooking solutions offered in developing countries.2 While there are clear synergies between the outcomes of clean cookstove technologies and REDD+, to date these mechanisms have developed along different paths; clean cookstoves have largely been viewed as an energy- and health-related mechanism with ‘co-benefits’ in the land-use sector; whereas REDD+ has been seen as a mitigation initiative with activities directly related to forest conservation outcomes. Notwithstanding this, there are clear forest mitigation related benefits arising from the use of clean cookstoves. Similarly, REDD+ is increasingly aiming to deliver health, gender, and social benefits, as well as address the underlying drivers of deforestation and forest degradation. This paper aims to identify and quantify the synergies between these two viewpoints.
1.1 Layout of the paper To achieve this goal, this paper is structured into three sections. Chapter 2 provides an analysis of current emissions from cookstove use. We use globally
1 FAO (2010), Forestry Paper, Criteria And Indicators For Sustainable Woodfuels. Available at http://www.fao.org/docrep/012/i1673e/i1673e00.pdf 2 Clean cookstove projects had a 24% share of the voluntary carbon market in 2013. See Forest Trends (2014), State of the Voluntary Carbon Markets 2014, Executive Summary, XIV, available at http://www.forest-trends.org/documents/files/doc_4501.pdf
1 . Introduction
Clean cookstoves can play a vital role in reducing emissions from deforestation and forest degradation. To date, the dissemination of clean cookstoves has largely progressed separately from policy discussions on REDD+, missing key opportunities to bring about win-wins for both of these communities.

Introduction
7
available datasets and recently published research to examine the role of woodfuel emissions for cooking in global emissions and its relation to deforestation and forest degradation. The analysis will show where these emissions are occurring (i.e. by country and by region) and the activities that contribute to these emissions. Chapter 3 explores the linkages between cookstoves and REDD+. We draw comparisons between our analysis of woodfuel emissions and globally available datasets on deforestation and forest carbon stocks in developing countries. Chapter 4 looks at technical abatement in the cookstove sector and the extent to which forest-based emissions can be avoided by improved woodfuel use. This section is broken down by supply-side and demand-side technologies and their relative contribution to reductions in deforestation and forest degradation. Finally, given the current sources of emissions and technical mitigation options, Chapter 5 explores recommendations and suggestions to align REDD+ policies with the dissemination of clean cookstoves. This section includes case studies from countries that have already developed integration to some degree between these two approaches.
1.2 Methodology Our report uses global data sets and publicly available data on fuelwood and charcoal consumption in households at the national level, forest carbon and deforestation data across the tropics, and national GHG emissions. A full list of sources is available in Annex 1 of this report. The analysis in this report was undertaken using the following information and assumptions: • The focus of this report is on household woodfuel use and for the
purposes of this study we ignore data on institutional woodfuel use e.g. in energy co-generation, municipal infrastructure (e.g. hospitals), or industry;
• We use the term ‘woodfuel’3 throughout this report, which refers to the use of solid woody biomass in cooking, including fuelwood, charcoal, and briquettes (often made from sawdust, woodchips, or carbonized wood).
• Charcoal is a refined form of fuelwood that is traditionally produced in small-scale, informal facilities, and is often produced from nearby forest resources to meet urban demand.4
• Alternative energy scenarios are based on uptake assumptions for alternative cooking methods or fuels. We only assess zero emissions or improved woodfuel burning alternatives, i.e. we do not look at switches to fossil fuel burning cooking alternatives.
• Estimates for emissions, and emissions reductions and removals only include the combustion of above ground biomass to CO2 , other pools (e.g. below ground biomass) and gases (e.g. methane) have not been taken into account in this study.
• This study focuses on woodfuel use in developing countries. While data is not available for all developing countries5, we use this term throughout as we have captured information on the major users across this group.
• We do not assess the impacts of black carbon or other short-lived climate pollutants (SLCPs) in our emissions scenarios.
3 As per the FAO (2014) State of the World’s Forests: Enhancing the Socioeconomic Benefit from Forests 4 IEA/OECD (2006). World Energy Outlook 2006. Chapter 15: Energy for Cooking in Developing Countries. https://www.iea.org/publications/freepublications/publication/cooking.pdf 5 See http://unstats.un.org/unsd/methods/m49/m49regin.htm for a typology of these countries.
We use the term ‘woodfuel’ throughout this report, which includes fuelwood and charcoal

Woodfuel use in developing countries
8
Woodfuel continues to meet a large portion of the world’s energy needs for cooking on a daily basis, and is relied on by more than a third of the world’s population.6 In non-Annex I countries, where the vast majority of woodfuel is consumed, an estimated 1.5 billion tonnes of woodfuel are consumed by households annually. In the 87 non-Annex I countries included in this study, 1.3 billion tonnes are consumed by households annually.7
2.1 Woodfuel consumption by country and region As illustrated by Figure 1, households in India and China consume by far the largest amount of woodfuel in absolute terms, followed by Indonesia, Brazil and Ethiopia. Together, these five countries represent 50% of total woodfuel use in developing countries. Seventy-five % of woodfuel consumption in Non-Annex I countries is consumed by just 16 countries (indicated by the countries in red and orange in Figure 1). Africa contributes to around a third of overall woodfuel use, the Americas 14% and Asia almost a half of global woodfuel use.
6 FAO (2014) State of the World’s Forests 33 7 Bailis, R., Drigo, R., Ghilardi, A., Masera, O. (2015) The carbon footprint of traditional woodfuels, Nature Climate Change Available at http://www.nature.com/nclimate/journal/vaop/ncurrent/full/nclimate2491.html
0 50
100 150 200 250 300
Chi
na
Indi
a In
done
sia
Bra
zil
Eth
iopi
a D
R C
ongo
P
akis
tan
Nig
eria
Ta
nzan
ia
Viet
Nam
S
outh
Afri
ca
Uga
nda
Ken
ya
Mya
nmar
Th
aila
nd
Nep
al
Mex
ico
Sud
an
Ban
glad
esh
Gha
na
Moz
ambi
que
Phi
lippi
nes
Mad
agas
car
Zam
bia
Côt
e d'
Ivoi
re
Zim
babw
e G
uate
mal
a C
hile
C
amer
oon
Gui
nea
Ang
ola
Arg
entin
a
Woo
dfue
l con
sum
ptio
n (m
illio
n to
nnes
)
2 . Woodfuel use in developing countries
Woodfuel use for cooking is responsible for around 0.8Gt CO2 per year, equivalent to 2% of global greenhouse gas (GHG) emissions. Countries with high overall emissions from woodfuel use are China, India, Indonesia, Ethiopia, and Pakistan. On a per capita basis, the countries with the highest emissions are mostly Least Developed Countries.
Figure 1: Total consumption of woodfuel in sample countries (million tonnes). Red = 50% of consumption; Red + Orange = 75% of consumption

Woodfuel use in developing countries
9
9
Box 1 Measuring household woodfuel consumption For the purposes of this study, all data on household woodfuel use are taken from a recent study by Yale/UNAM.8 Woodfuel consumption is taken from international, regional and, when available, national sources of data. The resulting data is compiled in a database of woodfuel production, consumption and trade, which integrates input from the following international databases of forestry and energy statistics: • Food and Agricultural Organization of the United Nations (FAO)
country data on woodfuel production, imports and exports • International Energy Agency (IEA) Renewable Energy statistics • Historical references (ENDA/IEPE, ESMAP, FUNBAR, LBL, OLADE,
FAO/RWEDP, etc.) • UN Energy statistics For each country, data from the international databases are compared to any available national source (e.g. censuses, nationally representative surveys, etc.) to identify the most reliable reference for each country. If large discrepancies exist between global datasets (FAO, UN, IEA) and national sources of data, national sources are favored since they are derived from actual surveys rather than projections or estimates. These data are combined into a best estimate of woodfuel demand.
Woodfuel consumption on a per household basis, however, is a very different picture. Both FAO and the World Health Organization (WHO) collect data on the total number of people in each country using woodfuel for cooking. Country- specific figures are also available for the average number of people per household (collected by the UN, multilateral development banks and other organizations). Dividing the former by the latter provides an estimate for the number of households using woodfuel in each country. This, in turn, can be used to estimate the amount of woodfuel consumed by each household reliant on woodfuel, within each country (see Table 1). >25 tonnes/yr >10 tonnes/yr >5 tonnes/yr >3 tonnes/yr
Malaysia Trinidad and Tobago Bhutan Uruguay Guyana
Brazil Costa Rica Guinea-Bissau Paraguay Dominican Republic Chile South Africa Gabon Argentina
Jamaica Ecuador Suriname Angola Zambia Panama Sudan Guatemala El Salvador Honduras PNG Zimbabwe
Indonesia Lao PDR Guinea Chad DRC Nepal Lesotho Somalia Cameroon Mauritania Equatorial Guinea
8 Bailis, R., Drigo, R., Ghilardi, A., Masera, O. (2015) The carbon footprint of traditional woodfuels, Nature Climate Change 5: 266-272. Available at http://www.nature.com/nclimate/journal/vaop/ncurrent/full/nclimate2491.html
Table 1: Woodfuel consumption per household using woodfuel

Woodfuel use in developing countries
10
10
Africa, and in particular Sub-Saharan Africa has the highest proportion of households using woodfuel as the primary cooking fuel (63%), followed by Asia (38%), and Latin America and the Caribbean (16%).9 Perhaps unsurprisingly, countries with a high percentage (90%+) of households using woodfuel as a main cooking fuel are likely to be Least Developed Countries (LDCs)10, with the exception of Zimbabwe, Kenya, Nigeria, Sri Lanka and a few others (see Figure 2). In contrast, the percentage of households reliant on woodfuel in India (54%) and China (20%) is relatively low.
This paper addresses woodfuel consumption at 2010 levels. However, consumption of fuelwood rose at an average of 1.7% between 2000 and 201011 (charcoal consumption, though far lower in absolute terms, rose at an annual rate of 2.8%,12 driven particularly by urbanization in Africa). In the absence of demand side interventions, these trends look set to continue through to 2020 as populations increase steadily (Figure 3).
9 FAO (2014) State of the World’s Forests: Enhancing the socioeconomic benefit from forests, p. 34. 10 For an up-to-date list of LDCs see http://unfccc.int/cooperation_and_support/ldc/items/3097.php 11 Figures calculated from UNSD data for household fuelwood consumption in developing countries between 2000 and 2010. 12 Id.
Figure 2: Percentage of households reliant on woodfuel as a main cooking fuel (above) and map of Least Developed Countries (LDCs) (below)

Woodfuel use in developing countries
11
11
2.1.1 Demonstrating the non-renewability of biomass Forests and trees naturally regenerate, and not all woodfuel combustion is a source of emissions. In order to determine the quantity of wood that is non-renewable (i.e. harvested at a rate that is beyond the ability of the forest to regenerate), the total quantity of woodfuel consumed is typically multiplied by the ‘fraction of non-renewable biomass’ (fNRB). Where woodfuel use is renewable, an equivalent amount of carbon released on combustion will be sequestered on forest regrowth, and thus only consumption of non-renewable woodfuel leads to an emission. Thus, getting the fNRB value right is essential, as incorrect predictions will lead to an over estimation or underestimation of the emission reductions achieved by reducing woodfuel use. To encourage carbon project development, the UNFCCC has published a list of default fNRB factors, which means these factors do not have to be calculated from scratch. While these default values are those used for Clean Development Mechanism (CDM) projects, they have been criticized for being unrealistically high and average at 87%. For example, Tanzania has an fNRB value of 96%, meaning that 96% of all woodfuel used for cooking is considered to be non-renewable. Concerns with these figures include the over-aggregation of national values given wide variations between areas, and the poor quality of FAO data14 according to which the values are calculated.15 Using unrealistically high fNRB values will overstate emission reductions achieved from reducing woodfuel consumption.
13 Population figures from UN (2013), World Population Prospects, The 2012 Revision, Volume I: Comprehensive Tables. 14 See Lee et al., (2013) Assessing the Climate Impacts of Cookstove Projects: Issues in Emissions Accounting, 1 CIS 53 available at http://www.librelloph.com/challengesinsustainability/issue/downloadPDF/10 15 See Annex 22 of EB 67 for a full explanation of how fNRB values are calculated, available from http://cdm.unfccc.int/DNA/fNRB/index.html
1000
1050
1100
1150
1200
1250
1300
1350
1400
1450
1500
5
5.5
6
6.5
7
7.5
8
2000 2005 2010 2015 2020
Glo
bal h
ouse
hold
fuel
woo
d co
nsum
ptio
n (1
000t
)
Glo
bal p
opul
atio
n (b
illio
n pe
ople
)
Global population (actual) Global population (projected) Fuelwood consumption (actual) Fuelwood consumption (projected)
Figure 3: Fuelwood consumption and global population growth, 2000-2010 (actual), projected to 2020.13
Total non-renewable biomass consumption for cooking is roughly half a billion tonnes of woodfuel annually, equivalent to a third of Ghana’s entire forest biomass
Woodfuel use in developing countries
12
12
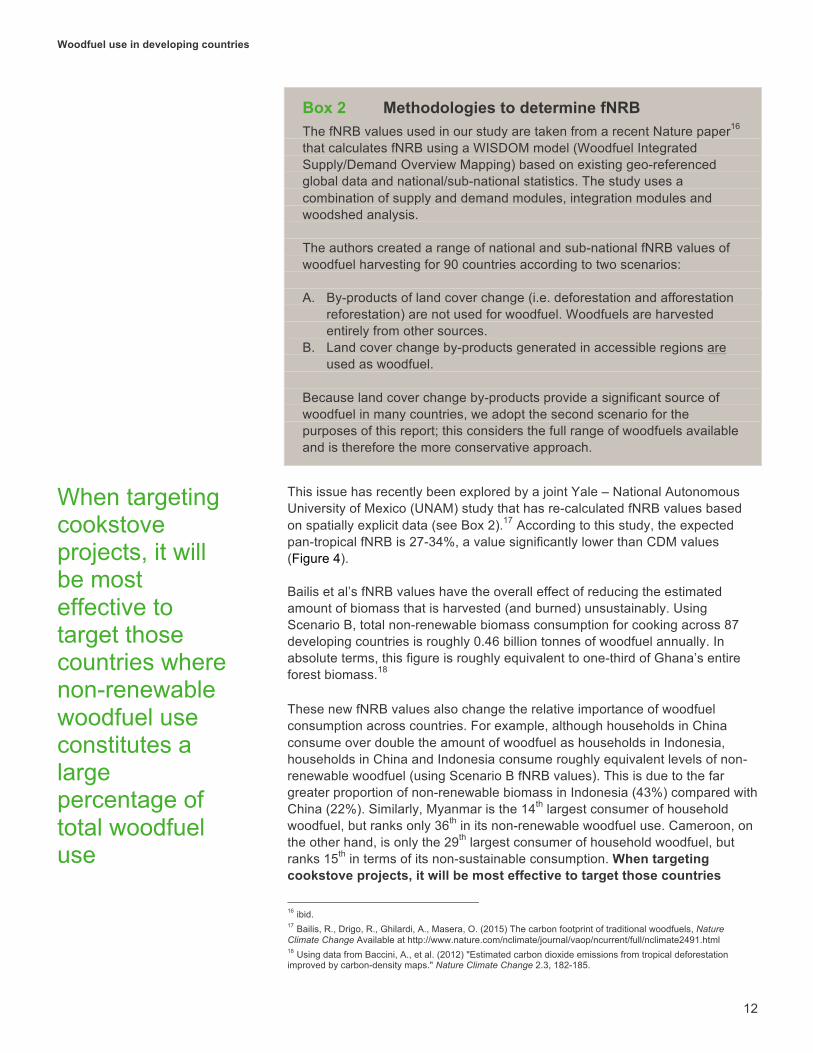
Box 2 Methodologies to determine fNRB The fNRB values used in our study are taken from a recent Nature paper16 that calculates fNRB using a WISDOM model (Woodfuel Integrated Supply/Demand Overview Mapping) based on existing geo-referenced global data and national/sub-national statistics. The study uses a combination of supply and demand modules, integration modules and woodshed analysis. The authors created a range of national and sub-national fNRB values of woodfuel harvesting for 90 countries according to two scenarios: A. By-products of land cover change (i.e. deforestation and afforestation
reforestation) are not used for woodfuel. Woodfuels are harvested entirely from other sources.
B. Land cover change by-products generated in accessible regions are used as woodfuel.
Because land cover change by-products provide a significant source of woodfuel in many countries, we adopt the second scenario for the purposes of this report; this considers the full range of woodfuels available and is therefore the more conservative approach.
This issue has recently been explored by a joint Yale – National Autonomous University of Mexico (UNAM) study that has re-calculated fNRB values based on spatially explicit data (see Box 2).17 According to this study, the expected pan-tropical fNRB is 27-34%, a value significantly lower than CDM values (Figure 4). Bailis et al’s fNRB values have the overall effect of reducing the estimated amount of biomass that is harvested (and burned) unsustainably. Using Scenario B, total non-renewable biomass consumption for cooking across 87 developing countries is roughly 0.46 billion tonnes of woodfuel annually. In absolute terms, this figure is roughly equivalent to one-third of Ghana’s entire forest biomass.18 These new fNRB values also change the relative importance of woodfuel consumption across countries. For example, although households in China consume over double the amount of woodfuel as households in Indonesia, households in China and Indonesia consume roughly equivalent levels of non-renewable woodfuel (using Scenario B fNRB values). This is due to the far greater proportion of non-renewable biomass in Indonesia (43%) compared with China (22%). Similarly, Myanmar is the 14th largest consumer of household woodfuel, but ranks only 36th in its non-renewable woodfuel use. Cameroon, on the other hand, is only the 29th largest consumer of household woodfuel, but ranks 15th in terms of its non-sustainable consumption. When targeting cookstove projects, it will be most effective to target those countries
16 ibid. 17 Bailis, R., Drigo, R., Ghilardi, A., Masera, O. (2015) The carbon footprint of traditional woodfuels, Nature Climate Change Available at http://www.nature.com/nclimate/journal/vaop/ncurrent/full/nclimate2491.html 18 Using data from Baccini, A., et al. (2012) "Estimated carbon dioxide emissions from tropical deforestation improved by carbon-density maps." Nature Climate Change 2.3, 182-185.
When targeting cookstove projects, it will be most effective to target those countries where non-renewable woodfuel use constitutes a large percentage of total woodfuel use

Woodfuel use in developing countries
13
13
where non-renewable woodfuel use constitutes a large percentage of total woodfuel use. As shown in Figure 4, there are still a handful of countries, predominantly in sub-Saharan Africa, that have high levels of unsustainable biomass consumption (above 80%), and many more that have fNRB values above 50%.
2.2 Emissions from household woodfuel use To derive country specific estimates of emissions from household woodfuel use and average emissions per household using woodfuel, we adopt the approach summarized in Figure 5 below. Emissions from woodfuel use are calculated as the CO2 released on the combustion of non-renewable woodfuel.
1. Total household woodfuel use 2. fNRB 3. Woodfuel to CO2
conversion factor
4. Emissions from household woodfuel
use
5. Number of individuals/households
using woodfuel
6. Average emissions per
household/individual using woodfuel
Figure 4: Non-Annex I fNRB values according to CDM default values (top) and Yale/UNAM values
Figure 5: Methodology for calculating emissions from household woodfuel use and average emissions per household.

Woodfuel use in developing countries
14
14
Using this methodology, households in the sample countries emit roughly 800 MtCO2/yr through woodfuel use19, equivalent to 2% of global GHG emissions, and more than the entire aviation sector. China emerges as the largest emitter (12%), followed by India (11%) Indonesia (10%), Ethiopia (8%) and Pakistan (7%). Combined, these countries account for 50% of emissions from household woodfuel use, and just 15 countries account for 75% of all emissions (see Figure 6).
Box 3 Converting woodfuel to CO2 emissions The UN provides data on household fuelwood expressed in a volume consumed in m3. This is converted into weight using a conversion factor of 0.72 tonnes/m3. This assumes a moisture content in the wood of 15%, which is the standard figure for air dried wood.20 Household charcoal consumption is provided by UN data in tonnes. This is converted to an equivalent amount of fuelwood using a conversion factor of 6kg wood/1kg charcoal according to IPCC figures21, and added to fuelwood consumption to get an overall figure for woodfuel consumption in tonnes. IPCC guidelines provide conversion factors of 0.0156TJ/tonne of wood22 and 112 tCO2/TJ23. Multiplying the two together provides a conversion factor of 1.74 tCO2/tonne of wood. Thus multiplying woodfuel consumption by 1.74 provides a figure for CO2 emissions.
19 Using CDM fNRB values the figure is much higher at 1.36 Gt CO2/yr and Yale ‘minimum’ figures for sustainable woodfuel use produce a value of 400 Mt CO2/yr . 20 FAO (1983), Wood Fuel Surveys, Annex III(b), Measuring Fuelwood and Charcoal, available at http://www.fao.org/docrep/q1085e/q1085e0c.htm#TopOfPage 21 See Revised 1996 IPCC Guidelines for National Greenhouse Gas Inventories, 1.46, Table I-14, available at http://www.ipcc-nggip.iges.or.jp/public/gl/guidelin/ch1ref3.pdf 22 2006 IPCC Guidelines for National Greenhouse Gas Inventories, Table 1.2, available at http://www.ipcc-nggip.iges.or.jp/public/2006gl/pdf/2_Volume2/V2_1_Ch1_Introduction.pdf 23 Id. Table 1.4.
0 10 20 30 40 50 60 70 80 90
100
Chi
na
Indi
a In
done
sia
Eth
iopi
a P
akis
tan
Bra
zil
Nig
eria
K
enya
U
gand
a D
RC
N
epal
B
angl
ades
h Ta
nzan
ia
Sud
an
Cam
eroo
n S
outh
Afri
ca
Moz
ambi
que
Gha
na
Viet
Nam
Zi
mba
bwe
Zam
bia
Mad
agas
car
Gua
tem
ala
Som
alia
Emis
sion
s (M
t CO
2 /ye
ar Figure 6: Total emissions from
woodfuel use in non-Annex I countries using mid-fNRB values, chart (Mt CO2/yr). Red = 50% of emissions, red+ orange = 75% of emissions.

Woodfuel use in developing countries
15
15
2.3 Comparison with total GHG emissions Woodfuel emissions can play a significant role in countries’ national GHG emissions. Given the reporting requirements of Non-Annex I countries under the convention, and the complexity of GHG reporting for woodfuel, these emissions are typically not included in countries’ national GHG inventories. Yet, according to our calculations, for many countries in Sub-Saharan Africa, woodfuel emissions are roughly half the size of total reported GHG emissions, and the figure is even higher in Bhutan, Rwanda, Liberia, and Uganda, where woodfuel emissions are equal to or greater than their reported annual GHG emissions (see Table 2). Country NRB emissions from
woodfuel (ktCO2/yr) National GHG Emissions (ktCO2/yr)24
Ratio
BHUTAN 2,719 1,412 193%
RWANDA 4,879 4,631 105%
LIBERIA 1,897 1,888 100%
UGANDA 25,179 27,895 90%
HAITI 5,013 19,599 64%
KENYA 25,833 47,474 54%
ETHIOPIA 65,081 123,049 53%
NEPAL 17,264 37,367 46%
LESOTHO 1,045 2,736 38%
ERITREA 2,150 5,693 38%
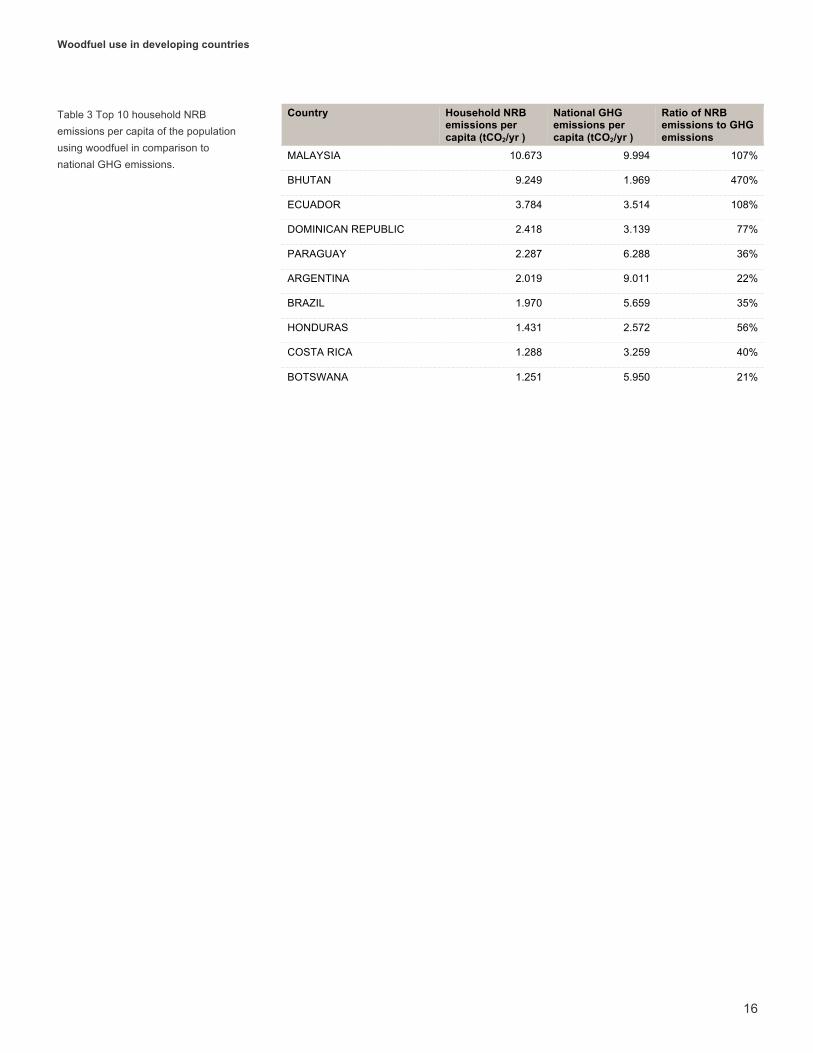
The comparison is even more contrasted when looking at emissions from only the proportion of the population that uses fuelwood for cooking. The per capita emissions of these households were calculated to be equal to or multiples of national per capita emissions (see Table 3). Malaysia, Bhutan, Ecuador and Dominican Republic all have very high per capita consumption of non-renewable biomass, and in some cases the emissions arising from these are higher than reported total per capita GHG emissions; 4.7 times greater in the case of Bhutan – suggesting a relatively high impact from woodfuel users in these countries relative to non woodfuel users. Given expected inaccuracies in some of the data, the larger per-individual figures should be treated with caution. Nevertheless, it is important to note that those individuals and households using woodfuel in many Latin American and Caribbean countries emit relatively large quantities of CO2 from woodfuel consumption. Targeting these woodfuel consumers could potentially provide a significant source of emissions reductions across the country as a whole.
24 CAIT (2010) see http://cait2.wri.org/
Table 2 Top 10 countries emissions from woodfuel in comparison with national GHG emissions.
Woodfuel use in developing countries
16
16
Country Household NRB
emissions per capita (tCO2/yr )
National GHG emissions per capita (tCO2/yr )
Ratio of NRB emissions to GHG emissions
MALAYSIA 10.673 9.994 107%
BHUTAN 9.249 1.969 470%
ECUADOR 3.784 3.514 108%
DOMINICAN REPUBLIC 2.418 3.139 77%
PARAGUAY 2.287 6.288 36%
ARGENTINA 2.019 9.011 22%
BRAZIL 1.970 5.659 35%
HONDURAS 1.431 2.572 56%
COSTA RICA 1.288 3.259 40%
BOTSWANA 1.251 5.950 21%
Table 3 Top 10 household NRB emissions per capita of the population using woodfuel in comparison to national GHG emissions.

Linking emissions from woodfuel use and REDD+
17
17
In the 1970s it was widely feared that a growing gap between woodfuel consumption and the rate of supply from forest land would lead to an energy shortfall and mass deforestation in developing countries within a few decades (the “fuelwood gap” theory).25 This theory proved unfounded due to a number of factors including higher regenerative capacity of forest land than initially thought, the harvesting of woodfuel by communities from non-forest areas, the availability of other fuels, and the fact that woodfuel demand decreases with scarcity.26 Over the last forty years, however, the global population has doubled, and Africa’s population has increased four-fold.27 At the same time, forest cover has been depleted in many developing countries and woodfuel consumption is now 1.3 billion tonnes per year compared with just 242 million tonnes per year in 1978.28 This changing dynamic of supply and demand for woodfuel use warrants a revisit to the issue of woodfuel use and deforestation in developing countries and the causal relationship between biomass consumption and forest loss. Furthermore, a comparison in terms of scale and geography is helpful to understand to what extent emissions from woodfuel use compare with emissions from deforestation, and in which countries the problem is most acute. 25 See Erik P. Eckholm (1975), The Other Energy Crisis: Firewood, Worldwatch Institute. 26 See John C. Woodwell (2002), Fuelwood and Land Use in West Africa: Understanding the Past to Prepare for the Future, International Resources Group, available at http://allafrica.com/download/resource/main/main/idatcs/00010332:a739c5b513e4898f7cf7b8657682b11c.pdf 27 Figures calculated from UN (2013), World Population Prospects, The 2012 Revision, Volume I: Comprehensive Tables. 28 de Montalembert, M.R. and Clement, J. (1983) Fuelwood supplies in the developing countries Chapter 3. Available at http://www.fao.org/docrep/X5329E/x5329e04.htm#3.1
3 . Linking emissions from woodfuel use and REDD+
Annual GHG emissions from woodfuel consumption are equivalent to roughly a quarter of gross GHG emissions from deforestation in the tropics. In some countries – due to a combination of poor reporting standards, definitional differences, and high woodfuel consumption – GHG emissions from woodfuel use are up to nine times greater than reported GHG emissions from deforestation.

Linking emissions from woodfuel use and REDD+
18
18
While there has been considerable research within the international community on the contribution of deforestation and forest degradation to global GHG emissions29 and the role of woodfuel use in causing forest loss30, very little empirical data exists on GHG emissions from woodfuel use for cookstoves and their corresponding contribution to forest loss. This section draws on existing data sets and recognized methodologies to estimate the contribution of woodfuel use for household cooking to global rates of deforestation and forest degradation. This analysis raises many challenges, not least the nature and scope of accounting and reporting between these two activities (see Box 4). An overview of the methodologies and calculations used to derive our estimates can be found in Annex 2.
Box 4 Measuring deforestation, degradation, and changes in forest carbon stocks.
Taken together, forest loss in Brazil and Indonesia in 2010 accounted for 36% to 49% of all deforestation in non-Annex I countries, according to figures reported by Hansen et al. (2014)31 and FAO32 respectively. Deforestation is generally concentrated in the Amazon, Congo Basin and tropical forests of Southeast Asia, with Bolivia, the Democratic Republic of Congo and Myanmar also reporting high rates. Accessing reliable data on deforestation can be challenging due to significant discrepancies and different methods of data collection between existing sources. For example, FAO, which relies on self-reported data by countries every five years, finds deforestation in Nigeria to be over ten times larger than that reported by Hansen et al. (2014), who use remote sensing data. According to FAO, China is currently afforesting, while Hansen et al. place China fourth highest for deforestation among non-Annex I countries. Overall, Hansen deforestation figures for non-Annex I countries in 2010 were double FAO figures. Given that this paper compares woodfuel emissions with GHG emissions from deforestation and forest degradation, the two key studies are Harris et al. (2012) for global forest emissions data, and Baccini et al. (2012) for global estimates of forest carbon stocks. These studies use data from satellite observations and have the advantage that any errors and inconsistencies that emerge are applied consistently across countries. However, while satellite data is good at tracking deforestation rates and consequent emissions, it is less able to measure emissions from forest degradation.
29 See e.g. Harris, Nancy L., et al. (2012) "Baseline map of carbon emissions from deforestation in tropical regions."; Houghton, R. (2012). Carbon emissions and the drivers of deforestation and forest degradation in the tropics; van der Werf, et al. (2009). CO2 Emissions from Forest Loss. 30 See e.g. Ahrends A, Burgess ND, Milledge SAH, Bulling MT, Fisher B, Smart JCR, et al. Predictable waves of sequential forest degradation and biodiversity loss spreading from an African city; Arnold M, Persson R. Reassessing the fuelwood situation in developing countries; Skutsch, M. Ghilardi, A (2008) Energy Access in REDD+: Prospects for socially responsible woodfuel interventions. UNAM, Morelia, Mexico. 31 Hansen, M. C., P. V. Potapov, R. Moore, M. Hancher, S. A. Turubanova, A. Tyukavina, D. Thau, S. V. Stehman, S. J. Goetz, T. R. Loveland, A. Kommareddy, A. Egorov, L. Chini, C. O. Justice, and J. R. G. Townshend. 2013. “Hansen/UMD/Google/USGS/NASA Tree Cover Loss and Gain Area.” University of Maryland, Google, USGS, and NASA. Accessed through Global Forest Watch on 1st June 2014. www.globalforestwatch.org. 32 FAO (2010) Forest Resource Assessment

Linking emissions from woodfuel use and REDD+
19
19
Complicating this issue are several important factors. Firstly, woodfuel can be harvested from both forest and non-forest land33; yet, many existing deforestation studies tend only to focus on biomass loss occurring on forestland. While it is arguable that only emissions from woodfuel harvested from forestland should be included within REDD+ accounting, non-renewable woodfuel harvesting leads to CO2 emissions whether woodfuel is taken from forest land or other sites such as farmland, scrubland or wasteland. The second issue is that woodfuel collection is often a process of degradation rather than deforestation; existing global studies that use satellite monitoring have thus far not been able to capture emissions from degradation. As such the emissions from woodfuel use are - to a large degree - not captured within existing datasets on forest loss.
Box 5 Case Study: Ethiopia’s forest emissions One of the major challenges in Ethiopia has been consistency in the definition of what constitutes a ‘forest’ and the wide variability in reported forest cover and forest cover change by different reporting entities. Two major reporting entities exist: the World Bank funded Woody Biomass Inventory Strategic Program Project (WBISPP) and FAO’s Forest Resource Assessment (FRA). According to WBISPP, woody vegetation - including montane forest - covers over 50% (more than 60 million ha) of Ethiopia’s land area.34 Ethiopia’s 2010 country report to FRA, on the other hand, indicated just 13 million hectares35 of forest cover equivalent to 10% of total land area. The use of different definitions of forest, as well as tools and methods to extrapolate land use change have contributed to widely variable reported annual rates of deforestation. Similarly, FAO report the annual deforestation rate in Ethiopia between 1990-2010 as 0.96 %, while WIBSPP estimates a rate closer to 2 %. This difference may be offset in part because the WIBSPP data doesn't capture information on the annual rate of new plantations36. A further study by the World Resources Institute (WRI) indicates the challenges in detecting major drivers of forest cover change in Ethiopia, particularly from woodfuel consumption, due to the absence of high spatial resolution satellite or aerial imagery and quality field data. Consequently, Ethiopia is not reporting forest degradation from woodfuel consumption to either the UNFCCC or FAO37.
33 Using FAO definitions a forest is classified as land with tree crown cover (or equivalent stocking level) of more than 10 % and area of more than 0.5 hectares (ha). The trees should be able to reach a minimum height of 5 meters (m) at maturity in situ. 34 WBISPP (2005) A national strategy plan for the biomass sector. Addis Ababa, Ethiopia. 35 FAO (2010) Global Forest Resources Assessment 2010 ‐ Country Report Ethiopia. Food and Agriculture Organization (FAO), Rome, Italy 36 Yitebitu Moges, Zewdu Eshetu and Sisay Nune. 2010. Ethiopian Forest Resources:Current Status and Future Management Options in view of Access to Carbon Market. Literature review prepared for Ethiopian Climate Research and Networking and UNDP. Addis Ababa. Ethiopia 37 WRI. 2012. MAPT Country Capacities Assessment: Technical Capacity Forest Carbon Monitoring in Ethiopia.
Draft report

Linking emissions from woodfuel use and REDD+
20
20
A further complicating factor is that in some instances woodfuel is simply a by-product of forest clearance for agriculture. In Kenya, for example, a large proportion of the charcoal is produced as a by-product of other land changes, and thus demand for charcoal cannot be classified as the key driver of deforestation.38 Determining how emissions should be accounted for under these land use scenarios is a complicated question of attribution and causality that as yet have not been clearly answered. Box 5 illustrates some of these challenges in the context of Ethiopia. Nevertheless, there is a strong argument that woodfuel harvesting, where it leads to biomass loss from forest or non-forest land (excluding plantations for woodfuel production), should be accounted for as an emissions source in the same manner as emissions from deforestation and degradation. REDD+ accounting systems in countries with high woodfuel use should consider forest definitions, and forest-degrading activities that go beyond traditional national forest inventories if they are to capture the majority of emissions from biomass conversion. IPCC guidelines state that to avoid double-counting, emissions from biomass use should be measured as part of the agriculture, forestry and other land use (AFOLU) sector, and that for the purposes of the energy sector, biomass should be treated as renewable.39 Thus emissions from woodfuel uses are not recorded on wood combustion, but on wood removal. Therefore, in order to design schemes to mitigate these emissions, it is vital that the impact of woodfuel harvest be related to deforestation, forest degradation and land use emissions generally.
3.1 Woodfuel emissions compared to emissions from deforestation
To draw a comparison between woodfuel emissions and emissions from deforestation, we calculate the ratio of woodfuel consumption to gross deforestation emissions (see Figure 7).
For the purposes of this report, emissions from deforestation have been taken from a 2012 study by Harris et al. using remote sensing of gross forest loss, taking into account maps of above ground biomass based on satellite observations calibrated with ground studies.40 This study finds that deforestation in the tropics between 2000 and 2005 released approximately 3.0 GtCO2 per year. As a crude estimate, therefore, emissions from woodfuel use in 38 See e.g. Davies, Jonathan (2007), Total Economic Value of Kenyan Pastoralism, available at http://cmsdata.iucn.org/downloads/kenya_tev.pdf and Mugo, F. and Gathui, T. (2010) Biomass energy use in Kenya. A background paper prepared for the International Institute for Environment and Development (IIED), available at http://pubs.iied.org/pdfs/G02985.pdf 39 IPCC, Guidelines for National Greenhouse Gas Inventories, Volume 2, Chapter 2, 2.3.3.4, available at http://www.ipcc-nggip.iges.or.jp/public/2006gl/pdf/2_Volume2/V2_2_Ch2_Stationary_Combustion.pdf 40 Harris, Nancy L., et al (2012) Baseline map of carbon emissions from deforestation in tropical regions. Science 336.6088: 1573-1576.
1. Non-renewable household woodfuel
emissions
2. National gross deforestation
emissions
3. Proportion of woodfuel to
deforestation emissions expressed
as a percentage
Many countries need to consider forest definitions, and forest-degrading activities that go beyond traditional national inventories
Figure 7: Methodology for calculating the proportion of woodfuel emissions to gross deforestation emissions using data from Harris et al.

Linking emissions from woodfuel use and REDD+
21
21
absolute terms are equivalent to roughly a quarter of emissions from deforestation in the tropics. It is worth noting, however, that we are not suggesting in this paper that these emissions are a subset (i.e. a percentage of) reported deforestation emissions; more likely - given that woodfuel collection is a process of both deforestation and forest degradation, and can occur on non forest lands - these emissions are partly accounted for under the deforestation rates reported by Harris et al. and are in part additional to these emissions. While globally the proportion of woodfuel to deforestation emissions is already significant, at a country level the ratio can be far higher. As illustrated by Figure 8, woodfuel emissions in some countries are up to nine times greater than reported emissions from deforestation.
With the exception of a few countries in Asia (Bangladesh, India, Nepal) and Latin America (Guatemala, Honduras, Dominican Republic), woodfuel’s impact on deforestation is predominantly an issue in sub-Saharan Africa. Lesotho, Rwanda, Somalia and Ethiopia have particularly high emissions from woodfuel relative to deforestation and in most East African countries, woodfuel emissions are at least the same and often greater than reported emissions from deforestation (see Table 4). In contrast, woodfuel emissions are dwarfed by deforestation emissions in most countries in Latin America. Country NRB emissions from
woodfuel (ktCO2/yr) National emissions from deforestation (ktCO2/yr)
Ratio
Lesotho 1,045 114 919%
Bangladesh 16,068 2,986 538%
Rwanda 4,879 1,072 455%
Somalia 6,427 1,537 418%
Haiti 5,013 1,353 371%
Ethiopia 65,081 19,707 330%
Burundi 3,296 1,044 316%
Kenya 25,833 11,841 218%
Nepal 17,264 11,274 153%
India 82,976 58,014 143%
Figure 8: Size of household woodfuel emissions relative to emissions from deforestation/degradation according to Harris et al. (2012) Figures for China are not included in the Harris study
Table 4: Countries with highest emissions from woodfuel use in comparison to emissions from deforestation according to Harris et al. (2012)
Linking emissions from woodfuel use and REDD+
22
22
3.2 Woodfuel emissions as a proportion of forest carbon stocks
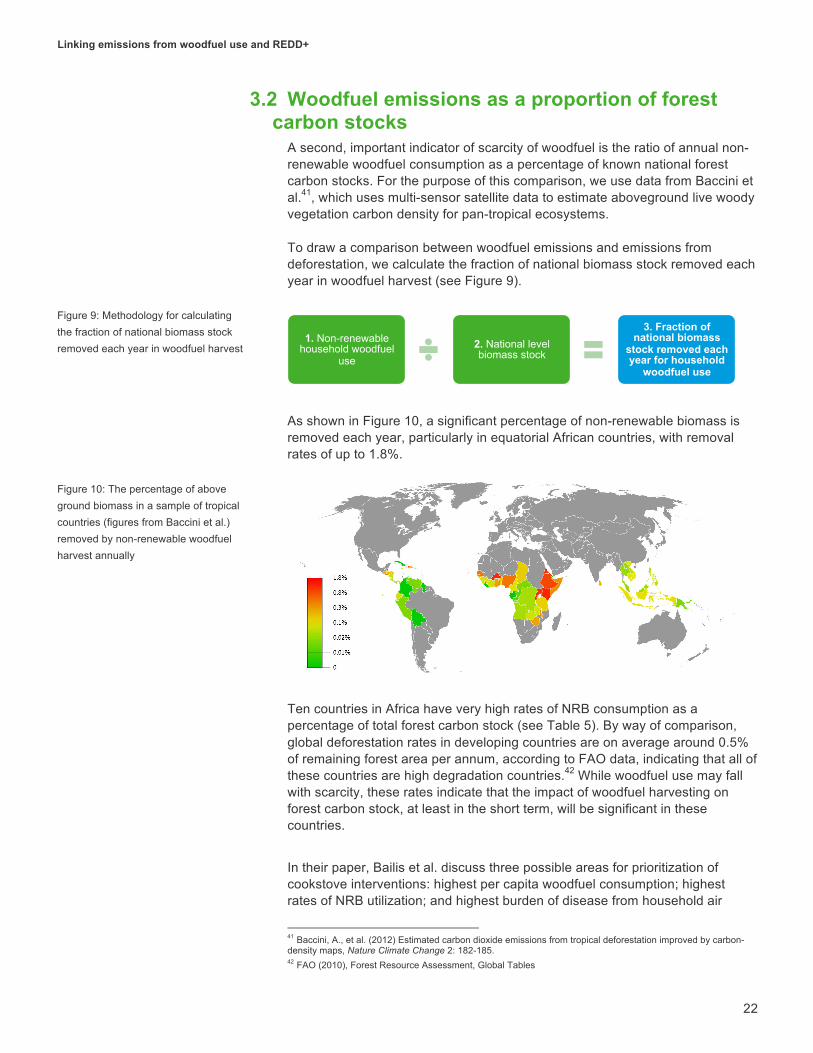
A second, important indicator of scarcity of woodfuel is the ratio of annual non-renewable woodfuel consumption as a percentage of known national forest carbon stocks. For the purpose of this comparison, we use data from Baccini et al.41, which uses multi-sensor satellite data to estimate aboveground live woody vegetation carbon density for pan-tropical ecosystems. To draw a comparison between woodfuel emissions and emissions from deforestation, we calculate the fraction of national biomass stock removed each year in woodfuel harvest (see Figure 9).
As shown in Figure 10, a significant percentage of non-renewable biomass is removed each year, particularly in equatorial African countries, with removal rates of up to 1.8%.
Ten countries in Africa have very high rates of NRB consumption as a percentage of total forest carbon stock (see Table 5). By way of comparison, global deforestation rates in developing countries are on average around 0.5% of remaining forest area per annum, according to FAO data, indicating that all of these countries are high degradation countries.42 While woodfuel use may fall with scarcity, these rates indicate that the impact of woodfuel harvesting on forest carbon stock, at least in the short term, will be significant in these countries.
In their paper, Bailis et al. discuss three possible areas for prioritization of cookstove interventions: highest per capita woodfuel consumption; highest rates of NRB utilization; and highest burden of disease from household air
41 Baccini, A., et al. (2012) Estimated carbon dioxide emissions from tropical deforestation improved by carbon-density maps, Nature Climate Change 2: 182-185. 42 FAO (2010), Forest Resource Assessment, Global Tables
1. Non-renewable household woodfuel
use 2. National level biomass stock
3. Fraction of national biomass
stock removed each year for household
woodfuel use
Figure 9: Methodology for calculating the fraction of national biomass stock removed each year in woodfuel harvest
Figure 10: The percentage of above ground biomass in a sample of tropical countries (figures from Baccini et al.) removed by non-renewable woodfuel harvest annually

Linking emissions from woodfuel use and REDD+
23
23
pollution (HAP) exposure. We suggest here that a fourth area - the ratio of non-renewable woodfuel use to remaining forest carbon stocks - is also important, as it indicates the most impact in terms of deforestation and forest degradation and also poses the largest risks from a woodfuel supply perspective. Countries with a high ratio of household NRB emissions relative to remaining forest carbon stocks - such as Rwanda, Kenya, and Burkina Faso - are at higher risk of depletion of woodfuel supplies, and therefore need to make preparations to avoid a potential future energy shortfall. These countries would also have a high potential for improved cookstove interventions to reduce a primary driver of deforestation and forest degradation.
Country HH NRB Emissions (ktCO2/year)
Forest carbon stocks (ktCO2)
Ratio NRB/forest carbon stocks
Rwanda 4,879 20,455 1.77%
Kenya 25,833 148,909 1.29%
Burkina Faso 6,402 38,182 1.25%
Eritrea 2,150 13,364 1.20%
Haiti 5,013 31,636 1.18%
Burundi 3,296 21,000 1.17%
Uganda 25,179 166,909 1.12%
Ethiopia 65,081 519,000 0.93%
Nigeria 34,100 446,182 0.57%
Senegal 3,551 48,000 0.55%
Table 5: Top 10 countries houshold non-renewable biomass emissions as a percentage of remaining above ground biomass (figures from Baccini et al.)

Mitigation potential from clean technologies
24
24
The previous chapters have shown that woodfuel use for cooking leads to considerable CO2 emissions with impacts on rates of deforestation and forest degradation in non-Annex I countries. This chapter serves to address this issue by outlining possible mitigation options and illustrating the impact that woodfuel mitigation could have on reducing rates of deforestation and forest degradation. This, in turn, builds the case for accessing REDD+ finance to support these interventions, which we discuss in more detail in Section 5.
4.1 Overview of intervention options To address the impact that woodfuel use has on deforestation and forest degradation, woodfuel mitigation interventions can be divided into two broad categories:
• Demand-side options: Woodfuel consumption can be reduced by addressing the demand for non-renewable biomass for cooking. This includes burning biomass more efficiently (i.e. fuel-efficiency options) or replacing the use of biomass with different fuels, such as biogas, solar cookstoves or briquettes made from waste/produced renewably (i.e. energy switching). Demand side options target the unsustainable consumption of woodfuel.
• Supply-side options: Supply side options target the unsustainable production of woodfuel and ensure that biomass production does not lead to deforestation or forest degradation. This includes afforestation and reforestation of degraded lands for woodfuel production, as well as improved and sustainable management of woodfuel lots. Supply side mitigation can also be addressed by improving production techniques for charcoal.
4.1.1 Demand-side options Demand-side mitigation options in the woodfuel sector can further be divided
4 . Mitigation potential from clean technologies
A range of mitigation options including fuel efficiency, energy switching and improved supply can reduce emissions from woodfuel use. In total these approaches could reduce emissions by 238 - 948 Mt CO2/yr (30 - 119%) depending on the adoption rates of these solutions.
Mitigation potential from clean technologies
25
into two different categories of intervention. Fuel-efficient stoves burn woodfuel more efficiently than existing cooking options, thus reducing the demand for woodfuel. This includes, for example, rocket stoves and improved charcoal stoves. These stoves typically constitute an insulated inner layer made from bricks or clay that reduces heat loss and transfers heat directly to the cooking pot, which sits on top of the stove. A metal outer layer provides grips for mobility, robustness and a frame on which the cooking pot can sit. Fuel is either fed into the bottom of the stove (in a rocket stove) or at the top only at the start of cooking, similar to the use of BBQ (for charcoal stoves). Energy-switching options provide households the opportunity to completely replace the use of woodfuel or charcoal for cooking with an alternative fuel. The most common options that are included in this study are biogas digesters, solar cookstoves and briquettes made from wastes. We have also included switching from charcoal to fuelwood as a mitigation option under this group, as it can lead to a reduction in biomass use per unit energy production.43 Other mitigation options not included in this study are energy switching to liquefied petroleum gas (LPG), or other fossil fuels. These have not been quantified due to the complexities in calculating emissions reductions when biomass burning is replaced by fossil fuel consumption. A further option, beyond the scope of this paper, is fuel switching from woodfuel-based technologies to more advanced cooking technologies requiring electrification and/or larger scale gas networks. More advanced technologies would deliver significant gains in terms of health and convenience, and would have a lower risk of “stove stacking”, the phenomena whereby households continue to use old cookstoves alongside new technologies. Assuming that the electricity is not generated from renewable sources, however, would lead to CO2 emissions that could be equal to or even greater than those associated with woodfuel. Further research would be needed to understand the proportion of GHG emissions that would simply be displaced by moving from e.g. wood to coal based cooking options.
4.1.2 Supply-side options Options for sustainable supply include a variety of approaches. Afforesting or reforesting degraded lands provides a means of supplying more sustainable woodfuel. Woodfuel plantations are usually managed for multiple outputs including woodfuel, timber and other non-timber forest products, e.g. small-scale agroforestry on farms or at the household level, communal plantations and large-scale commercial plantations. Improved and sustainable forest management such as through enrichment plantings and sustainable harvesting is another option to address unsustainable woodfuel production. The use of forest residues is often used to increase the sustainability of woodfuel supply. Finally, other efficiency improvements in the production and processing of wood for energy, e.g. green charcoal production, pelletization, and briquetting are a way to reduce the impact of woodfuel use. For the purposes of this study we have focused our analysis on the assessment of mitigation potential through afforestation and reforestation approaches, specifically through the creation of dedicated woodfuel lots. Estimates for improved forest management and other
43 See e.g. Nahayo, A. Ekise, I., and Mukarugwiza, A. (2013) Comparative Study on Charcoal Yield Produced by Traditional and Improved Kilns: A Case Study of Nyaruguru and Nyamagabe Districts in Southern Province of Rwanda. Energy and Environment Research; Vol. 3, No. 1; 2013
Switching from charcoal to fuelwood can lead to a reduction in biomass use per unit energy production

Mitigation potential from clean technologies
26
26
efficiency improvements were not available in the scientific literature and would require considerable new research.
4.2 Methodology
4.2.1 Demand side methodology In order to illustrate the potential impact of demand-side interventions on the total quantity of biomass used for cooking, three scenarios are developed (see Table 6 below). Demand-side options High adoption Mid adoption Low adoption
Population with efficient cookstoves 10 % 4% 2%
Population with biogas 5% 2% 1%
Population with solar cookstoves 5% 2% 1%
Population using briquettes 5% 2% 1%
Total 25% 10% 5%
Number of cooking devices distributed 137.5 million 55 million 27.5 million
The scenarios are intended to be illustrative only and do not reflect the implementation potential for these improved technologies in each host country; they do, however, take into account general adoption trends. For example, adoption rates of solar cookstoves and briquette-fired stoves are assumed to be lower than adoption of fuel-efficient cookstoves due to the need to considerably change cooking habits and the time required for preparation of food. Similarly, switching to biomass briquettes is typically constrained by the supply of briquettes. The Global Alliance for Clean Cookstoves’ target of 100 million households adopting clean and efficient cooking solutions by 2020 falls between high adoption and mid adoption scenarios. Charcoal-switching options High adoption Mid adoption Low adoption
Percentage of charcoal use displaced 50 % 20 % 10 %
Scenarios for displacing charcoal assume that 50%, 20% and 10% of charcoal use is displaced through targeting replacement cookstoves for charcoal users (see Table 7). These mitigation options exploit the assumption that 6 tonnes of dry biomass are required to produce 1 tonne of charcoal, and that in many cases charcoal users gain the same calorific output as woodfuel users.44 In sub-Saharan Africa, figures for conversion rates from wood to charcoal can be even higher due to inefficient production processes.
4.2.2 Supply side methodology Scenarios for afforestation and reforestation (A/R) are based on a study by Zomer et al. on estimates of total available hectares for reforestation and afforestation provided.45 These figures define available land as that with less than 10%-30% crown cover, discounting unsuitable land such as urban land, 44 ibid. 45 Zomer, Robert J., et al (2008) Climate change mitigation: A spatial analysis of global land suitability for clean development mechanism afforestation and reforestation. Agriculture, ecosystems & environment 126.1: 67-80.
Table 6: Adoption scenarios for demand-side technologies
Table 7: Adoption scenarios for displacing charcoal

Mitigation potential from clean technologies
27
land used for intensive agricultural, land at high elevations and so on. Based on these figures, total land availability in non-Annex I countries for A/R is approximately 530 million hectares, with the largest extents in Brazil, India and China (see Table 8). Of the Sub-Saharan African countries, Nigeria, Ethiopia, DRC and Madagascar have the greatest A/R potential. >100 million ha 25-100 million ha 10-25 million ha 5-10 million
Brazil
China India Argentina
Madagascar Nigeria Uruguay Colombia DRC Ethiopia
Indonesia Venezuela Angola Tanzania
For the purposes of our calculation we use the mid-range of 20% crown-cover to define available land and assume that 25%, 10% or 5% of this land would be afforested or reforested over a 15-year period. Under these scenarios, a total of 133 million, 53 million and 27 million hectares would be planted respectively (see Table 9). Supply-side options High adoption Mid adoption Low adoption
Percentage of available land used for dedicated woodfuel lots
25 % 10 % 5 %
Total land planted (million ha) 133 53 27
4.3 Demand-side mitigation potential The methodology and sources used to arrive at figures for fuel efficiency and energy switching are summarized in more detail under each chapter sub-heading. In general we follow the methodology outlined in Figure 11 to calculate demand-side mitigation potential for woodfuel.
Our calculations for mitigation from demand-side technologies assumes that efficient cookstoves operate at 30% thermal efficiency rate, compared to a 10%
1. Total household woodfuel use
2. Total number of households using
woodfuel 3. Woodfuel use per household per year
4. Fuel savings per technology
5. Percentage of households adopting
new technology 6. fNRB and other conversion factors
7. Average emissions per
household/individual using
woodfuel
Table 8: Land available for afforestation and reforestation in non-Annex I countries (million hectares)
Table 9: Adoption scenarios for afforestation/ reforestation
Figure 11: Methodology for calculating emission reductions from demand-side options

Mitigation potential from clean technologies
28
28
baseline efficiency rate for existing cookstoves.46 Biogas, solar and briquette technologies do not use woodfuel at all. Assuming deployment of improved cooking technologies according to the three scenarios outlined in Table 6, and that households will completely switch to using replacement cooking devices, the total amount of woodfuel saved in one year is relatively simple to calculate as a proportion of total woodfuel currently consumed in a year (see Box 6).
Box 6 Demand side mitigation methodology This report follows CDM methodology AMS-II.G (Energy Efficiency Measures in Thermal Applications of Non-Renewable Biomass) to calculate emission reductions from efficient cookstoves, and CDM methodology AMS-I.E (Switch From Non-Renewable Biomass For Thermal Applications By The User) to calculate emission reductions from biogas digesters, solar cookstove and briquette cookstoves. For efficient cookstoves, a usage rate of 82% is assumed to account for continued use of the baseline stove. This is multiplied by fNRB to determine the percentage of woodfuel saved that is non-renewable, and this figure converted into an emission using a wood to CO2 conversion factor of 1.75.47 Finally, a leakage value of 5% is assumed on the premise that a proportion of the woodfuel saved by one household using a replacement cookstove (reducing demand and possibly the cost of woodfuel) may be consumed by another household using baseline stove technology. For biogas digesters, solar cookstoves and briquettes, the approach is similar, except that usage rate of the replacement cookstove is assumed to be 100% (following AMS-I.E guidelines).
According to our analysis, global annual mitigation potential from demand-side interventions, including efficient cookstoves, biogas, solar cookstoves, briquettes and displacing charcoal amounts to 43-214 MtCO2, or 5-26% of global woodfuel emissions from cooking.48 Roughly 20% of these emissions reductions can be achieved by targeting charcoal users in the dissemination of improved cooking technologies. Demand-side interventions High adoption
(MtCO2/yr) Mid adoption
(MtCO2/yr) Low adoption
(MtCO2/yr)
Efficient cookstoves, biogas, solar cookstoves, briquettes
174 70 35
Displacing charcoal 40 16 8
Total 214 87 43
46 10% level is default value taken from AMS-II.G. The 30% thermal efficiency rate is estimated from Global Alliance figures available at http://catalog.cleancookstoves.org/#/stoves 47 2006 IPCC Guidelines for National Greenhouse Gas Inventories, Table 1.2, available at http://www.ipcc-nggip.iges.or.jp/public/2006gl/pdf/2_Volume2/V2_1_Ch1_Introduction.pdf 48 The lower range corresponds to a low adoption scenario (5%) and the upper range to a high adoption scenario (25%).
Global annual mitigation potential from demand-side interventions is 43-214 MtCO2 or 5-26% of global woodfuel emissions from cooking
Table 10: Demand-side mitigation potential under three adoption scenarios

Mitigation potential from clean technologies
29
Under all three adoption scenarios, 40% of replacement cooking devices will be efficient cookstoves, with the remaining 60% split equally between biogas digesters, solar cookstoves and briquette fired stoves. Efficient cookstoves, while more popular with target populations, have a lower emission reduction factor per unit than the alternatives, which do not use woodfuel at all, and thus efficient cookstoves account for only 27% of total emission reductions. The relationship between cookstove adoption and emission reductions is illustrated in Figure 12.
Geographically, China, India, Indonesia, Ethiopia and Pakistan represent just under half of potential emission reductions. As shown in Figure 13, of the 20 countries where the largest emission reductions are possible, eleven are located in sub-Saharan Africa. The greatest emission reductions from charcoal displacement are in those sub-Saharan countries where charcoal use is highest. In Ethiopia, the ratio in absolute terms of fuelwood to charcoal consumption is 15:1, in Sudan 4:1. This contrasts with a ratio of 400:1 in Indonesia, and charcoal consumption in India and China is even lower still.
In order to achieve the most efficient dissemination of improved cookstove technologies, cookstoves should be targeted at countries or regions with the highest emissions per household using woodfuel.49 Emission reductions per replacement cooking device range from over 10 tonnes of CO2 per year in
49 These figures are calculated by combining national woodfuel consumption, national fNRB values, household size and the percentage of the population using woodfuel
40%
27%
20%
24%
20%
24%
20%
24%
% cookstoves adopted
% emissions reductions
Efficient cookstoves Biogas digesters Solar cookers Briquette cookers
0
5
10
15
20
25
30
Chi
na
Indi
a
Indo
nesi
a
Eth
iopi
a
Pak
ista
n
Bra
zil
Nig
eria
Ken
ya
Uga
nda
DR
C
Nep
al
Ban
glad
es
Tanz
ania
Sud
an
Cam
eroo
n
Sou
th
Moz
ambi
q
Mex
ico
Gha
na
Viet
Nam
MtC
O2/y
ear
Charcoal displacement
Replacement cookstoves
Figure 12: Cookstove adoption scenario (top); and emission reductions per cookstove type according to this scenario (bottom)
Figure 13: Emission reductions by country from replacement cookstoves and charcoal displacement according to high adoption scenario (MtCO2/yr )

Mitigation potential from clean technologies
30
30
Malaysia and Bhutan to under half a tonne in China, with an average of 1.3 tCO2/yr across non-Annex I countries (see Table 11). Countries with a high emission reduction potential per cooking device, however, may present limited opportunities for total emission reductions in absolute terms if only a few households use woodfuel for cooking. In Malaysia for example, only 62,000 households use woodfuel for cooking, compared with over 20 million households in neighboring Indonesia. Notwithstanding this, targeted distribution of improved cookstoves in countries such as Malaysia and Ecuador may be the fastest and most efficient way to achieve emission reductions from woodfuel use.
>10 tonnes/yr >5 tonnes/yr >4 tonnes/yr >3 tonnes/yr
Malaysia Bhutan Trinidad and Tobago Ecuador
Paraguay Dominican Republic Guinea-Bissau Brazil Equatorial Guinea Honduras
Costa Rica Panama Chile Cameroon South Africa Argentina
Mauritania Sudan Angola Eritrea Botswana Nepal Zambia Lesotho Ethiopia El Salvador Somalia
4.4 Supply-side mitigation potential The methodology used to arrive at estimates for mitigation potential from the sustainable supply of woodfuel is summarized in Figure 14.
The methodology used to arrive at figures for standing stock is summarized in
1. Total hectares available for afforestation/
reforestation (A/R)
2. High, mid and low A/R scenarios
3. Mean annual increment over AR
period (harvesting 10% of biomass from year 4)
4. Total woodfuel production over AR period (capped at demand levels)
5. AR period (15 years) 6. Average annual woodfuel production
7. Total household woodfuel use
8. Fraction of household woodfuel use provided by A/R
Table 11: Emission reductions per replacement cookstove (tCO2/yr)
Figure 14: Methodology for calculating woodfuel mitigation potential from supply-side options

Mitigation potential from clean technologies
31
Figure 15.
Box 7 Supply side mitigation methodology Emissions reductions from average annual woodfuel production were calculated by multiplying each tonne of woodfuel by 1.75 (the wood to CO2 conversion factor). Emissions reductions from annual additional standing stock were calculated by multiplying each additional tonne of standing biomass by 1.75 and a mean annual increment of 8 tonnes of dry matter grown per year per hectare was used.50 The A/R period was assumed to be 15 years, with one fifteenth (i.e. 7%) of the available area planted in one year. Harvesting levels were assumed to be 10% of stock available at the end of each year, with harvesting starting in year 4. If the amount of woodfuel supplied in any country according to these calculations was greater than the non-renewable woodfuel consumption within that country, then the amount of woodfuel supplied was capped at the level of consumption.
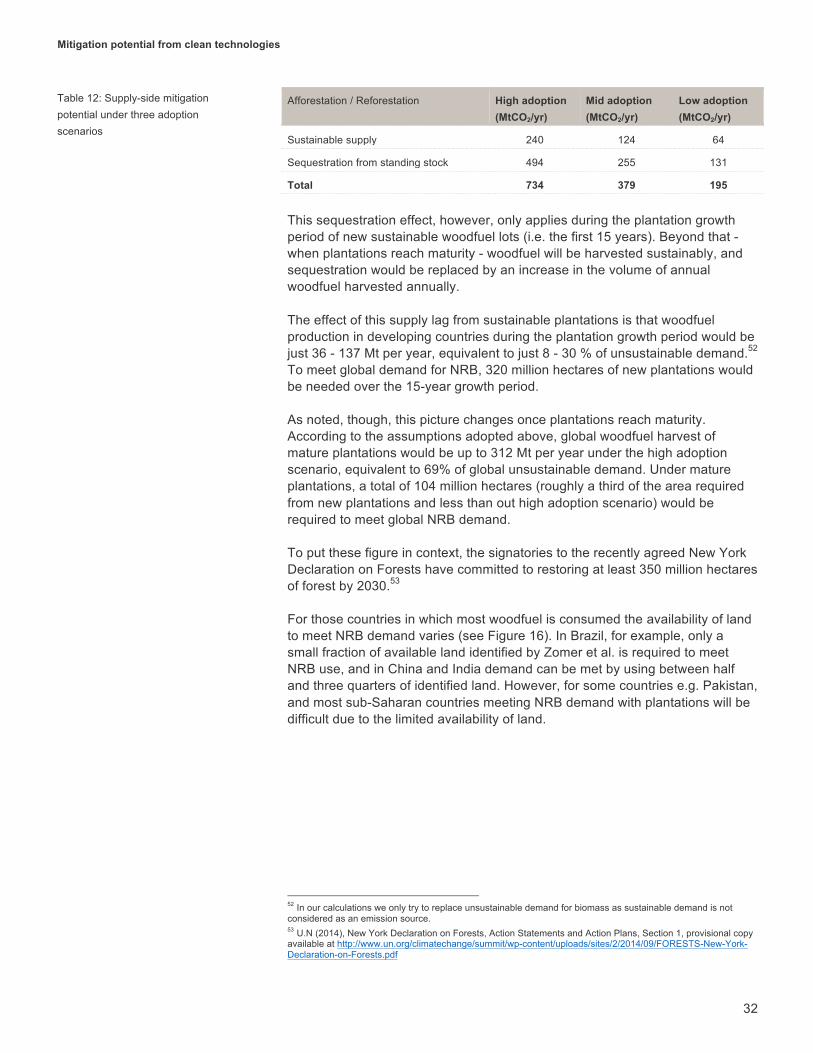
Using the assumptions outlined in Box 7, the annual supply-side mitigation potential from afforestation and reforestation ranges from 195-734 MtCO2.51 It is worth noting, however, that although dedicated woodfuel lots could play a significant role in mitigating emissions from cookstoves, this is in large part due to the volume of carbon being sequestered during the growth cycle of new woodfuel plantations. Under all three scenarios, roughly a third of the emissions reductions from afforestation and reforestation are a result of improvements in the sustainable supply of woodfuel from newly created woodfuel plantations. The remaining two thirds are due to carbon sequestration in the standing stock of newly planted forests (see Table 12).
50 2006 IPCC Guidelines for National Greenhouse Gas Inventories, Table 1.2, available at http://www.ipcc-nggip.iges.or.jp/public/2006gl/pdf/2_Volume2/V2_1_Ch1_Introduction.pdf 51 The lower range corresponds to a low adoption scenario (5% of available land is afforested or reforested) and the upper range to a high adoption scenario (25% of available land is afforested or reforested)
1. Total hectares available for afforestation/
reforestation (A/R)
2. High, mid and low A/R scenarios
3. Mean annual increment over AR
period minus woodfuel harvested
4. Total standing stock (capped at level
necessary to meet demand)
5. AR period (15 years) 6. Average additional standing stock per
year
Figure 15: Methodology for calculating standing stock created by supply side interventions.
Mitigation potential from clean technologies
32
32
Afforestation / Reforestation High adoption (MtCO2/yr)
Mid adoption (MtCO2/yr)
Low adoption (MtCO2/yr)
Sustainable supply 240 124 64
Sequestration from standing stock 494 255 131
Total 734 379 195
This sequestration effect, however, only applies during the plantation growth period of new sustainable woodfuel lots (i.e. the first 15 years). Beyond that - when plantations reach maturity - woodfuel will be harvested sustainably, and sequestration would be replaced by an increase in the volume of annual woodfuel harvested annually. The effect of this supply lag from sustainable plantations is that woodfuel production in developing countries during the plantation growth period would be just 36 - 137 Mt per year, equivalent to just 8 - 30 % of unsustainable demand.52 To meet global demand for NRB, 320 million hectares of new plantations would be needed over the 15-year growth period. As noted, though, this picture changes once plantations reach maturity. According to the assumptions adopted above, global woodfuel harvest of mature plantations would be up to 312 Mt per year under the high adoption scenario, equivalent to 69% of global unsustainable demand. Under mature plantations, a total of 104 million hectares (roughly a third of the area required from new plantations and less than out high adoption scenario) would be required to meet global NRB demand. To put these figure in context, the signatories to the recently agreed New York Declaration on Forests have committed to restoring at least 350 million hectares of forest by 2030.53 For those countries in which most woodfuel is consumed the availability of land to meet NRB demand varies (see Figure 16). In Brazil, for example, only a small fraction of available land identified by Zomer et al. is required to meet NRB use, and in China and India demand can be met by using between half and three quarters of identified land. However, for some countries e.g. Pakistan, and most sub-Saharan countries meeting NRB demand with plantations will be difficult due to the limited availability of land.
52 In our calculations we only try to replace unsustainable demand for biomass as sustainable demand is not considered as an emission source. 53 U.N (2014), New York Declaration on Forests, Action Statements and Action Plans, Section 1, provisional copy available at http://www.un.org/climatechange/summit/wp-content/uploads/sites/2/2014/09/FORESTS-New-York-Declaration-on-Forests.pdf
Table 12: Supply-side mitigation potential under three adoption scenarios

Mitigation potential from clean technologies
33
Geographically, China, Brazil, and India - the countries with the largest available land areas - have the greatest potential for emission reductions, and collectively account for over a half of overall mitigation potential through supply side mitigation options. Emissions reductions potential in sub-Saharan Africa - where there is the highest reliance on woodfuel - are considerably lower (see Figure 17).
In fact, the ability of dedicated woodfuel lots to meet demand for woodfuel in Sub-Saharan Africa is still somewhat limited. Most of these countries would need considerably larger land areas than those proposed by Zomer et al. to meet current demand for woodfuel use (see Table 13). Country (ordered by NRB demand)
NRB Demand Met By Supply (high adoption scenario)
Available land area (millions ha)
Land area required (millions ha)
Ethiopia 10% 10.5 27
Nigeria 26% 15 14
Kenya 6% 2.5 10.5
Uganda 9% 3.5 10.5
DRC 31% 11 9
Tanzania 23% 5 5.5
Sudan 2% 0.5 5.5
Cameroon 16% 3 5
South Africa 20% 3.5 4.5
Mozambique 24% 3.5 3.5
-
100
200
300
400
500
600
China India Indonesia Ethiopia Pakistan Brazil Nigeria Kenya
Mill
ion
Hec
tare
s (M
ha)
Land required to meet NRB use Land available (Zomer) Current forest areas (FAO)
0 20 40 60 80
100 120 140 160
Chi
na
Bra
zil
Indi
a N
iger
ia
Uru
guay
C
olom
bia
Mad
agas
cD
RC
E
thio
pia
Indo
nesi
a A
rgen
tina
Ang
ola
Tanz
ania
P
hilip
pine
s M
exic
o G
uine
a Ve
nezu
ela
Moz
ambi
qU
gand
a G
hana
MtC
O2/y
ear
Standing Stock
Sustainable supply
Figure 16: Land required to meet NRB use, land available (Zomer et al.) and current forest area (FAO) in eight largest consumers of woodfuel (Mha)
Figure 17: Emission reductions potential from afforestation and reforestation under high adoption scenario (MtCO2/yr)
Table 13: Available land in Sub-Saharan African countries (according to Zomer et al.) relative to land area required to meet NRB supply

Mitigation potential from clean technologies
34
34
4.5 Comparing demand- and supply-side potential According to the assumptions and scenarios outlined above, abatement potential from replacement cooking technology and sustainable supply of woodfuel from afforestation and reforestation are roughly equivalent (see Figure 18). By far the largest emissions reduction potential comes from the carbon sequestered in standing forest stock. As we have noted, however this sequestration will only occur during the plantation growth period (15 years). Under a high adoption scenario, it will be possible to mitigate all emissions from woodfuel use.
Though roughly equivalent when totaled across all countries, the proportion of potential emissions reductions achievable by supply and demand strategies varies greatly between countries (see Figure 19). In those countries with low land availability relative to woodfuel consumption (such as Ethiopia and Pakistan), supply strategies will be least effective and the focus should be placed on replacement cookstoves and fuel switching. The reverse is true for many Latin American countries in which the abatement potential of plantations to meet NRB demand is far greater.
To address NRB consumption, during plantation growth periods approximately 50% of non-renewable woodfuel use can be met through demand and supply side interventions. Once plantations are mature, however, this figure rises to 83% of NRB use (Figure 20).
0
200
400
600
800
1000
Emissions High Medium Low
MtC
O2/y
ear
Emissions Demand side intervention
A/R sustainable supply A/R standing stock
0%
50%
100%
150%
200%
250%
300%
350%
A/R Standing Stock
A/R Sustainable Supply Demand-side interventions
Figure 18: Emission reduction potential in non-Annex I countries from replacement cookstoves and afforestation/reforestation according to high adoption scenarios and mid-fNRB values (MtCO2/yr )
Figure 19: Percentage of woodfuel emissions that can be mitigated from A/R sustainable supply, A/R standing stock and demand side interventions (high adoption scenario) within the top ten emitting countries from woodfuel consumption

Mitigation potential from clean technologies
35
4.6 Priority countries for woodfuel interventions Geographically, there are several ways to prioritize woodfuel mitigation interventions. Clearly, a first order prioritization should be based on countries with the highest emissions from woodfuel use. These include high population countries such as China, India and Indonesia with high total emissions but often lower per-capita levels, as well as countries like Ethiopia, with lower populations and higher per-capita consumption. A second prioritization criterion should be those countries in which there are higher average emissions reductions per replacement cookstove. This in turn is a composite of two factors: the percentage of woodfuel consumed that is non-renewable, and the average amount of woodfuel consumed per household, of those households that consume woodfuel (which is affected by factors such as household size and woodfuel price/availability). A third prioritization criterion will be countries in which woodfuel emissions are a significant proportion of gross emissions from deforestation. As noted above, in a number of countries woodfuel emissions are equal to or even greater than reported emissions from deforestation, which indicates both the significance of woodfuel harvest as a driver, and the fact that in some countries, forest degradation caused by woodfuel harvest is largely unreported. Countries in which these prioritization criteria overlap represent excellent potential for cookstove interventions (see Figure 21), though of course, other factors, such as host country backing, distribution networks and security concerns will also play an important role. In terms of supply side solutions, those countries with land available to meet NRB use (see Figure 16) should be prioritized.
0
100
200
300
400
500
NRB use Plantation growth period
Mature plantation period
Bio
mas
s (M
t)
NRB use Demand side intervention A/R sustainable supply A/R standing stock
Figure 20: Non-renewable biomass (NRB) use that can be met under plantation growth period and mature plantation period

Mitigation potential from clean technologies
36
36
Figure 21: Countries in which to prioritize cookstove interventions according to three prioritization criteria
High emissions from woodfuel use
China DRC Indonesia Vietnam Tanzania Guatemala Pakistan Nigeria Mozambique Madagascar Zimbabwe Ghana
High emission reductions per replacement cookstove
Malaysia Guinea-Bissau Angola Botswana Trin. and Tob. Equat. Guinea Ecuador Honduras Paraguay Costa Rica Panama Eritrea Argentina
Lesotho Burundi Rwanda Malawi Haiti Senegal Burundi Togo Gambia
High woodfuel emissions as a proportion of gross emissions
from deforestation
Brazil Cameroon
Zambia Sudan
India Bangladesh
Uganda Kenya
Nepal Dom. Rep.
Bhutan
Somalia S. Africa Ethiopia

Policy options to align REDD+ and cookstoves
37
As outlined in the previous chapters, household woodfuel use for cooking represents a significant source of emissions, 0.8 GtCO2 per year, equivalent to a quarter of gross emissions from tropical deforestation. These emissions can be fully mitigated through a combination of fuel switching, energy efficiency, and woodlot plantations, using the highest adoption scenarios outlined above. There are, however, considerable barriers to reaching this potential scale of emissions reductions. This section explores current linkages between REDD+ and clean cookstoves, the scale of current REDD+ financing for cookstoves, and potential barriers to integrating REDD+ and more traditional cookstove financing.
5.1 Traditional financing options for cookstoves Clean and efficient cookstoves have been promoted as a strategy to improve health and reduce unsustainable woodfuel collection at least since the 1970s.54 In the past, however, many programs have under-performed, in most cases because of poor cookstove technology, lack of standards, no quality control and no adoption strategy. For many initiatives, adoption rates have been low due to a variety of barriers, such as lack of finance, poor adaptation to local needs, limited technical capacities, and strong cultural traditions, as well as limited awareness of the local population on potential health and livelihood benefits.55 Monitoring indicators are also often limited to quantities of cookstoves
54 Bailis, R., Hyman, J. (2011): Developing enabling frameworks for dissemination of clean-burning fuel-efficient cookstoves. In: Haselip et al. (Eds.): Diffusion of renewable energy technologies: case studies of enabling frameworks in developing countries. Technology Transfer Perspectives Series, 2011. UNEP Risø Centre, Denmark 55 ibid.
5 . Policy options to align REDD+ and cookstoves
REDD+ offers new sources of finance to support clean cook stove programs, including fuel switching, energy efficient stoves, and the sustainable production of woodfuel. Harnessing this finance, however, will require coordination both in the implementation of cookstove and REDD+ programmes and the methodological design of these respective agendas.

Policy options to align REDD+ and cookstoves
38
38
disseminated with little consideration of reduced emissions, and health and livelihood improvements. These systems often fail to assess long-term adoption rates and the issues of “stove stacking”, i.e. households using multiple types of stoves for different purposes. Monitoring, standardization and quality control represent major challenges in an already dispersed and niche sector, especially where appliances are, in part, locally produced. Although several monitoring tools have been developed, there is still no universal monitoring protocol. Local production of appliances, for example, may present advantages for adaptation to local practices and needs, in addition to livelihood benefits. However, a “design drift” can compromise efficiency and emissions improvements of these models.”56 Moreover, major health benefits of commonly available technologies are still largely contested. More advanced technologies, e.g., gas or electric models would provide more benefit but may not be appropriate for local markets yet. Notwithstanding these challenges, cookstove programs have evolved dramatically over the last decade as technologies improve and the market matures. Numerous technologies have been developed that improve efficiency, reduce smoke and emissions, and adapt to local cooking practices and available construction materials and skills. The Alliance’s Clean Cooking Catalog, a global database of clean cookstoves, lists over one hundred stove technologies (comprising over 200 models) by key indicators including major stove characteristics, specifications, emissions levels, efficiency, and safety from laboratory and field-testing.57 Two notable examples are the Daxu stove—which is featured in China’s national stove replacement program and improves efficiency by 40%58—and the Justa/2x3, which has been constructed on a large scale throughout Honduras by Proyecto Mirador, and reduces woodfuel consumption by half. 59 In addition to an increasing variety of clean cooking technologies becoming available, the Alliance’s 2013 Results Report demonstrates a substantial increase in the total number of stoves distributed worldwide by the Alliance’s partners. The rate of improved stove distribution has steadily increased from less than 2 million per year prior to 2010, to 14.3 million stoves distributed in 2013 alone.60 Many cookstove and biogas projects rely on a combination of international finance, carbon finance, domestic resources, and private sector finance. Yet, over the last decades, cookstove initiatives have evolved from typically free distribution models towards more market-driven approaches. These approaches invest in the capacity of local entrepreneurs to build and service stoves, generate revenues from the sale of clean cooking solutions, and employ
56 Simon, G.L., Bailis, R., Baumgartner, J., Hyman, J., Laurent, A. (2013): Current debates and future research needs in the clean cookstove sector. Energy for Sustainable Development, vol. 20, p. 49-57. 57 Clean Cooking Catalog: Stoves. http://catalog.cleancookstoves.org/#/stoves.
60 Global Alliance for Clean Cookstoves. 2013. RESULTS REPORT: Sharing Progress on the Path to Adoption of Cleaner and More Efficient Cooking Solutions. http://cleancookstoves.org/binary-data/RESOURCE/file/000/000/285-1.pdf
Many cookstove and biogas projects rely on a combination of international finance, carbon finance, domestic resources, and private sector finance
Policy options to align REDD+ and cookstoves
39
a mixture of direct (e.g. financing the cost of stove) and indirect subsidies (e.g. financing marketing, capacity-building, research, and certification activities) and are accompanied by significant co-benefits for local development.61
Climate finance plays a key role in catalyzing clean cookstove programs either through conventional aid programs, or through the purchase of emission reductions (e.g. through the CDM, or voluntary carbon markets). In both cases, there are a variety of flexible ways that climate finance can provide incentives, and increase adoption of clean cooking technologies, including:
• For manufacturers: to fund research and development to improve stove design and performance, reduce the costs of manufacturing, or invest to increase the scale of production.
• For distributers/retailers: to finance marketing and awareness campaigns to increase demand for clean cookstoves and fuels and knowledge of their benefits.
• For end-users: to train the end-user to adopt clean cooking practices; provide after-sales maintenance and repairs to ensure long term adoption; or to subsidize the upfront cost of the improved cookstoves to make them more affordable to the poor.
Some notable examples include: In Ethiopia, donor programs have disseminated more than one million cookstoves (e.g. the Mirt and Tikikil model) based on designs that can accommodate social and cultural cooking practices, especially for the preparation of local bread, injera. In the case of Proyecto Mirador in Honduras, households contribute locally available construction materials and labor by building the stove base (from e.g. adobe blocks), while the project’s technicians install cooktop, ceramic pieces and chimney, and provide training. This design, which is based partly on locally available components and is supported by carbon payments, enables an in-kind cost-sharing approach that has been identified as a main factor for the project’s long-term success.
Cookstove programs have also been implemented through financial intermediaries and implementation partners. The Household Energy and Universal Access Project - a World Bank and GEF project - provides an example of a comprehensive initiative that integrates sustainable forest management with fuel-efficient cookstoves, electrification and fuel substitution.62 Another example of an integrated initiative is the Program to Promote Renewable Energies, Rural electrification and Sustainable Supply of Domestic Fuel in Senegal, supported by GIZ. While one component of the program is focused on electrification based on concessions to private suppliers, another supports sustainable supply, alternative energy sources and improved efficiency, by supporting stove dissemination, marketing, and charcoal
61 Simon, G.L., Bailis, R., Baumgartner, J., Hyman, J., Laurent, A. (2013): Current debates and future research needs in the clean cookstove sector. Energy for Sustainable Development, vol. 20, p. 49-57. 62 The World Bank (2010): In Mali, Rural Electrification Rhymes with Renewable Energy. http://www.worldbank.org/en/news/feature/2010/10/29/in-mali-rural-electrification-rhymes-with-renewable-energy (September 2014)

Policy options to align REDD+ and cookstoves
40
40
production.63 To date, however, none of these programs have tried to incorporate their outcomes within a REDD+ framework.
Consumer financing options such as microfinance and micro-consignment mechanisms can provide clean cookstove customers with an opportunity to overcome the high upfront cost of cleaner cookstoves and fuels.64 Cookstove programs have also pioneered innovative mechanisms for consignment, i.e. by focusing on income generating opportunities associated to the production, retail and use of cookstoves, e.g. the Micro Consignment Model in Guatemala.65
The sector has also gathered momentum and experience using carbon finance to support implementation costs, both in the compliance and voluntary segments of the carbon market. Several years ago, voluntary carbon markets emerged as an important source of financing for improved cookstoves.66 In 2013, the share of clean cookstove initiatives was almost one quarter of the voluntary carbon market.67 The Alliance online catalog currently includes 49 cookstove projects in 26 countries that will reduce an estimated 7.7 million tonnes of CO2 per year and have distributed 5.1 million stoves to date.68 Proyecto Mirador provides an example of one of these successful projects, which has used carbon finance and other philanthropic support to disseminate over 73,000 stoves.69 To date, the project, which was among the first fuel-efficient cookstoves projects to be certified by the Gold Standard, has sold more than 400,000 verified emissions reductions. Similarly, an Ethiopian Cookstove Programme of Activities registered under the Clean Development Mechanism (CDM) with an objective to distribute over 200,000 improved cookstoves, seeks to reduce woodfuel use as a primary objective70.
5.2 Synergies between REDD+ and cookstoves REDD+ offers a new source of finance for clean cookstoves that can address both supply and demand for woodfuel, as well as creating new partnerships within government and the private sector. Under REDD+, payments are provided for the reduction in emissions from forest loss in developing countries. There is also an understanding that different countries will have different capacities to achieve the ultimate objective of reducing emissions from the forest sector. To enable countries to progress in a stepwise approach toward
63 Deutsche Gesellschaft für Internationale Zusammenarbeit (GIZ) GmbH (2014): Renewable energies, rural electrification and a sustainable supply of domestic fuel. Programme description. https://www.giz.de/en/worldwide/20886.html (September 2014) 64 Ignite Change: A Strategy for Universal Adoption of Clean Cookstoves and Fuels, GACC, page 21. 65 The MicroConsigment Model (2014): http://microconsignment.com/ 66 Peters-Stanley, M., Yin, D. (2013): Maneuvering the Mosaic State of the Voluntary Carbon Markets 2013. A Report by Forest Trends’ Ecosystem Marketplace & Bloomberg New Energy Finance. http://www.forest-trends.org/documents/files/doc_3898.pdf (September 2014) 67 Peters-Stanley, M., Gonzalez, G. (2014): Sharing the Stage. State of the Voluntary Carbon Markets 2014. A Report by Forest Trends’ Ecosystem Marketplace. http://www.forest-trends.org/documents/files/doc_4501.pdf (September 2014) 68 Available at http://cleancookstoves.org/resources_files/carbon-credit-offsets-catalog.pdf. 69 The Proyecto Mirador Foundation (2014): Proyecto Mirador. La estufa dos por tres. http://www.proyectomirador.org/ (September 2014) 70 United Nations Framework Convention on Climate Change (2013): Programme Design Document Form For Small-Scale CDM Programmes of Activities (F-CDM-SSC-PoA-DD): Ethiopia Improved Cookstoves Initiative Programme of Activities. https://cdm.unfccc.int/filestorage/9/5/E0UDOVXTC4WSN9AQFBYZKL61G58P7H.pdf/PoADD_WFP_Ethiopia_16sep2013.pdf?t=c3F8bmJhMHQ2fDB4RtRNi_MqJK4aLz2juolH (September 2014)

Policy options to align REDD+ and cookstoves
41
this goal, Parties to the UNFCCC have agreed that REDD+ should follow a “phased approach” (see Box 6).
Box 1 Phased approach to REDD+ Under the Cancun Agreements negotiated at the 16th Conference of the Parties (COP 16) in 2010, Parties to the UN Framework Convention on Climate Change (UNFCCC) officially adopted REDD+ as a framework that uses financial mechanisms to mitigate climate change through five identified activities: reducing deforestation, reducing degradation, conservation, sustainable management of forests, and enhancement of carbon stocks.71 It was agreed that REDD+ should follow a step-wise or phased approach,72 in which Countries engaging in REDD+ would begin by building technical and institutional capacity (Phase 1 or ‘readiness’); followed by policy reform and demonstration activities (Phase 2 or ‘implementation’); ramping up to fully measured, reported and verified (MRV) implementation (Phase 3 or ‘results-based payments’). These phases could be partly or fully overlapping.
Under a phased approach, countries are provided with resources to lay the necessary groundwork and pilot implementation before progressing to results-based activities. Finance has also to a large extent mapped onto these phases (see Figure 22).
5.2.1 Phase I synergies Under Phase I, multilateral and bilateral donor programs assist developing countries prepare for the implementation of REDD+ measures (REDD+ readiness). The most prominent of these programs are the World Bank’s Forest Carbon Partnership Facility’s (FCPF’s) Readiness Fund and the UN Collaborative Programme on Reducing Emissions from Deforestation and Forest Degradation in Developing Countries (UN-REDD). Since their inception in 2008, the FCPF Readiness Fund and UN-REDD Programme have collectively supported 52 developing countries with funds totaling approximately
71 UNFCCC (2011) Report of the Conference of the Parties on its sixteenth session, held in Cancun from 29 November to 10 Addendum FCCC/CP/2010/7/Add.1 paragraph 70. 72 Ibid. paragraph 73
Figure 22: REDD+ multilateral and bilateral funds organized according to REDD+ phases
I: Readiness II: Implementation III: Results-based FCPF Readiness Fund UN-REDD Forest Investment Program GEF - Sustainable Forest Management Congo Basin Forest Fund
Guyana REDD+ Investment Fund (GRIF) REDD Early Movers (REM)
World Bank BioCarbon Fund FCPF Carbon Fund

Policy options to align REDD+ and cookstoves
42
42
USD240 million and USD169 million respectively.73 Each of the programs has its own criteria and procedures to support REDD+ readiness, but both are designed to help potential REDD+ host countries fill the gaps between their current technical and institutional capacities, and those that would be required to access results-based REDD+ financing. At the end of Phase I countries should have in place the technical and institutional components necessary to begin implementing REDD+ activities.
Technologies to reduce woodfuel consumption feature heavily in countries’ national REDD+ strategies. A recent study of 31 countries’ Readiness Preparation Plans (R-PPs) under the FCPF Readiness Fund found that over half of them include woodfuel interventions and cookstoves as part of their national REDD+ strategies and a further four promote alternatives to wood fuel.74 This constitutes the largest intervention across all drivers identified in RPPs. Under the FCPF and UN-REDD readiness programs, countries are also building inter-ministerial coordination and collaboration to encourage institutions and sectors that normally operate independently to work together to address common drivers of deforestation and forest degradation. While many countries are discussing the role of woodfuel in their national REDD+ strategies, there is an opportunity to more firmly anchor cookstoves and sustainable woodfuel into these broader policy discussions. Examples of some of the interventions included in national REDD+ strategies include:
• Ethiopia: Adoption of more efficient fuelwood stoves. 75 • Cameroon: The development of biogas production to generate
electricity, by the recycling of agricultural and livestock farming by-products.76
• Kenya: Assisting national forest services to operationalize legislation on streamlined charcoal production and transportation rules.77
• Uganda: Tree planting and establishment of woodlots by farmers, government institutions and commercial users such as tea factories.78
• Tanzania: Acceleration of participatory land use planning and establishment of firewood/charcoal production areas on village lands.79
73 Heinrich Böll Stiftung; Overseas Development Institute (2014): Climate Funds Update. http://www.climatefundsupdate.org/ (Septemnber 2014) 74 See Kissinger, G., M. Herold, V. De Sy. Drivers of Deforestation and Forest Degradation: A Synthesis Report for REDD+ Policymakers. Lexeme Consulting, Vancouver Canada, August 2012. 75 Ethiopia’s R-PP http://www.forestcarbonpartnership.org/sites/forestcarbonpartnership.org/files/Documents/PDF/Jan2012/R-PP%20Ethiopia-final%20May%2025-2011.pdf 76 Cameroon’s R-PP http://www.forestcarbonpartnership.org/sites/forestcarbonpartnership.org/files/Documents/PDF/Oct2012/Cameroon%20final%20R-PP-English-October,%202012.pdf 77 Kenya’s R-PP http://www.forestcarbonpartnership.org/sites/forestcarbonpartnership.org/files/Documents/PDF/Jun2010/KENYA_REDD-RPP-JUNE_12th_2010.pdf 78 Uganda R-PP http://www.forestcarbonpartnership.org/sites/forestcarbonpartnership.org/files/Documents/PDF/Jun2011/Uganda%20Revised%20RPP%20May%2031,%20%202011_0.pdf 79 Tanzania’s R-PP http://www.forestcarbonpartnership.org/sites/forestcarbonpartnership.org/files/Documents/PDF/Jun2010/Tanzania-Revised_R-PP_main_document_V9-10.06.2010.pdf

Policy options to align REDD+ and cookstoves
43
5.2.2 Phase 2 synergies Under Phase 2, up-front finance (typically in the form of grant based ODA) is provided for the implementation of national or subnational REDD+ activities. The major source of multilateral Phase 2 finance is the World Bank’s Forest Investment Program (FIP). The FIP has a total of US$639 million to support eight countries to reduce emissions from deforestation and forest degradation. Under the FIP countries are required to develop Investment Plans (IPs) that outline the interventions that will be implemented using FIP funding. Of the eight countries supported by the FIP, four of them specifically integrate reduced woodfuel use in their proposed investment plans.80 Specific activities financed under FIP IPs include:
• Mexico: Encouraging the use of fuelwood from local wood lot plantations cultivating energy efficient species, the collection of sustainable fuelwood and logging debris in production forests, and promotion of the formalization and registration of commercial fuelwood collectors and traders.81
• DRC: Dissemination of improved cook stoves; and local communities trained in new practices for charcoal making (drying, placement of wood etc.) in order to improve productivity whilst retaining traditional cooking techniques.82
5.2.3 Phase 3 synergies Phase 3 finance for REDD+ is also underway with several programs now including the World Bank’s BioCarbon Fund (US$ 280 million), FCPF Carbon Fund (US$390 million), and Germany’s REDD Early Movers (REM) program (US$40 million). These funds collectively manage more than US$ 700 million in results-based finance for REDD+. While many of these programs are still in the early stages of development, it is expected that some will focus on payments for emissions reductions from reduced woodfuel consumption. Under the FCPF Carbon Fund for example, six of the eleven country proposals (termed Emissions Reduction Program Idea Notes or ER-PINs) accepted into the funding pipeline reference woodfuel demand as one of the main drivers of forest degradation.83 Of these six countries, four (Nepal, DRC and RoC and Vietnam) propose efficient or alternative energy cookstove distribution as a means to reducing woodfuel demand. These proposals include:
• RoC: The distribution and promotion of high efficiency cook stoves in urban centers84;
80 Burkina Faso, DRC, Mexico, and Ghana based on the author’s analysis from the FIP investment portfolio 81 Mexico’s IP http://www.climateinvestmentfunds.org/cif/sites/climateinvestmentfunds.org/files/FIP%205%20Mexico%20IP.pdf 82 DRC’s IP https://www.climateinvestmentfunds.org/cifnet/sites/default/files/DRC%20FIP%20Investment%20Plan%20-%20Endorsed.pdf 83 Guatemala, Nepal, Vietnam, RoC, DRC and Chile. Based on the author’s analysis from https://www.forestcarbonpartnership.org/er-pins-fcpf-pipeline 84 RoC ER-PIN http://forestcarbonpartnership.org/sites/fcp/files/2014/september/Republic%20of%20Congo%20ER-PIN%20final%20version%2011%20%28Clean%29_English_10%20July%202014.pdf

Policy options to align REDD+ and cookstoves
44
44
• Vietnam: The provision of alternative renewable energy solutions including biogas and waste-to-energy for crop residues (bamboo and rice);85
• Nepal: The installation of biogas plants to replace the need for woodfuel. Biogas plants require significant up-front capital to install, and will not directly benefit households without livestock, so Nepal will scale up its clean cookstove initiative in order to reach more households.86
Alternative proposals to reducing the impact of woodfuel demand under the FCPF Carbon Fund include:
• DRC: The implementation of an Eco-Charcoal Program to produce an alternative charcoal product made from renewable plantations and sustainably harvested natural degraded forest to substitute for ‘bush’ charcoal;87
• Chile: Promoting the use of official woodfuel processing centers88 and development of competitivity and legality in forestry products value chain;89
• Guatemala: Updating forest inspection systems and introducing punitive and preventive programs to reduce the proportion of woodfuel illegally cut and marketed.90
5.2.4 Summary of overlaps In total, nine countries: Burkina Faso, Chile, DRC, Ghana, Guatemala, Mexico, Nepal, Republic of Congo, and Vietnam are receiving multilateral funding for REDD+ implementation and have prioritized woodfuel interventions in their national program designs (see Figure 23).
While this is indication that cookstoves are being prioritized within REDD+, there is still a considerable way to go. Firstly, the priority countries for cookstove interventions from a deforestation perspective are to a large part not included in this subset of pilot countries (see Figure 21). The three countries that met all three criteria for prioritization under REDD+ (high emissions from woodfuel use, high emissions reductions per cookstove, high emissions compared to deforestation emissions) were Somalia, South Africa, and Ethiopia; none of which are part of REDD+ implementation programs. Of the second order countries that fulfilled two of the three criteria, only Nepal has an active cookstove program under a multilateral REDD+ program. There is a clear opportunity for REDD+ programs to more closely target countries that have high emissions reduction potential from woodfuel consumption.
85 Vietnam’s ER-PIN http://www.forestcarbonpartnership.org/sites/fcp/files/2014/May/Vietnam%20ER-PIN%20May%2026.pdf 86 Nepal’s ER-PIN https://www.forestcarbonpartnership.org/sites/fcp/files/2014/April/Nepal%20ER-PIN%20CF9.pdf 87 DRC’s ER-PIN https://www.forestcarbonpartnership.org/sites/fcp/files/2014/April/DRC%20ER-PIN%20CF9.pdf 88 Chile’s ER-PIN http://forestcarbonpartnership.org/sites/fcp/files/2014/February/Chile%20ER-PIN%20CF9%20English.pdf 89 Guatemala ER-PIN https://www.forestcarbonpartnership.org/sites/fcp/files/2014/september/Guatemala%20ER-PIN%20Version%20Sept%202014.pdf 90 Id.

Policy options to align REDD+ and cookstoves
45
Secondly, expected emissions reductions from these interventions fall well short of the scale of intervention needed to achieve meaningful reductions in woodfuel emissions. Figure 24 shows the expected emissions reductions in five FIP and FCPF countries that have projected overall impacts in their program designs compared to annual emissions from woodfuel consumption in those countries. With the exception of the Republic of Congo, in which expected emissions reductions over the lifetime of the ER Program (0.9 MtCO2 from 2016 to 2020) are larger than annual woodfuel emissions (0.35 MtCO2/year), in most other countries, annual woodfuel emissions dwarf expected savings over program lifetimes. In DRC for example, expected emissions reductions of 0.9 MtCO2 from 2014 to 2020 under FIP interventions compare with annual woodfuel emissions of 22 MtCO2, meaning that over the program period, interventions are expected to remove only 0.6% of emissions from woodfuel consumption.
Under both Phase 2 and Phase 3 of REDD+ countries are in the process of developing more detailed guidelines on how woodfuel interventions will be implemented. Though Phase 2 and Phase 3 programs are still in relatively early stages, these funds represent a significant source of finance for cookstove implementation. However, it is clear from the above that this finance will need to be scaled up significantly if REDD+ interventions are to meaningfully tackle woodfuel emissions.
0
5
10
15
20
25
FCPF RoC (2016-2020)
FCPF Guatemala (2016-2020)
FCPF Nepal (2015-2020)
FIP DRC (2014-2020)
FIP Burkina Faso (10 years)
MtC
O2
Expected ERs from FIP and FCPF woodfuel interventions
Country's annual emissions from woodfuel
Figure 23: Woodfuel interventions as part of the Forest Investment Program (FIP) and Forest Carbon Partnership Facility (FCPF).
Figure 24: Expected emissions reductions from woodfuel interventions under FIP and FCPF over entire program length where data available (green) and annual emissions from woodfuel according to data from this study (red)

Policy options to align REDD+ and cookstoves
46
46
5.3 Recommendations for future development Notwithstanding the above challenges, it is important that as REDD+ gains momentum, clean cookstoves and woodfuel mitigation strategies feature within national REDD+ frameworks where appropriate. Based on our analysis we recommend three areas for further development to align REDD+ with cookstoves and reduced woodfuel consumption. The first is an alignment in accounting methodologies between REDD+ and clean cookstoves and woodfuel consumption; the second is improved coordination and knowledge sharing between cookstove and REDD+ agendas; and finally, an analysis of impacts of current cookstove programs on REDD+ and the development of improved monitoring systems for the clean cooking sector including monitoring of REDD+ impacts. These issues are discussed in more detail below.
5.3.1 Aligning REDD+ and woodfuel use methodologies A major barrier to the integration of clean cooking and woodfuel mitigation strategies within a REDD+ framework is the difference in accounting methodologies used in REDD+ and clean cooking interventions, and therefore the difficulties in ascribing emissions reductions achieved from reduced woodfuel use (or more sustainable production) with REDD+ strategies. This issues spans across several elements that we identify as follows. Land-use v fNRB accounting Firstly, REDD+ uses a land-use accounting approach to measure forest emissions reductions that takes into account changes in forest carbon stocks in a geographically-defined area. Woodfuel projects, on the other hand, use the fraction of non-renewable biomass (fNRB) that is conserved to measure forest emissions reductions. Framed another way: REDD+ projects measure standing stocks of forest carbon, and clean cooking projects measure the flow of forest products. These different approaches make it difficult to directly compare the contributions of REDD+ and cookstove and fuels projects. Baseline setting Secondly, as mentioned above, emissions reductions from clean cookstove and woodfuel projects are measured as a function of the non-renewable woodfuel saved - usually compared to historical woodfuel consumption in target populations. REDD+ reference levels, on the other hand, use historical deforestation rates that may be adjusted upward or downward to take national circumstances into account (e.g., infrastructure development). Monitoring, reporting and verifying results Thirdly, different methodologies are used for monitoring, reporting and verification (MRV) of results. The type of land use from which woodfuel is harvested, which commonly includes roadside, farmland and other non-forest area, may not be monitored as part of REDD+ efforts (which focus on areas traditionally defined as forest land). Further, the effect of woodfuel harvesting (i.e. forest degradation) may not be measureable according to existing REDD+ methodologies, which typically focus on deforestation.

Policy options to align REDD+ and cookstoves
47
Scale Finally, there are different scales at which cooking and REDD+ interventions operate. Clean cookstove and fuel interventions typically have a more localized focus i.e. they are project-level activities. To date this has been less of a concern since REDD+ projects have also been conducted within a small geographical area. With the onset of a UNFCCC led approach, however, accounting for REDD+ is now to be conducted at the jurisdictional level (i.e. national or sub-national level),meaning that there will be considerable overlaps in geographies and interventions. To address these concerns, we propose that the Global Alliance for Clean Cookstoves (Alliance) conduct a study to identify the main gaps between clean cooking and REDD+ methodologies, and explore options for aligning approaches.
5.3.2 Coordination and knowledge sharing A major barrier to the integration of cookstoves with REDD+ is the lack of understanding within REDD+ and clean cooking communities about the potential for synergies between the two agendas. Clean cookstove and fuels specialists have had little input into the design of REDD+ funds and programs, and similarly REDD+ specialists have had little involvement with clean cookstove and fuels dissemination. This is true both at the strategic level in the design of funds and institutions, and on the ground at the project level. For example, the Alliance has over 1,000 partners, but these do not include the major REDD+ institutions. Similarly, clean cooking organizations are not represented as observers, members or expert reviewers at the major REDD+ funds such as the Forest Carbon Partnership Facility (FCPF), Forest Investment Programme (FIP) and UN-REDD. At the country level, there is no platform through which host countries can discuss the role of clean cooking technologies in reducing deforestation and forest degradation. This means that where there have been success stories or challenges in attempts to reduce forest loss (or improve forest cover) through clean cookstove and fuel dissemination, relevant lessons are lost. To address these concerns we propose that the Alliance organize and facilitate workshops at both the fund level, and at the host country level, that promote greater coordination between REDD+ and clean cooking efforts.
5.3.3 Assessing cookstoves’ impacts on REDD+ While considerable research has gone into the effectiveness of cookstoves91 and the environmental integrity of fNRB values92, there has been little research demonstrating observable links between existing clean cooking interventions on the one hand, and changes in deforestation and forest degradation levels in target areas on the other. There is still less evidence demonstrating a causal relationship between the two. Establishing that link is key to demonstrating the viability of REDD+ financing for clean cooking. This will require three key questions to be addressed: 91 See e.g. Ruiz-Mercado, I. et al. "Adoption and sustained use of improved cookstoves." Energy Policy 39.12 (2011): 7557-7566. 92 See e.g. Lee, Carrie M., et al. "Assessing the climate impacts of cookstove projects: issues in emissions accounting." Stockholm: Stockholm Environment Institute (SEI) (2013).

Policy options to align REDD+ and cookstoves
48
48
1. To what extent do replacement cookstoves lead to lower woodfuel
consumption at the household level? 2. To what extent does lower consumption by households lead to a lower
overall woodfuel harvest in the target area? 3. To what extent does lower woodfuel harvest lead to conserved forest
carbon stocks in the target area? The first question raises a number of behavioral issues related to the adoption of clean cookstove interventions that have - to a large extent - already been raised by the academic community. For example, can project proponents demonstrate that households with replacement cookstoves are not simply using efficiency gains to increase the amount of the cooking, or using the new cookstove in addition to, and not to the exclusion of, existing appliances? Addressing these questions will require considerable improvements, however, in abilities to monitor adoption rates of cookstoves technologies, as well as changes in collection of woodfuel. The second question relates to the issue of ‘leakage’: assuming that replacement cookstoves do lower demand, woodfuel harvest may remain unaffected if woodfuel is still harvested to be sold to communities elsewhere. On one hand, woodfuel harvest can be relatively elastic, and reductions in demand correspond directly to a reduction in supply, this may be true in local, rural settings for example, in which woodfuel collection is performed at the household level. On the other hand, woodfuel collection for urban consumption is relatively inelastic and one would expect little change in woodfuel collection based on individual household adoption rates. The third question raises a technical issue related to the assumptions behind fNRB values, and a policy issue related to the displacement of deforestation to other sectors and activities. As noted as part of Recommendation 1, there are a number of key technical differences in the way that fNRB values calculate emissions reductions in comparison to the measurement of deforestation and forest degradation. Without an alignment between these two areas, it may not be possible to reach any conclusions about the permanence of forest carbon stocks due to adoption of improved cooking technologies. The issue of leakage to other sectors is a more complex question to address. The reduction of woodfuel harvesting in a given area may effectively address woodfuel as a driver of deforestation and forest degradation, but deforestation might still occur due to the presence or emergence of another driver such as timber extraction or clearance for agriculture. These complex interplays between the drivers of land-use change, make it difficult to say whether woodfuel mitigation options are effectively reducing emissions from deforestation and forest degradation. An improved understanding of these factors will be essential to making the case that cookstoves can be a significant source of GHG mitigation in the forest sector. To address these knowledge gaps, we propose a two-fold strategy: firstly, to analyze the impacts of existing cookstove programs on local changes in deforestation and forest degradation; secondly, to develop options for improving the measurement, reporting and verification of clean cooking programs, in particular as relates to REDD+ impacts.

Annexes
49
6.1 Data sources Data sources used in this publication are as follows:
Baccini, A., et al. (2012) Estimated carbon dioxide emissions from tropical deforestation improved by carbon-density maps, Nature Climate Change 2.3: Supplementary Information.
Bailis, R., Drigo, R., Ghilardi, A., & Masera, O. (2015). The carbon footprint of traditional woodfuels. Nature Climate Change 5: 266-272. FAO (2010), Global Forest Resources Assessment. Global Tables. http://foris.fao.org/static/data/fra2010/FRA2010GlobaltablesEnJune29.xls
Harris, Nancy L., et al. (2012) Baseline map of carbon emissions from deforestation in tropical regions.; Houghton, R. (2012).
U.N. Statistical Division, Energy Statistics Database (last updated July 2013), Fuelwood – consumption by households, Charcoal – consumption by households.
World Health Organization (WHO) (2012), Global Health Observatory Data Repository, AIR 26: Population using charcoal as main cooking fuel, AIR27: Population using wood as main cooking fuel.
World Resources Institute (WRI). 2014. CAIT 2.0. Climate Analysis Indicators Tool: WRI’s Climate Data Explorer. http://www.wri.org/our-work/project/cait-climate-data-explorer.
Zomer, R. J., Trabucco, A., Verchot, L. V., & Muys, B. (2008). Land area eligible for afforestation and reforestation within the clean development mechanism: A global analysis of the impact of forest definition. Appendix 1: Total area for CDM-AR at specified crown cover density threshold. Mitigation and Adaptation Strategies for Global Change, 13, 219–239.
6 . Annexes

Annexes
50
50
6.2 Country REDD+ funding documents reviewed
6.2.1 Forest Investment Program Investment Plan for Brazil. FIP/SC.8/4/Rev.1. (23 April 2012). http://www.climateinvestmentfunds.org/cif/sites/climateinvestmentfunds.org/files/FIP_4_Brazil_IP_0.pdf Investment Plan for Burkina Faso. FIP/SC.9/4. (10 October 2012). https://www.climateinvestmentfunds.org/cif/sites/climateinvestmentfunds.org/files/FIP_4_Burkina_Faso.pdf. Investment Plan: Democratic Republic Of Congo. FIP/SC.6/4. (7 June 2011). https://www.climateinvestmentfunds.org/cifnet/sites/default/files/DRC%20FIP%20Investment%20Plan%20-%20Endorsed.pdf Draft Investment Plan for Ghana. FIP/SC.8/Inf.2. (23 April 2012). https://www.climateinvestmentfunds.org/cif/sites/climateinvestmentfunds.org/files/FIP_5_Ghana.pdf Investment Plan for Indonesia. FIP/SC.9/6. (10 October 2012). https://www.climateinvestmentfunds.org/cif/sites/climateinvestmentfunds.org/files/FIP_6_Indonesia_0.pdf Investment Plan of Lao People’s Democratic Republic. FIP/SC.7/4 (6 October 2011). http://www.climateinvestmentfunds.org/cif/sites/climateinvestmentfunds.org/files/FIP%204%20Lao%20PDR%20IP.pdf Investment Plan of Mexico. FIP/SC.7/5/Rev.1. (25 October 2011). http://www.climateinvestmentfunds.org/cif/sites/climateinvestmentfunds.org/files/FIP%205%20Mexico%20IP.pdf FIP Investment Plan for Peru. FIP/SC.11/4/Rev.1. (18 October 2013). https://www.climateinvestmentfunds.org/cif/sites/climateinvestmentfunds.org/files/FIP_SC.11_4_Peru_IP_.pdf
6.2.2 Forest Carbon Partnership Facility Carbon Fund Chile ER-PIN. (7 March 2014). http://forestcarbonpartnership.org/sites/fcp/files/2014/February/Chile%20ER-PIN%20CF9%20English.pdf Guatemala ER-PIN. (12 September 2014). https://www.forestcarbonpartnership.org/sites/fcp/files/2014/september/Guatemala%20ER-PIN%20Version%20Sept%202014.pdf Nepal ER-PIN. (7 March 2014). https://www.forestcarbonpartnership.org/sites/fcp/files/2014/April/Nepal%20ER-PIN%20CF9.pdf Vietnam ER-PIN. (26 May 2014). http://www.forestcarbonpartnership.org/sites/fcp/files/2014/May/Vietnam%20ER-PIN%20May%2026.pdf Republic of Congo ER-PIN. (10 July 2014). http://forestcarbonpartnership.org/sites/fcp/files/2014/september/Republic%20of%20Congo%20ER-PIN%20final%20version%2011%20%28Clean%29_English_10%20July%202014.pdf Democratic Republic of Congo ER-PIN. (7 March 2014). https://www.forestcarbonpartnership.org/sites/fcp/files/2014/April/DRC%20ER-PIN%20CF9.pdf