link.springer.com10.1007/s11095... · Web viewFigure B.1: ICC curves from the IRT model fit (black...
24
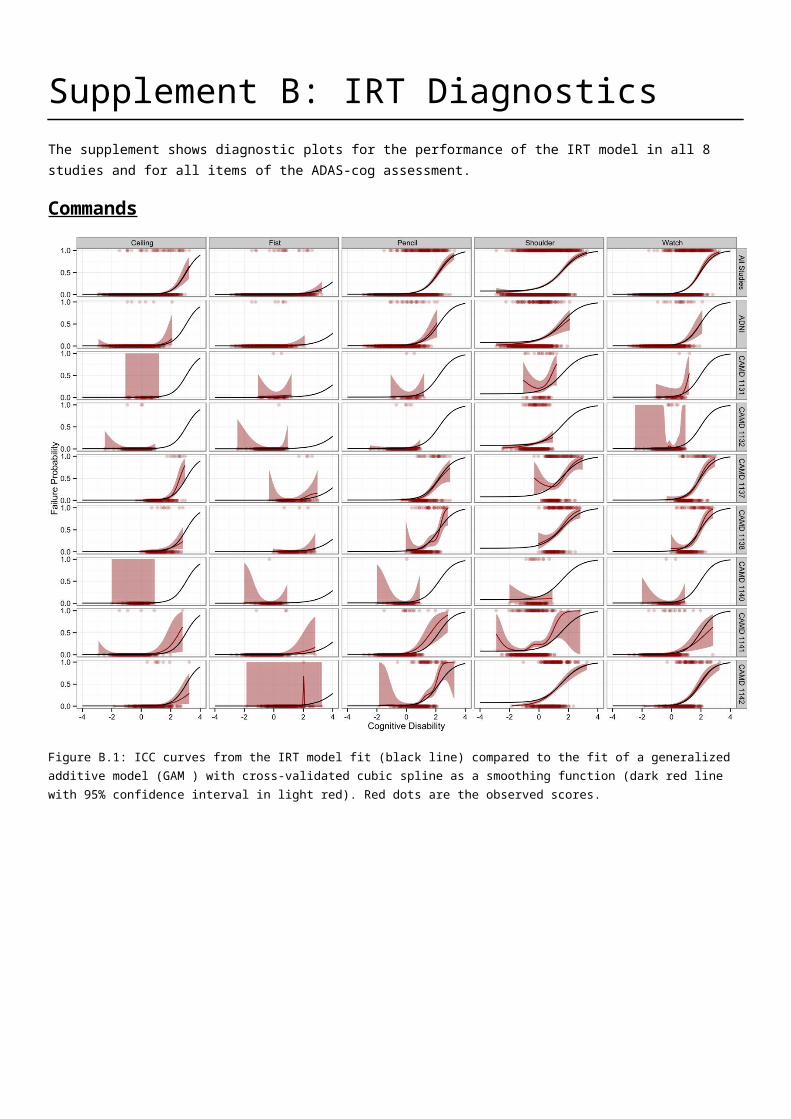
Supplement B: IRT Diagnostics The supplement shows diagnostic plots for the performance of the IRT model in all 8 studies and for all items of the ADAS-cog assessment. Commands Figure B.1: ICC curves from the IRT model fit (black line) compared to the fit of a generalized additive model (GAM ) with cross-validated cubic spline as a smoothing function (dark red line with 95% confidence interval in light red). Red dots are the observed scores.
Transcript of link.springer.com10.1007/s11095... · Web viewFigure B.1: ICC curves from the IRT model fit (black...
Supplement B: IRT DiagnosticsThe supplement shows diagnostic plots for the performance of the IRT model in all 8 studies and for all items of the ADAS-cog assessment.
Commands
Figure B.1: ICC curves from the IRT model fit (black line) compared to the fit of a generalized additive model (GAM ) with cross-validated cubic spline as a smoothing function (dark red line with 95% confidence interval in light red). Red dots are the observed scores.

Figure B.2: Observed (dark red) and simulated (grey) fraction of subjects failing a certain tasks of the command component. The grey shading visualizes the variability from 100 repetitions of the simulations.

Construction
Figure B.3: ICC curves from the IRT model fit (black line) compared to the fit of a generalized additive model (GAM ) with cross-validated cubic spline as a smoothing function (dark red line with 95% confidence interval in light red). Red dots are the observed scores.
Figure B.4: Observed (dark red) and simulated (grey) fraction of subjects failing a certain tasks of the construction component. The grey shading visualizes the variability from 100 repetitions of the simulations.

Ideational Praxis
Figure B.5: ICC curves from the IRT model fit (black line) compared to the fit of a generalized additive model (GAM ) with cross-validated cubic spline as a smoothing function (dark red line with 95% confidence interval in light red). Red dots are the observed scores.
Figure B.6: Observed (dark red) and simulated (grey) fraction of subjects failing a certain tasks of the ideational praxis component. The grey shading visualizes the variability from 100 repetitions of the simulations.

Naming Objects & Fingers
Figure B.7: ICC curves from the IRT model fit (black line) compared to the fit of a generalized additive model (GAM ) with cross-validated cubic spline as a smoothing function (dark red line with 95% confidence interval in light red). Red dots are the observed scores. Panels with grey background visualize data that was excluded from the analysis.

Figure B.8: ICC curves from the IRT model fit (black line) compared to the fit of a generalized additive model (GAM ) with cross-validated cubic spline as a smoothing function (dark red line with 95% confidence interval in light red). Red dots are the observed scores. Panels with grey background visualize data that was excluded from the analysis.

Figure B.9: ICC curves from the IRT model fit (black line) compared to the fit of a generalized additive model (GAM ) with cross-validated cubic spline as a smoothing function (dark red line with 95% confidence interval in light red). Red dots are the observed scores. Panels with grey background visualize data that was excluded from the analysis.

Figure B.10: ICC curves from the IRT model fit (black line) compared to the fit of a generalized additive model (GAM ) with cross-validated cubic spline as a smoothing function (dark red line with 95% confidence interval in light red). Red dots are the observed scores. Panels with grey background visualize data that was excluded from the analysis.

Figure B.11: Observed (dark red) and simulated (grey) fraction of subjects failing a certain tasks of the naming objects & fingers component. The grey shading visualizes the variability from 100 repetitions of the simulations. Panels with grey background visualize data that was excluded from the analysis.
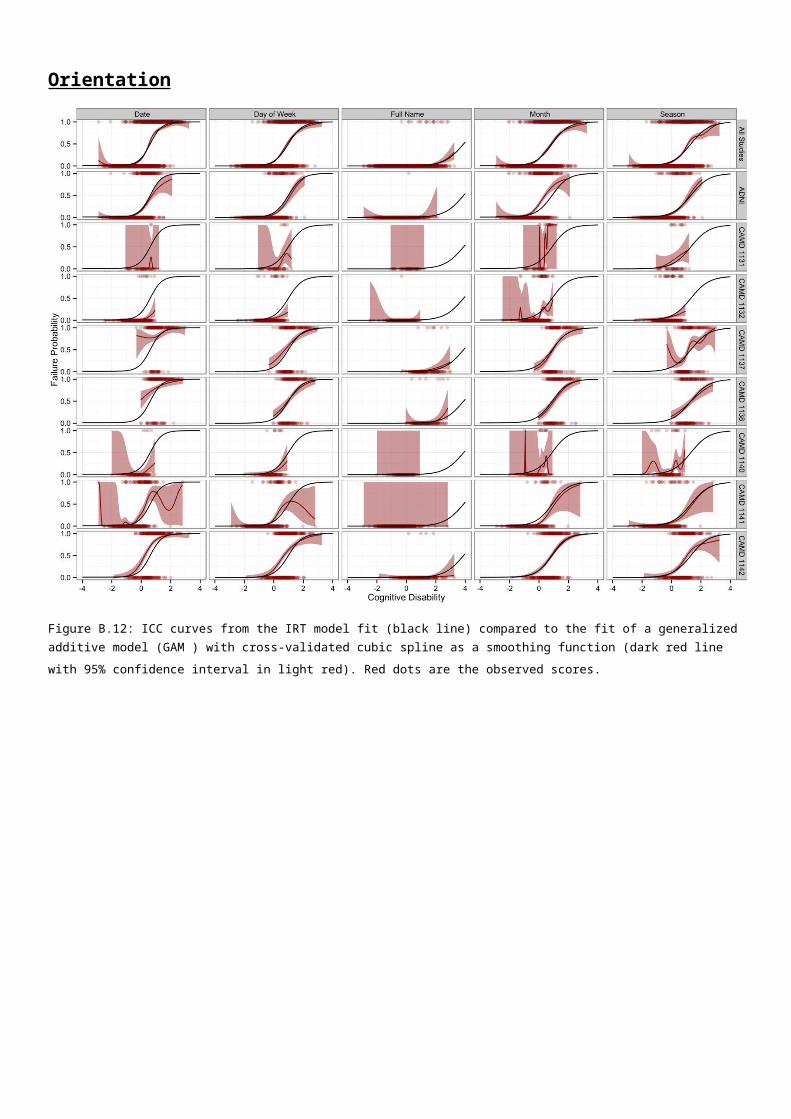
Orientation
Figure B.12: ICC curves from the IRT model fit (black line) compared to the fit of a generalized additive model (GAM ) with cross-validated cubic spline as a smoothing function (dark red line with 95% confidence interval in light red). Red dots are the observed scores.

Figure B.13: ICC curves from the IRT model fit (black line) compared to the fit of a generalized additive model (GAM ) with cross-validated cubic spline as a smoothing function (dark red line with 95% confidence interval in light red). Red dots are the observed scores.

Figure B.14: Observed (dark red) and simulated (grey) fraction of subjects failing a certain tasks of the orientation component. The grey shading visualizes the variability from 100 repetitions of the simulations.

Word Recall
Figure B.15: ICC curves from the IRT model fit (black line) compared to the fit of a generalized additive model (GAM ) with cross-validated cubic spline as a smoothing function (dark red line with 95% confidence interval in light red). Red dots are the observed scores.

Repetition 1
Figure B.16: Observed (dark red) and simulated (grey) distribution of scores for 1st repetition of the word recall component. The grey shading visualizes the variability from 100 repetitions of the simulations.
Repetition 2
Figure B.17: Observed (dark red) and simulated (grey) distribution of scores for 2nd repetition of the word recall component. The grey shading visualizes the variability from 100 repetitions of the simulations.
Repetition 3
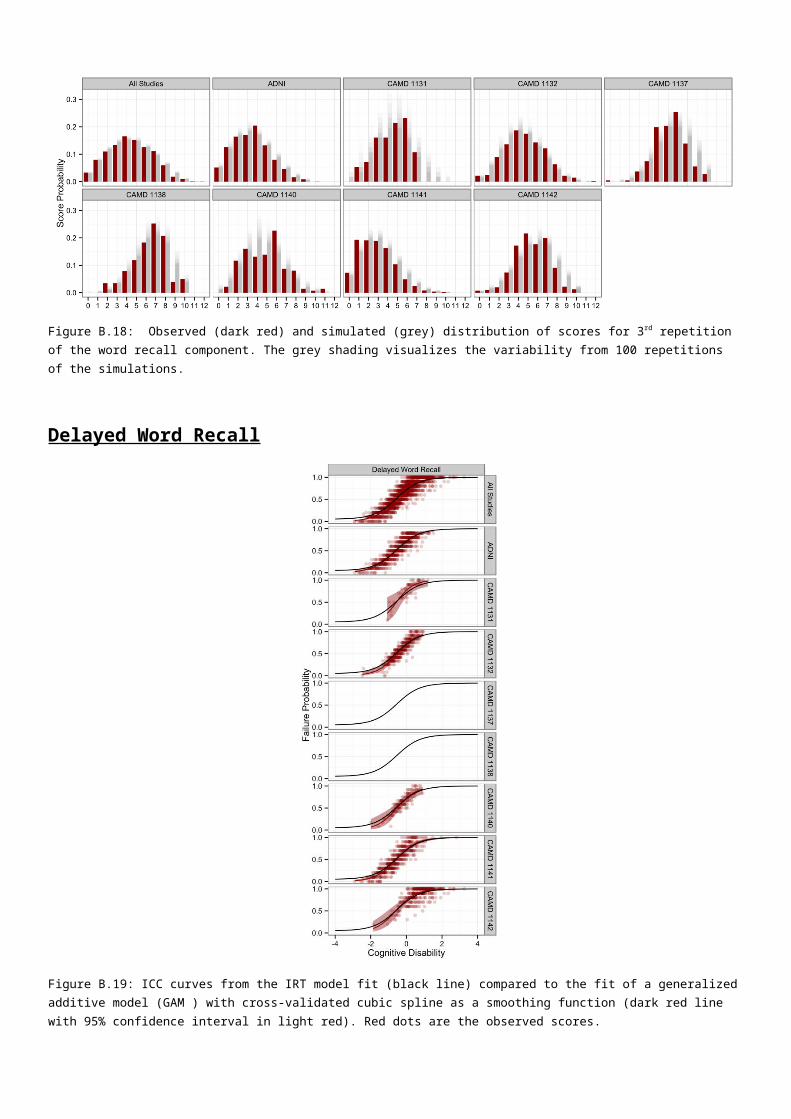
Figure B.18: Observed (dark red) and simulated (grey) distribution of scores for 3rd repetition of the word recall component. The grey shading visualizes the variability from 100 repetitions of the simulations.
Delayed Word Recall
Figure B.19: ICC curves from the IRT model fit (black line) compared to the fit of a generalized additive model (GAM ) with cross-validated cubic spline as a smoothing function (dark red line with 95% confidence interval in light red). Red dots are the observed scores.

Figure B.20: Observed (dark red) and simulated (grey) distribution of scores for the delayed word recall component. The grey shading visualizes the variability from 100 repetitions of the simulations.

Word Recognition
Studies without test repetition
Figure B.21: ICC curves from the IRT model fit (black line) compared to the fit of a generalized additive model (GAM ) with cross-validated cubic spline as a smoothing function (dark red line with 95% confidence interval in light red). Red dots are the observed scores.
Figure B.22: Observed (dark red) and simulated (grey) distribution of scores for the word recognition component (studies without repetition). The grey shading visualizes the variability from 100 repetitions of the simulations.
Studies with test repetition
Figure B.23: ICC curves from the IRT model fit (black line) compared to the fit of a generalized additive model (GAM ) with cross-validated cubic spline as a smoothing function (dark red line with 95% confidence interval in light red). Red dots are the observed scores.

Figure B.24: Observed (dark red) and simulated (grey) distribution of scores for the word recognition component (studies with repetition). The grey shading visualizes the variability from 100 repetitions of the simulations.

Number Cancellation
Figure B.25: ICC curves from the IRT model fit (black line) compared to the fit of a generalized additive model (GAM ) with cross-validated cubic spline as a smoothing function (dark red line with 95% confidence interval in light red). Red dots are the observed scores.
Figure B.26: Observed (dark red) and simulated (grey) distribution of scores for the number cancellation component. The grey shading visualizes the variability from 100 repetitions of the simulations.

Comprehension
Figure B.27: ICC curves from the IRT model fit (black line) compared to the fit of a generalized additive model (GAM ) with cross-validated cubic spline as a smoothing function (dark red line with 95% confidence interval in light red). Red dots are the observed scores.
Figure B.28: Observed (dark red) and simulated (grey) fraction of subjects with a certain categorization for the comprehension component. The grey shading visualizes the variability from 100 repetitions of the simulations.

Remembering
Figure B.29: ICC curves from the IRT model fit (black line) compared to the fit of a generalized additive model (GAM ) with cross-validated cubic spline as a smoothing function (dark red line with 95% confidence interval in light red). Red dots are the observed scores.
Figure B.30: Observed (dark red) and simulated (grey) fraction of subjects with a certain categorization for the remembering component. The grey shading visualizes the variability from 100 repetitions of the simulations.

Spoken Language
Figure B.31: ICC curves from the IRT model fit (black line) compared to the fit of a generalized additive model (GAM ) with cross-validated cubic spline as a smoothing function (dark red line with 95% confidence interval in light red). Red dots are the observed scores.
Figure B.32: Observed (dark red) and simulated (grey) fraction of subjects with a certain categorization for the spoken language component. The grey shading visualizes the variability from 100 repetitions of the simulations.

Word Finding
Figure B.33: ICC curves from the IRT model fit (black line) compared to the fit of a generalized additive model (GAM ) with cross-validated cubic spline as a smoothing function (dark red line with 95% confidence interval in light red). Red dots are the observed scores.
Figure B.34: Observed (dark red) and simulated (grey) fraction of subjects with a certain categorization for the word finding component. The grey shading visualizes the variability from 100 repetitions of the simulations.


![link.springer.com10.1007/s11164... · Web viewSYNTHESIS OF NOVEL 9-((ARYLIDENE) HYDRAZONO)-2,4,6,8-TETRAKIS (4-METHOXY PHENYL)-3,7-DIAZABICYCLO[3.3.1]NONANE AZINE DERIVATIVES AS POTIENTIAL](https://static.fdocuments.in/doc/165x107/5abe15dc7f8b9a8e3f8c93dc/link-101007s11164web-viewsynthesis-of-novel-9-arylidene-hydrazono-2468-tetrakis.jpg)