Linguistic Features Distinguishing Examinees’ Speaking ... · manner of speaking (fluency and...
16
Linguistic Features Distinguishing Examinees’ Speaking Performances at Different Proficiency Levels Okim Kang 1,a,* , Xun Yan 2,b 1 Northern Arizona University, Flagstaff, Arizona, USA 2 Department of Linguistics, University of Illinois at Urbana-Champaign, Urbana, USA a. [email protected], b. [email protected] *corresponding author Keywords: Speaking Assessment, Proficiency Level, Linguistic Analysis Abstract: A high-stakes speaking test needs to reflect a view of speaking ability that involves multiple competences by sampling features of language use (Davies, 2008). The current study examines linguistic features that distinguish examinee performance across Common European Framework of References (CEFR) levels in the Cambridge English Language Assessment. Using a quantitative/corpus-based approach, 1-minute long, mono- logic speech files of 106 candidates, at each of the CEFR levels were analyzed in various linguistic features. Dimension scores were subjected to correlational and MANOVA analyses. The findings suggest that there are distinctive differences in more linguistic dimensions between high and low CEFR speaking levels than between the adjacent levels. They also offer implications for the validation of the scoring criteria, and improvement of rater development and language pedagogy. 1. Introduction Successful oral communication requires proficiency on various aspects of speaking skills such as fluency, grammar, vocabulary, and pronunciation. However, thus far, no consensus has been reached as to what exactly second language (L2) speaking proficiency entails, and findings on linguistic criteria of speaking proficiency have been mixed (Brown, 2006; Iwashita, Brown, McNamara, & O’Hagan, 2008). In language testing research, examinees’ spoken responses have been measured for various linguistic traits. Iwashita et al.’s (2008) study found that a number of linguistic features were associated with holistic test scores, with vocabulary and fluency features having the strongest association. Jin and Mak (2013) examined correlations between selected distinguishing features and oral performance scores, but examinees’ first language (L1) background was limited to Chinese. More recently, Staples, LaFlair, and Egbert (2017) examined a wide array of linguistic features of the speaking performances on the MELAB test, to explore whether and to what extent different features are associated with holistic test scores. Still, these studies are somewhat unclear about how specific linguistic characteristics can differentiate L2 speakers at various proficiency levels. In addition, their measures of pronunciation were limited. More research is needed to comprehensively examine the linguistic features of L2 speakers’ oral production. Using examinees’ spoken responses 24 Journal of Language Testing & Assessment (2018) Vol. 1: 24-39 Clausius Scientific Press, Canada
Transcript of Linguistic Features Distinguishing Examinees’ Speaking ... · manner of speaking (fluency and...
Linguistic Features Distinguishing Examinees’ Speaking Performances at Different Proficiency Levels
Okim Kang1,a,*, Xun Yan2,b 1Northern Arizona University, Flagstaff, Arizona, USA
2Department of Linguistics, University of Illinois at Urbana-Champaign, Urbana, USA a. [email protected], b. [email protected]
*corresponding author
Keywords: Speaking Assessment, Proficiency Level, Linguistic Analysis
Abstract: A high-stakes speaking test needs to reflect a view of speaking ability that involves multiple competences by sampling features of language use (Davies, 2008). The current study examines linguistic features that distinguish examinee performance across Common European Framework of References (CEFR) levels in the Cambridge English Language Assessment. Using a quantitative/corpus-based approach, 1-minute long, mono-logic speech files of 106 candidates, at each of the CEFR levels were analyzed in various linguistic features. Dimension scores were subjected to correlational and MANOVA analyses. The findings suggest that there are distinctive differences in more linguistic dimensions between high and low CEFR speaking levels than between the adjacent levels. They also offer implications for the validation of the scoring criteria, and improvement of rater development and language pedagogy.
1. Introduction
Successful oral communication requires proficiency on various aspects of speaking skills such asfluency, grammar, vocabulary, and pronunciation. However, thus far, no consensus has been reached as to what exactly second language (L2) speaking proficiency entails, and findings on linguistic criteria of speaking proficiency have been mixed (Brown, 2006; Iwashita, Brown, McNamara, & O’Hagan, 2008).
In language testing research, examinees’ spoken responses have been measured for various linguistic traits. Iwashita et al.’s (2008) study found that a number of linguistic features were associated with holistic test scores, with vocabulary and fluency features having the strongest association. Jin and Mak (2013) examined correlations between selected distinguishing features and oral performance scores, but examinees’ first language (L1) background was limited to Chinese. More recently, Staples, LaFlair, and Egbert (2017) examined a wide array of linguistic features of the speaking performances on the MELAB test, to explore whether and to what extent different features are associated with holistic test scores. Still, these studies are somewhat unclear about how specific linguistic characteristics can differentiate L2 speakers at various proficiency levels. In addition, their measures of pronunciation were limited. More research is needed to comprehensively examine the linguistic features of L2 speakers’ oral production. Using examinees’ spoken responses
24
Journal of Language Testing & Assessment (2018) Vol. 1: 24-39 Clausius Scientific Press, Canada
from the Cambridge English Language Assessment, previously known as Cambridge ESOL, the current study examines what features can distinguish examinee performance at different Common European Framework of Reference (CEFR) levels for each of the assessment criteria.
2. Literature Review
2.1. Speaking Proficiency in Language Assessment
Theoretically, the term proficiency represents the ability to use a language for some purpose (Carroll, 1980), and the terms proficiency and ability are often used synonymously. In language assessment, ability is seen as a learner-internal construct, while proficiency is the observable manifestation of it (Douglas & Smith, 1997). However, in practice, proficiency has been used more arbitrarily to refer to knowledge, competence, or ability in the use of a language (Bachman, 1990). This, it remains unclear as to what proficiency entails exactly in speaking performance particularly due to the difficulty and variability in defining the construct (Iwashita, et al., 2008; Jin, Mak, & Zhou, 2012).
The term L2 speaking proficiency has been conceptualized differently in assessment frameworks and scoring rubrics. Cambridge English exams emphasize an effective use of linguistic resources to communicate. The exams follow the Common European Framework of Reference for Languages (CEFR) to classify learners by viewing proficiency as an ability to communicate with others orally via various linguistic resources; this ability varies across learners’ competence levels. Similarly, the American Council on the Teaching of Foreign Languages (ACTFL) Proficiency Guidelines for Speaking (2012) defined speaking proficiency in relation to communication effectiveness, placing more emphases on content, context, accuracy, and discourse types.
A major difference between assessment framework and scoring rubric is that while the former focuses on conceptualization of the target construct, the latter operationalizes it. In the band descriptors for the IELTS speaking test (IELTS, 2012), speaking proficiency is operationalized through the evaluation of fluency and coherence, lexical resource, grammatical range and accuracy, and pronunciation. In the case of TOEFL iBT, examinees’ oral performance is scored on delivery, language use, and topic development. The Versant English test uses facility to describe speaking proficiency, which means “the ability to understand spoken language on everyday topics and to respond appropriately at a native-like conversational pace in intelligible English” (Pearson, 2011, p.8). Evaluation criteria of facility include both content (sentence mastery and vocabulary), andmanner of speaking (fluency and pronunciation) (Pearson, 2011).
In general, L2 learners’ speaking proficiency has been described in high-stakes tests as different levels or bands by certain representative components of language. It consists of various features such as lexical, grammatical use, fluency of the speech, and discourse management. However, how proficiency can be characterized by these features or components may vary across proficiency levels and assessment contexts (De Jong, Steinel, Florijn, Schoonen, & Hulstijn, 2012). Examining how various (domains of) linguistic features manifest across proficiency levels can contribute to our understanding of speaking proficiency, thus making it an area worthy of further investigation.
2.2. Linguistic Features Distinguishing L2 Speaking Performance
Over the past decade, research in search of distinguishing linguistic features of speaking performance has increased. The domains of linguistic features include vocabulary, grammar, fluency, content, and rhetorical organization (e.g., Brown, 2006; Brown, Iwashita, & McNamara, 2005; Iwashita et al., 2008). Cambridge English exams, which are the primary sources of speech data used in this study, operationalize L2 speaking proficiency in terms of three large domains,
25
namely, discourse management, grammatical and lexical resource, and pronunciation. These domains are aligned with descriptors for speaking ability on the CEFR, one of the most researched and credible frameworks for language teaching, learning and assessment. The essence of the criterial feature concept in CEFR (Hawkins &Filipović, 2012) is that if we can describe the systematic differences in speaking performance at each proficiency level, we can then identify a set of linguistic features (grammatical and lexical, phonological, and semantic) to operationalize and validate the descriptors for speaking ability on the CEFR.
2.2.1. Features of Discourse Management
Management of discourse flow includes aspects of fluency and coherence. Measures of fluency investigated so far include speech rate, pausing, hesitation, and repair (Brown et al., 2005; Brown, 2006; Iwashita et al., 2008). These variables have been found to be associated with speaking proficiency as well as with listener comprehension (e.g., Isaacs, 2008; Iwashita et al., 2008; Kormos & Dénes, 2004; Munro & Derwing, 2001). Features of coherence include discourse markers, connective, and cohesive features, inclusions of introduction, and key ideas, although coherence is more difficult to measure through connective and cohesive devices (Brown, 2006). In a recent study on the speaking tasks on the TOEFL iBT, Jamieson and Poonpon (2013) reported that only the number of key ideas and presence of an introduction are significantly related to scores and tasks.
2.2.2. Features of Grammatical Resource
Measures of grammar include accuracy and complexity. Accuracy features normally include two categories: global accuracy and specific types of errors (Iwashita et al., 2008). Research findings show that both global accuracy and specific types of errors can differentiate speaking performances across among proficiency levels and speaking tasks (e.g., Iwashita et al., 2008; Jamieson & Poonpon, 2013).
Grammatical complexity has been measured through amount of subordination (Skehan & Foster, 1999), verb-phrase complexity ratio (Iwashita et al., 2008), and specific dependent clauses and phrases (i.e., complement clauses, adverbial clauses, relative clauses, and prepositional phrases) (Biber et al., 1999). The verb-phrase ratio was identified as one of the reliable indicators that distinguished levels of spoken performance in terms of grammar use (Iwashita et al., 2008). In addition, grammatical complexity has been examined by counting occurrences of prepositional phrases, passive structures, and adjectives as they revealed a significant effect on task and scores (Jamieson & Poonpon, 2013). Data-driven grammatical complexity has also been applied by counting occurrences of the lexico-grammatical features generated by Biber’s tagging program (Biber et al., 1999).
2.2.3. Features of Lexical Resource
Use of vocabulary has been considered as an important indicator of L2 learners’ speaking proficiency (e.g., Malvern & Richards, 2002). Features such as lexical sophistication and variation have been included in studies examining lexical richness (e.g., Lu, 2012; Yu, 2010). Findings of studies that investigated lexical resources have suggested that increases in proficiency levels are generally associated with increases in the amount of vocabulary produced, the proportion of lower-frequency vocabulary, and the range of words used (e.g., Biber et al., 1999; Lu, 2012). Although most measures of lexical resource vary in performance across proficiency levels, the differences of lexical knowledge displayed in speaking performance between adjacent levels are not always significant or substantial (Lee & Schallert, 1997).
26
2.2.4. Features of Pronunciation
An increasing number of studies have addressed the importance of non-native speakers’ (NNSs) suprasegmentals in listeners’ judgments (Isaacs, 2008; Kang, Rubin, & Pickering, 2010). For example, changing word stress can affect listeners’ comprehension (Hahn, 2004). Typically, low-proficient NNSs use primary stress on every lexical item, regardless of its function or semantic importance (Kang, 2010). NNS students also demonstrate a weak intonational structure (e.g., narrow pitch range in Pickering, 2001). A disturbance in prosodic composition considerably affects native speaker (NS) listeners’ perception of speech (Kang & Johnson, 2018; Pickering, 2001). In fact, stress and intonation patterns (e.g., pitch range or tone choices) are a big part of “acoustic fluency”, known as the best predictor of rated oral performance (Kang et al., 2010). In contrast, weak but significant correlations have been found between segmental errors and listeners’ judgments (e.g., Anderson-Hsieh, Johnson, & Koehler, 1992).
The studies reviewed above, while each employing a different set of linguistic features with a slightly different focus, collectively represent a wide range of linguistic features that have been used to describe L2 speaking proficiency or speaking performance in general. However, there has not been much research that comprehensively examines these linguistic features, to characterize speaking performance across proficiency levels in L2 assessment. In order to better understand candidates’ speaking performances and their relationships with proficiency levels, a more comprehensive set of measures is desired for all aspects of a language.
2.3. Level Adjacency
Several previous studies have examined test level as a function of the presence/absence or accuracy of lexical, grammatical, and phonological features (e.g., Iwashita, et al., 2008). Findings in this line of research have generally shown variability of speaking features across multiple levels. For example, Jamieson and Poonpon (2013) conducted multiple regression analyses to predict delivery, language use, and topic development scores on TOEFL iBT’s integrated speaking tasks. However, comparisons of linguistic performance between adjacent levels rarely reveal statistically significant differences (e.g., Biber et al., 2014; Banerjee et al., 2015).
The lack of consistent differences between adjacent groups or levels suggests a non-linear relationship in the development of certain linguistic features. Unfortunately, studies seeking to compare performance between test levels have not employed statistical analyses capable of detecting this type of trajectory. The current study investigated a wide array of linguistic measures in discourse management (fluency and coherence), grammatical, lexical resources, and pronunciation of the speaking performances on the Cambridge English Language Assessment. Specifically, this study addresses the following research question: What linguistic features from each of the scoring criteria of Cambridge English exams (i.e., discourse management, grammatical resources, lexical resources, and pronunciation) can distinguish examinees at different CEFR speaking levels (B1-C2)?
3. Methods
The study applied a quantitative/corpus-based approach to the analysis of speaking performance across four CEFR levels on the Cambridge English tests. It included an extensive number of linguistic variables in each dimension of the speaking assessment. Note that the study is rather exploratory and descriptive as seen in the case of some previous linguistic analysis studies (e.g., Ginther, Dimova, & Yang, 2010), because it aims to widely explore various linguistic features both
27
known and unknown in the field, which can distinguish examinees’ proficiency levels in a high-stakes assessment context.
3.1. Speech Files
The Cambridge English Language Assessment provided 118 audio speech files of examinee responses from general English examinations at CEFR levels B1 to C2, i.e., Preliminary English Test (PET: B1) for an intermediate level of English, First Certificate in English (FCE: B2) as an upper-intermediate level qualification, Certificate in Advanced English (CAE: C1) for a level of English for study and work environments, and Certificate of Proficiency in English (CPE: C2) for candidates who demonstrate exceptional English. Speakers were 32 in PET, 31 in FCE, 34 in CAE, and 21 in CPE. All candidate responses represented passing grades having received a standardized score of 75 or higher for the exam on a fixed scale out of 100. They also characterized ‘average’ learners at each level (Scores from 85-89 are considered Pass with Distinction. Scores from 90-100 are Pass with Merit). Each candidate’s speaking performance is assessed by two examiners using the analytic scales of the scoring criteria: discourse management, grammatical and lexical resources, pronunciation, and interactive communication (which is not part of this study), on the basis of which a candidate is awarded a global speaking proficiency score.
Cambridge English exams involve multiple tasks such as monologue (i.e., long-run individual responses by describing objects) and interaction (i.e., interviews, paired-collaborative tasks, and discussion on issues). The current study focused on the long, uninterrupted, mono-logic turns of speech. The speaking tasks of the four proficiency levels, though varying in topics, are of the same task type: individual picture-based description and discussion, in which candidates are asked to describe pictures or situations without interuption. Given that task topic tends to show little impact on speaking task performance (e.g., Nakatsuhara, 2006; Sun, 2011), the topic was not considered as a major variable of interest in this study. Although the total length of certain individual responses (e.g. CPE) could be two minutes or longer, the first 1-minute response was included in the linguistic analysis. When speech files were shorter than one minute, frequency counts of features were normalized to 1-minute.
The 118 files were used for fluency, lexical, and grammatical analyses, but only 115 files were used for pronunciation analyses because 3 files contained a creaky voice, which made the spectrogram blurred and unreadable. Among the candidates, 74 were females and 44 were males. Participants were from many different L1 backgrounds (e.g., Spanish, Korean, Italian, Dutch, French, Chinese, Japanese, German, Portuguese, and Russian).
3.2. Data Coding
The spoken responses were coded for linguistic features for each of the three scoring criteria (grammatical and lexical resources, discourse management, and pronunciation). Once all speech files were transcribed orthographically, each transcript was verified against the original sound files by the coders before being subjected to linguistic analysis. Grammatical features were analysed by two coders with high reliability of .90 and above. For the measures of fluency and pronunciation features, speech samples were processed by computer-assisted speech analysis programs: PRAAT (Boersma &Weenink, 2007) for speech rate and pauses, and the Computerized Speech Laboratory for stress and intonation. Transcripts were also used to analyse type-token ratio and vocabulary richness, using the web programme VocabProfile (Cobb 2002). For the measures of cohesion and grammatical accuracy the coders marked features on transcripts and counted the frequency manually.
28
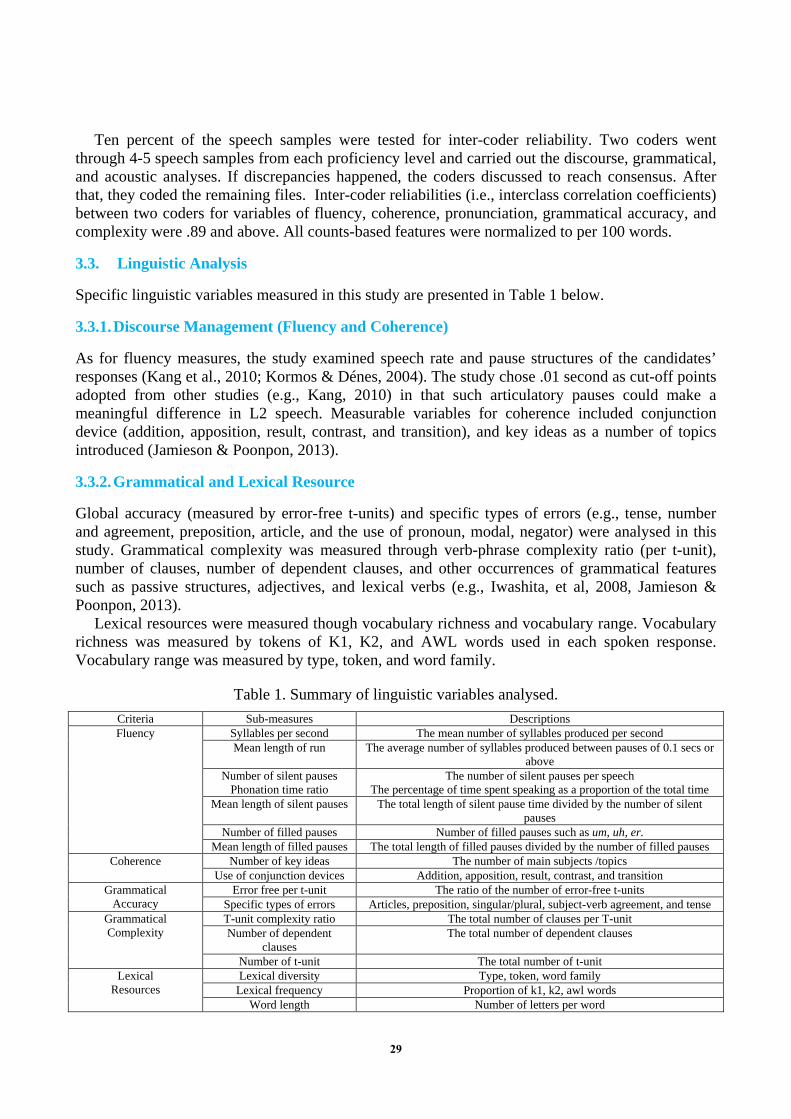
Ten percent of the speech samples were tested for inter-coder reliability. Two coders went through 4-5 speech samples from each proficiency level and carried out the discourse, grammatical, and acoustic analyses. If discrepancies happened, the coders discussed to reach consensus. After that, they coded the remaining files. Inter-coder reliabilities (i.e., interclass correlation coefficients) between two coders for variables of fluency, coherence, pronunciation, grammatical accuracy, and complexity were .89 and above. All counts-based features were normalized to per 100 words.
3.3. Linguistic Analysis
Specific linguistic variables measured in this study are presented in Table 1 below.
3.3.1. Discourse Management (Fluency and Coherence)
As for fluency measures, the study examined speech rate and pause structures of the candidates’ responses (Kang et al., 2010; Kormos & Dénes, 2004). The study chose .01 second as cut-off points adopted from other studies (e.g., Kang, 2010) in that such articulatory pauses could make a meaningful difference in L2 speech. Measurable variables for coherence included conjunction device (addition, apposition, result, contrast, and transition), and key ideas as a number of topics introduced (Jamieson & Poonpon, 2013).
3.3.2. Grammatical and Lexical Resource
Global accuracy (measured by error-free t-units) and specific types of errors (e.g., tense, number and agreement, preposition, article, and the use of pronoun, modal, negator) were analysed in this study. Grammatical complexity was measured through verb-phrase complexity ratio (per t-unit), number of clauses, number of dependent clauses, and other occurrences of grammatical features such as passive structures, adjectives, and lexical verbs (e.g., Iwashita, et al, 2008, Jamieson & Poonpon, 2013).
Lexical resources were measured though vocabulary richness and vocabulary range. Vocabulary richness was measured by tokens of K1, K2, and AWL words used in each spoken response. Vocabulary range was measured by type, token, and word family.
Table 1. Summary of linguistic variables analysed. Criteria Sub-measures Descriptions Fluency Syllables per second The mean number of syllables produced per second
Mean length of run The average number of syllables produced between pauses of 0.1 secs or above
Number of silent pauses Phonation time ratio
The number of silent pauses per speech The percentage of time spent speaking as a proportion of the total time
Mean length of silent pauses The total length of silent pause time divided by the number of silent pauses
Number of filled pauses Number of filled pauses such as um, uh, er. Mean length of filled pauses The total length of filled pauses divided by the number of filled pauses
Coherence Number of key ideas The number of main subjects /topics Use of conjunction devices Addition, apposition, result, contrast, and transition
Grammatical Accuracy
Error free per t-unit The ratio of the number of error-free t-units Specific types of errors Articles, preposition, singular/plural, subject-verb agreement, and tense
Grammatical Complexity
T-unit complexity ratio The total number of clauses per T-unit Number of dependent
clauses The total number of dependent clauses
Number of t-unit The total number of t-unit
Lexical Resources
Lexical diversity Type, token, word family Lexical frequency Proportion of k1, k2, awl words
Word length Number of letters per word
29
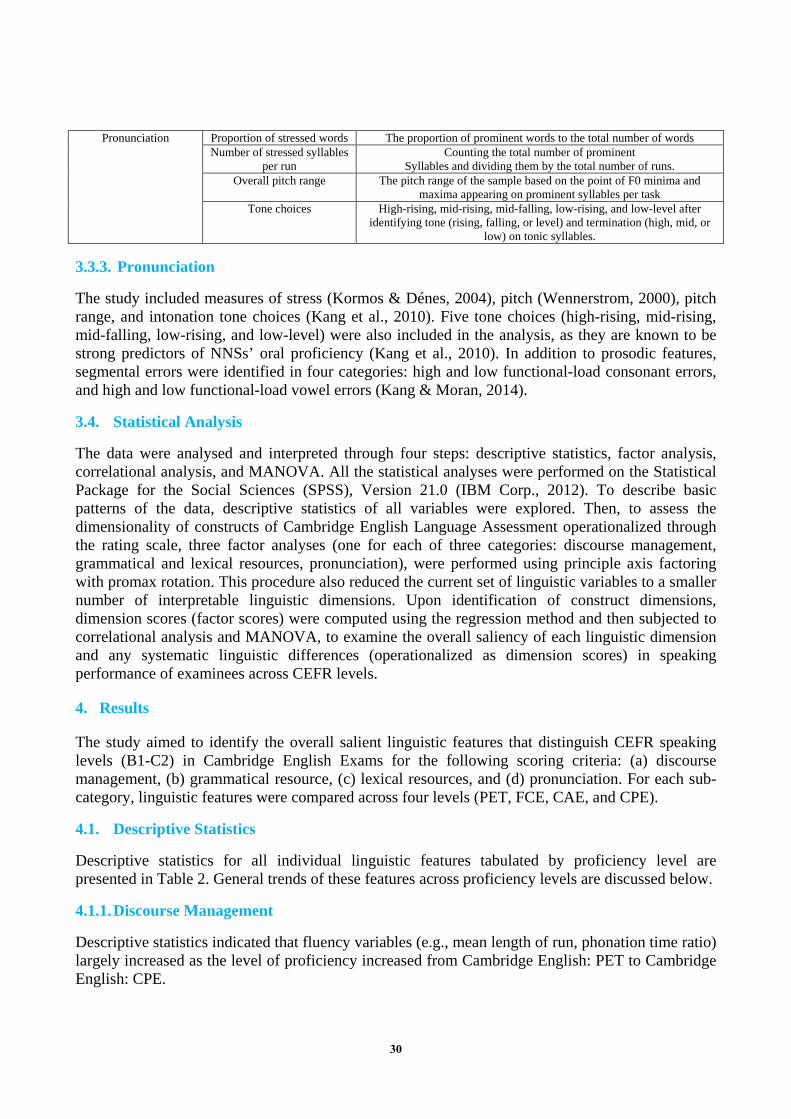
Pronunciation Proportion of stressed words The proportion of prominent words to the total number of words Number of stressed syllables
per run Counting the total number of prominent
Syllables and dividing them by the total number of runs. Overall pitch range The pitch range of the sample based on the point of F0 minima and
maxima appearing on prominent syllables per task Tone choices High-rising, mid-rising, mid-falling, low-rising, and low-level after
identifying tone (rising, falling, or level) and termination (high, mid, or low) on tonic syllables.
3.3.3. Pronunciation
The study included measures of stress (Kormos & Dénes, 2004), pitch (Wennerstrom, 2000), pitch range, and intonation tone choices (Kang et al., 2010). Five tone choices (high-rising, mid-rising, mid-falling, low-rising, and low-level) were also included in the analysis, as they are known to be strong predictors of NNSs’ oral proficiency (Kang et al., 2010). In addition to prosodic features, segmental errors were identified in four categories: high and low functional-load consonant errors, and high and low functional-load vowel errors (Kang & Moran, 2014).
3.4. Statistical Analysis
The data were analysed and interpreted through four steps: descriptive statistics, factor analysis, correlational analysis, and MANOVA. All the statistical analyses were performed on the Statistical Package for the Social Sciences (SPSS), Version 21.0 (IBM Corp., 2012). To describe basic patterns of the data, descriptive statistics of all variables were explored. Then, to assess the dimensionality of constructs of Cambridge English Language Assessment operationalized through the rating scale, three factor analyses (one for each of three categories: discourse management, grammatical and lexical resources, pronunciation), were performed using principle axis factoring with promax rotation. This procedure also reduced the current set of linguistic variables to a smaller number of interpretable linguistic dimensions. Upon identification of construct dimensions, dimension scores (factor scores) were computed using the regression method and then subjected to correlational analysis and MANOVA, to examine the overall saliency of each linguistic dimension and any systematic linguistic differences (operationalized as dimension scores) in speaking performance of examinees across CEFR levels.
4. Results
The study aimed to identify the overall salient linguistic features that distinguish CEFR speaking levels (B1-C2) in Cambridge English Exams for the following scoring criteria: (a) discourse management, (b) grammatical resource, (c) lexical resources, and (d) pronunciation. For each sub-category, linguistic features were compared across four levels (PET, FCE, CAE, and CPE).
4.1. Descriptive Statistics
Descriptive statistics for all individual linguistic features tabulated by proficiency level are presented in Table 2. General trends of these features across proficiency levels are discussed below.
4.1.1. Discourse Management
Descriptive statistics indicated that fluency variables (e.g., mean length of run, phonation time ratio) largely increased as the level of proficiency increased from Cambridge English: PET to Cambridge English: CPE.
30
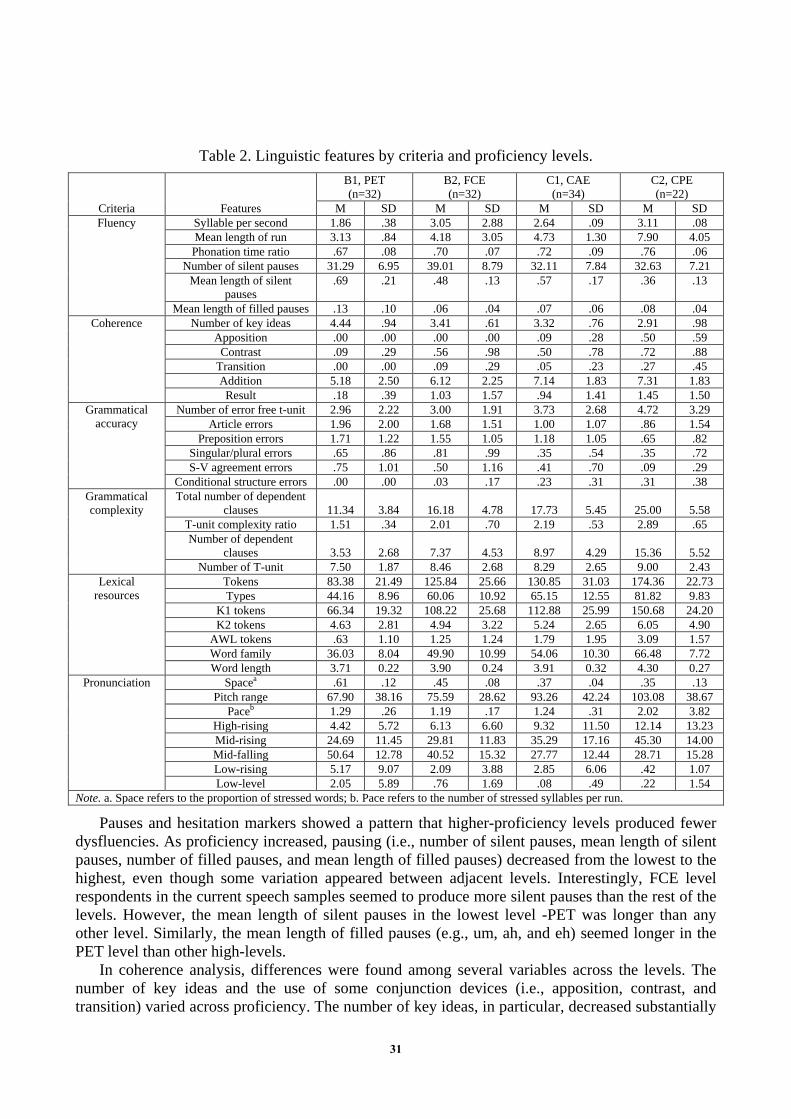
Table 2. Linguistic features by criteria and proficiency levels.
Criteria Features
B1, PET (n=32)
B2, FCE (n=32)
C1, CAE (n=34)
C2, CPE (n=22)
M SD M SD M SD M SD Fluency Syllable per second 1.86 .38 3.05 2.88 2.64 .09 3.11 .08
Mean length of run 3.13 .84 4.18 3.05 4.73 1.30 7.90 4.05 Phonation time ratio .67 .08 .70 .07 .72 .09 .76 .06
Number of silent pauses 31.29 6.95 39.01 8.79 32.11 7.84 32.63 7.21 Mean length of silent
pauses .69 .21 .48 .13 .57 .17 .36 .13
Mean length of filled pauses .13 .10 .06 .04 .07 .06 .08 .04 Coherence Number of key ideas 4.44 .94 3.41 .61 3.32 .76 2.91 .98
Apposition .00 .00 .00 .00 .09 .28 .50 .59 Contrast .09 .29 .56 .98 .50 .78 .72 .88
Transition .00 .00 .09 .29 .05 .23 .27 .45 Addition 5.18 2.50 6.12 2.25 7.14 1.83 7.31 1.83 Result .18 .39 1.03 1.57 .94 1.41 1.45 1.50
Grammatical accuracy
Number of error free t-unit 2.96 2.22 3.00 1.91 3.73 2.68 4.72 3.29 Article errors 1.96 2.00 1.68 1.51 1.00 1.07 .86 1.54
Preposition errors 1.71 1.22 1.55 1.05 1.18 1.05 .65 .82 Singular/plural errors .65 .86 .81 .99 .35 .54 .35 .72 S-V agreement errors .75 1.01 .50 1.16 .41 .70 .09 .29
Conditional structure errors .00 .00 .03 .17 .23 .31 .31 .38 Grammatical complexity
Total number of dependent clauses 11.34 3.84 16.18 4.78 17.73 5.45 25.00 5.58
T-unit complexity ratio 1.51 .34 2.01 .70 2.19 .53 2.89 .65 Number of dependent
clauses 3.53 2.68 7.37 4.53 8.97 4.29 15.36 5.52 Number of T-unit 7.50 1.87 8.46 2.68 8.29 2.65 9.00 2.43
Lexical resources
Tokens 83.38 21.49 125.84 25.66 130.85 31.03 174.36 22.73 Types 44.16 8.96 60.06 10.92 65.15 12.55 81.82 9.83
K1 tokens 66.34 19.32 108.22 25.68 112.88 25.99 150.68 24.20 K2 tokens 4.63 2.81 4.94 3.22 5.24 2.65 6.05 4.90
AWL tokens .63 1.10 1.25 1.24 1.79 1.95 3.09 1.57 Word family 36.03 8.04 49.90 10.99 54.06 10.30 66.48 7.72 Word length 3.71 0.22 3.90 0.24 3.91 0.32 4.30 0.27
Pronunciation Spacea .61 .12 .45 .08 .37 .04 .35 .13 Pitch range 67.90 38.16 75.59 28.62 93.26 42.24 103.08 38.67
Paceb 1.29 .26 1.19 .17 1.24 .31 2.02 3.82 High-rising 4.42 5.72 6.13 6.60 9.32 11.50 12.14 13.23 Mid-rising 24.69 11.45 29.81 11.83 35.29 17.16 45.30 14.00 Mid-falling 50.64 12.78 40.52 15.32 27.77 12.44 28.71 15.28 Low-rising 5.17 9.07 2.09 3.88 2.85 6.06 .42 1.07 Low-level 2.05 5.89 .76 1.69 .08 .49 .22 1.54
Note. a. Space refers to the proportion of stressed words; b. Pace refers to the number of stressed syllables per run.
Pauses and hesitation markers showed a pattern that higher-proficiency levels produced fewer dysfluencies. As proficiency increased, pausing (i.e., number of silent pauses, mean length of silent pauses, number of filled pauses, and mean length of filled pauses) decreased from the lowest to the highest, even though some variation appeared between adjacent levels. Interestingly, FCE level respondents in the current speech samples seemed to produce more silent pauses than the rest of the levels. However, the mean length of silent pauses in the lowest level -PET was longer than any other level. Similarly, the mean length of filled pauses (e.g., um, ah, and eh) seemed longer in the PET level than other high-levels.
In coherence analysis, differences were found among several variables across the levels. The number of key ideas and the use of some conjunction devices (i.e., apposition, contrast, and transition) varied across proficiency. The number of key ideas, in particular, decreased substantially
31
as proficiency increased. This means that compared to lower proficiency speakers, higher proficiency speakers might use longer or more complex sentences with multiple clauses to explain a relevant key topic so that, within a given time (1 minute), fewer topic changes might happen. Other conjunction devices (e.g., transition and addition) seemed to be used more frequently as candidates’ proficiency went up.
4.1.2. Grammatical and Lexical Resources
The descriptive statistics of most of the grammatical accuracy variables, except for tense, revealed that CPE is distinct from other levels, but the pattern is less clear at the adjacent levels (See Table 4 below), e.g., between B2 and C1. Not surprisingly, the number of error free t-units increased with proficiency. For linguistic variables such as articles, prepositions, singular/plural, and subject-verb agreement, the frequency of errors tended to decrease as proficiency increased. In contrast, grammatical errors in forming a conditional structure increased with proficiency.
The four grammatical complexity measures yielded positive results as shown in Table 2 below with descriptive statistics. The expected gradient of increasing complexity per level was found for most of the measures except for the total number of t-unit. Note that the t-unit complexity ratio refers to the number of clauses per unit. Features that appeared noticeably different across levels were the total number of clauses, t-unit complexity ratio, and the total number of clauses.
In terms of lexical resources, most of the variables indicated visible differences across levels. Firstly, an increase in proficiency level was associated with an increase in the number of words produced (tokens) and a wider range of words (type). At the CPE level, the word ranges and amount were substantially greater than the rest of the levels. However, when the level changed from FCE to CAE, these increases were only marginal.
A similar pattern was found with candidates’ use of the first 1000 words, word families, and the use of academic words. The frequencies of these features increased greatly as proficiency improved. Finally, words chosen by high-proficiency candidates seemed longer than those by low-proficiency candidates.
4.1.3. Pronunciation Analysis
As proficiency increased, the proportion of stressed words showed some decrease especially between PET to FCE and from CAE to CPE. Low-proficiency speakers might place stress on words (regardless of their functions) more frequently than high-proficiency speakers. The overall pitch range increased greatly at the higher CEFR levels. Lower proficiency speakers in the levels of PET and FCE had a more restricted pitch range than speakers in the advanced levels in CAE and CPE. The study also examined five tone choices. Mid-rising and high-rising tones were notably and positively associated with proficiency; i.e., the use of mid- and high-rising tones increased substantially as levels went up. In contrast, falling or level tones were more frequently used by low proficient speakers.
32
4.2. Factor Analysis
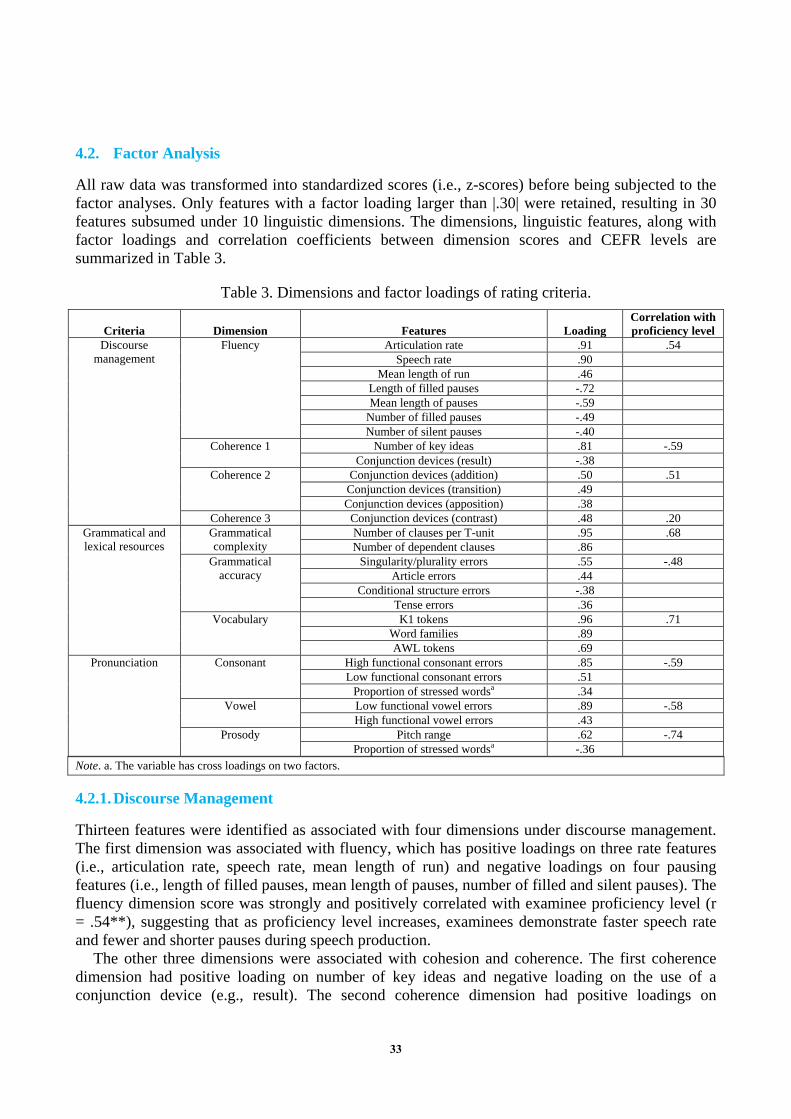
All raw data was transformed into standardized scores (i.e., z-scores) before being subjected to the factor analyses. Only features with a factor loading larger than |.30| were retained, resulting in 30 features subsumed under 10 linguistic dimensions. The dimensions, linguistic features, along with factor loadings and correlation coefficients between dimension scores and CEFR levels are summarized in Table 3.
Table 3. Dimensions and factor loadings of rating criteria.
Criteria Dimension Features Loading Correlation with proficiency level
Discourse management
Fluency Articulation rate .91 .54 Speech rate .90
Mean length of run .46 Length of filled pauses -.72 Mean length of pauses -.59
Number of filled pauses -.49 Number of silent pauses -.40
Coherence 1 Number of key ideas .81 -.59 Conjunction devices (result) -.38
Coherence 2 Conjunction devices (addition) .50 .51 Conjunction devices (transition) .49 Conjunction devices (apposition) .38
Coherence 3 Conjunction devices (contrast) .48 .20 Grammatical and lexical resources
Grammatical complexity
Number of clauses per T-unit .95 .68 Number of dependent clauses .86
Grammatical accuracy
Singularity/plurality errors .55 -.48 Article errors .44
Conditional structure errors -.38 Tense errors .36
Vocabulary K1 tokens .96 .71 Word families .89 AWL tokens .69
Pronunciation Consonant High functional consonant errors .85 -.59 Low functional consonant errors .51
Proportion of stressed wordsa .34 Vowel Low functional vowel errors .89 -.58
High functional vowel errors .43 Prosody Pitch range .62 -.74
Proportion of stressed wordsa -.36 Note. a. The variable has cross loadings on two factors.
4.2.1. Discourse Management
Thirteen features were identified as associated with four dimensions under discourse management. The first dimension was associated with fluency, which has positive loadings on three rate features (i.e., articulation rate, speech rate, mean length of run) and negative loadings on four pausing features (i.e., length of filled pauses, mean length of pauses, number of filled and silent pauses). The fluency dimension score was strongly and positively correlated with examinee proficiency level (r = .54**), suggesting that as proficiency level increases, examinees demonstrate faster speech rate and fewer and shorter pauses during speech production.
The other three dimensions were associated with cohesion and coherence. The first coherence dimension had positive loading on number of key ideas and negative loading on the use of a conjunction device (e.g., result). The second coherence dimension had positive loadings on
33
conjunction devices (e.g., addition, transition, and apposition), and the third coherence dimension was positively associated with a conjunction device (e.g., contrast).
As to dimension scores, the first coherence dimension score was negatively correlated with examinee proficiency level (r = -.59**), suggesting that higher proficiency speakers tend to present fewer ideas in short speech, but they tend to be more capable of developing and advancing ideas or arguments using causal conjunction devices. On the other hand, the second and third coherence dimension scores were positively associated with examinee proficiency level (r = .51**; r = .20*), suggesting that higher proficiency speakers tend to use more conjunction devices of various types to connect ideas within speech. Taken together, the cohesion and coherence dimensions seem to suggest that higher proficiency speakers tend not present a large number of ideas in a single speech, but, when they do, they tend to be more capable of using different types conjunction devices to develop and connect those ideas, to make the speech more coherent.
4.2.2. Grammatical and Lexical Resources
Three dimensions were identified for grammatical and lexical resources: grammatical complexity, grammatical accuracy, and vocabulary range. The grammatical complexity dimension had positive loadings on number of clause per T-unit and total number of dependent clauses. The correlation between grammatical complexity dimension score and proficiency level was strong and positive (r = .68**), suggesting that as examinees’ proficiency level increases, they tend to produce more complex sentences with dependent clauses. In contrast, the grammatical accuracy dimension was positively associated with different types of grammatical errors (i.e., singular/plural errors, article errors, tense errors). The fact that accuracy dimension score was negatively correlated with examinee proficiency level suggests that higher proficiency speakers tend to be more capable of controlling grammatical accuracy, producing fewer errors during speech production.
The vocabulary range dimension had positive loadings on K1 tokens, word families, and AWL tokens. This dimension was strongly and positively correlated with proficiency level, suggesting that higher proficiency speakers tend to use more academic words and words from the K1 word frequency band.
4.2.3. Pronunciation
The pronunciation features were grouped into three dimensions based on factor loadings: consonant errors, vowel errors, and prosody. While the first two dimensions were associated with high and low functional consonant or vowel errors, the prosody dimension was negatively associated with the proportion of stressed words but positively associated with pitch range. In terms of dimension scores, both consonant and vowel error dimensions were negatively correlated with examinee proficiency level, suggesting that as proficiency increases, examinees produce fewer pronunciation errors. The prosody dimension score was also negatively correlated with proficiency level, suggesting that higher proficiency speakers displayed a wider pitch range and smaller proportion of stressed words. These results suggest that speakers of higher proficiency tend to be more capable of producing English sounds accurately and tend to use stress and intonation patterns more effectively to making meanings during speech production.
4.3. MANOVA
A one-way MANOVA of the dimension scores among the speech samples revealed a strong multivariate main effect for proficiency level, Wilks’ λ = .12, F(30, 276.59) = 9.76, p < .001, η2 = .51. Given the significance of the overall test, the univariate main effects were examined, with results summarized in Table 4. Significant univariate main effects for proficiency level were
34
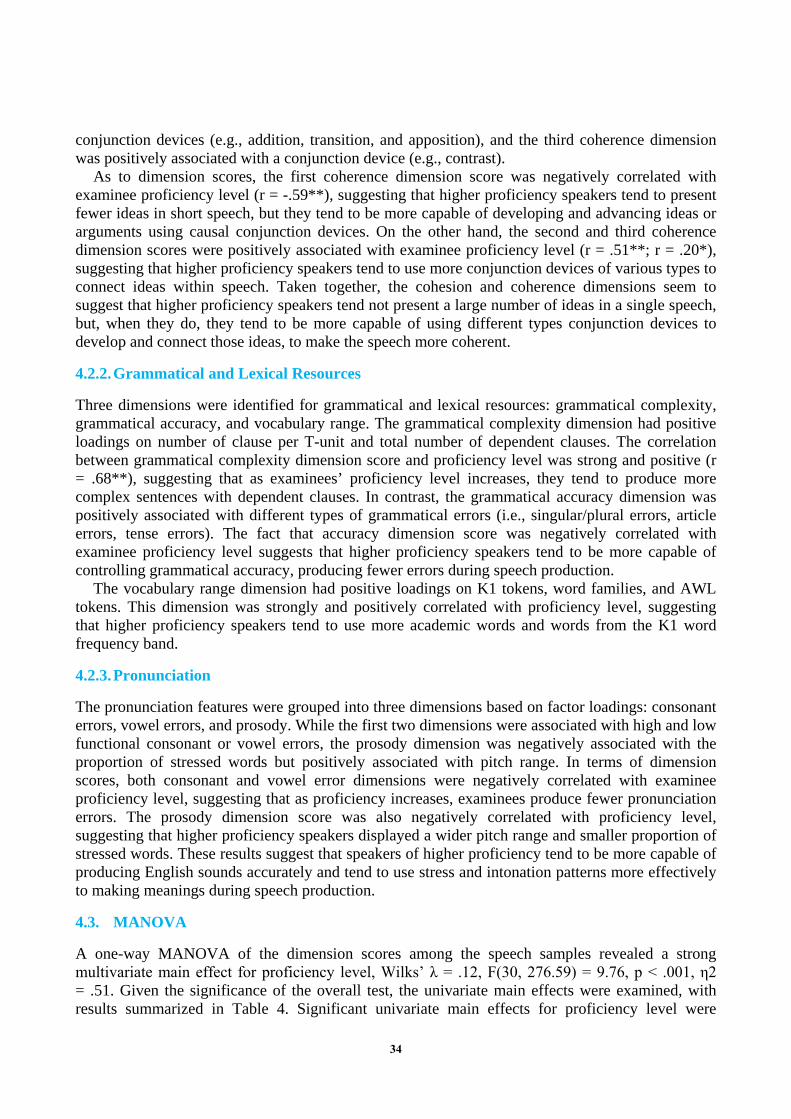
obtained for all dimensions except the Coherence 3 dimension, F(3,103) = 2.60, p = .06, η2 =.07). These results suggest that there are significant differences between at least two proficiency levels on the majority of the linguistic dimensions, although Tukey’s post-hoc comparisons indicate that distinctions in linguistic dimensions across levels differ depending on the levels of comparison.
Table 4. Univariate ANOVAs of dimension scores across proficiency levels.
Dimension df F p Partial η2 Tukey’s post-hoc
comparison Fluency (3, 103) 23.72 <.001 .41 1<23<4a
Coherence 1 (3, 103) 28.67 <.001 .46 1>234; 2>4 Coherence 2 (3, 103) 13.56 <.001 .28 123<4 Coherence 3 (3, 103) 2.60 .06 .07 -
Grammatical complexity (3, 103) 32.03 <.001 .48 1<23<4 Grammatical accuracy (3, 103) 14.41 <.001 .30 12>34
Vocabulary (3, 103) 39.93 <.001 .54 1<23<4 Pronunciation: Consonant (3, 103) 19.64 <.001 .36 1>234; 2>4
Pronunciation: Vowel (3, 103) 20.08 <.001 .37 1>234 Prosody (3, 103) 47.78 <.001 .58 1>2>34
Note. a. “<” and “>” represent significant differences.
As shown in Table 4, there are distinctive differences in more linguistic dimensions between high and low CEFR speaking levels (see columns 9-11) than between the adjacent levels (see columns 6-8). For comparisons of two groups that are two or three CEFR levels apart, significant differences can be observed in all dimensions, except the Coherence 3 dimension and the Coherence 2 dimension (between B1 and C1).
For adjacent level comparisons, speaking performance at B1 and B2 levels were significantly different on all four rating criteria, i.e., fluency, Coherence 1, grammatical complexity, vocabulary range, pronunciation accuracy, and prosody. Speaking performance at the C1 and C2 levels were distinguished on three rating criteria except pronunciation. Specifically, C2-level examinees performed significantly better on fluency, Coherence 2, grammatical complexity, and vocabulary. In contrast, the differences between B2 and C1 were the least distinctive, with the two groups performing distinctively only on grammatical accuracy and prosody. Taken together, the post-hoc comparisons suggest that speaking scores on the Cambridge English Language Assessment series reflect the constructs measured by the rating scale, although performance across different CEFR levels are distinguished by different linguistic dimensions. Moreover, when proficiency difference reaches two or more CEFR levels, the speaking performance can be distinguished in all rating criteria.
5. Discussion
The current study has attempted to illustrate linguistic features in speaking performances that can distinguish the different CEFR levels. Overall findings suggest that there are distinctive differences in linguistic features across CEFR speaking levels (PET, FCE, CAE, and CPE).
First, descriptive statistics of most variables in the four scoring criteria indicate observable differences across CEFR speaking levels. Speech rate measures (syllable per second, mean length of run, and phonation time ratio), as a part of discourse management, largely increased as candidates’ proficiency level increased. Additionally, the general decrease pattern of paused and hesitation markers (# of silent pauses, mean length of silent pauses, # of filled pauses, and mean length of filled pauses) also adds evidence to the increasing fluency among higher-proficiency candidates. In other words, proficient candidates produced more syllables per second, and longer utterances between major pauses, and used less silent pauses and hesitation markers.
35
In terms of coherence measures, while the number of key ideas substantially dropped with the increase of proficiency, certain conjunction devices (i.e. apposition, contrast, and transition) were more frequently found among higher-proficiency speakers than lower-proficiency speakers. This finding is understandable particularly because less competent speakers may not be able to elaborate ideas in detail, which leads them to changing topics frequently.
Finding of grammatical measures reflected the complexity of utterances at both levels of clause relations and within-sentence sophistication (e.g., Brown et al., 2005). These results concur with the findings of previous studies with written texts concluding that advanced learners used more features such as be-copula as the main verb (Hinkel, 2003) or pronoun, hedges, verbs, subordinators (Espada-Gustilo, 2011, Grant & Ginther, 2000). Meanwhile, lower-level learners relied more on simpler linguistic features linked by “and” or “but”.
As for grammatical accuracy, error rates of some features (e.g., number of error free T-units, articles, prepositions, singular/plural, and subject-verb agreement) dropped as proficiency went up. That is, learners may be more aware of these higher-frequency grammatical features as their proficiency improves. One the other hand, grammatical errors in certain features (e.g., formation of conditional structure) increased with proficiency. This is the tension between complexity and accuracy. This complex feature was not found at the low level as candidates might avoid using it or not hold ability. As candidates with higher proficiency level attempted to take more risks when speaking, their accuracy may decrease.
The results of the lexical analysis also revealed noticeable patterns across four different levels. Increase in proficiency resulted in increase in the number of words produced (tokens) and a wider range of words (types). There was also a significant increase in the occurrences of the most frequent 1,000-word usage and academic word usage as proficiency levels improved. Most levels presented salient features that distinguished its level from others such as PET vs. FCE or CAE vs. CPE. However, distinctiveness of lexical features between FCE level and CAE level was less obvious.
Finally, in terms of pronunciation features, low proficiency speakers emphasized words with stress more frequently than high proficient speakers. Typically, low-proficient NNSs use primary stress on every lexical item, regardless of its function or semantic importance (Kang, 2010; Wennerstrom, 2000). In addition, lower proficient speakers in the levels of PET and FCE had a more restricted pitch range than speakers in CAE and CPE. Among the five tone choices, the findings corresponded to Kang et al.’s (2010) study. That is, while mid-rising and high-rising tones were positively associated with proficiency, mid-level and low-falling tones were negatively associated with proficiency. That is to say, candidates in CPE used a wide range of tone choices including native-like rising tones, whereas those in PET and FCE chose tones limitedly. Overall, these tone choice variables appeared to be good indicators of distinguishing candidates’ speaking performance across CEFR levels for the criterion of pronunciation.
We then conducted three factor analyses to reduce the wide array of linguistic features to 10 interpretable dimensions. These dimensions largely correspond to the scoring criteria used for the Cambridge speaking tests, providing empirical support for the validation of the scoring systems (e.g., the Cambridge English Assessment): fluency, coherence, lexical and grammatical resources, and pronunciation. These five features are uniformly valued by other high-stakes language tests such as TOEFL iBT or IELTS. For instance, the integrated speaking rubrics of TOEFL iBT describes a 4-point (the highest) performance as “speech is generally clear, fluid… exhibits sustained, coherent discourse … contains generally effective word choice …good control of basic and complex grammatical structures … minor difficulties with pronunciation or intonation…” (see TOEFL iBT integrated speaking rubrics). However, the current findings offer concrete examples to assess such broad aspects of rating criteria through such selected features.
36
While the overwhelming majority of the dimensions exhibit moderate to strong correlation with CEFR levels, there are distinctive differences in more linguistic dimensions between high and low CEFR speaking levels than between the adjacent levels. Moreover, different pairs of adjacent levels are distinguished by different dimensions. These dimensions can help raters to better understand the systematic linguistic differences characterizing speaking performance of each CEFR level. In addition, the fact that no single dimension can discriminate all CEFR levels (see Table 4) suggests that subcomponents of speaking ability develop at different rates and across different stages. Taken together, these findings provide important implications for language assessment and pedagogy, as well as theories of second language proficiency development, in particular with respect to oral proficiency.
6. Conclusion
As a preliminary process, the study sought to identify linguistic features that distinguish levels of candidates’ performances in one of the high-stakes speaking tests, i.e., the Cambridge English Language Assessment. The outcomes of the study have made two things explicit: (1) some of the salient linguistic features useful for distinguishing scoring criteria in tentatively defining certain criterial features at each level; and (2) objective (not impressionistic) differences between high-scoring performances and low-scoring performances.
However, the current study analysed speech data from one type of a monologic-speaking task, but did not explore any effect of topic difference. Interpretation should be made suggestive when applying the linguistic patterns addressed in this study to other speaking tasks such as paired or group interactions with different topics. In addition, linguistic measures included are comprehensive, yet not exhaustive, with regard to assessing L2 oral proficiency. Future research can further investigate other linguistic components such as content-related discourse features or segmental aspects of pronunciation in oral assessment. Finally, L1-specific linguistic analysis for each proficiency level is recommended.
Despite the limitations listed above, findings of this study yield several implications for L2 assessment and pedagogy. Specific linguistic features and their contribution to each proficiency level can be integrated in scoring descriptors in the Cambridge English Speaking tests and further inform the future development of automated scoring system. Features can be incorporated when expanding the scoring rubric to describe speaking performance in more detail. Moreover, salient features identified in this study (e.g., speech rate or the number of key ideas for discourse management; pitch range or number of stressed words for pronunciation; grammatical accuracy for grammatical resource; or a wide range of vocabulary for lexical resource) can inform rater training of L2 speaking assessment. In particular, novice raters would benefit from such detailed features because sometimes descriptors in scoring rubrics are often presented in general terms. Discrete linguistic features of candidates’ oral performance can facilitate the process of finding scoring benchmarks and help raters better understand the level-specific traits of speaking skills.
Finally, when NNSs’ specific linguistic features for each proficiency level are documented, concrete advice can be given to ESL/EFL teachers, so that students can better utilize their linguistic repertoires in high-stakes test situations. In teaching speaking, level-specific instruction is important (Bailey, 2005). Various linguistic features identified by proficiency level in the study can inform teachers to set level-specific goals for learners and develop their curriculum that are more descriptive and learner-oriented. Each of the isolated features can guide classroom instruction as learners can directly relate their performance to those features addressed.
37
Acknowledgements
This work was entirely supported by the Cambridge ESOL Funded Research Program Round 2 [Grant number 11.0285].
References
[1] American Council on the Teaching of Foreign Languages. (2012). ACTFL Proficiency Guidelines—Speaking. Retrieved October 12, 2012, from http://www.actfl.org/sites/default/files/pdfs/public/ACTFLProficiencyGuidelines2012_FINAL.pdf
[2] Anderson-Hsieh, J., Johnson, K., & Koehler, K. (1992). The relationship between native speaker judgments of non-native pronunciation and deviance in segmentals, prosody, and syllablestructure. Language Learning, 42, 529-555.
[3] Bachman, L.F. (1990). Fundamental considerations in language testing. Oxford, UK: Oxford University Press. [4] Bailey, K. M. (2005). Practical English language teaching: Speaking. New York, NY: McGraw-Hill. [5] Biber, D., Johansson, S., Leech, G., Conrad, S., & Finnegan, E. (1999). Longman Grammar of Spoken and Written
English. Essex: Pearson Education Limited. Educational Testing Service. [6] Boersma, P., &Weenink, D. (2007). Praat, http://www.praat.org (Version 4.5.25). [7] Brazil, D. (1997). The communicative value of intonation in English. Cambridge, UK: Cambridge University Press. [8] Brown, A. (2006). Candidate discourse in the revised IELTS Speaking Test. In P. McGovern & S. Walsh (Eds.),
IELTS research reports 2006 (pp.71-89). Canberra & Manchester: IELTS Australia and British Council. [9] Brown, A., Iwashita, N., & McNamara, T. (2005). An examination of rater orientations and test taker performance
on English-for-Academic-Purpose speaking tasks (TOEFL Monograph No. 29). Princeton, NJ: Educational Testing Service.
[10] Carroll, B. J. (1980). Testing communicative performance. Oxford, UK: Pergamon Press. [11] Cobb, T. (2002). The Web Vocabulary Profile. http://www.er.uqam.ca/nobel/r21270/textools/web_vp.html [12] Davies, A. (2008). Assessing academic English: Testing English proficiency 1950-1989 – the IELTS solution,
Studies in Language Testing 23, UCLES/Cambridge University Press, Cambridge [13] de Jong, N.H., Steinel, M.P., Florijn, A.F., Schoonen, R. & Hulstijn, J. H. (2012). Facets of speaking proficiency.
Studies in Second Language Acquisition, 34, 5-34. [14] de Jong, N., Groenhout, R., Schoonen, R., and Hulstijn, J. H. (2012). L2 fluency: speaking style or proficiency?
Correcting measures of L2 fluency for L1behavior, Applied Psycholinguistics. Retrieved from http://www.academia.edu/2240591/L2_fluency_speaking_style_or_proficiency_Correcting_measures_of_L2_fluency_for_L1_behavior.
[15] Douglas, D., & Selinker, L. (1993). Performance on a general versus a field-specific test of speaking proficiency by international teaching assistants. In D. Douglas, & C. Chapelle (Eds), A new decade of language testing research (pp. 235-256). Alexandria, VA: TESOL.
[16] Douglas, D., & Smith, J. (1997). Theoretical underpinnings of the Test of Spoken English revision project. Princeton, NJ: Educational Testing Service.
[17] Espada-Gustilo., L. (2011). Linguistic features that impact essay scores: A corpus linguistic analysis of ESL writing in three proficiency levels. The Southeast Asian Journal of English Language Studies, 17 (1), 55-64.
[18] Galaczi, E.D., & ffrench, A. (2011): Context validity of Cambridge ESOL speaking tests. In L. Taylor (Ed.), Examining speaking (Vol. 30). Cambridge, UK: Cambridge University Press.
[19] Galaczi, E. D., Post, B., Li, A., & Graham, C. (2011). Measuring L2 English phonological proficiency: Implications for language assessment, in Proceedings of the British Association of Applied Linguistics, 67-72.
[20] Ginther, A., Dimova, S., & Yang, R. (2010). Conceptual and empirical relationships between temporal measures of fluency and oral English proficiency with implications for automated scoring. Language Testing, 27(3), 379-399.
[21] Grant, L., & Ginther, A. (2000). Using computer-tagged linguistic features to describe L2 writing differences. Journal of Second Language Writing, 9 (2), 123-145.
[22] Hawkins, J. A., & Filipović, L. (2012). Criterial Features in L2 English: Specifying the reference levels of the Common European Framework, English Profile Studies volume 1, Cambridge: UCLES/Cambridge University Press.
[23] Hahn, L. D. (2004). Primary stress and intelligibility: Research to motivate the teaching of suprasegmentals. TESOL Quarterly, 38, 201–223.
[24] Hewings, M. (1995). Tone choice in the English intonation of non-native speakers. The International Review of Applied Linguistics, 33, 251-265.
[25] Hinkel, E. (2003). Simplicity without elegance: Features of sentences in L1 and L2 academic texts. TESOL Quarterly, 37(2), 275-301.
38
[26] International English Language Testing System (2012). IELTS Speaking band descriptors (public version).Retrieved October 15, 2012 fromhttps://www.teachers.cambridgeesol.org/ts/digitalAssets/114292_IELTS_Speaking_Band_Descriptors.pdf
[27] Isaacs, T. (2008). Towards defining a valid assessment criterion of pronunciation proficiency in non-nativeEnglish-speaking graduate students. The Canadian Modern Language Review, 64, 555–580.
[28] Iwashita, N., Brown, A., McNamara, T., & O’Hagan, S. (2008). Assessed levels of second language speakingproficiency: How distinct? Applied Linguistics, 29 (1), 24-49.
[29] Jamieson, J., & Poonpon, K. (2013). Developing analytic scoring guides for TOEFL iBT’s Speaking Measure.TOEFL Monograph Series. RR-13-13.
[30] Jin, T., & Mak, B. (2013). Distinguishing features in scoring L2 Chinese speaking performance: How do they work?Language Testing, 30 (1), 23-47.
[31] Jin, T., Mak, B., & Zhou, P. (2012). Confidence scoring of speaking performance: How does fuzziness becomeexact? Language Testing, 29(1), 43–65.
[32] Kang, O. (2010). Relative salience of suprasegmental features on judgments of L2 comprehensibility andaccentedness. System, 38(2), 301-315.
[33] Kang, O., & Johnson, D. (2018). The roles of suprasegmental features in predicting English oral proficiency withan automated system. Language Assessment Quarterly, 15 (2), 150-168.
[34] Kang, O., & Moran, M. (2014). Functional loads of pronunciation features in non-native speakers' oralassessment. TESOL Quarterly , 48(1), 176-187.
[35] Kang, O., Rubin, D., Pickering, L. (2010). Suprasegmental measures of accentedness and judgments of languagelearner proficiency in oral English. Modern Language Journal, 94, 554-566.
[36] Kormos, J., & Dénes, M. (2004). Exploring measures and perceptions of fluency in the speech of second languagelearners. System, 32, 145–164.
[37] Lee, J-W., & Schallert, D. L. (1997). The relative contribution of L2 language proficiency and L1 reading abilityto L2 reading performance: A test of the threshold hypothesis in an EFL context. TESOL Quarterly, 31, 713-739.
[38] Lu, X. (2012). The relationship of lexical richness to the quality of ESL learners’ oral narratives. The ModernLanguage Journal, 96 (2), 190-208.
[39] Malvern, D., & Richards, B. (2002). Investigating accommodation in language proficiency interviews using a newmeasure of lexical diversity. Language Testing, 19(1), 85–104.
[40] Munro, M. J., &Derwing, T. M. (2001). Modelling perceptions of the accentedness and comprehensibility of L2speech: The role of speaking rate. Studies of Second Language Acquisition, 23, 451–468.
[41] Nakatsuhara, F. (2006). The impact of proficiency-level on conversational styles in paired speaking tests.Research Notes, 25, 15-20.
[42] Pearson. (2011). Versant English Test: Test description and validation summary. Pearson KnowledgeTechnologies, Palo Alto, CA. Retrievedfrom http://www.versanttest.com/technology/VersantEnglishTestValidation.pdf
[43] Pickering, L. (2001). The role of tone choice in improving ITA communication in the classroom. TESOL Quarterly35, 233-255.
[44] Skehan, P., &Foster, P. (1999). The influence of task structure and processing conditions on narrative retellings.Language Learning, 49(1), 93-120.
[45] Staples, S., Laflair, G. T., & Egbert, J. (2017). Comparing language use in oral proficiency interviews to targetdomains: Conversational, academic, and professional discourse. The Modern Language Journal, 101(1), 194-213.
[46] Sun, Y. (2011). The influence of the social interactional context on test performance: A sociocultural view. TheCanadian Journal of Applied Linguistics, 14 (1), 194-221.
[47] Syakur. (1987). Language Testing and Evaluation. Surakarta: SebelasMaret University Press[48] Taylor, L. (2001). Revising the IELTS Speaking test: Developments in test format and task design. Research Notes,
5, 3-5.[49] Taylor, L. (2011). Examining speaking: Research and practice in assessing second language speaking. Cambridge:
Cambridge University Press.[50] UCLES (2011). Cambridge English: Proficiency specifications and sample papers. Retrieved October 16, 2012
fromhttp://www.cambridgeesol.org/assets/pdf/exams/cpe/cpe-spec-2013.pdf[51] University of Cambridge ESOL Examination (2011). Using the CEFR: Principles of good practice. Retrieved
from http://www.cambridgeenglish.org/research-and-validation/fitness-for-purpose/[52] Wennerstrom, A. (1994). Intonational meaning in English discourse: A study of nonnative speakers. Applied
Linguistics, 15, 399-421.[53] Wennerstrom, A.(2000). The role of intonation in second language fluency. In Riggenbach, H. (Ed.), Perspectives
on Fluency (pp.102-127). University of Michigan Press, Ann Arbor.[54] Yu, G. (2010). Lexical diversity in writing and speaking task performances. Applied Linguistics, 31(2), 236-259.
39