LINERS AND COVERS FOR WASTE CONTAINMENT: · PDF fileAlternative covers now being used in drier...
41
Proc. Fourth Kansai Intl. Geotechnical Forum, Creation of a New Geo-Environmental, Japanese Geotechnical Society, Kyoto, Japan, May 24-26, 2000, 1-40 1 LINERS AND COVERS FOR WASTE CONTAINMENT Craig H. Benson Professor, Geoengineering Program Dept. of Civil and Environmental Engineering, Geological Engineering University of Wisconsin-Madison Madison, Wisconsin 53706 USA [email protected] Abstract: This paper provides a comprehensive review of the technology associated with liners and covers used for waste containment systems. A historical perspective is used to discuss the key issues influencing design and selection and the key factors affecting performance. Case histories and example data from the literature are used to illustrate important points. Specifications based on achieving a desired performance are discussed, as is performance-based design of landfill liners. Alternative covers now being used in drier regions are also discussed and design procedures for selecting layer thicknesses are presented. 1 INTRODUCTION Engineering of waste containment facilities such as solid and hazardous waste landfills, liquid impoundments, and mine waste repositories began in the 1970s with the introduction of clay liners and clay caps. The overall objective was to limit discharge of toxic contaminants to groundwater. This objective has not changed over the years. However, liner and cover design has undergone great change, with new materials being introduced and new design philosophies being adopted. These changes have occurred as a result of many factors, most important being the desire to further reduce the discharge of contaminants to groundwater while employing technology that is both cost effective and practical. This paper provides a comprehensive review of liner and cover systems for waste containment, with emphasis on the lessons learned and future directions. Most of the paper is derived from the research and consulting engineering experience accrued by the author while dealing with liners and covers extensively during the 1980s and 1990s. The paper is divided into two main sections, one on liners and the other on covers. Although liners are discussed first, liners and covers are equally important. Liners provide the final line of defense against groundwater contamination. Covers provide long-term control of percolation into the waste, and thus control the generation of leachate. Thus, both liners and covers have an essential role in protecting groundwater resources. 2 LINERS Lining systems can vary significantly in complexity (Fig. 1). The simplest lining systems consist of a compacted clay or geomembrane liner overlain by a granular collection layer (Fig. 1a). A more sophisticated and effective lining system incorporates a composite liner (Fig. 1b) comprised of a geomembrane placed directly on top of a clay liner (or other type of soil liner). Composite liners are now the most common liners used for municipal solid waste (MSW) landfills. Redundant lining systems incorporating one or more liners are also used (Fig. 1c), primarily for sites where the risks are great [e.g., hazardous waste landfills or corrective action management units (CAMUs) at remediation sites]. For example, liquid wastes from pesticide and chemical warfare agents are being disposed in a
-
Upload
nguyenthuy -
Category
Documents
-
view
216 -
download
1
Transcript of LINERS AND COVERS FOR WASTE CONTAINMENT: · PDF fileAlternative covers now being used in drier...

Proc. Fourth Kansai Intl. Geotechnical Forum, Creation of a New Geo-Environmental, Japanese Geotechnical Society, Kyoto, Japan, May 24-26, 2000, 1-40
1
LINERS AND COVERS FOR WASTE CONTAINMENT
Craig H. Benson
Professor, Geoengineering Program Dept. of Civil and Environmental Engineering, Geological Engineering
University of Wisconsin-Madison Madison, Wisconsin 53706 USA
Abstract: This paper provides a comprehensive review of the technology associated with liners and covers used for waste containment systems. A historical perspective is used to discuss the key issues influencing design and selection and the key factors affecting performance. Case histories and example data from the literature are used to illustrate important points. Specifications based on achieving a desired performance are discussed, as is performance-based design of landfill liners. Alternative covers now being used in drier regions are also discussed and design procedures for selecting layer thicknesses are presented.
1 INTRODUCTION Engineering of waste containment facilities such as solid and hazardous waste landfills, liquid impoundments, and mine waste repositories began in the 1970s with the introduction of clay liners and clay caps. The overall objective was to limit discharge of toxic contaminants to groundwater. This objective has not changed over the years. However, liner and cover design has undergone great change, with new materials being introduced and new design philosophies being adopted. These changes have occurred as a result of many factors, most important being the desire to further reduce the discharge of contaminants to groundwater while employing technology that is both cost effective and practical. This paper provides a comprehensive review of liner and cover systems for waste containment, with emphasis on the lessons learned and future directions. Most of the paper is derived from the research and consulting engineering experience accrued by the author while dealing with liners and covers extensively during the 1980s and 1990s. The paper is divided into two main sections, one on liners and the other on covers. Although liners are discussed first, liners and covers are equally
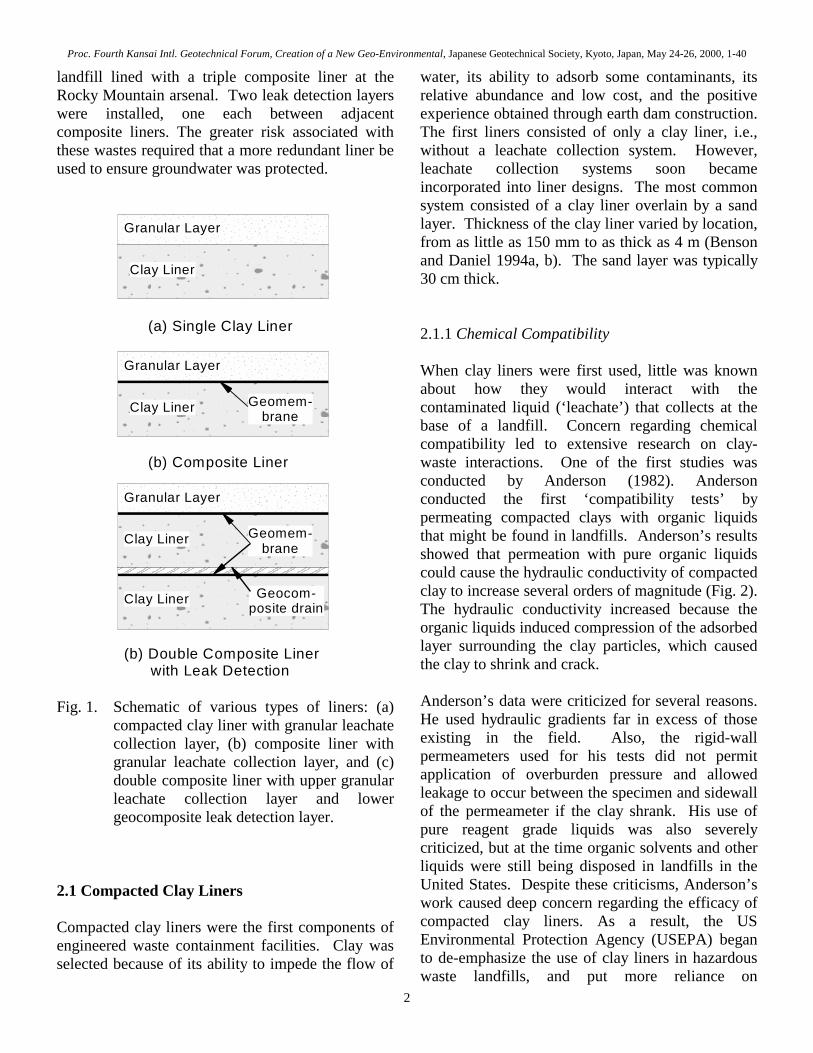
important. Liners provide the final line of defense against groundwater contamination. Covers provide long-term control of percolation into the waste, and thus control the generation of leachate. Thus, both liners and covers have an essential role in protecting groundwater resources. 2 LINERS Lining systems can vary significantly in complexity (Fig. 1). The simplest lining systems consist of a compacted clay or geomembrane liner overlain by a granular collection layer (Fig. 1a). A more sophisticated and effective lining system incorporates a composite liner (Fig. 1b) comprised of a geomembrane placed directly on top of a clay liner (or other type of soil liner). Composite liners are now the most common liners used for municipal solid waste (MSW) landfills. Redundant lining systems incorporating one or more liners are also used (Fig. 1c), primarily for sites where the risks are great [e.g., hazardous waste landfills or corrective action management units (CAMUs) at remediation sites]. For example, liquid wastes from pesticide and chemical warfare agents are being disposed in a
Proc. Fourth Kansai Intl. Geotechnical Forum, Creation of a New Geo-Environmental, Japanese Geotechnical Society, Kyoto, Japan, May 24-26, 2000, 1-40
2
landfill lined with a triple composite liner at the Rocky Mountain arsenal. Two leak detection layers were installed, one each between adjacent composite liners. The greater risk associated with these wastes required that a more redundant liner be used to ensure groundwater was protected.
(a) Single Clay Liner
(b) Composite Liner
(b) Double Composite Liner with Leak Detection
Clay Liner
Granular Layer
Clay Liner
Granular Layer
Geomem-brane
Clay Liner
Granular Layer
Geomem-brane
Clay Liner Geocom-posite drain
Fig. 1. Schematic of various types of liners: (a)
compacted clay liner with granular leachate collection layer, (b) composite liner with granular leachate collection layer, and (c) double composite liner with upper granular leachate collection layer and lower geocomposite leak detection layer.
2.1 Compacted Clay Liners Compacted clay liners were the first components of engineered waste containment facilities. Clay was selected because of its ability to impede the flow of
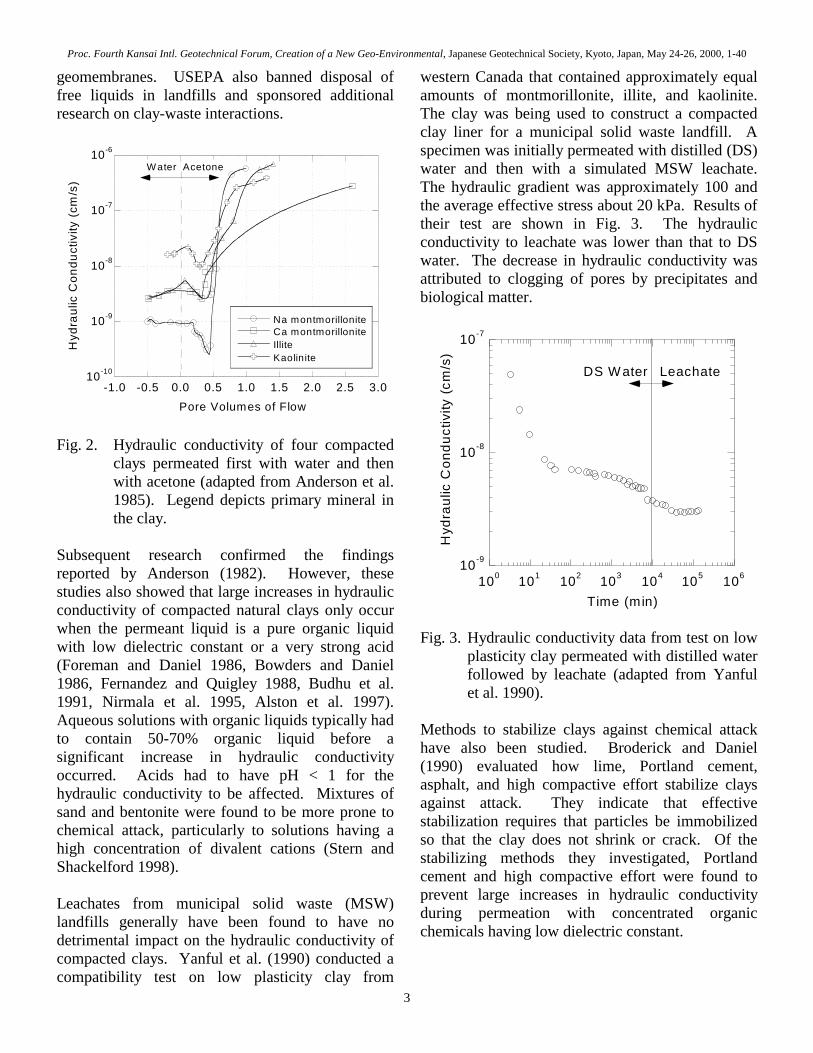
water, its ability to adsorb some contaminants, its relative abundance and low cost, and the positive experience obtained through earth dam construction. The first liners consisted of only a clay liner, i.e., without a leachate collection system. However, leachate collection systems soon became incorporated into liner designs. The most common system consisted of a clay liner overlain by a sand layer. Thickness of the clay liner varied by location, from as little as 150 mm to as thick as 4 m (Benson and Daniel 1994a, b). The sand layer was typically 30 cm thick. 2.1.1 Chemical Compatibility When clay liners were first used, little was known about how they would interact with the contaminated liquid (‘leachate’) that collects at the base of a landfill. Concern regarding chemical compatibility led to extensive research on clay-waste interactions. One of the first studies was conducted by Anderson (1982). Anderson conducted the first ‘compatibility tests’ by permeating compacted clays with organic liquids that might be found in landfills. Anderson’s results showed that permeation with pure organic liquids could cause the hydraulic conductivity of compacted clay to increase several orders of magnitude (Fig. 2). The hydraulic conductivity increased because the organic liquids induced compression of the adsorbed layer surrounding the clay particles, which caused the clay to shrink and crack. Anderson’s data were criticized for several reasons. He used hydraulic gradients far in excess of those existing in the field. Also, the rigid-wall permeameters used for his tests did not permit application of overburden pressure and allowed leakage to occur between the specimen and sidewall of the permeameter if the clay shrank. His use of pure reagent grade liquids was also severely criticized, but at the time organic solvents and other liquids were still being disposed in landfills in the United States. Despite these criticisms, Anderson’s work caused deep concern regarding the efficacy of compacted clay liners. As a result, the US Environmental Protection Agency (USEPA) began to de-emphasize the use of clay liners in hazardous waste landfills, and put more reliance on
Proc. Fourth Kansai Intl. Geotechnical Forum, Creation of a New Geo-Environmental, Japanese Geotechnical Society, Kyoto, Japan, May 24-26, 2000, 1-40
3
geomembranes. USEPA also banned disposal of free liquids in landfills and sponsored additional research on clay-waste interactions.
10-10
10-9
10-8
10-7
10-6
-1.0 -0.5 0.0 0.5 1.0 1.5 2.0 2.5 3.0
Na montmorilloniteCa montmorilloniteIlliteKaolinite
Hyd
raul
ic C
ondu
ctiv
ity (
cm/s
)
Pore Volumes of Flow
Water Acetone
Fig. 2. Hydraulic conductivity of four compacted
clays permeated first with water and then with acetone (adapted from Anderson et al. 1985). Legend depicts primary mineral in the clay.
Subsequent research confirmed the findings reported by Anderson (1982). However, these studies also showed that large increases in hydraulic conductivity of compacted natural clays only occur when the permeant liquid is a pure organic liquid with low dielectric constant or a very strong acid (Foreman and Daniel 1986, Bowders and Daniel 1986, Fernandez and Quigley 1988, Budhu et al. 1991, Nirmala et al. 1995, Alston et al. 1997). Aqueous solutions with organic liquids typically had to contain 50-70% organic liquid before a significant increase in hydraulic conductivity occurred. Acids had to have pH < 1 for the hydraulic conductivity to be affected. Mixtures of sand and bentonite were found to be more prone to chemical attack, particularly to solutions having a high concentration of divalent cations (Stern and Shackelford 1998). Leachates from municipal solid waste (MSW) landfills generally have been found to have no detrimental impact on the hydraulic conductivity of compacted clays. Yanful et al. (1990) conducted a compatibility test on low plasticity clay from
western Canada that contained approximately equal amounts of montmorillonite, illite, and kaolinite. The clay was being used to construct a compacted clay liner for a municipal solid waste landfill. A specimen was initially permeated with distilled (DS) water and then with a simulated MSW leachate. The hydraulic gradient was approximately 100 and the average effective stress about 20 kPa. Results of their test are shown in Fig. 3. The hydraulic conductivity to leachate was lower than that to DS water. The decrease in hydraulic conductivity was attributed to clogging of pores by precipitates and biological matter.
10-9
10-8
10-7
100 101 102 103 104 105 106
Hyd
raul
ic C
ondu
ctiv
ity (c
m/s
)
Time (min)
DS W ater Leachate
Fig. 3. Hydraulic conductivity data from test on low plasticity clay permeated with distilled water followed by leachate (adapted from Yanful et al. 1990).
Methods to stabilize clays against chemical attack have also been studied. Broderick and Daniel (1990) evaluated how lime, Portland cement, asphalt, and high compactive effort stabilize clays against attack. They indicate that effective stabilization requires that particles be immobilized so that the clay does not shrink or crack. Of the stabilizing methods they investigated, Portland cement and high compactive effort were found to prevent large increases in hydraulic conductivity during permeation with concentrated organic chemicals having low dielectric constant.
Proc. Fourth Kansai Intl. Geotechnical Forum, Creation of a New Geo-Environmental, Japanese Geotechnical Society, Kyoto, Japan, May 24-26, 2000, 1-40
4
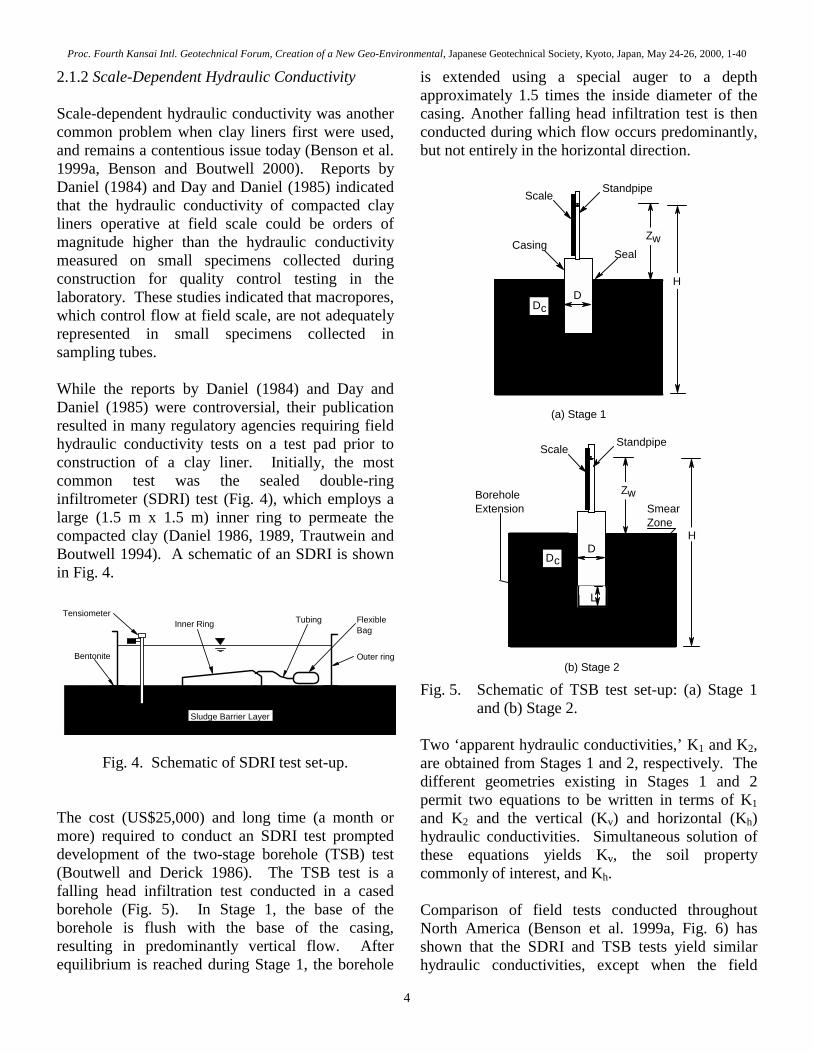
2.1.2 Scale-Dependent Hydraulic Conductivity Scale-dependent hydraulic conductivity was another common problem when clay liners first were used, and remains a contentious issue today (Benson et al. 1999a, Benson and Boutwell 2000). Reports by Daniel (1984) and Day and Daniel (1985) indicated that the hydraulic conductivity of compacted clay liners operative at field scale could be orders of magnitude higher than the hydraulic conductivity measured on small specimens collected during construction for quality control testing in the laboratory. These studies indicated that macropores, which control flow at field scale, are not adequately represented in small specimens collected in sampling tubes. While the reports by Daniel (1984) and Day and Daniel (1985) were controversial, their publication resulted in many regulatory agencies requiring field hydraulic conductivity tests on a test pad prior to construction of a clay liner. Initially, the most common test was the sealed double-ring infiltrometer (SDRI) test (Fig. 4), which employs a large (1.5 m x 1.5 m) inner ring to permeate the compacted clay (Daniel 1986, 1989, Trautwein and Boutwell 1994). A schematic of an SDRI is shown in Fig. 4.
Inner Ring
Outer ring
FlexibleBag
Tubing
Bentonite
Tensiometer
Sludge Barrier Layer
Fig. 4. Schematic of SDRI test set-up. The cost (US$25,000) and long time (a month or more) required to conduct an SDRI test prompted development of the two-stage borehole (TSB) test (Boutwell and Derick 1986). The TSB test is a falling head infiltration test conducted in a cased borehole (Fig. 5). In Stage 1, the base of the borehole is flush with the base of the casing, resulting in predominantly vertical flow. After equilibrium is reached during Stage 1, the borehole
is extended using a special auger to a depth approximately 1.5 times the inside diameter of the casing. Another falling head infiltration test is then conducted during which flow occurs predominantly, but not entirely in the horizontal direction.
D
SealCasing
Scale Standpipe
H
(a) Stage 1
Zw
Dc
D
Scale Standpipe
H
(b) Stage 2
L
BoreholeExtension Smear
Zone
Zw
Dc
Fig. 5. Schematic of TSB test set-up: (a) Stage 1
and (b) Stage 2. Two ‘apparent hydraulic conductivities,’ K1 and K2, are obtained from Stages 1 and 2, respectively. The different geometries existing in Stages 1 and 2 permit two equations to be written in terms of K1 and K2 and the vertical (Kv) and horizontal (Kh) hydraulic conductivities. Simultaneous solution of these equations yields Kv, the soil property commonly of interest, and Kh. Comparison of field tests conducted throughout North America (Benson et al. 1999a, Fig. 6) has shown that the SDRI and TSB tests yield similar hydraulic conductivities, except when the field

Proc. Fourth Kansai Intl. Geotechnical Forum, Creation of a New Geo-Environmental, Japanese Geotechnical Society, Kyoto, Japan, May 24-26, 2000, 1-40
5
hydraulic conductivity is high (> 3x10⁻⁷ cm/s). In the latter case, the macropores are too large or too widely spaced to be adequately represented in the 100-mm-diameter borehole typically used for TSB testing.
10-9
10-8
10-7
10-6
10-5
10-9 10-8 10-7 10-6 10-5
BlockTSB
Hyd
raul
ic C
ondu
ctiv
ity (
cm/s
ec)
from
TS
B o
r B
lock
Tes
t
Field Hydraulic Conductivity(cm/sec) from SDRI Test
?
Fig. 6. Comparison of field hydraulic conductivities
measured using the SDRI test, the TSB test, and laboratory tests on large specimens collected as undisturbed blocks (adapted from Benson et al. 1999a).
Analysis of data from the TSB and SDRI tests requires that simplifying assumptions be made regarding the flow process. For example, the wetted zone is assumed to saturated, the clay is assumed to be non-swelling, and the wetting front is assumed to be sharp (Wang and Benson 1995). More importantly, the TSB and SDRI tests are conducted at essentially zero confinement, which is unlikely to exist in the field. The assumptions about flow and state of the clay as well as lack of confinement cause conservative errors, i.e., the field measured hydraulic conductivity is usually higher than will exist during the service life of the facility. In some cases, the measurement may be too conservative and more realistic testing conditions are required. Conducting tests in the laboratory in flexible-wall permeameters permits saturation and application of the proper effective stress. These laboratory tests are also less expensive than the field tests (~ US$800 per specimen). However, for such tests to represent field conditions, the specimen being tested
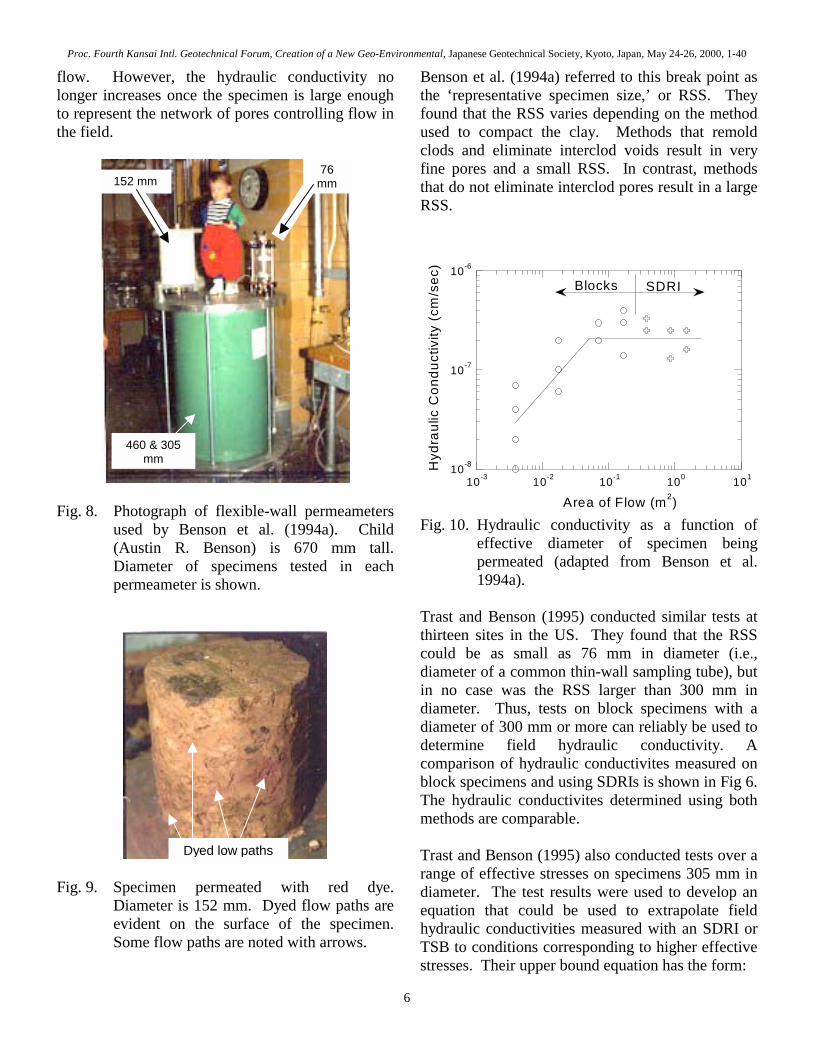
must be sufficiently large to contain a network of pores representative of those existing in the field. Benson et al. (1994a) identified how large specimens must be to represent field conditions by conducting hydraulic conductivity tests on test pads that permeated various volumes of clay. SDRI tests were conducted using inner rings having dimensions of 0.6 m x 0.6 m, 0.9 m x 0.9 m, or 1.2 m x 1.2 m. Once the SDRI tests were complete, large undisturbed block samples (0.6 m diameter) were trimmed from clay beneath the inner ring of each SDRI. A photograph of a block sample is shown in Fig. 7.
Fig. 7. Photograph of block sample obtained from
beneath inner ring of SDRI. The blocks were trimmed to a diameter of 460 mm and aspect ratio of 1 and then were placed in large-scale flexible-wall permeameters for testing. After the hydraulic conductivity was measured, the specimens were trimmed to a smaller diameter and then permeated again in smaller flexible-wall permeameters (Fig. 8). Specimens having diameters of 460, 305, 152, and 76 mm were tested. Some of the specimens were permeated with red dye at their largest diameter to mark the primary paths conducting flow. When these specimens were trimmed to smaller diameters, dyed flow paths were evident. An example of dyed flow paths is shown in Fig. 9. Trimming cut-off some of the flow paths, and thus lowered the hydraulic conductivity. Typical results of these tests are shown in Fig. 10. The hydraulic conductivity increases with increasing diameter, as more pores are active in
Proc. Fourth Kansai Intl. Geotechnical Forum, Creation of a New Geo-Environmental, Japanese Geotechnical Society, Kyoto, Japan, May 24-26, 2000, 1-40
flow. However, the hydraulic conductivity no longer increases once the specimen is large enough to represent the network of pores controlling flow in the field.
Fig. 8. Photograph of flexible-wall permeameters used by Benson et al. (1994a). Child (Austin R. Benson) is 670 mm tall. Diameter of specimens tested in each permeameter is shown.
Fig. 9. Specimen
Diameter evident oSome flow
Benson et al. (1994a) referred to this break point as the ‘representative specimen size,’ or RSS. They found that the RSS varies depending on the method used to compact the clay. Methods that remold clods and eliminate interclod voids result in very fine pores and a small RSS. In contrast, methods that do not eliminate interclod pores result in a large RSS.
10-8
10-7
10-6
10-3 10-2 10-1 100 101
Hyd
raul
ic C
ondu
ctiv
ity (
cm/s
ec)
Area of Flow (m2)
SDRIBlocks
Fig. 10. Hydraulic conductivity as a function of
effective diameter of specimen being permeated (adapted from Benson et al. 1994a).
Trast and Benson (1995) conducted similar tests at thirteen sites in the US. They found that the RSS could be as small as 76 mm in diameter (i.e., diameter of a common thin-wall sampling tube), but in no case was the RSS larger than 300 mm in diameter. Thus, tests on block specimens with a diameter of 300 mm or more can reliably be used to determine field hydraulic conductivity. A comparison of hydraulic conductivites measured on block specimens and using SDRIs is shown in Fig 6. The hydraulic conductivites determined using both methods are comparable. Trast and Benson (1995) also conducted tests over a
460 & 305 mm
152 mm 76
mm
Dyed low paths6
permeated with red dye. is 152 mm. Dyed flow paths are n the surface of the specimen. paths are noted with arrows.
range of effective stresses on specimens 305 mm in diameter. The test results were used to develop an equation that could be used to extrapolate field hydraulic conductivities measured with an SDRI or TSB to conditions corresponding to higher effective stresses. Their upper bound equation has the form:
Proc. Fourth Kansai Intl. Geotechnical Forum, Creation of a New Geo-Environmental, Japanese Geotechnical Society, Kyoto, Japan, May 24-26, 2000, 1-40
7
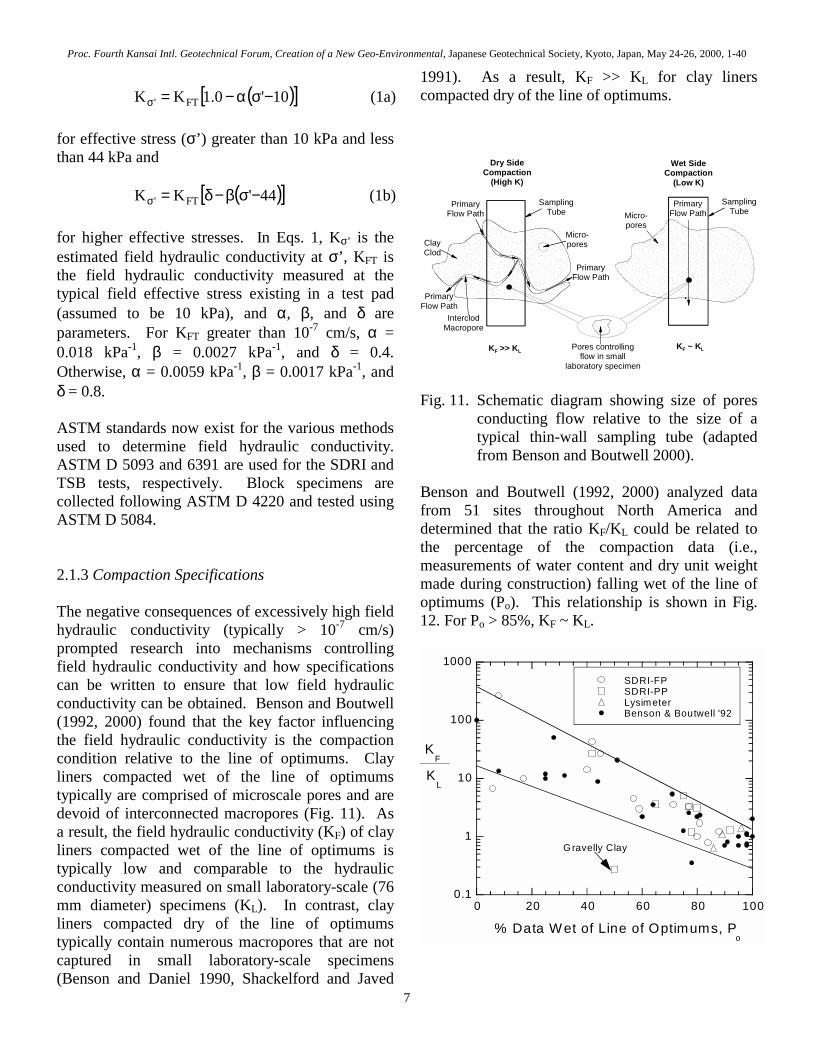
( )[ ]10'0.1KK FT' −σα−=σ (1a) for effective stress (σ’) greater than 10 kPa and less than 44 kPa and ( )[ ]44'KK FT' −σβ−δ=σ (1b) for higher effective stresses. In Eqs. 1, Kσ’ is the estimated field hydraulic conductivity at σ’, KFT is the field hydraulic conductivity measured at the typical field effective stress existing in a test pad (assumed to be 10 kPa), and α, β, and δ are parameters. For KFT greater than 10-7 cm/s, α = 0.018 kPa-1, β = 0.0027 kPa-1, and δ = 0.4. Otherwise, α = 0.0059 kPa-1, β = 0.0017 kPa-1, and δ = 0.8. ASTM standards now exist for the various methods used to determine field hydraulic conductivity. ASTM D 5093 and 6391 are used for the SDRI and TSB tests, respectively. Block specimens are collected following ASTM D 4220 and tested using ASTM D 5084. 2.1.3 Compaction Specifications The negative consequences of excessively high field hydraulic conductivity (typically > 10-7 cm/s) prompted research into mechanisms controlling field hydraulic conductivity and how specifications can be written to ensure that low field hydraulic conductivity can be obtained. Benson and Boutwell (1992, 2000) found that the key factor influencing the field hydraulic conductivity is the compaction condition relative to the line of optimums. Clay liners compacted wet of the line of optimums typically are comprised of microscale pores and are devoid of interconnected macropores (Fig. 11). As a result, the field hydraulic conductivity (KF) of clay liners compacted wet of the line of optimums is typically low and comparable to the hydraulic conductivity measured on small laboratory-scale (76 mm diameter) specimens (KL). In contrast, clay liners compacted dry of the line of optimums typically contain numerous macropores that are not captured in small laboratory-scale specimens (Benson and Daniel 1990, Shackelford and Javed
1991). As a result, KF >> KL for clay liners compacted dry of the line of optimums.
ClayClod
InterclodMacropore
PrimaryFlow Path
PrimaryFlow Path
PrimaryFlow Path
SamplingTube
Micro-pores
SamplingTubeMicro-
pores
PrimaryFlow Path
Pores controlling flow in small
laboratory specimen
Dry SideCompaction
(High K)
Wet SideCompaction
(Low K)
KF >> KLKF ~ KL
Fig. 11. Schematic diagram showing size of pores
conducting flow relative to the size of a typical thin-wall sampling tube (adapted from Benson and Boutwell 2000).
Benson and Boutwell (1992, 2000) analyzed data from 51 sites throughout North America and determined that the ratio KF/KL could be related to the percentage of the compaction data (i.e., measurements of water content and dry unit weight made during construction) falling wet of the line of optimums (Po). This relationship is shown in Fig. 12. For Po > 85%, KF ~ KL.
0.1
1
10
100
1000
0 20 40 60 80 100
SDRI-FPSDRI-PPLysimeterBenson & Boutwell '92
KF
% Data Wet of Line of Optimums, Po
KL
Gravelly Clay

Proc. Fourth Kansai Intl. Geotechnical Forum, Creation of a New Geo-Environmental, Japanese Geotechnical Society, Kyoto, Japan, May 24-26, 2000, 1-40
8
Fig. 12. Ratio KF/KL vs. percentage of compaction data falling wet of the line of optimums (Po). Graph adapted from Benson and Boutwell (2000).
A similar analysis on data from 85 sites by Benson et al. (1999) showed that requiring a high Po is likely to yield low KF. In particular, Benson et al. (1999) found no sites with KF > 10-7 cm/s when Po was greater than 90% (Fig. 13).
10-9
10-8
10-7
10-6
10-5
0 20 40 60 80 100
Fie
ld H
ydra
ulic
Con
duct
ivity
(cm
/s)
Percent Wet of Line of Optimums
(a)
Fig. 13. Field hydraulic conductivity measured with
an SDRI vs. percentage of compaction data falling wet of the line of optimums (Po). Graph is adapted from Benson et al. (1999).
Based on these findings, Benson et al. (1999) and Benson and Boutwell (2000) recommend that compaction specifications for compacted clay liners be written in a manner that ensures compaction is wet of the line of optimums. Specifications following this recommendation appear as shown in Fig. 14. Methods to develop this type of specification are described in Daniel and Benson (1990) and Benson (1994). 2.2 Geomembranes and Composite Liners Geomembranes are thin polymeric sheets having a thickness between 1 and 3 mm. They are used alone or in conjunction with soil as a liner.
Geomembranes are also known as ‘flexible membrane liners’ or FMLs. The latter terminology is infrequently used today, but exists in many regulations and government-issued guidance documents. A variety of polymers have been used for geomembranes, but nearly all geomembranes today are made of high-density polyethylene (HDPE), linear low-density polyethylene (LLDPE), polypropylene (PP), or polyvinyl chloride (PVC).
Dry
Uni
t Wei
ght Line of
Optimums
Min. γd Based on Minimum% Compaction to AchieveLow KF and Adequate Strength
RequiredCompactionin This Zone
Compaction Water Content
TrafficabilityLimit
DuctilityLimit
Si=100%
Fig. 14. Modern compaction specification that ensures compaction wet of the line of optimums (adapted from Benson et al. 1999a).
2.2.1 Polymers Research in the 1980s showed that HDPE is highly resistant to degradation by nearly all chemicals and, for all practical purposes, is impervious to water (August and Tatzky 1984, Haxo et al. 1985, Matrecon 1988, Haxo and Lahey 1988). HDPE is also used by a variety of industries for storage of chemicals and is a common material used for fuel tanks. These factors, combined with ease by which HDPE can be welded and the relatively low cost of the polymer, are reasons why HDPE geomembranes are so common. Manufacturers of HDPE geomembrane have also been very effective in marketing their product, which has contributed to HDPE’s large market share.

Proc. Fourth Kansai Intl. Geotechnical Forum, Creation of a New Geo-Environmental, Japanese Geotechnical Society, Kyoto, Japan, May 24-26, 2000, 1-40
9
One disadvantage of HDPE is its potential for stress cracking, which is the sudden and unexpected rupture of a plastic caused by a tensile stress lower than its short-term tensile strength (Halse et al. 1990). Stress cracks occur after extended loading at lower stresses due to breakdown of tie molecules in the polymer. These tie molecules are normally responsible for the ductile stress-strain behavior of HDPE. Stress cracking is normally prevented by selecting HDPE resins that have a ductile-to-brittle transition time in excess of 200 hr (Daniel and Koerner 1993), as measured in a notched constant load test (e.g., ASTM D 5397). The 100-hr criterion is empirical and is based primarily on an analysis of case histories where stress cracking has occurred. LLDPE geomembranes are used in applications where a more flexible material is necessary. LLDPE can undergo much greater strain before failure than HDPE. Thus, LLDPE is used in applications where additional puncture resistance is required. LLDPE is often used in covers where distortion is more likely to exist and for lining storage piles where frequent traffic places additional stress on the lining system. PP geomembranes are more flexible than HDPE geomembranes, but less flexible than LLDPE geomembranes. PP also has good chemical resistance, although it is not as resistant as HDPE. PP is welded as easily as HDPE and is used when it is less costly or when a slightly more flexible geomembrane is needed. PVC geomembranes are used far less frequently than HDPE geomembranes. One reason for the less frequent use of PVC is that these geomembranes typically contain a plasticizer that makes the polymer flexible. This plasticizer slowly evaporates over time, and the geomembrane becomes more brittle and likely to crack. Recently the use of PVC has increased due to changes in the polymer characteristics that make it more durable. Also, use of thermal welding, as opposed to solvent welding used in the past, has made installation of PVC geomembranes easier and more palatable. 2.2.2 Leakage Rates
Geomembranes are essentially impervious when devoid of holes or tears. Water can move through geomembranes by diffusion, but the water transmission rates are very low. ‘Effective hydraulic conductivities’ corresponding to water diffusion are on the order of 10-12 to 10-15 cm/s for most geomembranes (Giroud and Bonaparte 1989). Even though recent advances such as conductive geomembrane, leak location surveys, and spark testing have improved geomembrane installations, geomembranes are almost never installed without holes (Darilek et al. 1989, Giroud and Bonaparte 1989, Brennecke and Corser 1998, Rollin et al. 1999). Based on an analysis of case histories, Giroud and Bonaparte (1989) indicate that the frequency of holes ranges between 2.5 to 25 holes/ha. For design calculations, they recommend using holes having a diameter of 11 mm (area = 100 mm2). The author typically uses a hole frequency of 12 holes/ha and 11-mm-diameter holes for design. Leakage from holes in a geomembrane can be calculated using Bernoulli’s equation (Giroud and Bonaparte 1989, Benson et al. 1995a) provided the geomembrane is placed on a permeable subgrade. Bernoulli’s equation is wB gd2aCQ = (2) where Q is the leakage rate per hole, CB is a dimensionless coefficient, a is the cross-sectional area of the hole, g is the gravimetric acceleration, and dw is the depth of liquid on top of the geomembrane. Benson et al. (1995a) conducted a series of tests with various geomembranes to determine typical values of CB. A variety of different holes were considered, ranging from precise circular holes to punctures caused by rocks and screwdrivers. Analysis of all the data showed that CB typically ranges between 0.5-0.9, and on average is about 0.6. Typical leakage rates from a geomembrane liner can be computed using Eq. 2. If the number of holes ranges between 2 and 12 holes/ha, each hole has a diameter of 11 mm, and the depth of leachate is 300 mm, then the leakage rate is 24,000–143,000 l/ha-day! Thus, geomembranes with a typical number of

Proc. Fourth Kansai Intl. Geotechnical Forum, Creation of a New Geo-Environmental, Japanese Geotechnical Society, Kyoto, Japan, May 24-26, 2000, 1-40
10
holes may transmit very high leakage rates when placed on a permeable subgrade. Consequently, geomembranes are normally used in ‘composite liners’ where a layer of fine-grained soil is placed directly beneath the geomembrane. 2.2.3 Leakage Rates from Composite Liners Composite liners leak appreciably less than geomembrane liners on permeable subgrade or compacted clay liners because composite liners exploit the desirable characteristics of the geomembrane and soil components. The geomembrane component reduces the area of flow to a very small value (i.e., the area of the flaws) and the soil liner provides hydraulic impedance. Several methods are available to estimate leakage rates from composite liners (Foose 1997). The most common method is to use an equation proposed by Giroud et al. (1989): 74.0
s9.0
w1.0 Kda15.1Q = (3)
where a is the area of the hole (m2), dw is the depth of leachate (m), Ks is the saturated hydraulic conductivity of the soil liner (m/s), and Q is the leakage rate per hole (m3/s). Eq. 3 is empirical. Thus, the specified units must be used. Foose (1997) shows that more rigorous methods to compute leakage rates yield values lower than those predicted using Eq. 3. Thus, predictions made with Eq. 3 tend to be conservative. Leakage rates for compacted clay liners, geomembrane liners, and composite liners are compared in Fig. 15. The holes were assumed to have a cross-sectional area of 100 mm2, the depth of leachate was assumed to be 300 mm, and the clay component was assumed to be 600 mm thick. All factors being equal, composite liners leak appreciably less than geomembrane or compacted clay liners. For this reason, composite liners are used in many waste containment applications in the US today. 2.2.4 Slope Stability
When geomembranes and other geosynthetic components are incorporated into waste containment systems, planes of weakness are introduced that pose stability problems. These planes of weakness are caused by the slippery interfaces that exist between the soils and geosynthetics and the geosynthetics themselves. The small displacements required to mobilize peak strengths exacerbate the stability issue because displacements larger than those that mobilize peak strength occur during construction and filling of a waste containment facility (Stark and Poeppel 1994).
0
200
400
600
800
1000
10-910-810-710-610-5
Leak
age
Rat
e (l/
ha-d
)
Hydraulic Conductivity of the Clay Liner (cm/s)
Clay
CompositeN
h=12
CompositeN
h=2
Geomembrane24,000-143,000 l/ha-d
Fig. 15. Leakage rates for composite, compacted
clay, and geomembrane liners calculated using Eqs. 2-3.
The massive slope failure at the Kettleman Hills hazardous waste landfill is an example of problems that can arise when the shear strength of the interface between the geomembrane and compacted clay (or other interfaces) are not accounted for properly in slope stability analyses (Seed et al. 1990, Stark and Poeppel 1994). The slide at the Kettleman Hills landfill occurred along the interface between the compacted clay and a smooth geomembrane. A careful analysis of the failure by Stark and Poeppel (1994) resulted in important design recommendations. They suggest that the factor of safety against slope failure for composite lined facilities should be at least 1.0 when the analysis is based completely on residual strengths

Proc. Fourth Kansai Intl. Geotechnical Forum, Creation of a New Geo-Environmental, Japanese Geotechnical Society, Kyoto, Japan, May 24-26, 2000, 1-40
11
and exceed 1.0 when the base of the landfill is assumed to be at peak strength and the side slope is assumed to be at residual strength. The compaction conditions used to minimize hydraulic conductivity (i.e., compaction wet of the line of optimums) tend to result in the lowest interface strengths between the compacted clay and geomembrane. For example, Seed and Boulanger (1991) evaluated how the friction angle at large-displacement (δLD) for the clay-geomembrane interface at the Kettleman Hills facility was influenced by the compaction condition of the clay liner. Their results are shown in Fig. 16. The lowest interface friction angles are obtained for conditions that normally yield the lowest field hydraulic conductivities (i.e., Zones I and II in Fig. 16). Thus, the designer must carefully weigh the relative advantages of lower hydraulic conductivity and shear strength when designing a composite lined landfill.
Fig. 16. Interface friction angle at large
displacement (δLD) for the Kettleman Hills composite liner in the as-compacted condition (adapted from Seed and Boulanger 1991). Note: 1 lb/ft3 = 0.157 kN/m3 and 1000 lb/ft2 = 48 kPa.
2.3 Geosynthetic Clay Liners Geosynthetic clay liners (GCLs) are thin prefabricated clay liners consisting of sodium
bentonite (~7.5 kg/m2) encased between two geotextiles or glued to a geomembrane. A schematic of the common GCLs is shown in Fig. 17. The low saturated hydraulic conductivity to water (~10-9 cm/s in deionized water) and high swelling capacity of the sodium bentonite makes GCLs appear as an attractive alternative to compacted clay. However, the high activity and low drained shear strength of sodium bentonite can pose special problems, notably chemical incompatibility and slope stability. The latter issue is discussed in Sec. 3.3.3.
Clay+adhesive
Clay
Clay+adhesive or clay
Upper geotextile
Upper geotextile
Upper geotextile
Stitch bonded in rows
Needle punched fibers throughout
Clay+adhesiveLower or upper geomembrane
Lower geotextile
Lower geotextile
Lower geotextile
(a) adhesive bound clay to upper and lower geotextiles
(b) stitch-bonded clay between upper and lower geotextiles
(c) needle-punched through upper and lower geotextiles
(d) adhesive-bound clay to geomembrane Fig. 17. The four common types of GCLs: (a)
adhesive bonded with geotextile encasement, (b) stitch-bonded with geotextile encasement, (c) needle-punched with geotextile encasement, and (4) adhesive bonded to a geomembrane.
Shackelford et al. (2000) contains a recent review of the literature on chemical compatibility of GCLs. Their review points to three key issues in the assessment of chemical compatibility: (i) type of permeant liquid, (ii) the influence of ‘prehydration,’ and (iii) the need to ensure that chemical equilibrium is established before terminating chemical compatibility tests. 2.3.1 Permeant Liquid
δLD
Proc. Fourth Kansai Intl. Geotechnical Forum, Creation of a New Geo-Environmental, Japanese Geotechnical Society, Kyoto, Japan, May 24-26, 2000, 1-40
12
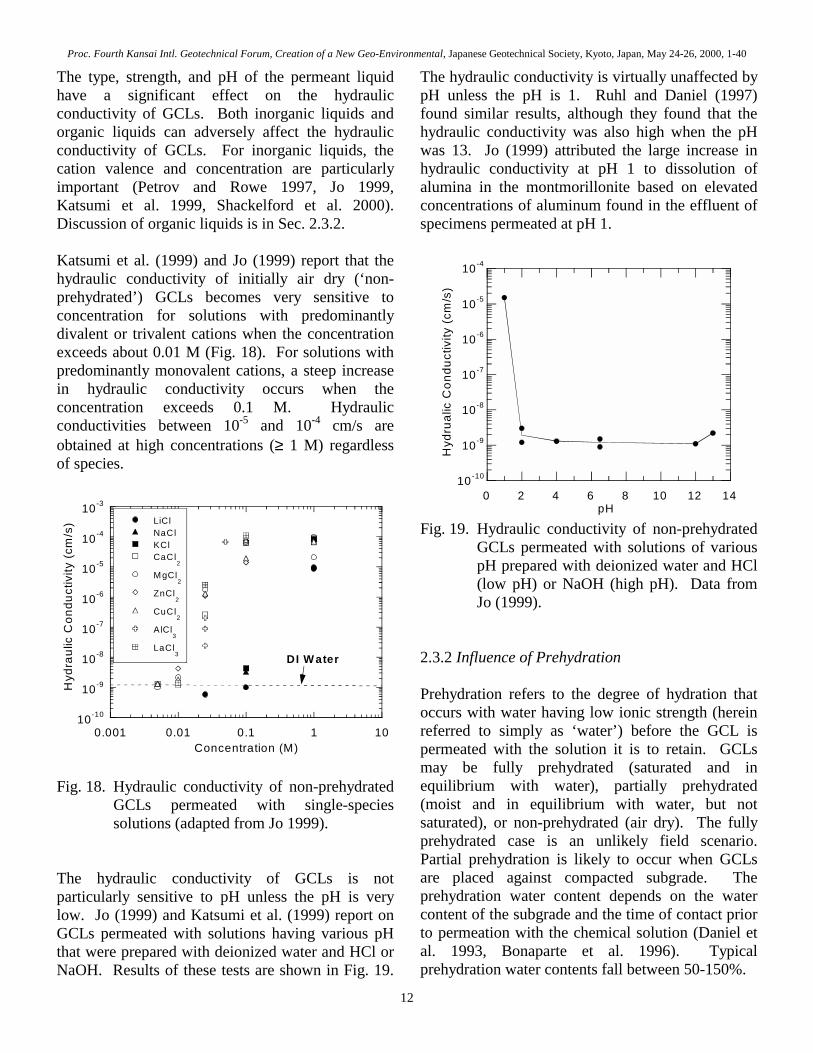
The type, strength, and pH of the permeant liquid have a significant effect on the hydraulic conductivity of GCLs. Both inorganic liquids and organic liquids can adversely affect the hydraulic conductivity of GCLs. For inorganic liquids, the cation valence and concentration are particularly important (Petrov and Rowe 1997, Jo 1999, Katsumi et al. 1999, Shackelford et al. 2000). Discussion of organic liquids is in Sec. 2.3.2. Katsumi et al. (1999) and Jo (1999) report that the hydraulic conductivity of initially air dry (‘non-prehydrated’) GCLs becomes very sensitive to concentration for solutions with predominantly divalent or trivalent cations when the concentration exceeds about 0.01 M (Fig. 18). For solutions with predominantly monovalent cations, a steep increase in hydraulic conductivity occurs when the concentration exceeds 0.1 M. Hydraulic conductivities between 10-5 and 10-4 cm/s are obtained at high concentrations (≥ 1 M) regardless of species.
10-10
10-9
10-8
10-7
10-6
10-5
10-4
10-3
0.001 0.01 0.1 1 10
LiClNaClKClCaCl
2
MgCl2
ZnCl2
CuCl2
AlCl3
LaCl3
Hyd
raul
ic C
ondu
ctiv
ity (
cm/s
)
Concentration (M)
DI W ater
Fig. 18. Hydraulic conductivity of non-prehydrated
GCLs permeated with single-species solutions (adapted from Jo 1999).
The hydraulic conductivity of GCLs is not particularly sensitive to pH unless the pH is very low. Jo (1999) and Katsumi et al. (1999) report on GCLs permeated with solutions having various pH that were prepared with deionized water and HCl or NaOH. Results of these tests are shown in Fig. 19.
The hydraulic conductivity is virtually unaffected by pH unless the pH is 1. Ruhl and Daniel (1997) found similar results, although they found that the hydraulic conductivity was also high when the pH was 13. Jo (1999) attributed the large increase in hydraulic conductivity at pH 1 to dissolution of alumina in the montmorillonite based on elevated concentrations of aluminum found in the effluent of specimens permeated at pH 1.
10-10
10-9
10-8
10-7
10-6
10-5
10-4
0 2 4 6 8 10 12 14
Hyd
rual
ic C
ondu
ctiv
ity (
cm/s
)
pH Fig. 19. Hydraulic conductivity of non-prehydrated
GCLs permeated with solutions of various pH prepared with deionized water and HCl (low pH) or NaOH (high pH). Data from Jo (1999).
2.3.2 Influence of Prehydration Prehydration refers to the degree of hydration that occurs with water having low ionic strength (herein referred to simply as ‘water’) before the GCL is permeated with the solution it is to retain. GCLs may be fully prehydrated (saturated and in equilibrium with water), partially prehydrated (moist and in equilibrium with water, but not saturated), or non-prehydrated (air dry). The fully prehydrated case is an unlikely field scenario. Partial prehydration is likely to occur when GCLs are placed against compacted subgrade. The prehydration water content depends on the water content of the subgrade and the time of contact prior to permeation with the chemical solution (Daniel et al. 1993, Bonaparte et al. 1996). Typical prehydration water contents fall between 50-150%.
Proc. Fourth Kansai Intl. Geotechnical Forum, Creation of a New Geo-Environmental, Japanese Geotechnical Society, Kyoto, Japan, May 24-26, 2000, 1-40
13
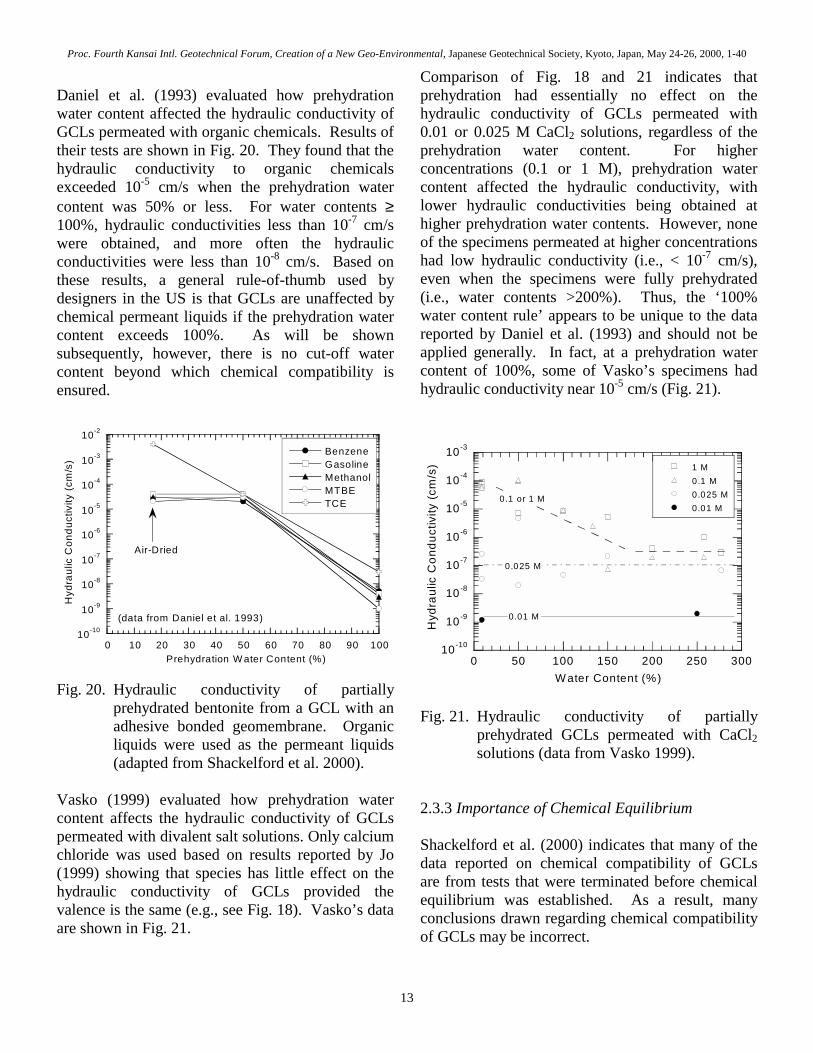
Daniel et al. (1993) evaluated how prehydration water content affected the hydraulic conductivity of GCLs permeated with organic chemicals. Results of their tests are shown in Fig. 20. They found that the hydraulic conductivity to organic chemicals exceeded 10-5 cm/s when the prehydration water content was 50% or less. For water contents ≥ 100%, hydraulic conductivities less than 10-7 cm/s were obtained, and more often the hydraulic conductivities were less than 10-8 cm/s. Based on these results, a general rule-of-thumb used by designers in the US is that GCLs are unaffected by chemical permeant liquids if the prehydration water content exceeds 100%. As will be shown subsequently, however, there is no cut-off water content beyond which chemical compatibility is ensured.
10-10
10-9
10-8
10-7
10-6
10-5
10-4
10-3
10-2
0 10 20 30 40 50 60 70 80 90 100
BenzeneGasolineMethanolMTBETCE
Hyd
raul
ic C
ondu
ctiv
ity (
cm/s
)
Prehydration W ater Content (%)
Air-Dried
(data from Daniel et al. 1993)
Fig. 20. Hydraulic conductivity of partially
prehydrated bentonite from a GCL with an adhesive bonded geomembrane. Organic liquids were used as the permeant liquids (adapted from Shackelford et al. 2000).
Vasko (1999) evaluated how prehydration water content affects the hydraulic conductivity of GCLs permeated with divalent salt solutions. Only calcium chloride was used based on results reported by Jo (1999) showing that species has little effect on the hydraulic conductivity of GCLs provided the valence is the same (e.g., see Fig. 18). Vasko’s data are shown in Fig. 21.
Comparison of Fig. 18 and 21 indicates that prehydration had essentially no effect on the hydraulic conductivity of GCLs permeated with 0.01 or 0.025 M CaCl2 solutions, regardless of the prehydration water content. For higher concentrations (0.1 or 1 M), prehydration water content affected the hydraulic conductivity, with lower hydraulic conductivities being obtained at higher prehydration water contents. However, none of the specimens permeated at higher concentrations had low hydraulic conductivity (i.e., < 10-7 cm/s), even when the specimens were fully prehydrated (i.e., water contents >200%). Thus, the ‘100% water content rule’ appears to be unique to the data reported by Daniel et al. (1993) and should not be applied generally. In fact, at a prehydration water content of 100%, some of Vasko’s specimens had hydraulic conductivity near 10-5 cm/s (Fig. 21).
10-10
10-9
10-8
10-7
10-6
10-5
10-4
10-3
0 50 100 150 200 250 300
1 M0.1 M 0.025 M0.01 M
Hyd
raul
ic C
ondu
ctiv
ity (c
m/s
)
W ater Content (%)
0.01 M
0.025 M
0.1 or 1 M
Fig. 21. Hydraulic conductivity of partially
prehydrated GCLs permeated with CaCl2 solutions (data from Vasko 1999).
2.3.3 Importance of Chemical Equilibrium Shackelford et al. (2000) indicates that many of the data reported on chemical compatibility of GCLs are from tests that were terminated before chemical equilibrium was established. As a result, many conclusions drawn regarding chemical compatibility of GCLs may be incorrect.

Proc. Fourth Kansai Intl. Geotechnical Forum, Creation of a New Geo-Environmental, Japanese Geotechnical Society, Kyoto, Japan, May 24-26, 2000, 1-40
14
Shackelford et al. (2000) recommends that compatibility tests be continued until the chemistry of the influent and effluent are the same, which may require many pore volumes of flow and a long test time. Based on theory developed by Shackelford et al. (1999), Shackelford et al. (2000) shows that equilibrium is established when the influent and effluent have the same electrical conductivity (EC) and pH. In particular, Shackelford et al. (2000) recommends that the ratio of effluent to influent pH and effluent to influent EC both fall between 1.0 ± 0.1 before terminating compatibility tests. The test data in Fig. 22 illustrate how misleading conclusions can be drawn if compatibility tests are terminated too early. Hydraulic conductivity tests were conducted on two identical GCL specimens. One specimen was permeated with DI water whereas the other was permeated with 0.0125 M CaCl2. Neither specimen was prehydrated.
10-10
10-9
10-8
10-7
0 100 200 300 400 500 600 700 800
0.0125 M CaCl2
DI W aterHyd
raul
ic C
ondu
ctiv
ity (c
m/s
)
Elapsed Time (days) Fig. 22. Hydraulic conductivity of GCL specimens
permeated with DI water or 0.0125 M CaCl2. Data for the test with 0.0125 M CaCl2 were initially reported by Lin (1998). Data for the specimen permeated with DI water were initially reported by Jo (1999). Both tests are still being conducted. Recent data courtesy of H-Y Jo.
Under typical conditions, the test using the CaCl2 solution would have terminated before 100 days had elapsed. By this time, the hydraulic conductivity
was steady, inflow equaled outflow, and more than five pore volumes of flow had passed through the specimen. At 100 days, the hydraulic conductivity of the GCL to the CaCl2 solution was essentially equal to the hydraulic conductivity to DI water. This similarity continued until about 250 days, when the hydraulic conductivity to the CaCl2 solution began to increase. The hydraulic conductivity continued to increase until about 500 days elapsed. The final hydraulic conductivity was 25 times higher than the hydraulic conductivity at 100 days. Examination of the pH and EC data showed that the effluent had much higher pH and EC than the influent at day 100, and that the influent and effluent did not have similar pH and EC until about 600 days elapsed (Shackelford et al. 2000). 2.4 Performance-Based Liner Design Perhaps the biggest shift in design of waste containment systems is the current trend towards performance-based design. To date, most designs have been prescriptive, an approach referred to by the author as ‘regulatory engineering.’ Regulations stipulate a product-based design where properties of the materials are prescribed (e.g., hydraulic conductivity and thickness of a clay liner). However, the advent of better methods to analyze contaminant transport in lining systems has lead to growing interest in performance-based design. The paradigm shift towards performance-based design is healthy for engineers, since it provides them with the opportunity to truly design a waste containment system that protects the environment in a cost-effective manner. Depending on the performance criteria and geological setting, a performance-based design may be more comprehensive or less restrictive than a prescriptive design. An example of a performance-based design is the hazardous waste landfill at the US Army’s Rocky Mountain Arsenal in Denver, Colorado, USA. Contaminant transport analyses showed that a triple composite liner was necessary to protect contaminant concentrations in groundwater beneath the landfill from exceeding health-based criteria. This design was more rigorous than that of a typical

Proc. Fourth Kansai Intl. Geotechnical Forum, Creation of a New Geo-Environmental, Japanese Geotechnical Society, Kyoto, Japan, May 24-26, 2000, 1-40
15
hazardous waste landfill. US regulations prescribe only a double composite liner for hazardous waste landfills. At other sites where wastes are less toxic, recharge is very low, and groundwater is very deep, performance-based design may show that no liner is necessary. Katsumi et al. (2000) provides a review of the approaches that can be used in performance-based design. In most cases, the design process consists of three steps: (i) determining acceptable groundwater quality standards (e.g., health-based limits on concentrations), (ii) determining the maximum mass loading (Mmax) that can be discharged to groundwater without exceeding the health-based concentrations, and (iii) selecting a liner with mass discharge (M) that is less than Mmax. Determining exact values for M is difficult given the complexity of solute transport in modern lining systems. However, conservative estimates of M can be made using simplified methods that can be implemented using a spreadsheet application such as Microsoft Excel®. The simplified approach described here is from Katsumi et al. (2000). 2.4.1 Geomembrane Liners There are two primary mechanisms for contaminant transport through geomembranes: "leakage" through holes and molecular "diffusion" through the intact geomembrane (Fig. 23). Inorganic compounds are transported primarily by advection through the holes. Organic compounds flow through the holes by advection and through the intact geomembrane via diffusion (Haxo et al. 1985, Haxo and Lahey 1988, Rowe et al. 1997, Park et al. 1996, Mandelkern and Alamo 1999).
Geomembrane
OrganicDiffusion
Inorganic or OrganicAdvection
Subgrade orClay Liner
OrganicDiffusion
Hole
Fig. 23. Mechanisms of advective and diffusive
transport in a geomembrane placed on subgrade or a clay liner (adapted from Foose 1997).
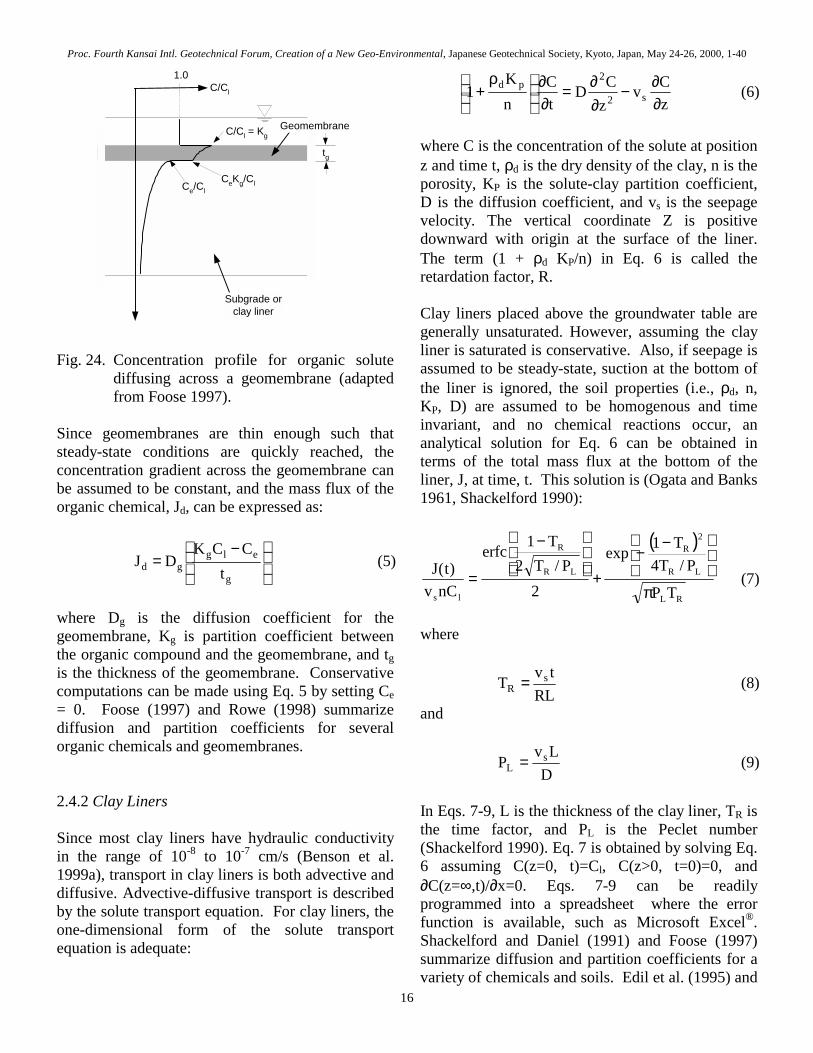
The mass flux due to leakage through holes, Ja, is calculated using lha QCNJ = (4) where Q is the leakage rate (defined using Eq. 2), Nh is the number of the holes per unit area in geomembrane, and Cl is the solute concentration in the leachate. Diffusive transport through geomembranes is more complex than advection through the holes. The transport mechanisms controlling diffusion are illustrated in Fig. 24. An organic chemical having concentration Cl first partitions into the geomembrane (KgCl), then diffuses downward through the geomembrane, and finally partitions back into the pore water at the base of the geomembrane (Ce). Diffusion then occurs through the underlying soil, which may be subgrade or compacted clay.
Proc. Fourth Kansai Intl. Geotechnical Forum, Creation of a New Geo-Environmental, Japanese Geotechnical Society, Kyoto, Japan, May 24-26, 2000, 1-40
16
C/Cl
1.0
C/Cl = Kg
Ce/ClCeKg/Cl
tg
Subgrade orclay liner
Geomembrane
Fig. 24. Concentration profile for organic solute
diffusing across a geomembrane (adapted from Foose 1997).
Since geomembranes are thin enough such that steady-state conditions are quickly reached, the concentration gradient across the geomembrane can be assumed to be constant, and the mass flux of the organic chemical, Jd, can be expressed as:
−=
g
elggd t
CCKDJ (5)
where Dg is the diffusion coefficient for the geomembrane, Kg is partition coefficient between the organic compound and the geomembrane, and tg is the thickness of the geomembrane. Conservative computations can be made using Eq. 5 by setting Ce = 0. Foose (1997) and Rowe (1998) summarize diffusion and partition coefficients for several organic chemicals and geomembranes. 2.4.2 Clay Liners Since most clay liners have hydraulic conductivity in the range of 10-8 to 10-7 cm/s (Benson et al. 1999a), transport in clay liners is both advective and diffusive. Advective-diffusive transport is described by the solute transport equation. For clay liners, the one-dimensional form of the solute transport equation is adequate:
zCv
zCD
tC
nK
1 s2
2pd
∂∂−
∂∂=
∂∂
ρ+ (6)
where C is the concentration of the solute at position z and time t, ρd is the dry density of the clay, n is the porosity, KP is the solute-clay partition coefficient, D is the diffusion coefficient, and vs is the seepage velocity. The vertical coordinate Z is positive downward with origin at the surface of the liner. The term (1 + ρd KP/n) in Eq. 6 is called the retardation factor, R. Clay liners placed above the groundwater table are generally unsaturated. However, assuming the clay liner is saturated is conservative. Also, if seepage is assumed to be steady-state, suction at the bottom of the liner is ignored, the soil properties (i.e., ρd, n, KP, D) are assumed to be homogenous and time invariant, and no chemical reactions occur, an analytical solution for Eq. 6 can be obtained in terms of the total mass flux at the bottom of the liner, J, at time, t. This solution is (Ogata and Banks 1961, Shackelford 1990):
( )
RL
LR
2R
LR
R
ls TP
P/T4T1exp
2P/T2
T1erfc
nCv)t(J
π
−−+
−
= (7)
where
RL
tvT s
R = (8)
and
D
LvP s
L = (9)
In Eqs. 7-9, L is the thickness of the clay liner, TR is the time factor, and PL is the Peclet number (Shackelford 1990). Eq. 7 is obtained by solving Eq. 6 assuming C(z=0, t)=Cl, C(z>0, t=0)=0, and ∂C(z=∞,t)/∂x=0. Eqs. 7-9 can be readily programmed into a spreadsheet where the error function is available, such as Microsoft Excel®. Shackelford and Daniel (1991) and Foose (1997) summarize diffusion and partition coefficients for a variety of chemicals and soils. Edil et al. (1995) and

Proc. Fourth Kansai Intl. Geotechnical Forum, Creation of a New Geo-Environmental, Japanese Geotechnical Society, Kyoto, Japan, May 24-26, 2000, 1-40
17
Foose (1997) provide partition coefficients and diffusion coefficients for VOCs. 2.4.3 Composite Liners The advective and diffusive modes of transport in geomembranes also apply to composite liners. Since the clay barrier impedes flow and provides for a greater distance across which diffusion occurs, steady-state conditions cannot be assumed. Moreover, transport through defects in the geomembrane and underlying clay occurs three-dimensionally (3-D), which makes the analysis more complex. An exact analysis of inorganic and organic solute transport through composite liners requires complex 3-D numerical models of coupled flow and transport. However, a conservative approximation can be obtained by simplifying the 3-D system into a 1-D uniform system (Foose 1997). For inorganic solutes, transport only occurs through defects in the geomembrane. In this case, the simplification consists of assuming that a 1-D uniform system acts over an equivalent area of transport, Ae. The equivalent area of transport is assumed to equal the average area of flow for an equivalent 1-D system having flow rate Q from a defect in the geomembrane. The flow rate is obtained from Eq. 3. Darcy’s Law is then applied to obtain Ae from Q:
KiQAe = (10)
where K is the saturated hydraulic conductivity of the underlying clay liner and i is the average one-dimensional gradient (i.e., i = 1 + dw/L). The mass flux from the area Ae is obtained from Eq. 7 using transport parameters for the clay liner. The seepage velocity is calculated using Darcy’s law, the saturated hydraulic conductivity of the clay liner, the average one-dimensional gradient, and the total porosity of the clay liner. Total porosity is used instead of effective porosity based on the findings of Kim et al. (1997). They show that the effective porosity equals the total porosity for compacted
clays. The total mass flux, J, for the liner is then obtained as: ehe ANJJ = (11) For organic chemicals, the contribution of leakage through defects in the geomembrane to the total mass flux through the composite liner is negligible. Molecular diffusion through the geomembrane is far more significant (Foose 1997). Thus, a one-dimensional analysis can be used. This analysis is straightforward if the geomembrane is assumed to have no effect on diffusive transport but completely eliminates advective transport. That is, vs in Eq. 7 is assumed to be zero and all other properties (D, R) are assumed to correspond to those of the clay. Foose et al. (1999) compared predictions made using this simplified method to those obtained from an exact 3-D finite difference model. An example of his comparisons are shown in Fig. 25 for organic solutes. The approximate method tends to over-predict the mass flux, with greater errors associated with thicker liners.
0
50
100
150
200
250
300
350
0 20 40 60 80 100
Approximate Solution
Numerical ModelMas
s F
lux
at B
ase
of L
iner
(g/H
a/yr
)
T ime (yr)
Clay-Geomembrane Composite610 mm of clay
(a)

Proc. Fourth Kansai Intl. Geotechnical Forum, Creation of a New Geo-Environmental, Japanese Geotechnical Society, Kyoto, Japan, May 24-26, 2000, 1-40
18
0
500
1000
1500
2000
2500
0 20 40 60 80 100
Approximate Solution
Numerical Model
Mas
s Fl
ux a
t Bas
e of
Lin
er (
g/H
a/yr
)
Time (yr)
GCL Composite Liner
(b)
Fig. 25. Mass flux obtained using simplified
method and numerical model: (a) thick composite liner with 610 mm clay barrier and (b) thin composite liner with GCL (adapted from Foose et al. 1999).
3 COVERS 3.1 Compacted Clay Covers The first covers for waste containment systems consisted of a compacted clay barrier overlain by a vegetated surface layer (Fig. 26). The low saturated hydraulic conductivity of the compacted clay layer (10-6 to 10-8 cm/s) was expected to limit deep percolation of water and enhance runoff and evapotranspiration. Use of compacted clay covers was coincident with the onset of incorporating compacted clay liners in waste containment systems. The compacted clay cap was believed to prevent the “bathtub” effect. That is, the cover was anticipated to leak no more than the liner and thus water would not accumulate within the waste containment unit. Compacted clay covers are still widely used today.
Vegetated Surface Layer (150 mm)
Clay Liner (> 600 mm)
Fig. 26. Schematic of compacted clay cover.
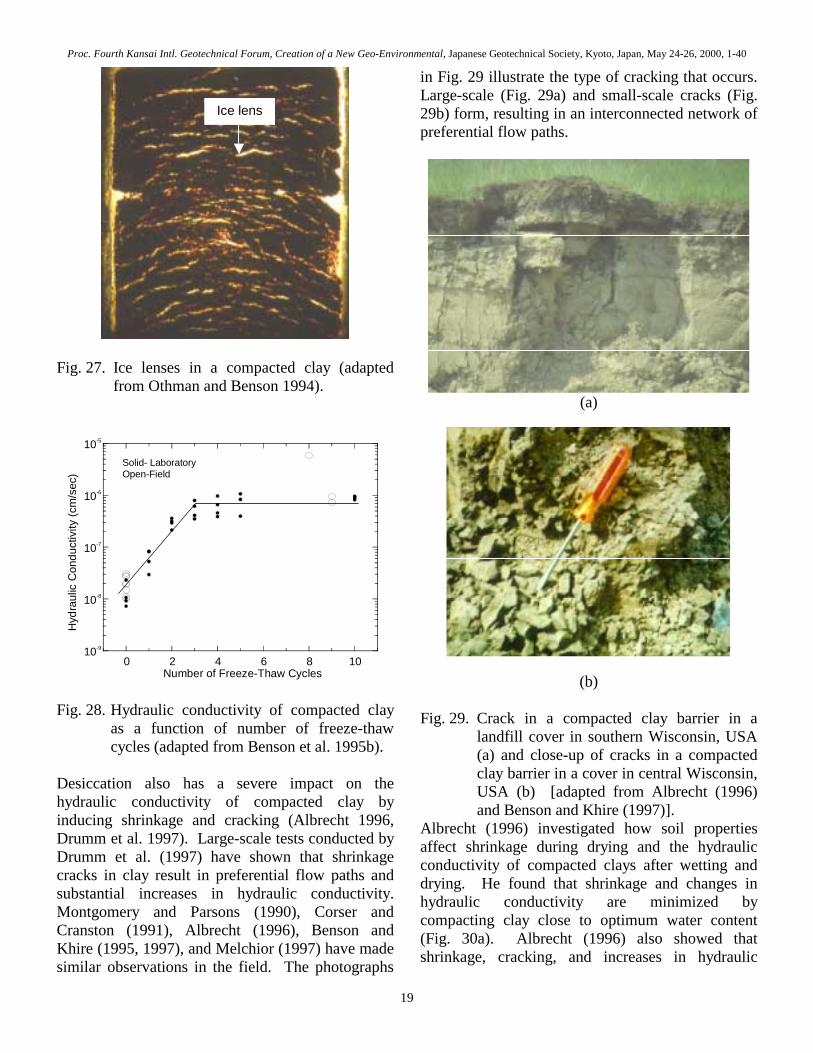
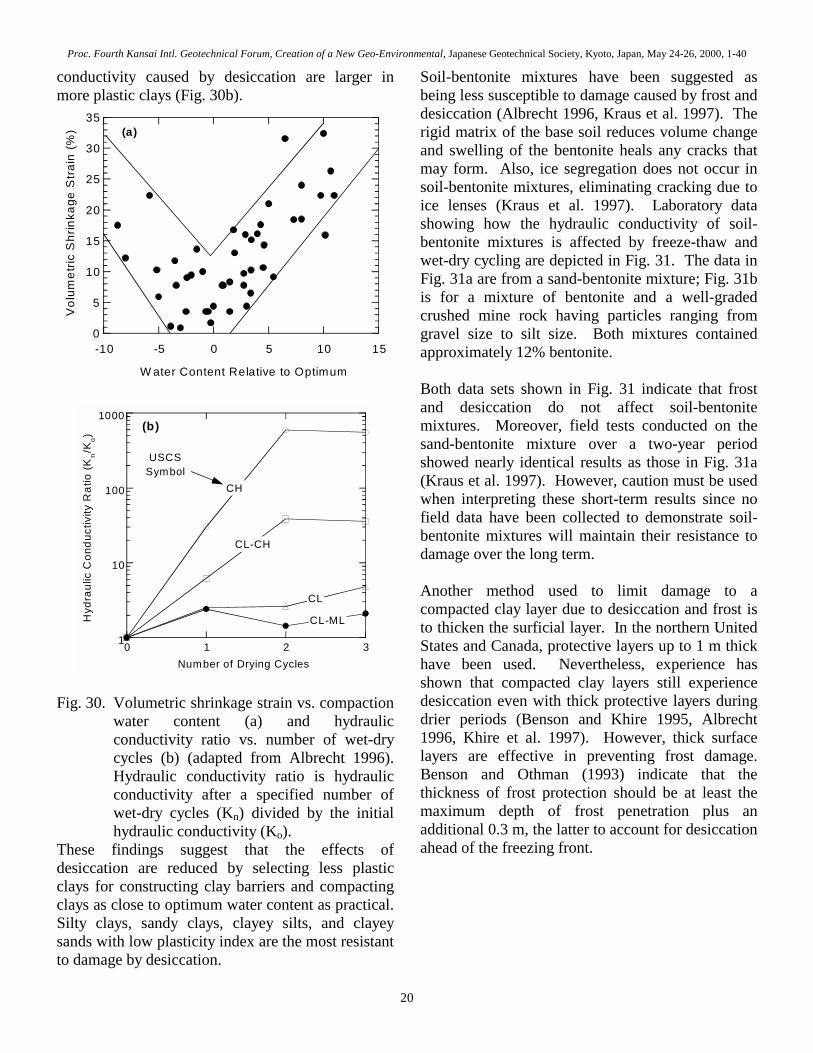
3.1.1 Frost Damage and Desiccation Deleterious impacts of desiccation and frost action were not considered when compacted clay covers were conceived. The pedogenetic effects associated with these factors include cracking of the compacted clay, which results in large increases in saturated hydraulic conductivity (Corser and Cranston 1991, Benson and Othman 1993, Othman et al. 1994). Frost-related damage to compacted clay barriers is caused by desiccation induced as the freezing front moves downward and by the formation of ice lenses (Benson and Othman 1993). Hydraulic gradients driving flow to the growing lenses cause desiccation of the underlying clay, which results in vertically oriented shrinkage cracks. Horizontal cracks are created as ice lenses form. The horizontal and vertical cracks form a permeable network responsible for the increase in hydraulic conductivity. An example of cracks formed by ice lenses is shown in Fig. 27. This photograph was taken by backlighting a frozen thin section trimmed from a larger frozen specimen. Ice lenses are the thin white features that are nearly horizontal. Laboratory and field testing has shown that most of the damage caused by frost occurs within three to five freeze-thaw cycles (Fig. 28). The magnitude of these changes can be predicted reasonably well using the standard laboratory methods in ASTM D 6035. The laboratory data in Fig. 28 were obtained using D 6035. The field data are from a test pad exposed to freezing and thawing that was constructed from the same clay as was used in the laboratory tests. The field and laboratory hydraulic conductivities are similar.
Proc. Fourth Kansai Intl. Geotechnical Forum, Creation of a New Geo-Environmental, Japanese Geotechnical Society, Kyoto, Japan, May 24-26, 2000, 1-40
19
Fig. 27. Ice lenses in a compacted clay (adapted from Othman and Benson 1994).
10-9
10-8
10-7
10-6
10-5
0 2 4 6 8 10
Hyd
raul
ic C
ondu
ctiv
ity (c
m/s
ec)
Number of Freeze-Thaw Cycles
Solid- LaboratoryOpen-Field
Fig. 28. Hydraulic conductivity of compacted clay as a function of number of freeze-thaw cycles (adapted from Benson et al. 1995b).
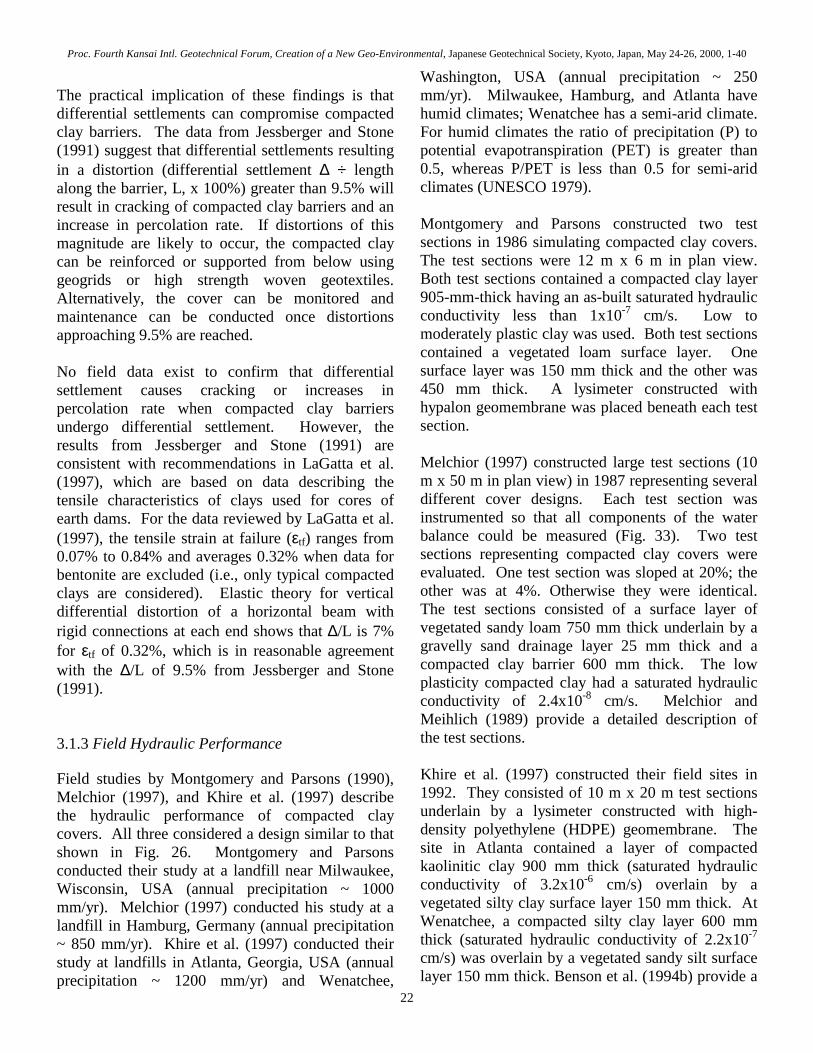
Desiccation also has a severe impact on the hydraulic conductivity of compacted clay by inducing shrinkage and cracking (Albrecht 1996, Drumm et al. 1997). Large-scale tests conducted by Drumm et al. (1997) have shown that shrinkage cracks in clay result in preferential flow paths and substantial increases in hydraulic conductivity. Montgomery and Parsons (1990), Corser and Cranston (1991), Albrecht (1996), Benson and Khire (1995, 1997), and Melchior (1997) have made similar observations in the field. The photographs
in Fig. 29 illustrate the type of cracking that occurs. Large-scale (Fig. 29a) and small-scale cracks (Fig. 29b) form, resulting in an interconnected network of preferential flow paths.
(a)
(b) Fig. 29. Crack in a compacted clay barrier in a
landfill cover in southern Wisconsin, USA (a) and close-up of cracks in a compacted clay barrier in a cover in central Wisconsin, USA (b) [adapted from Albrecht (1996) and Benson and Khire (1997)].
Albrecht (1996) investigated how soil properties affect shrinkage during drying and the hydraulic conductivity of compacted clays after wetting and drying. He found that shrinkage and changes in hydraulic conductivity are minimized by compacting clay close to optimum water content (Fig. 30a). Albrecht (1996) also showed that shrinkage, cracking, and increases in hydraulic
Ice lens
Proc. Fourth Kansai Intl. Geotechnical Forum, Creation of a New Geo-Environmental, Japanese Geotechnical Society, Kyoto, Japan, May 24-26, 2000, 1-40
20
conductivity caused by desiccation are larger in more plastic clays (Fig. 30b).
0
5
10
15
20
25
30
35
-10 -5 0 5 10 15
Vol
umet
ric S
hrin
kage
Str
ain
(%)
W ater Content Relative to Optimum
(a)
1
10
100
1000
0 1 2 3
Hyd
raul
ic C
ondu
ctiv
ity R
atio
(Kn/K
o)
Number of Drying Cycles
USCSSymbol
CH
CL-CH
CL
CL-ML
(b)
Fig. 30. Volumetric shrinkage strain vs. compaction
water content (a) and hydraulic conductivity ratio vs. number of wet-dry cycles (b) (adapted from Albrecht 1996). Hydraulic conductivity ratio is hydraulic conductivity after a specified number of wet-dry cycles (Kn) divided by the initial hydraulic conductivity (Ko).
These findings suggest that the effects of desiccation are reduced by selecting less plastic clays for constructing clay barriers and compacting clays as close to optimum water content as practical. Silty clays, sandy clays, clayey silts, and clayey sands with low plasticity index are the most resistant to damage by desiccation.
Soil-bentonite mixtures have been suggested as being less susceptible to damage caused by frost and desiccation (Albrecht 1996, Kraus et al. 1997). The rigid matrix of the base soil reduces volume change and swelling of the bentonite heals any cracks that may form. Also, ice segregation does not occur in soil-bentonite mixtures, eliminating cracking due to ice lenses (Kraus et al. 1997). Laboratory data showing how the hydraulic conductivity of soil-bentonite mixtures is affected by freeze-thaw and wet-dry cycling are depicted in Fig. 31. The data in Fig. 31a are from a sand-bentonite mixture; Fig. 31b is for a mixture of bentonite and a well-graded crushed mine rock having particles ranging from gravel size to silt size. Both mixtures contained approximately 12% bentonite. Both data sets shown in Fig. 31 indicate that frost and desiccation do not affect soil-bentonite mixtures. Moreover, field tests conducted on the sand-bentonite mixture over a two-year period showed nearly identical results as those in Fig. 31a (Kraus et al. 1997). However, caution must be used when interpreting these short-term results since no field data have been collected to demonstrate soil-bentonite mixtures will maintain their resistance to damage over the long term. Another method used to limit damage to a compacted clay layer due to desiccation and frost is to thicken the surficial layer. In the northern United States and Canada, protective layers up to 1 m thick have been used. Nevertheless, experience has shown that compacted clay layers still experience desiccation even with thick protective layers during drier periods (Benson and Khire 1995, Albrecht 1996, Khire et al. 1997). However, thick surface layers are effective in preventing frost damage. Benson and Othman (1993) indicate that the thickness of frost protection should be at least the maximum depth of frost penetration plus an additional 0.3 m, the latter to account for desiccation ahead of the freezing front.

Proc. Fourth Kansai Intl. Geotechnical Forum, Creation of a New Geo-Environmental, Japanese Geotechnical Society, Kyoto, Japan, May 24-26, 2000, 1-40
21
0 2 3 5 610-9
10-8
10-7
Hyd
raul
ic C
ondu
ctiv
ity (c
m/s
)
Number of Freeze-Thaw Cycles
(a)
0 1 2 3 410-8
10-7
10-6
Hyd
raul
ic C
ondu
ctiv
ity (c
m/s
)
Number of Wet-Dry Cycles
(b)
Fig. 31. Hydraulic conductivity vs. number of
freeze-thaw cycles (a) and number of wet-dry cycles (b) [adapted from Kraus et al. (1997) and Albrecht (1996)].
3.1.2 Differential Settlement Large settlements (5 to 30%) often occur in MSW landfills as the waste degrades (Edil et al. 1990). Heterogeneity in the waste inevitably results in differential settlements, which is evident in the undulating surface of most covers on MSW landfills. Differential settlement can affect the integrity of compacted clay barriers since compacted clays are brittle in tension and have low tensile strength. Jessberger and Stone (1991) conducted model tests in a geotechnical centrifuge to assess when differential settlement will cause cracking of a compacted clay barrier and whether the cracks
would result in higher percolation rates. A layer of compacted kaolinite was prepared on a table that contained a centrally located trap door. The trap door could be opened to induce an angular deformation θ in the compacted kaolinite layer while the centrifuge was operating (Fig. 32a). Water covering the compacted kaolinite layer provided a constant head for flow. A collection system was placed below the layer to collect any water that passed through the barrier.
0.1
1.0
10.0
100.0
0 2 4 6 8 10
Flow
(l/m
in)
Angular Deformation (θo)
(b)
Fig. 32. Definition of angular deformation (a) and
flow rates measured at various angular deformations (adapted from Jessberger and Stone 1991).
Results of centrifuge tests that were conducted to simulate the low effective stress typically in covers are shown in Fig. 32b. Flow rate through the barrier was very low and remained unchanged until θ reached 6o. At 6o, the flow rate jumped by a factor of 80 and remained relatively high as θ continued to increase. Examination of the clay barrier after testing showed that cracks formed at the point of maximum tensile strain and penetrated the entire thickness of the barrier (Fig. 8a).
(a)
Proc. Fourth Kansai Intl. Geotechnical Forum, Creation of a New Geo-Environmental, Japanese Geotechnical Society, Kyoto, Japan, May 24-26, 2000, 1-40
22
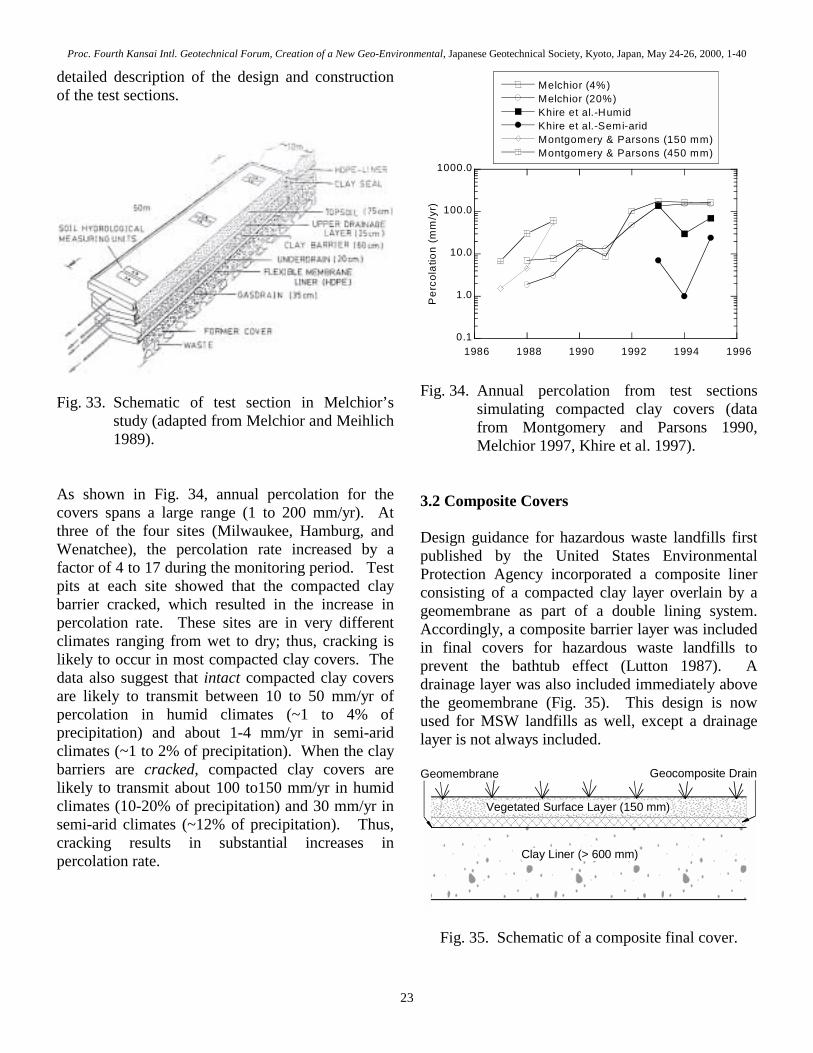
The practical implication of these findings is that differential settlements can compromise compacted clay barriers. The data from Jessberger and Stone (1991) suggest that differential settlements resulting in a distortion (differential settlement ∆ ÷ length along the barrier, L, x 100%) greater than 9.5% will result in cracking of compacted clay barriers and an increase in percolation rate. If distortions of this magnitude are likely to occur, the compacted clay can be reinforced or supported from below using geogrids or high strength woven geotextiles. Alternatively, the cover can be monitored and maintenance can be conducted once distortions approaching 9.5% are reached. No field data exist to confirm that differential settlement causes cracking or increases in percolation rate when compacted clay barriers undergo differential settlement. However, the results from Jessberger and Stone (1991) are consistent with recommendations in LaGatta et al. (1997), which are based on data describing the tensile characteristics of clays used for cores of earth dams. For the data reviewed by LaGatta et al. (1997), the tensile strain at failure (εtf) ranges from 0.07% to 0.84% and averages 0.32% when data for bentonite are excluded (i.e., only typical compacted clays are considered). Elastic theory for vertical differential distortion of a horizontal beam with rigid connections at each end shows that ∆/L is 7% for εtf of 0.32%, which is in reasonable agreement with the ∆/L of 9.5% from Jessberger and Stone (1991). 3.1.3 Field Hydraulic Performance Field studies by Montgomery and Parsons (1990), Melchior (1997), and Khire et al. (1997) describe the hydraulic performance of compacted clay covers. All three considered a design similar to that shown in Fig. 26. Montgomery and Parsons conducted their study at a landfill near Milwaukee, Wisconsin, USA (annual precipitation ~ 1000 mm/yr). Melchior (1997) conducted his study at a landfill in Hamburg, Germany (annual precipitation ~ 850 mm/yr). Khire et al. (1997) conducted their study at landfills in Atlanta, Georgia, USA (annual precipitation ~ 1200 mm/yr) and Wenatchee,
Washington, USA (annual precipitation ~ 250 mm/yr). Milwaukee, Hamburg, and Atlanta have humid climates; Wenatchee has a semi-arid climate. For humid climates the ratio of precipitation (P) to potential evapotranspiration (PET) is greater than 0.5, whereas P/PET is less than 0.5 for semi-arid climates (UNESCO 1979). Montgomery and Parsons constructed two test sections in 1986 simulating compacted clay covers. The test sections were 12 m x 6 m in plan view. Both test sections contained a compacted clay layer 905-mm-thick having an as-built saturated hydraulic conductivity less than 1x10⁻⁷ cm/s. Low to moderately plastic clay was used. Both test sections contained a vegetated loam surface layer. One surface layer was 150 mm thick and the other was 450 mm thick. A lysimeter constructed with hypalon geomembrane was placed beneath each test section. Melchior (1997) constructed large test sections (10 m x 50 m in plan view) in 1987 representing several different cover designs. Each test section was instrumented so that all components of the water balance could be measured (Fig. 33). Two test sections representing compacted clay covers were evaluated. One test section was sloped at 20%; the other was at 4%. Otherwise they were identical. The test sections consisted of a surface layer of vegetated sandy loam 750 mm thick underlain by a gravelly sand drainage layer 25 mm thick and a compacted clay barrier 600 mm thick. The low plasticity compacted clay had a saturated hydraulic conductivity of 2.4x10⁻⁸ cm/s. Melchior and Meihlich (1989) provide a detailed description of the test sections. Khire et al. (1997) constructed their field sites in 1992. They consisted of 10 m x 20 m test sections underlain by a lysimeter constructed with high-density polyethylene (HDPE) geomembrane. The site in Atlanta contained a layer of compacted kaolinitic clay 900 mm thick (saturated hydraulic conductivity of 3.2x10⁻⁶ cm/s) overlain by a vegetated silty clay surface layer 150 mm thick. At Wenatchee, a compacted silty clay layer 600 mm thick (saturated hydraulic conductivity of 2.2x10⁻⁷ cm/s) was overlain by a vegetated sandy silt surface layer 150 mm thick. Benson et al. (1994b) provide a
Proc. Fourth Kansai Intl. Geotechnical Forum, Creation of a New Geo-Environmental, Japanese Geotechnical Society, Kyoto, Japan, May 24-26, 2000, 1-40
23
detailed description of the design and construction of the test sections.
Fig. 33. Schematic of test section in Melchior’s
study (adapted from Melchior and Meihlich 1989).
As shown in Fig. 34, annual percolation for the covers spans a large range (1 to 200 mm/yr). At three of the four sites (Milwaukee, Hamburg, and Wenatchee), the percolation rate increased by a factor of 4 to 17 during the monitoring period. Test pits at each site showed that the compacted clay barrier cracked, which resulted in the increase in percolation rate. These sites are in very different climates ranging from wet to dry; thus, cracking is likely to occur in most compacted clay covers. The data also suggest that intact compacted clay covers are likely to transmit between 10 to 50 mm/yr of percolation in humid climates (~1 to 4% of precipitation) and about 1-4 mm/yr in semi-arid climates (~1 to 2% of precipitation). When the clay barriers are cracked, compacted clay covers are likely to transmit about 100 to150 mm/yr in humid climates (10-20% of precipitation) and 30 mm/yr in semi-arid climates (~12% of precipitation). Thus, cracking results in substantial increases in percolation rate.
0.1
1.0
10.0
100.0
1000.0
1986 1988 1990 1992 1994 1996
Melchior (4%)Melchior (20%)Khire et al.-HumidKhire et al.-Semi-aridMontgomery & Parsons (150 mm)Montgomery & Parsons (450 mm)
Per
cola
tion
(mm
/yr)
Fig. 34. Annual percolation from test sections
simulating compacted clay covers (data from Montgomery and Parsons 1990, Melchior 1997, Khire et al. 1997).
3.2 Composite Covers Design guidance for hazardous waste landfills first published by the United States Environmental Protection Agency incorporated a composite liner consisting of a compacted clay layer overlain by a geomembrane as part of a double lining system. Accordingly, a composite barrier layer was included in final covers for hazardous waste landfills to prevent the bathtub effect (Lutton 1987). A drainage layer was also included immediately above the geomembrane (Fig. 35). This design is now used for MSW landfills as well, except a drainage layer is not always included.
Vegetated Surface Layer (150 mm)
Clay Liner (> 600 mm)
Geomembrane Geocomposite Drain
Fig. 35. Schematic of a composite final cover.
Proc. Fourth Kansai Intl. Geotechnical Forum, Creation of a New Geo-Environmental, Japanese Geotechnical Society, Kyoto, Japan, May 24-26, 2000, 1-40
24
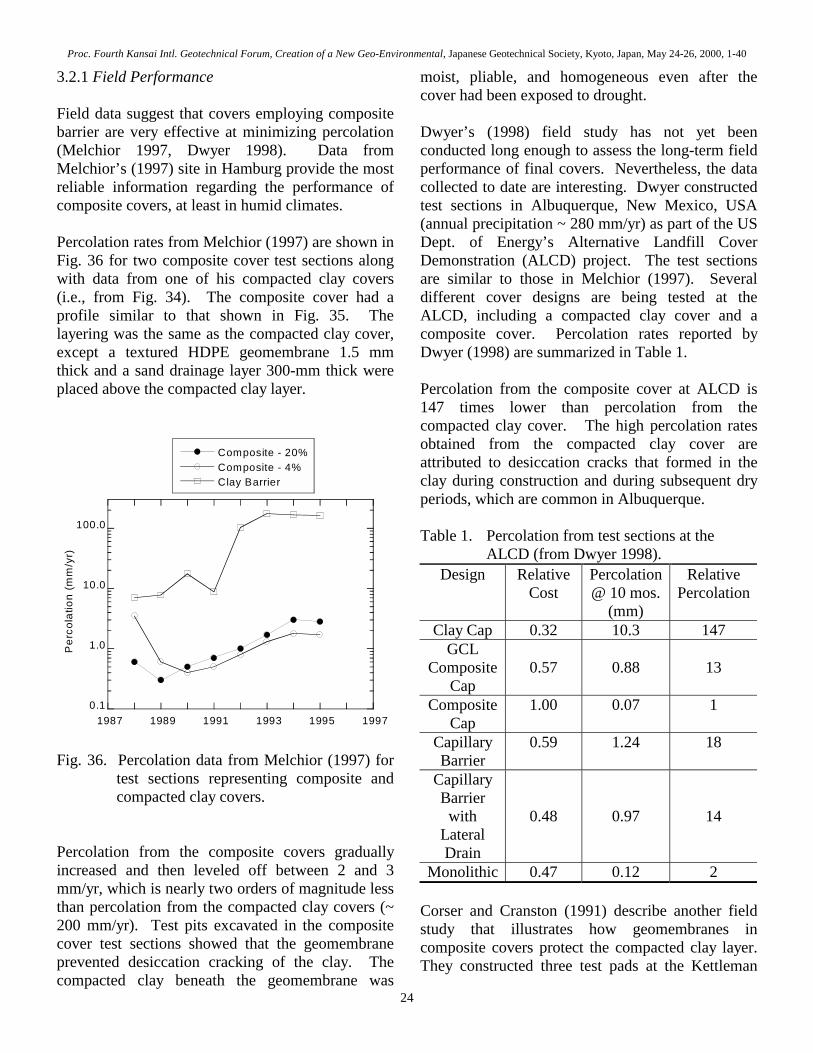
3.2.1 Field Performance Field data suggest that covers employing composite barrier are very effective at minimizing percolation (Melchior 1997, Dwyer 1998). Data from Melchior’s (1997) site in Hamburg provide the most reliable information regarding the performance of composite covers, at least in humid climates. Percolation rates from Melchior (1997) are shown in Fig. 36 for two composite cover test sections along with data from one of his compacted clay covers (i.e., from Fig. 34). The composite cover had a profile similar to that shown in Fig. 35. The layering was the same as the compacted clay cover, except a textured HDPE geomembrane 1.5 mm thick and a sand drainage layer 300-mm thick were placed above the compacted clay layer.
0.1
1.0
10.0
100.0
1987 1989 1991 1993 1995 1997
Composite - 20%Composite - 4%Clay Barrier
Per
cola
tion
(mm
/yr)
Fig. 36. Percolation data from Melchior (1997) for test sections representing composite and compacted clay covers.
Percolation from the composite covers gradually increased and then leveled off between 2 and 3 mm/yr, which is nearly two orders of magnitude less than percolation from the compacted clay covers (~ 200 mm/yr). Test pits excavated in the composite cover test sections showed that the geomembrane prevented desiccation cracking of the clay. The compacted clay beneath the geomembrane was
moist, pliable, and homogeneous even after the cover had been exposed to drought. Dwyer’s (1998) field study has not yet been conducted long enough to assess the long-term field performance of final covers. Nevertheless, the data collected to date are interesting. Dwyer constructed test sections in Albuquerque, New Mexico, USA (annual precipitation ~ 280 mm/yr) as part of the US Dept. of Energy’s Alternative Landfill Cover Demonstration (ALCD) project. The test sections are similar to those in Melchior (1997). Several different cover designs are being tested at the ALCD, including a compacted clay cover and a composite cover. Percolation rates reported by Dwyer (1998) are summarized in Table 1. Percolation from the composite cover at ALCD is 147 times lower than percolation from the compacted clay cover. The high percolation rates obtained from the compacted clay cover are attributed to desiccation cracks that formed in the clay during construction and during subsequent dry periods, which are common in Albuquerque. Table 1. Percolation from test sections at the
ALCD (from Dwyer 1998). Design Relative
Cost Percolation @ 10 mos.
(mm)
Relative Percolation
Clay Cap 0.32 10.3 147 GCL
Composite Cap
0.57
0.88
13
Composite Cap
1.00 0.07 1
Capillary Barrier
0.59 1.24 18
Capillary Barrier
with Lateral Drain
0.48
0.97
14
Monolithic 0.47 0.12 2 Corser and Cranston (1991) describe another field study that illustrates how geomembranes in composite covers protect the compacted clay layer. They constructed three test pads at the Kettleman

Proc. Fourth Kansai Intl. Geotechnical Forum, Creation of a New Geo-Environmental, Japanese Geotechnical Society, Kyoto, Japan, May 24-26, 2000, 1-40
25
Hills hazardous waste landfill in southern California, USA, which has a semi-arid climate. One test pad simulated a compacted clay cover, another a composite cover, and the third a compacted clay barrier covered only with a geomembrane. The profile for the composite cover consisted of 610 mm of vegetated fill, a 1.5-mm-thick HDPE geomembrane, and 915 mm of compacted highly plastic clay. The compacted clay cover had the same profile without the geomembrane. After six months of exposure to ambient conditions, test pits were excavated to examine the condition of the clay in each test pad. In the compacted clay cover, cracks 2-6 mm wide and 25-100 mm deep were found in the compacted clay layer as shown in Fig. 37. The water content had also dropped 6% in the upper 100 mm of the clay. Cracks of similar size were also found in the compacted clay layer covered only with a geomembrane. However, these cracks were located in isolated regions where a gap existed between the geomembrane and the compacted clay (Fig. 37b). At locations where the geomembrane and clay were in firm contact, the clay was moist. Solar heating of the geomembrane caused water to evaporate in regions where a gap existed between the clay and geomembrane. This water condensed on the underside of the geomembrane, and flowed along the surface of the geomembrane to regions where the clay and geomembrane were in contact. Unlike the other two test pads, the compacted clay barrier in the composite cover was devoid of cracks. The clay was moist, soft, and pliable as if it had just been placed. Test pits were excavated again three years after construction. In the compacted clay cover and the compacted clay overlain only with a geomembrane, cracks existed that were 5-10 mm wide and penetrated the entire thickness of the clay barrier. In contrast, the compacted clay in the composite cover was still moist and un-cracked (Patrick Corser, personal communication, Montgomery-Watson, Steamboat Springs, Colorado, USA, 1997). These findings indicate that the geomembrane in a composite cover is very effective in protecting the clay from desiccation cracking, as was reported by
Melchior (1997). Without a geomembrane, a compacted clay barrier is likely to crack and become very permeable. Montgomery and Parsons (1990), Albrecht (1996), Benson and Khire (1997), and Melchior (1997) have made similar observations. Also, simply covering the clay with a geomembrane is inadequate. A surface layer must be placed as soon as possible to provide a surcharge to maintain firm contact between the geomembrane and clay.
Note: Crack width varied between 2 to 6 mm;depth varied between 25 to 100 mm.
(a) Clay - Vegetative Cover
(b) Clay - Geomembrane
Dry
WetDry
Crystaline Precipitateon Surface of WetClay
Dry
Fig. 37. Sketch of surface of clay in compacted clay cover (a) and compacted clay covered only with a geomembrane (b) (adapted from Corser and Cranston 1991).
3.2.2 Drainage above the Geomembrane Stability problems can arise in composite covers without drainage layers or with inadequate drainage layers. Since the geomembrane impedes practically all of the flow, positive pore water pressures can
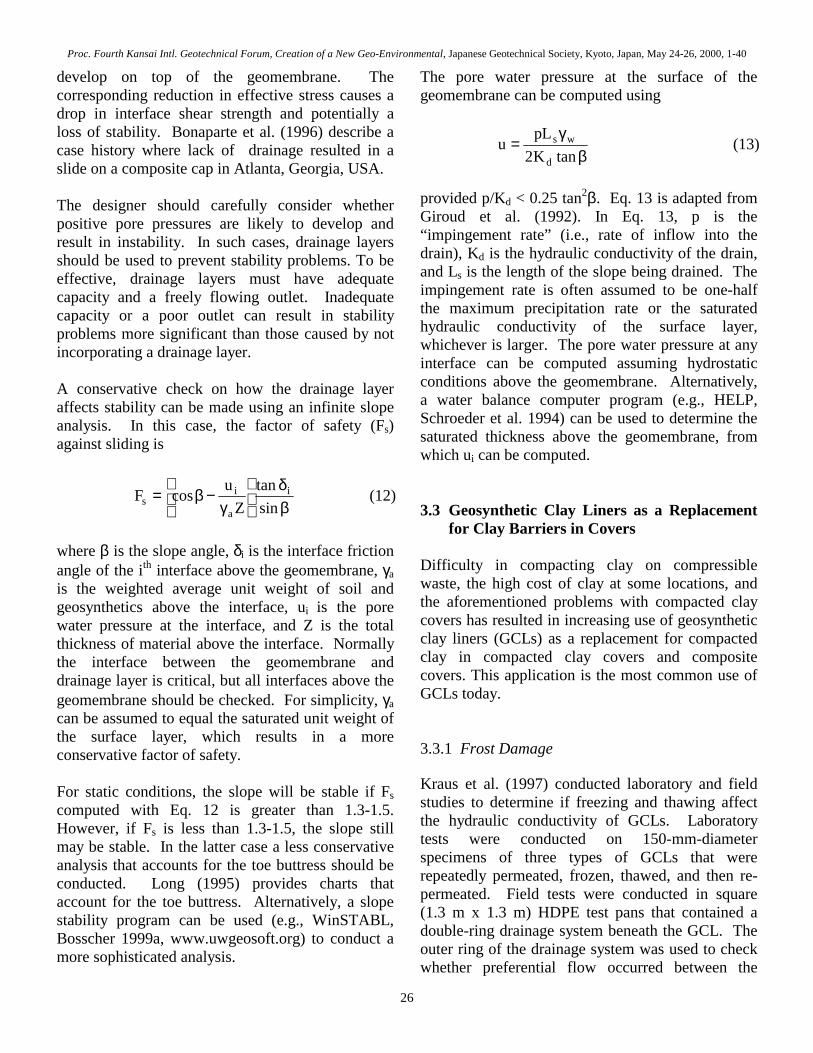
Proc. Fourth Kansai Intl. Geotechnical Forum, Creation of a New Geo-Environmental, Japanese Geotechnical Society, Kyoto, Japan, May 24-26, 2000, 1-40
26
develop on top of the geomembrane. The corresponding reduction in effective stress causes a drop in interface shear strength and potentially a loss of stability. Bonaparte et al. (1996) describe a case history where lack of drainage resulted in a slide on a composite cap in Atlanta, Georgia, USA. The designer should carefully consider whether positive pore pressures are likely to develop and result in instability. In such cases, drainage layers should be used to prevent stability problems. To be effective, drainage layers must have adequate capacity and a freely flowing outlet. Inadequate capacity or a poor outlet can result in stability problems more significant than those caused by not incorporating a drainage layer. A conservative check on how the drainage layer affects stability can be made using an infinite slope analysis. In this case, the factor of safety (Fs) against sliding is
βδ
γ
−β=sintan
Zu
cosF i
a
is (12)
where β is the slope angle, δi is the interface friction angle of the ith interface above the geomembrane, γa is the weighted average unit weight of soil and geosynthetics above the interface, ui is the pore water pressure at the interface, and Z is the total thickness of material above the interface. Normally the interface between the geomembrane and drainage layer is critical, but all interfaces above the geomembrane should be checked. For simplicity, γa can be assumed to equal the saturated unit weight of the surface layer, which results in a more conservative factor of safety. For static conditions, the slope will be stable if Fs computed with Eq. 12 is greater than 1.3-1.5. However, if Fs is less than 1.3-1.5, the slope still may be stable. In the latter case a less conservative analysis that accounts for the toe buttress should be conducted. Long (1995) provides charts that account for the toe buttress. Alternatively, a slope stability program can be used (e.g., WinSTABL, Bosscher 1999a, www.uwgeosoft.org) to conduct a more sophisticated analysis.
The pore water pressure at the surface of the geomembrane can be computed using
β
γ=
tanK2pL
ud
ws (13)
provided p/Kd < 0.25 tan2β. Eq. 13 is adapted from Giroud et al. (1992). In Eq. 13, p is the “impingement rate” (i.e., rate of inflow into the drain), Kd is the hydraulic conductivity of the drain, and Ls is the length of the slope being drained. The impingement rate is often assumed to be one-half the maximum precipitation rate or the saturated hydraulic conductivity of the surface layer, whichever is larger. The pore water pressure at any interface can be computed assuming hydrostatic conditions above the geomembrane. Alternatively, a water balance computer program (e.g., HELP, Schroeder et al. 1994) can be used to determine the saturated thickness above the geomembrane, from which ui can be computed. 3.3 Geosynthetic Clay Liners as a Replacement
for Clay Barriers in Covers Difficulty in compacting clay on compressible waste, the high cost of clay at some locations, and the aforementioned problems with compacted clay covers has resulted in increasing use of geosynthetic clay liners (GCLs) as a replacement for compacted clay in compacted clay covers and composite covers. This application is the most common use of GCLs today. 3.3.1 Frost Damage Kraus et al. (1997) conducted laboratory and field studies to determine if freezing and thawing affect the hydraulic conductivity of GCLs. Laboratory tests were conducted on 150-mm-diameter specimens of three types of GCLs that were repeatedly permeated, frozen, thawed, and then re-permeated. Field tests were conducted in square (1.3 m x 1.3 m) HDPE test pans that contained a double-ring drainage system beneath the GCL. The outer ring of the drainage system was used to check whether preferential flow occurred between the

Proc. Fourth Kansai Intl. Geotechnical Forum, Creation of a New Geo-Environmental, Japanese Geotechnical Society, Kyoto, Japan, May 24-26, 2000, 1-40
27
GCL and the test pan. GCLs in the test pans were overlain with a layer of gravel and exposed to two winters of weather. After the thaw each spring, water was placed on top of the GCLs and the outflow was measured to calculate the hydraulic conductivity. Typical results of the laboratory tests are summarized in Fig. 38. Essentially no change in hydraulic conductivity occurred. Similar results were obtained for all but one of the field tests. The field test that performed differently was for a GCL containing no additional bentonite in the seam. The hydraulic conductivity of this GCL increased by a factor of 25. Dye testing showed that preferential flow through the seam was responsible for the increase in hydraulic conductivity rather than damage to bentonite in the GCL. Nearly identical results were obtained in a bench-scale study conducted by Hewitt and Daniel (1997).
0 5 10 15 20
Specim en 1Specim en 2Specim en 3
1 10-9
2 10-9
3 10-9
4 10-9
5 10-9
Hyd
raul
ic C
ondu
ctiv
ity (c
m/s
)
Number of Freeze-Thaw Cycles
Fig. 38. Results of laboratory tests to assess how freeze-thaw cycling affects the hydraulic conductivity of GCLs (adapted from Kraus et al. 1997).
Kraus et al. (1997) indicate that GCLs are not damaged by frost because the hydrated bentonite is soft, and readily consolidates around ice lenses and other defects during thawing. Their findings along with those of others, suggest that GCLs are undamaged by freeze-thaw cycling provided that the seams contain additional bentonite. However, a word of caution: no field tests have been conducted
to determine the long-term performance of GCLs in cold regions. 3.3.2 Desiccation GCLs have been suggested as a superior alternative to compacted clay because cracks that form in a GCL during desiccation should swell shut during hydration due to the high swell potential of bentonite. However, mixed results have been obtained regarding the effect that desiccation has on the hydraulic conductivity of GCLs. Boardman and Daniel (1996) conducted large-scale laboratory tests on a GCL in a tank 2.4 m long, 1.2 m wide, and 0.9 m deep. The GCL was placed in the bottom of the tank on top of a drainage layer. Clamps were placed around the perimeter of the GCL to seal it against the edges of the tank, even during drying. Gravel was placed on top of the GCL to simulate a leachate collection layer. Pipes were installed in the gravel to route heated air for drying the GCL. Electrical resistance probes were installed in the GCL to determine when it ceased losing water during drying. Tap water was initially placed in the tank to hydrate the bentonite and to determine the initial hydraulic conductivity of the GCL. Afterwards, the water was drained and hot air was circulated through the gravel until probes in the GCL indicated the water content was no longer decreasing. The tank was then re-filled with tap water for permeation to define the hydraulic conductivity after drying. Results of the tests showed that the GCLs initially were very permeable, having a saturated hydraulic conductivity of approximately 10-3 cm/s. However, the hydraulic conductivity gradually dropped and after two days it returned to its value before drying (~10-8 cm/s). Melchior (1997) and James et al. (1997) describe case histories where GCLs apparently were damaged by desiccation. In both cases, GCLs buried in covers began to leak excessively. Exhumation revealed that the GCLs contained fine cracks that apparently formed during desiccation. Tests on bentonite from the exhumed GCLs showed that the exchange complex was primarily calcium

Proc. Fourth Kansai Intl. Geotechnical Forum, Creation of a New Geo-Environmental, Japanese Geotechnical Society, Kyoto, Japan, May 24-26, 2000, 1-40
28
and magnesium, which are the predominant cations in natural pore waters. Apparently sodium ions initially in the exchange complex were replaced by calcium and magnesium cations as pore water hydrated the bentonite. As a result the swell potential of the bentonite decreased. After calcium-for-sodium exchange, cracks that formed in the bentonite during dry periods did not swell shut when the bentonite was subsequently re-hydrated. Percolation from the covers increased due to preferential flow through these cracks. The findings of Melchior (1997) and James et al. (1997) prompted Lin and Benson (2000) to conduct a series of laboratory tests under controlled conditions to assess how GCLs are affected by desiccation and re-hydration with waters having concentrations of divalent cations typical of humid climates. Results of swell and hydraulic conductivity tests they conducted are shown in Fig. 39. Bentonite subjected to wet-dry cycling using deionized water (DI) water as the hydrating liquid showed no change in swell or hydraulic conductivity even after seven wet-dry cycles. In contrast, swell decreased when 0.0125 M CaCl2 solution was used for re-hydration and, after four wet-dry cycles, the hydraulic conductivity increased by a factor of 4000. Desiccation cracks that did not close during re-hydration were the cause of the increase in hydraulic conductivity. Lin and Benson (2000) also suggest that Boardman and Daniel (1996) did not see an increase in hydraulic conductivity since they conducted only a single drying cycle and used water having a concentration of divalent cations below that typical of natural pore waters. The results reported by Lin and Benson (2000) confirm the case histories reported by Melchior (1997) and James et al. (1997). That is, exchange of divalent cations in natural pore waters for sodium in the bentonite ultimately results in the bentonite being unable to swell sufficiently to close cracks that form during desiccation. As a result, GCLs that are exposed to wet-dry cycling are likely to fail in the long term unless cation exchange can be prevented. From a practical perspective, these findings suggest that GCLs should not be used in covers unless they will be placed directly beneath a geomembrane.
0
10
20
30
40
50
60
0 2 4 6 8 10
DI0.0125 M CaCl
2
Sw
ell (
mm
)
No. of W etting Cycles
(a)
10-10
10-9
10-8
10-7
10-6
10-5
10-4
0 2 3 5 6 8
Hyd
raul
ic C
ondu
ctiv
ity (c
m/s
)
No. of W etting Cycles
(b)
Fig. 39. Swell (a) and hydraulic conductivity (b) of
GCL subjected to wet-dry cycling using DI water and 0.0125 M CaCl2 solution (adapted from Lin and Benson 2000).
3.3.3 Shear Strength and Stability Covers employing GCLs are prone to instability because the drained friction angle of fully hydrated sodium bentonite is approximately 4o (Olson 1974). Consequently, reinforced GCLs (see Fig. 17) are used in nearly all cover applications. Daniel et al. (1998) conducted a field study for USEPA to investigate the operative shear strength of GCLs in final covers. Fourteen test sections were

Proc. Fourth Kansai Intl. Geotechnical Forum, Creation of a New Geo-Environmental, Japanese Geotechnical Society, Kyoto, Japan, May 24-26, 2000, 1-40
29
constructed on 2:1 and 3:1 slopes using various GCLs and arrangements of soil and geosynthetic layers. A schematic of a typical test section is shown in Fig. 40. After construction, the geosynthetics at the top of the slope were cut, resulting in an infinite slope condition. The test sections were monitored for two years, during which three test sections failed. None of the failures were due to internal failure of the GCL reinforcement. Rather, failures occurred on the geosynthetic interfaces.
29 m
0.9 m
13
Crest
Toe
Subsoil
GCL
Geomembrane
Cover Soil
GeonetDrainage Material
1.5 m
Fig. 40. Test section used to assess stability in field
study conducted by Daniel et al. (1998). Direct shear tests were conducted on all of the interfaces in a large-scale (300 mm x 300 mm) direct shear machine following methods in ASTM D 5321. Friction angles corresponding to peak shear strength (τp) and the shear strength at a large (50 mm) displacement (τld) were used to back-calculate factors of safety for each test section using an infinite slope analysis. Eight of the test sections that were stable had Fs > 1.3 based on τp and Fs > 1.0 based on τld. All of the test sections that failed had Fs ≤ 1.0 based on τp and Fs < 0.9 based on τld. Based on these results, a reasonable recommendation for design is to ensure that all slopes have a static factor of safety greater than 1.3 based on peak strength and 1.0 based on the large-displacement strength measured using D 5321. However, some practitioners prefer that the factor of safety based on the large-displacement strength be at least 1.3.
An important point is that the strength at large displacement measured in D 5321 is not the residual strength. Displacements greater than 1 m are required to obtain fully residual conditions in GCLs and for geosynthetic interfaces (Stark and Poeppel 1994, Eid et al. 1999). Displacements this large cannot be induced using D 5321. 3.4 Alternative Earthen Final Covers The high cost associated with composite final covers (~$400,000 to 500,000/ha) and the frequent failure of compacted clay covers has led to interest in alternative earthen final covers (AEFCs) in drier regions. AEFCs are earthen covers designed on water storage principles that perform equally as well as their prescriptive counterpart (i.e., composite or compacted clay covers), have greater durability, or lower cost (Table 1). In addition, AEFCs are perceived to be more harmonious and congruent with nature. AEFCs can be as simple as a monolithic layer of vegetated finer-grained soil or as complex as a multilayer anisotropic capillary barrier (Benson and Khire 1995, Stormont 1995, Gee and Ward 1997). AEFCs are receiving significant attention in North America, particularly in western regions that have semi-arid and arid climates. AEFCs are designed like a sponge (Fig. 41). They store water during periods of elevated precipitation and limited evapotranspiration as a dry sponge stores water that is wiped from a countertop. Stored water subsequently is released to the atmosphere during drier periods with higher evapotranspiration as does a sponge when not in use. In a similar manner as a sponge drips water when its storage capacity is exceeded, percolation from an AEFC occurs when the total water storage (S) exceeds its storage capacity (Sc). AEFCs are suitable in drier regions where PET far exceeds precipitation, and can be designed to have sufficient storage capacity to retain water during wet periods without transmitting appreciable percolation. A variety of designs are being considered for AEFCs, but most can be classified as monolithic barriers or capillary barriers.

Proc. Fourth Kansai Intl. Geotechnical Forum, Creation of a New Geo-Environmental, Japanese Geotechnical Society, Kyoto, Japan, May 24-26, 2000, 1-40
30
Precipitation
L“Sponge”
InfiltrationCOVER
Percolation ifS > Sc
Fig. 41. Sponge principle for design of AEFCs (adapted from Chen 1999).
3.4.1 Monolithic Covers Monolithic AEFCs consist of a thick vegetated layer of finer textured soil that has high water storage capacity. A monolithic cover is made sufficiently thick so that water contents near the base of the cover remain fairly low. Under this condition, percolation from the base of the cover can be small enough to meet target percolation rates. The target percolation rate is selected based on the percolation rate associated with the prescriptive cover that the monolithic cover is to replace. The Alternative Cover Assessment Program (ACAP) sponsored by the USEPA has defined target percolation rates for humid climates and semi-arid (or drier) climates that correspond to compacted clay and composite covers. These percolation rates are summarized in Table 2. Chen (1999) describes a method to select the thickness (Lc) of a monolithic cover using site-specific meteorological data and soil water characteristic curves (SWCCs) for the soil. The method is based on a series of unsaturated flow simulations that were conducted to identify the most critical meteorological years for use in design.
Table 2. Equivalent percolation rates for prescriptive final covers for USEPA’s ACAP Program (Benson 1999).
Maximum Annual Percolation (mm/yr)
Type of
Prescriptive Cover
Semi-Arid & Drier
(P/PET ≤ 0.5)
Humid (P/PET >
0.5) Compacted
Clay (or Lesser)
10
30
Composite 3 3 The first step in Chen’s method is to examine the existing meteorological record for the site and determine the wettest year on record and the snowiest year on record, the latter only being relevant at colder sites. Total precipitation (Ptw or Pts, respectively) and total precipitation outside the growing season (Pow or Pos, respectively) are recorded for these two years. Two parameters describing the storage capacity of the soil layer are then computed: the cover field capacity (Sf) and the cover storage capacity (Sc). The cover field capacity equals the field capacity of the cover soil (θf) multiplied by the cover thickness (i.e., Sf = θfL). Chen (1999) used the traditional definition of field capacity (θ at suction of 33 kPa) which is obtained from the SWCC. Alternatively, flux-based definitions of field capacity can be used (Meyer and Gee 1999). The cover storage capacity, Sc, is defined as: cwfc L)(S θ−θ= (14) where θw is the wilting point of the cover soil. The wilting point is estimated as the water content at a suction of 1500 kPa. This estimate is conservative since plants in semi-arid and arid regions can usually extract water from the root zone at suctions higher than 1500 kPa (Meyer and Gee 1999). Six estimates of the required thickness of the cover are then made using Eqs. 15:
cf
twfftw L/S2
PFL = (15a)

Proc. Fourth Kansai Intl. Geotechnical Forum, Creation of a New Geo-Environmental, Japanese Geotechnical Society, Kyoto, Japan, May 24-26, 2000, 1-40
31
cf
tsffts L/S2
PFL = (15b)
and Eqs. 16:
cc
twcctw L/S2
PFL = (16a)
cc
toccow L/S2
PFL = (16b)
cc
tsccts L/S2
PFL = (16c)
cc
osccos L/S2
PFL = (16d)
The functions Ff and Fc in Eqs. 15 and 16 are related to the target percolation rate (P) and were defined empirically by Chen (1999) based on an analysis of results from unsaturated flow simulations. Function Ff is
f
ff
PlogF
κ−α
= (17a)
and Fc is
c
cc
PlogF
κ−α
= (17b)
The parameters αc, αf, κf, and κc in Eqs. 17 are summarized in Table 3. The preliminary design thickness (Lp) is selected as: [ ]coscftscowctwftsftwp L,L,L,L,L,LmaxL = (18) A monolithic cover with thickness Lp is then simulated using a suitable unsaturated flow model (e.g., WinUNSAT-H, Bosscher 1999b, see www.uwgeosoft.org). Wilson et al. (1999) provide guidance on selecting an appropriate model. Meteorological data for the wettest year on record and the snowiest year on record five years back-to-back are used to conduct two simulations. The percolation rates obtained from these simulations are compared to the target percolation rate. Based on this comparison, the cover thickness is adjusted if necessary to tighten or loosen the design. The
thickness defined after any adjustments is the final design thickness, Ld.
Table 3. Parameters for functions Ff and Fc (for P
and precipitation in mm/yr). For use with Eq. No. αc or αf κc or κf
4a, 4b 10 8 5a, 5c 2 2.9 5b, 5d 3.3 3.2
3.4.2 Capillary Barriers Capillary barriers employ a contrast in texture (e.g., silt layer overlying a sand layer) to form a capillary break that impedes downward flow until the finer soil becomes nearly saturated. A break exists at the interface because, at the same matric potential, coarse soils typically have lower unsaturated hydraulic conductivity (Kψ) than finer soils (e.g., Fig. 42b). The degree of saturation of the finer layer at which breakthrough into the coarser layer occurs depends on the SWCCs of each layer (Stormont and Anderson 1999, Khire et al. 1999). Breakthrough occurs when the matric suction at the interface between the layers reaches a value corresponding to the sharp bend in the SWCC of the coarser soil near residual water content (Khire et al. 1999), referred to as ψB (Fig. 42a). For the sandy silt and pea gravel in Fig. 42a, ψB is 25 cm. The volumetric water content of the finer layer (θBF) at which breakthrough into the coarser layer occurs is 0.34. The volumetric water content of the coarser layer at ψB is approximately 0.02. At ψB, Kψ of the coarser layer is 10-7 cm/s, which is lower than that of the finer layer. The thickness of the finer layer (Lf) is sized to have sufficient water storage capacity to store water during cooler and wetter months while limiting percolation to below a prescribed threshold (Stormont and Morris 1998, Khire et al. 2000). The storage capacity of the finer layer is computed as:
fw
L
0zc LdzS
f
θ−θ= ∫ (18)

Proc. Fourth Kansai Intl. Geotechnical Forum, Creation of a New Geo-Environmental, Japanese Geotechnical Society, Kyoto, Japan, May 24-26, 2000, 1-40
32
where z is the distance above the interface (Stormont and Morris 1998). The function θz is defined by the SWCC and θBF. At z = 0, θz = θBF. For z > 0, θz equals the water content on the soil water characteristic curve corresponding to suction ψ = ψB+z (Khire et al. 2000). This calculation implicitly assumes that a unit hydraulic gradient exists immediately prior to breakthrough across the interface, as demonstrated experimentally by Stormont and Anderson (1999).
10-1
101
103
105
0.0 0.1 0.2 0.3 0.4
Volumetric Water Content ( θ )
Mat
ric S
uctio
n (c
m)
(a)
Finer
Coarser
θBC θ
BF
BC B
FψB
θBC
= 0.0195
θBF
= 0.341ψ
B = 25 cm
10-12
10-10
10-8
10-6
10-4
10-2
100
10-1 100 101 102 103 104
Matric Suction (cm)
Hyd
raul
ic C
ondu
ctiv
ity (c
m/s
) (b)
Finer
Coarser
ψB
Coarser Soil:ψ
B = 25 cm
Kψ = 10-7 cm/s
Fig. 42. Soil water characteristic curves (a) and
unsaturated hydraulic conductivity functions (b) for a silty sand and gravel (from Khire et al. 2000).
The required storage capacity conservatively is assumed to equal the amount of precipitation received outside the growing season during the wettest year on record and the snowiest year on record (e.g., Pow or Pos, respectively, as for
monolithic covers). Thickness of the finer layer, Lf, is then computed by setting Sc in Eq. 18 equal to Pow or Pos and solving for Lfw and Lfs
fww
L
0zow LdzP
fw
θ−θ= ∫ (19a)
fsw
L
0zos LdzP
fs
θ−θ= ∫ (19b)
The larger of Lfw and Lfs is used as the preliminary design thickness, Lfp. Then, as for monolithic covers, simulations are conducted using an unsaturated flow model to verify that Lfp is suitable. Adjustments are then made to the final cover thickness, if necessary, to define the final design thickness, Lfd, of the finer layer. Thickness of the coarser layer is not nearly as important as that of the finer layer since the coarser layer provides little storage capacity. The coarser layer only needs to be thick enough to provide a good working platform for placement of the finer layer. A layer 300-mm thick is generally adequate (Khire et al. 2000). 3.4.3 Site-Specific Design An aspect of AEFC design that differs from the design of prescriptive covers is that the cover profile is a function of meteorological conditions and vegetation. Thus, the cover thickness varies with location. For example, Winkler (1999) conducted a modeling study evaluating how the thickness of monolithic covers varies with location throughout the western United States. He used site-specific meteorological data and vegetative properties in his analysis. Some findings of Winkler’s study are shown in Fig. 43, which is a contour map of the thickness of silt loam required to achieve an annual percolation rate of 10 mm/yr. The silt loam had a saturated hydraulic conductivity of 10-5 cm/s. The map indicates that very thin covers can be used in the desert southwest (e.g., Arizona, Nevada, New Mexico) whereas much thicker covers are required in the cool deserts where significant snowfall occurs (e.g., Montana, Wyoming, North Dakota).
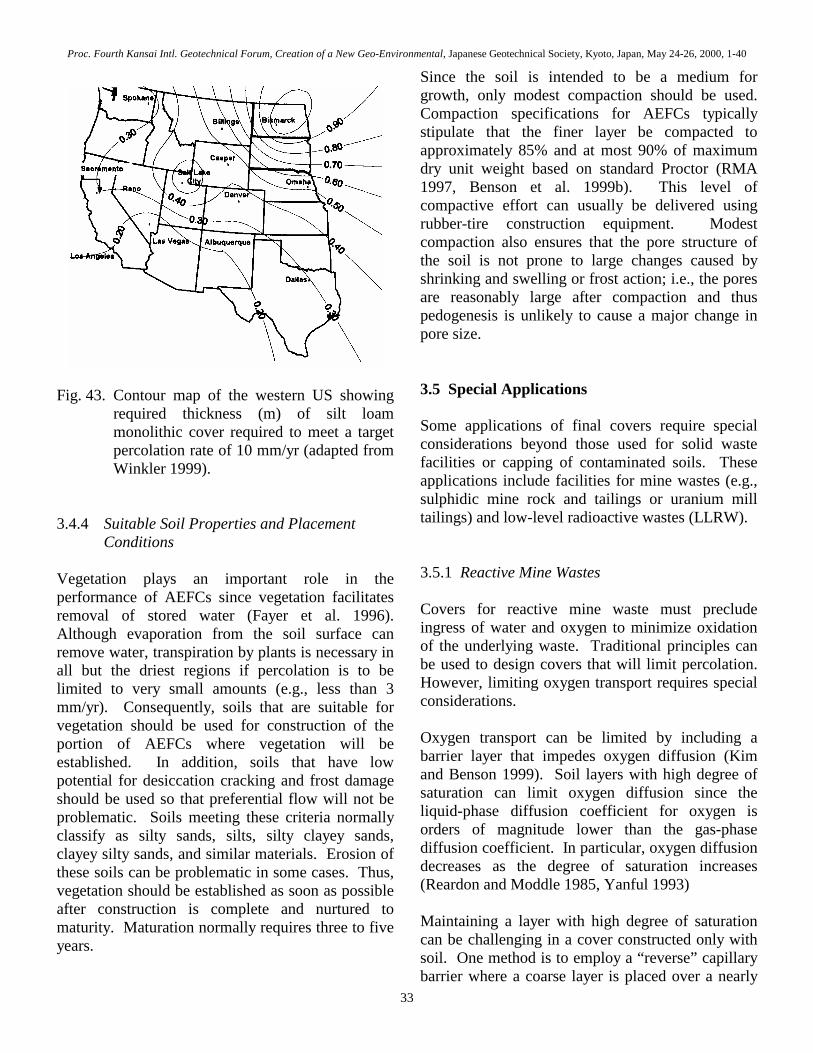
Proc. Fourth Kansai Intl. Geotechnical Forum, Creation of a New Geo-Environmental, Japanese Geotechnical Society, Kyoto, Japan, May 24-26, 2000, 1-40
33
Fig. 43. Contour map of the western US showing
required thickness (m) of silt loam monolithic cover required to meet a target percolation rate of 10 mm/yr (adapted from Winkler 1999).
3.4.4 Suitable Soil Properties and Placement
Conditions Vegetation plays an important role in the performance of AEFCs since vegetation facilitates removal of stored water (Fayer et al. 1996). Although evaporation from the soil surface can remove water, transpiration by plants is necessary in all but the driest regions if percolation is to be limited to very small amounts (e.g., less than 3 mm/yr). Consequently, soils that are suitable for vegetation should be used for construction of the portion of AEFCs where vegetation will be established. In addition, soils that have low potential for desiccation cracking and frost damage should be used so that preferential flow will not be problematic. Soils meeting these criteria normally classify as silty sands, silts, silty clayey sands, clayey silty sands, and similar materials. Erosion of these soils can be problematic in some cases. Thus, vegetation should be established as soon as possible after construction is complete and nurtured to maturity. Maturation normally requires three to five years.
Since the soil is intended to be a medium for growth, only modest compaction should be used. Compaction specifications for AEFCs typically stipulate that the finer layer be compacted to approximately 85% and at most 90% of maximum dry unit weight based on standard Proctor (RMA 1997, Benson et al. 1999b). This level of compactive effort can usually be delivered using rubber-tire construction equipment. Modest compaction also ensures that the pore structure of the soil is not prone to large changes caused by shrinking and swelling or frost action; i.e., the pores are reasonably large after compaction and thus pedogenesis is unlikely to cause a major change in pore size. 3.5 Special Applications Some applications of final covers require special considerations beyond those used for solid waste facilities or capping of contaminated soils. These applications include facilities for mine wastes (e.g., sulphidic mine rock and tailings or uranium mill tailings) and low-level radioactive wastes (LLRW). 3.5.1 Reactive Mine Wastes Covers for reactive mine waste must preclude ingress of water and oxygen to minimize oxidation of the underlying waste. Traditional principles can be used to design covers that will limit percolation. However, limiting oxygen transport requires special considerations. Oxygen transport can be limited by including a barrier layer that impedes oxygen diffusion (Kim and Benson 1999). Soil layers with high degree of saturation can limit oxygen diffusion since the liquid-phase diffusion coefficient for oxygen is orders of magnitude lower than the gas-phase diffusion coefficient. In particular, oxygen diffusion decreases as the degree of saturation increases (Reardon and Moddle 1985, Yanful 1993) Maintaining a layer with high degree of saturation can be challenging in a cover constructed only with soil. One method is to employ a “reverse” capillary barrier where a coarse layer is placed over a nearly
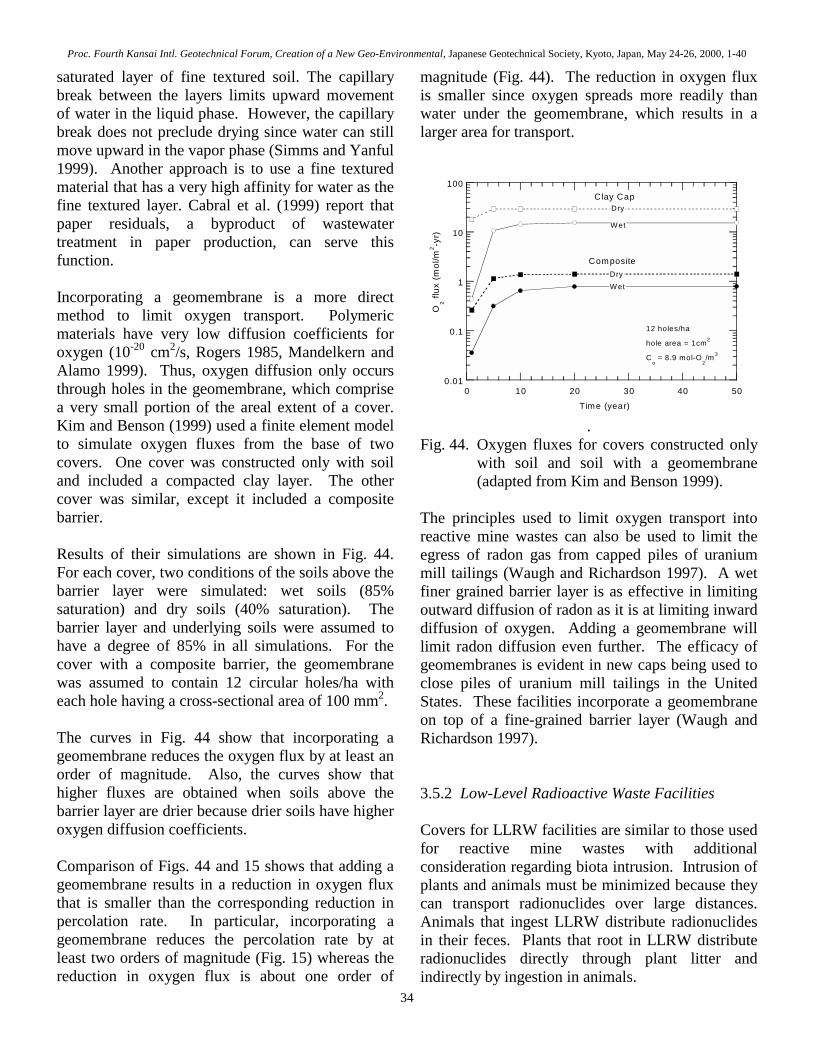
Proc. Fourth Kansai Intl. Geotechnical Forum, Creation of a New Geo-Environmental, Japanese Geotechnical Society, Kyoto, Japan, May 24-26, 2000, 1-40
34
saturated layer of fine textured soil. The capillary break between the layers limits upward movement of water in the liquid phase. However, the capillary break does not preclude drying since water can still move upward in the vapor phase (Simms and Yanful 1999). Another approach is to use a fine textured material that has a very high affinity for water as the fine textured layer. Cabral et al. (1999) report that paper residuals, a byproduct of wastewater treatment in paper production, can serve this function. Incorporating a geomembrane is a more direct method to limit oxygen transport. Polymeric materials have very low diffusion coefficients for oxygen (10-20 cm2/s, Rogers 1985, Mandelkern and Alamo 1999). Thus, oxygen diffusion only occurs through holes in the geomembrane, which comprise a very small portion of the areal extent of a cover. Kim and Benson (1999) used a finite element model to simulate oxygen fluxes from the base of two covers. One cover was constructed only with soil and included a compacted clay layer. The other cover was similar, except it included a composite barrier. Results of their simulations are shown in Fig. 44. For each cover, two conditions of the soils above the barrier layer were simulated: wet soils (85% saturation) and dry soils (40% saturation). The barrier layer and underlying soils were assumed to have a degree of 85% in all simulations. For the cover with a composite barrier, the geomembrane was assumed to contain 12 circular holes/ha with each hole having a cross-sectional area of 100 mm2. The curves in Fig. 44 show that incorporating a geomembrane reduces the oxygen flux by at least an order of magnitude. Also, the curves show that higher fluxes are obtained when soils above the barrier layer are drier because drier soils have higher oxygen diffusion coefficients. Comparison of Figs. 44 and 15 shows that adding a geomembrane results in a reduction in oxygen flux that is smaller than the corresponding reduction in percolation rate. In particular, incorporating a geomembrane reduces the percolation rate by at least two orders of magnitude (Fig. 15) whereas the reduction in oxygen flux is about one order of
magnitude (Fig. 44). The reduction in oxygen flux is smaller since oxygen spreads more readily than water under the geomembrane, which results in a larger area for transport.
0.01
0.1
1
10
100
0 10 20 30 40 50
O2 fl
ux (
mol
/m2 -y
r)
T ime (year)
12 holes/ha
hole area = 1cm2
Co = 8.9 mol-O
2/m 3
W et
W et
Dry
DryComposite
Clay Cap
. Fig. 44. Oxygen fluxes for covers constructed only
with soil and soil with a geomembrane (adapted from Kim and Benson 1999).
The principles used to limit oxygen transport into reactive mine wastes can also be used to limit the egress of radon gas from capped piles of uranium mill tailings (Waugh and Richardson 1997). A wet finer grained barrier layer is as effective in limiting outward diffusion of radon as it is at limiting inward diffusion of oxygen. Adding a geomembrane will limit radon diffusion even further. The efficacy of geomembranes is evident in new caps being used to close piles of uranium mill tailings in the United States. These facilities incorporate a geomembrane on top of a fine-grained barrier layer (Waugh and Richardson 1997). 3.5.2 Low-Level Radioactive Waste Facilities Covers for LLRW facilities are similar to those used for reactive mine wastes with additional consideration regarding biota intrusion. Intrusion of plants and animals must be minimized because they can transport radionuclides over large distances. Animals that ingest LLRW distribute radionuclides in their feces. Plants that root in LLRW distribute radionuclides directly through plant litter and indirectly by ingestion in animals.

Proc. Fourth Kansai Intl. Geotechnical Forum, Creation of a New Geo-Environmental, Japanese Geotechnical Society, Kyoto, Japan, May 24-26, 2000, 1-40
35
Incorporating layers that preclude burrowing of animals into the barrier layer and the underlying waste limits the intrusion of animals. Albrecht and Benson (1997) summarized the small amount of information available regarding design methods for barriers to animal intrusion and provide design guidance. Albrecht and Benson (1997) indicate that the first step is identifying the design animal and its burrowing habits. Then a barrier material needs to be selected that will preclude burrowing. Granular protection layers should have a particle diameter greater than the breadth of the design animal, since animals will not excavate particles that cannot be pushed out of their burrow. Pores in the media should also be sufficiently small to preclude interparticle burrowing. A coarse layer can also limit plant intrusion since coarse layers generally have little water storage and roots are attracted to water. However, root barrier layers are more effective. Root barrier layers are light non-woven geotextiles to which plastic nodules containing herbicide are attached. The herbicide slowly diffuses into the geotextile where it prevents roots from penetrating (Benson et al. 1999b). Root barrier layers typically have a design life of about 20 yr. 4 SUMMARY This paper has reviewed the technology associated with liners and covers used for waste containment systems. Emphasis has been placed on factors influencing the performance of liners and covers and methods to design liners and covers to meet a performance criterion. The discussion of liners included compacted clay liners, geosynthetic clay liners, geomembrane liners, and composite liners. Issues such as chemical compatibility, scaling from laboratory to field, stability issues, and suitable specifications have been discussed. A method for performance-based design of liners was also summarized. The discussion of covers primarily focused on environmental factors that affect hydrologic performance in the context of laboratory data and
field performance data. Covers employing a soil barrier with low saturated hydraulic conductivity (compacted clay or GCL) as the primary impedance to flow have been shown to perform poorly due to the effects of desiccation and frost action. Covers with a composite barrier layer or alternative earthen covers designed based on water balance principles appear to have better long-term performance. Procedures to design alternative covers were summarized. Other issues such as controlling gas diffusion and biota intrusion were also described. The most important issues in liner and cover design to consider in the future are performance-based design and analysis of field performance data. Performance-based design permits the engineer to truly design a facility to meet performance criteria, while considering the geological setting and economics. More extensive use of performance-based design requires that additional field performance data be collected that can be used to assess design methods. The existing database on field performance is meager, especially considering the large quantity of research that has been conducted on waste containment systems and the volume of regulations that have been promulgated throughout the world during the last 20 years. 5 ACKNOWLEDGEMENT Support for Dr. Benson’s research on waste containment systems has been provided by a number of sponsors including the US National Science Foundation, the US Environmental Protection Agency, the City of Glendale, Arizona, the States of Colorado and Wisconsin, Waste Management, Inc., Browning-Ferris Industries, Inc., EQ, Inc., and the National Council of the Pulp and Paper Industry for Air and Stream Improvement. This support is gratefully acknowledged. Thought provoking discussions with graduate students and professional colleagues on waste containment systems have been essential to this research. While the are too many persons to name individually, their input has been of great value. This paper is solely a work product of the author. Endorsement by any of the research sponsors is not implied and should not be construed. Mr. Xiaodong Wang and Dr. Tarek

Proc. Fourth Kansai Intl. Geotechnical Forum, Creation of a New Geo-Environmental, Japanese Geotechnical Society, Kyoto, Japan, May 24-26, 2000, 1-40
36
Abichou prepared some of the illustrations in this paper. 6 REFERENCES Albrecht, B. (1996) Effect of Desiccation on
Compacted Clay, MS Thesis, University of Wisconsin, Madison, Wisconsin, USA.
Albrecht, B. and Benson, C. (1997), Design of Biota Barriers, Report to State of Colorado Dept. of Public Health, by Civil Engineering Consultants, Verona, Wisconsin, USA.
Alston, C., Daniel, D., and Devroy, D. (1997), Design and Construction of Sand-Bentonite Liner for Effluent Treatment Lagoon, Canadian Geotech. J., 34, 841-852.
Anderson, D. (1982), Does Landfill Leachate Make Clay Liners More Permeable?, Civil Engineering, ASCE, 52(9), 66-69.
Anderson, D., Brown, K., and Thomas, J. (1985), Conductivity of Compacted Clay Soils to Water and Organic Liquids, Waste Management & Research, 3, 339-349.
August, H. and Tatzky, R. (1984), Permeabilities of Commercially Available Polymeric Liners for Hazardous Waste Landfill Leachate Organic Constituents, Proc. Intl. Conf. On Geomembranes, Industrial Fabrics Assoc. Intl., St. Paul, MN, USA, 163-168.
Benson, C. and Daniel, D. (1990), Influence of Clods on the Hydraulic Conductivity of Compacted Clay, J. of Geotech. Engr., ASCE, 116(8), 1231-1248.
Benson, C. and Boutwell, G. (1992), Compaction Control and Scale-Dependent Hydraulic Conductivity of Clay Liners, Proc. of the 15th International Madison Waste Conference, Madison, Wisconsin, USA, Sept. 23-24, 62-83.
Benson, C. and Othman, M. (1993), Hydraulic Conductivity of Compacted Clay Frozen and Thawed In Situ, J. of Geotech. Engr., ASCE, 119(2), 276-294.
Benson, C. (1994), Research Developments in Clay Liner Construction, Proc. 32nd Annual International Solid Waste Exposition, Solid Waste Association of North America, Silver Spring, Maryland, USA, 81-93.
Benson, C. and Daniel, D. (1994a), Minimum Thickness of Compacted Soil Liners: I-Stochastic
Models, J. of Geotech. Engr., ASCE, 120(1), 129-152.
Benson, C. and Daniel, D. (1994b), Minimum Thickness of Compacted Soil Liners: II-Analysis and Case Histories, J. of Geotech. Engr., ASCE, 120(1), 153-172.
Benson, C., Hardianto, F., and Motan, E. (1994a), Representative Specimen Size for Hydraulic Conductivity of Compacted Soil Liners, Hydraulic Conductivity and Waste Containment Transport in Soils, STP 1142, ASTM, S. Trautwein and D. Daniel, Eds., 3-29.
Benson, C., Abichou, T., Olson, M., and Bosscher, P. (1995a), Winter Effects on the Hydraulic Conductivity of Compacted Clay, J. of Geotech. Engr., ASCE, 121(1), 69-79.
Benson, C., Bosscher, P., Lane, D., and Pliska, R. (1994b), Monitoring System for Hydrologic Evaluation of Landfill Final Covers, Geotech. Testing J., ASTM, 17(2), 138-149.
Benson, C. and Khire, M. (1995), Earthen Covers for Semi-Arid and Arid Climates, Landfill Closures, ASCE, GSP No. 53, J. Dunn and U. Singh, Eds., 201-217.
Benson, C. and Khire, M. (1997), Earthen Materials in Surface Barriers, Barrier Technologies for Environmental Management, National Academy Press, National Research Council, Washington, DC, USA, D79-D89.
Benson, C., Tinjum, J., and Hussin, C. (1995), Leakage Rates Through Geomembranes Containing Holes, Proc. Geosynthetics 95, Industrial Fabrics Assoc. Intl., St. Paul, USA, 745-758.
Benson, C. (1999), Final Covers for Waste Containment Systems: A North American Perspective, Proc. XVII Conference of Geotechnics of Torino, Control and Management of Subsoil Pollutants, Italian Geotechnical Society, Torino, Italy, 1-32.
Benson, C., Daniel, D., and Boutwell, G. (1999a), Field Performance of Compacted Clay Liners, J. of Geotech. and Geoenviron. Engr., ASCE, 125(5), 390-403.
Benson, C., Abichou, T., Wang, X., Gee, G., and Albright, W. (1999b), Test Section Installation Instructions Alternative Cover Assessment Program, Environmental Geotechnics Report 99-3, University of Wisconsin, Madison, Wisconsin, USA.

Proc. Fourth Kansai Intl. Geotechnical Forum, Creation of a New Geo-Environmental, Japanese Geotechnical Society, Kyoto, Japan, May 24-26, 2000, 1-40
37
Benson, C. and Boutwell, G. (2000), Compaction Conditions and Scale-Dependent Hydraulic Conductivity of Compacted Clay Liners, Constructing and Controlling Compaction of Earth Fills, STP 1384, D. Shanklin, K. Rademacher, and J. Talbot, Eds., ASTM, in press.
Bonaparte, R., Othman, M., Rad, N., Swan, R., and Vander Linde, D. (1996), Evaluation of Various Aspects of GCL Performance, Report of 1995 Workshop on Geosynthetic Clay Liners, USEPA Report No. EPA/600/R-96/149, Washington, DC, USA, F1-F34
Boardman, T. and Daniel, D. (1996), Hydraulic Conductivity of Desiccated Geosynthetic Clay Liners, J. of Geotech. and Geoenviron. Engr., ASCE, 122(3), 204-208.
Bosscher, P. (1999a), WinSTABL, A Slope Stability Program for Windows 95/98/NT, University of Wisconsin, Madison, Wisconsin, USA.
Bosscher, P. (1999b), WinUNSAT-H, the Windows 95/98/NT Implementation of UNSAT-H, University of Wisconsin, Madison, Wisconsin, USA.
Boutwell, G. and Derick, R. (1986), Groundwater Protection for Sanitary Landfills in the Saturated Zone, Proc. Waste-Tech 1986, American Water Works Association, Chicago.
Bowders, J. and Daniel, D. (1987), Hydraulic Conductivity of Compacted Clay to Dilute Organic Chemicals, J. of Geotech. Engr., 113(12), 1432-1448.
Brennecke, D. and Corser, P. (1998), Performance Issues Related to Geosynthetic Liners at Monticello, Utah, Proc. Tailings and Mine Waste '98, Balkema, Rotterdam, 351-360.
Broderick, G. and Daniel, D. (1990), Stabilizing Compacted Clay Against Chemical Attack, J. of Geotech. Engr., ASCE, 116(10), 1549-1567.
Budhu, M., Giese, R., Campbell, G., Baumgrass, L., (1991), The Permeability of Soils with Organic Fluids, Canadian Geotech. J., 28, 140-147.
Cabral, A., Burnotte, F., and Lefebvre, G. (1999), Application of TDR Technology to Water Content Monitoring of Capillary Barriers made of Pulp and Paper Residues, Geotechnical Testing J., ASTM, 22(1), 39-43.
Corser, P. and Cranston, M. (1991), Observations on The Performance of Composite Clay Liners and Covers, Proc. Geosynthetic Design and
Performance, Vancouver Geotechnical Society, Vancouver, British Columbia, Canada, 1-16.
Chen, C. (1999), Meteorological Conditions for Design of Monolithic Alternative Earthen Covers (AEFCs), MS Thesis, University of Wisconsin, Madison, Wisconsin, USA.
Daniel, D. (1984), Predicting Hydraulic Conductivity of Compacted Clay Liners, J. of Geotech. Engr., ASCE, 110(2), 285-300.
Daniel, D. and Trautwein, S. (1986), Field Permeability Test for Earthen Liners, Use of In Situ Tests in Geotechnical Engr., GSP No. 6, ASCE, 146-160.
Daniel, D. (1989), In Situ Hydraulic Conductivity Tests for Compacted Clay, J. of Geotech. Engr., ASCE, 115(9), 1205-1227.
Daniel, D. and Benson, C. (1990), Water Content-Density Criteria for Compacted Soil Liners, J. of Geotech. Engr., ASCE, 116(12), 1811-1830.
Daniel, D. E., Shan, H-Y, and Anderson, J. D. (1993). Effects of Partial Wetting on the Performance of the Bentonite Component of a Geosynthetic Clay Liner. Geosynthetics '93, Industrial Fabrics Assoc. Intl., St. Paul, MN, USA, 3, 1482-1496.
Daniel, D. and Koerner, R. (1993), Quality Assurance and Quality Control for Waste Containment Facilities, USEPA, Report No. EPA/600/R-93/182, Cincinnati, Ohio, USA.
Daniel, D., Koerner, R., Bonaparte, R., Landreth, R., Carson, D., and Scranton, H. (1998), Slope Stability of Geosynthetic Clay Liner Test Plots, J. of Geotech. and Geoenviron. Engr., ASCE, 124(7), 628-637.
Darilek, G., Laine, D., Parra, J. (1989), The Electrical Leak Location Method for Geomembrane Liners: Development and Applications, Geosynthetics '89, Industrial Fabrics Assoc. Intl., St. Paul, Minnesota, USA, 456-466.
Day, S. and Daniel, D. (1985), Hydraulic Conductivity of Two Prototype Clay Liners, J. of Geotech. Engr., ASCE, 111(8), 957-970.
Drumm, E., Boles, D., and Wilson, G. (1997), Desiccation Cracks Result in Preferential Flow, Geotechnical News, 15(2), 22-25.
Dwyer, S. (1998), Alternative Landfill Covers Pass the Test, Civil Engineering, 68(9), 30-52.
Edil, T., Ranguette, V., and Wuellner, W. (1990), Settlement of Municipal Refuse, Geotechnics of
Proc. Fourth Kansai Intl. Geotechnical Forum, Creation of a New Geo-Environmental, Japanese Geotechnical Society, Kyoto, Japan, May 24-26, 2000, 1-40
38
Waste Fills - Theory and Practice, STP 1070, A. Landva and G. Knowles, Eds., ASTM, 225-239.
Edil, T., Wambold, W., and Park, J. (1995), Partitioning of VOCs on Clay Liner Materials, Geoenvironment 2000, GSP No. 26, ASCE, 775-790.
Eid, H., Stark, T., and Doerfler, C. (1999), Effect of Shear Displacement Rate on Internal Shear Strength of Reinforced Geosynthetic Clay Liner, Geosynthetics International, 6(3), 219-239.
Fayer, M., Gee, G., Rockhold, M., Freshley, M. and Walters, T. (1996), Estimating Recharge Rates for a Groundwater Model Using a GIS, J. Env. Quality, 25, 510-518.
Fernandez, F. and Quigley, R. (1988), Viscosity and Dielectric Constant Controls on the Hydraulic Conductivity of Clayey Soils Permeated with Water Soluble Organic Chemicals, Canadian Geotech. J., 25, 582-589.
Foose, G. (1997), Leakage Rates and Chemical Transport Through Composite Liners, PhD Dissertation, University of Wisconsin, Madison, Wisconsin, USA.
Foose, G., Benson, C., and Edil, T. (1999), Equivalency of Composite Geosynthetic Clay Liners as a Barrier to Volatile Organic Compounds, Geosynthetics ’99, Industrial Fabrics Assoc. Intl., St. Paul, Minnesota, USA, 321-334.
Foreman, D. and Daniel, D. (1986), Permeation of Compacted Clay with Organic Chemicals, J. of Geotech. Engr., ASCE, 112(7), 669-681.
Gee, G. and Ward, A. (1997), Still in Quest of the Perfect Cap, Proc. Landfill Capping in the Semi-Arid West: Problems, Perspectives, and Solutions, Env. Sci and Res. Fnd., Idaho Falls, Idaho, USA, 145-164.
Giroud, J. and Bonaparte, R. (1989), Leakage Through Liners Constructed with Geomembranes - Part I. Geomembrane Liners, Geotextiles and Geomembranes, 8, 27-67.
Giroud, J., Khatami, A. and Badu-Tweneboah, K. (1989), Evaluation of the Rate of Leakage Through Composite Liners, Geotextiles and Geomembranes, 8(4), 337-340.
Giroud, J., Gross, B., and Durasse, H. (1992), Flow in Leachate Collection Layers, Design and Performance of Geosynthetic Lining Systems for Waste Containment, IFAI Publishers, St. Paul, MN.
Halse, Y., Lord, A., and Koerner, R. (1990), Ductile-to-Brittle Transition Time in Polyethylene Geomembrane Sheet, Geosynthetic Testing for Waste Containment Applications, STP 1081, ASTM, 95-109.
Haxo, H., Miedema, J., and Nelson, N. (1985), Permeability of Polymeric Membrane Lining Materials for Waste Management Facilities, Elastomerics, 117(5), 29-66.
Haxo, L. and Lahey, T. (1988), Transport of Dissolved Organics from Dilute Aqueous Solutions Through Flexible Membrane Liners, Hazardous Waste and Hazardous Materials, 5(4), May Ann Liebert, Inc., New York, 275-294.
Hewitt, R. and Daniel, D. (1997), Hydraulic Conductivity of GCLs after Freeze-Thaw, J. of Geotech. And Geoenviron. Engr., ASCE, 123(4), 305-313.
James, A., Fullerton, D., and Drake, R. (1997), Field Performance of GCL Under Ion Exchange Conditions, J. of Geotech. and Geoenviron. Engr., ASCE, 123(10), 897-901.
Jessberger, H. and Stone, K. (1991), Subsidence Effects on Clay Barriers, Géotechnique, 41(2), 185-194.
Jo, H. (1999), Hydraulic Conductivity and Swell of Non-Prehydrated Geosynthetic Clay Liners Permeated with Inorganic Chemicals, MS Thesis, University of Wisconsin, Madison, Wisconsin, USA
Katsumi, T., Jo, H., Benson, C., and Edil, T. (1999), Hydraulic Conductivity Performance of Geosynthetic Clay Liners Permeated with Inorganic Chemical Solutions, Geosynthetics Engineering J., Japanese Chapter of IGS, 4, 360-369.
Katsumi, T., Foose, G., Benson, C., and Kamon, M. (2000), Performance-Based Design of Landfill Liners, Engineering Geology, in press.
Kim, H. and Benson, C. (1999), Oxygen Transport Through Multilayer Caps Over Mine Waste, Proc. Mining and the Environment II, Sudbury, Ontario, Canada, 183-192.
Khire, M., Benson, C., and Bosscher, P. (1997), Water Balance Modeling of Earthen Landfill Covers, J. of Geotech. and Geoenviron. Engr., ASCE, 123(8), 744-754.
Khire, M., Benson, C., and Bosscher, P. (1999), Field Data from a Capillary Barrier in Semi-Arid and Model Predictions with UNSAT-H, J. of
Proc. Fourth Kansai Intl. Geotechnical Forum, Creation of a New Geo-Environmental, Japanese Geotechnical Society, Kyoto, Japan, May 24-26, 2000, 1-40
39
Geotech. and Geoenviron. Engr., ASCE, 125(6), 518-528.
Khire, M., Benson, C., and Bosscher, P. (2000), Design Variables and the Water Balance of Capillary Barriers, J. of the Geotech. and Geoenviron. Engr., ASCE, accepted.
Kim, J., Edil, T., and Park, J. (1997), Effective Porosity and Seepage Velocity in Column Tests on Compacted Clay, J. of Geotech. and Geoenviron. Engr., ASCE, 123(12), 1135-1142.
Kraus, J., Benson, C., Erickson, A., and Chamberlain, E. (1997), Freeze-Thaw and Hydraulic Conductivity of Bentonitic Barriers, J. of Geotech. and Geoenviron. Engr., ASCE, 123(3) 229-238.
LaGatta, M., Boardman, B., Cooley, B., and Daniel, D. (1997), Geosynthetic Clay Liners Subjected to Differential Settlement, J. of Geotech. and Geoenviron. Engr., ASCE, 123(5), 402-410.
Lin, L. (1998), Effects of Wetting and Drying on Swelling and Hydraulic Conductivity of Geosynthetic Clay Liners, MS Thesis, University of Wisconsin, Madison, Wisconsin, USA.
Lin, L. and Benson, C. (2000), Effect of Wet-Dry Cycling on Swelling and Hydraulic Conductivity of Geosynthetic Clay Liners, J. of Geotech. and Geoenviron. Engr., ASCE, 126(1), 40-49.
Long, J. (1995), Graphical Solutions for Determining Geosynthetic Tension in Cover Systems, Geosynthetics International, 2(5), 777-785.
Lutton, R. (1987), Design, Construction, and Maintenance of Covers Systems for Hazardous Waste, USEPA Report 600/2-87/039, Cincinnati, Ohio, USA.
Matrecon, Inc. (1988), Lining of Waste Containment and Other Impoundment Facilities, USEPA, Report EPA/600/2-88/052, Cincinnati, Ohio, USA.
Mandelkern, L. and Alamo, R. (1999), Polymer Data Handbook, J. Mark, Ed., Oxford Univ. Press, New York, 493-507
Melchior, S. and Meihlich, G. (1989), Field Studies on the Hydrological Performance of Multilayered Landfills Caps, Proc. 3rd Intl Conf. on New Frontiers for Hazardous Waste Management, USEPA, 100-108.
Melchior, S. (1997), In Situ Studies on the Performance of Landfills Caps, Proc. Intl
Containment Technology Conf., US Dept. of Energy, Germantown, Maryland, USA, 365-373.
Meyer, P. and Gee, G. (1999), Flux-Based Estimation of Field Capacity, J. of Geotech. and Geoenviron. Engr., ASCE, 125(7), 595-600.
Montgomery, R. and L. Parsons (1990), The Omega Hills Cover Test Plot Study: Fourth Year Data Summary, Proc. 22nd Mid-Atlantic Industrial Waste Conf., Drexel University, Philadelphia, Pennsylvania, USA.
Nirmala, G., Lewis, B., and Finno, R. (1995), Microstructural Changes in Sand-Bentonite Soils When Exposed to Aniline, J. of Geotech. Engr., ASCE, 121(2), 119-125.
Ogata, A. and Banks, R. (1961), A Solution of the Differential Equation of Longitudinal Dispersion in Porous Media, U.S. Geological Survey Professional Paper, 441-A.
Olson, R. (1974), Shearing Strengths of Kaolinite, Illite, and Montmorillonite, J. of the Geotech. Engr. Division, ASCE, 100(11), 1215-1229.
Othman, M. and Benson, C. (1994), Effect of Freeze-Thaw on the Hydraulic Conductivity and Morphology of Compacted Clay, Canadian Geotech. J., 30(2), 236-246.
Othman, M., Benson, C., Chamberlain, E., and Zimmie, T. (1994), Laboratory Testing to Evaluate Changes in Hydraulic Conductivity Caused by Freeze-Thaw: State-of-the-Art, Hydraulic Conductivity and Waste Containment Transport in Soils, STP 1142, ASTM, S. Trautwein and D. Daniel, Eds., 227-254.
Park, J., Sakti, J., and Hoopes, J. (1996), Transport of Aqueous Organic Compounds in Thermoplastic Geomembranes. II: Mass Flux Estimates and Practical Implications, J. of Environ. Engr., ASCE, 122(9), 807-813.
Petrov, R. and Rowe, R. (1997), Geosynthetic Clay Liner (GCL)–Chemical Compatibility by Hydraulic Conductivity Testing and Factors Impacting its Performance, Canadian Geotech J., 34, 863-885.
Reardon, E. and Moddle, P. (1985), Gas Diffusion Coefficient Measurements on Uranium Mill Tailings: Implications to Cover Layer Design, Uranium, 2, 111-131.
RMA (1997), Rocky Mountain Arsenal, Final RCRA-Equivalent Cover Demonstration Project Comparative Analysis and Field Demonstration Scope of Work, Dec. 1997, Rocky Mountain

Proc. Fourth Kansai Intl. Geotechnical Forum, Creation of a New Geo-Environmental, Japanese Geotechnical Society, Kyoto, Japan, May 24-26, 2000, 1-40
40
Arsenal Remediation Venture Office, Commerce City, Colorado, USA.
Rogers, C. (1985), Permeation of Gases and Vapours in Polymers, Polymer Permeability, J. Comyn, Ed., Elsevier Applied Science Publishers, London.
Rollin, A., Marcotte, M., Jacquelin, T., Chaput, L. (1999), Leak Location in Exposed Geomembrane Liners Using an Electrical Leak Detection Technique, Geosynthetics ’99, Industrial Fabrics Assoc. Intl., St. Paul, Minnesota, USA, 615-626.
Rowe, R., Hrapovic, L., and Kosaric, N. (1997), Diffusion of Chloride and Dichloromethane Through an HDPE Geomembrane, Geosynthetics International, 2(3), 507-536.
Rowe, R. (1998), Geosynthetics and the Minimization of Contaminant Migration Through Barrier Systems Beneath Solid Waste, Proc. 6th Intl. Conf. on Geosynthetics, Atlanta, GA, 27-102.
Ruhl, J. and Daniel, D. (1997). Geosynthetic Clay Liners Permeated with Chemical Solutions and Leachates. J. of Geotech. and Geoenviron. Engr., ASCE, 123(4), 369-381.
Schroeder, P., Lloyd, C., and Zappi, P. (1994), The Hydrologic Evaluation of Landfill Performance (HELP) Model, User's Guide for Version 3.0, USEPA, Cincinnati, OH 45268, February 1994.
Seed, R., Mitchell, J., and Seed, H. (1990), Kettleman Hills Waste Landfill Slope Failure. II Stability Analyses, J. of Geotech. Engr., ASCE, 116(4), 669-690.
Seed, R. and Boulanger, R. (1991), Smooth HDPE-Clay Liner Interface Shear Strengths: Compaction Effects, J. of Geotech. Engr., ASCE, 117(4), 686-693.
Rowe, R. (1998), Geosynthetics and The Minimization of Contaminant Migration Through Barrier Systems Beneath Solid Waste, Proc. Sixth Intl. Conf. on Geosynthetics, Industrial Fabrics Association Intl., St. Paul, Minnesota, USA, 27-102.
Shackelford, C. (1990), Transit-time Design of Earthen Barriers, Engr. Geology, 29, 79-94.
Shackelford, C. and Daniel, D. (1991), Diffusion in Saturated Soil. II: Results for Compacted Clay, J. of Geotech. Engr., ASCE, 117(3), 485-506.
Shackelford, C. and Javed, F., (1991), Large-Scale Laboratory Permeability Testing of a Compacted Clay Soil, Geotechnical Testing Journal, ASTM, 14(2), 171-179.
Shackelford, C., Malusis, M., Majeski, M., and Stern, R. (1999), Electrical Conductivity Breakthrough Curves, J. of Geotech. and Geoenviron. Engr., ASCE, 125(4), 260-270.
Shackelford, C., Benson, C., Katsumi, T., Edil, T. B., and Lin, L. (2000), Evaluating the Hydraulic Conductivity of GCLs Permeated with Non-Standard Liquids, J. of Geotextiles and Geomembranes, 18(2-3), 133-161.
Simms, P. and Yanful, E. (1999), Some Insights into the Performance of an Experimental Soil Cover Near London, Ontario, Canadian Geotech. J., 36, 846-860.
Stark, T. and Poeppel, A. (1994), Landfill Liner Interface Strengths from Torsional-Ring-Shear Tests, J. of Geotech. Engr., ASCE, 120(3), 597-615.
Stern, R. and Shackelford, C. (1998), Permeation of Sand-Processed Clay Mixtures with Calcium Chloride Solutions, J. of Geotech. and Geoenviron. Engr., ASCE, 124(3), 231-241.
Stormont, J. (1995), The Performance of Two Capillary Barriers During Constant Infiltration, Landfill Closures, ASCE, GSP No. 53, J. Dunn and U. Singh, Eds., 77-92.
Stormont, J. and Morris, C. (1998), Method to Estimate the Water Storage Capacity of Capillary Barriers, J. of Geotech. and Geoenviron. Engr., ASCE, 124(4), 297-302.
Stormont, J. and Anderson, C. (1999), Capillary Barrier Effect from Underlying Coarser Soil Layer, J. of Geotech. and Geoenviron. Engr., ASCE, 125(8), 641-648.
Trast, J. and Benson, C. (1995), Estimating Field Hydraulic Conductivity at Various Effective Stresses, J. of Geotech. Engr., ASCE, 121(10), 736-740.
Trautwein, S. and Boutwell, G. (1994), In Situ Hydraulic Conductivity Tests for Compacted Soil Liners and Caps, Hydraulic Conductivity and Waste Containment Transport in Soils, STP 1142, ASTM, S. Trautwein and D. Daniel, Eds., 184-223.
UNESCO (1979), Map of the World Distribution of Arid Regions, MAB Technical Note 7, United Nations Educational, Scientific, and Cultural Organization, Paris.
Wang, X. and Benson, C. (1995), Infiltration and Field-Saturated Hydraulic Conductivity of
Proc. Fourth Kansai Intl. Geotechnical Forum, Creation of a New Geo-Environmental, Japanese Geotechnical Society, Kyoto, Japan, May 24-26, 2000, 1-40
41
Compacted Clay, J. of Geotech. Engr., ASCE, 121(10), 713-722.
Waugh, W. and Richardson, G. (1997), Ecology, Design, and Long Term Performance of Surface Barriers: Applications at a Uranium Mill Tailings Site, Barrier Technologies for Environmental Management, National Academy Press, National Research Council, Washington, DC, D36-D49.
Wilson, G., Albright, W., Gee, G., Fayer, M., and Ogan, B. (1999), Alternative Cover Assessment Project Phase I Report, USEPA Contract No. 68-C5-0036, Cincinnati, Ohio, USA.
Winkler, W. (1999), Thickness of Monolithic Covers in Arid and Semi-Arid Climates, MS Thesis, University of Wisconsin, Madison, Wisconsin, USA.
Vasko, S. (1999), Hydraulic Conductivity of Prehydrated Geosynthetic Clay Liners Permeated with Calcium Chloride Solutions, MS Thesis, University of Wisconsin, Madison, Wisconsin, USA.
Yanful, E., Haug, M., and Wong, L. (1990), The Impact of Synthetic Leachate on the Hydraulic Conductivity of a Smectitic Till Underlying a Landfill near Saskatoon, Saskatchewan, Canadian Geotech. J., 27, 507-519.
Yanful, E. (1993), Oxygen Diffusion Through Soil Covers on Sulphidic Mine Tailings, J. of Geotech. Engr., ASCE, 119(8), 1207-1228.