LINEAR SYSTEMS of INEQUALITIES – Graphing Method When graphing a set of linear inequalities, the...
30
LINEAR SYSTEMS of INEQUALITIES – Graphing Method When graphing a set of linear inequalities, the solution set will be a “shared” space where the two solutions intersect. You can see where the tan and gray have a common area where they are “on top” of each other. Coordinates in that shared space will satisfy BOTH inequalities. SHARED AREA
-
Upload
anissa-dickerson -
Category
Documents
-
view
214 -
download
0
Transcript of LINEAR SYSTEMS of INEQUALITIES – Graphing Method When graphing a set of linear inequalities, the...

LINEAR SYSTEMS of INEQUALITIES – Graphing Method
When graphing a set of linear inequalities, the solution set will be a “shared” space where the two solutions intersect.
You can see where the tan and gray have a common area where they are “on top” of each other.
Coordinates in that shared space will satisfy BOTH inequalities. SHARED
AREA
LINEAR SYSTEMS of INEQUALITIES – Graphing Method
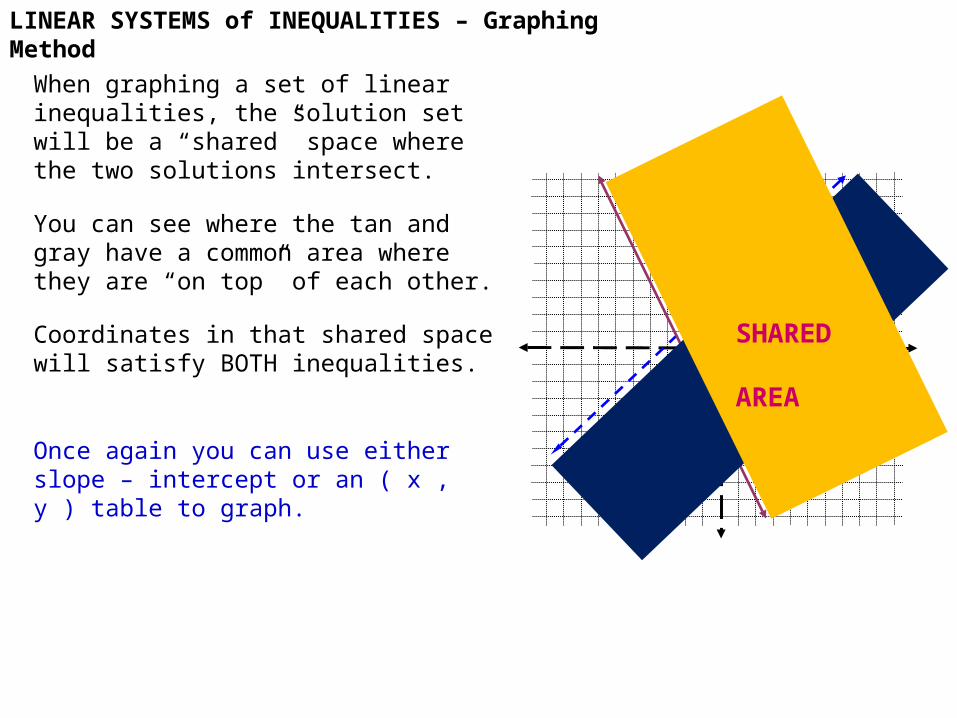
When graphing a set of linear inequalities, the solution set will be a “shared” space where the two solutions intersect.
You can see where the tan and gray have a common area where they are “on top” of each other.
Coordinates in that shared space will satisfy BOTH inequalities.
Once again you can use either slope – intercept or an ( x , y ) table to graph.
SHARED AREA
LINEAR SYSTEMS of INEQUALITIES – Graphing Method
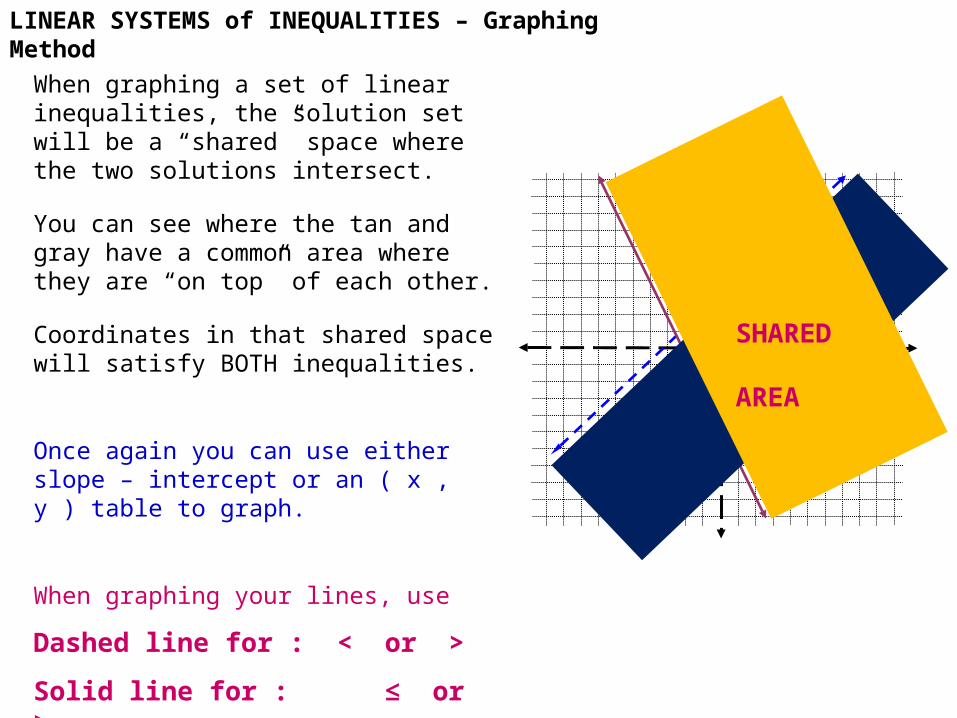
When graphing a set of linear inequalities, the solution set will be a “shared” space where the two solutions intersect.
You can see where the tan and gray have a common area where they are “on top” of each other.
Coordinates in that shared space will satisfy BOTH inequalities.
Once again you can use either slope – intercept or an ( x , y ) table to graph.
When graphing your lines, use
Dashed line for : < or >
Solid line for : ≤ or ≥
SHARED AREA
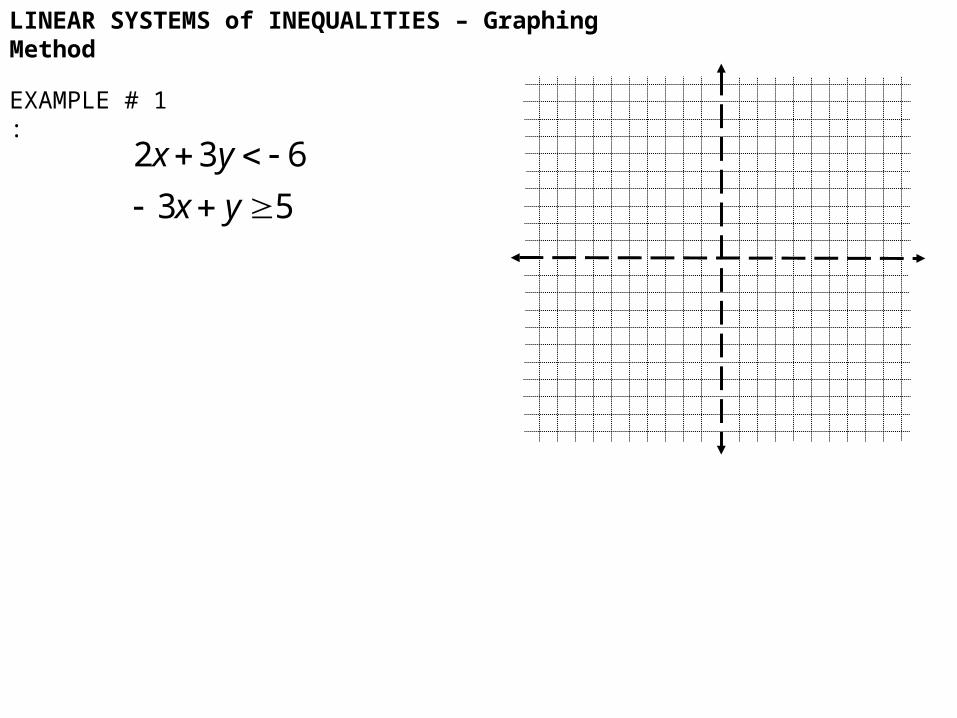
LINEAR SYSTEMS of INEQUALITIES – Graphing Method
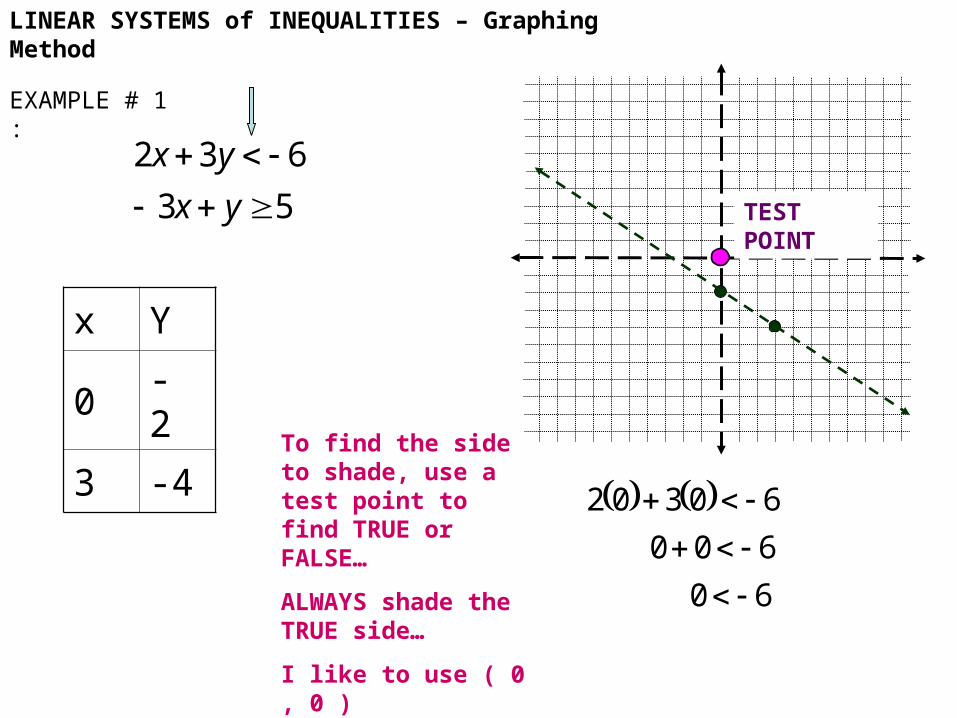
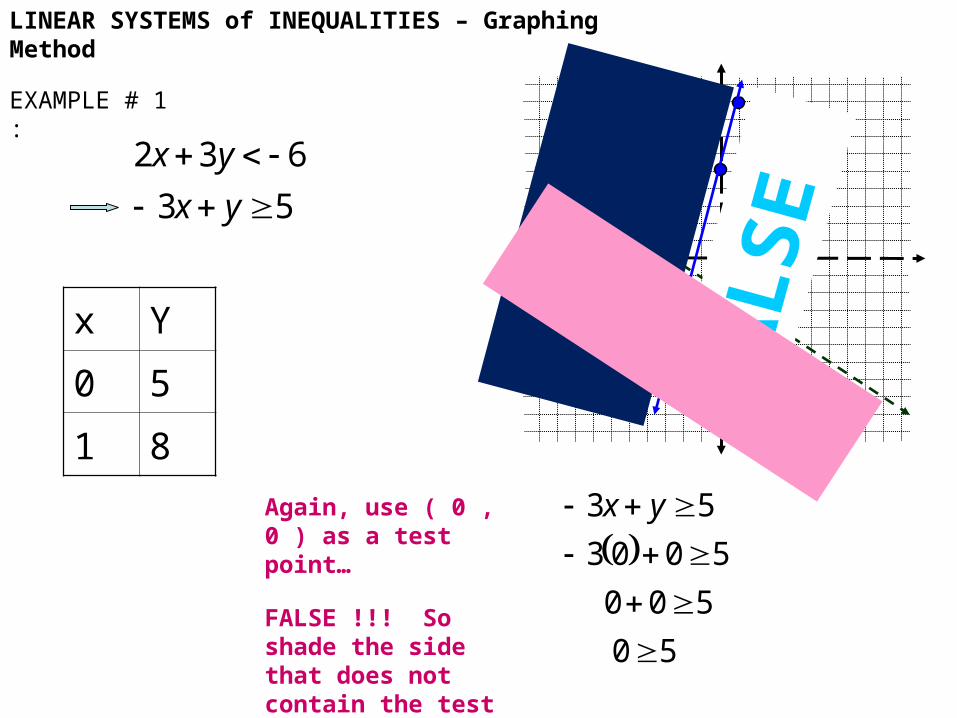
EXAMPLE # 1 :
53
632
yx
yx
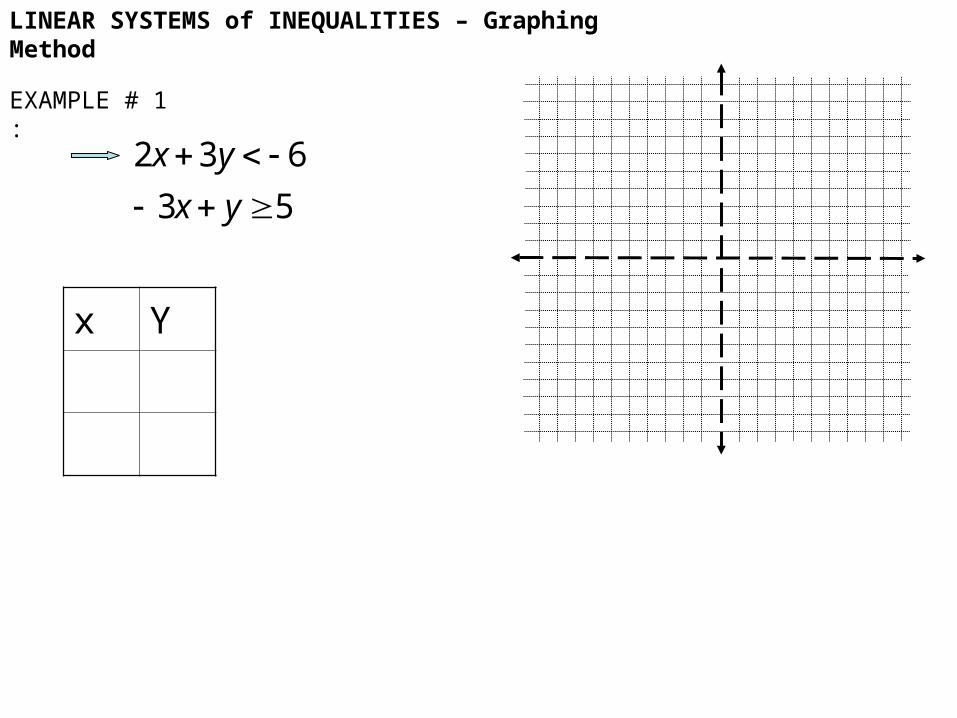
LINEAR SYSTEMS of INEQUALITIES – Graphing Method
EXAMPLE # 1 :
53
632
yx
yx
x Y

LINEAR SYSTEMS of INEQUALITIES – Graphing Method
EXAMPLE # 1 :
53
632
yx
yx
x Y
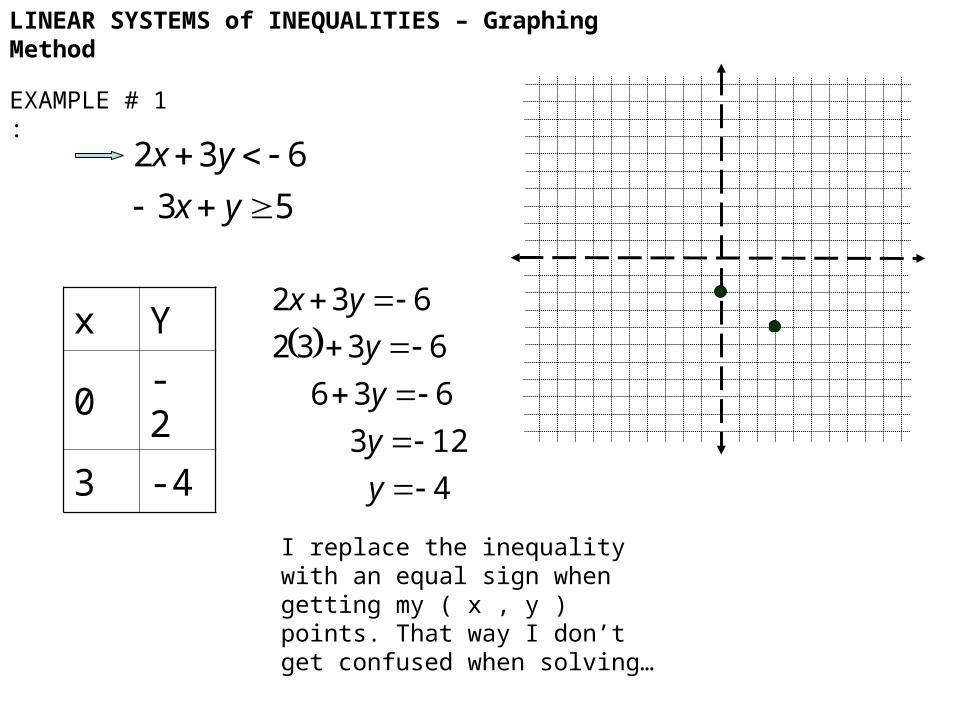
0 - 2
2
63
6302
632
y
y
y
yx
I replace the inequality with an equal sign when getting my ( x , y ) points. That way I don’t get confused when solving…
LINEAR SYSTEMS of INEQUALITIES – Graphing Method
EXAMPLE # 1 :
53
632
yx
yx
x Y
0 - 2
3 -4
4
123
636
6332
632
y
y
y
y
yx
I replace the inequality with an equal sign when getting my ( x , y ) points. That way I don’t get confused when solving…
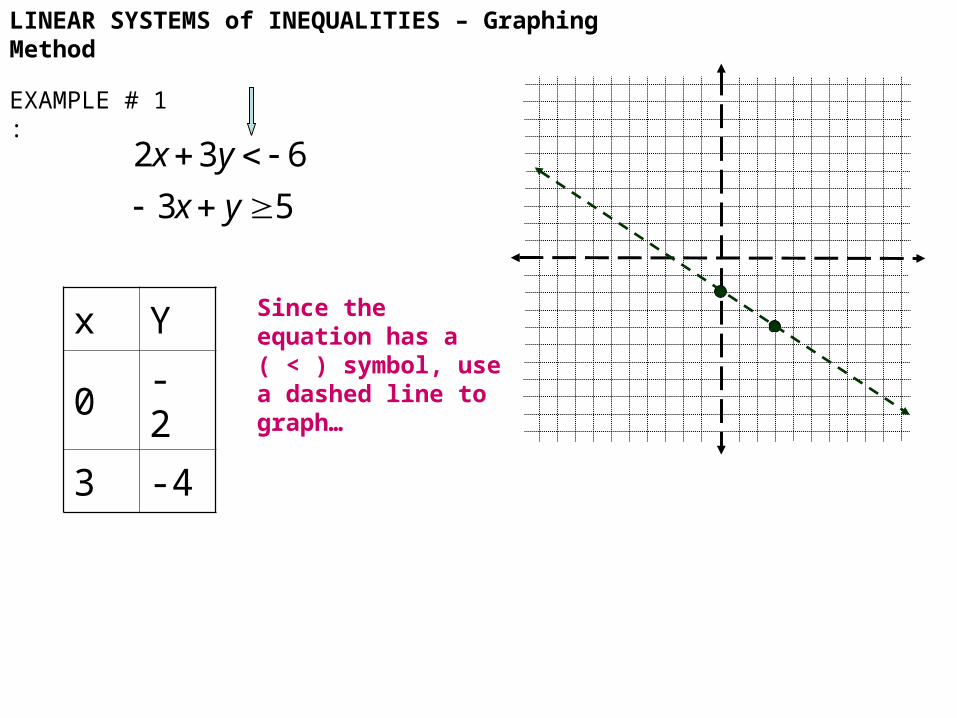
LINEAR SYSTEMS of INEQUALITIES – Graphing Method
EXAMPLE # 1 :
53
632
yx
yx
x Y
0 - 2
3 -4
Since the equation has a ( < ) symbol, use a dashed line to graph…
LINEAR SYSTEMS of INEQUALITIES – Graphing Method
EXAMPLE # 1 :
53
632
yx
yx
x Y
0 - 2
3 -4 To find the side to shade, use a test point to find TRUE or FALSE…
ALWAYS shade the TRUE side…
I like to use ( 0 , 0 )
60
600
60302
TEST POINT
LINEAR SYSTEMS of INEQUALITIES – Graphing Method
EXAMPLE # 1 :
53
632
yx
yx
x Y
0 - 2
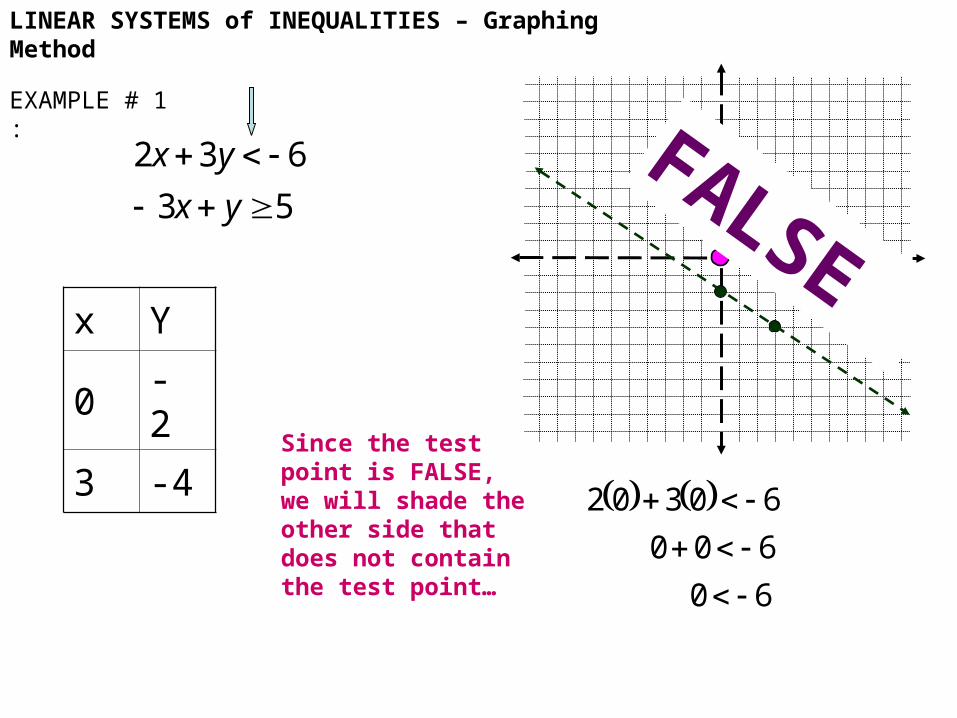
3 -4 Since the test point is FALSE, we will shade the other side that does not contain the test point…
FALSE
60
600
60302
LINEAR SYSTEMS of INEQUALITIES – Graphing Method
EXAMPLE # 1 :
53
632
yx
yx
x Y
0 - 2
3 -4
60
600
60302
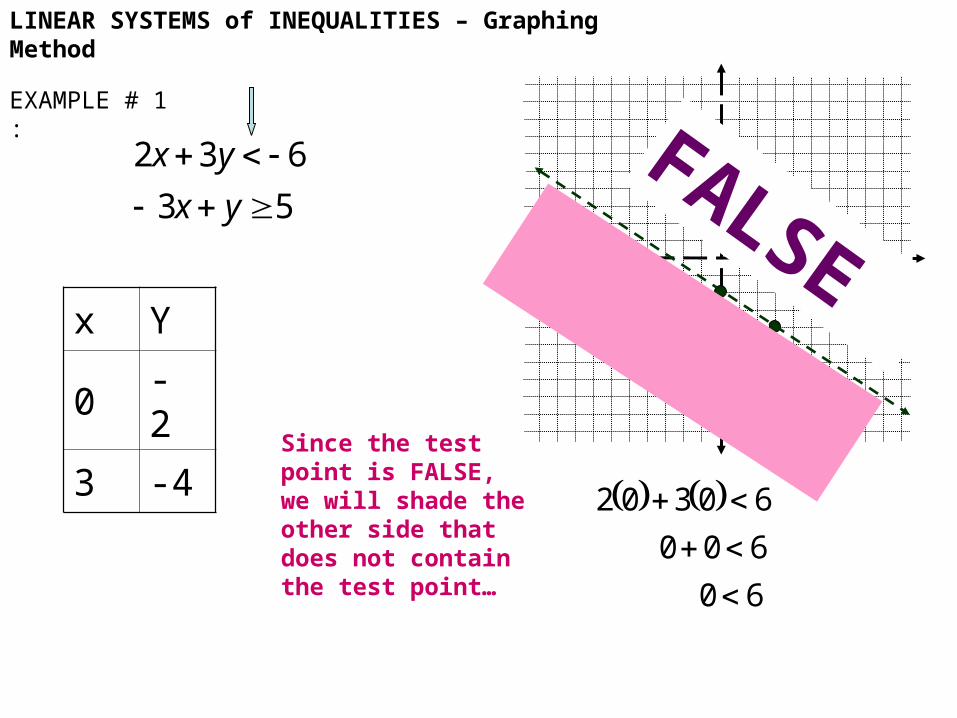
Since the test point is FALSE, we will shade the other side that does not contain the test point…
FALSE
LINEAR SYSTEMS of INEQUALITIES – Graphing Method
EXAMPLE # 1 :
53
632
yx
yx
x Y
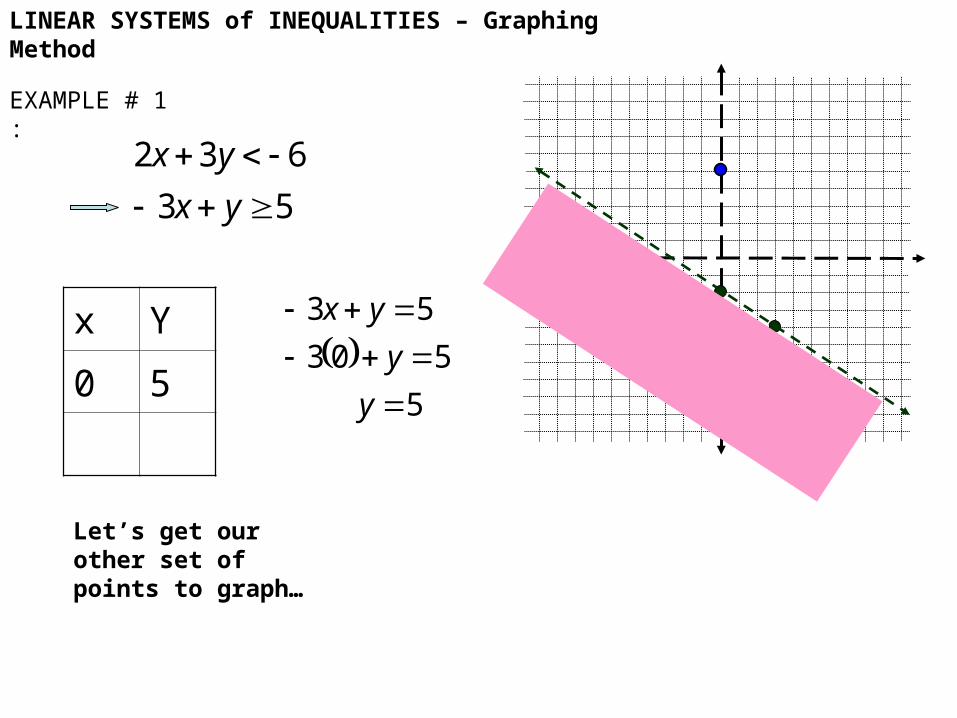
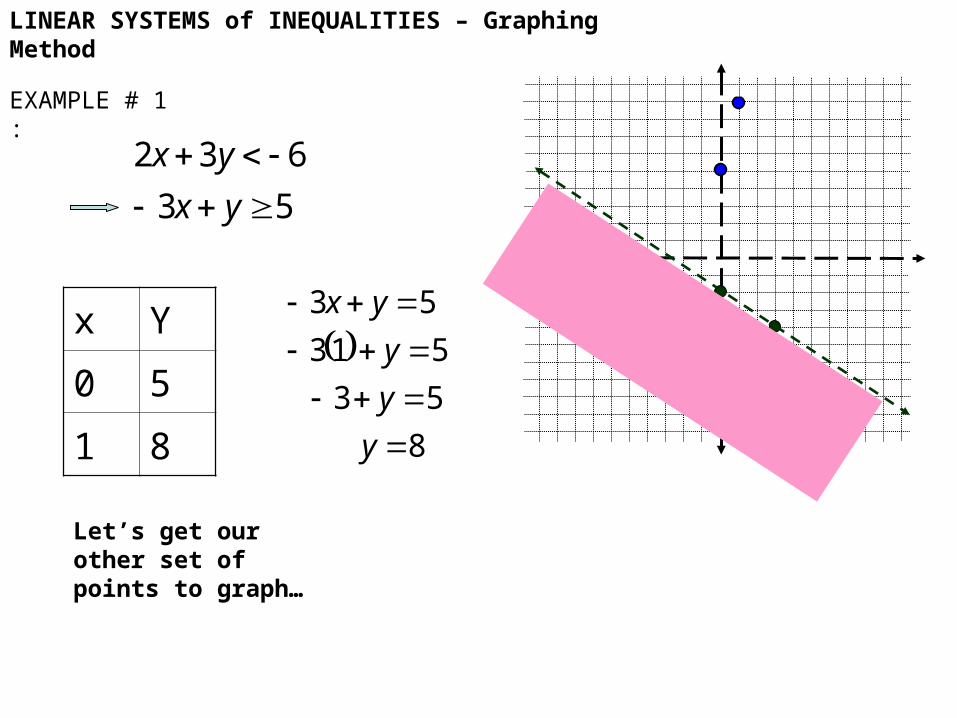
0 5
Let’s get our other set of points to graph…
5
503
53
y
y
yx
LINEAR SYSTEMS of INEQUALITIES – Graphing Method
EXAMPLE # 1 :
53
632
yx
yx
x Y
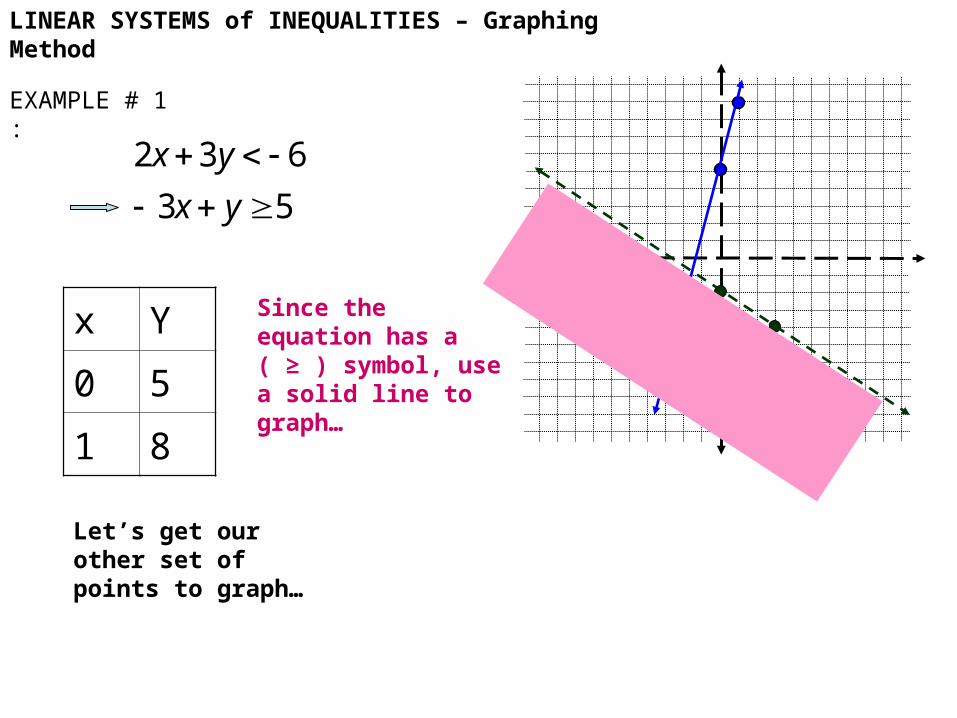
0 5
1 8
Let’s get our other set of points to graph…
8
53
513
53
y
y
y
yx
LINEAR SYSTEMS of INEQUALITIES – Graphing Method
EXAMPLE # 1 :
53
632
yx
yx
x Y
0 5
1 8
Let’s get our other set of points to graph…
Since the equation has a ( ≥ ) symbol, use a solid line to graph…
LINEAR SYSTEMS of INEQUALITIES – Graphing Method
EXAMPLE # 1 :
53
632
yx
yx
x Y
0 5
1 8
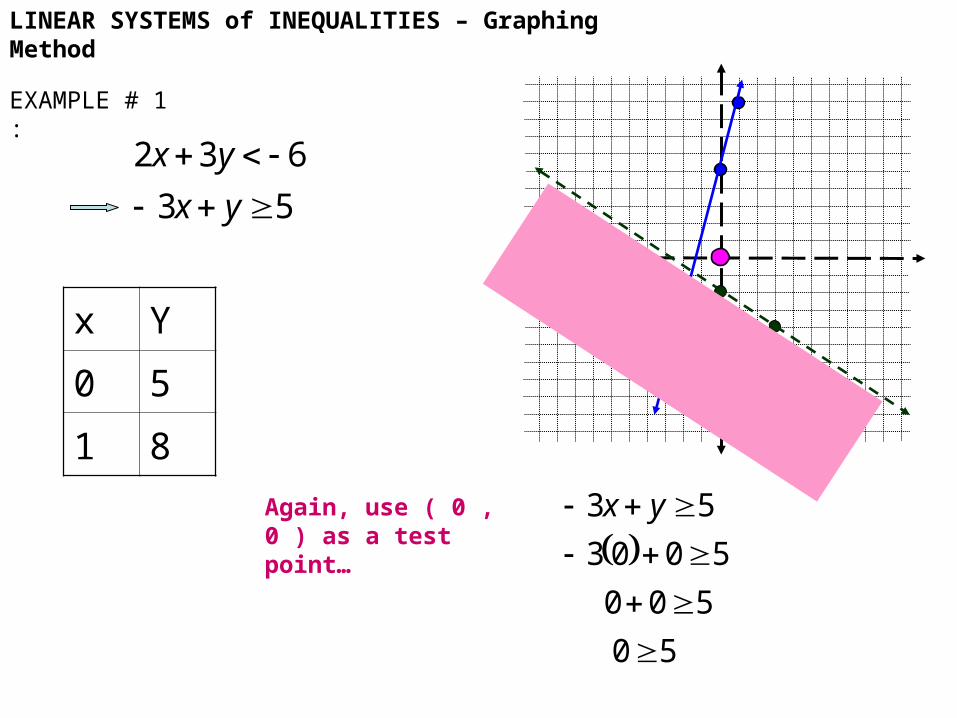
Again, use ( 0 , 0 ) as a test point…
50
500
5003
53
yx
LINEAR SYSTEMS of INEQUALITIES – Graphing Method
EXAMPLE # 1 :
53
632
yx
yx
x Y
0 5
1 8
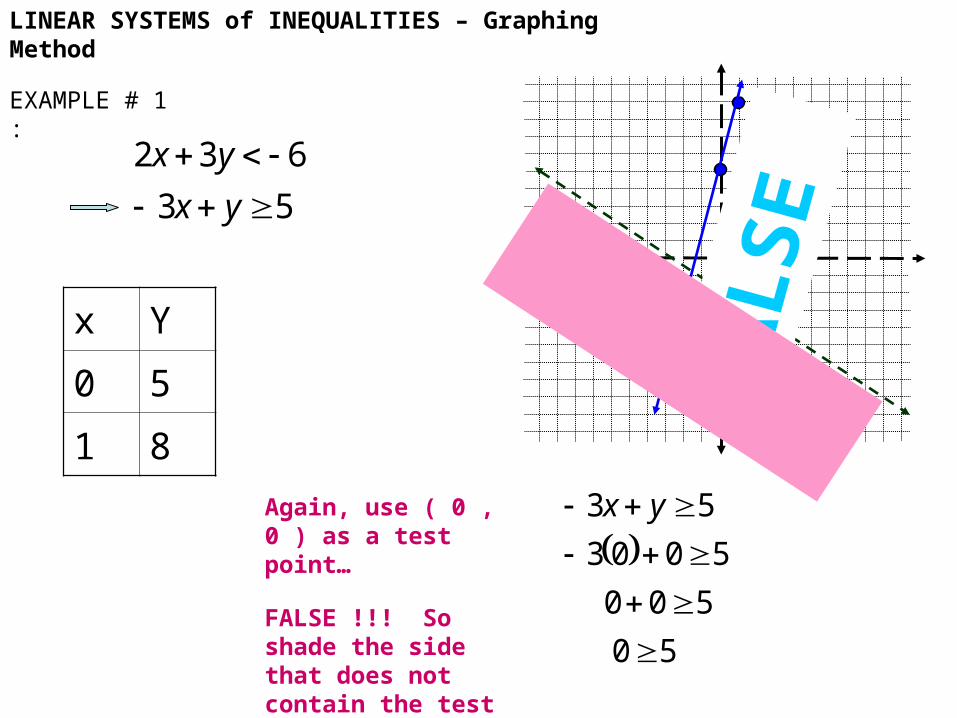
Again, use ( 0 , 0 ) as a test point…
FALSE !!! So shade the side that does not contain the test point…
50
500
5003
53
yx
FA
LS
E
LINEAR SYSTEMS of INEQUALITIES – Graphing Method
EXAMPLE # 1 :
53
632
yx
yx
x Y
0 5
1 8
Again, use ( 0 , 0 ) as a test point…
FALSE !!! So shade the side that does not contain the test point…
50
500
5003
53
yx
FA
LS
E
LINEAR SYSTEMS of INEQUALITIES – Graphing Method
EXAMPLE # 1 :
53
632
yx
yx
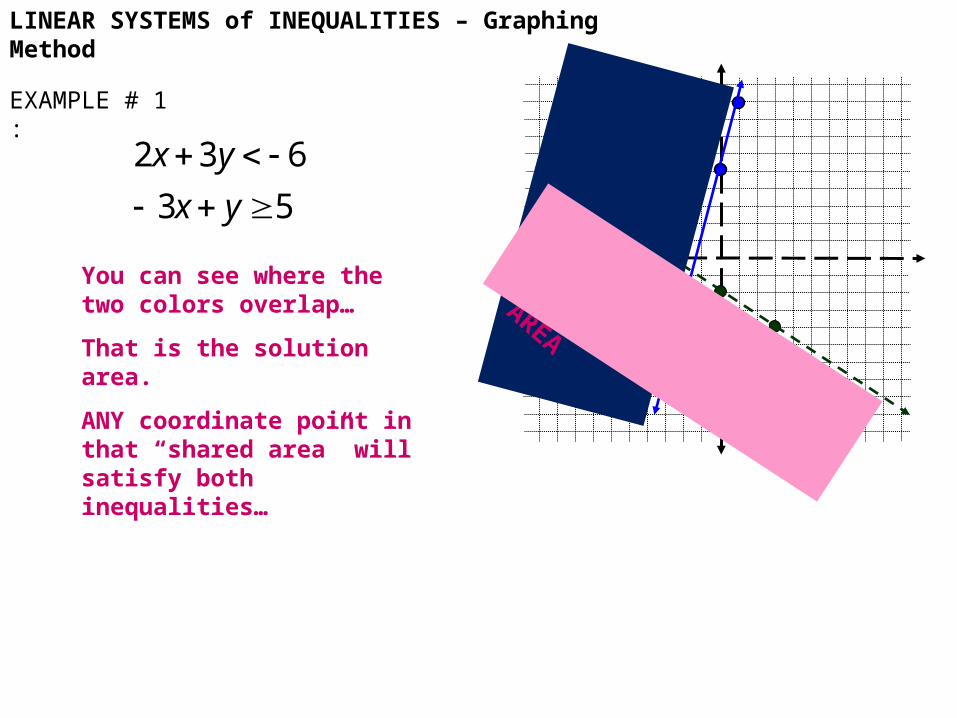
You can see where the two colors overlap…
That is the solution area.
ANY coordinate point in that “shared area” will satisfy both inequalities…
SHARED
AREA

LINEAR SYSTEMS of INEQUALITIES – Graphing Method
EXAMPLE # 1 :
53
632
yx
yx
Let’s check the point ( - 6, - 2 ) …
618
6612
62362
632
yx
( - 6, - 2 )
516
5218
5263
The check coordinate satisfy’s BOTH …
LINEAR SYSTEMS of INEQUALITIES – Graphing Method
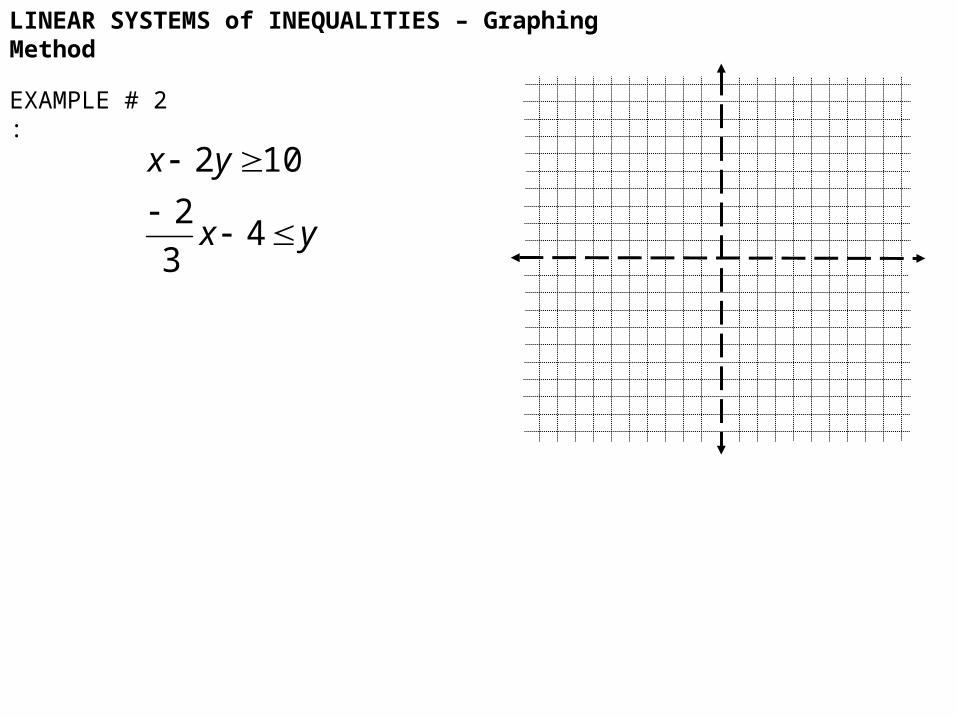
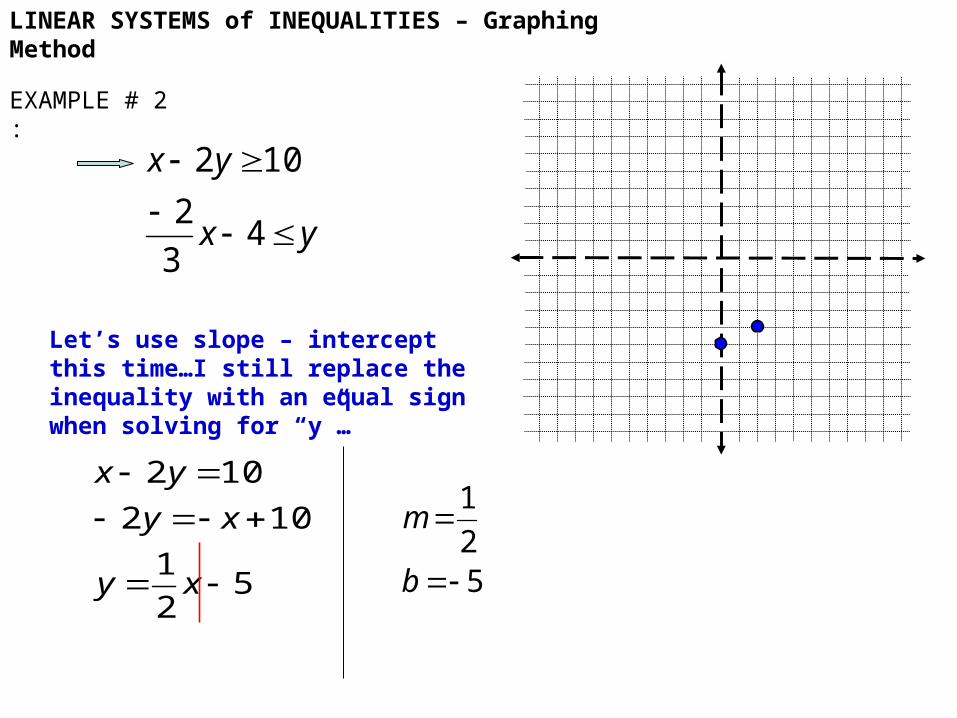
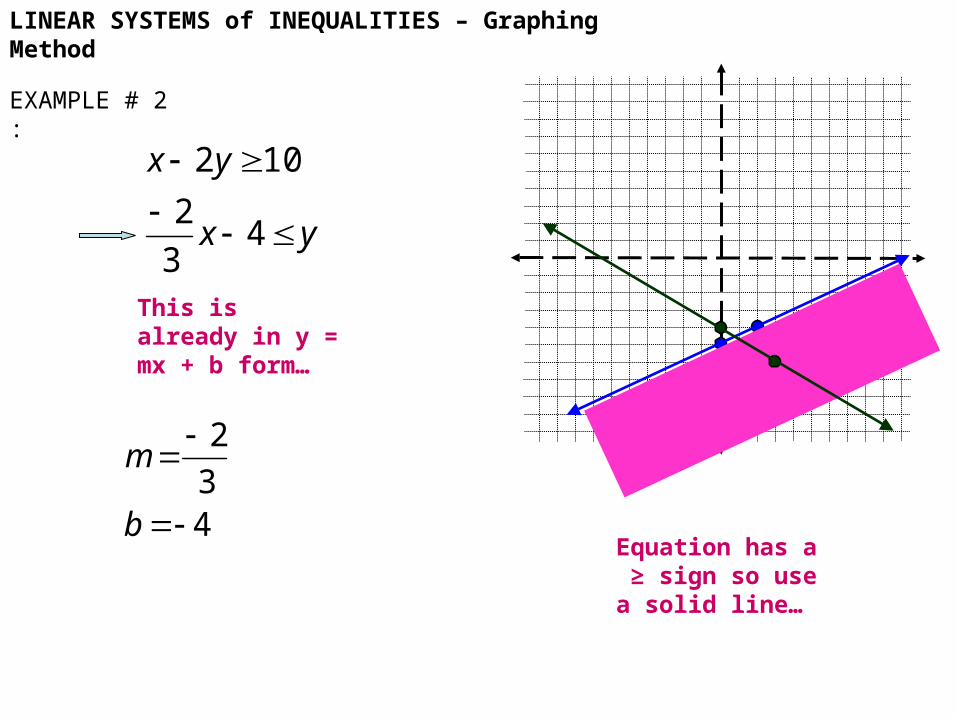
EXAMPLE # 2 :
yx
yx
43
2
102
LINEAR SYSTEMS of INEQUALITIES – Graphing Method
EXAMPLE # 2 :
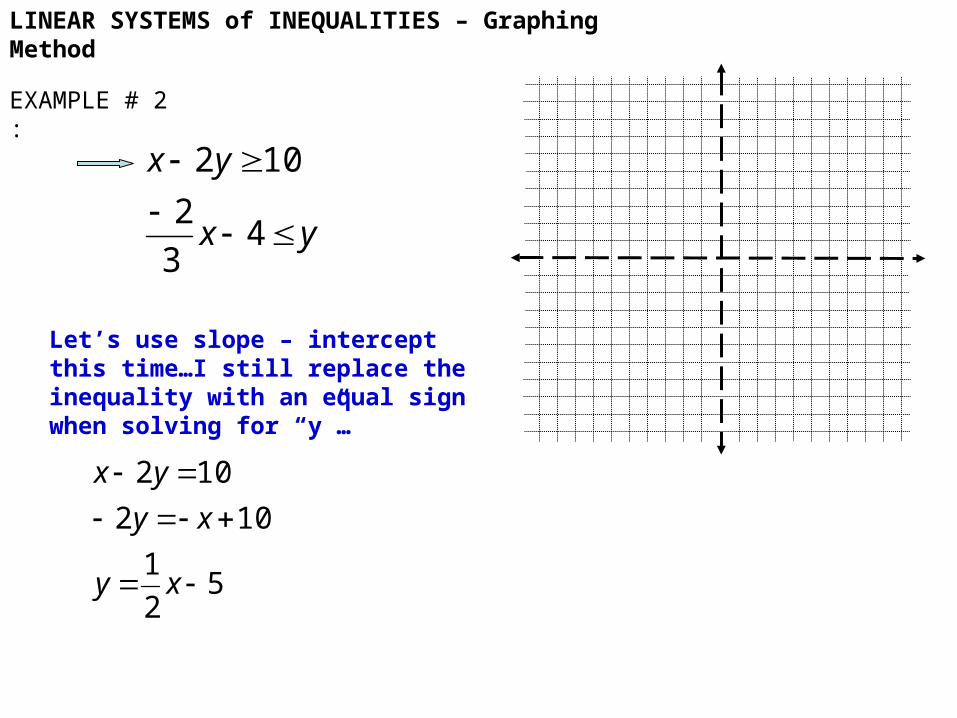
Let’s use slope – intercept this time…I still replace the inequality with an equal sign when solving for “y”…
52
1
102
102
xy
xy
yx
yx
yx
43
2
102
LINEAR SYSTEMS of INEQUALITIES – Graphing Method
EXAMPLE # 2 :
Let’s use slope – intercept this time…I still replace the inequality with an equal sign when solving for “y”…
52
1
102
102
xy
xy
yx
yx
yx
43
2
102
52
1
b
m

LINEAR SYSTEMS of INEQUALITIES – Graphing Method
EXAMPLE # 2 :
Let’s use slope – intercept this time…I still replace the inequality with an equal sign when solving for “y”…
yx
yx
43
2
102
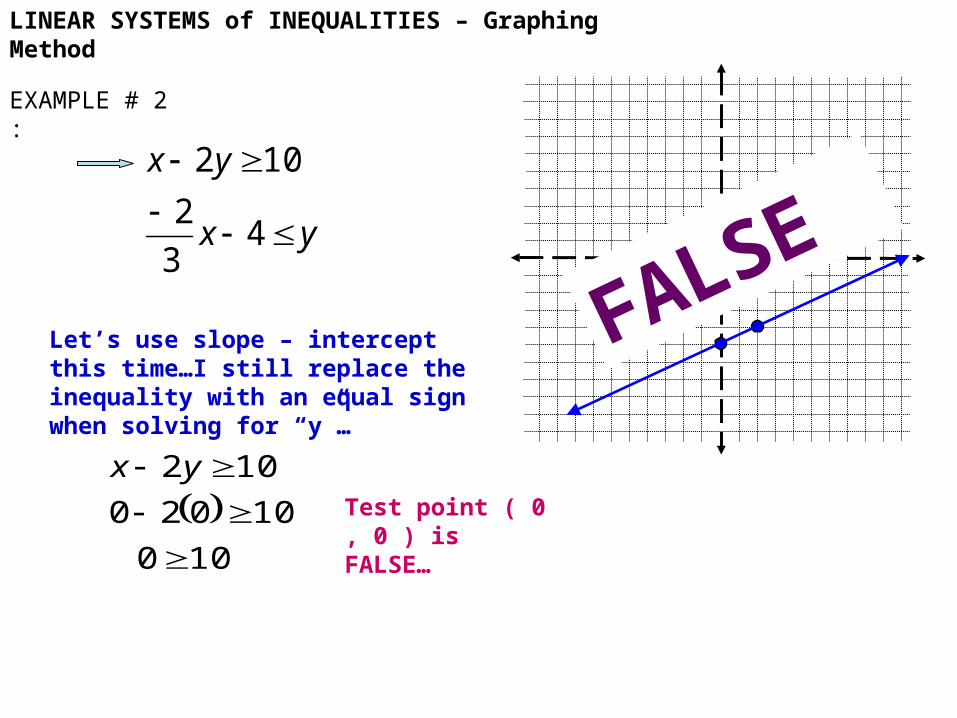
Equation has a ≥ sign so use a solid line…
LINEAR SYSTEMS of INEQUALITIES – Graphing Method
EXAMPLE # 2 :
Let’s use slope – intercept this time…I still replace the inequality with an equal sign when solving for “y”…
100
10020
102
yx
yx
yx
43
2
102
Test point ( 0 , 0 ) is FALSE…
FALSE
LINEAR SYSTEMS of INEQUALITIES – Graphing Method
EXAMPLE # 2 :
Let’s use slope – intercept this time…I still replace the inequality with an equal sign when solving for “y”…
100
10020
102
yx
yx
yx
43
2
102
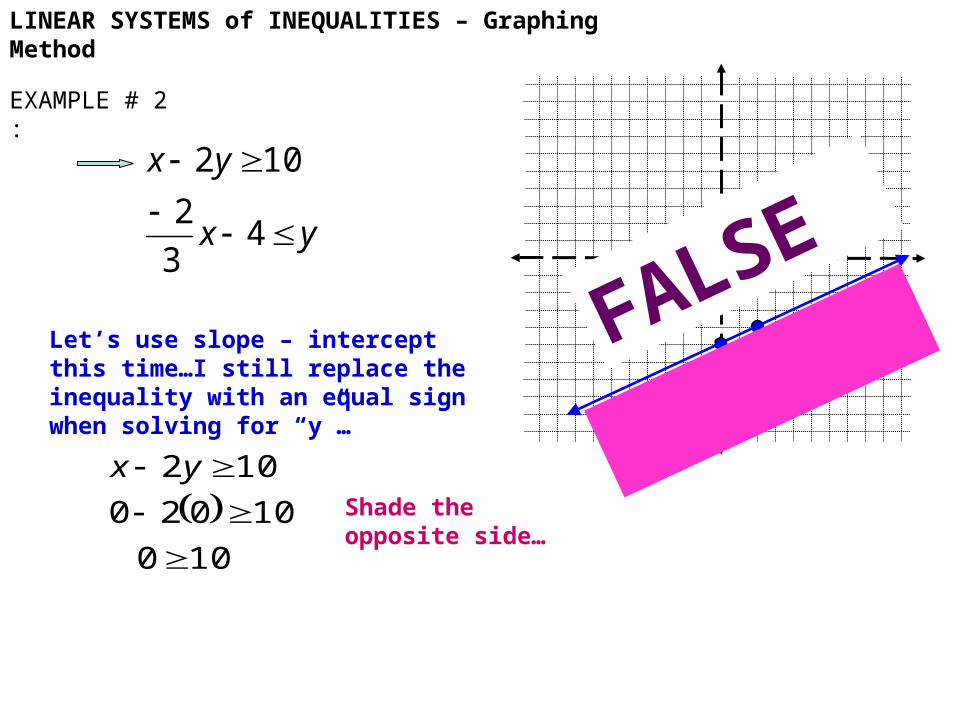
Shade the opposite side…
FALSE
LINEAR SYSTEMS of INEQUALITIES – Graphing Method
EXAMPLE # 2 :
yx
yx
43
2
102
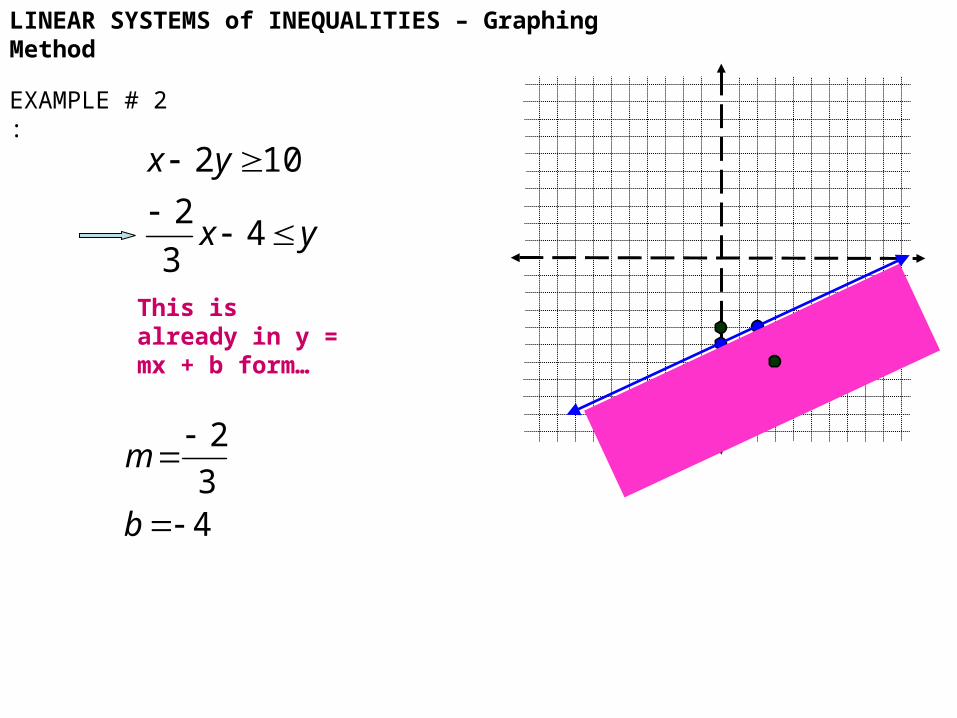
43
2
b
m
This is already in y = mx + b form…
LINEAR SYSTEMS of INEQUALITIES – Graphing Method
EXAMPLE # 2 :
yx
yx
43
2
102
43
2
b
m
Equation has a ≥ sign so use a solid line…
This is already in y = mx + b form…
LINEAR SYSTEMS of INEQUALITIES – Graphing Method
EXAMPLE # 2 :
yx
yx
43
2
102
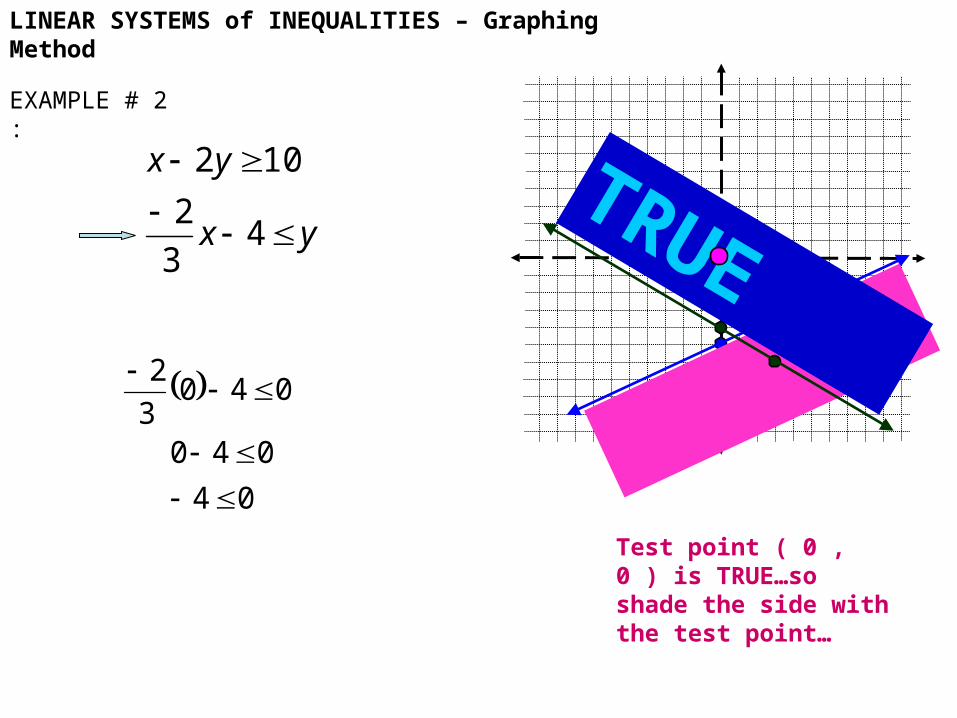
Test point ( 0 , 0 ) is TRUE…so shade the side with the test point…
04
040
0403
2
TRUE
LINEAR SYSTEMS of INEQUALITIES – Graphing Method
EXAMPLE # 2 :
yx
yx
43
2
102
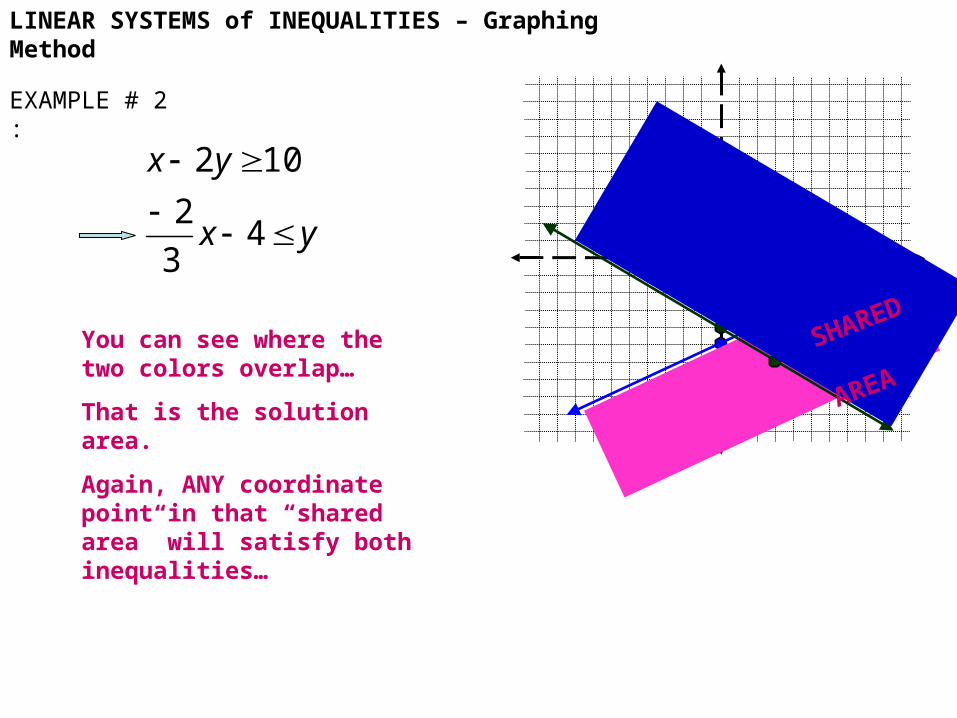
SHARED
AREAYou can see where the two
colors overlap…
That is the solution area.
Again, ANY coordinate point in that “shared area” will satisfy both inequalities…

LINEAR SYSTEMS of INEQUALITIES – Graphing Method
EXAMPLE # 2 :
yx
yx
43
2
102
Let’s check the point ( 6 , - 4 )
( 6 , - 4 )
1014
1086
10426
102
yx
48
444
4463
2
The check coordinate satisfy’s BOTH …


![Solving & Graphing Linear Inequalities & Compound ... · 07/10/2018 · Solving & Graphing Linear Inequalities & Compound Inequalities[InClass Version]Algebra 1.notebook 24 October](https://static.fdocuments.in/doc/165x107/5f609302028f2543654b3819/solving-graphing-linear-inequalities-compound-07102018-solving.jpg)