Linear Referencing for Petroleum Exploration and Production Data
103
Linear Referencing Guide for Petroleum Exploration Robert L. Warford Senior GIS Analyst ESRI Houston
Transcript of Linear Referencing for Petroleum Exploration and Production Data

Linear Referencing Guide for Petroleum Exploration
Robert L. WarfordSenior GIS AnalystESRI Houston

Linear Referencing Guide for Petroleum Exploration
Contents…
•Introduction and Overview
•Linear Referencing Tools and Commands
•Linear Referenced Exploration Data
•Introduction to Data Interoperability
Section I: Linear Referencing Basics
Section II: Creating Route Layers•Creating Seismic Navigation Routes
•Displaying Seismic Navigation Routes
•Creating Wellpath Routes
•Displaying wellpath Routes

Linear Referencing Guide for Petroleum Exploration
Contents…
•Point Route Events (Formation Tops)
•Line Route Events (Lithologic Units)
•Discontinuous Line Route Events (Perforation Intervals)
•Using a Hatch Interval Attribute (Drilling Rates)
•Using Route Event Offsets (Well Log Intervals)
•Using Route Event Offsets (Well Log Values)
•Combined Wellpath Route Events
Section III: Route Events
References

Section ILinear Referencing
Basics

Introduction and Overview

Seismic Navigation Data OverviewShotpoint - A location or station where a seismic source is activated.
Navigation Data – The position of the seismic line as defined by the location of the shotpoints
Reflection Data – The time depth data
Seismic Navigation DataSeismic Reflection Profile

Wellbore Data OverviewMap view shows the horizontal path of a directionally drilled well
MD – Measured depth
TVD – True vertical depth (MD corrected for horizontal displacement)
TVDSS – True vertical depth subsea (relative to a vertical datum)
Wellbore Path (MD) Measured v.s. True Vertical Depth

Linear Referencing OverviewRoute – A linear feature containing a linear measurement system
Measures – Points which define the linear measurement system. Location, Value, Sign, Units (distance, time, magnitude)
Route Event – An occurrence along a route feature
Dynamic Segmentation – The process of creating route event geometry

Hatching OverviewHatching is a type of labeling that is designed to post and label hatch marks or symbols at a regular interval along measured linear features.
Hashing using line symbols
Has
hing
usi
ng m
arke
r sym
bols

Linear Referencing Tools and Commands
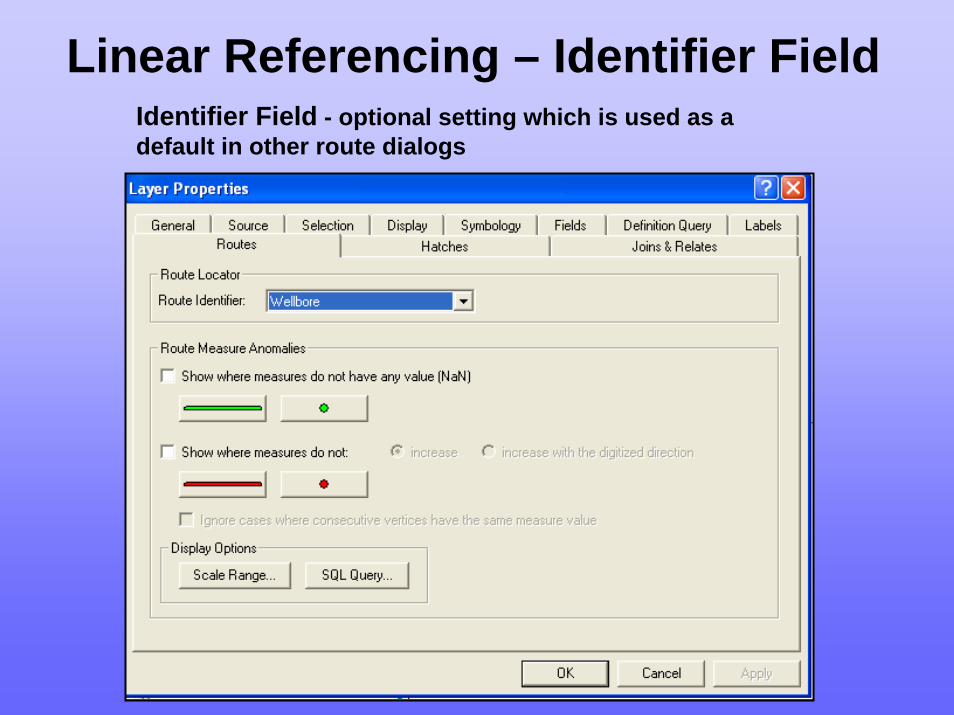
Linear Referencing – Identifier FieldIdentifier Field - optional setting which is used as a default in other route dialogs

Linear Referencing - ArcToolboxRecalculates route measures using points.
Create routes from existing lines segments.
Removes redundant information from event tables or separates event tables having more than one descriptive attribute into individual tables.
Computes the intersection of input features (point, line, or polygon) and route features and writes the route and measure information to a new event table.Creates a temporary feature layer using routes and route events.
Overlays two event tables to create an output event table that represents the union or intersection of the input.
Computes the intersection of input features (point, line, or polygon) and route features and writes the route and measure information to a new event table.
Various tools can be used with route features

Identify Route Command tool
Shows measure values along a route

Displaying Route Events
Create a route event layer by using the “Display Route Events” dialog

Route Toolbar (ArcEditor)
Define Line PortionDefines a sketch that represents a portion of the currently selected line feature. The portion is defined between a start point and an end-point.
Make RouteInvokes the Make Route dialog, which creates a new route in the target line layer from the currently selected set of line features.
Calibrate RouteOpens the Calibrate Route dialog, which adjusts the current selected route’s measures based on a series of digitized points.
ArcEditor tools which can be used to modify route data.

Route Geoprocessing WizardRoutes can be used in geoprocessing operations

Linear Referenced Exploration Data

Linear Referencing of Seismic Navigation Data
•Shotpoints are used to define routes
•Shotpoint measures can be used to interpolate the locations of missing shotpoints
•The display of shotpoint measures can be decimated so only some shotpoint locations are displayed
•Shotpoint measures can be labeled using an interval and orientation
•The end points can be displayed and labeled separately

Linear Referencing of Well Path Data
•Use MD to define measures
•Use TVDSS for Z values
•Point Route Events: Formation tops
•Line Route Events: Perforation, Core and DST intervals

Introduction to Data Interoperability

Two Methods for Creating Routes1. Add measures to existing lines•Standard method for creating routes
•Use ArcGIS tools (Make Route)
•Lines must already exist
•Use distances to define measures
2. Create routes from points•Assemble a set of points into lines with routes
•Each point becomes a vertex with a measure
•Not supported using standard ArcGIS tools
•Requires Data Interoperability extension
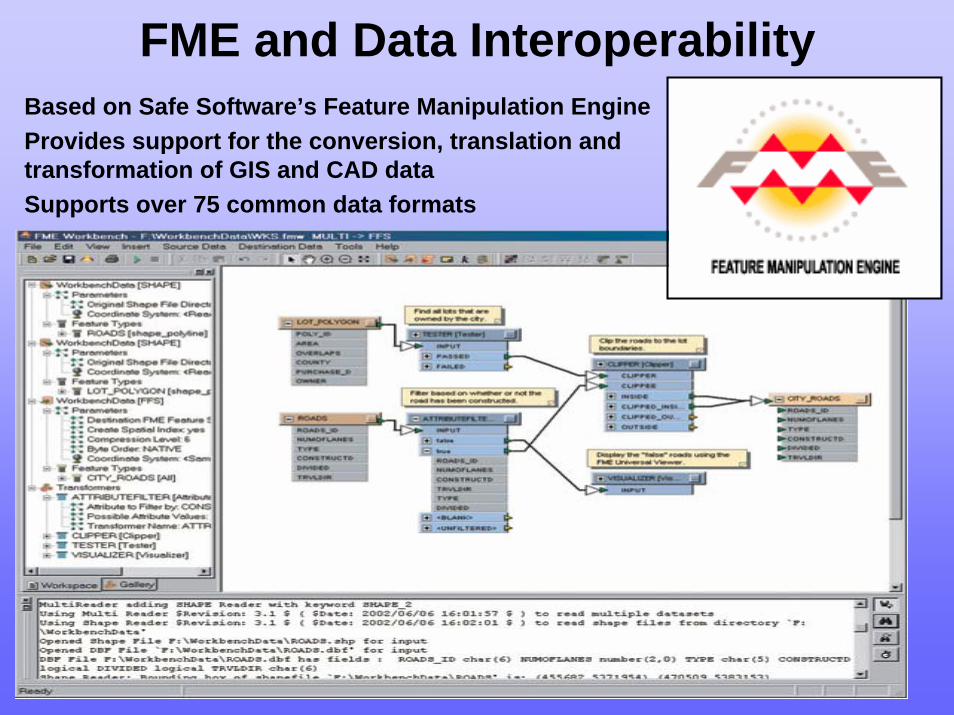
FME and Data InteroperabilityBased on Safe Software’s Feature Manipulation EngineProvides support for the conversion, translation and transformation of GIS and CAD dataSupports over 75 common data formats

Data Interoperability Connections
Create new nodes Directly read supported
formats as layers in your map

Quick Import and Export
•Import FME data into ESRI formats•Export ESRI data into FME formats•Use Quick Import and Export Tools in models

Custom Import and Export•Transform data being imported or exported•Many types of transformation elements•Connect transformations together•Read/write using multiple data sets•Uses a graphical interface to model transformations
Section IICreating Route Layers

Creating Seismic Navigation Routes

Seismic Data
Problem StatementHow do you create routes from a set of shotpointlocations stored in an Access database table?

Seismic Route Builder Tool
Data Source
2DPointReplacer
ListConcatenator
PointConnector
Destination
•Create routes from data stored in a Microsoft Access table•Uses latitude and longitude fields to create points (shotpoints)•Uses shotpoint values for measures

Seismic Route Builder Tool
PointConnector
•Start with a new Data Interoperability custom import tool•Drag transformers (2DPointReplacer, etc) from the list of transformers •Configure the properties of each transformer (see following slides)

Seismic Route Builder Tool
2DPointReplacer
ListConcatenator
PointConnector
Destination
•Start with a new Data Interoperability custom import tool•Drag transformers (2DPointReplacer, etc) from the list of transformers •Configure the properties of each transformer (see following slides)

Seismic Route Builder – 2DPointReplacer
Data Source
2DPointReplacer
ListConcatenator
PointConnector
Destination
Creates points from x, y fieldsConfigure by setting the properties
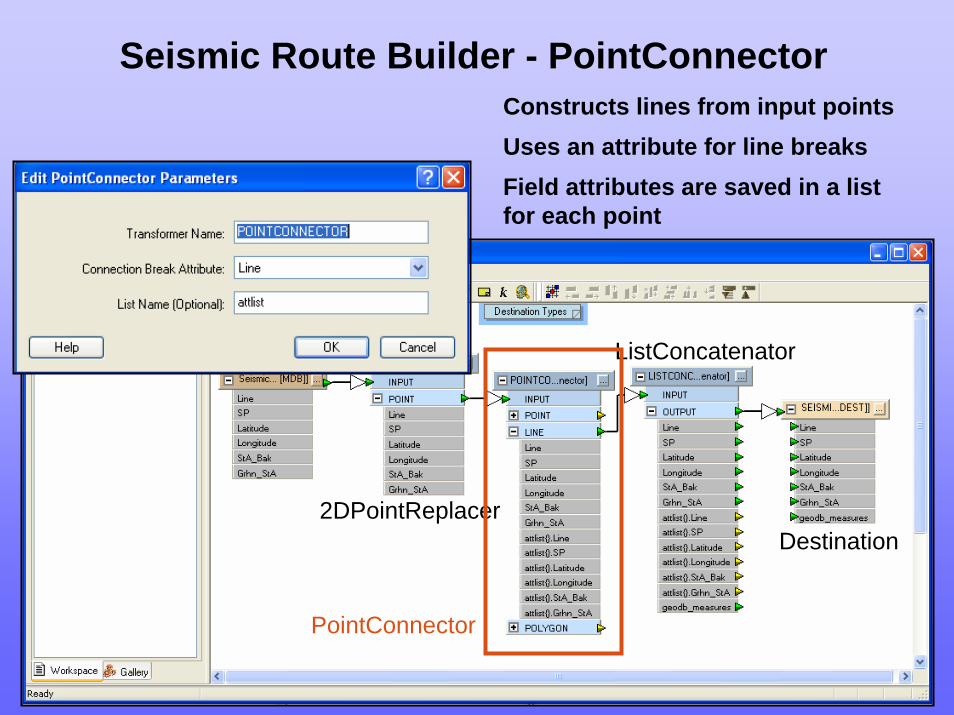
Seismic Route Builder - PointConnector
Data Source
2DPointReplacer
ListConcatenator
PointConnector
Destination
Constructs lines from input pointsUses an attribute for line breaksField attributes are saved in a list for each point

Seismic Route Builder - ListConcatenator
Data Source
2DPointReplacer
ListConcatenator
PointConnector
Destination
Adds a list to an output attributePuts shotpoint values into the geodb_measures attribute

Seismic Route Builder - Parameters
Set the coordinate reference system to match the source data
Tool Parameters

Seismic Route Builder
Expose the geodb_measuresattribute.
This is present for features that have measures when reading. To write measures, you simply build this list with one value for each vertex in the feature being written. This is a comma-separated list of floating values that correspond to the vertex measures. The first value is for the first vertex, second for the second, and so on.
Destination Properties

Seismic Route Builder
Set the “Output has M Values” property to “Enabled”
Environment Settings
Run the tool to create seismic routes
1. Double click on the tool
2. Set the properties and environment
3. Click OK to start processing

Displaying Seismic Navigation Routes
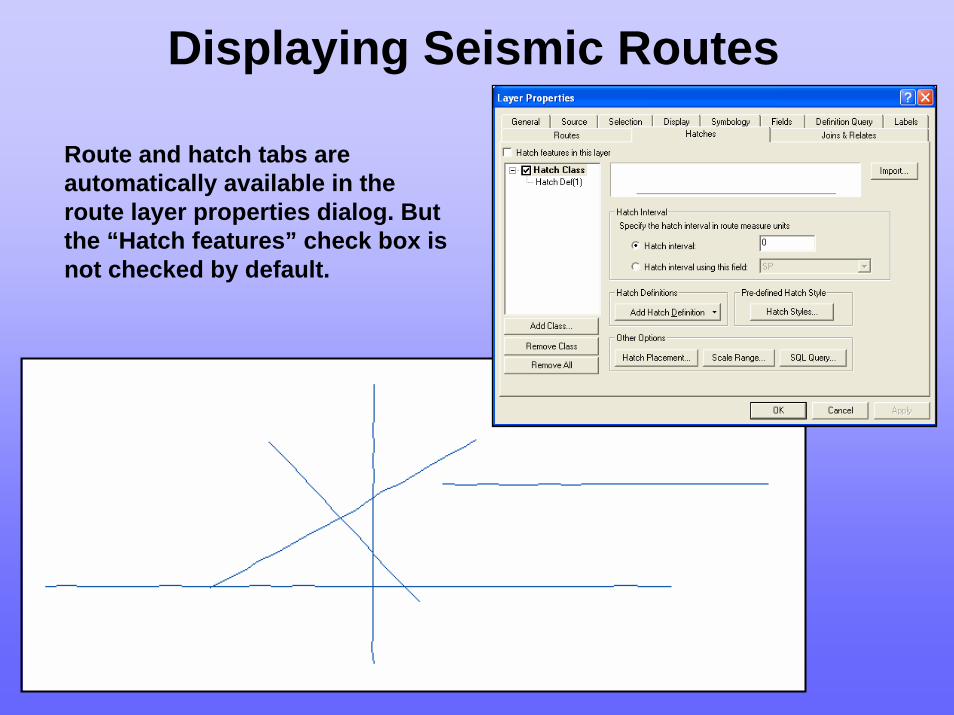
Displaying Seismic Routes
Route and hatch tabs are automatically available in the route layer properties dialog. But the “Hatch features” check box is not checked by default.

Displaying Seismic Routes – Hatch Class
Check the “Hatch features”check box.Set the hatch interval to 10

Displaying Seismic Routes – Hatch Definition 1
Click on Hatch DefinitionPlace hatches every 1 hatch intervalUse a marker symbolSet the symbol properties to use a hollow circle, size 8

Displaying Seismic Routes – Hatch Definition 5
Create a new hatch definitionPlace hatches every 5 hatch intervalUse a marker symbolSet the symbol properties to use a black circle, size 8Label the hatches with 10pt text

Displaying Seismic Routes – Hatch End Definition
Create a new end hatch definitionPlace hatches every 0 hatch intervalsUse a marker symbolSet the symbol properties to use a hollow circle, size 8Label the hatches with 10pt text

Displaying Seismic Routes – Line Labeling
Click on the labels tabCheck label featuresLabel field “Line”Set the font size to 8ptSet placement properties

Creating Wellpath Routes

Wellpath Data
Problem StatementHow do you create routes from a set of x, y, z locations stored in a Microsoft Access table?

Wellpath Route Builder Tool
Data Source
3DPointReplacer
ListConcatenator
PointConnectorDestination
•Creates 3D routes from data stored in a Microsoft Access table•Uses x (easting) and y (northing), and TVDSS fields to create points•Uses measured depths for measure values

Wellpath Route Builder Tool
PointConnector
•Start with a new Data Interoperability custom import tool•Drag transformers (2DPointReplacer, etc) from the list of transformers •Configure the properties of each transformer (see following slides)

Wellpath Route Builder Tool
2DPointReplacer
ListConcatenator
PointConnectorDestination
•Start with a new Data Interoperability custom import tool•Drag transformers (2DPointReplacer, etc) from the list of transformers •Configure the properties of each transformer (see following slides)

Wellpath Route Builder – 3DPointReplacer
Data Source
3DPointReplacer
ListConcatenator
PointConnectorDestination
Creates points from x, y, z fieldsConfigure by setting properties

Wellpath Route Builder - PointConnector
Data Source
3DPointReplacer
ListConcatenator
PointConnectorDestination
Constructs lines from input pointsUses an attribute for line breaksAttributes are saved in a list for each point

Wellpath Route Builder - ListConcatenator
Data Source
3DPointReplacerListConcatenator
PointConnector
Destination
Adds a list to an attributePuts measured depth values into the geodb_measuresattribute
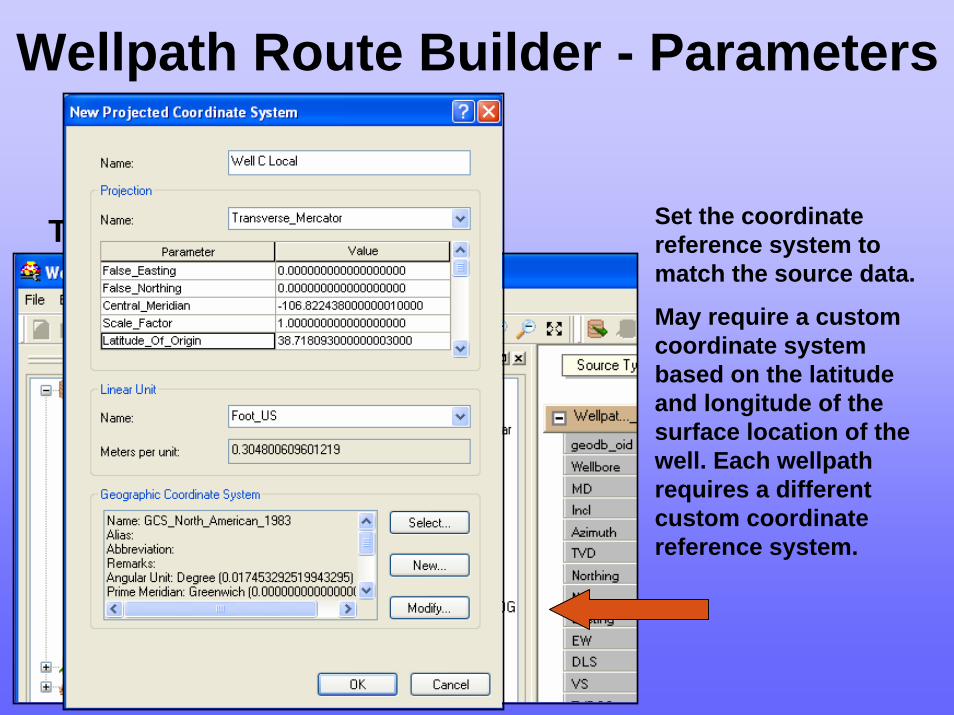
Set the coordinate reference system to match the source data.
May require a custom coordinate system based on the latitude and longitude of the surface location of the well. Each wellpathrequires a different custom coordinate reference system.
Tool Parameters
Wellpath Route Builder - Parameters
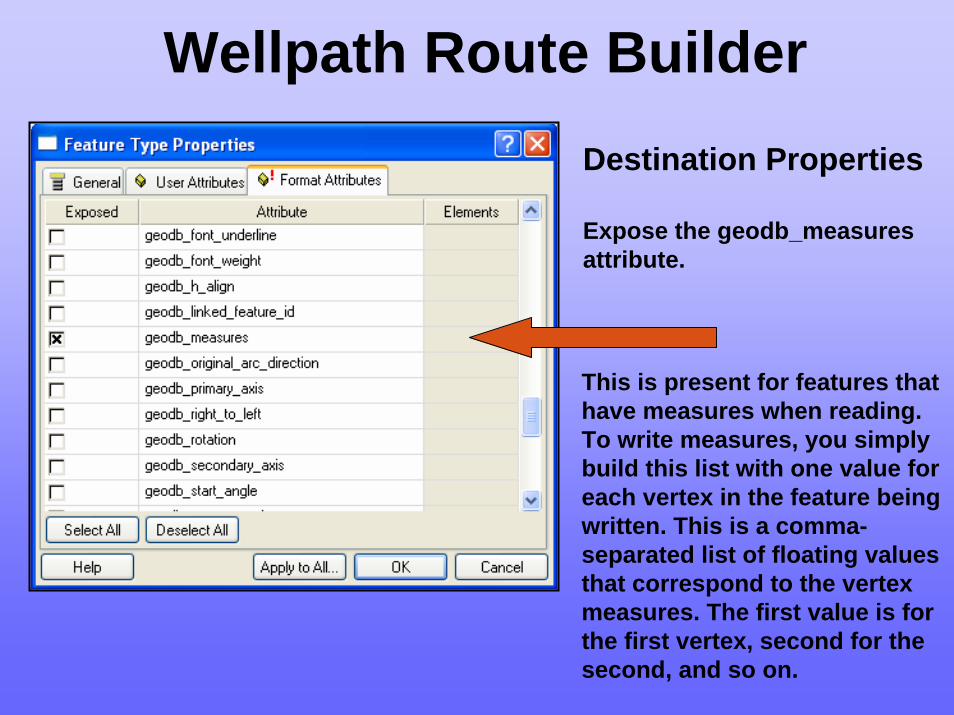
Expose the geodb_measuresattribute.
This is present for features that have measures when reading. To write measures, you simply build this list with one value for each vertex in the feature being written. This is a comma-separated list of floating values that correspond to the vertex measures. The first value is for the first vertex, second for the second, and so on.
Destination Properties
Wellpath Route Builder

Run the tool to create wellpath routes
1. Double click on the tool
2. Set the properties and environment
3. Click OK to start processing
Set the “Output has M Values” property to “Enabled”
Wellpath Route Builder
Set the “Output has Z Values” property to “Enabled”
Environment Settings
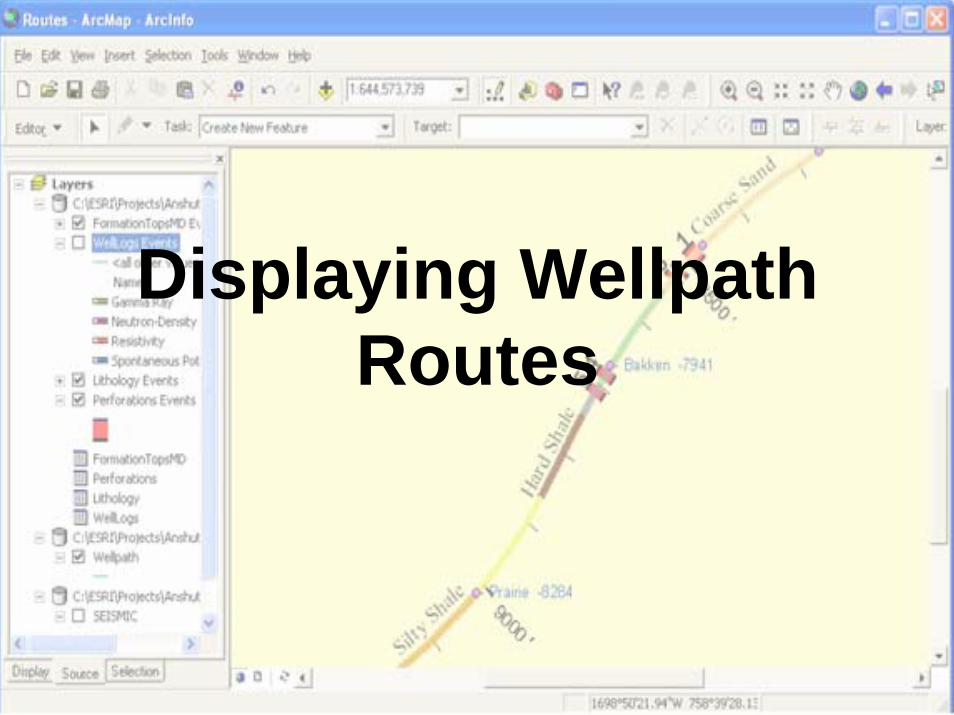
Displaying WellpathRoutes

Displaying Wellpath Routes
Route and hatch tabs are automatically available in the route layer properties dialog.
The “Hatch features” check box is not checked by default.

Displaying Wellpath Routes
Hatch Class: Lower Section•Hatch Interval = 100’•Start hatching at 4000’
The “Hatch features” check box must be checked.
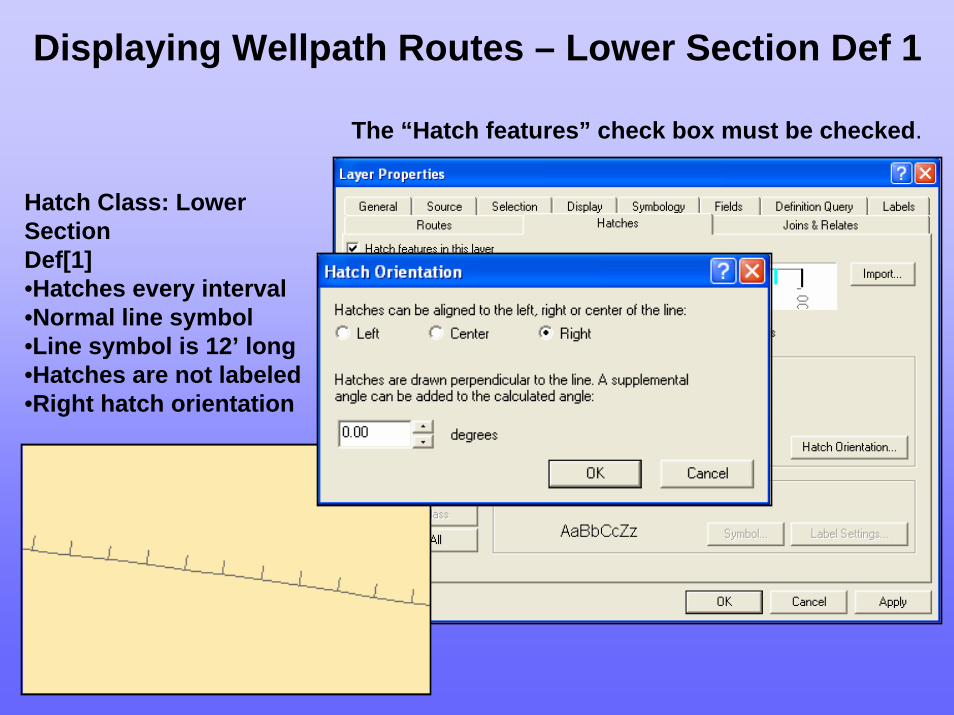
Displaying Wellpath Routes – Lower Section Def 1
The “Hatch features” check box must be checked.
Hatch Class: Lower SectionDef[1]•Hatches every interval•Normal line symbol•Line symbol is 12’ long•Hatches are not labeled•Right hatch orientation

Displaying Wellpath Routes – Lower Section Def 5
The “Hatch features” check box must be checked.Hatch Class: Lower Section
Def[5]•Hatches every 5 intervals•Bold line symbol•Line symbol is 20’ long•Hatches are labeled•Right hatch orientation•Text vertical alignment -Center

Displaying Wellpath Routes – Lower Section Def 5
Hatch Class: Lower SectionDef[5]•Hatches every 5 intervals•Bold line symbol•Line symbol is 20’ long•Hatches are labeled•Right hatch orientation•Text Vertical Alignment Center

Displaying Wellpath Routes – Total Depth
Hatch Class: Total Depth•Interval = 0
The “Hatch features” check box must be checked.

Displaying Wellpath Routes – Total Depth
Hatch Class: Total DepthDef[End]•Line length 15 ‘•Red line and text•Use prefix/suffix
The “Hatch features” check box must be checked.
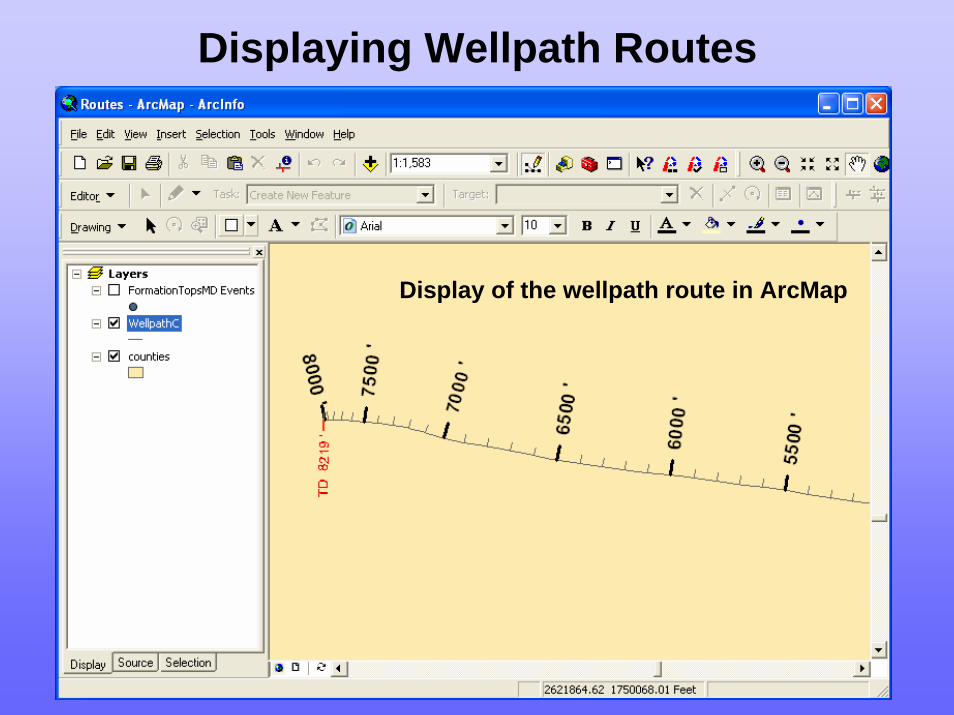
Displaying Wellpath Routes
Display of the wellpath route in ArcMap

Section IIIRoute Events

Point Route Events

Point Route EventsFormation Tops
Example of a table containing formation tops
This table of formation top data was used in the following route event example.
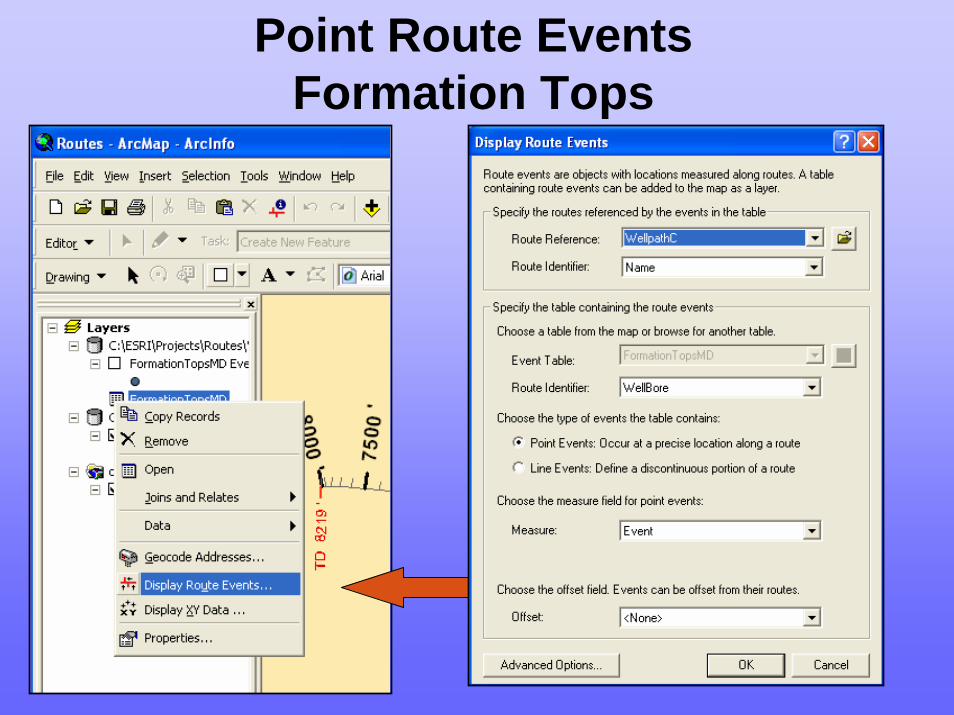
Point Route EventsFormation Tops
Show the dialog window used to create a route event layer

Point Route EventsFormation Tops
Add a label expression to show the formation name and depth

Point Route EventsFormation Tops
Set the label placement properties

Formation Tops in ArcMapFormation top events displayed in ArcMap

Line Route Events

Line Route EventsLithologic Units
Example of a table containing wellbore lithology
This table of lithologic data was used in the following route event example.

Line Route EventsLithologic Units
Specify start and end measure attributes to create a line route event layer .
Display the “Display Route Events..” dialog by right clicking on the “Lithologic Unit”table in the ArcMap table of contents.

Line Route EventsLithologic Units
The lithology route layer uses a unique value legend based on the lithology attribute field

Line Route EventsLithologic Units
Use an attribute field to specify the hatch interval

Line Route EventsLithologic Units
Hatches are labeled using the lithology field in an expression

Lithologic Units in ArcMapEach line event classification has a unique color

Discontinuous Line Route Events

Discontinuous Line Route EventsPerforation Intervals
Example of a table containing well perforation intervals(could have used drill stem test or core intervals instead)
This table of perforation interval data was used in the following route event example.

Discontinuous Line Route EventsPerforation Intervals
Specify start and end measure attributes to create line a line route event layer .
Display the “Display Route Events..” dialog by right clicking on the “Perforation Interval” table in the ArcMaptable of contents.

Well Perforations in ArcMap

Using a Hatch Interval Attribute

Hatch Interval AttributeDrilling Rates
Example of a table containing drilling rates
This table of drilling rate data was used in the following route event example.
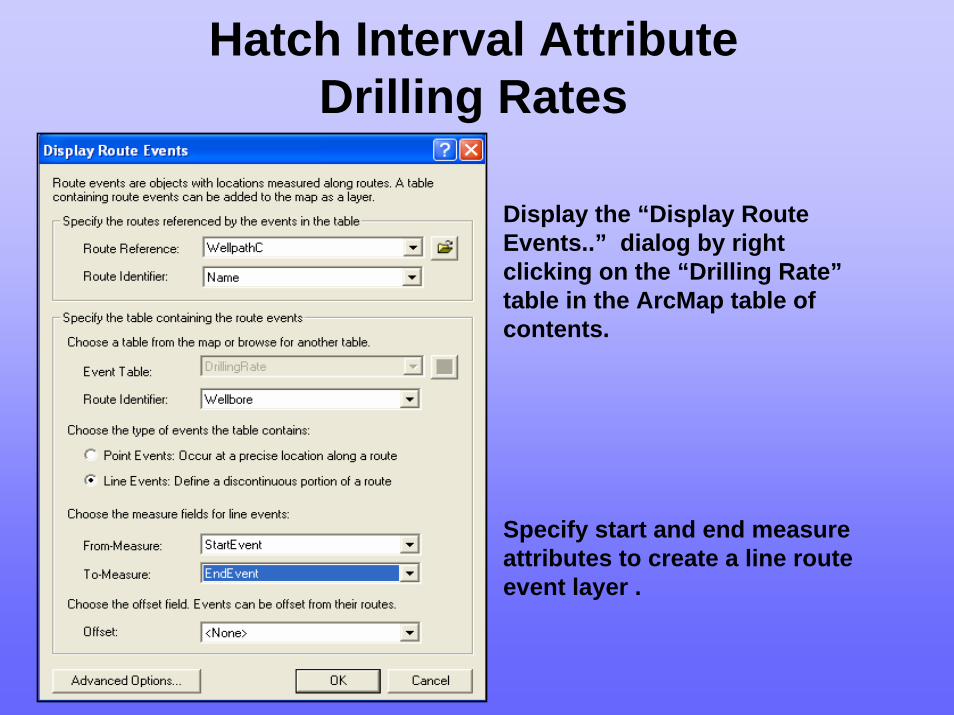
Hatch Interval AttributeDrilling Rates
Specify start and end measure attributes to create a line route event layer .
Display the “Display Route Events..” dialog by right clicking on the “Drilling Rate”table in the ArcMap table of contents.

Hatch Interval AttributeDrilling Rates
Use the StartEventattribute field for the hatch interval.

Drilling Rates Displayed in ArcMap

Using Route Event Offsets

Route Event OffsetsWell Logs
Example of a table containing well log intervals
This table of well log interval data was used in the following route event example.

Route Event OffsetsWell Logs
Specify start and end measure attributes to create a line route event layer .
Use an attribute containing offset distances in map units
Display the “Display Route Events..” dialog by right clicking on the “Well Log Interval” table in the ArcMap table of contents.

Well Logs in ArcMapWell log intervals appear using offsets which overlap along the wellbore

Well Logs in ArcMap
Two extra well log interval event layers were created without using the offset field. In these layers hatched lines were used to show the start of each log interval

Using Route Event Offsets
(Well Log Values)

Route Event OffsetsWell Log Values
Example of a table containing gamma ray values
This table of gamma ray data was used in the following route event example.

Route Event OffsetsWell Log Values
The measure positions are offset using the gamma ray values
Display the “Display Route Events..” dialog by right clicking on the ‘Well Log Values” table in the ArcMap table of contents.

Route Event OffsetsWell Log Values
Gamma Ray values displayed spatially, as points. They are offset from the wellbore by the value of the Gamma Ray.
The Gamma Ray measure points can be exported to a geodatabase for use in ArcScene.

Route Event OffsetsWell Log Values
The Gamma Ray data displayed next to the wellbore in ArcScene.
The Gamma Ray data manipulated in 3D

Route Event OffsetsWell Log Values
Movie of a gamma ray curve displayed as 3D points
Click on the picture to view the movie

Combined WellpathRoute Events

Wellpath Route Events

Wellpath Route Events
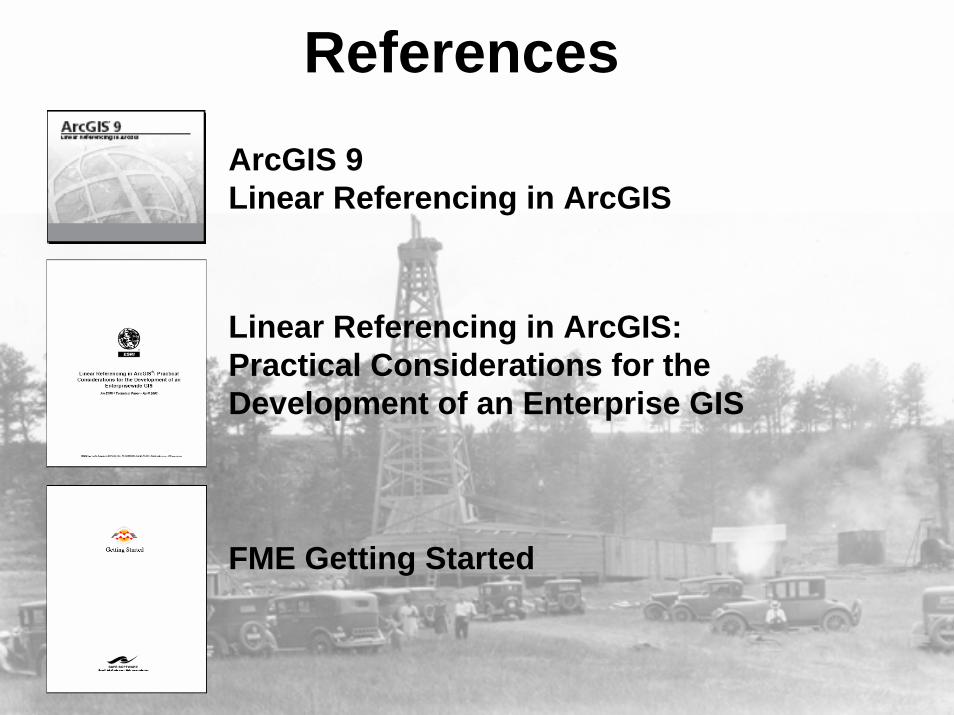
ReferencesArcGIS 9Linear Referencing in ArcGIS
Linear Referencing in ArcGIS: Practical Considerations for the Development of an Enterprise GIS
FME Getting Started

References
FME Readers and Writers
ArcGIS Data Interoperability Tutorial