Linear and nonlinear dynamics of cylindrically and...
29
This is a repository copy of Linear and nonlinear dynamics of cylindrically and spherically expanding detonation waves. White Rose Research Online URL for this paper: http://eprints.whiterose.ac.uk/7930/ Article: Watt, S.D. and Sharpe, G.J. (2005) Linear and nonlinear dynamics of cylindrically and spherically expanding detonation waves. Journal of Fluid Mechanics, 522. pp. 329-356. ISSN 0022-1120 https://doi.org/10.1017/S0022112004001946 [email protected] https://eprints.whiterose.ac.uk/ Reuse See Attached Takedown If you consider content in White Rose Research Online to be in breach of UK law, please notify us by emailing [email protected] including the URL of the record and the reason for the withdrawal request.
-
Upload
nguyenduong -
Category
Documents
-
view
221 -
download
0
Transcript of Linear and nonlinear dynamics of cylindrically and...
This is a repository copy of Linear and nonlinear dynamics of cylindrically and spherically expanding detonation waves.
White Rose Research Online URL for this paper:http://eprints.whiterose.ac.uk/7930/
Article:
Watt, S.D. and Sharpe, G.J. (2005) Linear and nonlinear dynamics of cylindrically and spherically expanding detonation waves. Journal of Fluid Mechanics, 522. pp. 329-356. ISSN 0022-1120
https://doi.org/10.1017/S0022112004001946
[email protected]://eprints.whiterose.ac.uk/
Reuse
See Attached
Takedown
If you consider content in White Rose Research Online to be in breach of UK law, please notify us by emailing [email protected] including the URL of the record and the reason for the withdrawal request.

J. Fluid Mech. (2005), vol. 522, pp. 329–356. c© 2005 Cambridge University Press
DOI: 10.1017/S0022112004001946 Printed in the United Kingdom
329
Linear and nonlinear dynamics of cylindricallyand spherically expanding detonation waves
By SIMON D. WATT AND GARY J. SHARPE†
School of Mathematics and Statistics, University of Birmingham, Edgbaston,Birmingham B15 2TT, UK
(Received 27 October 2003 and in revised form 1 September 2004)
The nonlinear stability of cylindrically and spherically expanding detonation waves isinvestigated using numerical simulations for both directly (blast) initiated detonationsand cases where the simulations are initialized by placing quasi-steady solutionscorresponding to different initial shock radii onto the grid. First, high-resolution one-dimensional (axially or radially symmetric) simulations of pulsating detonations areperformed. Emphasis is on comparing with the predictions of a recent one-dimensionallinear stability analysis of weakly curved detonation waves. The simulations show that,in agreement with the linear analysis, increasing curvature has a rapid destabilizingeffect on detonation waves. The initial size and growth rate of the pulsation amplitudedecreases as the radius where the detonation first forms increases. The pulsationsmay reach a saturated nonlinear behaviour as the amplitude grows, such that thesubsequent evolution is independent of the initial conditions. As the wave expandsoutwards towards higher (and hence more stable) radii, the nature of the saturatednonlinear dynamics evolves to that of more stable behaviour (e.g. the amplitude ofthe saturated nonlinear oscillation decreases, or for sufficiently unstable cases, theoscillations evolve from multi-mode to period-doubled to limit-cycle-type behaviour).For parameter regimes where the planar detonation is stable, the linear stabilityprediction of the neutrally stable curvature gives a good prediction of the locationof the maximum amplitude (provided the stability boundary is reached beforethe oscillations saturate) and of the critical radius of formation above which nooscillations are seen. The linear analysis also predicts very well the dependenceof the period on the radius, even in the saturated nonlinear regimes. Secondly,preliminary two-dimensional numerical simulations of expanding cellular detonationsare performed, but it is shown that resolved and accurate calculations of the cellulardynamics are currently computationally prohibitive, even with a dynamically adaptivenumerical scheme.
1. Introduction
Detonation waves are powerful and rapid (supersonic) combustion waves whichcan propagate through reactive materials. These waves consist of a shock wave, whichraises the pressure and temperature of the explosive, initiating the chemical reactions,and an exothermic reaction zone, the heat release of which provides the energyto drive the wave forward. Detonations are prone (especially in gaseous mixtures)to both a pulsating instability in which the front oscillates longitudinally and a
† Present address: Los Alamos National Laboratory, New Mexico, NM 87545, USA.

330 S. D. Watt and G. J. Sharpe
multi-dimensional cellular instability in which the front becomes wrinkled (Fickett &Davis 1979). Predicting different instability regimes and understanding of these instabi-lities is important if one wishes to control detonation processes, either for applicationswhich make use of the power of these waves, such as in Pulsed Detonation Enginetechnology, or for explosion safety issues (i.e. in preventing unplanned detonations).
The majority of previous theoretical work on detonation instabilities has concernedplanar detonation waves, relevant to detonation waves in channels or square tubes.This includes linear stability analyses of steady, planar detonations (e.g. Short &Stewart 1998), weakly nonlinear theories (e.g. Short 2001), one-dimensional numericalsimulations of pulsating detonations (e.g. Sharpe & Falle 2000a; Radulescu et al.2002) and multi-dimensional simulations of cellular detonations (e.g. Sharpe 2001;Bourlioux & Majda 1992). However, if the detonation propagates through an uncon-fined reactive material (such as cylindrically or spherically expanding detonationsinitiated by a high-energy source, or detonation diffraction when the wave exits fromthe end of a tube) or the reactive material is weakly confined by a surroundinginert material (e.g. sticks of explosives or gaseous detonations propagating in porouswalled tubes), then the wave front is globally curved. In these cases, it is importantto understand how this global curvature affects the stability of the detonation andconversely how the instabilities affect the propagation of the curved detonation front.
Recently, Watt & Sharpe (2003) performed a one-dimensional linear stability ana-lysis (corresponding to the pulsating detonation instability) of weakly curved, quasi-steady detonations. This analysis predicts that even weak curvature will have asignificant destabilizing effect on detonations, as well as providing a prediction ofneutral stability boundaries, i.e. critical curvatures above which the front becomesunstable. This appears to agree with one-dimensional numerical simulations of directlyinitiated radially expanding detonations (He & Clavin 1994; Eckett, Quirk & Shepherd2000; Sharpe 2000; Ng & Lee 2003) which show that the curved detonation may beunstable even when the planar wave is stable, but that the expanding waves becomeless unstable as the radius of the front increases. However, these previous simulationsof radially expanding detonations were mainly concerned with the direct initiationproblem (i.e. with criteria for the minimum source energy required for initiating thedetonation) or with the quasi-steady state, rather than with the nature of the nonlinearstability of the wave itself, and had no stability analysis with which to compare.
The main purpose of this paper is to compare nonlinear calculations with thepredictions of the linear stability analysis in Watt & Sharpe (2003), and to investigatehow curvature affects the nonlinear stability of detonation waves. Here we performnumerical simulations of cylindrically and spherically expanding detonation waves,since this is the simplest geometry in which curvature of detonation fronts is important.Indeed, this case is sufficiently simple that one-dimensional (axially or radiallysymmetric) simulations are possible, and hence we can compare directly with the one-dimensional stability analysis in Watt & Sharpe (2003). Such expanding detonationscan be initiated by a sufficiently high-energy line or point source in cylindrical andspherical geometry, respectively. For example, a cylindrically expanding detonationin a reactive gas may be initiated by a length of exploding cord embedded in the gas(Radulescu et al. 2003), while small spherical sources of solid explosives have beenused to initiate spherical detonations (Radulescu et al. 2000). However, it should bestressed that while in our simulations the radially expanding detonations are initiatedby high-energy line or point sources, we are not concerned with the direct initiationproblem itself, but with the nonlinear dynamics of the propagation of the detonationwave after it has formed.

Expanding detonation waves 331
The plan of the paper is as follows: the mathematical model is described in § 2;quasi-steady solutions to these equations and their linear stability are reviewed in § 3;the numerical method is described in § 4; the results for the pulsating and cellularinstabilities are given in § 5 and § 6, respectively; § 7 contains the conclusions andideas for future work.
2. Governing equations
In this paper we use the standard, idealized model of a detonation with a single,irreversible reaction, A → B. This is the model used in the stability analysis of Watt &Sharpe (2003) with which we wish to compare. In one dimension the governingequations are thus
∂ρ
∂t+
∂(ρu)
∂r+
j
r(ρu) = 0, (2.1)
∂(ρu)
∂t+
∂(ρu2 + p)
∂r+
j
r(ρu2) = 0, (2.2)
∂(ρe)
∂t+
∂(ρue + pu)
∂r+
j
r(ρue + pu) = 0, (2.3)
∂(ρλ)
∂t+
∂(ρuλ)
∂r+
j
r(ρuλ) = −αλ exp(−τ/T ) = W, (2.4)
where ρ is the density of the fluid, u the velocity, p the pressure,
e =p
(γ − 1)ρ+ 1
2u2 − q(1 − λ)
the total energy per unit mass, λ the reaction progress variable or fuel mass fraction(with λ=1 for completely unburnt and λ= 0 for completely burnt), T =p/ρ is thetemperature, α the rate constant, τ the activation temperature, γ the (constant) ratioof specific heats, q the heat of reaction and j = 1 for cylindrical geometry or j =2for spherical geometry. Equations (2.1)–(2.4) have been non-dimensionalized usingthe upstream density and the speed and half-reaction length of the steady planarChapman–Jouguet (CJ) (self-supporting) detonation (these scalings are describedmore fully in Sharpe 1997). However, for detonation stability studies, the activationtemperature and heat of reaction are usually given in terms of Erpenbeck’s (1964)scalings for these parameters, E and Q (i.e. those scaled with the upstreamtemperature). Here we will set Q =50 and γ = 1.2 and vary the activation temperature(E). The relationship between the scalings is τ =p0E and q = p0Q where p0 is thedimensionless upstream pressure in our scalings, with p0 = 0.0216 for Q =50 (Sharpe1997).
3. Quasi-steady solutions and linear stability
For a stable radially expanding detonation, numerical simulations of the reactiveEuler equations show that the instantaneous speed and structure of the detonationat a given shock radius are described accurately by a quasi-steady analysis (Sharpe2000; Short & Sharpe 2003), i.e. the assumption that the front evolves on a timescalewhich is long compared to the particle transit time through the reaction zone holds.Stable expanding detonation fronts are therefore described to leading order by thequasi-steady version of equations (2.1)–(2.4), which, written in a frame attached to
332 S. D. Watt and G. J. Sharpe
0.5
0.6
0.7
0.8
0.9
0 200 400 600 800 1000
ps
rs/j
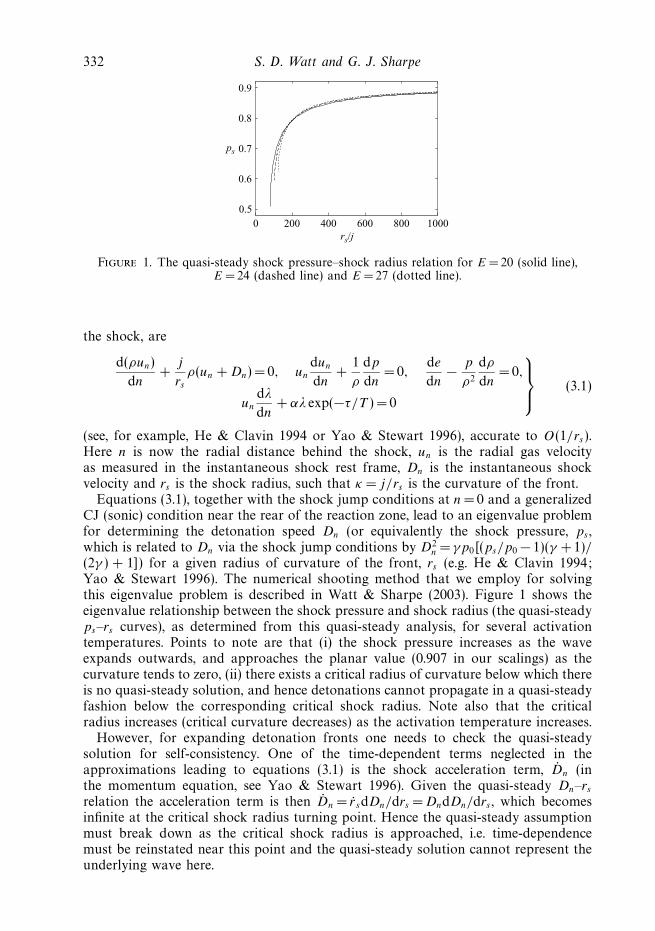
Figure 1. The quasi-steady shock pressure–shock radius relation for E = 20 (solid line),E = 24 (dashed line) and E = 27 (dotted line).
the shock, are
d(ρun)
dn+
j
rs
ρ(un + Dn) = 0, un
dun
dn+
1
ρ
dp
dn=0,
de
dn−
p
ρ2
dρ
dn=0,
un
dλ
dn+ αλ exp(−τ/T ) = 0
(3.1)
(see, for example, He & Clavin 1994 or Yao & Stewart 1996), accurate to O(1/rs).Here n is now the radial distance behind the shock, un is the radial gas velocityas measured in the instantaneous shock rest frame, Dn is the instantaneous shockvelocity and rs is the shock radius, such that κ = j/rs is the curvature of the front.
Equations (3.1), together with the shock jump conditions at n = 0 and a generalizedCJ (sonic) condition near the rear of the reaction zone, lead to an eigenvalue problemfor determining the detonation speed Dn (or equivalently the shock pressure, ps ,which is related to Dn via the shock jump conditions by D2
n = γp0[(ps/p0 − 1)(γ +1)/(2γ ) + 1]) for a given radius of curvature of the front, rs (e.g. He & Clavin 1994;Yao & Stewart 1996). The numerical shooting method that we employ for solvingthis eigenvalue problem is described in Watt & Sharpe (2003). Figure 1 shows theeigenvalue relationship between the shock pressure and shock radius (the quasi-steadyps–rs curves), as determined from this quasi-steady analysis, for several activationtemperatures. Points to note are that (i) the shock pressure increases as the waveexpands outwards, and approaches the planar value (0.907 in our scalings) as thecurvature tends to zero, (ii) there exists a critical radius of curvature below which thereis no quasi-steady solution, and hence detonations cannot propagate in a quasi-steadyfashion below the corresponding critical shock radius. Note also that the criticalradius increases (critical curvature decreases) as the activation temperature increases.
However, for expanding detonation fronts one needs to check the quasi-steadysolution for self-consistency. One of the time-dependent terms neglected in theapproximations leading to equations (3.1) is the shock acceleration term, Dn (inthe momentum equation, see Yao & Stewart 1996). Given the quasi-steady Dn–rs
relation the acceleration term is then Dn = r sdDn/drs = DndDn/drs , which becomesinfinite at the critical shock radius turning point. Hence the quasi-steady assumptionmust break down as the critical shock radius is approached, i.e. time-dependencemust be reinstated near this point and the quasi-steady solution cannot represent theunderlying wave here.
Expanding detonation waves 333
0
0.01
0.02
0.03
0.04
0.05
80 100 120 140 160 180 200
Acc
eler
atio
n
rs rs
(a)
0
0.01
0.02
0.03
0.04
0.05
100 120 140 160 180 200
(b)
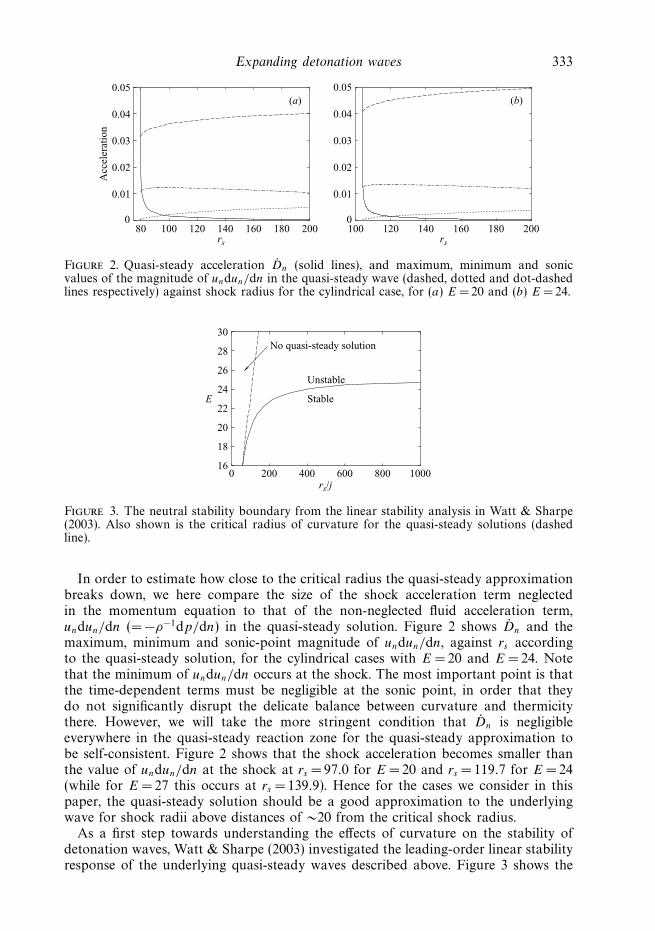
Figure 2. Quasi-steady acceleration Dn (solid lines), and maximum, minimum and sonicvalues of the magnitude of undun/dn in the quasi-steady wave (dashed, dotted and dot-dashedlines respectively) against shock radius for the cylindrical case, for (a) E = 20 and (b) E = 24.
16
18
20
22
24
26
28
30
0 200 400 600 800 1000
E
rs/j
Unstable
Stable
No quasi-steady solution
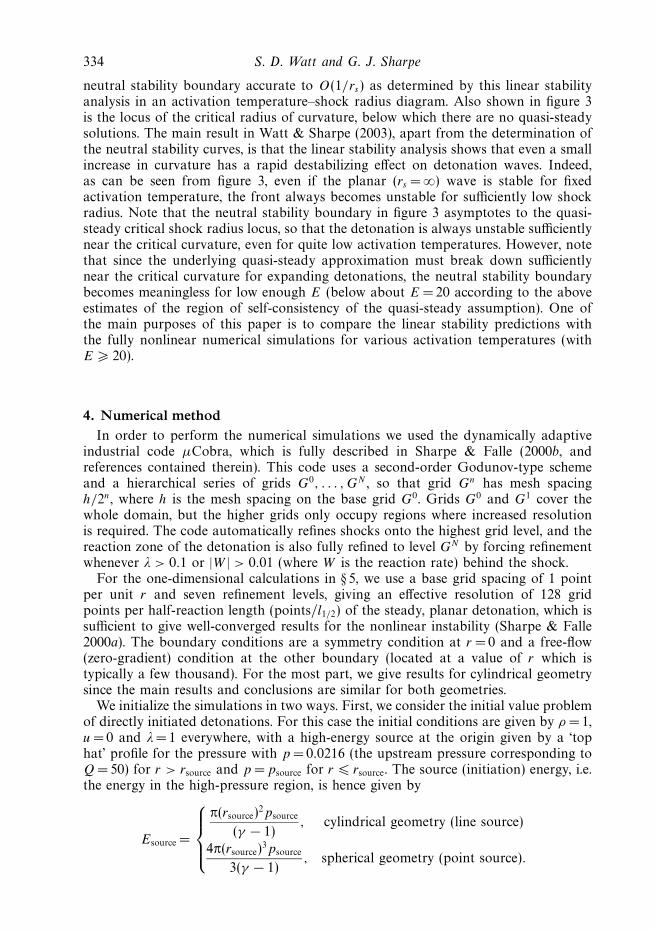
Figure 3. The neutral stability boundary from the linear stability analysis in Watt & Sharpe(2003). Also shown is the critical radius of curvature for the quasi-steady solutions (dashedline).
In order to estimate how close to the critical radius the quasi-steady approximationbreaks down, we here compare the size of the shock acceleration term neglectedin the momentum equation to that of the non-neglected fluid acceleration term,undun/dn (= −ρ−1dp/dn) in the quasi-steady solution. Figure 2 shows Dn and themaximum, minimum and sonic-point magnitude of undun/dn, against rs accordingto the quasi-steady solution, for the cylindrical cases with E =20 and E = 24. Notethat the minimum of undun/dn occurs at the shock. The most important point is thatthe time-dependent terms must be negligible at the sonic point, in order that theydo not significantly disrupt the delicate balance between curvature and thermicitythere. However, we will take the more stringent condition that Dn is negligibleeverywhere in the quasi-steady reaction zone for the quasi-steady approximation tobe self-consistent. Figure 2 shows that the shock acceleration becomes smaller thanthe value of undun/dn at the shock at rs = 97.0 for E = 20 and rs = 119.7 for E =24(while for E = 27 this occurs at rs = 139.9). Hence for the cases we consider in thispaper, the quasi-steady solution should be a good approximation to the underlyingwave for shock radii above distances of ∼20 from the critical shock radius.
As a first step towards understanding the effects of curvature on the stability ofdetonation waves, Watt & Sharpe (2003) investigated the leading-order linear stabilityresponse of the underlying quasi-steady waves described above. Figure 3 shows the
334 S. D. Watt and G. J. Sharpe
neutral stability boundary accurate to O(1/rs) as determined by this linear stabilityanalysis in an activation temperature–shock radius diagram. Also shown in figure 3is the locus of the critical radius of curvature, below which there are no quasi-steadysolutions. The main result in Watt & Sharpe (2003), apart from the determination ofthe neutral stability curves, is that the linear stability analysis shows that even a smallincrease in curvature has a rapid destabilizing effect on detonation waves. Indeed,as can be seen from figure 3, even if the planar (rs = ∞) wave is stable for fixedactivation temperature, the front always becomes unstable for sufficiently low shockradius. Note that the neutral stability boundary in figure 3 asymptotes to the quasi-steady critical shock radius locus, so that the detonation is always unstable sufficientlynear the critical curvature, even for quite low activation temperatures. However, notethat since the underlying quasi-steady approximation must break down sufficientlynear the critical curvature for expanding detonations, the neutral stability boundarybecomes meaningless for low enough E (below about E = 20 according to the aboveestimates of the region of self-consistency of the quasi-steady assumption). One ofthe main purposes of this paper is to compare the linear stability predictions withthe fully nonlinear numerical simulations for various activation temperatures (withE � 20).
4. Numerical method
In order to perform the numerical simulations we used the dynamically adaptiveindustrial code µCobra, which is fully described in Sharpe & Falle (2000b, andreferences contained therein). This code uses a second-order Godunov-type schemeand a hierarchical series of grids G0, . . . , GN , so that grid Gn has mesh spacingh/2n, where h is the mesh spacing on the base grid G0. Grids G0 and G1 cover thewhole domain, but the higher grids only occupy regions where increased resolutionis required. The code automatically refines shocks onto the highest grid level, and thereaction zone of the detonation is also fully refined to level GN by forcing refinementwhenever λ > 0.1 or |W | > 0.01 (where W is the reaction rate) behind the shock.
For the one-dimensional calculations in § 5, we use a base grid spacing of 1 pointper unit r and seven refinement levels, giving an effective resolution of 128 gridpoints per half-reaction length (points/l1/2) of the steady, planar detonation, which issufficient to give well-converged results for the nonlinear instability (Sharpe & Falle2000a). The boundary conditions are a symmetry condition at r = 0 and a free-flow(zero-gradient) condition at the other boundary (located at a value of r which istypically a few thousand). For the most part, we give results for cylindrical geometrysince the main results and conclusions are similar for both geometries.
We initialize the simulations in two ways. First, we consider the initial value problemof directly initiated detonations. For this case the initial conditions are given by ρ =1,u =0 and λ= 1 everywhere, with a high-energy source at the origin given by a ‘tophat’ profile for the pressure with p =0.0216 (the upstream pressure corresponding toQ =50) for r > rsource and p = psource for r � rsource. The source (initiation) energy, i.e.the energy in the high-pressure region, is hence given by
Esource =
π(rsource)2psource
(γ − 1), cylindrical geometry (line source)
4π(rsource)3psource
3(γ − 1), spherical geometry (point source).

Expanding detonation waves 335
One half-reaction length is typically used for the hot-spot radius, rsource = 1. Thisinitial condition quickly produces a classical self-similar strong blast wave. Providedthe source energy is sufficiently high then as the blast wave expands outwards anddecays, the shock and exothermicity of the reactions begin to couple and eventuallyproduce a radially expanding detonation (see Ng & Lee 2003). For convenience wedefine a scaled source energy by
Es =
{
(γ − 1)Esource/π (cylindrical geometry)
3(γ − 1)Esource/4π (spherical geometry).
While this initial value problem is more physically realistic and allows us toinvestigate the complete nonlinear evolution from initiation onwards, this is not aclean problem for comparing directly with the linear stability analysis of the quasi-steady solutions, because the stability and initiation characteristics may overlap, i.e.for cases where the blast wave approaches the quasi-steady curve near the criticalshock radius it is difficult to assess where the underlying wave would have becomequasi-steady (if it were stable) and thus to ensure that the pulsations belong to a fullyformed detonation. Hence in order to compare the nonlinear results more directlywith the linear stability predictions, we also consider cases where we initialize thesimulations by placing the quasi-steady solution (obtained by numerical integrationof equations (3.1)) corresponding to various values of rs onto the numerical grid. Inthis case the perturbation to the quasi-steady solution is mainly due to the startuperror from the initial smearing out of the shock, as usual (see Sharpe & Falle 2000a,for example).
For the two-dimensional simulations of cylindrically expanding fronts in § 6,Cartesian coordinates are used, with the numerical domain consisting of the quarter-plane x � 0, y � 0, with symmetry boundary conditions at x = 0 and y =0 (andfree-flow conditions at the other two boundaries). The initial conditions are similarto those of the one-dimensional simulations (i.e. a high pressure in the regionx2 + y2 � (rsource)
2).
5. Pulsating instability
In this section we give the results of the one-dimensional simulations for variousactivation temperatures and source energies. In discussing these results, it is instructiveto review the one-dimensional nonlinear stability of planar detonation fronts describedin Sharpe & Falle (2000a). First, for planar waves, when the initial conditions are givenby the underlying steady detonation, the linear stability analysis accurately predictsthe stability boundaries as a stability parameter (e.g. the activation temperature) isvaried. For unstable cases there are two stages in the evolution. Initially the shockspeed (or pressure) begins to oscillate with an exponentially growing amplitude. Asthe stability parameter is varied such that the linear analysis predicts that the steadywave becomes more unstable, the initial growth rate of the oscillations increases asexpected.
However, the amplitude of the oscillations eventually saturates as it reaches anonlinear equilibrium behaviour. Sufficiently near the stability boundary this saturatednonlinear behaviour is that of a limit cycle (constant-amplitude oscillations). Thefinal amplitude of the limit-cycle oscillation is smaller for less unstable values of thestability parameter. However, one important point to note is that as the neutrallystable value of the parameter is approached, the limit cycle amplitude does not tend
336 S. D. Watt and G. J. Sharpe
to zero (although the linear growth rate of the initial stage does). Hence for veryweakly unstable cases the oscillations grow very slowly, but still eventually saturateat some finite amplitude. Further from the stability boundary the saturated nonlinearbehaviour undergoes period doubling bifurcations, and for sufficiently unstable waves,the final behaviour may be multi-mode or chaotic.
The main difference between the previous one-dimensional simulations of planardetonations and those for radially expanding detonations considered here, is that ourmain stability parameter (the curvature of the front) is not a constant but changes intime (towards more stable values according to the linear stability analysis in Watt &Sharpe 2003) as the wave front expands outwards. Hence we may expect the initialgrowth rate to depend on the radius at which the detonation first forms, and, oncereached, for the saturated nonlinear behaviour to also evolve in time.
5.1. E = 20
For an activation temperature of E =20, the planar wave is highly stable, and thelinear stability analysis in Watt & Sharpe (2003) predicts that the radius of curvaturehas to be sufficiently near the critical quasi-steady radius for the front to be one-dimensionally unstable (the linear analysis predicts the neutrally stable radius to beat rs/j = 104, compared to the critical quasi-steady radius of rs/j = 79.4). Since thequasi-steady solution is predicted to be stable away from the critical radius, this isan instructive case to consider in order to explore the dependence of the radius offormation of the quasi-steady detonation on the source energy, and also for separatingaspects of the initiation process from the stability issue.
One important point to note is that, in planar geometry, Mazaheri (1997) andSharpe & Falle (2000a) have shown that a drawback of the standard one-stepreaction model used here is that it has no definite detonability limit, and hence,unrealistically, a detonation will always be generated after a sufficiently long time, sothat a critical source energy cannot be properly defined. However, for cylindrical orspherical waves it appears that the additional geometric expansion behind the shockis sufficient to produce a definite critical source energy even for the one-step model,or at least a sharp distinction between source energies producing a prompt initiationof the detonation and those for which no detonation is initiated for exponentiallylong times (Eckett et al. 2000). Nevertheless, as pointed out by Ng & Lee (2003), ifone is mainly concerned with the direct initiation problem, a more realistic chemicalmodel with an intrinsic chemically based detonability limit should be employed.
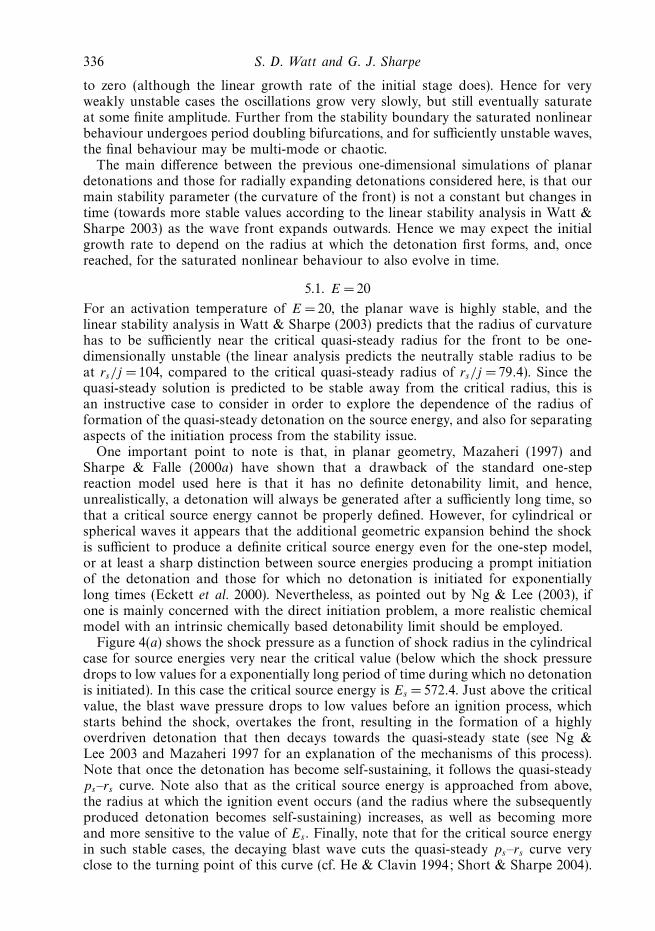
Figure 4(a) shows the shock pressure as a function of shock radius in the cylindricalcase for source energies very near the critical value (below which the shock pressuredrops to low values for a exponentially long period of time during which no detonationis initiated). In this case the critical source energy is Es = 572.4. Just above the criticalvalue, the blast wave pressure drops to low values before an ignition process, whichstarts behind the shock, overtakes the front, resulting in the formation of a highlyoverdriven detonation that then decays towards the quasi-steady state (see Ng &Lee 2003 and Mazaheri 1997 for an explanation of the mechanisms of this process).Note that once the detonation has become self-sustaining, it follows the quasi-steadyps–rs curve. Note also that as the critical source energy is approached from above,the radius at which the ignition event occurs (and the radius where the subsequentlyproduced detonation becomes self-sustaining) increases, as well as becoming moreand more sensitive to the value of Es . Finally, note that for the critical source energyin such stable cases, the decaying blast wave cuts the quasi-steady ps–rs curve veryclose to the turning point of this curve (cf. He & Clavin 1994; Short & Sharpe 2004).
Expanding detonation waves 337
0.4
0.8
1.2
(a)
0.4
0.8
1.2
0 200 400 600 800 1000
ps
ps
rs
(b)
Figure 4. Shock pressure versus shock radius in cylindrical geometry for E = 20 and(a) Es = 572.3 (dotted line), 572.4 (solid line), 573 (long-dashed line), 574 (dot-dashed line)and 580 (double-dot-dashed line), and (b) Es = 600 (solid line), 700 (long-dashed line), 900(dot-dashed line), 1500 (double-dot dashed line) and 3000 (dotted line). The short-dashed curveis the quasi-steady ps–rs relation.
One should be careful in distinguishing the pulse in the pressure history producedby the ignition process from anything to do with the pulsating instability of thedetonation, since a propagating detonation has not formed until after this ignitionprocess has taken place. Indeed, the evolution for sufficiently supercritical sourceenergies shows that the underlying quasi-steady state is stable at the radii where theignition takes place in these near critical cases (see figure 4b), in agreement withthe prediction of the linear stability analysis. Hence for the more unstable casesconsidered below, we will call this first pulse the ‘ignition pulse’ to distinguish itfrom the pulsations due to the instability of the propagating detonation which issubsequently formed. As we will see, it is the radius where the detonation approachesthe quasi-steady state after the ignition pulse which determines the subsequent stabilityof the detonation, rather than the radius where the blast wave pressure first intersectsthe quasi-steady ps–rs curve.
Figure 4(b) shows the shock pressure evolution for increasingly supercritical sourceenergies. As Es continues to increase away from the critical value, the ignitionpulse and subsequent quasi-steady detonation formation occur at smaller radii, andthe amplitude of the ignition pulse decreases. However, for sufficiently supercriticalvalues, the blast wave decays smoothly until it reaches the quasi-steady ps–rs curveand subsequently follows closely the quasi-steady solution. Hence in this final regimethe blast wave pressure never drops below the quasi-steady shock pressure, and asEs is increased further the shock decays towards the quasi-steady state at a largerradius, and thus the detonation forms at larger rs .
In summary, the main result determined from this stable case is that as the sourceenergy increases from its critical value, the radius where the detonation forms initiallydecreases, until a particular value of source energy is reached, E∗
s , say. For Es > E∗s ,
the radius of detonation formation begins to increase. Hence there is a minimum

338 S. D. Watt and G. J. Sharpe
0.5
0.6
0.7
0.8
0.9
0 200 400 600 800 1000
ps
rs
Figure 5. Shock pressure versus shock radius in cylindrical geometry for E = 20 when thesimulations are initialized by the quasi-steady solutions corresponding to rs = 110 (dotted line)and 200 (solid line). The dashed curve is the quasi-steady ps–rs relation.
formation radius corresponding to E∗s . For example, for E =20 figure 4 shows that
E∗s ∼ 1500. Since the linear stability analysis predicts that, for fixed higher activation
temperatures, the detonation will be more unstable at smaller shock radii of curvature,we therefore expect that the most unstable initial behaviour of the detonation (e.g.most rapid growth rate of the pulsations) will be seen for source energies close to E∗
s ,with the detonation becoming initially more stable as Es decreases towards the criticalvalue or increases to more supercritical values. Moreover, the stability analysis alsopredicts that increasing curvature has a rapid destabilizing effect, so we may expectthe behaviour to become rapidly more unstable as E∗
s is approached.Figure 5 shows results for cases where the simulation is initialized by placing
the quasi-steady solution on the grid, corresponding to two different initial valuesof rs (110 and 200). In these cases the initial perturbation caused by the startuperror induces an oscillation of the shock pressure (see Sharpe & Falle 2000a).However, figure 5 shows that the oscillations are very quickly damped out andthe solution rapidly returns to being quasi-steady, showing that the underlying quasi-steady solution is highly stable away from the critical radius for E = 20, in agreementwith the linear stability analysis.
5.2. E = 24
For E = 24 the planar wave is stable, but now the neutrally stable radius of curvaturepredicted by the leading-order linear stability analysis (Watt & Sharpe 2003) isrs/j = 403.
Figure 6(a) shows the shock pressure against shock radius in cylindrical geometryfor Es = 1300, which is near the critical initiation energy for E = 24, so that thereis initially a large-amplitude ignition pulse in this case. By the time the overdriveof the detonation produced by this pulse has decayed back to near the quasi-steadyspeed, the curvature is not far from the neutrally stable value predicted by the linearanalysis. Indeed, figure 6(a) shows that the amplitude of the oscillations is rather smalland subsequently grows only slightly initially, before reaching a maximum and thendecaying. Figures 6(b) and 6(c) show the results for slightly higher source energies(Es = 1400 and 1500, respectively). Es =1500 is close to E∗
s for E = 24 (i.e. that cor-responding to the minimum radius of formation of the detonation). Note that thedistinction between the ignition pulse and the instability becomes much less clear asEs increases. However, ignoring this first pulse, the amplitude of the initial oscillationsis largest for Es = 1500. In both cases, the amplitude subsequently decreases.
Expanding detonation waves 339
0.6
0.8
1.0
1.2
ps
0.6
0.8
1.0
1.2
ps
0.6
0.8
1.0
1.2
ps
(a)
(b)
0 200 400 600 800 1000 1200 1400rs
(c)
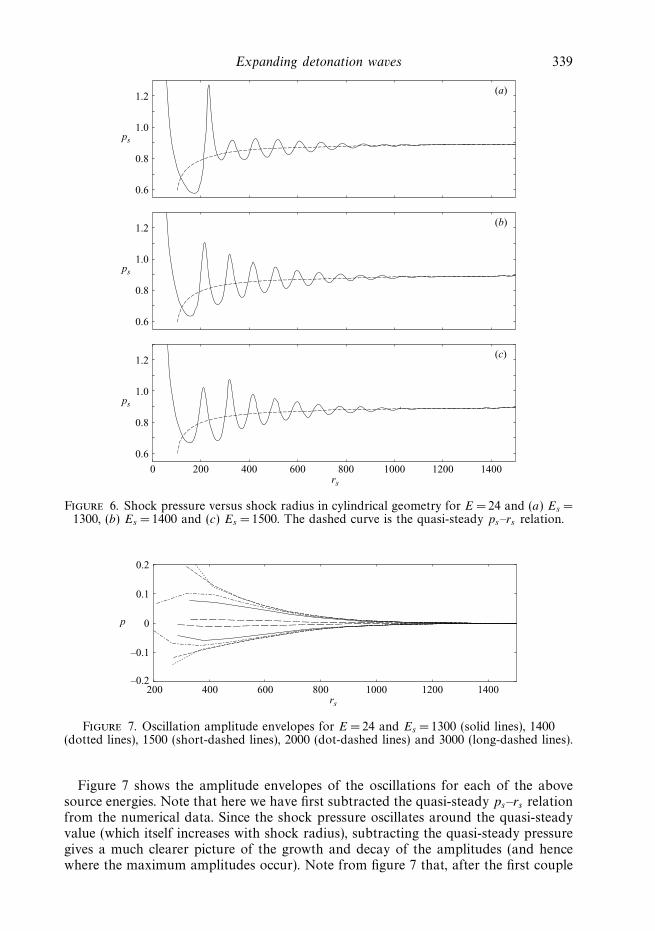
Figure 6. Shock pressure versus shock radius in cylindrical geometry for E = 24 and (a) Es =1300, (b) Es = 1400 and (c) Es =1500. The dashed curve is the quasi-steady ps–rs relation.
–0.2
–0.1
0
0.1
0.2
200 400 600 800 1000 1200 1400
p
rs
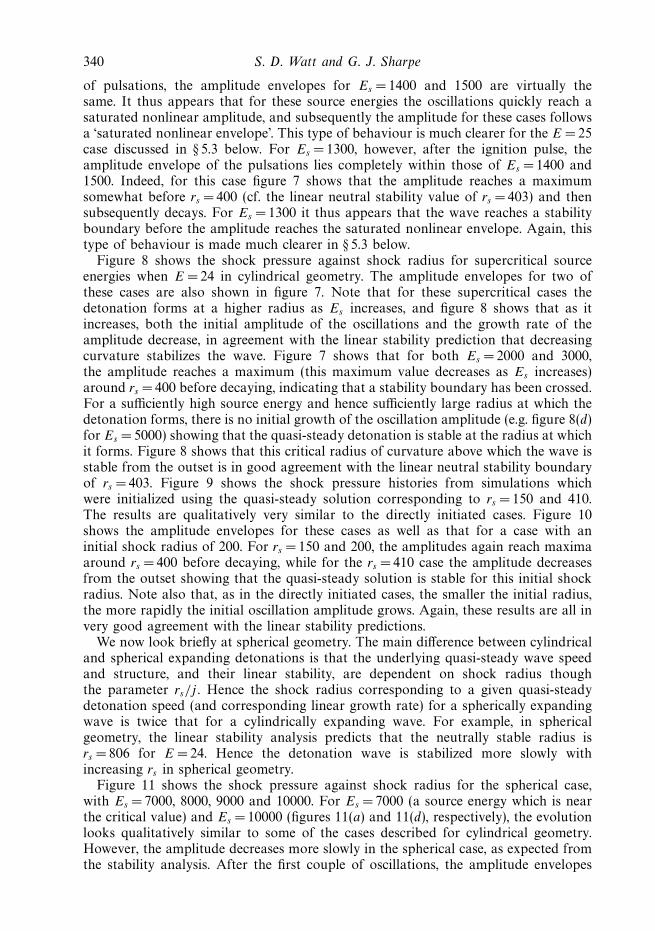
Figure 7. Oscillation amplitude envelopes for E = 24 and Es = 1300 (solid lines), 1400(dotted lines), 1500 (short-dashed lines), 2000 (dot-dashed lines) and 3000 (long-dashed lines).
Figure 7 shows the amplitude envelopes of the oscillations for each of the abovesource energies. Note that here we have first subtracted the quasi-steady ps–rs relationfrom the numerical data. Since the shock pressure oscillates around the quasi-steadyvalue (which itself increases with shock radius), subtracting the quasi-steady pressuregives a much clearer picture of the growth and decay of the amplitudes (and hencewhere the maximum amplitudes occur). Note from figure 7 that, after the first couple
340 S. D. Watt and G. J. Sharpe
of pulsations, the amplitude envelopes for Es = 1400 and 1500 are virtually thesame. It thus appears that for these source energies the oscillations quickly reach asaturated nonlinear amplitude, and subsequently the amplitude for these cases followsa ‘saturated nonlinear envelope’. This type of behaviour is much clearer for the E = 25case discussed in § 5.3 below. For Es = 1300, however, after the ignition pulse, theamplitude envelope of the pulsations lies completely within those of Es = 1400 and1500. Indeed, for this case figure 7 shows that the amplitude reaches a maximumsomewhat before rs = 400 (cf. the linear neutral stability value of rs =403) and thensubsequently decays. For Es =1300 it thus appears that the wave reaches a stabilityboundary before the amplitude reaches the saturated nonlinear envelope. Again, thistype of behaviour is made much clearer in § 5.3 below.
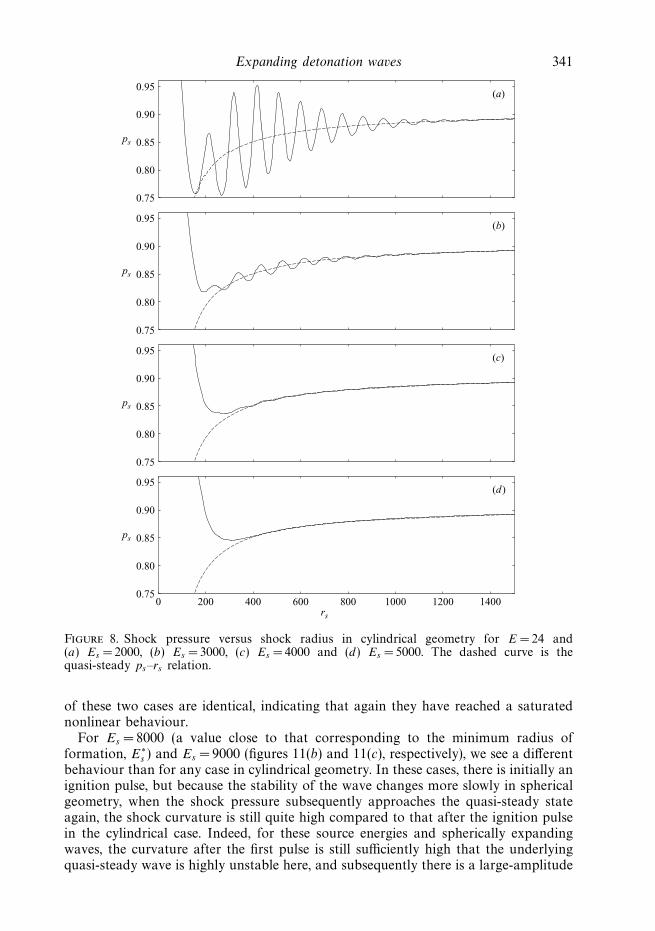
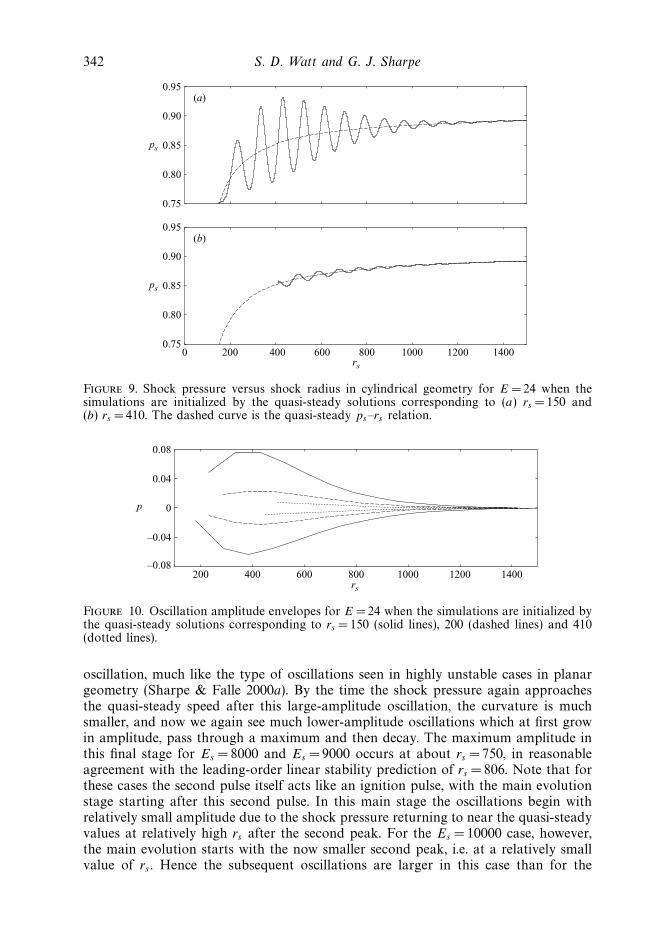
Figure 8 shows the shock pressure against shock radius for supercritical sourceenergies when E =24 in cylindrical geometry. The amplitude envelopes for two ofthese cases are also shown in figure 7. Note that for these supercritical cases thedetonation forms at a higher radius as Es increases, and figure 8 shows that as itincreases, both the initial amplitude of the oscillations and the growth rate of theamplitude decrease, in agreement with the linear stability prediction that decreasingcurvature stabilizes the wave. Figure 7 shows that for both Es = 2000 and 3000,the amplitude reaches a maximum (this maximum value decreases as Es increases)around rs = 400 before decaying, indicating that a stability boundary has been crossed.For a sufficiently high source energy and hence sufficiently large radius at which thedetonation forms, there is no initial growth of the oscillation amplitude (e.g. figure 8(d)for Es = 5000) showing that the quasi-steady detonation is stable at the radius at whichit forms. Figure 8 shows that this critical radius of curvature above which the wave isstable from the outset is in good agreement with the linear neutral stability boundaryof rs = 403. Figure 9 shows the shock pressure histories from simulations whichwere initialized using the quasi-steady solution corresponding to rs =150 and 410.The results are qualitatively very similar to the directly initiated cases. Figure 10shows the amplitude envelopes for these cases as well as that for a case with aninitial shock radius of 200. For rs =150 and 200, the amplitudes again reach maximaaround rs =400 before decaying, while for the rs = 410 case the amplitude decreasesfrom the outset showing that the quasi-steady solution is stable for this initial shockradius. Note also that, as in the directly initiated cases, the smaller the initial radius,the more rapidly the initial oscillation amplitude grows. Again, these results are all invery good agreement with the linear stability predictions.
We now look briefly at spherical geometry. The main difference between cylindricaland spherical expanding detonations is that the underlying quasi-steady wave speedand structure, and their linear stability, are dependent on shock radius thoughthe parameter rs/j . Hence the shock radius corresponding to a given quasi-steadydetonation speed (and corresponding linear growth rate) for a spherically expandingwave is twice that for a cylindrically expanding wave. For example, in sphericalgeometry, the linear stability analysis predicts that the neutrally stable radius isrs =806 for E =24. Hence the detonation wave is stabilized more slowly withincreasing rs in spherical geometry.
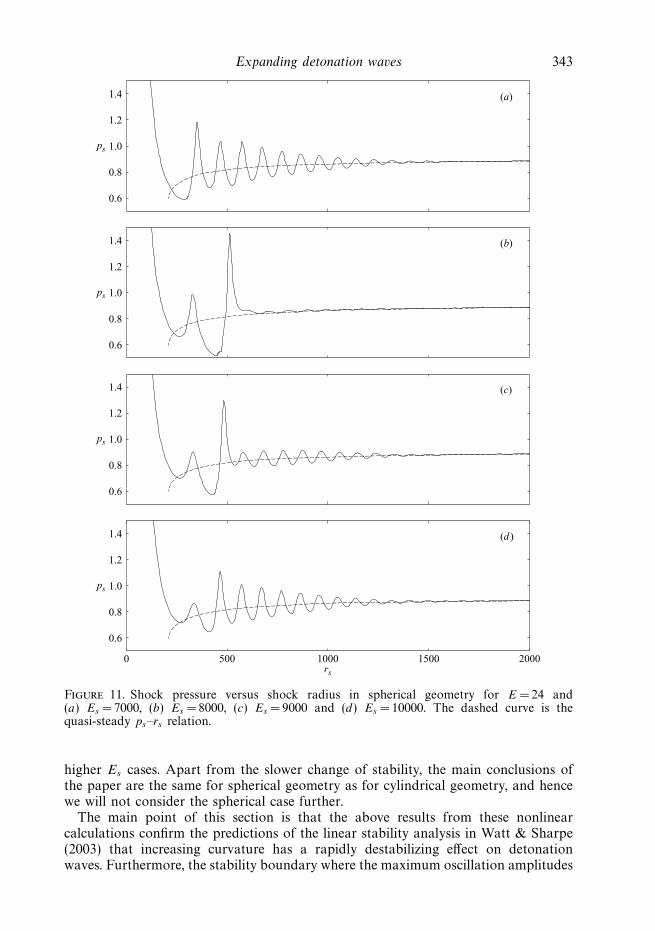
Figure 11 shows the shock pressure against shock radius for the spherical case,with Es = 7000, 8000, 9000 and 10000. For Es = 7000 (a source energy which is nearthe critical value) and Es = 10000 (figures 11(a) and 11(d), respectively), the evolutionlooks qualitatively similar to some of the cases described for cylindrical geometry.However, the amplitude decreases more slowly in the spherical case, as expected fromthe stability analysis. After the first couple of oscillations, the amplitude envelopes
Expanding detonation waves 341
0.75
0.80
0.85
0.90
0.95
ps
ps
ps
ps
(a)
0.75
0.80
0.85
0.90
0.95(b)
0.75
0.80
0.85
0.90
0.95(c)
0.75
0.80
0.85
0.90
0.95
0 200 400 600 800 1000 1200 1400rs
(d)
Figure 8. Shock pressure versus shock radius in cylindrical geometry for E = 24 and(a) Es = 2000, (b) Es = 3000, (c) Es =4000 and (d) Es = 5000. The dashed curve is thequasi-steady ps–rs relation.
of these two cases are identical, indicating that again they have reached a saturatednonlinear behaviour.
For Es = 8000 (a value close to that corresponding to the minimum radius offormation, E∗
s ) and Es = 9000 (figures 11(b) and 11(c), respectively), we see a differentbehaviour than for any case in cylindrical geometry. In these cases, there is initially anignition pulse, but because the stability of the wave changes more slowly in sphericalgeometry, when the shock pressure subsequently approaches the quasi-steady stateagain, the shock curvature is still quite high compared to that after the ignition pulsein the cylindrical case. Indeed, for these source energies and spherically expandingwaves, the curvature after the first pulse is still sufficiently high that the underlyingquasi-steady wave is highly unstable here, and subsequently there is a large-amplitude
342 S. D. Watt and G. J. Sharpe
0.75
0.80
0.85
0.90
0.95
ps
0.75
0.80
0.85
0.90
0.95
ps
(a)
0 200 400 600 800 1000 1200 1400rs
(b)
Figure 9. Shock pressure versus shock radius in cylindrical geometry for E = 24 when thesimulations are initialized by the quasi-steady solutions corresponding to (a) rs = 150 and(b) rs = 410. The dashed curve is the quasi-steady ps–rs relation.
–0.08
–0.04
0
0.04
0.08
200 400 600 800 1000 1200 1400
p
rs
Figure 10. Oscillation amplitude envelopes for E = 24 when the simulations are initialized bythe quasi-steady solutions corresponding to rs = 150 (solid lines), 200 (dashed lines) and 410(dotted lines).
oscillation, much like the type of oscillations seen in highly unstable cases in planargeometry (Sharpe & Falle 2000a). By the time the shock pressure again approachesthe quasi-steady speed after this large-amplitude oscillation, the curvature is muchsmaller, and now we again see much lower-amplitude oscillations which at first growin amplitude, pass through a maximum and then decay. The maximum amplitude inthis final stage for Es =8000 and Es = 9000 occurs at about rs = 750, in reasonableagreement with the leading-order linear stability prediction of rs =806. Note that forthese cases the second pulse itself acts like an ignition pulse, with the main evolutionstage starting after this second pulse. In this main stage the oscillations begin withrelatively small amplitude due to the shock pressure returning to near the quasi-steadyvalues at relatively high rs after the second peak. For the Es =10000 case, however,the main evolution starts with the now smaller second peak, i.e. at a relatively smallvalue of rs . Hence the subsequent oscillations are larger in this case than for the
Expanding detonation waves 343
0.6
0.8
1.0
1.2
1.4
ps
0.6
0.8
1.0
1.2
1.4
ps
0.6
0.8
1.0
1.2
1.4
ps
0.6
0.8
1.0
1.2
1.4
ps
(a)
(b)
(c)
0 500 1000 1500 2000rs
(d )
Figure 11. Shock pressure versus shock radius in spherical geometry for E = 24 and(a) Es = 7000, (b) Es = 8000, (c) Es = 9000 and (d) Es = 10000. The dashed curve is thequasi-steady ps–rs relation.
higher Es cases. Apart from the slower change of stability, the main conclusions ofthe paper are the same for spherical geometry as for cylindrical geometry, and hencewe will not consider the spherical case further.
The main point of this section is that the above results from these nonlinearcalculations confirm the predictions of the linear stability analysis in Watt & Sharpe(2003) that increasing curvature has a rapidly destabilizing effect on detonationwaves. Furthermore, the stability boundary where the maximum oscillation amplitudes
344 S. D. Watt and G. J. Sharpe
0.6
0.8
1.0
1.2
ps
0.6
0.8
1.0
1.2
ps
0.6
0.8
1.0
1.2
ps
(a)
(b)
0 500 1000 1500 2000 2500 3000 3500 4000rs
(c)
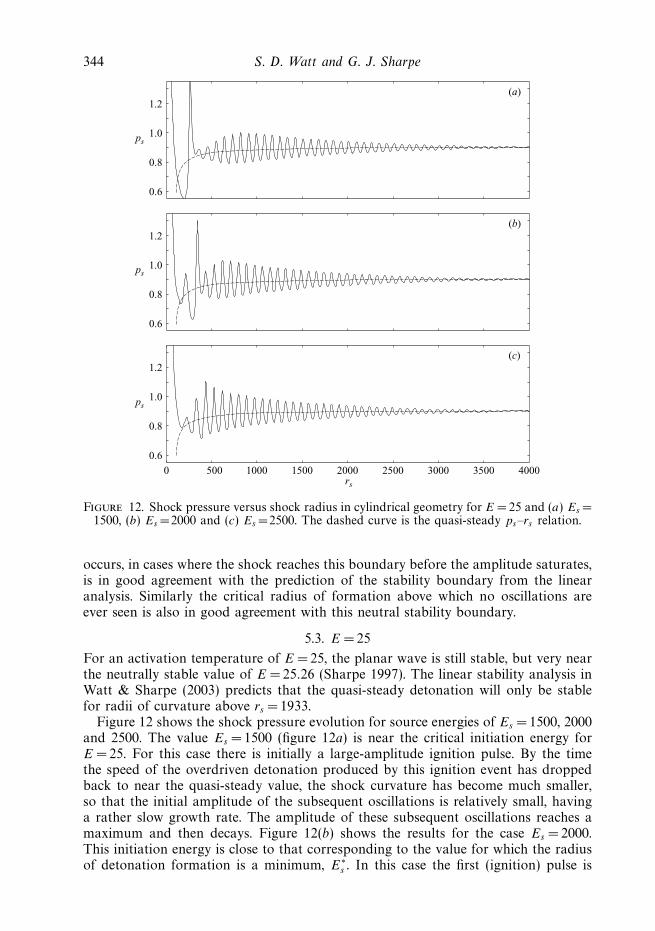
Figure 12. Shock pressure versus shock radius in cylindrical geometry for E = 25 and (a) Es =1500, (b) Es =2000 and (c) Es =2500. The dashed curve is the quasi-steady ps–rs relation.
occurs, in cases where the shock reaches this boundary before the amplitude saturates,is in good agreement with the prediction of the stability boundary from the linearanalysis. Similarly the critical radius of formation above which no oscillations areever seen is also in good agreement with this neutral stability boundary.
5.3. E = 25
For an activation temperature of E =25, the planar wave is still stable, but very nearthe neutrally stable value of E = 25.26 (Sharpe 1997). The linear stability analysis inWatt & Sharpe (2003) predicts that the quasi-steady detonation will only be stablefor radii of curvature above rs =1933.
Figure 12 shows the shock pressure evolution for source energies of Es =1500, 2000and 2500. The value Es = 1500 (figure 12a) is near the critical initiation energy forE = 25. For this case there is initially a large-amplitude ignition pulse. By the timethe speed of the overdriven detonation produced by this ignition event has droppedback to near the quasi-steady value, the shock curvature has become much smaller,so that the initial amplitude of the subsequent oscillations is relatively small, havinga rather slow growth rate. The amplitude of these subsequent oscillations reaches amaximum and then decays. Figure 12(b) shows the results for the case Es = 2000.This initiation energy is close to that corresponding to the value for which the radiusof detonation formation is a minimum, E∗
s . In this case the first (ignition) pulse is
Expanding detonation waves 345
–0.15
–0.05
0.05
0.15
0.25
500 1000 1500 2000 2500 3000 3500 4000
p
rs
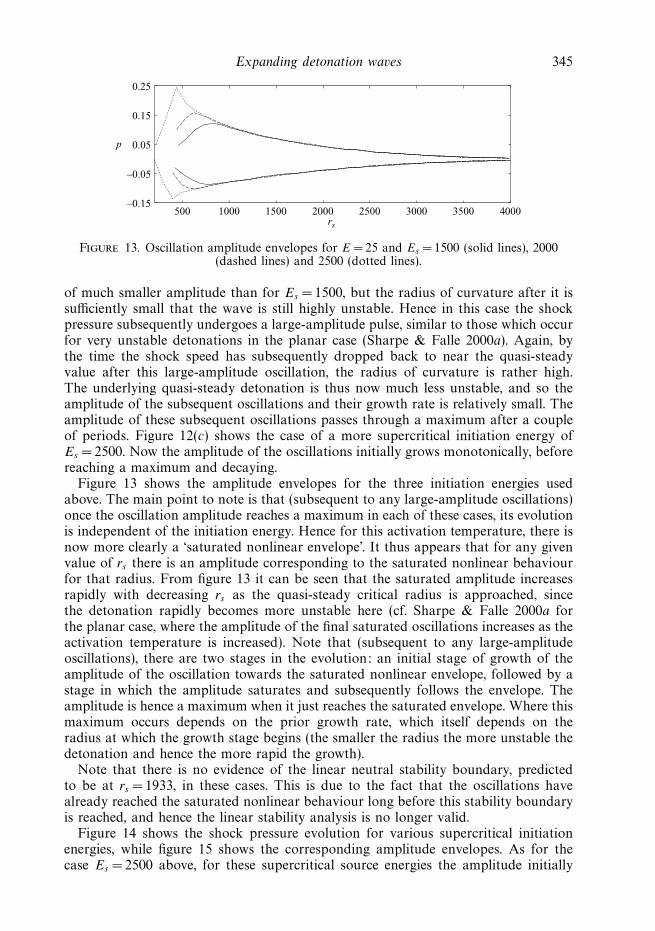
Figure 13. Oscillation amplitude envelopes for E = 25 and Es = 1500 (solid lines), 2000(dashed lines) and 2500 (dotted lines).
of much smaller amplitude than for Es = 1500, but the radius of curvature after it issufficiently small that the wave is still highly unstable. Hence in this case the shockpressure subsequently undergoes a large-amplitude pulse, similar to those which occurfor very unstable detonations in the planar case (Sharpe & Falle 2000a). Again, bythe time the shock speed has subsequently dropped back to near the quasi-steadyvalue after this large-amplitude oscillation, the radius of curvature is rather high.The underlying quasi-steady detonation is thus now much less unstable, and so theamplitude of the subsequent oscillations and their growth rate is relatively small. Theamplitude of these subsequent oscillations passes through a maximum after a coupleof periods. Figure 12(c) shows the case of a more supercritical initiation energy ofEs = 2500. Now the amplitude of the oscillations initially grows monotonically, beforereaching a maximum and decaying.
Figure 13 shows the amplitude envelopes for the three initiation energies usedabove. The main point to note is that (subsequent to any large-amplitude oscillations)once the oscillation amplitude reaches a maximum in each of these cases, its evolutionis independent of the initiation energy. Hence for this activation temperature, there isnow more clearly a ‘saturated nonlinear envelope’. It thus appears that for any givenvalue of rs there is an amplitude corresponding to the saturated nonlinear behaviourfor that radius. From figure 13 it can be seen that the saturated amplitude increasesrapidly with decreasing rs as the quasi-steady critical radius is approached, sincethe detonation rapidly becomes more unstable here (cf. Sharpe & Falle 2000a forthe planar case, where the amplitude of the final saturated oscillations increases as theactivation temperature is increased). Note that (subsequent to any large-amplitudeoscillations), there are two stages in the evolution: an initial stage of growth of theamplitude of the oscillation towards the saturated nonlinear envelope, followed by astage in which the amplitude saturates and subsequently follows the envelope. Theamplitude is hence a maximum when it just reaches the saturated envelope. Where thismaximum occurs depends on the prior growth rate, which itself depends on theradius at which the growth stage begins (the smaller the radius the more unstable thedetonation and hence the more rapid the growth).
Note that there is no evidence of the linear neutral stability boundary, predictedto be at rs = 1933, in these cases. This is due to the fact that the oscillations havealready reached the saturated nonlinear behaviour long before this stability boundaryis reached, and hence the linear stability analysis is no longer valid.
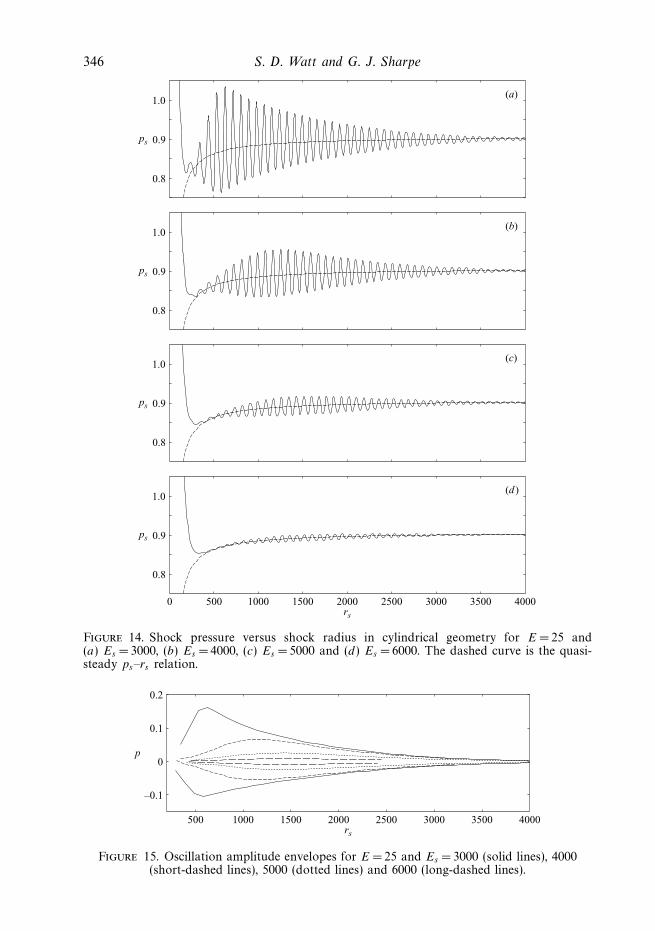
Figure 14 shows the shock pressure evolution for various supercritical initiationenergies, while figure 15 shows the corresponding amplitude envelopes. As for thecase Es =2500 above, for these supercritical source energies the amplitude initially
346 S. D. Watt and G. J. Sharpe
0.8
0.9
1.0(a)
(b)
(c)
(d )
5000 1000 1500 2000 2500 3000 3500 4000rs
ps
0.8
0.9
1.0
ps
0.8
0.9
1.0
ps
0.8
0.9
1.0
ps
Figure 14. Shock pressure versus shock radius in cylindrical geometry for E = 25 and(a) Es = 3000, (b) Es = 4000, (c) Es = 5000 and (d) Es =6000. The dashed curve is the quasi-steady ps–rs relation.
–0.1
0
0.1
0.2
p
500 1000 1500 2000 2500 3000 3500 4000rs
Figure 15. Oscillation amplitude envelopes for E = 25 and Es = 3000 (solid lines), 4000(short-dashed lines), 5000 (dotted lines) and 6000 (long-dashed lines).

Expanding detonation waves 347
0.80
0.85
0.90
0.95
1.00
0 500 1000 1500 2000 2500 3000 3500 4000rs
ps
Figure 16. Shock pressure versus shock radius in cylindrical geometry for E =25 andEs =80000. The dashed curve is the quasi-steady ps–rs relation.
grows monotonically. However, the initial amplitude and subsequent growth rate aresmaller the more supercritical the initiation energy is. This is because the radiuswhere the detonation first forms increases and hence the detonation is more stablefrom the outset. For E =3000 (figure 14a), the amplitude again reaches the saturatednonlinear envelope after a few periods. For the higher values of Es however, figure 15shows that the amplitude of the oscillations passes through a maximum before theyreach the saturated envelope. Hence the amplitude envelopes for the higher Es lieentirely within those for lower initiation energies. For these cases the growth of theoscillations is sufficiently slow that the wave reaches a nonlinear stability boundarybefore the amplitude saturates, and then subsequently decays. Since the growth rateis slower the higher the initiation energy, the amplitude reached before the stabilityboundary decreases. The value of rs where this nonlinear stability boundary occurs(i.e. where the amplitude is a maximum) depends to some extent on the size of theamplitude, but as the amplitude here decreases (and hence the linear approximationbecomes more valid), it tends to about rs = 1500. Similarly, the critical radius offormation above which no oscillations are seen is also about rs = 1500 (see figure 16for Es = 80000).
However, the quasi-steady initialized simulations give much better agreement withthe linear stability boundary prediction of rs = 1933. Figure 17 shows the resultsfor a couple of quasi-steady-solution initialized cases, while figure 18 shows theamplitude envelopes corresponding to several different initial shock radii. For thesecases, figure 18 shows that the position of the maximum amplitude is around 1600for the most unstable cases shown (corresponding to an initial shock radius of 500),but that the position of the maximum amplitude increases with increasing initialshock radius, and tends towards around rs = 1900, in good agreement with the linearprediction. For the case with an initial radius rs = 2000, the amplitude monotonicallydecreases, showing that the quasi-steady solution is stable at this radius.
The reason why the stability boundary of rs ∼ 1500 in the directly initiated casesdoes not agree quantitatively with the linear analysis for this case is explained byfigure 19. For this activation temperature, the stability boundary occurs at quite alarge rs . It can be seen from the shock pressure evolution figures that at such highradii the underlying quasi-steady shock pressure (and speed and structure) is veryslowly varying with rs . For example at rs = 1500, ps = 0.893 for the quasi-steady wave,while the shock pressure is only slightly larger, ps =0.896, at rs = 1933. Similarly,the linear stability response of the quasi-steady wave will also be insensitive tors at these larger radii. Indeed, figure 19 shows the leading-order linear growth rate for

348 S. D. Watt and G. J. Sharpe
0.8
0.9
1.0
ps
ps
(a)
0.8
0.9
1.0
0
(b)
500 1000 1500 2000 2500 3000 3500 4000rs
Figure 17. Shock pressure versus shock radius in cylindrical geometry when the simulationsare initiated by the quasi-steady solutions corresponding to (a) rs = 500 and (b) rs =1500. Thedashed curve is the quasi-steady ps–rs relation.
–0.05
–0.03
–0.01
0.01
0.03
0.05
p
500 1000 1500 2000 2500 3000 3500 4000rs
Figure 18. Oscillation amplitude envelopes when the simulations are initialized by thequasi-steady solutions corresponding to rs = 500 (solid lines), 750 (short-dashed lines), 1000(dotted lines), 1500 (dot-dashed lines) and 2000 (long-dashed lines).
0
0.01
0.02
0.03
0 500 1000 1500 2000 2500
Lin
ear
gro
wth
rat
e
rs/j
Figure 19. Leading order linear growth rate versus rs/j for E = 25.

Expanding detonation waves 349
80
90
100
110
120
0 500 1000 1500 2000 2500
Per
iod
rs
Figure 20. Periods of oscillation versus rs for E = 25 in cylindrical geometry. Leading-orderlinear period (solid line) and periods from directly initiated simulation with Es = 3000 (dashedline) and from quasi-steady solution initialized simulation with initial rs =500 (dotted line).
E = 25 against rs , from which it can be seen that the growth rate varies only weaklywith rs for shock radii greater than about 1000 (as rs decreases and the curvature ofthe front begins to increase rapidly, the growth rate begins to accelerate, and thensplits into two real eigenvalues as the critical quasi-steady curvature is approached).Since the magnitude of the growth rate remains very small at these high radii, anysmall residual time-dependence in the underlying wave in the directly initiated casesor any weak nonlinearity in the oscillations may shift the actual stability boundaryby a relatively large value of rs from the leading-order quasi-steady prediction.Nevertheless, the leading-order analysis still provides a qualitatively good predictionof the boundary even for the directly initiated case, and more importantly providesthe correct parametric dependency of its location. Furthermore, the analysis doesprovide a quantitatively good prediction of the neutrally stable quasi-steady shockpressure (or speed).
For the planar case, near the stability boundary the linear period of oscillationpredicts well the period of the oscillations, even when they have reached the saturatednonlinear (limit cycle) amplitude (Sharpe & Falle 2000a; Short & Quirk 1997). Henceone may expect that for the expanding detonation case, the linear dependence of theperiod on rs may predict well the change in the period of the oscillations as the frontexpands outwards. Figure 20 shows the linear dependence of the period on rs and alsothe periods from the numerical simulations (defined as the distance between adjacentcrests in the oscillation amplitude) for both a directly initiated case and a quasi-steady-solution initialized case. Importantly, note that for the directly initiated case(corresponding to Es =3000), the oscillations quickly reach the saturated nonlinearenvelope. It can be seen that the linear stability analysis predicts extremely well theperiods in the simulations, even in the saturated nonlinear regime. Note that theperiod is long compared to the particle transit time through the quasi-steady wave,but short on the slow evolution timescale of the quasi-steady solution.
5.4. E = 27
For E = 27, the planar wave is unstable, and hence in this case the oscillations willalways eventually reach a saturated behaviour, regardless of Es , as there is no stabilityboundary. In the planar case, this activation temperature is just below a period-doubling bifurcation boundary (at E =27.2) (Sharpe & Falle 2000a). We may thusexpect that even at quite large radii of curvatures for E = 27, the increase in instabilitywill cause the saturated nonlinear behaviour to period double, with the behaviour
350 S. D. Watt and G. J. Sharpe
0.6
0.8
1.0
1.2
1.4
1.6
ps
ps
0.6
0.8
1.0
1.2
1.4
1.6
rs
(a)
0 500 1000 1500 2000 2500 3000 3500 4000
(b)
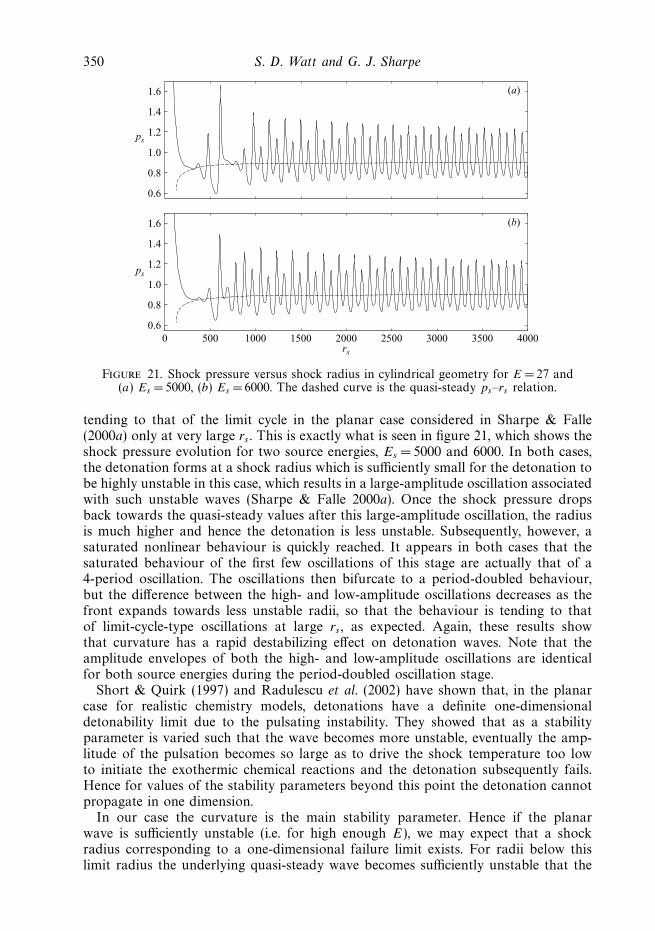
Figure 21. Shock pressure versus shock radius in cylindrical geometry for E = 27 and(a) Es = 5000, (b) Es = 6000. The dashed curve is the quasi-steady ps–rs relation.
tending to that of the limit cycle in the planar case considered in Sharpe & Falle(2000a) only at very large rs . This is exactly what is seen in figure 21, which shows theshock pressure evolution for two source energies, Es =5000 and 6000. In both cases,the detonation forms at a shock radius which is sufficiently small for the detonation tobe highly unstable in this case, which results in a large-amplitude oscillation associatedwith such unstable waves (Sharpe & Falle 2000a). Once the shock pressure dropsback towards the quasi-steady values after this large-amplitude oscillation, the radiusis much higher and hence the detonation is less unstable. Subsequently, however, asaturated nonlinear behaviour is quickly reached. It appears in both cases that thesaturated behaviour of the first few oscillations of this stage are actually that of a4-period oscillation. The oscillations then bifurcate to a period-doubled behaviour,but the difference between the high- and low-amplitude oscillations decreases as thefront expands towards less unstable radii, so that the behaviour is tending to thatof limit-cycle-type oscillations at large rs , as expected. Again, these results showthat curvature has a rapid destabilizing effect on detonation waves. Note that theamplitude envelopes of both the high- and low-amplitude oscillations are identicalfor both source energies during the period-doubled oscillation stage.
Short & Quirk (1997) and Radulescu et al. (2002) have shown that, in the planarcase for realistic chemistry models, detonations have a definite one-dimensionaldetonability limit due to the pulsating instability. They showed that as a stabilityparameter is varied such that the wave becomes more unstable, eventually the amp-litude of the pulsation becomes so large as to drive the shock temperature too lowto initiate the exothermic chemical reactions and the detonation subsequently fails.Hence for values of the stability parameters beyond this point the detonation cannotpropagate in one dimension.
In our case the curvature is the main stability parameter. Hence if the planarwave is sufficiently unstable (i.e. for high enough E), we may expect that a shockradius corresponding to a one-dimensional failure limit exists. For radii below thislimit radius the underlying quasi-steady wave becomes sufficiently unstable that the

Expanding detonation waves 351
0.2
0.4
0.6
0.8
1.0
1.2
1.4
1.6
0 200 400 600 800 1000
ps
rs
Figure 22. Shock pressure versus shock radius in cylindrical geometry for E = 27 when thesimulations are initialized with the quasi-steady solution corresponding to rs = 200 (dot-dashedline), 206 (dotted line) and 207 (long-dashed line). Also shown is the directly initiated solutionfor Es = 4000 (solid line). The short-dashed curve is the quasi-steady ps–rs relation.
pulsations drive the shock temperature too low for continued propagation of the front.This is confirmed by figure 22 in which the results for cases where the simulationswere initialized by the quasi-steady solutions for various initial values of rs areshown. Figure 22 reveals that in this case the limit value of rs is 206, below which thedetonation quickly fails, and above which the detonation manages to keep propagating(note the failure limit would be more sharply defined for realistic chemistry models).Note that as E increases and the planar wave becomes more unstable, a smallerincrease in curvature will be required for the wave to become unstable enough to fail,and hence the limit radius will move towards higher rs .
The presence of this failure-limit radius suggests that even for ‘supercritical’ sourceenergies where the blast wave approaches the quasi-steady curve above the criticalquasi-steady radius but below the limit radius, the detonation will fail to be initiatedin one dimension since even if it initially forms from the decaying blast wave, it willsubsequently fail again due to the instability. Again, this is confirmed in figure 22which also shows the result for a directly initiated case with Es = 4000.
Indeed, Eckett et al. (2000) found that for a case they considered, successfuldetonation initiation did not depend monotonically on Es . They showed that initiallyas the source energy was increased above the minimum critical source energy, adetonation was successfully initiated, but then for a range of higher values of Es , thedetonation failed subsequently to initiation. For all source energies above this range ofEs , a detonation was again successfully initiated. This behaviour in Eckett et al. (2000)is hence explained by the results of this section: for the case they considered thereclearly exists a failure-limit shock radius associated with the instability. For sufficientlynear critical or sufficiently supercritical source energy, the detonation forms abovethis failure-limit radius, and hence continues to propagate after formation. Howeverfor a range of source energies close to E∗
s (the source energy corresponding to theminimum radius of detonation formation), the detonation forms below the failureradius and hence the instability quickly kills the wave after it has formed, leading tofailure not only below the critical source energy but also for a range of Es near E∗
s .However, it is important to note that while the detonation fails in one dimension
in these cases, it does not mean that in reality it will fail, but that multi-dimensionaleffects such as the cellular instability will play the crucial role in determining whetherthe wave can propagate or whether a detonation will be successfully initiated forsource energies close to E∗
s .
352 S. D. Watt and G. J. Sharpe
200
100
200
100
y
x x
x
0 100 200
200
100
y
0 100 200
0 100 200
(a) (b)
(c)
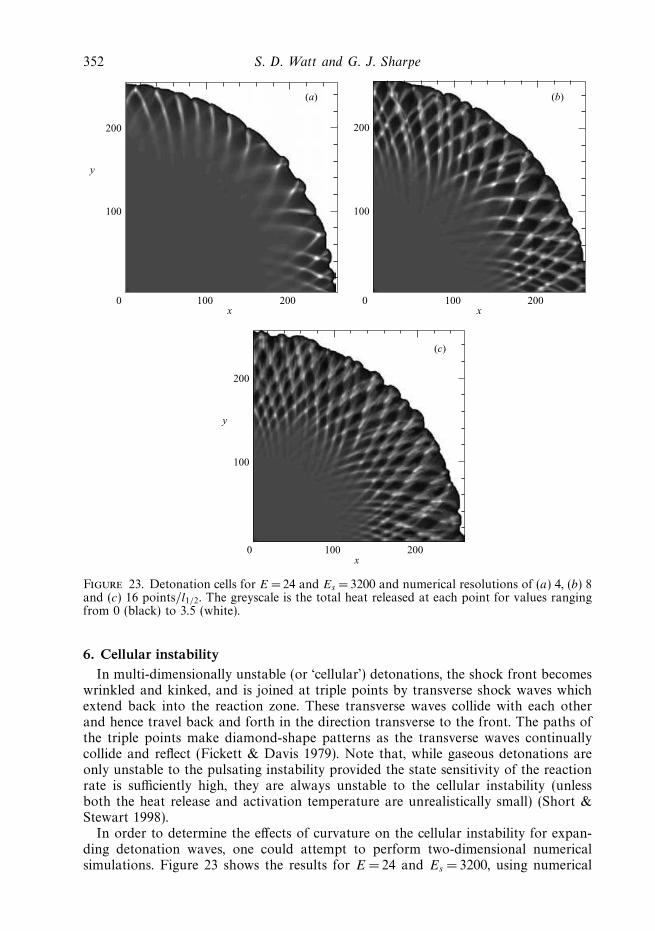
Figure 23. Detonation cells for E =24 and Es = 3200 and numerical resolutions of (a) 4, (b) 8and (c) 16 points/l1/2. The greyscale is the total heat released at each point for values rangingfrom 0 (black) to 3.5 (white).
6. Cellular instability
In multi-dimensionally unstable (or ‘cellular’) detonations, the shock front becomeswrinkled and kinked, and is joined at triple points by transverse shock waves whichextend back into the reaction zone. These transverse waves collide with each otherand hence travel back and forth in the direction transverse to the front. The paths ofthe triple points make diamond-shape patterns as the transverse waves continuallycollide and reflect (Fickett & Davis 1979). Note that, while gaseous detonations areonly unstable to the pulsating instability provided the state sensitivity of the reactionrate is sufficiently high, they are always unstable to the cellular instability (unlessboth the heat release and activation temperature are unrealistically small) (Short &Stewart 1998).
In order to determine the effects of curvature on the cellular instability for expan-ding detonation waves, one could attempt to perform two-dimensional numericalsimulations. Figure 23 shows the results for E =24 and Es =3200, using numerical

Expanding detonation waves 353
500
400
300
200
100
0 100 200 300 400 500
500
400
(a) (b)
300
200
100
0 100 200 300 400 500
y
x x
Figure 24. As figure 23 (a, b) but showing the cellular evolutions after a longer time.
resolutions of 4, 8 and 16 points/l1/2. The figure shows greyscale plots of the totalheat released at each point in the numerical domain (see Sharpe & Falle 2000c).The main point to note is that at these resolutions, the cell sizes and evolutionare completely grid-dependent. The cells appear only once the decaying blast wavehas approached the quasi-steady detonation speed, i.e. when the reactions becomeimportant to sustaining the shock, as expected. However, the cells appear earlier with asmaller size as the resolution increases (presumably tending to the size correspondingto the wavelength with the maximum linear growth rate at the shock radius wherethey form, as in Sharpe & Falle 2000c for the planar case). The size of the cells alsoappears to grow more slowly as the resolution increases. Figure 24 shows the cellularevolutions after a longer time for the 4 and 8 points/l1/2 resolution cases. At thelower resolution, the cells grow but remain quite regular, while for the 8 points/l1/2case, the cells are much more irregular and one can see weak tracks appearing as newtriple points are generated as the front expands.
Hence, in order to obtain correct, grid-independent results from such simulations,much higher resolutions than those used in figures 23 and 24 are required. Simulationsof cellular detonations in tubes show that at least about 50 points/l1/2 are requiredto ensure that all the lengthscales involved in the instability are resolved (Sharpe &Falle 2000c; Sharpe 2001). However, for the cylindrically expanding case in twodimensions, such requisite high resolutions are computationally prohibitive. This isdue to the fact that while large numbers of points in the reaction zone are required,the shock front circumference is large on the reaction-zone scale, even when thedetonation (and the cells) first form and even for the quarter-plane as consideredhere. This results in a very high number of grid points over the entire detonationfront. As the wave front expands outwards, the length of the front increases, andhence so does the computational cost. Note that halving the grid size (i.e. doublingthe number of points/l1/2) increases the computational time by a factor of 8 (doublethe number of grid points in each direction, and double the number of timesteps for afixed Courant number). Note also that a uniform grid calculation with an equivalentresolution to that in our dynamically adaptive grid calculations would take more thanan order of magnitude longer time, with this disparity increasing with the resolution.

354 S. D. Watt and G. J. Sharpe
To give an idea of the computational cost, even with an adaptive grid scheme, thecalculation with 8 points/l1/2 in figure 24(b) (up to the point where rs ≈ 500) tookover 2 weeks of continuous run time on a dedicated 1.9 GHz processor, while the 16points/l1/2 case, which ran up to the point where rs ≈ 260 (figure 23c) took about3 weeks on a similar dedicated processor. An equivalent run with a resolution of64 points/l1/2, or two additional refinement levels, would thus take about 3.7 years.Hence, to perform parametric studies (on E and Es for example, as in § 5) with asufficiently high resolution to obtain reliable results (>50 points/l1/2) would be almostimpossible, even with an adaptive code and even on a parallel machine.
Nevertheless, the cellular instability will be crucial for determining whether the frontcan propagate in some cases, e.g. when the wave would fail in one dimension. Indeed,recent experiments in porous-walled tubes by Radulescu & Lee (2002) and Radulescu(2003) clearly show that for detonations with very regular cells, the cellular instabilityplays no crucial role in the propagation of the front. However, for highly unstabledetonations with very irregular cells, they showed the presence of the transverse wavesis in fact crucial for the wave to continue to propagate. Moreover, direct initiationexperiments show that in some mixtures the wave fails if new transverse waves arenot generated sufficiently rapidly to maintain a roughly constant spacing as the waveexpands outwards (Lee 1977), and hence in these cases the cellular instability is thecrucial factor for determining the successful initiation.
7. Conclusion
In this paper we have performed numerical simulations of cylindrically andspherically expanding detonations as a first step towards understanding the effectof curvature on the stability and propagation of detonations, and compared thenonlinear results with the recent linear stability analysis in Watt & Sharpe (2003).
First, one-dimensional numerical simulations of the pulsating detonation instabilitywere performed. The main conclusion is that, in agreement with the linear analysis,increasing curvature of the front has a rapid destabilizing effect on detonation waves.The initial behaviour (e.g. amplitude and growth rate of pulsations) depends sensitivelyon the radius where the detonation first forms (i.e. on the source energy Es for thedirectly initiated expanding waves). The closer the radius of formation is to theturning point of the quasi-steady ps–rs curve, the more unstable this behaviour. Theradius is a minimum (and hence the detonation is initially most unstable) for a valueof the source energy, E∗
s , which is above the critical source energy for successfulinitiation.
For cases where the planar wave (corresponding to infinite shock radius) is unstable,if the detonation is successfully initiated then the pulsations quickly reach a saturatednonlinear behaviour which is independent of the initial conditions. These saturatednonlinear oscillations tend to more stable behaviour as the front expands (e.g. itmay pass backward through period-doubling bifurcations). However, for cases wherethe planar wave is one-dimensionally stable, there exists a neutrally stable shockradius above which the wave becomes stable. If the oscillations reach this boundarybefore they reach the saturated nonlinear state, then the amplitude subsequentlydecays. Alternatively, if the detonation initially forms above this radius, then nooscillations are seen and the wave propagates in a quasi-steady manner from theoutset. The leading-order linear stability analysis in Watt & Sharpe (2003) provides aqualitatively good prediction of this neutrally stable shock radius, and a quantitativelygood prediction of the neutrally stable quasi-steady detonation speed.
Expanding detonation waves 355
In future studies we intend to perform further analyses and simulations in order toget a better understanding of the effects of curvature on the detonation instabilities,and of the role of these instabilities in the propagation of curved fronts. First, sincewe have shown that the one-dimensional linear analysis correctly predicts the effectof curvature on detonations, we intend to perform a multi-dimensional analysis ofcylindrically expanding fronts. Secondly, we intend to perform multi-dimensionalnumerical simulations of detonations where the front is curved but not expanding, sothat the front is not too long compared to the reaction-zone length and hence sufficientresolution can be achieved. Such situations arise, for example, in weakly confineddetonations, such as in condensed-phase explosives, and also gaseous detonations inporous-walled tubes.
This work was funded by EPSRC and DSTL under the Joint Grant Scheme. Cobrawas supplied by Mantis Numerics Ltd.
REFERENCES
Bourlioux, A. & Majda, M. J. 1992 Theoretical and numerical structure for unstable two-dimensional detonations Combust. Flame 90, 211–229.
Eckett, C. A., Quirk, J. J. & Shepherd, J. E. 2000 The role of unsteadiness in direct initiation ofgaseous detonations J. Fluid Mech. 421, 147–183.
Erpenbeck, J. J. 1964 Stability of idealized one-reaction detonations Phys. Fluids 7, 684–696.
Fickett, W. & Davis, W. C. 1979 Detonation. University of California Press.
He, L. & Clavin, P. 1994 On the direct initiation of gaseous detonations by an energy sourceJ. Fluid Mech. 277, 227–248.
Lee, J. H. S. 1977 Initiation of gaseous detonations Annu. Rev. Phys. Chem. 28, 75–104.
Mazaheri, K. 1997 Mechanism of onset of detonation in blast initiation PhD Thesis, McGillUniversity.
Ng, H. D. & Lee, J. H. S. 2003 Direct initiation of detonation with a multi-step reaction schemeJ. Fluid Mech. 476, 179–211.
Radulescu, M. I. 2003 The propagation and failure mechanism of gaseous detonations: experimentsin porous-walled tubes PhD Thesis, McGill University.
Radulescu, M. I., Higgins, A. J., Lee, J. H. S. & Murray, S. B. 2000 On the explosion lengthinvariance in direct initiation of detonation Proc. Combust. Inst. 28, 637–644.
Radulescu, M. I., Higgins, A. J., Murray, S. B. & Lee, J. H. S. 2003 An experimental investigationof the direct initiation of cylindrical detonations J. Fluid. Mech. 480, 1–24.
Radulescu, M. I. & Lee, J. H. S. 2002 The failure mechanism of gaseous detonations: experimentsin porous-walled tubes Combust. Flame 131, 29–46.
Radulescu, M. I., Ng, H. D., Lee, J. H. S. & Varatharajan, B. 2002 The effect of argon dilutionon the stability of acetylene-oxygen detonations Proc. Combust. Inst. 29, 2825–2831.
Sharpe, G. J. 1997 Linear stability of idealized detonations Proc. R. Soc. Lond. A 453, 2603–2625.
Sharpe, G. J. 2000 The structure of planar and curved detonation waves with reversible reactionsPhys. Fluids 12, 3007–3020.
Sharpe, G. J. 2001 Transverse waves in numerical simulations of cellular detonations J. Fluid Mech.447, 31–51.
Sharpe, G. J. & Falle, S. A. E. G. 2000a Numerical simulations of pulsating detonations: I.Nonlinear stability of steady detonations Combust. Theory Model. 4, 557–574.
Sharpe, G. J. & Falle, S. A. E. G. 2000b One-dimensional nonlinear stability of pathologicaldetonations J. Fluid Mech. 414, 339–366.
Sharpe, G. J. & Falle, S. A. E. G. 2000c Two-dimensional numerical simulations of idealizeddetonations Proc. R. Soc. Lond. A 456, 2081–2100.
Short, M. 2001 A nonlinear evolution equation for pulsating Chapman–Jouguet detonations withchain-branching kinetics J. Fluid Mech. 430, 381–400.

356 S. D. Watt and G. J. Sharpe
Short, M. & Quirk, J. J. 1997 On the nonlinear stability and detonability limit of a detonationwave for a model three-step chain-branching reaction J. Fluid Mech. 339, 89–119.
Short, M. & Sharpe, G. J. 2003 Curved detonations for a two-step reaction. Combust. Flame,submitted.
Short, M. & Sharpe, G. J. 2004 Failure and ignition limits of curved three-step chain-branchingdetonations Combust. Theory Model., submitted.
Short, M. & Stewart, D. S. 1998 Cellular detonation stability. Part 1. A normal-mode linearanalysis J. Fluid Mech. 368, 229–262.
Watt, S. D. & Sharpe, G. J. 2003 One-dimensional linear stability of curved detonations Proc. R.Soc. Lond. A 460, 2551–2568.
Yao, J. & Stewart, D. S. 1996 On the dynamics of multi-dimensional detonation J. Fluid Mech.309, 225–275.