Linda Spencer - Home Page | California State Water ... · Web viewThe watershed-based framework...
257
SAN FRANCISCO BAY REGIONAL WATER QUALITY CONTROL BOARD WATERSHED MANAGEMENT INITIATIVE INTEGRATED PLAN CHAPTER
Transcript of Linda Spencer - Home Page | California State Water ... · Web viewThe watershed-based framework...

SAN FRANCISCO BAY REGIONAL WATER QUALITY CONTROL BOARD
WATERSHED MANAGEMENT INITIATIVEINTEGRATED PLAN CHAPTER
January 2002

Table of ContentsEXECUTIVE SUMMARY..................................................................................................................................... i
Overview........................................................................................................................................................... iWatersheds in the San Francisco Bay Region.................................................................................................... iiImplementation of the Watershed Management Initiative................................................................................. iiiWatershed Management Activities.................................................................................................................... v
I. INTRODUCTION........................................................................................................................................... 1
A. Background................................................................................................................................................. 1B. Definition of Watershed Management.......................................................................................................... 2C. Description of Region and Watershed Management Areas...........................................................................2D. Watershed-Based Organizational Structure and Management......................................................................5
II. REGIONWIDE ACTIVITIES....................................................................................................................... 9
A. High-Priority Issues...................................................................................................................................... 9B. Planning and Policy Development............................................................................................................... 16C. Monitoring and Assessment........................................................................................................................ 21D. Nonpoint Source Program........................................................................................................................... 25E. Wetlands and Stream Protection.................................................................................................................. 42F. Field Team/Environmental Compliance......................................................................................................49G. Core Regulatory Programs (NPDES Wastewater, Municipal and Industrial Storm Water, Non-Chapter 15 WDRs)............................................................................................................................................................ 50H. Groundwater Resource Management...........................................................................................................56I. Geographic Information System.................................................................................................................. 71
III. WATERSHED BASED ACTIVITIES........................................................................................................ 73
A. County Watershed Management Area Activities.........................................................................................73B. Alameda Watershed Management Area......................................................................................................76C. Contra Costa Watershed Management Area................................................................................................81D. Marin Watershed Management Area........................................................................................................... 85E. Napa Watershed Management Area............................................................................................................93F. San Francisco Watershed Management Area...............................................................................................98G. San Mateo Watershed Management Area..................................................................................................102H. Santa Clara Watershed Management Area (Santa Clara Basin).................................................................107I. Solano Watershed Management Area......................................................................................................... 116J. Sonoma Watershed Management Area.......................................................................................................118K. Total Maximum Daily Load (TMDL).......................................................................................................122
San Francisco Bay Region January 2002

Figures
Figure I.1 San Francisco Bay Region........................................................................................................... 3Figure II–1. SWAMP Pilot Watersheds.........................................................................................................20Figure II-2. Significant Groundwater Basins................................................................................................57Figure III-1. Alameda County Significant Watersheds..................................................................................75Figure III-2. Contra Costa County Significant Watersheds............................................................................80Figure III-3. Marin County Significant Watersheds.......................................................................................84Figure III-4. Significant Watersheds in Napa, Sonoma, and Solano Counties................................................92Figure III-5. San Francisco and San Mateo Significant Watersheds...............................................................96Figure III-6. San Francisco Groundwater Basins...........................................................................................97Figure III-7. Santa Clara County Significant Watersheds............................................................................106
Tables
Table II.D.1. Regional Nonpoint Source Problems by Management Measure Category...................................31Table II.D.2 Nonpoint Source Program Short Term Objectives.......................................................................33Table II.D.3. Education, Outreach, and Technical Assistance...........................................................................35Table II.D.4. Targeted Projects for Potential Funding.......................................................................................36Table II.D.5 Proposed FY 2001/02 Resource Allocation..................................................................................40Table II.D.6 NPS Resource Needs 2001/02 Through 2003/04..........................................................................41Table II.H.1. Groundwater Basins in the San Francisco Bay Region...................................................................58Table II.H.2. Existing and Potential Beneficial Uses of Groundwater................................................................61Table III.K.1 TMDL PROJECTS and SCHEDULE..........................................................................................126
Appendix A
Section 1 – NPDES Major Wastewater Permit Reissuance Schedule.……………………………………………A-1Section 2 – NPDES Minor Wastewater Permit Reissuance Schedule…………………………………………….A-3Section 3 – NPDES Stormwater Permit Reissuance Schedule..…………………………………………………..A-5Section 4 – NPDES Pretreatment PCIs/Audits Schedule...……………………………………………………….A-6Section 5 – NPDES Compliance Inspections Schedule……………….…………………………………………..A-7Section 6 – Chapter 15 WDR Reissuance Schedule………………………………………………………………A-8Section 7 – Non-Chapter 15 WDR Reissuance Schedule…………………………………………………………A-9Section 8 – 303(d) Listing / TMDLs Schedule for Development………………………………………………..A-11Section 9 – Basin Plan Updates Schedule………………………………………………………………………..A-18
Appendix B
Section 1 - Santa Clara Basin Watershed Management Initiative Evaluation of the Regional Board Top 10 B-1Section 2 - Watershed Management Initiative: Goals & Planning Objectives, April 1999 Status Review, June 2001……..……………………………………………………………………………………………………B-5Section 3 - 2000-2001 Successes and Accomplishments of the SCBWMI by Core Group, August 2, 2001 B-11
San Francisco Bay Region January 2002

SAN FRANCISCO BAY REGIONAL WATER QUALITY CONTROL BOARDWATERSHED MANAGEMENT INITIATIVE
INTEGRATED PLAN CHAPTER
EXECUTIVE SUMMARY1
Overview The water resource protection and restoration efforts of the State Water Resources Control Board and the nine Regional Water Quality Control Boards are guided by a five-year Strategic Plan (updated in November 2001). A key component of the Strategic Plan is a watershed management approach for water resources protection and restoration. This update of the Integrated Plan Chapter contains activities the San Francisco Bay Region has planned over the next one to two years in support of a watershed management approach.
To protect water resources within a watershed management approach, all point and nonpoint source discharges, ground and surface water interactions, and water quality/water quantity relationships within each watershed must be considered. These complex relationships present considerable challenges to water resource protection programs. The State and Regional Boards are responding to these challenges with the Watershed Management Initiative (WMI). The WMI is designed to integrate various surface and ground water regulatory programs while promoting cooperative, collaborative efforts within a watershed. It is also designed to focus limited resources on key issues.
Past State and Regional Board programs tended to be directed at site-specific problems. This approach was reasonably effective for controlling water pollution from point sources. However, with diffuse nonpoint sources of pollutants now representing the majority of uncontrolled pollution, a new regulatory strategy was needed. The WMI uses a strategy to draw solutions from all interested parties or stakeholders within a watershed, and to more effectively coordinate and implement measures to control both point and nonpoint pollution sources.
During initial implementation of the WMI, each Regional Board identified the watersheds in its Region, prioritized water quality issues within each watershed, and developed watershed management strategies. These strategies and the State Board’s overall coordinating approach to the WMI are contained in each Board’s Chapter of the Integrated Plan for Implementation of the WMI. The San Francisco Bay Region’s WMI Chapter is a regularly updated planning tool for identifying priorities to be funded by existing resources, as well as priority tasks that are currently unfunded. This January 2002 Chapter contains activities planned over the next one to two years, and in some cases, over the next five years. It also contains descriptions of regional and watershed strategies, discusses how we are structured to implement the WMI, and how we implement a priority setting process. It builds upon the progress made to date by our efforts, combined with local watershed efforts led by others. It also reflects how much more work we have to accomplish to fully implement the WMI.
1 For more information or copies of the Watershed Management Initiative Chapter, visit the San Francisco Bay Region’s website at http://www.swrcb.ca.gov/~rwqcb2.
San Francisco Bay Region i January 2002

Watersheds in the San Francisco Bay Region
The San Francisco Bay Region, which covers a basin of approximately 4,550 square miles, is located on the central coast of California (Figure I-1). The San Francisco Bay and Delta form the largest estuary on the West Coast and function as the only drainage outlet for waters of the Central Valley. The basin also marks a natural topographic separation between the northern and southern coastal mountain ranges. The Region’s waterways, wetlands, and bays form the centerpiece of the United States’ fourth-largest metropolitan region. Because of its highly dynamic and complex environmental conditions, the basin supports an extraordinarily diverse and productive ecosystem. Its deepwater channels, tidelands, and marshlands provide a dynamic and complex environment that supports an extraordinary array of plants, animals, birds, and aquatic life. Two-thirds of the state’s salmon pass through the Bay and Delta each year, as do half of the waterfowl and shorebirds migrating along the Pacific Flyway.
Nearly 50 significant upland watersheds have been delineated in the San Francisco Bay Basin Water Quality Control Plan (Basin Plan). The basin’s watershed includes freshwater and estuarine streams and rivers that serve as vital habitat and as spawning areas for anadromous fish, as well as supporting municipal and domestic drinking water supply, agricultural and industrial process supply, water recreation, and navigation beneficial uses. In addition to San Francisco Bay itself, there are a number of water bodies of special significance within the basin. Watersheds within Marin County (Lagunitas Creek, Olema Creek, and Redwood Creek) and San Mateo Counties (Pescadero Creek and San Gregorio Creek) provide some of the best habitats for threatened or endangered coho salmon and steelhead populations in Central California. This critical beneficial use is impaired in each of these watersheds due to impacts from sedimentation and habitat degradation (e.g., excess fine sediments, lack of large woody debris, and lack of or covered spawning gravels). There are also many bayside watersheds that have important beneficial uses for fishes and other aquatic species; in most cases these streams have also suffered severe habitat degradation due to urbanization and flood control projects.
Tomales Bay has special significance since it is one of the few relatively unpolluted major estuaries along the coast. It is one of four commercial shellfish growing areas in the west, has significant sport and commercial fisheries, and is a major recreational area for the whole San Francisco Bay region. Tomales Bay is also an impaired water body due to impacts from pathogens, sediment, and mercury. Bolinas Lagoon has been designated a wetland of international importance; it is impaired by sedimentation.
Within the nine-county Region there are over 33 groundwater basins. Santa Clara Valley, Niles Cone, Livermore Valley and Westside Basins are the largest water supply resources, which supply groundwater to approximately 3 million people. During the dry seasons, groundwater discharges to surface water provide essential fresh water replenishment to creeks. Locally, groundwater is also used for irrigation and industrial supply beneficial uses.
The San Francisco Bay Region has a variety of water quality issues to address. The Bay Area is highly urbanized and is affected by all of the impacts associated with commercial, industrial, and residential development, including wastewater and industrial discharges, significant historic loss of wetlands through diking and filling, widespread stream modification projects for flood control and urban development, and contamination from pollutants such as industrial chemicals, hydrocarbons, pesticides, and legacy pollutants. The Region has seen a rapid expansion of residential development within the past twenty
San Francisco Bay Region ii January 2002

years, which has lead to impacts from increased impervious surface, storm water pollution, and changes to stream channels, hydrographs and riparian zones. There are also water quality impacts in the more rural areas of the Region from grazing and agriculture, confined animal facilities, onsite sewage systems, and land conversions. Groundwater contamination from industrial sites, leaking underground tanks, landfills, and MTBE are also major water quality concerns in the Region.
Implementation of the Watershed Management Initiative
The goal of the Watershed Management Initiative (WMI) is to effectively use Board and other agency staff and grant resources for the prevention and control of water pollution on a watershed scale, while continuing to meet regulatory program mandates. To meet this goal, we created the Watershed Management Division, defined watershed management areas, developed an initial priority-setting process, set priorities that are currently being reevaluated, and established new internal workgroups. All this work has been done with three key objectives in mind:
Focus on priority issues Integrate water quality programs Improve communication.
Focus on Priority Issues
At the onset of watershed planning efforts, there were few resources available for addressing priority watershed problems. Most of our staff and resources were tied to specific core regulatory programs with demanding workloads. Many of the priority watershed problems are caused by nonpoint sources of pollution, which generally are not managed with permits. As a result we found it necessary to establish and implement a priority setting process to focus our limited resources. We developed and applied a ranking system (high, medium, and low) for issues and activities based on three criteria: water quality benefit, customer service, and program requirements. At a priority setting retreat in 1997, fourteen issues emerged as high priority in all three criteria:
1. Mercury2. Waterway Management 3. Watershed Monitoring and Assessment 4. Urban Runoff5. New Development6. Erosion / Sedimentation7. Wetlands
8. Dredging9. Major Industrial Discharges 10. Dairies 11. Major Municipal Wastewater Discharges12. Reclamation13. Sediment Hot Spots 14. Exotic Species
Impressive progress towards addressing and resolving each of these issues was made in the last year. This progress is summarized below in Section II.A. Regional High Priorities.
In November 2001, staff re-evaluated the eleven watershed-related high-priority issues (issues 1-8, 10, and 13-14 above), and determined that one had been resolved (dredging) and the ten others could be combined into five high-priority issues to address over the next several years. The remaining three of fourteen high-priority issues (major industrial discharges, major municipal discharges, and reclamation) are related to our NPDES permit program, and staff plans to evaluate them in 2002. Currently the
San Francisco Bay Region iii January 2002

priorities below have been adopted in principle, and we will be working to refine the issues, goals, and objectives over the next six months to a year.
The current watershed-related high-priority issues are:
1) Urban Runoffa) New Developmentb) Watershed Monitoringc) Industrial Stormwaterd) Compliance Statuse) Trash TMDLs (via municipal stormwater permits)
2) Total Maximum Daily Loads (TMDLs)a) Mercuryb) Erosion/Sedimentation (including vineyards in Napa and Sonoma Counties)c) Sediment Hot Spots/Sediment Management/Beneficial Reused) Watershed Monitoringe) Pesticides
3) Wetlands and Stream Protectiona) Wetlandsb) Waterway Management and Stream Protectionc) Exotic Species
4) Rural Nonpoint Source (NPS)a) Confined animals (dairies, horse boarding, and other)b) Vineyards
5) Rural Wastewater and non-Chapter 15 Waste Discharge Requirements (WDRs)
Potential Future Priorities include:a) Grazing via erosion/sediment TMDLsb) Water Quantity where it has a deleterious effect upon water qualityc) Temperature and Nutrients via new TMDLs
Since the November 2001 evaluation and selection of current high-priority issues, staff has prepared “issue summary papers” which describe these water quality issues, goals, and workplan objectives in detail.
Integrate Water Quality Programs
Beginning in 1997, the San Francisco Bay Region was structured to promote a watershed-based approach to implementation of programs, with particular emphasis on integration of programs within county watershed management areas. In 1999, we completed a second reorganization to further implement our WMI objectives. The wastewater NPDES program was consolidated into the NPDES Permits Division in recognition of the demanding programmatic priorities and increasingly specialized staff work involved. Our goal is to be more efficient in meeting NPDES program goals while maintaining our watershed-based priorities. All other surface water programs are within the Watershed Management Division or the Policy and Planning Unit. During 2001, we expanded the Policy and Planning Unit to include a TMDL section. This section will be developing our TMDLs in close coordination with our watershed staff. In 2002, we will establish an Environmental Compliance Section within the Watershed Management Division, which
San Francisco Bay Region iv January 2002

will expand historic “Field Team” activities to more efficiently address emergency response needs, inspect construction and industrial storm water sites and audit municipal storm water programs’ oversight of these sites, and oversee sites that have been issued water quality certification and waivers of waste discharge requirements (WDRs). Additionally, the Section will work with staff from our Coastal and North East Bay Sections on inspection and enforcement for confined animal facilities. The Environmental Compliance Section will also work to educate both dischargers and local agencies on appropriate best management practices and our expectations for control of onsite pollution sources.
In 2002, we will also split the Watershed Management Division into North Bay and South Bay divisions. Since the 1999 reorganization, the Watershed Management Division has grown to four sections, numerous senior specialists, and the San Francisco Estuary Project. Splitting the Division into two will improve internal efficiency, but present a challenge to regionwide consistency. Consistency will partially be ensured by the work of the Surface Water Integration Group, further described below.
Improve Communication
Improving communication on watershed management issues is an ongoing challenge for any organization. Our staff strives to build relationships and communicate effectively with the key stakeholders in each watershed. The communication link to watershed stakeholders is key for targeting our limited grant dollars effectively. In the coming year we will be developing guidance for working with stakeholders on TMDLs and other watershed planning and implementation processes, including developing regional and local priorities for addressing water quality. We will also be working on improving interdivisional communication on watershed issues, which will be even more important when the Watershed Management Division is split into two divisions.
We have established the following permanent committees/workgroups to promote teamwork and better internal communication: Sediment Management, Groundwater, Urban Runoff, Watershed and Stream Protection, NPDES, and Computers. A Surface Water Integration Group will meet monthly to follow up on the recent priority setting tasks. The Group is comprised of the Division Chiefs, Section Leaders, and Program Managers who are responsible for watershed, surface water, planning, and TMDL related activities. The Group will be responsible for implementing the priority tasks and ensuring effective communication between divisions and sections, program areas, and watershed management areas. The Group will also help ensure a consistent internal approach once the Watershed Management Division is split into North Bay and South Bay divisions.
Watershed Management Activities
As a regional agency, we have the opportunity to solve priority water quality issues by choosing the best geographic level to address the root problem. The three geographic levels we use are: 1) the San Francisco Bay Regionwide watershed, 2) area watersheds generally defined by county boundaries, and 3) subwatersheds within county watershed management areas. Defining these three levels provides a way to classify problems and focus control measures at the most appropriate level. This process is flexible, with communication occurring up and down the watershed scale to ensure optimum use of resources and effective actions.
San Francisco Bay Region v January 2002

Regionwide Activities
Our regionwide activities include: (1) planning and policy development, (2) monitoring and assessment, (3) nonpoint source program, (4) wetlands and stream protection, (5) field team/environmental compliance, (6) core regulatory programs, (7) groundwater management, and (8) Total Maximum Daily Loads (TMDLs). Through our regionwide activities we address ubiquitous watershed issues that impact San Francisco Bay as well as addressing issues that are common to many watersheds.
Planning and Policy Development:Many of our activities stem from requirements and commitments associated with existing program areas. Other activities reflect new and emerging programs that have arisen as priority issues that merit region-wide strategies. Planning and policy are discussed in Section II.B below. Our long-term objectives are to:
Refine existing regulations, policies, and implementation measures in order to define limits and requirements that are appropriate for local conditions in cases where federal standards and/or statewide implementation measures may not be appropriate;
Develop regulatory program tools that will facilitate the transition between point source discharge regulation and broader watershed and cross-media management;
Develop local policies and regulatory approaches for watershed management, such as a template for evaluating projects that involve modifications of sediment fluxes in individual drainages; and
Develop TMDLs for pollutants and stressors of concern in addition to those noted in other tasks (copper, nickel, mercury, and PCBs).
Monitoring and Assessment:The goals of monitoring and assessment are to define issues, set priorities, and evaluate effectiveness of pollution prevention and control actions. We are fortunate to have our dischargers funding the $2.6 million annual San Francisco Bay Regional Monitoring Program to regularly monitor and assess San Francisco Bay segments. We established a Regional Monitoring and Assessment Strategy (RMAS) in 1999 (Section II.C). The Surface Water Ambient Monitoring Program (SWAMP) will be used in this Region to implement part of the RMAS. In August 2001, the Regional Board developed a workplan to describe the site-specific monitoring to be completed under SWAMP in the year 2001-2002. The goal of the site-specific portion of the SWAMP program in this Region is to monitor and assess all of our waterbodies in order to identify reference sites (clean sites) and waterbodies or sites that are impaired. Data developed in this program will be used for evaluating waterbodies for the water quality assessment report required by Clean Water Act Section 305(b) and the impaired waterbodies list required by Clean Water Act Section 303(d). With funding from the 2000-2001 fiscal year we will be monitoring and assessing six “planning watersheds”; with funding from the 2001-2002 fiscal year three more planning watersheds will be monitored. We also participate in a number of other ongoing regional and local watershed monitoring and assessments as detailed in Section II.C.
Nonpoint Source Program (Section II.D):Our program uses the three-tiered approach towards nonpoint source management (self-determined management practices, regulatory-based encouragement, and effluent limitations). However, our primary focus is on the middle tier of regulatory-based encouragement, in which we consider issuing waivers of WDRs if effective best management practices are implemented. We are applying this approach to urban runoff for non-NPDES permitted areas, to confined animal facilities, and to onsite disposal systems. Our overall goals for the nonpoint source program are to:
San Francisco Bay Region vi January 2002

Facilitate implementation of watershed management plans for the prevention and control of nonpoint source pollution throughout the San Francisco Bay Region;
Promote implementation of land-use specific nonpoint source pollution management measures that prevent or solve nonpoint source pollution problems throughout the San Francisco Bay Region; and
Educate, inform, and provide technical assistance to the public, public agencies, and private landowners and other interested parties about prevention and correction of nonpoint source pollution problems.
Our priority areas for nonpoint source funding are: facility wastewater and runoff from confined animal facilities, management measures for urban areas, and management measures for hydromodification.
Wetlands and Stream Protection (Section II.E)Wetlands and creeks are closely linked in the environment and through our regulatory programs. The Regional Board regulates activities affecting wetlands and creeks under both Federal and State law. Significant staff resources are dedicated to overseeing applications for Water Quality Certifications; additionally, staff has begun issuing WDRs to regulate discharges of wastes to waterways under State law. Our wetlands efforts are guided by the goals of conserving, protecting, restoring, and increasing wetlands habitat within the region, while continuing to improve the permitting process. Some of our high priority objectives over the next few years will be to develop mitigation guidance and complete a Basin Plan amendment on wetland monitoring guidance, develop regional general permits, and develop policies for implementing the recommendations of the Baylands Ecosystem Habitat Goals.
Our stream protection efforts are guided by the long-term goal of having creeks and waterways that function as well or better than they do at the present time. Priority tasks in FY 2002/03 will be 1) educating the Regional Board, Board staff, and local municipalities and stakeholders on the Stream Protection Policy (under development) and how to protect and enhance stream functions, 2) developing staff guidelines for project reviews, 3) identifying ways to improve cross-divisional communication and organization to be more effective in protecting streams, and 4) doing a statistically valid survey of the cumulative effects of small stream alteration projects within a watershed. Another priority in FY 2002/03 is to further coordinate with public works departments, flood management agencies, and agencies overseeing creek maintenance on developing mutually acceptable guidelines for best management practices.
Field Team/Environmental ComplianceAs discussed above and in Section II.F below, our historic “field team” activities will be addressed by an Environmental Compliance Section that will work with the other sections in the Watershed Management Division on all aspects of continuing oversight, inspections, and enforcement activities related to watershed issues.
Core Regulatory ProgramsThese programs are discussed under Section II.G. Core Regulatory programs include NPDES wastewater permitting, municipal and industrial storm water permitting, and permitting of facilities under non-Chapter 15 WDRs. These activities are implemented at both the regionwide and watershed level. Regionwide activities include program management and coordination and activities that are more efficiently implemented at the regionwide level. Storm water permitting, which is included in the
San Francisco Bay Region vii January 2002

Watershed Management Division, is integrally related to other watershed priorities such as TMDLs, and staff work closely together to assure that the watershed management approach is being maximized.
Groundwater Resource Management (Section II.H)The overall goal of the groundwater program is to protect and improve water quality for all beneficial uses. Our key stakeholders are the public, water supply agencies, owners of sites with contaminated groundwater, and property owners and developers. Groundwater programs are a major focus of the Regional Board’s program comprising 36% of our annual budget. Over $4 million per year is directed toward groundwater and soil pollution issues. Overall, the Regional Board's groundwater program is driven by the need to protect groundwater quality for existing municipal drinking water supply. Contamination sites in groundwater basins actively used for municipal drinking water receive the highest level of regulatory attention. Military base closures, property redevelopment issues, impacts to ecological receptors, and programmatic requirements (e.g., RCRA Subtitle C and D) also require significant staff focus. Other significant groundwater basins, used for domestic, irrigation or industrial supply, are an important, but secondary concern (due to limited resources).
The major objectives for FY 02/03 are:
Monitoring active gas stations to determine whether undetected MTBE releases from operating and upgraded underground storage tanks have occurred.
Supporting the Department of Water Resources Update on Groundwater Basins of California, which will consist of a summary of data available on the State’s groundwater basins, as well as detailed information on individual groundwater basins in our region.
Continuing efforts to create a region-wide GIS database that contains both surface water and groundwater information and supporting the State Board’s GeoTracker initiative.
Supporting the State Board’s development and implementation of SWIM, the database relating to inspection, monitoring, enforcement, and reporting.
Developing Regional Board policy for active landfills located in historic wetlands of the San Francisco Bay Estuary (Estuary Landfills).
Because of groundwater-planning efforts, staff intend to identify priority groundwater issues within several watersheds. Building on experience gained from the DOD/DOE program and pilot efforts at updating and revising groundwater beneficial use designations, we expect to start development of a plan to better integrate the groundwater protection activities in the Watershed Management Initiative in the near future.
Geographic Information System (GIS)The Regional Board continues to utilize GIS as a useful analytical tool for the study and monitoring of groundwater quality. The Regional Board is also increasing the use of GIS in watershed and TMDL analysis, and the SWAMP team is using GIS to track and monitor sampling sites. Future goals include increasing staff access to GIS tools, developing staff training, and increasing public access to Regional Board data layers. GIS objectives are more fully discussed in Section II.I. Total Maximum Daily Loads (TMDLs)The Watershed Management Initiative provides an operative framework to meet the challenges associated with the development and implementation of TMDLs for pollutants causing impairment of
San Francisco Bay Region viii January 2002

waters (see Section II.K). A complete TMDL encompasses many tasks and activities directly or indirectly associated with watershed/waterbody characterization, assessment, and management and other programs (e.g., NPDES, Nonpoint Source Program, Monitoring and Assessment, and Basin Planning). Consequently, TMDL development and implementation must be closely coordinated with watershed and program tasks on both the regionwide and county watershed management area levels. Our strategy is to approach each TMDL from the perspective that solution of the identified water quality impairment is the goal, not the TMDL itself. As such, we will evaluate the need and benefit of tasks in each of the complete TMDL elements and focus resources on tasks most critical to the ultimate solution. For example, problem definition would be a high priority for waterbodies that may be listed as impaired based on limited, outdated or poor quality data. Source analysis may be the critical gap for other TMDLs. Consideration of implementation alternatives, enforcement mechanisms, and watershed management will be critical for TMDLs that have nonpoint sources as the primary source of the water quality impairment.
Stakeholder participation and support will be essential for all TMDL projects. We continually identify and create opportunities to enhance involvement and collaboration with stakeholders. These efforts include improved outreach and communication, improved descriptions and use of stakeholder involvement, and collaboration opportunities and mechanisms.
County Watershed Management Area Activities
Staff working within each of the nine county watershed management areas (Alameda, Contra Costa, Marin, Napa, San Francisco, San Mateo, Santa Clara, Solano, and Sonoma Counties) is responsible for core regulatory programs (stormwater permitting, water quality certifications, waste discharge requirements) and management of nonpoint sources. In addition, staff participates in review of federal 205(j) and 319(h) grants, manages 319(h) contracts, participates and provides technical guidance on specific watershed projects, and conducts public outreach and education efforts. Section III describes each watershed management area, significant issues in each, and planned and proposed work tasks. Planned activities are tied to specific funding sources, whereas proposed activities currently have no funding sources. A summary of significant issues in each of the county watershed management areas is listed below. Currently, identification of these issues is based on collective input from staff working in individual watersheds.
San Francisco Bay Region ix January 2002

Summary of Significant Issues
Urban Runoff
Urban runoff
County Watershed Management Areas
County Watershed Management Area
Ala
med
a
Con
tra
Cos
ta
Mar
in
Nap
a
San
Fran
cisc
o San
Mat
eo
Sant
a C
lara
Sola
no
Sono
ma
Stream & Wetland Impacts from New & Re-development including erosion, changes in hydrograph
X X X X X X X X X
WQ impairment from pesticide runoff X X X X X X X X X
WQ impacts from industrial and commercial site development
X X X X X X X X
Lack of permanent stormwater treatment X X X X X X X X
More enforcement/inspection needed X X X X X X X X X
Wetlands and Stream Protection
Wetland and stream alterations in new developments
X X X X X X X X
Loss & degradation of wetland and riparian habitat X X X X X X X X X
Destabilization of stream channels X X X X X X X X
Degrading stream quality from rural road erosion X X X X X X X
Grazing impacts in upper watershed reaches
X X X X X
Flood Control & Management Modifications to creeks
for flood-control maintenance
Wetlands modifications for flood control
X X X X X X X X
Degradation of fishery habitat X X X X X X X X
Opportunity & need to protect good habitat
X X X X X X X X
Restoration of tidal and seasonal wetlands, and baylands wetlands
X X X X X X X X X
Alteration of flow regimes X X X X X X X XDeclining water level in Lake Merced
X X
Need for baseline watershed X X X X X X X X
San Francisco Bay Region x January 2002

assessments; ID significant sediment sourcesProtection of endangered species
X X X X X X X X X
Upland erosion & downstream sedimentation in Suisun Marsh & tributaries; protection of endangered species habitat
X
Impacts from point source pollutantsGroundwater Protection of Drinking
Water New Development in
recharge areas Potential reclamation in
recharge areas
X
X
X
X
X
X
X
X
X
X
X
X
X
X
X
X
Quarry & mine discharges Turbidity, pH Hg
X X X
X X
Use of wetlands for wastewater
X
Wastewater discharges from major industries
X
Stormwater runoff contamination
X
Contaminant levels in dredged sediments at piers
X
Nonpoint Source pollutants Confined animals waste
runoffX X X
Pathogens in shellfish beds; Assess on-site sewage systems
Tomales Bay Rural areas
X X
Impacts from agricultural facilities (irrigation runoff, pesticides, diversions, increased sedimentation and erosion)
X X X X X X
Surface water impacts from houseboats, boat works, marinas
X X X
Contaminated sediments Islais and Mission Creeks Resolution of potential
sediment impairment
X X
Beach pollution and closures from sewage overflows
X X
Pesticides in urban streams X X X X X X X X X
San Francisco Bay Region xi January 2002
This page intentionally left blank
San Francisco Bay Region xii January 2002

I. INTRODUCTION
A. Background
The water resource protection efforts of the State Water Resources Control Board and the Regional Water Quality Control Boards are guided by a five year Strategic Plan (developed in 1995 and last updated on November 15, 2001). A key component of the Strategic Plan is the Watershed Management Initiative (WMI), which promotes a watershed management approach for water resources protection. The WMI was developed to help State and Regional Boards meet our goal of providing water resource protection, enhancement, and restoration while balancing economic and environmental impacts. Past State and Regional Board programs tended to be directed at site-specific problems. This approach was reasonably effective for controlling pollution from point sources. However, to address diffuse nonpoint sources of pollutants, a new regulatory strategy was needed. To protect water resources within a watershed context, a mix of point and nonpoint source discharges, ground and surface water interactions, and water quality/water quantity relationships must be considered. The WMI is designed to integrate various surface and ground water regulatory programs while promoting cooperative, collaborative efforts within a watershed. It is also designed to focus limited resources on key issues. The WMI uses a strategy of drawing solutions from all interested parties within a watershed, to more effectively coordinate and implement measures to control both point and nonpoint sources.
Each Regional Board and the State Board prepare “Chapters” that together form the “Integrated Plan” for Implementation of the WMI. These chapters are updated annually. This document is the 2002 WMI Chapter of the San Francisco Bay Regional Water Quality Control Board (Region 2). Our WMI Chapter is a planning tool for identifying priorities to be funded by existing resources, as well as priority tasks that are currently unfunded. This Chapter contains activities planned over the next one to two years, and in some cases, over the next five years. It also contains descriptions of regional and watershed strategies, discusses how we are structured to implement the Watershed Management Initiative, and how we are implementing a priority setting process. It builds upon the progress made to date by our efforts, combined with local watershed efforts led by other entities. It also reflects how much more work we have to accomplish to fully implement the Watershed Management Initiative.
The WMI Chapter is not a commitment to complete work. Work commitments are made in fund source-specific workplans. The Chapter will be used to provide information for making informed decisions on which activities will be funded by specific workplans. The Chapter is dynamic and represents the best information and strategy at the time of this writing. Since the document is an administrative management tool, it must be flexible and responsive to the adaptive management required in addressing issues with changing priorities, new information, and changes in funding. Currently this region is working through a reassessment of institutional and water quality priorities, and we expect these to evolve over the coming months.
B. Definition of Watershed Management
A watershed is the land area extending from the topographic high points where water collects,
San Francisco Bay Region 1 January 2002

such as ridges, down to the topographic low point where the area drains into a creek, river, bay, ocean, or other waterbody. Watershed management is the coordination of activities within the watershed to protect beneficial uses. This concept has as its premise that many water quality and ecosystem problems are best prioritized and then solved at the watershed level rather than at the individual waterbody or discharger level. Major features of a Watershed Management Approach are: targeting priority problems, promoting a high level of stakeholder involvement, developing integrated solutions that make use of the expertise and authority of multiple agencies and organizations, and measuring success through monitoring and other data gathering.
State policy for water quality control in California is directed toward achieving the highest water quality consistent with maximum benefit to the people of the state. The beneficial uses described in the Regional Board’s Basin Plan define the resources, services, and desired qualities of the waters in our watersheds. The Regional Board is charged with protecting all these uses from pollution and nuisance that may occur as a result of waste discharges in the region. Therefore, Regional Board Watershed Management is the coordination of activities that affect beneficial uses of waters of the state within each watershed in our jurisdiction.
C. Description of Region and Watershed Management Areas
For the purpose of implementation of the Watershed Management Initiative in the San Francisco Bay Region, we have defined watershed management areas at three levels: 1) San Francisco Bay Regionwide; 2) county watershed management areas; and 3) subwatersheds.
Level 1 is the entire area of the San Francisco Bay Region. The San Francisco Bay Region is located on the central coast of California (Figure I-1). The San Francisco Bay and Delta is one of the world’s largest estuarine systems, which functions as the only drainage outlet for waters of the Central Valley. It also marks a natural topographic separation between the northern and southern coastal mountain ranges. The region includes the main Bay segments and the areas that drain to them. It also includes the coastal watersheds in the Region that drain to the Pacific Ocean.
The San Francisco Bay Region covers an area of approximately 4,550 square miles (sq. mi.), of which the land mass is approximately 90% (4,100 sq. mi.) Development activities have filled in the Bay (including San Pablo and Suisun Bays), reducing the area of high tide downstream of the Delta from 516,000 to 327,000 acres. Average annual precipitation is about 22 inches per year, and ranges from 18 inches per year in the driest areas (Port Chicago in Suisun Bay and San Jose in the South Bay) up to 49 inches per year in the wettest area (Kentfield, Marin County).
The region’s waterways, wetlands, and bays form the centerpiece of the United States’ fourth-largest metropolitan region. Because of its highly dynamic and complex environmental conditions, the Bay system supports an extraordinarily diverse and productive ecosystem. Effective management at this level requires consideration of areas and sources within Regions 1, 3, and 5 since segments of our Region's boundaries are political boundaries rather than hydrologic unit boundaries. In Section II, Regionwide Activities, we describe activities that are implemented at this level.
San Francisco Bay Region 2 January 2002

Figure I.1 San Francisco Bay Region
San Francisco Bay Region 3 January 2002

The second level is watersheds that are areas generally defined by county boundaries (Figure I-1). Some county boundaries, such as Napa and Santa Clara, closely correspond to physical watersheds, the Napa River drainage area and the Santa Clara Valley, respectively. However, other counties in the Region are essentially politically defined geographic areas that encompass several small watersheds. The counties range greatly in their urban and rural make-up, as well as in size:
County Area(sq. mi.)
Population (2000 census)
County Area(sq. mi.)
Population (2000 census)
Alameda 740 1,453,000 San Mateo 560 727,300Contra Costa 510 962,900 Santa Clara 950 1,719,160Marin 560 255,650 Solano 410 423,300Napa 430 132,700 Sonoma 300 476,900San Francisco 101 780,390
Because of the hydrology of our region, where we have many small watersheds draining to San Francisco Bay and relatively few large discrete watersheds, therefore it makes sense to work with watersheds on a county basis. The disadvantage of using county boundaries rather than watershed boundaries is balanced by the fact that counties provide the best opportunity for local government and agency participation and coordination. However, we are increasingly focused on using true watershed boundaries that may cut across county lines, particularly in developing TMDLs. In Section III, Watershed Based Activities, activities implemented at the county level are described in detail.
The third level is the subwatershed level within county watershed areas. For example, the San Lorenzo Creek drainage area in Alameda County is a third level watershed (see Figure II-1). Nearly 50 significant drainage basins have been delineated in our Basin Plan. The region’s watersheds include freshwater and estuarine streams and rivers. These surface waters serve as vital habitat and as spawning areas for anadromous fish as well as supporting municipal and domestic drinking water supply, agricultural and industrial process supply, water recreation, and navigation beneficial uses. Activities implemented at this level are described in more detail in Section II.C Monitoring and Assessment, individual county watershed management areas in Section III B-J, and Section III-K Total Maximum Daily Loads (TMDLs).
This watershed management process is flexible, with communication occurring up and down the watershed scale to ensure we use resources optimally and that our actions are effective. For example, pollutant sources that directly affect the Bay, such as the major industrial wastewater discharges, are being managed at the first (regionwide) level. Our experience to date suggests that urban runoff is best managed at the second level (county watershed management area, where municipalities are responsible for managing their urban drainage areas), although we also work at the regionwide level in setting standards for program review and permit conditions. The municipalities have, in turn, defined problems and implementation actions at the third level (subwatersheds). Regional Board staff involvement at all three levels will ensure that approaches to watershed management efforts are consistent regionwide.
San Francisco Bay Region 4 January 2002

D. Watershed-Based Organizational Structure and Management
The San Francisco Bay Regional Board is organized to promote a watershed-based approach towards implementation of programs, with particular emphasis on integration of programs within watershed management areas. Our watershed-based organization structure, priority setting process, and approach to program management are discussed in this section.
Watershed-Based Organizational Structure
We implemented an officewide reorganization in 1997 to focus on watersheds and to facilitate achievement of our WMI objectives (focus on priorities, integrate programs, communication). This reorganization consolidated the responsibilities, functions, and activities of most surface water related programs into two geographically defined watershed divisions. In 1999, we completed a second reorganization (see table below), consolidating the wastewater NPDES program into the NPDES Permits Division, due to the demands of permit reissuance and the increasingly specialized staff work involved. All other surface water programs are within the Watershed Management and the Policy and Planning Divisions. The Policy and Planning Division is responsible for basin planning and policy development, monitoring and assessment, and Bay dredging and dredge material disposal A Total Maximum Daily Load (TMDL) section was added to the Planning and Policy Division to develop and implement TMDLs in the Region.
WATERSHED BASED ORGANIZATIONDIVISION SECTION WATERSHED MANAGEMENT
AREASWatershed Management Division
South East Bay Alameda and Santa Clara Counties
Coastal San Francisco, San Mateo, and Marin Counties
North East Bay Contra Costa, Napa, Solano, and Sonoma Counties
Environmental Compliance
Regionwide
NPDES Permits Division
Section 1 RegionwideSection 2 RegionwideSection 3 Enforcement, regionwide
Policy and Planning Policy and Planning RegionwideTMDL Regionwide
Priority Setting ProcessIn mid-1997, management and staff participated in a priority setting process based on a ranking system of high, medium, low for issues and activities based on three criteria: water quality benefit, customer service, and program requirements,as detailed below:
1. Water quality benefit Beneficial use impairment Pollutant(s) of concern
San Francisco Bay Region 5 January 2002

Toxicity or other environmental factor Activity/source of concern
2. Customer service Permit holder "Bill-of-Rights" Equity Public "right-to-know" Reward good actors Maintain good working relationships Environmental justice
3. Program requirements Statutory/regulatory requirement State Board requirement/request Permit backlog Compliance with Board Orders Existing obligations Multiple program benefit
Staff determined that 14 issues were high-priority water quality issues. In November 2001, staff began a reevaluation of the high-priority issues for the Watershed and Policy and Planning Divisions, a process which will be completed in 2002. The details are presented in Section II.A, High-Priority Issues.
The current (interim) watershed-related high-priority issues are:
1) Urban Runoffa) New Developmentb) Watershed Monitoringc) Industrial Stormwaterd) Compliance Statuse) Trash TMDLs (via municipal stormwater permits)
2) Total Maximum Daily Loads (TMDLs)a) Mercuryb) Erosion/Sedimentation (including vineyards in Napa and Sonoma)c) Sediment Hot Spots/Sediment Management/Beneficial Reused) Watershed Monitoringe) Pesticides
3) Wetlands and Stream Protectiona) Wetlandsb) Waterway Management and Stream Protectionc) Exotic Species
4) Rural Nonpoint Source (NPS)a) Confined animals (dairies, horse boarding, and other)b) Vineyards
5) Rural Wastewater and non-Chapter 15 Waste Discharge Requirements (WDRs)
San Francisco Bay Region 6 January 2002

Potential High Priority Issues: Issues identified as potential high priorities that merit further consideration were: water quantity, grazing management, and temperature TMDLs. The issue of water quantity, which includes effects of water diversions on streams, providing adequate water at the right times and temperatures to support beneficial uses for fishes and other aquatic life, and changes in hydrology, is an important one that affects water quality.
Grazing management has effects on erosion and sedimentation, which in turn affects existing and potential beneficial uses. Temperature TMDLs may be needed in conjunction with sediment and nutrient TMDLs in a number of waterbodies.
A Watershed Initiative Management Committee will be meeting monthly to follow up on the recent priority setting tasks. The Committee is comprised of the Division Chiefs, Section Leaders, and Program Managers who are responsible for watershed, surface water, planning, and TMDL related activities. The committee will be responsible for ensuring effective communication among divisions and sections, program areas, and watershed management areas.
Watershed-Based Program Management and Chapter Organization
Our regionwide programs are Basin Planning (Planning and Policy Development), Monitoring and Assessment, Nonpoint Source, Wetlands and Stream Protection, Field Team/Environmental Compliance, Core Regulatory (NPDES, non-Chapter 15 Waste Discharge Requirements), Groundwater Resource Management, Geographic Information System (GIS), and TMDLs. We manage our surface water programs within a watershed-based framework as described in the description and organizational structure sections above. The watershed-based framework enables us to identify priority watershed issues, link them to the appropriate surface water program(s), and begin to resolve them through watershed management activities. The summary below describes the watershed management level for each surface water program and where pertinent discussions or data are located in this WMI Chapter.
Basin Planning (Planning and Policy Development)In general, Basin Planning activities are conducted at the Regionwide scale. Therefore, discussion of Basin Planning activities is in the Section II.B Planning and Policy Development. However, there will be Basin Planning issues (beneficial uses, water quality objectives, implementation plans) specific to county watershed management areas or specific subwatersheds. Such issues are included in the appropriate Section III, Watershed Activities section. A summary of Basin Planning schedules is found in Appendix A, Section 9.
Monitoring and AssessmentIdentification of priority issues and evaluation of the effectiveness of actions and activities are described in Section II.C, Monitoring and Assessment. This section discusses our Regional Monitoring and Assessment Strategy and implementation of the Surface Water Ambient Monitoring Program (SWAMP).
Nonpoint Source ProgramImplementation of the Nonpoint Source (NPS) Program is particularly amenable to a watershed-based approach. Our overall strategy acknowledges the existing impairment of water bodies from nonpoint sources and puts forth long term goals to short-term objectives to address these impairments. Our specific activities are described in Section II.D, Nonpoint Source Program.
San Francisco Bay Region 7 January 2002

Specific implementation activities for each county watershed are included in Section III.
Wetlands and Stream ProtectionWetlands, creeks, and waterway protection and management continue to be a high priority in the San Francisco Bay Region. Further discussion of Wetlands issues and activities is contained in Section II.E, Wetlands and Stream Protection. In addition, wetlands, creeks, and waterway protection and management issues specific to county watershed management areas or specific subwatersheds are highlighted in Section III.
Field Team/Environmental ComplianceWe have maintained a Field Team with responsibilities for responding to spills, leaks, and other actions associated with unregulated discharges regionwide as well as inspecting construction sites covered by storm water permits and of municipal storm water management programs that have responsibility for oversight of construction sites. In 2002, we will establish an Environmental Compliance Section to expand the historic reach of the Field Team to industrial storm water sites and sites that have been issued water quality certification and waivers of waste discharge requirements. These activities are both regionwide and watershed-specific and are described in Section II.F, Field Team, and Section III.
Core Regulatory Programs (NPDES, Storm Water, non-Chapter 15 WDRs) Core regulatory activities are implemented at both the regionwide and county watershed level. As a result, discussion of these core regulatory implementation issues and activities are contained both in Section II.G, Core Regulatory Programs, and in Section III. Appendix A, Sections 1 – 7, contain information on permit reissuance schedules, pretreatment inspection and audit schedules, and compliance inspections.
Geographic Information System (GIS)The Regional Board continues to utilize GIS as a useful analytical tool for the study and monitoring of groundwater quality. The Regional Board is also increasing the use of GIS in its watershed and TMDL analysis, and the SWAMP team is using GIS to track and monitor sampling sites. Future goals include increasing staff access to GIS tools, developing staff training, and increasing public access to Regional Board data layers. GIS objectives are more fully discussed in Section II.I Geographic Information System.
Total Maximum Daily Loads (TMDLs)Development of TMDLs is taking place at all three watershed levels, from several baywide TMDLs (pesticides, mercury) to subwatersheds. Since TMDLs are developed and implemented on a watershed basis, they are described under Section III, Watershed Based Activities. A summary of our overall strategy is in Section III.K, Total Maximum Daily Loads. Appendix A, Section 8 contains a list and schedule for development of all planned TMDLs.
Activities at the county watershed level and subwatersheds within counties are described in Section III B-J, which include watershed descriptions, summaries of significant water quality issues, proposed workplans for FY 2002/03 and 2003/04, high priority unfunded activities, and high priority projects for grant funding.
San Francisco Bay Region 8 January 2002

II. REGIONWIDE ACTIVITIES
Our regionwide activities include: (1) planning and policy development; (2) monitoring and assessment; (3) nonpoint source program; (4) wetlands and stream protection; (5) field team/environmental compliance (6) core regulatory programs, (7) groundwater resource management, and (8) geographic information system (GIS). Through our regionwide activities we address overall watershed problems that impact San Francisco Bay and problems that are common to more than one watershed. For example, BMP’s for urban waterway management, environmental indicators for 303(d) listed water bodies, and updating groundwater beneficial use designations are the types of issues that we address on a regionwide scale. We are also reevaluating our overall regional priority setting process, which is discussed in the following section.
A. High-Priority Issues
In mid-1997, management and staff participated in a priority setting process based on a ranking system of high, medium, and low for issues and activities based on three criteria: water quality benefit, customer service, and program requirements. Staff determined that 14 issues were high-priority water quality issues as noted in the table below.
1. Mercury2. Waterway Management 3. Watershed Monitoring and Assessment4. Urban Runoff5. New Development6. Erosion / Sedimentation7. Wetlands
8. Dredging9. Major Industrial Discharges 10. Dairies 11. Major Municipal Wastewater Discharges12. Reclamation13. Sediment Hot Spots 14. Exotic Species
For each issue, the policy goal is summarized below followed by a bulleted list of progress made during FY2001/02.
3. Mercury Goal: Develop TMDL strategy and permit reissuance strategy Implemented a workplan to complete mercury TMDL by 2003. Completed a Technical Support Document for the mercury TMDL, including a problem
statement, source analysis, numeric targets, linkage analysis, and proposed load allocations.
Solicited stakeholder feedback on the Technical Support Document and responded to comments received.
Lead Mercury Watershed Council and continued stakeholder participation in TMDL development.
Continued collaboration with Central Valley Regional Board. Drafted Basin Plan Amendment and staff report, including TMDL implementation plan,
for submittal for scientific peer review.
2. Stream Protection
9

Goal: The overall goal of the stream protection program is to have creeks and other waterways that function as well or better than they do at the present time, through development and refinement of a Stream Protection Policy. By the end of FY2001/02 staff will have developed a Baseline Stream Protection Policy
for five management areas: 1) changes in the hydrograph, 2) protection of floodprone area, 3) riparian zones, 4) buffer zones, and 5) impacts from instream structures.
By the end of FY2001/02 staff will have developed a Basin Plan amendment for the Baseline Stream Protection Policy, including two new beneficial uses.
Determined that preliminary stream classification system for the Bay Area was not adequate for the variety of regional stream and land use types; continued to work on strategy for developing a successful system in coordination with sediment TMDL strategy and Regional Monitoring and Assessment Strategy (RMAS).
Continued work with local experts to develop technical framework for protecting stream functions.
Continued coordination with key stakeholder groups to develop partnership projects to reduce impacts to streams.
Identified future research needs for understanding of Bay Area stream systems.
3. Watershed Monitoring and Assessment Goal: Develop Implementation Strategy Initiated implementation of RMAS. Formed and convened Technical Advisory Committee. Completed preliminary lists of observation watersheds (finest scale analysis) and pilot
watersheds for the next Clean Water Act Section 305(b)/303(d) cycle. Began development of environmental indicators and protocols; system for data
management; guidance for 305(b)/303(d); RMAS plan for bioassessment reference conditions and metrics for rivers and creeks.
Began planning a process for coordination and integration of multiple monitoring efforts – regionwide volunteer monitoring strategy, regionwide urban runoff monitoring strategy and regional monitoring program for the Bay; geographic linkage of various data sets and accessibility are of particular importance.
Developed Surface Water Ambient Monitoring Program (SWAMP) strategy for Regional Board lead and partner lead watersheds. Completed draft workplan for 2001-02, including designation and plan for site-specific monitoring in nine watersheds.
4. Urban Runoff Goal: Better compliance assessment and effective management of the stormwater permit programs for pollutant reduction and beneficial use protection Focused on assuring adequate quality and quantity of industrial stormwater inspections
by the municipal permitees. Took initiative to inform city and county planning staffs of need for clean stormwater
and stream protection in order to improve permitting process for new development.
5. New Development
10

Goal: Reduce water quality impacts that result when land is developed. Impacts include increased pollutant loads and changes in the hydrograph from increased impervious surfaces. Adopted enhanced performance standard provisions as amendment to Santa Clara
Program stormwater permit, requiring new and redevelopment projects to implement post-construction stormwater controls, site design measures, and source control measures.
Focused on minimizing impervious areas in new development.
6. Erosion/Sedimentation Goal: Refine and Implement Existing Strategy Ongoing inspection and enforcement activities for construction, industrial facilities, spill
response. Conducted 10 construction and erosion control workshops for municipalities and
contractors in the Region with over 500 attendees. Continued outreach and education workshops to other Regions in California.
7. Wetlands Goal: Protection, enhancement and restoration (increase) of wetlands habitats within our region Continued work with Coastal Conservancy, San Francisco Estuary Institute, USEPA and
others to develop a wetlands regional monitoring program (WRMP). Monitoring protocols for San Francisco Bay wetlands will be published in 2002. We are also participating as part of the WRMP Team to develop a wetland monitoring program for CALFED funding.
Prepared draft resolution on the Regional Board’s use of the Baylands Ecosystem Habitat Goals document.
Completed the Baylands Ecosystem Species and Community Profiles, which is the technical compendium to the Habitat Goals Report.
8. Dredging – Goal achieved in 2001Goal: Coordinate Beneficial Reuse Strategy (this goal is now complete, and consequently this issue is no longer a high priority) Completed development of the Management Plan, which documents how the Long Term
Management Strategy (LTMS) for the Placement of Dredged Material in the San Francisco Bay Region goals will be implemented. Public release on the Plan is expected in early 2002. The need for the Management Plan had made this a high priority issue.
Initiated process of amending Basin Plan to incorporate implementation of the LTMS. Process expected to be completed in 2002.
Began process of developing standard permit conditions for projects proposing the beneficial reuse of dredged material.
Continued participation with the Dredged Material Management Office - accomplishes multiagency review of aquatic disposal of dredged material and is initiating multiagency review of upland beneficial reuse of dredged materials.
9. Major Industrial Dischargers Goal: Develop Selenium Strategy and Develop Permit Strategy for Dilution Credits Reduced selenium discharges by oil refineries beginning in July 1998 Evaluated program effectiveness to increase pollution prevention/reduction
11

Developed dioxin strategy Participated with State Board in development of the Inland Surface Waters and Enclosed
Bays and Estuaries Plan
10. Dairies Goal: Assure compliance with state regulations on confined animal facilities such that facilities are not contributing nonpoint source pollution to the region’s waterbodies. Maintained our field presence at dairy facilities for routine inspections as well as spill
and complaint response and enforcement
11. Major POTWsGoal: Address Chronic Toxicity and Develop Shallow Water Discharge Strategy Began implementation of Clean Water Enforcement and Pollution Prevention Act of
1999 (SB 709) Prepared response to court cases challenging shallow water discharge permits Reduced permit backlog Reissued 27 major NPDES permits Identified technical issues related to setting water quality based effluent limits into
impaired water bodies Conducted Level A and Level B inspections at permitted facilities
12. Reclamation Goal: Develop Implementation Strategy Participated on the Settlement Panel regarding the Dublin San Ramon Services District
and Zone 7’s law suit appealing the Regional Board’s approval of the Clean Water Revival Groundwater
Brought several Sanitary Wastewater Districts under the General Water Reuse Permit Adopted Water Reuse Permits for a private project and the East Bay Regional Park using
State-of –the-Art-Technology under Title 22 Continued work with the Water Reuse Association on water reuse issues and activities
13. Sediment hot spots Goal: Complete Evaluation and Cleanup Plans Continued implementation of clean-up plans through activities at DOD/DOE sites Review of Mission Creek and Islais Creek studies by City of San Francisco as part of
proposed wetland restoration activities Issued cleanup order to UC Berkeley and Zeneca Corp. for Stege Marsh in Richmond to
address contamination with mercury, selenium, copper and other metals, and pesticides
14. Exotic Species Goal: Ballast Water Prohibition Issued permits to dry docks with prohibition of ballast water discharge Developed workplan to complete exotic species TMDL by 2005 Participated with state workgroup on AB703 (Lempert) to initiate state regulatory
program on ballast water management Participated in national and international workgroups to address problem
12

In December 2001, staff reevaluated the 11 watershed-related high-priority issues (issues 1-8, 10, and 13-14 above), and determined that dredging was completed and the 10 others could be combined into five high-priority issues to address over the next several years. The remaining three of 14 high-priority issues (major industrial discharges, major municipal discharges, and reclamation) are related to our NPDES permit program, and staff plans to evaluate them in 2002. Currently the priorities below have been adopted in principle, and we will be working to refine the issues, goals, and objectives over the next six months to a year.
The current (interim) watershed-related high-priority issues are:
13
1) Urban Runoffa) New Developmentb) Watershed Monitoringc) Industrial Stormwaterd) Compliance Statuse) Trash TMDLs (via municipal
stormwater permits)
2) TMDLsa) Mercuryb) Erosion/Sedimentation
(including vineyards in Napa and Sonoma)
c) Sediment Hot Spots/Sediment Management/Beneficial Reuse
d) Watershed Monitoringe) Pesticides
3) Wetlands and Stream Protectiona) Wetlandsb) Waterway Management and
Stream Protectionc) Exotic Species
4) Rural Nonpoint Source (NPS)a) Confined animals (dairies, horse
boarding, and other)b) Vineyards
5) Rural Wastewater and non-Chapter 15 Waste Discharge Requirements (WDRs)
6) Potential Future Priorities:a) Grazing via erosion/sediment
TMDLb) Water Quantity where it has a
deleterious effect upon water quality
c) Temperature and Nutrients via new TMDLs
14

Since the December 2001 evaluation and selection of current high-priority issues, staff has been drafting “issue summary papers” which will describe these water quality issues and proposed solutions in detail. However, these documents are not scheduled to be completed for several months, and so they are not yet available to be included in this (January 2002) WMI Chapter. We plan to include them next year. In the meantime, about a summary of the current priorities is listed below:
1) Urban RunoffThis is one of the agency’s primary program missions, and the largest and least managed source of impairing pollutants. As part of urban runoff, “New and re-Development” is a water quality priority because it capitalizes on the opportunity to decrease a development’s adverse impacts to watercourses during the project planning process, when it is most cost-effective and practical.
2) Total Maximum Daily Loads (TMDLs)High priority TMDLs are identified and TMDL schedule included in Section III.K and Appendix A, Section 8. Update on TMDL development and implementation will be included in January 2003 WMI Chapter.
3) Wetlands and Stream ProtectionNon-point sources now account for more than half of pollution into San Francisco Bay. Wetlands can improve Bay water quality by retaining sediment and contaminants, and by processing nutrients, some minerals, and organic matter. In terms of beneficial uses, wetlands support diverse biological communities, provide a flood storage function and afford recreational uses. To more effectively protect beneficial uses of waters of the State, we need to 1) better understand and manage the chemical, physical, and biological functions of, and links between, creeks, wetlands, and uplands and 2) better use our regulatory and planning tools to protect these functions and links. Specific tasks include working on implementing a Stream Protection Policy and improving the 401 certification process through upgrading our database, improving our application forms, and developing regional permits as appropriate.
4) Rural Nonpoint Source (NPS)Confined animal facilities contribute sediment, fecal coliform, nutrients, and other agricultural pollutants to surrounding watersheds. These facilities, if not properly managed, can also lead to impairment and/or loss of riparian zones, increased sedimentation from erosion, and decline in stream functions. Based on existing information, many of the confined animal facilities in our Region are not complying with regulations. We will be focusing some of our nonpoint resources on the effort to identify these facilities and assure compliance.
5) Rural Wastewater and non-Chapter 15 Waste Discharge Requirements (WDRs) (To be included in January 2003 WMI Chapter)
San Francisco Bay Region 15 January 2002

Staff also identified several Potential Future Priorities:a) Grazing: Grazing management has effects on erosion and sedimentation, which in turn
affects existing and potential beneficial uses. This issue will be addressed primarily via erosion/sediment TMDLs
b) Water Quantity where it has a deleterious effect upon water quality. The issue of water quantity is an important one that affects water quality in numerous ways. These include the effects of water diversions on streams, providing adequate water at the right times and temperatures to support beneficial uses for fishes and other aquatic life, and changes in hydrology. For most of the watersheds in Region 2, including the San Francisco Bay and Delta, inadequate water quantity is fully as damaging as pollutants to the health of biological resources. Over the past 30 years, as pollutants have received ever more attention, the water quantity picture has generally gotten worse.
Water quantity issues cannot be addressed solely by promising a more restrictive decision framework for new diversions. In many cases, certainly including the Bay, major problems would exist even if there were no additional diversions. Rather the focus must be broadened, to include:
Enforcement of applicable restrictions on existing permitted diversions. For example, in this region we believe that storage duration restrictions on riparian diversions are routinely violated. The State Board should consider using Regional Boards to track the status of compliance with existing water rights.
Seeking new legislation to create a statewide system for regulating groundwater pumping, as has been done in all the other states of the arid west.
Fostering plans to acquire and transfer to fish or people water now used for subsidized or low-value farming. For example, alfalfa, which accounts for about 0.1 percent of the California economy, uses as much water as all the people.
We plan to make a determination within the next three months of the watersheds in our Region where issues related to water quantity are having a significant effect on water quality and beneficial uses, in order to determine whether this is a priority issue for us in the coming year.
c) Temperature and Nutrients: Temperature and/or nutrient TMDLs may be needed in conjunction with sediment TMDLs in a number of waterbodies via new and existing TMDLs.
We have also determined upon a number of institutional priorities related to watershed management, which include 1) defining our watershed management approach and developing a clear vision and goals, to be included in our Basin Plan, 2) developing guidance for working with stakeholders on TMDLs and other watershed planning and implementation processes, including developing regional and local priorities for addressing water quality impairment, 3) developing a clearer and more effective enforcement process, and 4) improving interdivisional communication on watershed issues.
San Francisco Bay Region 16 January 2002

B. Planning and Policy Development
Background
A major focus of our water quality control programs has been and continues to be on managing the influx of toxic pollutants to the larger San Francisco Bay Estuary aquatic system. Certain toxic pollutants remain a great concern even after decades of successful efforts in controlling wastewater sources of pollutants. This remains the case even after a great degree of progress has been made towards control of wastewater sources as evidenced by the great improvement in the overall health of the bay. This has resulted in raising the significance of other sources, such as urban and non-urban runoff and the continued significance of pollutants in the sediments (reservoir sources) and ongoing releases from historical sources (eg., continued inputs of PCBs or organo-chlorine pesticides) of pollutants that have been banned for more than 20 years. This has resulted in the increased awareness that a number of the high priority issues or pollutants are the result of numerous, small inputs or cross-media issues where the initial release is not directly to water. Both of these cases emphasize the need for coordination between policy development and the watersheds to provide the appropriate tools to allow progress towards solutions for these difficult issues.
In terms of activities related to the Estuary itself, we are fortunate to have the San Francisco Bay Estuary Project at the Regional Board. In 1993, the Estuary Project reached its goal of developing a Comprehensive Conservation and Management Plan (CCMP), which contains over 140 recommended actions. Many of our priorities and activities are consistent with or are direct implementation of CCMP actions. As such, the Regional Board works cooperatively with the Estuary Project on several projects including: erosion control, vessel waste, invasive species, pollution prevention, urban runoff and watershed management planning, and the wetlands ecosystem goals project.
Also, many of our current planning and policy development activities stem from requirements and commitments associated with existing program areas. Examples include the Long Term Management Strategy (LTMS) for dredging and dredge spoil disposal, the Regional Monitoring Program (RMP), and the development of Total Maximum Daily Loads (TMDL) for specific pollutant or stressors. Other activities reflect new and emerging programs that have arisen as priority issues that merit region-wide strategies. The following list encompasses most of the high priority categories where specific activities are ongoing:
Monitoring and assessment (SWAMP) TMDLs or mass-based waste load allocations for specific chemicals Bay dredging and disposal (LTMS) Regional Monitoring Program Interface with CalFed and other Regional Boards Effluent toxicity control program Basin plan updates including:
Site specific water quality objectives Stream Protection Policy Revision of water quality criteria Beneficial Use Evaluation of Groundwater Basins
San Francisco Bay Region 17 January 2002

Long-term mercury strategy (TMDL) Selenium strategy for petroleum refineries (TMDL) Reclamation strategy Erosion and sedimentation
Planning and Policy Development Activities
Planning provides two basic functions to assist in the resolution of these high priority issues in the context of Watershed Management:a) Resolving outstanding issues associated with regional implementation of federal standards and regulations and statewide implementation measures; andb) Articulating new regulatory tools and approaches that emerge as we engage more and more in watershed management.
For each of these functions, we must ensure that new tools and policies are clearly articulated, receive a thorough public review, and move through the formal approval process. Appendix A, Section 9 contains a schedule for planned Basin Plan Amendments and the next Basin Planning Triennial Review.
Long-Term Planning Objectives
There are a number of long-term objectives for policy development and regulatory approaches that will help us to better implement the Watershed Management Initiative and further management of water quality on a watershed basis:
Planning Objective 1. - Refine existing regulations, policies, and implementation measures in order to define limits and requirements that are appropriate for local conditions in cases where federal standards and/or statewide implementation measures may not be appropriate.
At present, there is an existing template for deriving water quality based effluent limits and proposed or established numerical standards for the pollutants on the national priority list. There are, however, ongoing implementation problems with a small subset of these pollutants. The planning objective is to conduct region-wide troubleshooting for this subset of pollutants over the next two to four years. When finished, staff resources that are currently being spent responding to the same implementation problem in all permits can be redirected towards broader watershed issues. The following tasks fall under this objective:
Resolve copper and nickel issues by: a) Developing Basin Plan amendments to include site specific objective for copper and nickel in South San Francisco Bay in the context of the Santa Clara Basin Watershed Management Initiative; and
b) Complete the ongoing process of evaluating the copper-nickel levels in the embayments north of the Dumbarton Bridge. Four rounds of data collection have been completed and additional analysis is needed.
Developing pollutant-specific strategies for mercury, PCBs, and selected pesticides: San Francisco Bay Region 18 January 2002

a) A draft mercury strategy was prepared and released for public comment. It is the intent to build upon this report to set the stage for TMDL development and Basin Plan Amendments. Additional actions that are underway include, ongoing meeting of a mercury watershed council, including workgroups focused on pollution prevention or source elimination, pollutant credit or trading mechanisms, and research priorities. Proposals for modifications to the RMP base program to address data gaps regarding methyl mercury will be considered by the RMP steering committee in the Spring of 1999, for possible inclusion in this years sampling program. Proposals that are being considered for funding through CalFed will improve the estimates of mercury loading from riverine sources and cost estimates for remediation of some sources. Monitoring of fish tissue and other aquatic organisms will continue to provide a barometer of progress on improving conditions in the Bay. Coordination with Region 5 and the State Board to resolve issues concerning sources outside of our Region will continue.
b) Sampling information on PCBs has been collected through The RMP and Bay Protection and Toxic Hot Spot Cleanup Program. The RMP chlorinated hydrocarbon work group has provided preliminary loading estimates. These estimates are based on data collected by the RMP and a model derived from work completed as part of the Great Lakes initiative and other work. This has served as the basis for identifying data gaps and a work plan to prioritize data needs to determine the source of PCBs in the estuary and take the first steps toward determining appropriate control measures for the sources that are identified. Evaluation of data collected near storm drain outlets and channels will be completed in the coming year. Additional data has been collected at selected locations within stormwater conveyance systems. The results will be considered as part of the eventual establishment of TMDL targets and implementation.
c) Continued evaluation of toxicity related to organo-phosphate pesticides in the Bay and urban streams, possible educational and management practices to ameliorate the problem.
d) Development of a strategy to provide information critical to the determination of the appropriate control measures for exotic or invasive species within the estuary. This could include improved data on vessel calls at Bay area ports, ballast water discharge volume estimates, and improved tracking of port of origin for vessels calling at Bay area ports.
Planning Objective 2. - Development of regulatory program tools that will facilitate the transition between point source discharge regulation and broader watershed and cross-media management;
Develop and obtain public review on a pilot mass offset system for point to nonpoint permits to facilitate effective management of pollutants dominated by riverine or relic sources and airborne sources.
Define water quality problems that are the result of land or air management.
Refine the conceptual maps of mass loading and transport of pollutants of concern. A portion of this synthesis has been completed by the RMP sources and loadings workgroup and has been identified as a key issue to be addressed in the program re-design. Additional resources are targeted for this task in this fiscal year. Additional resources will be required to complete this task in future years.
San Francisco Bay Region 19 January 2002

Develop and initiate Basin Plan amendment process specifically defining groundwater basin beneficial uses, protection, and development policies using detailed geological, land use, cleanup, and development data developed for each groundwater basin within the region. Data has been collected on 2 of the 32 basins and draft proposals for Basin Plan amendments have been prepared.
Planning Objective 3. - Development of local policies and regulatory approaches for watershed management, such as a template for evaluating projects that involve modifications of sediment fluxes in individual drainages;
Develop several sets of regional guidelines for projects involving hydrogeomorphological modifications of streams and channels in the region. Initial focus will be on defining flood management activities that have minimal potential to impact water quality or stream function and on the definition of acceptable modifications to streams in terms of protecting or enhancing stream function to protect the beneficial uses of the streams.
Develop a stream protection policy to enhance the ability to protect the functions of streams that are necessary to preserve the beneficial use of the stream.
Planning Objective 4. - Development of TMDLs for pollutants and stressors of concern in addition to those noted in other tasks (copper, nickel, mercury, and PCBs); [Appendix A, Section 8, contains a schedule for TMDL development for water bodies in our Region.]
Initial action plan for control of exotic species has been completed. While this identifies a TMDL target of zero for introduction of non-native species, implementation measures and timing are still being investigated and considered.
Draft TMDL work plans have been developed for all water bodies and stressors included in the 1998 303(d) report adopted by the Regional Board.
Develop strategy for prevention and control of toxicity caused by pesticides, particularly diazinon and chlopyrifos and continue to work with Region 5, the Department of Pesticide Regulation, municipalities, and other interested parties through the Urban Pesticide Committee and other forums.
Develop regional strategy for sediment TMDLs with initial focus on the Napa River and Sonoma Creek watersheds.
Continue to oversee implementation of selenium control strategies by the petroleum refineries.
San Francisco Bay Region 20 January 2002

SF Bay RWQCB boundary
Major streams
County boundary
Ambient monitoring watershed
Water body
N
0 5 10 15 Miles
0 5 10 15 20 25 Kilometers
Projection: Albers Equal Area Conic (NAD 1927)Source: SFB RWQCBDate: December 18, 2001
Walker Creek
Lagunitas Creek
Suisun Creek
San PabloCreek
San LeandroCreek
Arroyo delas Positas
Wildcat Creek
San GregorioCreek
Pescadero CreekStevens Creek
PermanenteCreek
Figure II–1. SWAMP Pilot Watersheds
San Francisco Bay Region 21 January 2002

C. Monitoring and Assessment
In October 1999 the San Francisco Bay Regional Water Quality Control Board (Regional Board) developed a Regional Monitoring and Assessment Strategy (RMAS) in order to develop information for all waterbodies in the Region for the 305(b) report and for 303(d) listing. The RMAS was developed in cooperation with many stakeholders, such as the Bay Area Stormwater Management Agencies Association (BASMAA), San Francisco Estuary Institute (SFEI) and California Department of Fish and Game (CDFG). In July 2000, the governor approved funding for the statewide Surface Waters Ambient Monitoring Program (SWAMP), which for the first time provided funding to the State and Regional Boards to perform ambient monitoring specifically for the 305(b) report and 303(d) list. Although the Regional Boards were directed to monitor and assess all hydrologic units in their region within five years, funding constraints have made it necessary to use a representative approach to selected waterbodies. Future assessment following the current fiscal year will depend on the funding available from the State.
The Surface Water Ambient Monitoring Program (SWAMP) will be used in this Region to implement the RMAS, in addition to other monitoring the Board requires of NPDES and other permit holders. The three components that make up the SWAMP/RMAS include: 1) funding from the State Water Resources Control Board for Regional Board lead activities (these activities will concentrate on monitoring watersheds, lakes/reservoirs and bays and estuaries other than San Francisco Bay and will include other Regional Board programs such as State Mussel Watch, the Toxic Substances Monitoring Program and the Coastal Fish Contamination Program), 2) partner lead watershed monitoring programs that are being conducted by local agencies or other groups and are of similar goals, structure and scope as the Regional Board lead activities and 3) the San Francisco Estuary Regional Monitoring Program (RMP).
The 4000 square-mile San Francisco Bay Region was divided into 47 “planning watersheds” for the purpose of implementing a rotating basin approach for monitoring and assessment on a finer scale than the seven hydrologic basins. These planning watersheds are between 30 and 200 square miles in area, with most between 50 and 100 square miles. Some of these planning watersheds are self-contained hydrologic units that drain to an estuary or the ocean (e.g., Sonoma Creek), and others have been either combined with adjacent watersheds (e.g., North San Mateo Coastal Creeks) or are subwatersheds within a larger drainage basin (e.g., Arroyo Mocho within the larger Alameda Creek). All planning watersheds are fully contained within one of the seven Hydrologic Units of the San Francisco Bay Region.
In August 2001, the Regional Board developed a workplan to describe the site-specific monitoring to be completed under SWAMP in the year 2001-2002. These activities are those referred to above as Regional Board lead activities. The goal of the site-specific portion of the SWAMP program in this Region is to monitor and assess all of our waterbodies in order to identify reference sites (clean sites) and waterbodies or sites that are impaired. Data developed in this program will be used for evaluating waterbodies for the 305(b) report and the 303(d) list. Specific objectives of the monitoring program are to: 1) identify reference sites, 2) identify impacted sites or waterbodies in order to determine if beneficial uses are being protected, 3) identify the cause of impacts (i.e., sediment, specific chemical contaminants, temperature), 4) determine if these impacts are associated with specific land uses and 5) evaluate monitoring tools
San Francisco Bay Region 22 January 2002

in watersheds in order to develop a program that uses the best environmental indicators to achieve the purposes of the program.
Criteria for prioritizing the planning watersheds for monitoring and assessment are pragmatic, and aim toward generating the most useful and current information with the least amount of new resources and investigations. The first watersheds to be analyzed at this new level of detail also consider time-sensitive issues such as imminent development plans (e.g., major housing or flood control projects), upcoming stream restoration projects, or declining sensitive aquatic resources. The prioritized order of planning watersheds achieves balance geographically, by eco-region, and includes both data-rich and data-poor watersheds as well as a balance of potentially clean and problem watersheds. Table II-1 is a prioritized list of planning watersheds to be monitored under the SWAMP in this region.
With funding from the 2000-2001 fiscal year we will be monitoring and assessing six “planning watersheds”: Walker and Lagunitas in Marin County, Wildcat/San Pablo in Contra Costa County, San Leandro and Arroyo Las Positas in Alameda and Contra Costa Counties and Suisun Creek in Solano and Napa Counties. The greater Lagunitas watershed includes Olema Creek where the National Park Service has already initiated a multi-year watershed monitoring program of similar goals, structure and scope. Our sampling plan focuses on three sampling events based on three hydrologic cycles. The 3 hydrologic cycles are the wet season (January - March), decreasing hydrograph /spring (April - June) and the dry season (July - October). Rapid bioassessments were conducted in the six planning watersheds in May 2001. However, due to contractual delays the rest of the monitoring that was planned had to be delayed until the dry season. Therefore, monitoring, other than bioassessments and qualitative physical habitat assessment, in these watersheds will take place in the dry season of 2001, the wet season of 2002 and the decreasing hydrograph in 2002.
With funding from the 2001-2002 fiscal year three more planning watersheds will be monitored. These watersheds are Pescadero and San Gregorio in San Mateo County and Stevens/Permanente Creek watershed in Santa Clara County. The same basic study design will be used in these watersheds. This monitoring will start in spring (decreasing hydrograph) of 2002. Investigations and reconnaissance are currently being conducted to finalize this part of the study.
In general, the technical approach for Regional Board lead activities under SWAMP includes: 1) monitoring fish for contaminant levels in reservoirs and coastal areas where people catch and consume fish and 2) watershed monitoring to assess water quality impacts and establish regional sites of reference (i.e., high quality or “clean”) conditions. The part of the program to measure contaminants in fish will be implemented through the Toxic Substances Monitoring Program and the Coastal Fish Contamination Program. The Regional Board will implement most of the watershed monitoring portion of SWAMP through the Fish and Game master contract, although additional monitoring will be conducted by Regional Board staff using our laboratory contract for laboratory services. Regional Board staff will be conducting continuous water quality monitoring in each of the watersheds using continuous monitoring probes and collecting samples for bacteriological analysis in areas where there is water contact recreation.
San Francisco Bay Region 23 January 2002

Conducting rapid bioassessments with concurrent measurement of basic water quality parameters and visual physical habitat assessments is the framework of our watershed monitoring program and considered Tier 1 of the program. Continuous monitoring devices will be used to measure basic water quality parameters (dissolved oxygen, pH, temperature, and conductivity), and will be deployed at a few representative sites in each watershed. These field measurements, as well as flow, will be measured whenever possible as available labor and equipment allow. Paired watersheds that are close geographically, and have similar land use and geology were chosen for monitoring. Funding for monitoring is from a combination of Regional Board, California Coastal Conservancy, and National Park Service efforts.
Tier 2 of the design was developed to answer basic questions concerning protection of beneficial uses and potential impacts of land use and water management. There are 33 tier 2 stations that are a subset of approximately 80 tier 1 stations. At tier 2 stations samples will be collected during two or three hydrologic cycles as described above. Additional parameters that will be monitored include conventional water quality parameters (e.g., nutrients), toxicity (using the U.S. EPA three species tests), and water column chemistry for toxic metal and organic pollutants. A subset of Tier 1 stations will be selected for Tier 2 physical measurements, such as pebble counts and longitudinal profile, to augment the Tier 1 visual physical assessments and more precisely interpret rapid bioassessment information.
At the bottom of each watershed in the non-tidal area we will have one station, the integrator station, that will integrate the contaminant conditions in the waterbody and determine which contaminants from that waterbody flow into the receiving waters. At these stations, Corbicula will be deployed for bioaccumulation measurements and sediment samples will be collected for toxicity analysis, using Hyalella, grain size analysis and sediment chemistry. Clams will be deployed and collected during the period of April-October. Sediment and any other samples will be collected when the clams are collected. Regional Board staff will collect samples for total and fecal coliforms and E. coli at 14 of the tier 2 stations where there is water contact recreation and/or there are potential sewage inputs. Fish tissue from commonly fished reservoirs and lakes will be analyzed for bioaccumulative contaminants, supplementing the state’s Toxic Substances Monitoring Program where appropriate.
In addition to SWAMP, we participate in several focused monitoring efforts for San Francisco Bay. The primary ongoing monitoring effort within the San Francisco Bay Region is the San Francisco Estuary Regional Monitoring Program for Trace Substances (RMP). This $2.8 million effort is funded entirely by over 70 of the major dischargers in the Region. The program provides scientifically rigorous chemical and physical data for water, sediment, and biota. The RMP’s objectives include: describing patterns and trends in contaminant transport; describing pollutant general sources, pathways, and loadings; and measuring contaminant effects on the Bay’s ecosystems. Information from the RMP is critical to the development of several TMDL’s for San Francisco Bay.
Numerous other state and federal monitoring and research programs are currently taking place in the Bay. State programs include the Mussel Watch Program for bioaccumulation of contaminants by resident and deployed bivalves, the Toxic Substances Monitoring Program which measures the contaminant load in fish in freshwater systems, the Interagency Ecological
San Francisco Bay Region 24 January 2002

Program which conducts ecological studies in the Bay/Delta, and CALFED which conducts studies in the San Francisco Bay watershed down to San Pablo Bay to guide restoration of the Bay/Delta system.
Federal programs currently conducting research and monitoring in the Bay include the U.S. Geologic Survey, which conducts numerous ongoing research and monitoring programs. NOAA’s Status and Trends Program will be conducting studies, mainly on sediment quality, from 2000-2002. There is also a limited amount of ongoing monitoring of urban creeks by various municipal storm water agencies and citizens’ volunteer monitoring programs. Local universities also conduct some studies in the Bay.
Since so many research and monitoring programs are currently taking place in the Bay, Regional Board staff created a Monitoring and Assessment Integration Team to facilitate coordination and integration of studies, identify and fill data gaps, and ensure that the information needed to make management decisions is collected in a thorough and efficient manner. The Team is currently meeting on an as-needed basis since its original communication mission has been successfully completed.
Monitoring Coordination
Coordination and integration of the large number of monitoring efforts are critical to understanding what data are available and to identify data gaps. Of particular importance is the coordination of urban runoff monitoring, volunteer monitoring programs, and the San Francisco Estuary Regional Monitoring Program. The Bay Area Stormwater Management Agencies Association (BASMAA), Bay Area Clean Water Agencies (BACWA) and Western States Petroleum Association (WSPA), have signed an MOU for monitoring to develop loading estimates for TMDLs. The focus will be on in-Bay and watershed-related pollutants that are impairing the Bay. Also, a Watershed Assessment Resource Center is being developed with funding from a 319(h) grant to provide a forum for coordinating volunteer monitoring efforts. The Center will help local agencies and community groups institute monitoring and assessment protocols, provide technical assistance to new and ongoing watershed assessment programs, provide training and assist in developing interagency agreements, and develop a funding program to support the Center after completion of this project. We also continue to work with outside experts and stakeholders, such as the BASMAA Monitoring Committee.
San Francisco Bay Region 25 January 2002

D. Nonpoint Source Program
This section describes our Region’s nonpoint source-related water quality problems, our overall strategy to address these problems, an implementation framework, and specific tasks. The section focuses on specific implementation activities that are funded by USEPA’s Nonpoint Source Program resources. We target these resources to address priority problems where other resources are not available. However, addressing nonpoint source issues in the San Francisco Bay Region goes beyond the activities that are funded by EPA’s Nonpoint Source Program (NPS) resources. For example, we use resources from other core regulatory programs such as non-Chap 15 waste discharge requirements, enforcement, and basin planning to fund efforts that have been identified as priorities through our Watershed Management Initiative. We have also leveraged additional, outside resources to fund priority projects identified by staff. For example, nearly all of our fines levied from administrative civil liabilities are directed towards “supplemental environmental projects” (SEPs) within the watersheds where the violation took place. Since 1991 over $4 million has gone toward 85 projects in three categories: 1) education and outreach, 2) pollution prevention, and 3) restoration. In addition, this year the Board has begun working with dischargers who choose to support smaller SEPs as part of the State’s new Mandatory Minimum Penalties (SB 2165) program. In the past year, there were 39 mandatory minumum penalties in this region with a total fine number of $657,000. Of these, 18 spent $3,000 each on an SEP (the maximum allowed per fine), totaling $54,000.
Nonpoint Source Problems
Many waterbodies within our Region are impaired or threatened due to pollution from nonpoint sources. Table II.D.1 contains a list of these waterbodies and the pollutants of concern arranged by management measure category, as described in the “Plan for California’s Nonpoint Source Pollution Control Program” (2000). The primary causes of impairment or threat in the San Francisco Bay Region are from activities associated with agriculture, urbanization, and hydromodification. Accordingly, we have identified the following high priority Management Measures for our Region:
1) Facility Wastewater and Runoff from Confined Animal Facilities (1B, 1E, 1G); 2) Management Measures for Urban Areas (3.1-3.3, 3.6); and 3) Management Measures for Hydromodification (5.1, 5.3, 5.4)
Projected land use changes in the San Francisco Bay Area have the potential to intensify nonpoint source inputs into already impaired waterbodies. The two dominant land use changes in the region are new development and elimination of woodlands and open space for viticulture and development. The geographic areas where new development has the greatest impacts are Alameda, Contra Costa, Napa, Santa Clara, Solano, and Sonoma Counties. Changes in land use from open space to viticulture are primarily in Napa and Sonoma County and, to a lesser extent Marin County. The adverse impacts to beneficial uses associated with urbanization and land use conversions are:
1) Elimination of natural channels, including loss of wetlands, wildlife, fisheries and riparian habitat;
2) Increased sedimentation due to construction activities and land clearing;
San Francisco Bay Region 26 January 2002

3) Unmitigated changes in hydrology that upset the geomorphic equilibrium of streams, causing destabilization and erosion of channels, and more frequent flooding;
4) Increased pollutant loads associated with urban activities; 5) Impairment of fish habitat from water diversions and fish passage barriers due to
construction of in-channel reservoirs and diversion structures; and6) Increased pollutant loads associated with agricultural activity.
Nonpoint Source Strategy
Nonpoint source pollution is the leading cause of water quality impairment in California. California’s Nonpoint Source (NPS) Pollution Control Program has been in effect since 1988. In January 2000 the lead State agencies for the NPS program, the SWRCB and CCC in coordination with the RWQCBs, released the “Plan for California’s Nonpoint Source Pollution Control Program” (NPS Program Plan). The NPS Program Plan enhances the State’s efforts to protect water quality, and to conform to the Clean Water Act Section 319 (CWA 319) and Section 6217 of the Coastal Zone Act Reauthorization Amendments (CZARA) The State’s long-term goal is to “improve water quality by implementing the management measures identified in the California Management Measures for Polluted Runoff Report (CAMMPR) by 2013.” A key element of the Program is the “Three-Tiered Approach,” through which self-determined implementation is favored, but more stringent regulatory authorities are utilized when necessary to achieve implementation. In February 2000 the SWRCB and CCC submitted the NPS Program Plan to the USEPA and NOAA for federal approval. A condition for approval was a clear commitment by the RWQCBs to implement the NPS Program Plan as expressed in their WMI chapters. Because California’s efforts to control NPS pollution has been severely underfunded, an important part of the program implementation is a better articulation of each Region’s problems and resource needs. Information set forth in this document outlines the Region’s NPS efforts to deal with its NPS problems consistent with the NPS Program Plan and its resource needs.
Our Basin Plan includes a summary of adverse impacts from nonpoint source pollution on San Francisco Bay area water bodies and states our general approach to nonpoint source pollution management:
“The total amount of pollutants entering aquatic systems from these diffuse, nonpoint sources is now generally considered to be greater than that from any other source. Protecting the region’s aquatic systems from impacts associated with these diffuse sources is a long-term challenge and requires very different approaches than the control of pollutants from point sources.” (Basin Plan, p.4-28)
“(1) Changes in existing operating practices to minimize the potential for untreated wastes to reach aquatic systems; (2) collection and treatment of wastes; (3) prohibition of waste-generating practices…” (ibid.)
We have three long-term goals and associated short-term objectives to meet these goals for nonpoint source management. Table II.D.2 links the short-term objectives to the specific goals and to NPS management measures.
San Francisco Bay Region 27 January 2002

1) Encourage development and implementation of watershed management plans that address nonpoint source pollution by working within our office and with outside stakeholders throughout the San Francisco Bay Region.
2) Ensure effective implementation of high priority management measures for confined animal facilities, urban runoff, and hydromodification
3) Educate, inform, and provide technical assistance to the public, agencies, and private landowners and other interested parties about prevention and correction of nonpoint source pollution problems.
Our NPS Program is implemented through a three-tiered approach towards nonpoint source management. The three tiers are: 1)Tier One: Self-Determined Management Practices; 2) Tier Two: Regulatory-Based Encouragement; and 3) Tier Three: Effluent Limitations. Specific actions within the three tiers to achieve each of our NPS Program goals are discussed in the Specific Activities Section below. Within watershed management stakeholder forums we emphasize that commitment to self-determined management practices (Tier One) will preclude direct regulation. We encourage implementation of management practices through Tier Two, regulatory-based encouragement, by using waivers of waste discharge requirements if management practices are implemented. We initiate enforcement actions or WDRs (Tier Three) if necessary.
The three-tier approach is dependent on our ability to communicate the benefits and consequences of each tier, particularly the regulatory consequences. We have learned from our experiences that Tier One does not work without the presence of regulatory encouragement or direct regulation, except where commitment to stewardship occurs within the watershed management approach. At this time there are no definitive triggers that cause us to shift from one tier to another. However, our Board strongly supports the use of enforcement as an incentive for compliance. We have taken high profile enforcement measures against egregious dischargers, which have served as key examples to others in the community that we are serious about compliance.
The evolving importance of Total Maximum Daily Loads (see Section III.K TMDLs) for pollutants causing impairment of waters provides further cause to strengthen our use of the three-tier approach and attainment of our NPS Program goals with particular emphasis on effective watershed management. Most of our impairment problems are due to nonpoint sources. Consequently, we have two choices: 1) preclude the need for a TMDL by solving the nonpoint source problem through optimum use of the three-tier approach (i.e., if the problem is solved we won’t need to do a TMDL); or 2) establish a TMDL and implementation plan with its associated regulatory requirements.
Specific Activities
Our Nonpoint Source Program resources are distributed among our three geographic-based Watershed Management Division sections. In general, the same staff person(s) within a watershed management area is responsible for watershed management activities, outreach
San Francisco Bay Region 28 January 2002

activities, specific nonpoint source issues (urban runoff, confined animal facilities, etc.), volunteer monitoring, and contract management.
We also coordinate our NPS activities with the California Coastal Commission (CCC). Specific activities on which we will continue to coordinate include:1) Development of runoff-specific tracking elements for the CCC’s Permit Tracking System
and Wetlands Tracking System to establish a connection between land uses, management measure implementation, and water quality impacts.
2) Development of model languages for preventing and controlling polluted runoff in Local Coastal Programs and Coastal Development Permits in order to build the appropriate NPS management mechanisms and measures for implementation into local programs and the CCC’s permitting function.
3) Development of educational information on polluted runoff and organization of workshops and forums.
We are also working with the San Francisco Bay Conservation and Development Commission (BCDC) on issues related to San Francisco Bay marinas, including permitting conditions, marina monitoring proposals, and educational and outreach efforts.
Tier One ActivitiesActivities that occur within the Tier One include education, outreach, and technical assistance efforts. These activities are summarized in Table II.D.3. Our efforts to target projects for financial assistance are also within Tier One. These projects include 319(h) grants, State Revolving Fund projects, and Prop 13 Water Bond funding. Table II.D.4 lists targeted projects for potential funding from these three sources. Staff also continues to work with the Natural Resource Conservation Service (NRCS) and RCDs to establish priority projects for receipt of federal Environmental Quality Incentives (EQIP) funding. In the Sonoma-Marin Area, projects receiving preferential consideration for EQIP funding include reducing animal waste from entering waterways, reducing soil erosion and sedimentation of waterways, and working to improve riparian buffer zones. In 2000 and 2001 a total of 18 contracts were approved for funding in Region 2, including eight dairies, eight livestock ranches, and two vineyards. NRCS anticipates funding approximately seven additional contracts for 2002.
Tier Two ActivitiesTier Two activities play a vital role in our efforts to ensure effective implementation of land-use specific management measures; these activities include regulatory incentives and discharge waivers. In accordance with Board Resolution 83-3, general and individual waivers of WDR have been issued for many NPS-related activities where appropriate Best Management Practices are implemented, including dredging operations, small construction and new development projects, confined animal facilities, food processing wastes spread to land, industrial wastes used for soil amendments, timber harvesting, winery operations, and irrigation water return.
The Implementation Plan section of our Basin Plan contains our strategy for implementation of management measures for urban areas that are not covered by NPDES permits. The strategy states that municipalities are expected to implement urban runoff control programs, and they are required to submit annual reports to the Board that describe their programs and evaluate their effectiveness. If effective implementation is not realized in this manner, the strategy identifies San Francisco Bay Region 29 January 2002

additional regulatory mechanisms, including consideration of WDRs that would require implementation of urban runoff control programs.
A Tier Two approach has also been in effect for animal confinement operations, including dairy waste management. The Board has waived waste discharge requirements for operations that implement management practices that have been identified by the Sonoma-Marin Animal Waste Management Committee and are in conformance with Chapter 15 regulations. Our approach includes inspection of operations to verify implementation. Currently, our efforts have been focused on dairy operations and some poultry operations. In the future, (FY 2002/03 and beyond) we intend to expand our efforts to other confined animal operations such as equestrian facilities.
Oversight of onsite disposal systems is another area where we are implementing a Tier Two approach. As described in the Basin Plan, our approach provides for waivers of WDRs for systems that are in conformance with the Board’s “Minimum Guidelines for the Control of Individual Wastewater Treatment and Disposal Systems” (Minimum Guidelines) adopted by Resolution No. 79-5. The Board has also entered into Memoranda of Understanding (MOUs) with counties that recognize local agency responsibility for over seeing onsite disposal systems. We now recognize the need to update the Minimum Guidelines, to develop and revise the county MOUs and to improve tracking of onsite system management measures. Tier Three ActivitiesDespite our efforts to promote self-determined implementation of management practices and to provide regulatory encouragement, we often need to focus our nonpoint source program activities in the third tier. Since 1992, we have taken over 30 enforcement actions against non-compliant dairy facilities. This includes 5 Administrative Civil Liabilities, 8 Cleanup and Abatement Orders, 8 Notices of Violation, 2 Notices To Comply, 5 requests for Reports of Waste Discharge (ROWDs), and 5 District Attorney Office referrals. Dairy facilities that have demonstrated an inability to meet State standards will continue to be required to submit ROWDs and will be issued permits.
Similarly, we have had to take numerous enforcement actions against new development and other construction related activities, despite ambitious education and outreach efforts targeting local municipal government agencies, as well as the construction industry.
Statewide ActivitiesWe actively participate in statewide activities as part of the nonpoint source program. These include: 401 Certification roundtable, Urban Runoff Task Force, GIS roundtable, Monitoring Roundtable, and Nonpoint Source Program roundtable. We are involved in the 319(h) grant projects Request for Proposal preparation and subsequent review and selection of submitted projects. We have taken a leadership role statewide in the development of policy and implementation actions on hydromodification and urban runoff. We are also involved in the development of strategies in collaboration with the Department of Pesticide Regulation to prevent and correct water quality problems associated with urban uses of pesticides.
San Francisco Bay Region 30 January 2002

Monitoring, Assessment, and Implementation Tracking
The goals of out monitoring and assessment efforts for nonpoint sources are to define issues, set priorities, and evaluate effectiveness of pollution prevention and control actions. We are fortunate to have the San Francisco Estuary Regional Monitoring Program (RMP) to regularly monitor and assess the San Francisco Bay segments. Our Regional Monitoring and Assessment Strategy (RMAS) focuses on surface water bodies other than the San Francisco Bay segments including the Surface Water Ambient Monitoring Program (SWAMP), which is described in detail in Section II.C Monitoring and Assessment of this chapter.
We are currently tracking implementation of specific management measures through several mechanisms. We track implementation of management measures for urban areas by requiring submittal of annual storm water program reports by municipalities. We directly track implementation of management measures at confined animal operations by inspecting dairies. We also have an active field presence to observe hydromodification management measures. We also indirectly track management measure implementation throughout the Region through regular communication with Resource Conservation Districts and through participation on watershed management forums. In the future, (FY 2002/03 and beyond) we intend to establish a more comprehensive implementation tracking strategy.
Resource AllocationIn order to meet our goals and objectives, we have identified priority tasks and resource allocations for FY 2002/3 (Table II.D.5) and for proposed resource allocations through FY 04/05 (Table II.D.6). They are organized by categories to match our goals and our linked to specific management measures.
San Francisco Bay Region 31 January 2002

Table II.D.1. Regional Nonpoint Source Problems by Management Measure CategoryPollutant(s) impairing or threatening Beneficial Uses Arranged by Management Measure CategoryWATERSHED
/WATERBOD
Y
AGRICULTURE
SILVICULTURE URBAN MARINAS/
REC BOATING
HYDROMO-DIFICATION
San Francisco Bay RegionwideSouth SF Bay, Lower SF Bay, Central SF Bay, Richardson Bay, San Pablo Bay, Carquinez Strait, Suisun Bay, Delta
pesticidesselenium
coppermercurynickelPCBspesticides
Richardson Bay coliformUrban Creeks diazinonAlameda CountyAlameda Creek nutrients
sedimentdiazinonsediment
sediment
San Lorenzo Creek
sediment diazinon sediment
Contra Costa CountyAlhambra Creek
sediment sediment sediment
Walnut Creek diazinon sedimentMarin CountyLagunitas Creek
nutrientspathogenssediment
Walker Creek pathogenssediment
Tomales Bay nutrientspathogenssediment
pathogens
pathogens .
Napa CountyNapa River nutrients
sedimentsediment sediment sediment
San Mateo CountyButano Creek,Pescadero CreekSan Gregorio
sediment sediment
San Francisquito Creek
sedimentnutrients
diazinon sediment
Santa Clara CountyAdobe CreekCalabazas
diazinon sediment
San Francisco Bay Region 32 January 2002

Table II.D.1. Regional Nonpoint Source Problems by Management Measure CategoryPollutant(s) impairing or threatening Beneficial Uses Arranged by Management Measure CategoryWATERSHED
/WATERBOD
Y
AGRICULTURE
SILVICULTURE URBAN MARINAS/
REC BOATING
HYDROMO-DIFICATION
CreekCoyote Creek Guadalupe RiverMatadera CreekStevens CreekSolano CountySuisun Marsh Wetlands
nutrientsorganic enrichment
metalsnutrients
Sonoma CountyPetaluma River nutrients
pathogenssediment
sediment sediment
Sonoma Creek nutrientspathogenssediment
sediment sediment sediment
San Francisco Bay Region 33 January 2002

Table II.D.2 Nonpoint Source Program Short Term Objectives
Objective
Goa
l
FY 0
2/03
FY 0
3/04
FY 0
4/05
FY 0
5/06
Management Measures
Funded in FY 2002/2003
Achieve pollution reduction from nonpoint sources through watershed management efforts (e.g., Napa River, Petaluma River, Sonoma Creek, Tomales Bay, Santa Clara Basin)
123
x x x x 1 E, 3.1 A-C, 3.6, 5.1, 5.2, 5.4
Yes
AgriculturePromote cooperative efforts among dairy producers and ranchers
2 x x 1B, 1E Yes
Support outreach programs for dairy producers and ranchers
23
x 1B, 1E No
Increase awareness of regulatory requirements among dairy producers and ranchers
23
x x x x 1B, 1E Yes
Foster interagency coordination on CAFOs and grazing issues
2 x x x x 1B, 1E Yes
Implement watershed monitoring efforts to evaluate effectiveness of BMP’s at CAFOs
12
x x x 1B No
Urban AreasOversee implementation of non-NPDES permitted urban runoff programs
23
x 3.1(A), 3.1(B), 3.1(C) Yes
Develop consistent regional approach for operating onsite disposal systems (OSDS)
13
x x 3.4(A), 3.4 (B) Yes
Improve coordination between regional and local agencies for OSDS
13
x x 3.4 (A), 3.4 (B) Yes
Provide assistance to local agencies to ensure onsite disposal systems do not pollute surface & GW
13
x x x x 3.4 (A), 3.4 (B) Yes
Provide financial and technical assistance for “alternative” onsite disposal systems
3 x x x x 3.4 (A), 3.4 (B) Partial
Marinas and Recreational BoatingDetermine baseline water quality conditions at all marinas to allow assessment of BMP effectiveness
1 x x 4.1(A) No
Provide for adequate waste 1 x 4.1 (G), 4.2 (F) No
San Francisco Bay Region 34 January 2002

Table II.D.2 Nonpoint Source Program Short Term Objectives
Objective
Goa
l
FY 0
2/03
FY 0
3/04
FY 0
4/05
FY 0
5/06
Management Measures
Funded in FY 2002/2003
handling facilitiesWork with BCDC to develop marina outreach
3 x x 4.3(A) Yes
HydromodificationStreamline regulatory process for hydromodification permits
2 x 5.4(A) Yes
Promote public/private, state/local partnership for stream protection
2 x x x x 5.4(A) Yes
Establish stream protection policy
2 x x 5.1 (B), 5.3(A), 6(A), 6(B)
Yes
Improve knowledge of sediment nonpoint source pollution impacts to water quality
3 x x x x 5.3(A) Partial
Outreach/EducationUtilize citizen monitoring to help gauge the health of watersheds
23
x x x x 1(G), 3.6, 5.4(A) Partial
Target projects for 319(h) grants with high potential for success of implementing nonpoint source controls
3 x x x x 1(G), 3.6, 5.4(A) Yes
Participate in public forums, technical advisory committees, and watershed management stakeholder groups that are action-oriented towards resolving nonpoint source problems
123
x x x x 1(G), 3.6, 5.4(A) Yes, partial
Goals: 1. Facilitate implementation of watershed management plans for prevention and control of
nonpoint source pollution throughout the San Francisco Bay Region.2. Ensure effective implementation of high priority land-use specific nonpoint source
pollution management measures throughout the San Francisco Bay Region.3. Educate, inform, and provide technical assistance to the public, public agencies, and
private landowners and other interested parties about prevention and correction of nonpoint source pollution problems.
San Francisco Bay Region 35 January 2002

Table II.D.3. Education, Outreach, and Technical AssistanceAgricultural (Confined Animal Facilities)
Participate with stakeholder groups and other government agencies such as the Sonoma-Marin Animal Resource Committee (SMARC), NRCS EQUIP Program, and California Dairy Quality Assurance Program. (CDQAP).
Provide technical assistance to stakeholder groups and landowners.
Provide funding assistance through our Board’s Supplemental Environmental Projects (SEP) program. SEP have included development of ranch conservation plans, erosion and sediment control projects, stream restoration projects, fencing out livestock from waterways, evaluating the effectiveness of alternative waste management systems, and water quality monitoring.
Project involvement and contract management of a Proposition 13-funded dairy BMP implementation.
Agricultural (Vineyard Development)
Participate with stakeholder groups, including involvement and contract management of 205j and 319h grants for development and implementation watershed management plans.
Provide technical assistance to stakeholder groups through locally sponsored workshops.
Urban Areas
Meet with municipalities within Marin, Napa, Sonoma, and Solano Counties to coordinate implementation of urban storm water programs; review annual reports; presentations to stakeholders.
Work with BASMAA New Development Committee and other government agencies in developing new development guidance and policy.
Conduct construction and erosion control workshops for local municipal staff and contractors
Hydromodification
Continue working with BASMAA Operational Permits Committee, local flood management districts and public works agencies, and Caltrans to implement BMPs for channel maintenance activities.
Develop a Stream Protection Policy to protect stream functions to preserve and enhance beneficial uses. BMP guidance is being developed to provide recommendations for adequate setbacks from creeks, appropriate side slope design, reservation of adjacent floodplains for non-structural uses, and adequate measures to promote water retention and otherwise minimize degradation to the overall stream system.
We will continue providing technical assistance to stakeholder groups through locally sponsored workshops on fluvial geomorphology and stream restoration techniques.
Work with Statewide Hydromodification Workgroup on regional workshops and statewide hydromod. seminar
Marinas and Boating
Work with Bay Conservation and Development Commission to provide technical support for marina permitting, monitoring and education
San Francisco Bay Region 36 January 2002

Table II.D.4. Targeted Projects for Potential Funding Potential Funding Sources: NPS Implementation USEPA 319(h), State Water Bond (Prop. 13), and State Revolving Loan Funds (SRLF)
Region 2 priority projects for 319(h) and State Water Bond funding should provide scientifically demonstrable water quality improvements and should have a high likelihood of success. The following projects appear to meet these criteria and may be considered for funding.
Table II.D.4. Targeted Projects for Potential Funding
Project Description Watershed/Waterbody
Outcomes/Products
Potential Lead Group(s)
Potential funding
source(s)Geomorphology assessment, monitoring, habitat restoration, education & outreach, technical support.
Walker Creek,
Marin County
Assessments, erosion control projects, BMP implementation
Marin RCD, UC Extension, Tomales Bay Watershed Council
319 (h)Prop 13
Assessment of limiting factors for salmonid habitat, implementation of Best Management Practices
Lagunitas Creek watershed, Marin County
Assessments, projects
Tomales Bay Watershed Council, Marin RCD
319 (h)Prop 13
Implement and demonstrate effectiveness of vineyard erosion BMPs
Napa River Watershed, Napa County
BMP implementation; Report on effectiveness
Napa County, Napa RCD
319(h)
Implementation of sediment and nutrient source reduction BMPs, habitat restoration, education & outreach, and technical support
Napa River Watershed, Napa County
Reports, educational materials, load reductions, BMPimplementation
Napa RCD, Napa County
319(h) Prop 13
Implementation of watershed restoration plan to address impairment due to sediment
Pescadero Creek San Mateo County
Salmonid habitat restoration projects
San Mateo RCD, Cities and County
319(h)Prop 13
Implement BMPs to reduce mercury impairment
Guadalupe RiverSanta Clara County
Implementation of mercury reduction BMPs
Santa Clara County, municipalities
319(h)Prop 13SRLF
Implementation of the Sonoma Creek Watershed Enhancement Plan; implementation of appropriate BMPs, volunteer monitoring, habitat restoration, education & outreach, technical support
Sonoma CreekSonoma County
BMP implementation;Implementation of the Sonoma Creek Plan
Sonoma Ecology Center, So. Sonoma RCD
319(h)Prop 13
Working to protect riparian corridors; restoration projects
Baxter Creek, El Cerrito
Restoration projects
Friends of Baxter Creek
319(h)Prop 13
Removing concrete , restoring the creek and using upstream retention basins to address
Pinole Creek, Pinole
Restoration projects
Friends of Pinole Creek
319(h)Prop 13
San Francisco Bay Region 37 January 2002

Table II.D.4. Targeted Projects for Potential Funding
Project Description Watershed/Waterbody
Outcomes/Products
Potential Lead Group(s)
Potential funding
source(s)flooding concernsRestoration integrated with flood control. In cooperation with County Supervisor Gioia’s office, County Public Works Department, and Urban Creeks Council
Wildcat Creek and San Pablo Creek
Restoration projects
Wilcat Creek/San Pablo Watershed Awareness Group
319(h)Prop 13
Restoration projects planned Refugio Creek Restoration projects
319(h)Prop 13
Education and fostering of community awareness and involvement in protection of the watershed; citizen monitoring; restoration
San Pablo Creek Educational materials
San Pablo Watershed Awareness Group
319(h)Prop 13
Creek restoration projects; wildlife habitat (butterfly) restoration/enhancement projects
Crockett Restoration projects
Carquinez Regional Environmental Education Center
319(h)Prop 13
Restore Gallindo Creek floodplain and natural functions by buying properties adjacent to the creek, and demolishing to create floodplain
Gallindo Creek, Pleasant Hill
Restoration projects, land acquisition
City of Pleasant Hill
319(h)Prop 13SRLF
Through public process involving residents and stakeholders in the watershed, develop a watershed management plan that restores, maintains, and protects the WS
Kirker Creek, Pittsburg
Watershed management plan
Kirker Creek Watershed Management Plan
Prop 13
Creek restoration Green Valley Creek and Sycamore Creek, San Ramon
Restoration projects
319(h)Prop 13
Community education of mostly private homeownership watershed, large capital improvement creek restoration projects
All Lafayette area creeks
Restoration projects, educational materials
Friends of Lafayette Creeks
319(h)Prop 13SRLF
Protect watershed in order to maintain water quality in the San Pablo Reservoir.
Watershed lands East Bay Municipal Utility District (EBMUD)
319(h)Prop 13SRLF
Develop a restoration strategy for the watersheds of Contra Costa County. Compile an overview of watershed issues and main structural improvements to restore WQ
Entire county Restoration projects
County-wide Watershed Protection Program
319(h)Prop 13
Implementation of written Watershed Management Plan; restoration/flood control projects; public outreach and education
Alhambra Creek, Martinez
Restoration projects
Friends of Alhambra Creek
319(h)Prop 13
Update and implement plans Lower Walnut Restoration Walnut Creek 319(h)
San Francisco Bay Region 38 January 2002

Table II.D.4. Targeted Projects for Potential Funding
Project Description Watershed/Waterbody
Outcomes/Products
Potential Lead Group(s)
Potential funding
source(s)developed in the early 1990s, for restoration of Walnut Creek. Restoration of the lower reach; possible funding from the US ACE; purchase of the floodplain and channel modification; remove Drop Structure No. 1.
Creek watershed projects, capital improvement projects
Restoration Prop 13
Several varied projects, including removal of invasive species, creek clean-up, creek restoration, citizen education
Walnut Creek, with Focus on Upper Walnut Creek Watershed
Restoration projects
Friends of Walnut Creek
319(h)Prop 13
Purchase and preservation of open space surrounding the Pine Creek Detention basin
Pine Creek Watershed
Land acquisition Prop 13SRLF
Mapping and watershed characterization; development of a citizen volunteer monitoring program to generate usable and defensible data for local government and the Regional Board
County-wide Data collection and information; maps
Contra Costa Watershed Forum
319(h)Prop 13
Develop and implement environmental engineering curriculum; train students in water quality monitoring ;collect usable and defensible water quality data
Danville, San Ramon; greater Walnut Creek watershed
Environmental curriculum, water quality data
San Ramon Valley High School Environmental Engineering (E2) Academy
319(h)
Wetlands Restoration and Preservation (cleanup, buffer zones, purchases, BMPs) Purchase of diked baylands
site(s) for restoration and habitat enhancement
Increase wetlands acreage
Bel Marin Keys, Novato, Marin County
Restoration projects, land acquisition
Audubon Society, Coastal Conservancy, Fish and Game
SRLF
Comprehensive Watershed Analysis and Restoration Plans to Protect Threatened and Endangered Salmonids Scientifically based priority
list of potential restoration measures
Coordination of Clean Water Act and Endangered Species Act regulatory planning decisions (in listed basins)
Priority I: Lagunitas Creek, Redwood Creek, San Gregorio Creek, Sonoma Creek, San Pedro Creek ,Alameda Creek, Upper Penitencia Creek, San Francisquito Creek. Priority II: Petaluma River, San Leandro and Redwood Creeks
Watershed and restoration plans
Various local agencies, Coastal Conservancy, watershed stakeholder groups, etc.
SRLF
San Francisco Bay Region 39 January 2002

Table II.D.4. Targeted Projects for Potential Funding
Project Description Watershed/Waterbody
Outcomes/Products
Potential Lead Group(s)
Potential funding
source(s)upstream of San Leandro reservoir, Green Valley Creek, Suisun Creek, Huichica Creek, Stevens Creek, Permanente Creek.
Address beach/shellfish area closings Development of assessment
and remediation strategy for on-site septic systems and funding for system upgrades/community system(s)
Tomales Bay, Marin County
County of Marin, County of San Mateo, local municipalities
SRLF
Reduce polluted runoff from confined animal facilities Implementation of water
quality improvement practices for animal waste control, construction of barns, riparian buffers and offstream watering
Regionwide BMP practices in place
RCDs, landowners SRLF
San Francisco Bay Region 40 January 2002

Table II.D.5 Proposed FY 2002/03 Resource Allocation
Task Product Management Measure(s)
Geographic Area
Funding Source
Cost PYs/Dollars
NPS Program Management
Progress reports, FY 03/04 workplan,5yr plan
All Regionwide18050001-18050006
Fed-319 0.7 PY$79,330
Contract Management
Educational materials, reports, projects
All Regionwide18050001-18050006
Fed-319 1.4 PY$158,660
Outreach and education
Status reports, presentations, fact sheets
All Regionwide18050001-18050006
Fed-319 0.3 PY$33,998
Hydromodi-fication
WDRs, stream alteration reviews
5.1, 5.3, 5.4 Regionwide18050001-18050006
Fed-319 0.4 PY$45,332
Confined Animals
Inspections, assessments, WDRs, enforcement
1B, 1E, 1G 18050002, 18050005
Fed-319 0.5 PY$56,665
Urban Runoff Stormwater reports, annual reviews, urban runoff mgmnt plans
3.1, 3.2, 3.3, 3.6
18050001 - 18050006
Fed - 319
0.5 PY$56,665
Total staff cost
3.8 PY$430,651
San Francisco Bay Region 41 January 2002

Table II.D.6 NPS Resource Needs 2002/03 Through 2004/05
Task Product Management Measure(s)
Geographic Area
State Fiscal Year
Est. Cost PYs/Dollars
NPS Program Management
Progress reports, workplans, interagency meetings
All Regionwide
18050001-18050006
02/03 – 04/05
0.7 PY$79,330per year
Contract Management
Educational materials, reports, projects
All Regionwide18050001-18050006
02/03 – 04/05
1.4 PY$158,660per year
Outreach and education
Status reports, presentations, fact sheets
All Regionwide18050001-18050006
02/03 – 04/05
2.0 PY$226,658per year
Hydromodi-fication
WDRs, stream alteration reviews
5.1, 5.3, 5.4 Regionwide18050001-18050006
02/03 – 04/05
2.0 PY$226,658per year
Confined Animals
Inspections, assessments, WDRs, enforcement
1B, 1E, 1G 18050002, 18050005
02/03 – 04/05
1.5 PY$169,993 per year
Urban Runoff WDR implementation
3.1, 3.2, 3.3, 3.6
18050001 - 18050006
Fed - 319 2.0 PY$226,658per year
Total staff costneeded
9.6 PY$1,087,958
San Francisco Bay Region 42 January 2002

E. Wetlands and Stream Protection
Wetlands and Waterway Protection and Management were included as two of the fourteen regional priority issues identified by Board staff during the development of the WMI. These issues were combined into one category of Wetlands and Stream Protection in our update of priorities in November 2001. Wetlands and streams (which include rivers, creeks, sloughs, intermittent and ephemeral drainages; note in this section the terms “streams” and “creeks” may be used interchangeably) are closely linked both in topographic location and in ecological function. In turn, streams and wetlands are physically and biologically linked to the adjacent uplands. To effectively protect beneficial uses of waters of the state, we must better understand and manage the functions of, and links between, streams, wetlands, and uplands, and develop ways to use our regulatory and planning tools to protect their beneficial uses more effectively.
Regional Framework for Protecting Wetlands and Streams
Wetlands policy and program development are guided by the California Wetlands Conservation Policy (Executive Order W-59-93); the CWA §404(b)(1) guidelines (adopted into the Basin Plan in 1995); the Senate Concurrent Resolution No. 28, and the California Water Code Section 13142.5, which is incorporated by reference into our Basin Plan. An additional and important guidance document for wetlands is the Comprehensive Conservation and Management Plan (CCMP; Estuary Project 1994).
The Regional Board regulates activities affecting wetlands and streams under both Federal and State law. Federal law (CWA §404 and §401) requires most federally permitted activities to obtain Water Quality Certification (WQC) from the State signifying that the proposed activity complies with State water quality standards. State law allows the Regional Board to regulate any discharge that could adversely affect a water’s designated beneficial uses. Our primary mechanisms for doing this include taking enforcement actions for violation of water quality objectives or discharge prohibitions, and issuing Waste Discharge Requirements (WDRs). Staffing limitations restrict our ability to take significant and timely enforcement actions for illegal activities in wetlands and creeks, and often the ecological functions of the waterbody cannot be effectively restored.
Until recent years, WDRs were primarily used to regulate discharges of liquid waste to land (e.g., treated groundwater, septic effluent, etc.). We are increasing the use of WDRs to regulate discharges of waste (including fill material, sediment, and changes in flow) to waterways. Staff has developed draft general WDRs for channel maintenance (see Nonpoint Source Program Section for more detail). As we increase our understanding of the links between impacts to land and the functions of uplands, creeks, and wetlands, we will continue to seek better ways to use WDRs, including more general permits for specific classes of activities or activities within a specific watershed.
Although WQCs and WDRs are our fundamental regulatory tools, there are many other ways in which the Regional Board protects and helps improve management of wetlands and creeks. We participate in site cleanup and restoration efforts, generate monitoring data and standards, and provide public education. We also have developed programs to look at other priority issues related to wetlands and streams, such as mercury, watershed monitoring and assessment, urban runoff and new development, and erosion and sedimentation. Each division manages several
San Francisco Bay Region 43 January 2002

programs with links to wetlands and/or stream protection, some of which are listed below. An important objective of the Wetlands and Stream Protection Program is to help define the links between these diverse programs and clarify the ways that each can contribute to improve protection of beneficial uses.
Regional Board programs related to Wetlands and Stream Protection:
Planning and Policy Division Mussel watch (monitoring and assessment of wetlands) Regional Monitoring and Assessment Strategy (monitoring and assessment of creeks) State Water Ambient Monitoring Program (SWAMP) San Francisco Estuary Regional Monitoring Program (water quality monitoring of Bay
and Estuary) Total Maximum Daily Loads – sediment, pesticides, PCBs, mercury, copper, nickel,
pathogens Basin Plan Amendments (currently proposed are a Stream Protection Policy and a
Wetland Monitoring Program for mitigation projects).
NPDES Permits Division Pollution Prevention Program (pollution prevention plans, public education) Permits including waterway protection
Groundwater Protection and Waste Containment Division Department of Defense Section (WQCs, creek and wetland cleanup, restoration, and
monitoring)
Watershed Management Division Water Quality Certifications and Waste Discharge Requirements (regulate fill and other
activities impacting beneficial uses of creeks and wetlands), including data management. It should be noted that processing and taking appropriate action on requests for WQCs requires substantially more resources than provided. There are currently approximately 20 staff that do WQC work at least some portion of their time. We estimate that approximately 7 PYs spent on WQC related activities office-wide, and we are currently budgeting 2.4 PYs for this task. New Federal legislation may significantly impact the way that we are required to process WQC applications, and may result in increased staff time requirements.
Urban Runoff Program (municipal NPDES permits protect creeks and wetlands through control of pollutants, sediment, and changes in hydrographs)
Nonpoint Source Program (regulate adverse impacts to creeks from agriculture and forestry practices, outreach through watershed councils and stakeholder forums)
Wetlands Monitoring Program (develop protocols, establish regional monitoring program in collaboration with CALFED)
Field Team/Environmental Compliance Section (enforcement of Basin Plan and permit violations) and erosion control program
Wetlands and creeks are closely linked in the environment and through our regulatory programs, but our planning approaches in each of these areas have advanced differently. Wetlands received significant focus for a number of years in the 1990’s because of several state and federal mandates and associated funding. As a result, our Wetlands Program developed rapidly during
San Francisco Bay Region 44 January 2002

that period, guided by state and federal directives. In contrast, our efforts in creek protection and planning were driven by staff recognition of deficiencies in the existing programs for providing adequate protection of these important systems. The following sections describe our Wetlands and Stream Protection programs in more detail.
Wetlands ProgramWetlands Program Goals
The ultimate goals of our wetlands program are protection, enhancement and restoration (increase) of wetlands habitats within our region. Wetlands and related habitats comprise some of the San Francisco Bay Region’s most valuable natural resources. They provide critical habitat for hundreds of species of fish, birds, and other wildlife; they also improve the overall water quality in the Region, help control flooding, provide open space, offer recreational opportunities, and provide filtration and purification of pollutants. The Baylands, that area bayward of the natural historic tideline, comprise a large percentage of the existing wetland resources, as well as most of the potentially restorable wetlands within our Region, and they are critical to the survival of several endangered fish and wildlife species. The largest remaining tidal wetland in California is the Suisun Marsh in Suisun Bay (over 72,000 acres). In the South Bay, the San Francisco Bay National Wildlife Refuge protects over 19,000 acres of wetlands.
Wetlands have also been under severe threat from development since the San Francisco Bay Area began its rapid population expansion in 1850’s, and it has been estimated that over 80% of the estuary’s wetlands have been filled since that time. In spite of significant new proposed wetland restoration projects, such as Hamilton Air Force Base in Marin County, and acquisition of existing wetlands such as Bair Island in the South Bay, wetlands remain under threat from development and pollution and from a lack of successful regional planning efforts.
In the late 1990’s USEPA led the effort to develop the Baylands Ecosystem Habitat Goals (1999). The Habitat Goals provide a picture of the types, amounts, and distribution of habitats needed within the Baylands to support healthy and diverse populations of fish and wildlife. The Habitat Goals also provide considerable additional information on the desired characteristics, design, and management of healthy wetlands habitats. In 2001 we completed the Baylands Ecosystem Species and Community Profiles, the technical compendium to the Habitat Goals Report. For the coming years, one of our primary objectives in wetlands planning and protection will be to facilitate implementation of the Habitat Goals.
A concern among the agencies and wetland advocates is that uncoordinated efforts to “implement the Goals” may result in creation of sub-optimal restored habitats, and no long-term support for creating (in the correct locations) and managing some critical habitats, such as shallow open water habitat (salt ponds), and seasonal ponds. To address this, some of the agencies are pursuing a coordinated effort to develop a long-term Regional Wetlands Recovery Program. Because of lack of sufficient staffing, we have not participated in that effort in the last two years. However, we consider this effort to be important and hope to be able to reinitiate our participation and support at some point in the future. Given sufficient funding, we would also like to establish an internal “Baylands Advisor” position to assist staff with review of projects within or near the Baylands. The baylands advisor would help interpret the Habitat Goals, as they may be relevant to the project, and help identify monitoring needs and project coordination issues. The baylands advisor would also help centralize information on pending Baylands projects and feed it back into appropriate regional planning efforts.
San Francisco Bay Region 45 January 2002

Between 1995 and 2000, the Regional Board maintained a separate Wetlands Planning section to help develop wetlands policy and protection strategy. In 2000, responsibility for wetlands policy and program development was distributed among Watershed Division staff, and the former Wetlands Planning section was dissolved.
High-priority Wetlands Program objectives in next two years include the following:
Administrative Tracking : update the current certification application package and guidelines to assure complete applications and reduce multiple rounds of supplemental information requests; upgrade the existing 401 Project Database to use as a tool to evaluate criteria for project approval and mitigation success; tie the Region’s database into statewide tracking (e.g., SWIM).
Baylands Advisor : Identify funding and assign staff as ‘gatekeeper’ or ‘baylands advisor’ as noted above to perform preliminary review of projects and to provide staff training and technical support.
Regional General Permits : develop Regional General Permits (WDRs) for similar types of wetland fill/impacts with limited water quality threats to reduce staff time on individual permits.
Mitigation and Monitoring Compliance : assign staff to review mitigation and monitoring proposals and provide staff training and mentorship; update and utilize mitigation and monitoring database which provides historical information on completed projects; and improve our follow up on mitigation projects by performing inspections and reviewing reports.
Interagency Coordination and Planning : increase staff participation in multi-agency activities in the Wetland Recovery Program, given our high profile role in permitting projects (this could be part of baylands advisor role).
Mitigation Guidance : provide clearer guidance to applicants on mitigation requirements (e.g., minimum mitigation ratios or mitigation narrative functional losses via direct and indirect impacts).
Assessment Field Sheet : Develop wetland assessment field sheet and assess mitigation projects that have been completed in this region.
Basin Plan Amendment : Complete a Basin Plan amendment that provides guidelines for determining wetland monitoring requirements and a new beneficial use definition to assure adequate protection of wetland functions. It is expected that the proposed tiered monitoring program will provide greater consistency for determining how wetland mitigation projects should be monitored. A staff report and draft basin plan amendment are currently under review.
Board Resolution : Finalize a resolution for the Board, describing how the Regional Board will use the Habitat Goals.
Staff Training : Develop and provide training to familiarize staff with the Habitat Goals, monitoring protocols, and other wetlands issues, and to keep staff apprised of changing policy directions.
Stream Protection Program
San Francisco Bay Region 46 January 2002

Stream Protection Program Goals
The overall goal of the stream protection program is to have creeks and other waterways that function as well or better than they do at the present time. Ultimately, the long-term goals are to halt the loss and degradation of creeks (and other waterways), and to improve the condition of our remaining creeks and waterways in order to achieve a sustainable system that supports and meets the needs of the watershed users, including humans and wildlife. Several elements are necessary to achieve this goal: The Regional Board must continue to improve education for its staff and the public on how
to manage streams for multiple objectives while seeking the highest environmental quality. Regulations and guidance must be developed that clearly outline the Board’s objectives for
achieving protection of beneficial uses for varied watershed activities. By better educating the regulated public on water quality objectives that must be considered
in order to protect creeks, we will also continue to streamline the permit process. Broad participation by the Regional Board Planning and Watershed staff in the State Water
Ambient Monitoring Program (SWAMP) that is seeking to evaluate water quality in all San Francisco Bay Creeks over the next several years.
Stream Protection Program Background
Streams and stream corridors in the Bay Area are under increasing attack from a variety of historic and current land use activities. Activities such as grazing, land use conversions, water diversions, removal of existing riparian corridors, and culverting and modifying drainages have all led to the degradation of the Bay Area’s stream systems and watersheds. The effects of historical land use activities continue to have an impact on stream stability. Projects ranging from large-scale developments covering thousand of acres to large numbers of seemingly minor discharges and fills have been shown to have long term, unanticipated, direct and indirect impacts.
Because of the large number of projects, which have generally been reviewed on a case-by-case basis, Regional Board staff have been unable to provide needed technical guidance or to consistently review the cumulative impacts of many small projects on a stream system. We have found the traditional 401 water quality certification program to be limited in protecting small creeks and “headwaters” because the limits for notification to the Corps are determined by acres filled, rather than linear feet. It is especially important to protect headwaters areas (known as first- and second-order streams), which comprise 60-70% (in linear footage) of Bay Area streams and are the primary pathways for moving water and sediment from upland areas to the lower stream reaches that provide habitat for fish and other aquatic and riparian species. The importance of these small streams in the overall ecosystem has typically been ignored, leading to extensive culverting, filling, and ditching of these important stream segments.
Mitigation for such projects has frequently resulted in small “patches” of riparian area, which function differently from the long riparian corridors that were removed. Often mitigation focuses only on replacing the riparian vegetation function of the stream with no mitigation for the loss of functions such as flood retention, water conveyance, or sediment transport. Municipalities, the regulated public, and other members of the community are often unaware of the linkages between all parts of a watershed’s drainages, and the necessity of protecting all types of waterways, in order to protect functions up and downstream. Also, there is now considerable literature that shows that inadequate setbacks and faulty project designs result in
San Francisco Bay Region 47 January 2002

direct and significant adverse impacts to water quality. Effective creek protection requires an understanding of the physical and regulatory links throughout Bay area creeks and their surrounding watersheds.
To that end, our staff has been working on developing a Stream Protection Policy (SPP), with funding from a U.S. EPA 104(b) grant. The goal of the SPP is to describe how protecting stream functions will protect beneficial uses. To protect the functions of different stream types we are focusing on five areas of emphasis for implementation activities: riparian corridors, floodplains, buffer zones, instream structures, and changes in the hydrograph.
Program Development and Priority Tasks
Further development of the SPP will continue to be a high priority in FY 2002/03. Staff plans to submit a Basin Plan amendment to the Board in mid-2002, including two new beneficial uses of flood water storage and water quality enhancement, a general policy on stream protection, and an implementation framework. We will also be holding a series of workshops with various stakeholder groups on the draft policy in preparation for a basin plan amendment. We will be working with the Bay Area Stormwater Management Agencies Association (BASMAA) to develop an external review process for the SPP, particularly in relation to potential conflicts with existing flood control maintenance and new development programs.
We have also identified two broad categories of research needs for better understanding stream dynamics and different scales in varied regional settings: 1) a refined stream classification system specific to Bay Area streams, and 2) research designed to resolve questions about how much and what types of information are required to predict watershed responses to specific alterations, which will lead to technically sound assessment protocols for use by individual applicants, municipalities, flood control agencies, and urban runoff programs. Another high priority is to develop new approaches to evaluate bank protection options, including evaluating the “no action” option and alternative, biotechnical methods. There is a need to develop analytical tools that use boundary sheer stress rather than velocity as a measure of the force driving bank erosion. We will continue to seek funding and expert assistance for these research efforts in the coming fiscal year and beyond.
A Planning and Policy Division staff person is responsible for creek basin planning issues and development of the SPP with assistance from the Watershed Division. Coordination on technical and policy development is communicated through trainings, staff participation in the statewide hydromodification workgroup, and short-term limited focus work teams. Staff involved in the non point source, urban runoff and field programs have primary responsibility for identifying appropriate local forums to assist in implementing creek protection measures. In mid-2001, we hired a stream specialist, who is providing regional and statewide staff training and technical support for restoration and stream alteration projects. Priority tasks in FY 2002/03 will be 1) educating Regional Boards, Board staff, and local municipalities and stakeholders on the Stream Protection Policy and how to protect and enhance stream functions, 2) developing staff guidelines for project reviews, 3) identifying ways to improve cross-divisional communication and organization to be more effective in protecting streams, and 4) doing a statistically valid survey of the cumulative effects of small stream alteration projects within a watershed. Watershed staff from multiple programs will be involved in these efforts.
San Francisco Bay Region 48 January 2002

Another priority in FY 2002/03 is to coordinate with public works departments, flood management agencies, and agencies overseeing creek maintenance to develop mutually acceptable guidelines for best management practices. Regional and State Board staff have developed a set of agreed-upon activities with minimal impact and/or specific best management practices for maintenance activities involving bank stabilization, vegetation and/or sediment removal, and the repair of in-stream structures and have developed a draft permit for these maintenance activities. The next step is to continue to work with the BASMAA’s Operational Permits Committee to complete an environmental assessment for CEQA in order to complete the permit process. Staff will also be working on a long-term flood control maintenance permit for Santa Clara Valley Water District that should become a model for all flood management agency programs.
San Francisco Bay Region 49 January 2002

F. Field Team/Environmental Compliance
We have maintained a Field Team with responsibilities for responding to spills, leaks, and other actions associated with unregulated discharges regionwide. The Team has also had responsibility for inspecting construction sites covered by storm water permits and assuring effective implementation of municipal storm water management programs that have responsibility for oversight of construction sites.
In 2002, we will establish an Environmental Compliance Section to expand the historic reach of the Field Team. While we will continue to address emergency response needs, inspect construction sites and audit municipal storm water programs’ oversight of construction sites, we will expand the effort to industrial storm water sites and sites that have been issued water quality certification and waivers of waste discharge requirements. That effort will require site inspections on an “audit” basis with recommendations for improvements or corrections. When problems are identified, staff will followup with appropriate enforcement and communicate the problems to local agencies. Recommendations to improve or correct are typically communicated in an inspection form or a Notice to Comply.
The Environmental Compliance Section will also work to educate both dischargers and local agencies on appropriate best management practices and our expectations for control of onsite pollution sources. Additionally, the Section will work with staff from our Coastal and North East Bay Sections on inspection of dairies and perform related enforcement actions. The Section will need to regularly interface with our three subregional watershed sections on essentially all watershed management related activities to ensure that all sections are ensuring compliance on a water quality priority basis.
Future Resource Needs
Construction (0.5 py)The Phase II storm water regulations will expand General Permit coverage to sites of one or more acres (versus current requirement of coverage for sites of five or more acres) by early 2003. In anticipation, we will provide expanded outreach programs to local agencies, contractors and developers and increasing enforcement actions (primarily through the use of Notices to Comply) to sites in non-compliance as well as to the offending local government if negligence on its part is identified.
Animal Waste Facilities (1 py)We will continue to expand outreach programs to agricultural groups (including dairy waste committees and university continuing education programs), local dairies, animal feeding operations, major animal grazing facilities and horse boarding facilities, and to increase enforcement actions (primarily through the use of Notices to Comply) to sites in non-compliance.
San Francisco Bay Region 50 January 2002

San Francisco Bay Region 51 January 2002

G. Core Regulatory Programs (NPDES Wastewater, Municipal and Industrial Storm Water, Non-Chapter 15 WDRs)
Core Regulatory programs include NPDES wastewater permitting, municipal and industrial storm water permitting, and permitting of facilities under non-chapter 15 Waste Discharge Requirements. These activities are implemented at both the regionwide and watershed level. Regionwide activities include program management and coordination and activities that are more efficiently implemented at the regionwide level. Specific Core Regulatory activities implemented at the regionwide level are listed below.
WASTEWATER NPDES PERMITS
The complexity of issues we address in NPDES permits has increased since adoption of the State Implementation Policy and California Toxics Rule in April 2000. These issues can be summarized as follows:
Ambient Monitoring and Effluent Characterization Pursuant to the State Implementation Policy, Regional Board staff has requested all dischargers to perform ambient monitoring and effluent characterization for the priority pollutants. Although we encourage group efforts, whenever feasible, the review and approval of sampling plans have been time consuming. Interim reports are expected in May 2003; review of these may be much more time consuming.
Acute and Chronic Toxicity Testing Through permit reissuance, Board staff have been requiring the dischargers to perform acute toxicity bioassays using updated test methods promulgated in October 1995 in 40 CFR 136. Dischargers have identified several practical and technical issues that need to be resolved before implementing the new procedures, referred to as the 4th edition. The dischargers have been given 12 months to implement the new procedures. Chronic toxicity requirements have been and will continue to be established in all major permits. This requires training staff in this area, reviewing toxicity identification evaluations and toxicity reduction evaluations, and providing guidance to dischargers on conducting whole effluent toxicity testing. Although testing protocols have been established for many organisms, use of most of these organisms is still not widespread. Therefore extra time is required for us to resolve issues raised by dischargers such as availability of organisms and specific protocols for toxicity identification evaluations.
Permit Petition and Litigation Nearly 100% of the permits we reissued have been petitioned for State Board review. Staff has to prepare the administrative record, respond to petitions, and review and comment on draft remands. A subset of these permits has been litigated either by the environmental groups, the regulated community or both after the State Board’s actions. Staff has to provide support to the Attorney General, who represents us, to prepare responses to litigations or prepare declarations, attend court hearings or negotiate with the litigants on settlement agreements. All the demands on staff during the petition and litigation processes are resource-intensive. At the end of these processes, the typical outcome has been permit amendments or reissuance that further add to staff’s workload. Training of Regional Boards’ staff by the Office of Chief Counsel will be
San Francisco Bay Region 52 January 2002

planned and conducted to increase the likelihood of having permits upheld by the State Board and the courts when challenged.
Pollution PreventionPursuant to the State Implementation Policy and Water Code Section 13263.3, there has been a lot more emphasis on pollution prevention programs than in the previous years. Board staff intends to use an objective third party to establish model programs, and to review program proposals and reports for adequacy. This is to encourage use of pollution prevention and does not abrogate the Board’s responsibility for regulation and review of the dischargers’ pollution prevention programs. Board staff intends to continue to collaborate with Bay Area Pollution Prevention Group (BAPPG) to identify the appropriate objective third party for this effort. The other tasks that the Board staff intends to coordinate with the BAPPG include: facilitating information exchange and technology transfer, coordinating regional pollution prevention projects, sponsoring or encouraging research and publication on topics related to pollution prevention, and developing regionally consistent education messages and programs.
Other High Priorities
Permit Backlog We will continue to clear our major backlogged permits and meet our goal by the end of 2002. We will shift gears to reissue over 30 backlogged minor permits in the next year. We intend to develop general permits for two to three categories of the minor permits to streamline the permit reissuance process. Appendix A, Sections 1 and 2 contains schedules for permit reissuance for major and minor NPDES permits. Section 4 contains the schedule for pretreatment inspections and audits.
Electronic Data Reporting has been a top priority in this Region to facilitate trend and status monitoring on a regional basis and ensure accurate and timely detection of violations. Early detection of violations has increased our effectiveness and efficiency in taking enforcement actions including issuing Administrative Civil Liabilities (ACLs) and Mandatory Minimum Penalties (MMPs). In the first half of the fiscal year 2001/2002, we have issued 1 Cease and Desist Order, 3 ACLs and 11 MMPs with the total penalty amount of $700,300. Most major dischargers participate in the electronic data reporting voluntarily. We will continue to encourage the rest of the major and minor dischargers to report monitoring data electronically. However, we have to continue to draw from existing staff resources to expand and maintain our own system as well as to assist State Board in scaling up our system to one that can be used statewide.
Enforcement: The Region has created an office-wide Enforcement Committee. The chair of the Committee is the Regional Enforcement Coordinator, and the members are coordinators from each division. The mission of the Committee is to develop guidance on implementing new regulations and policy to ensure office-wide enforcement consistency. We have reorganized the NPDES Permit Division to have a section dedicated to compliance inspections and enforcement. The section leader is the division’s enforcement coordinator who participates in the Enforcement Committee. This will allow us to take timely and equitable enforcement actions.
San Francisco Bay Region 53 January 2002

Wastewater reclamation not only is a beneficial reuse and preservation of the water resource but also is the most direct measure to reduce pollutant loads to the Bay. We will continue to create regulatory incentives to maximize wastewater reclamation. Reclamation priorities for 2002 are:
Continue to work with the Dublin San Ramon Services District Clean Water and Zone 7 on the Clean Water Revival Groundwater Replenishment Project or Alternative Reuse Projects
Continue to work with the City of Livermore on its groundwater recharge project or alternative water reuse projects
Update the Livermore Valley Water Reuse Master Permit Update the Regional Board’s General Water Reuse Permit and continue working with
Wastewater Management Districts to bring them under general permit Where appropriate encourage and assist private entities in obtaining Water Reuse Permits
using State-of-the-Art-Technology under Title 22 Continue working with the Water Reuse Association on water reuse issues and activities
NPDES Permits for Treated Groundwater Discharges
We have two general permits for discharges of treated groundwater, one for solvent contamination sites and one for fuel leak sites. We dedicate one PY for oversight of these permits and related activities.
STORM WATER NPDES PERMITS
Municipal Permits
Urban runoff and new development are high priority issue areas for our region. We have established an Urban Runoff Workgroup to address issues associated with compliance with Municipal Storm Water NPDES and development of Phase II storm water permits by 2003. The top five priorities for the group are to:
1. Improve communication and information management internally and externally;2. Establish region-wide performance standards;3. Develop standard program review and annual report audit procedures and tools;4. Revise the Staff Recommendations for New Development; and5. Consider developing a municipal storm water general permit.
The priorities for the storm water program for the coming year are as follows:
Implementation of Existing Program Components: We will be bringing information items to the Board early in calendar year 2002, describing the compliance status of each Program. This reflects an overall increase in the depth and breadth of scrutiny of Co-permittees’ actions and compliance status, by both staff and the Board, as a consequence of the fact that conventional point source discharges are relatively well controlled, and urban runoff and other non-point sources of pollutants are now the largest, and least managed source of impairment of beneficial uses. Since storm water pollutant reduction is management-practice based, and the Board is looking for vigorous effort and accountability
San Francisco Bay Region 54 January 2002

to prove the validity of this approach. Appendix A, Section 3 contains the permit reissuance schedule for municipal storm water permits.
Focus on TMDLs and 303(d)-Listed Pollutants: Both focused monitoring efforts and enhanced control strategies aimed at the pollutants for which receiving waters are currently listed as impaired should continue to be a significant priority of all Programs. A particular example among these is pesticide use and disposal, which is a quintessential stormwater challenge – one where progress will only occur through widespread outreach and resultant change in use and management patterns, vigorously promoted by the local agencies.
New Development: The recent adoption of the enhanced performance standard provision as an amendment to the Santa Clara Program’s permit will lead to a major focus for the coming year on 1) adding new development permit amendments for the counties of Alameda, Contra Costa, and San Mateo and cities of Fairfield-Suisun and Vallejo and 2) monitoring Santa Clara’s and the other programs’ compliance. All of the Programs will be encouraged to work together to address: (a) a waiver provision, with compensation, (b) a hydrograph change management plan (HMP), and (c) an alternate definition of the smaller (5000 square foot) applicable project category.
Monitoring and Assessment: Our collective knowledge of the Bay proper is improving through the auspices of the San Francisco Estuary RMP. However, our knowledge in detail of the status of the important tributary waters that feed the Bay is lacking. Prioritized watershed assessment must move beyond the pilot stage, and we must implement plans to assess these waters. We will work with the municipal storm water programs, using volunteer talent and community based resources, to develop effective local monitoring programs.
Caltrans: Work with the local Caltrans district on coordination and compliance with their statewide permit as they move forward with construction of the new Bay Bridge.
Increased Outreach – We will increase our outreach and education to local government decision makers in cooperation and with the assistance of the municipal permit agencies.
Other regionwide activities in addition to program management and coordination include participation on committees and workgroups including the Urban Runoff Task Force, the Bay Area Stormwater Management Agencies Association (BASMAA), and the California Stormwater Quality Task Force.
Industrial Permits
The administrative aspects and much of the report-based compliance tracking of the Industrial Storm Water NPDES Permit program is implemented at the regionwide level for efficiency and consistency. Activities include maintaining a discharger database, response to inquiries, review of annual reports, and review and processing of other submittals (Notices of Termination, No-Exposure Certifications, Sampling and Analysis Reduction Certifications, etc.). The Industrial Storm Water NPDES Permit program is coordinated with the Municipal Storm Water NPDES Permit program. In particular, the Municipal permit liaisons and one additional staff member whose primary responsibility is the Industrial Inspection program, work with the permitted cities
San Francisco Bay Region 55 January 2002

and counties to assure both the quality and quantity of inspections of industrial facilities and other follow up activities with industrial storm water programs conducted by municipalities. By this means, our staff achieves inspection of many more facilities than would be possible by direct inspections. We spend our efforts ensuring that the local permitted agencies have sufficient personnel and training, and are placing proper priority on this inspection activity. We currently have 1 PY of staff and 1.2 student interns dedicated to this program; however, we estimate that at least 3 PY are needed to run the program successfully.
Activities associated with facilities that are Non-Filers (not covered by the Industrial Storm Water General Permit) are also a high priority, although we do not have enough staff to dedicate full time to these activities, which include identification of non-filers, inspections and other follow-up activities, and enforcement actions.
NON-CHAPTER 15 WDR PROGRAM
The Non-Chapter 15 WDR program regulates point source discharges and dredge and fill activities, which are not otherwise regulated by the NPDES Program and the Chapter 15 program, so that beneficial uses of the State's waters are protected and enhanced. The discharges regulated by this program are typically discharges to land, while the NPDES program typically regulates discharges to surface water. Appendix A, Section 7 contains the schedule for WDR permit review and reissuance. In addition to the normal baseline activities, Non-Chapter 15 WDR resources are also used for:
Regulating wetland fill activities to allow conditioning of permits for protection of beneficial uses and to help better track tasks including mitigation projects;
Adopting and enrolling discharges under general WDRs including those for typical point source discharges and those for wetland fill activities; and
On-site system work such as updating Minimum Guidelines for Septic Systems in order to include non-standard systems, reviewing county codes, ordinances, files, and practices, updating county waiver resolutions based on results of reviews of existing waivers, and reviewing non-conforming septic systems.
The Coastal Counties Section of the Watershed Management Division has developed a strategy for determining which facilities in Marin and San Mateo Counties should be considered for inspection priority based upon the following criteria:
Potentially Extensive Significant Impacts to surface water, groundwater, or human health Potentially Localized Significant Impacts to surface water, groundwater, or human health Localized Insignificant Impacts to surface water, groundwater, or human health Unknown Impacts Receipt of Report of Waste Discharge requiring New or Re-Issued Permit
An additional factor to be added to this strategy is to determine when the permit comes up for review (a 5-, 10-, or 15-year timeframe, depending upon facility complexity).
San Francisco Bay Region 56 January 2002

These criteria will be balanced with the amount of staff time required to resolve or complete the review and inspection (i.e., inspection may lead to enforcement action or other follow up inspections verses inspection likely to reveal well-run facility generally in compliance). Section Staff are working in teams to complete review and inspections. This approach creates training opportunity for new staff and sharing of the “institutional memory”.
San Francisco Bay Region 57 January 2002

H. Groundwater Resource Management
This section of the WMI describes the activities, strategies and goals for addressing threats to and impairments of groundwater resources in the San Francisco Bay Region. A discussion of existing ambient groundwater monitoring activities and priority unfounded projects is also included.
The overall goal of the Regional Board groundwater program is to protect and improve water quality for beneficial use. Our key stakeholders are:
The public that depends on a present and future safe source of groundwater for drinking water. They require confidence that the Regional Board is managing groundwater contamination issues in the public trust for human health and the environment.
Water supply agencies, which need protection of supply wells, recharge areas, and future groundwater development areas.
Owners of sites with contaminated groundwater, which need fair and timely response to contamination studies submitted to the Board and remediation requirements that are proportional to the risks.
Property owners and developers, which need accurate and complete information on groundwater contamination for real estate transactions.
Groundwater programs are a major focus of the Regional Board’s program comprising 36% of our annual budget. Over $4 million per year is directed toward groundwater and soil pollution issues. Overall, the Regional Board's groundwater program is driven by the need to protect groundwater quality for existing municipal drinking water supply. Contamination sites in these basins receive the highest level of regulatory attention. Military base closures, property redevelopment issues, impacts to ecological receptors, and programmatic requirements (e.g., RCRA Subtitle C and D) also require significant staff focus. Other significant groundwater basins, used for domestic, irrigation or industrial supply, are an important, but secondary concern (due to limited resources).
Groundwater Resources in the San Francisco Bay Region
There are 33 groundwater basins in the San Francisco Bay Region (Figure II-2). The basins range in size from the 240 mi2 Santa Clara Valley to the 2 mi2 Pescadero Valley. A summary of the groundwater basins is shown in Table II.H.1.
San Francisco Bay Region 58 January 2002

Figure II-2. Significant Groundwater Basins
San Francisco Bay Region 59 January 2002

Table II.H.1. Groundwater Basins in the San Francisco Bay Region
GROUNDWATER BASIN COUNTYDWRBasin No.6
AREAL EXTENT(SQ. MI.)
BASIN DEPTH(FEET)7
STORAGECAPACITY(AC-FT)8
PERENNIALYIELD(AC-FT)9
EAST BAY GROUNDWATER BASINSAlameda Creek (Niles Cone) Alameda 2 - 9.01 97 40 - >500a 1.3 mila 32,600a
Castro Valley Alameda 2 - 8 4 NA NA NAEast Bay Plain
Richmond Sub-Area Contra Costa >600u 420 u
Berkeley Sub-Area Alameda 300 u
2.67 milw
Oakland Sub-Area Alameda 2 - 9.01 700 u
San Leandro Sub-Area Alameda 1100 u
San Lorenzo Sub-Area Alameda 1100 u
Livermore Valley Alameda 2 - 10 170 0 - 500d 540,000d 13,500e
Sunol Valley Alameda 2 - 11 28 160 - 500f >2800g ? 140g ?Arroyo Del Hambre Valley Contra Costa 2 - 31 2 NA NA NAClayton Valley Contra Costa 2 - 5 30 50 - 300h 180,000d ? NAPittsburg Plain Contra Costa 2 - 4 30 50 - 160h NA NASan Ramon Valley Contra Costa 2 - 7 30 300 - 600i NA NAYgnacio Valley Contra Costa 2 - 6 30 20 - 300h 50,000h NANORTH BAY GROUNDWATER BASINSNovato Valley Marin 2 - 30 17.5 55 - 90j NA NASand Point Area Marin 2 - 27 2 20 - 300k NA NASan Rafael Marin 2 - 29 NA NA NA NARoss Valley Marin 2 - 28 18 10 - 60l 1380l 350l
Suisun/Fairfield Valley Solano 2 - 3 203 30 - 400s,t 40,000t NAKenwood Valley Sonoma 2 - 19 6 0 - 1000d 460,000d NAPetaluma Valley Sonoma 2 - 1 41 0 - 900d 2.1 mild NASebastopol-Merced Fm. Highlands Sonoma 2 - 25 150 NA NA NASonoma Valley Sonoma 2 - 2.022 50 0 - 1000d 2.66 mild NANapa Valley Napa 2.2 & 2 - 2.01 210 50 - 500m 240,000n 24,000m
SAN FRANCISCO PENINSULA AND COASTAL GROUNDWATER BASINSIslais Valley3 San
Francisco & San Mateo
2 - 33 8.75
Visitacion Valley San Francisco
2 - 32 8 <200v 20,000v
Downtown1 San Francisco
2 - 34 11.7 175 59,500
Marina1 San Francisco
2 - 34 3.5 200v
Lobos1 San Francisco & San Mateo
2 - 34 3.75 140v
Westside2 San Francisco & San Mateo
2 - 34/2 - 35 38 3500v 500,000 - 1 milv
South1 San Francisco
2 - 34 3.25 200v 5,000v NA
Treasure Island4 San Francisco
none 0.9 28v
San Francisco Bay Region 60 January 2002

Half Moon Bay Terrace San Mateo 2 - 22 25 20-15o 10,300o 2200o
Pescadero Valley San Mateo 2 - 26 2 NA NA NASan Gregorio Valley San Mateo 2 - 24 2 NA NA NASan Mateo Plain San Mateo 2 - 9 (A) 32.5 100-500q NA NASan Pedro Valley San Mateo 2 - 36 2 NA NA NASOUTH BAY GROUNDWATER BASINSanta Clara Valley (& Coyote) Santa Clara 2 - 9 (B) 240 10-1010d 3.0 milr 100,000r
See footnotes on next pageNA - Not Available.
N O T E S :
1. Previously this basin was part of the “San Francisco Sands” Basin. This basin was designated as “existing” MUN beneficial uses in the 1995 Basin Plan.2. Previously this basin was part of the “Merced Valley” Basin and the “San Francisco Sands” Basin.3. Previously this basin was designated as part of the “Merced Valley” Basin.4. This area was not designated as a groundwater basin in the 1995 Basin Plan.5. Information compiled from DWR and local water management agencies. (References are listed below.)6. DWR Bulletin 118-80 (1980).7. Average depth to aquifers below land surface. These depths are provided for information only and cannot be used to characterize site-specific conditions.8. Total available storage in acre-feet. (References are listed below.)9. The average annual amount of groundwater that can be withdrawn without producing an undesired result. (References are listed below.)
R E F E R E N C E S :a. Alameda County Water District Staff, 1992, Personal Communication.b. Alameda County Flood Control and Water Conservation District, 1988, Geohydrology and Groundwater Quality Overview, East Bay Plain Area, 205(j) Report.c. California Department of Water Resources, 1991, Groundwater Storage Capacity of the Alameda Bay Plain, Draft Report for Alameda Public Works Agency.d. California Department of Water Resources, 1975, California’s Groundwater, Bulletin 118.e. U.S. Geological Survey, 1984, Water quality conditions and an evaluation of ground and surface water based sampling in Livermore-Amador Valley, WRI 84-4352.f. California Department of Water Resources, 1974, Evaluation of groundwater resources in the Livermore and Sunol Valleys, Bulletin 118-2.g. California Department of Water Resources, 1963, Alameda County Investigation, Bulletin 13.h. Contra Costa County Health Department, 1986, Small Community Water Systems.i. California Department of Water Resources, 1964, Alameda Creek watershed above Niles; Chemical qualities of surface water, waste discharges and groundwater.j. Blackie & Wond, Consulting Engineers, 1957, Report to the North Marin County Water District on Water Supply Development, Project Number 2.k. Wallace, Roberts & Todd, 1988, Revised Draft Dillon Beach Community Plan, prepared for Marin County Planning Department.l. Ellis, William C. and Associates, 1978, Groundwater resources of Ross Valley; A report on water planning investigations prepared for Marin Municipal
Water District, Marin County, California.m. Napa County Flood Control and Water Conservation District, 1991, Water Resource Study for Napa County Region.n. U.S. Geological Survey, 1960, Geology and Groundwater in Napa and Sonoma Valleys, Water Supply Paper 1495.o. Geoconsultants, Inc., 1991, Annual Report 1990-1991, Groundwater Resources, Half Moon Bay, California, prepared for the City of Half Moon Bay.p. Applied Consultants, 1991, Report on the Daly City Groundwater Investigation and Model Study, prepared for Daly City.q. University of California, Berkeley, Sanitary Engineering and Environmental Health Research Laboratory, 1987, San Francisco Bay Region
Groundwater Resource Study Volume 10 - San Mateo Ground Water Basin Characteristics, SEEHRL Report No. 87-8/10.r. Santa Clara Valley Water District, 1975, Master Plan - expansion of in-county water distribution system.s. University of California, Berkeley, Sanitary Engineering and Environmental Health Research Laboratory, 1987, San Francisco Bay Region
Groundwater Resource Study Volume 6 - Suisun/Fairfield Ground Water Basin Characteristics, SEEHRL Report No. 87-8/6.t. U.S. Geological Survey, 1960, Geology, Water Resources, and Usable Groundwater Storage Capacity of part of Solano County, California, Water Supply Paper 1464.u. Figuers, S., 1998, Groundwater Study and Water Supply History of the East Bay Plain, Alameda and Contra Costa Counties, CA.v. Regional Board, 1996, San Francisco and Northern San Mateo County Pilot Beneficial Use Designation Project, Draft Staff Report.w. California Department of Water Resources. 1994. Groundwater Storage Capacity of a Portion of the East Bay Plain, Alameda County, California.
San Francisco Bay Region 61 January 2002

Significant Groundwater ResourcesOf the 33 groundwater basins in our region, only four are utilized for municipal drinking water supply. These four basins supply groundwater to approximately 3 million people. The basins that are utilized for supply are the Santa Clara Valley, Niles Cone, Livermore Valley and Westside Basins. In addition, the East Bay Plain Groundwater Basin is being investigated by East Bay Municipal Utility District for conjunctive use.
Beneficial Uses of GroundwaterThree basins (Santa Clara, Livermore, and Niles Cone) have been used to store imported surface water from the State and Federal Water Projects since the 1960’s. Imported water is recharged into these basins along with a smaller amount of local runoff and natural groundwater recharge. Additional water supply basins include: the West Side Basin for municipal use; and Half Moon Bay, Sonoma, Petaluma, Napa, and the East Bay Plain basins for domestic and agricultural supply, the Downtown (San Francisco) Basin is used for industrial and landscape irrigation supply. A list of the beneficial uses for each groundwater basin is shown in Table II.H.2.
Further, groundwater development of portions of the West Side Basin by the San Francisco Public Utilities Commission and the East Bay Plain by the East Bay Municipal Utility District are under investigation.
Groundwater and Surface Water Interactions Groundwater and surface water interactions are a significant issue at many groundwater pollution sites that are adjacent to San Francisco Bay. Remediation at the San Francisco International Airport has set the precedent for the Board's approach at similar sites. Other sites where groundwater remediation has addressed migration to surface water include: Port of Oakland, Pacific Bell Park, and about 20 landfills and 6 closing military bases.
Sole Source AquifersThere are no sole source aquifers as defined by USEPA in the San Francisco Bay Region.
San Francisco Bay Region 62 January 2002

Table II.H.2. Existing and Potential Beneficial Uses of GroundwaterIdentified Basins or Portions thereof
(As adopted by the Regional Board in April 2000, but awaiting SWRCB approval)
GROUNDWATER BASIN COUNTY DWRBasin No.
MUN PROC IND AGR FRESH 6
EAST BAY GROUNDWATER BASINSAlameda Creek (Niles Cone) Alameda 2 - 9.01 E E E ECastro Valley Alameda 2 - 8 P P P PEast Bay Plain
Richmond Sub-AreaUnderlying Chevron Richmond Refinery8
Contra Costa2 - 9.01
E5
_7EP
EP
EP
Berkeley Sub-Area Alameda E5 E E E
Oakland Sub-AreaUnderlying Oakland shoreline/Alameda Point8
Alameda E5
_7EP
EP
EP
San Leandro Sub-Area Alameda E E E E
San Lorenzo Sub-Area Alameda E E E E
Livermore Valley Alameda 2 - 10 E E E ESunol Valley Alameda 2 - 11 E E E EArroyo Del Hambre Valley Contra Costa 2 - 31 P P P PClayton Valley Contra Costa 2 - 5 E P P PPittsburg Plain Contra Costa 2 - 4 P P P PSan Ramon Valley Contra Costa 2 - 7 E P P EYgnacio Valley Contra Costa 2 - 6 P P P PNORTH BAY GROUNDWATER BASINSNovato Valley Marin 2 - 30 P P P PSand Point Area Marin 2 - 27 E P P PSan Rafael Marin 2 - 29 P P P PRoss Valley Marin 2 - 28 E P P ESuisun/Fairfield Valley Solano 2 - 3 E E E EKenwood Valley Sonoma 2 - 19 E P P EPetaluma Valley Sonoma 2 - 1 E P P ESebastopol-Merced Fm. Highlands Sonoma 2 - 25 E P P ESonoma Valley Sonoma 2 - 2.022 E P P ENapa Valley Napa 2.2 & 2 - 2.01 E E E ESAN FRANCISCO PENINSULA AND COASTAL GROUNDWATER BASINSIslais Valley3 San
Francisco & San Mateo
2 - 33 P5 E E P
Visitacion Valley San Francisco
2 - 32 P5 E E P
Downtown1 San Francisco
2 - 34 _7 E E E
Marina1 San Francisco
2 - 34 P5 P P P
Lobos1 San Francisco & San Mateo
2 - 34 E P E E
Westside2 San Francisco & San Mateo
2 - 34/2 - 35 E P E E
South1 San 2 - 34 P5 P P P
San Francisco Bay Region 63 January 2002

GROUNDWATER BASIN COUNTY DWRBasin No.
MUN PROC IND AGR FRESH 6
FranciscoHalf Moon Bay Terrace San Mateo 2 - 22 E P P EPescadero Valley San Mateo 2 - 26 E P P ESan Gregorio Valley San Mateo 2 - 24 E P P ESan Mateo Plain San Mateo 2 - 9 (A) E E E PSan Pedro Valley San Mateo 2 - 36 P P P PSOUTH BAY GROUNDWATER BASINSanta Clara Valley (& Coyote) Santa Clara 2 - 9 (B) E E E E
Notes: Beneficial Uses:MUN - Municipal and domestic water supply.PROC - Industrial process water supply.IND - Industrial service water supply.AGR - Agricultural water supply.
FRESH - Freshwater replenishment to surface water. (Designation will be determined at a later date; for the interim, a site-by-site determination will be made.)
E - Existing beneficial use. P - Potential beneficial use.
1 Previously this basin was part of the “San Francisco Sands” Basin. 2 Previously this basin was part of the “Merced Valley” Basin and the “San Francisco Sands” Basin.3 Previously this basin was designated as part of the “Merced Valley” Basin.4 This area was not designated as a groundwater basin in the 1995 Basin Plan.5 No known existing drinking water wells. However, there are numerous private backyard irrigation wells.6 To be determined7 Groundwater does not meet the state’s Sources of Drinking Water Policy criteria (State Board Resolution 88-63).8 Dedesignation of the MUN beneficial use in these areas only applies to the shallow aquifers and not the deeper aquifers. The shallow
aquifers are defined as those water-bearing zones above the Yerba Buena Mud (generally less than 100 feet below ground surface). Within these areas, there is no historical, existing or planned use of groundwater as a source of drinking water either in the shallow or deeper aquifers. However, deep aquifers in these areas will continue to be designated as MUN. Therefore pollution in the shallow zones will still be required to be remediated to levels to protect the deeper aquifers or other more stringent levels as required to protect remaining beneficial uses (i.e., aquatic receptors in the shoreline bands).
San Francisco Bay Region 64 January 2002

Groundwater Pollution Sources
The groundwater staff at the Regional Board is responsible for managing an enormous number of groundwater contamination sites. As of December 1999, these include:
LUSTIS Cases Regional Board Lead (Open): 534LUSTIS Cases Local Cases (Open): 3189Active SLIC Cases 408USEPA State Lead Sites 21 DoD Sites 32DoE Sites 4Above Ground Tank Facilities 375Landfills (Active) 12Landfills (Inactive) 45Industrial Sites (Refineries, Chemical Mfg. Plants) 34
Total Regulated Groundwater Sites = 4654
In addition to the above totals, the Regional Board maintains information on 1027 closed LUSTIS Cases that are Regional Board lead and 4092 closed LUSTIS Cases overseen by Local Programs. A subset of these case are likely to be reopened in the future. Sites that will be reopened will be those that stored fuel with MTBE but were closed without monitoring for it. Leaking Underground Fuel Tank SitesAbout 6% of the sites have active groundwater cleanup in progress, about 70% of the over 8,800 fuel UST sites have completed source control, less than 1% have other engineering controls including capping and containment barriers. Together with local agencies we are steadily closing cases; over half are now closed.
MTBE has been added to gasoline sold in California since the 1979 as an octane booster. Since the late 1980’s it has been added as an oxygenate to the State’s reformulated gasoline; comprising up to 11% by weight volume. MTBE has been detected in groundwater in up to 80% of LUFT sites, and in municipal water supply wells in San Jose, Santa Monica, and Lake Tahoe. Due to its chemical and physical properties, has the potential to become a significant threat to California’s groundwater supply.
Because of the significant threat to California’s groundwater resources posed by MTBE, Governor Davis issued Executive Order D-5-99 on March 25, 1999. The order recognizes that if not managed properly, MTBE can cause significant adverse impacts to current and future beneficial uses of ground and surface water. The order contains eleven items that include tasks for various state departments and boards. Among these, item 8 directs the State Board to proceed to identify areas with vulnerable groundwater, prioritize resources, and to provide guidelines for the cleanup of MTBE in groundwater.
The State Water Resources Control Board (SWRCB) has issued draft guidelines that are
San Francisco Bay Region 65 January 2002

intended for use by Regional Water Quality Control Boards and local agencies to assist in the investigation and cleanup of MTBE impacted sites. The guidelines provide for establishing a priority ranking of MTBE sites in vulnerable groundwater areas, a general scope of work and strategy for MTBE sites, a timeframe for completing site management milestones, a decision- making framework for validating the site conceptual model, and an overview of technical considerations for MTBE cases.
The San Francisco Bay Regional Water Quality Control Board (Region 2) recognizes that there are significant groundwater resources in its jurisdiction that are available for municipal and other purposes. While several municipal drinking water wells in the region have been impacted by MTBE, there has not yet been a major impact to these groundwater resources from MTBE. However, the closure of these three municipal water supply wells in Region 2 is an indicator of a larger problem, as all were contaminated by MTBE from leaking underground storage tanks. To meet this challenge Region 2 is formulating a comprehensive strategy regarding the MTBE threat to ensure that there are no more impacts to community drinking water wells and to minimize the threat to Region 2’s groundwater resources. Non Fuel ProgramSites within the Non Fuel Program are typically SLIC (Spills, Leaks, Investigations and Cleanup) contaminated with chlorinated volatile organic compounds. Sites with significant threats to human health and the environment are issued Site Cleanup Requirements. As of 1999, the Regional Board has issued nearly 200 Site Cleanup Requirements for investigation and remediation of VOC plumes. Site Cleanup Requirements utilize the authority in the Water Code under Cleanup and Abatement Orders. The goal is for dischargers to reimburse staff oversight costs. Over the past five years we have had a steady increase in the sites where staff time at non-fuel sites is reimbursed by the discharger. Currently, 74% of active cases are on cost recovery.
Saltwater IntrusionHistorically, overpumping of several groundwater basins has resulted in saltwater intrusion. Basins that have been effected by saltwater intrusion include Santa Clara Valley, Niles Cone, Petaluma, Pittsburg Plain, and East Bay Plain. In general, saltwater intrusion has been halted in most basins due to reduction in pumping rates and the implementation of artificial recharge. The historical effects are still present in all of the above basins. The only potential current problem may be in the Westside Basin where limited data in the Daly City area shows gradual increases in chloride concentrations. Board staff have urged implementation of measures to prevent saltwater intrusion in this area in comments on the AB3030 groundwater management plan to the City of Daly City. Daly City received a grant from the Department of Water Resources in 2001 to install new saltwater intrusion monitoring wells. The result from the sampling of these wells should be available in FY2002/2003.
Other PollutantsMetals in groundwater are an issue at a small sub set of sites and are regulated under the SLIC program. Pesticides and herbicides have not been a significant issue in our Region. Nitrates from confined animal facilities are an issue locally in the Santa Clara Valley.
Activities for Preserving and Restoring Groundwater
San Francisco Bay Region 66 January 2002
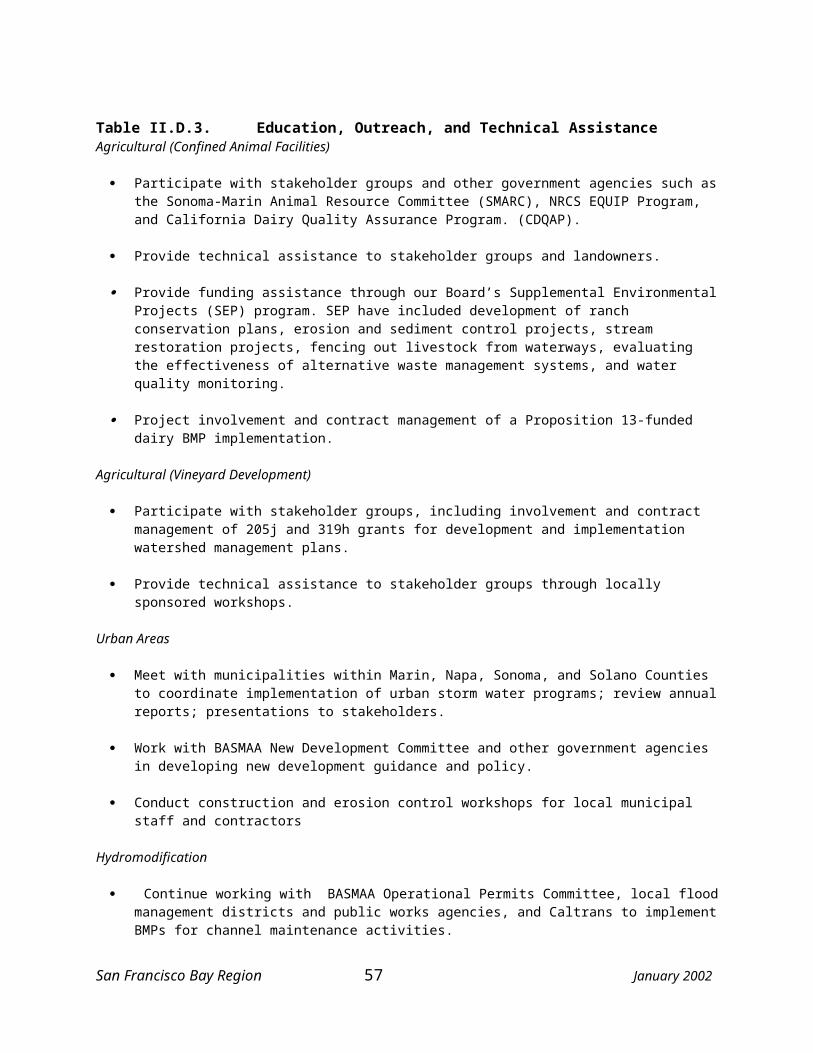
A total of 43 Regional Board staff (currently consisting of 1 Assistant Executive Officer, 2 Division Chiefs, 5 Section Leaders, and 35 line staff) are assigned to groundwater cleanup projects. While all surface water staff are organized on a watershed basis, most groundwater staff are not. The groundwater staff are divided within two separate groundwater divisions (the Groundwater Protection and Waste Containment Division and the Toxics Cleanup Division). A one half-time Planning and Policy Division staff person is responsible for groundwater basin planning issues with assistance from the two groundwater divisions. Each Division manages several groundwater related programs as follows:
Groundwater Protection and Waste Containment Division Chapter 15 (waste management units) Department of Defense (DOD) and Department of Energy (DOE) facilities Resource, Conservation, and Recovery Act (RCRA) Toxic Pits Cleanup Act (TPCA) Solid Waste Assessment Tests (SWAT) Above Ground Tank Program (AGT)
Toxics Cleanup Division Spills, Leaks, Investigations, and Cleanups (SLIC) Superfund (state lead) Underground Storage Tanks (UST) NPDES for groundwater extraction discharges USEPA Brownfields Programs
Planning and Policy Division Groundwater Basin Planning Groundwater Technical Support AB3030 Groundwater Management Plans Interstate Technology and Regulatory Cooperative Drinking Water Source Assessment and Protection (DWSAP) Program
Application of Risk-Based Screening Levels and Decision Making to Sites With Impacted Soil and Groundwater (Interim Final - August 2000)
Staff of the San Francisco Bay Area, Regional Water Quality Control Board (RWQCB) have prepared a technical document entitled Application of Risk-Based Screening Levels and Decision Making to Sites With Impacted Soil and Groundwater (Interim Final - August 2000). Volume 1 of the document presents lookup tables of conservative, Risk-Based Screening Levels (RBSLs) for over 100 chemicals commonly found in impacted soil and groundwater at sites where releases of hazardous substances have occurred. Volume 2 describes how the RBSLs were developed and provides detailed tables and appendices in support of the summary lookup tables. The document is intended to help expedite the preparation of environmental risk assessments at sites where impacted soil and groundwater has been identified. As an alternative to preparing a formal risk assessment, soil and groundwater data collected at a site can be directly compared to the RBSLs and the need for additional work evaluated. It is anticipated that this document will
San Francisco Bay Region 67 January 2002

be especially beneficial for use at small- to medium-size sites, where the preparation of a more formal risk assessment may not be warranted or feasible due to time and cost constraints.
Watershed IntegrationThere is interest to integrate and coordinate these groundwater activities along a more watershed related basis. A new Principal Engineer Position has been created to oversee all groundwater programs in the office. The creation of the new Groundwater Principal Engineer position provides an opportunity to begin reorganizing the two Groundwater Divisions along watersheds.
Past proposals have focused on the DOD/DOE program, since each military facility is, in essence, a mini-watershed. DOD/DOE staff has managed sediment, wetlands, groundwater, soil, and surface water issues at each facility. These sections have used a team approach and also use each other’s expertise in particular areas, such as sediment toxicity and ecological risk.
The groundwater staff can benefit from the lessons learned by the surface water staff's evolution into a Watershed based structure. The approach will likely be similar to that used by the Watershed Committee in FY 1996-97 for integrating the former surface water divisions into watershed divisions. As described above, this approach involves extensive staff input, establishing priorities, and recommending alternatives. Full integration with the surface water divisions appears unwieldy at this time. However, a modest realignment within the existing groundwater divisions will certainly better leverage our resources and improve communication and consistency.
Groundwater CommitteeThe Committee recommends policy on groundwater issues, conveys and shares new information and events related to groundwater pollution cleanup, and fosters internal consistency on groundwater policy implementation. The Committee normally consists of Regional Board line staff, supervisors, and managers from all five staff divisions.
The Committee's first major project was the groundwater Basin Plan Amendment adopted by the Board in 1992. The State and other regional boards in their Basin Plan updates have used significant portions of this amendment. It highlights the Board's experience with groundwater cleanup since the early 1980’s and includes a recommendation to evaluate the Board's existing approach to managing site cleanups. This includes a review of the beneficial use designations for each of the Region's groundwater basins.
More recently the Committee has focused on groundwater beneficial use evaluations. In 1996, the Committee produced the San Francisco and Northern San Mateo County Pilot Beneficial Use Designation Project. In 1999, the Committee produced the East Bay Plain Beneficial Use Designation Project.The current Groundwater Committee Project is titled “ A Comprehensive Groundwater Protection Evaluation for South San Francisco Bay Basins.” As of December 2001, a draft stakeholder review version was being circulated for comments. The report is expected to be completed in early 2002.
The project was conducted in coordination with the Alameda County Water District, Santa Clara Valley Water District, and San Mateo County Environmental Health Services Division.
San Francisco Bay Region 68 January 2002

Numerous local, state, and federal programs address groundwater protection. And perhaps nowhere in the San Francisco Bay area are these programs as important as in the South Bay, where 351 public water supply wells serve a population of 1.75 million people and provide up to half of the drinking water supply. The South Bay project area covers three groundwater basins (Niles Cone, Santa Clara Valley, and San Mateo Plain) and includes large portions of three counties and 27 cities.
A comprehensive overview of existing groundwater protection programs in the San Francisco Bay area had not been performed prior to this project. The purposes of the project are to:
Describe and review the effectiveness of groundwater protection programs and recommend areas for improvement
Identify issues of concern that have not been adequately addressed Describe ongoing protection efforts and offer recommendations to address issues of
concern
InnovationThe Regional Board encourages the use of innovative technologies as solutions to groundwater contamination issues, e.g., funnel and gate, enhanced bioremediation, groundwater reinjection, natural attenuation, etc. The Board also promotes the use of innovative regulatory solutions to groundwater contamination issues: containment zones, operable units, secondary liability findings, Brownfield initiatives, mediation, and risk based decision-making.
Board staff actively participate in nationwide and statewide groundwater contamination studies including the National Research Council, Lawrence Livermore National Laboratory LUFT Study, MTBE Study, and VOC Historical Case Analysis.
Other strategies include encouraging groundwater recharge with reclaimed water and the prevention of adverse ecological impacts from the discharge of contaminated groundwater to surface water.
FY 2002/03 Goals
MTBE: The goals of the MTBE program are to prevent impacts to municipal water wells, protect groundwater with drinking water beneficial uses from MTBE pollution, and support, complement, and supplement the goals mandated in the Governor’s Executive Order D-5-99.
One of the MTBE goals for FY 2002/2003 is the monitoring of active service stations to determine whether undetected MTBE releases from operating and upgraded LUST facilities have occurred.
Support the Department of Water Resources Update on Groundwater Basins of California. DWR is updating its report titled “California's Ground Water - Bulletin 118,” first published in 1975. This is a three-year effort, with a draft report to be released in early 2002 and a final report to be published in late 2002. The update will consist of a summary of regional and statewide data
San Francisco Bay Region 69 January 2002

available on groundwater basins, as well as detailed information on individual groundwater basins.
Geographic Information System: Continue efforts to create a region-wide GIS database that contains both surface water and groundwater information. Support the SWRCB’s GeoTracker initiative, which provides a Web-based tool that the public and local agencies can use to conduct case-by-case review of information about LUSTs and drinking water wells. Routine updating of GeoTracker is expected to begin in late 2001 within the S.F Bay Region, including the South Bay Basins.
SWRCB’s System for Water Information Management: Support the SWRCB’s development and implementation of SWIM, relating to inspection, monitoring, enforcement, and reporting. SWIM is scheduled to be fully implemented in 2003. SWIM will accept self-monitoring report data in electronic and standardized formats, thus reducing the manual effort now required to capture data and decreasing the elapsed time between receipt and capture of data.
Develop Regional Board policy for active landfills located in historic wetlands of the San Francisco Bay Estuary (Estuary Landfills). While over 30 Estuary Landfills have closed due to lack of capacity and the burdens of new landfill regulations, there remain 8 active landfills with considerable unlined capacity. At issue is whether the Regional Board should take formal position on Estuary Landfills as a group. Three of these landfills have expansion plans. Collectively, the Estuary Landfills have 34 million cubic yards of potential capacity and an additional future potential capacity of 19 million cubic yards. The primary issues are 1) ongoing disposal in unlined cells (where waste has subsided 5-25 feet below sea level into the underlying bay mud) and 2) expansion of these landfills vertically and into historic wetlands.
Future Planning Because of these groundwater-planning efforts, staff are ready to identify priority groundwater issues within several watersheds. Building on experience gained from the DOD/DOE program and the groundwater pilot projects, we expect to start development of a plan to integrate the non-watershed activities in the Watershed Management Initiative in the near future.
Ambient Groundwater Monitoring and Assessment
The Regional Board does not have a mechanism to track all of the Ambient Groundwater Monitoring and Assessment Activities in the Region.
Current Programs:
Ambient groundwater monitoring is conducted in Santa Clara, Niles Cone, Livermore, and the East Bay Plain Groundwater Basins. In almost all cases, monitoring does not include volatile organic compounds and the results are not published or made easily available to the general public.
The Regional Board has conducted limited ambient groundwater monitoring using funds from the laboratory services contact. In 1990, the Regional Board monitored pesticides in Napa
San Francisco Bay Region 70 January 2002

Groundwater basin wells. In 1999, the Regional Board monitored organic compounds in the San Francisco Downtown Basin wells. In 2000 and 2001 we funded the San Mateo County Health Department (SMCHD to sample wells in the Westside and San Mateo Plain Basins. The San Mateo County Health Department (SMCHD), Groundwater Protection Program is providing database consolidation activities of water quality and water depth data for an agreement based upon the AB3030 plan with the cities of Daly City, San Bruno, San Francisco, and California Water Company. SMCHD is compiling data from the AB3030 partners and measures water levels in existing agricultural, industrial and municipal wells in the San Mateo County portion of the basin.
SWRCB’s Ambient Groundwater Monitoring and Assessment Program: The SWRCB, in coordination with the Department of Health Services and the Department of Water Resources, is implementing the California Aquifer Susceptibility (CAS) assessment to determine the water quality and relative susceptibility of groundwater that serves as a source for public water supplies to potentially contaminating activities. CAS is part of the Ambient Groundwater Monitoring and Assessment Program and will employ groundwater age-dating techniques and low-level analyses for volatile organic compounds.
Sampling began in June 2001 in the Santa Clara Valley, Niles Cone, Westside, and Livermore Basins. A total of 271 public water supply wells have been sampled and data will be available in early 2002. This new data will allow the Regional Board to better the access ongoing cleanup efforts, the vulnerability of existing aquifers and prioritize future cleanup efforts.
The S.F. Regional Board has designated a staff person in the Groundwater Protection Division to be the region’s GAMA coordinator.
Unfunded Ambient Groundwater Monitoring Activities
In general, funding is needed for ambient groundwater monitoring of VOCs and oxygenates in Santa Clara, Niles Cone, Livermore, and the East Bay Plain Groundwater Basins. Funding is also needed to make existing data available to the public for these basins.
One specific priority unfunded proposal that the Regional Board has an interest in is as follows:
East Bay Groundwater Awareness and Information Network – This is a proposed monitoring program developed as part of a USEPA grant application (City of Emeryville, 1998). The grant was not funded, but the cooperating agencies are interested in the network. The grant sought to create the “East Bay Groundwater Awareness and Information Network” (GAIN). The objective of GAIN are (1) to design a community based, time relevant groundwater monitoring program network, (2) cultivate public interest in obtaining and using information, (3) complete a time relevant groundwater monitoring network, and (4) manage, process, and deliver groundwater monitoring data to the public. GAIN is designed to provide East Bay residents with the ability to gauge for themselves the overall “health” of their deep groundwater resources. GAIN also
San Francisco Bay Region 71 January 2002

targets localized areas where groundwater is contaminated and residents have requested monitoring data to guide decisions affecting economic revitalization.
Future Goals
Support expanding GeoTracker to include information on sites other than LUFTs. The addition of SLIC sites, Landfills, AGTs, and DoD sites to GeoTracker would greatly improve access to site data and allow for better site management and tracking.
Support ongoing Regional Board efforts to analyze the historical plume information collected by responsible parties over the past 15 years, investigate trends in remediation approaches, and develop a prioritization list.
Regional Groundwater Basin Assessment. Expand ambient water quality monitoring in municipal supply aquifers, compile existing data and support the establishment a broader network of deep monitoring wells. While over 10,000 wells are used to monitor the shallow aquifers in the Region, less than one-hundred wells monitor the deeper aquifers.
Policy Development. Support the development of policy and guidelines for: the natural attenuation of volatile organic compounds; non point source pollution of groundwater; and groundwater cleanup at sites located over marginal groundwater resources.
Source Water Protection. If funding is available, the Regional Board will assist water purveyors using groundwater, with obtaining information on the Board’s permitting activities to compile their list of potential sources of contamination to those groundwater sources of drinking water.
San Francisco Bay Region 72 January 2002

I. Geographic Information System (GIS)
The previous edition of the Watershed Management Initiative Plan recommended increasing staff awareness of and access to Geographic Information System (GIS) data as well as the development of improved data layers for the Region’s streams and watershed boundaries. Progress has been made in setting the foundation for achieving these goals, and significant gains expected within the coming year.
Current GIS Activities
Over the past several years, the Region Board has initiated or participated in a number of projects that incorporated a significant application of GIS. These projects include Board studies of the Napa River Watershed (1996), the San Francisco groundwater basins (1996), the East Bay Plain groundwater basin (1999) and the South Bay groundwater basins (2001); and the development of the San Francisco Bay EcoAtlas (in conjunction with the San Francisco Estuary Institute).
The Regional Board continues to utilize GIS as a useful analytical tool for the study and monitoring of groundwater quality. The Regional Board provided significant input into the State Board’s Geotracker (web-based GIS analytical tool for the display and analysis of LUFT and well data) and has developed a number of scripts and routines for the prioritization of its own MTBE cleanup cases. In 2001, the Regional Board implemented a pilot project for the electronic reporting of solvent plume contours by responsible parties. Regional Board staff are also currently investigating the possibility of prioritizing solvent plume cleanup cases in a manner similar to MTBE cases.
The Regional Board continues to work closely with other agencies and community groups to share information, improve data accuracy and facilitate data acquisition and analysis. Regional Board staff are working closely with and lending technical assistance to the Contra Costa Community Development Department in their work with local creek groups in mapping stream channels and features. The Regional Board has also worked closely with Alameda County Water District, Santa Clara Valley Water District, San Mateo County Environmental Health Services Division on the mapping and analysis of the groundwater basins in their jurisdictions.
The Regional Board is also increasing the use of GIS in its watershed and TMDL analysis. In 2001, it worked closely with Stillwater Sciences in the development and use of analytical routines to determine sediment loading for the Napa River TMDL. Regional Board staff are also currently using GIS to map and analyze the location of dairies and livestock facilities in the Tomales Bay watershed for use in that body’s pathogen TMDL. The SWAMP program team is using GIS to plan and track sampling sites.
The Regional Board currently has 1 PY dedicated to GIS activities in addition to approximately eight staff members who apply GIS to varying degrees in their work.
San Francisco Bay Region 73 January 2002

Future Goals
Prior application of GIS analysis at the Regional Board has been determined in large part by project-specific goals. The following objectives have been established to assist in the broader application of GIS in the Board’s activities:
1. Continued development of region-wide “framework” data layers. The previous project-focused development of GIS in the Board has resulted in “pockets” of high-quality data and “holes” of relatively little data. The following regional data layers are already available in 1:100000 scale:
Major roads LUFT sites SLIC sites Significant watersheds Calwater watersheds Land use
However, other data themes still need to be updated:
Above-ground tank sites Quaternary geology Stream channels
2. Increase staff access to GIS software. The Regional Board recently purchased a number of Arcview licenses that will enable more staff to access the Board’s GIS coverages. A distribution plan for these licenses is being developed and should be implemented in early 2002. In addition, the use of web-based GIS tools (such as ArcIMS) should be explored.
3. Develop staff training aids. Improved access to GIS data and software will also increase the need for technical support and assistance in the usage of the GIS tools. A staff training covering basic GIS and data acquisition issues should be scheduled. Additional training documents (handouts, Powerpoint presentation slides, etc.) as well as information regarding classes and workshops on more advanced GIS topics could be made available via the Board Intranet web site.
4. Increase public access to Regional Board data layers. Many of the Regional Board’s data layers could be made available for public download on either the Regional Board’s website or from the state GIS portal (http://gis.ca.gov). Policies for data distribution should be formulated and FGDC- or state-compliant metadata for all Regional Board coverages should be developed.
San Francisco Bay Region 74 January 2002

III. WATERSHED BASED ACTIVITIES
As described above, we have three levels of watershed management: 1) San Francisco Bay regionwide 2) county watersheds; and 3) subwatersheds. Watershed-based activities implemented on a regionwide basis are discussed above in the Section II Regionwide Activities of this document. Activities associated with county watershed management areas and subwatersheds are discussed below. The descriptions include a discussion of issues pertinent to allocation and use of staff resources.
A. County Watershed Management Area ActivitiesWe are committed to implement all of our surface water related programs on a watershed basis. However, given the current work demands within each county watershed, our experience is that current staffing levels are barely adequate to implement “baseline” watershed planning activities. Therefore, based on our priorities, we have worked to redirect our staff resources within and between subwatersheds. Our ultimate goal is to participate in development of watershed management plans for each county watershed management area.
Baseline Watershed Activities
Watershed Management Division staff working within each of the county watershed management areas are responsible for core regulatory programs (water quality certifications, stormwater NPDES, non-chapter 15 Waste Discharge Requirements) and nonpoint source programs. In addition, staff oversee 319(h) grants, provide technical guidance on specific watershed projects, and conduct public outreach and education efforts. As we gain experience in watershed management, we are continually evaluating ways to be more efficient. For example, we intend to evaluate the increased use of general permits, where appropriate. We will also seek opportunities to coordinate permit reissuance on a watershed basis.
As we continue to work on our internal priority setting process, our goal will be to develop watershed workplans in cooperation with local stakeholders. For now, we have developed strategies that describe the watershed, significant issues, and specific work tasks. The strategies are based on priorities identified by Board staff in each watershed management area. In subsequent years, we hope to have increasing involvement from stakeholders in our priority setting process.
The following sections describe each watershed area, summarize significant issues, and provide a plan for the next two years. Each section includes a regional map, based on the 1995 Basin Plan watershed boundaries, which includes the major watersheds and subwatersheds discussed in the county section.
The county watershed management area plans include outputs for: Major and minor municipal NPDES permits; Municipal stormwater NPDES permits; Water quality certifications; Pretreatment program;
San Francisco Bay Region 75 January 2002

Waste Discharge Requirements (non-Chapter 15); Nonpoint source management; Outreach and education; Watershed management projects; Reclamation (water recycling or water reuse); Contract management (104(b), 205(j), 319(h), Prop 13 grants, etc.); and TMDLs
Appendix A contains schedules for completing major, minor, and storm water NPDES permit reissuance, compliance inspections, non-chapter 15 waste discharge requirements, pretreatment inspections and audits, and TMDLs.
San Francisco Bay Region 76 January 2002

#
#
#
#
#
#
#
#
#
#
# #
#
#
#
#
#
Pleasanton
Livermore
Fremont
Newark
Hayward
Union City
San Leandro
Alameda
Oakland
Emeryville
Berkeley
Albany
El Cerrito
San Ramon
San Lorenzo
#CastroValley
Alameda
Creek
San
Lorenzo
Creek
Dublin
San
Leandro
Creek
Piedmont
Lake Merritt
Temescal Creek
San
Francisco
Bay
Arroyo del Valle
Arroyo del Valle
Arroyo d e la Laguna
Arroyo Hond o
Alameda C r eek
Alameda Creek
Glen Echo Cr.
Cordonices Cr.
Seminary Cr.Arroyo Viejo
Sausal Cr.
HarborBay Isl.
HaywardMarsh
Calaveras Res.
0 2 4 6 8 MilesN
County boundaryRegion 2 boundary
Stream
Watershed boundaryMajor watershed nameAlameda Cr.
Other waterbody nameSausal Cr.
Highway# Hayward City
AlamedaCreek
Watershed
Alameda Co.Santa Clara Co.
Contra Costa Co.
Alameda Co.
Alameda Co.
San Mateo Co.
Contra Costa Co.
Alameda Co.
%&'P
%&'P
!"#E%&'P
123]%&'V
%&'V
%&'R
%&'R
<=Â
<=Â<=̧
<=ÿ
<=÷
<=÷
%&'P
Figure III-1. Alameda County Significant Watersheds
San Francisco Bay Region 77 January 2002

B. Alameda Watershed Management Area
Bordering the east bay shoreline of San Francisco Bay, Alameda County encompasses 738 square miles of land and has a total population of approximately 1.5 million. Highly urbanized in the western portion, eastern Alameda County still has considerable agricultural and open space lands (although substantial land development is predicted during the next 10 years). The County has 500,000 acres of rangeland and grazeable woodlands. Elevations range from sea level along the 36 miles of bay shoreline to 3,817 feet in the Diablo Mountain Range south of Livermore. The County is approximately 32 miles long in a north-south direction and 45 miles wide (Figure II-1).
The county is a diverse combination of land types and forms: the western portion contains an urban corridor running between Berkeley and Fremont with a narrow fringe of marshlands along the Bay and considerable open space in the East Bay Hills. The eastern portion of the county varies from gently rolling terraces and alluvial plains to the steep V-shaped upland areas. The population is concentrated in the highly urbanized Bay Plain along the Bay and suburban sprawl east of the East Bay Hills.
Northern Alameda County imports its drinking water from Sierra Nevada sources serviced by the East Bay Municipal Utility District. There are five major reservoirs in the County, three of which are located in the Alameda Creek watershed. Southern and eastern Alameda County also relies on groundwater basins to augment surface water supplies.
Several creeks in Alameda County are considered impaired as a result of the potential for diazinon discharges to adversely affect aquatic life. Diazinon is a broad-spectrum organophosphate pesticide used for agricultural pest control, structural pest control, landscape maintenance, and other home and garden applications. Runoff from urban areas contains diazinon at levels potentially harmful to some aquatic organisms. Alameda Creek, Arroyo de la Laguna, Arroyo del Valle, Arroyo Hondo, San Leandro Creek, and San Lorenzo Creek have been named specifically because substantial parts of their watersheds include developed urban areas and because they support beneficial uses related to freshwater aquatic habitat. Diazinon may also be of concern in other Alameda County creeks, particularly if they pass through urban areas and support aquatic life. The Regional Board is developing a diazinon Total Maximum Daily Load (TMDL) which will address pesticide toxicity in Bay Area urban creeks. Through this process, it will investigate the extent of the problem, identify diazinon sources, allocate diazinon loads among the sources, and implement control measures.
Lake Merritt is considered impaired as a result of floating material and organic enrichment (low dissolved oxygen). In addition, Alameda County storm water and wastewater contribute to impairment of San Francisco Bay, and the Regional Board is developing TMDLs to address water quality problems in the Bay, such as mercury, copper, and polychlorinated biphenyls (PCBs).
Some of the major creeks, which are receiving attention from local community groups include: Alameda (remnant steelhead population), Sausal, Glen Echo, Seminary, Codornices, Arroyo Viejo, San Leandro, San Lorenzo, and Temescal Creeks. In addition, the largest constructed
San Francisco Bay Region 78 January 2002

marsh in the Region, Hayward Marsh, and Harbor Bay Island, a constructed lagoon, are located in Alameda County.
Alameda Creek is a significant water body in the East Bay as its watershed spans three counties: Alameda, Contra Costa and Santa Clara, and it makes up more than half of the entire East Bay watershed area. To the west, its tributaries drain from the Coast Range, to the east from the foothills of Mt. Hamilton. The creek flows recharges the Niles Cone groundwater basin before emptying into San Francisco Bay. Biologically, it is one of the most significant watersheds in the region, due to the great diversity of species found there, and because it harbors one of the few remaining remnant steelhead populations in the East Bay. Concerns about aquatic habitat in this watershed include fragmentation caused by urbanization, herbicide and pesticide use, stream habitat degradation caused by excessive cattle grazing and associated soil erosion, direct livestock impacts to stream corridors through bank scarring and collapse from animal passage, similar impacts from wild pigs, and stream obstructions. A stakeholder group of livestock and rangeland managers has formed to begin to address these issues in the entire Alameda Creek watershed.
Several efforts are underway in the Alameda Creek watershed to remove barriers to steelhead migration. The Alameda County Public Works Agency received funding from U.S. Army Corps of Engineers to construct a fish ladder past the primary barrier to anadromous fish migration on Alameda Creek. This fish ladder will consist of a large concrete railway bridge support structure in Fremont. The Alameda Creek Alliance, a local citizens’ group, actively supports this proposal. Some progress is occurring on lands controlled by the East Bay Park District and the City and County of San Francisco.
Flows in the upper reaches of the Alameda Creek watershed are controlled by water releases from the Calaveras Reservoir, which is managed by the City and County of San Francisco. The Calaveras Reservoir captures natural runoff and stores imported water from the Hetch Hetchy reservoir. Issues in this reach include soil erosion, yellow star thistle, pathogens and nutrients from cattle grazing. The intermediate area of the watershed is controlled by the Zone 7 Water district, which harvests the local runoff. Supplies for public and wildlife use come from the State Water Project. Issues in this reach include sedimentation and erosion. The Alameda County Water District manages the lower reaches of the watershed. Water from Alameda Creek is used for groundwater recharge in the Niles Cone groundwater basin. Issues in this reach include equine facilities that are located near creeks, increasing vineyard development, and pollution threats to groundwater recharge areas from upstream activities.
Water recycling and reclamation are important issues discussed in the Alameda Creek Watershed Management Initiative. The local grape growers, agriculture, and new development are examining the use of recycled water for irrigation. In addition, wastewater dischargers promote water recycling. Local water purveyors have been discussing groundwater injection of highly treated (reverse osmosis) recycled water for drinking. Wastewater discharges include two deep-water outfalls into Central San Francisco Bay (East Bay Municipal Utilities District, East Bay Dischargers Authority and Livermore Amador Valley Water Management Agency). A portion of the Union Sanitary District discharge is reclaimed into the Hayward Marsh.
San Francisco Bay Region 79 January 2002

The Alameda Countywide Stormwater Program began in 1987 and uses a watershed approach to stormwater pollution problems in the county. It is an effort of the fourteen cities in Alameda County, and the County working together under a Municipal NPDES Stormwater Permit. This program incorporates the key program elements of industrial inspection and illicit discharge control, public participation and public outreach, municipal maintenance enhancement, and new development stormwater pollution controls. This program, working closely with Alameda County Public Works Agency staff and Board staff, has taken an innovative, leadership approach to solving many difficult problems. While much remains to be accomplished on the path to clean stormwater runoff, this program has demonstrated that a great deal can be done with a reasonable resource commitment. It has been successfully coordinating a watershed management approach, including regulatory compliance amongst all municipalities.
Significant Issues
Urban runoff Stream and wetland impacts from new development Water quality impairment from pesticide runoff Water quality impacts from industrial and commercial site development Stream and Wetland Habitat Protection Wetland and stream alterations in hillside and bay-adjacent development Modification to creeks for flood-control maintenanceImpacts from pollutants Degradation of groundwater quality in Livermore Valley from salt loading Impacts in Upper Alameda, Arroyo Laguna and San Lorenzo Creeks from cattle grazing and
rangeland management Water quality impacts associated with Dublin/Livermore reclaimed water projects Unknown impacts from large number of unpermitted utility, construction, and other
temporary discharges Discharges to impaired 303(d) listed waterbodies (lower S.F. Bay) Impacts to creeks from discharges of turbid and high pH waters from quarries and mines in
Livermore Valley Program implementation by RWQCB staff and local partners More proactive response to major development plans by RWQCB staff More effective implementation of California’s NPS Management Measures relating to
agricultural and grazing lands by RWQCB, local agencies, and landowners More effective leveraging and oversight of grants Stormwater program improvements through critical review and comment on annual reports
Proposed Workplan for FY 2002/03 and 2003/04
Urban Runoff Review and comment on annual report from Alameda Countywide Clean Water Program Conduct annual storm water progam auditStream and Wetland Habitat Protection Develop an agreement with flood control agencies for long-term maintenance of waterways Establish general permit for 401 certification with Alameda County Flood Control District Take action on over 130 anticipated 401/404 water quality certifications
San Francisco Bay Region 80 January 2002

Impacts from Pollutants Complete and implement the City of Livermore groundwater recharge projects Update the Livermore Valley Water Reuse Master Permit Monitor and assess Union Sanitary District’s shallow water discharge at Hayward Marsh Reissue NPDES and Waste Discharge Permits (see Appendix A, Sections 1-3 for schedule) Complete pretreatment compliance inspections (see Appendix A, Section 4 for schedule) Conduct annual compliance inspections (see Appendix A, Section 5 for schedule)Program Implementation Provide guidance on permanent new development stormwater treatment measures, Assess adequacy of industrial stormwater inspections component, and seek improvement
where necessary, Oversee 319 grants in Livermore Valley, San Lorenzo and Alameda Creek Watershed
management Take enforcement actions as needed
High Priority Unfunded Activities
Develop BMP’s for grazing for water district and park watersheds, and general rangeland Work with NRCS and RCD on grazing issues Oversee reclamation process in Livermore Valley Participate in salt management activities in Livermore Valley Participate in Alameda Creek Watershed Management Initiative Issue general permit for low threat de minimus discharges Complete CEQA review Develop an agreement with flood control agencies for long-term maintenance of waterways Assist in removing barriers to anadromous fish migration on Alameda Creek
High Priority Projects for Grant Funding
(See also Table II.D.4) Riparian habitat and stream restoration projects
San Francisco Bay Region 81 January 2002

#
#
#
#
#
#
#
#
#
#
#
##
#
#
#
#
#
#
#
#
Concord
Pittsburg Antioch
Clayton
Martinez
Walnut Creek
Pleasant Hill
Hercules
Orinda Lafayette
Moraga
Danville
San Ramon
Dublin
Oakland
Berkeley
Albany
El Cerrito
Pinole
San Pablo
Richmond
Arroyo delHambre
(AlhambraCreek)
Walnut
Creek
Pine
CreekSan
Pablo
Creek
San
Leandro
Creek
Pinole
Creek
Wildcat Creek
Rodeo
Creek
San
Lorenzo
Creek
Alameda
Creek
Carquinez StraitSan
PabloBay
Solano Co.
Contra Costa Co.
Marin
Co.
Cont
ra C
osta
Co.
Contra Costa Co.
Alameda Co.
Contra Costa Co.
Alameda Co.
San
Francisco
Bay
San Ramon Creek
Grays
o n C
reek
Waln
ut C
r eek
0 2 4 6 MilesN
County boundaryRegion 2 boundary
Stream
Watershed boundaryMajor watershed namePine Cr.
Other waterbody nameWalnut Cr.
Highway# Moraga City
%&'R
%&'P
!"#E
%&'R
<=²<=²
<=Â
%&'P
%&'P
!"#E
<=̧
%&'P
Figure III-2. Contra Costa County Significant Watersheds
San Francisco Bay Region 82 January 2002

C. Contra Costa Watershed Management Area
The Contra Costa Watershed Management Area (Figure II-2) includes areas within the jurisdiction of 17 municipalities and the county’s unincorporated areas. The county is bounded by San Francisco Bay and San Pablo Bay to the west, by Suisun Bay and the channels of the Sacramento and San Joaquin Rivers to the north, the south by Alameda County, and to the east by San Joaquin County. The total area is approximately 800 square miles and contains a population of 962,900 (2000 census). The dominant demographic phenomenon has been the significant increase in urbanization of the county at the expense of agricultural land, which has declined by half since 1940. Contra Costa also has the largest number of municipal and industrial dischargers in the Region.
The County is divided into 3 geographic areas: West County, Central County, and East County.
West County – contains 27% of the urbanized area in the county and contains a mixture of residential and commercial and industrial uses. Only 10% of this watershed is in agriculture. Major industries in this area include petroleum refineries and chemical companies. The major creeks are Wildcat and San Pablo, which discharge into San Pablo Bay.
Central County – is the largest of the watersheds located in Contra Costa County and drains mostly residential areas. The largest land use designation is undeveloped at 48%, 44% is urbanized, with less than 5% in agriculture and only 3% is publicly owned. The major drainage areas are Grayson/Walnut Creek, San Ramon and Arroyo del Hambre, which drain into Suisun Bay and the Carquinez Straits.
East County - is predominantly undeveloped with agricultural uses comprising 70% of the watershed. Urbanized land uses comprise only 13% of the land area and the major receiving water is the Delta; however, most of this area is outside our Region’s jurisdiction.
Municipal water supply is provided to the county by two main water purveyors. East Bay Municipal Utility District (EBMUD) provides water service to a large portion of the East Bay, including the urbanized western portion of the County as well as to central portions. Most of this water comes from the Mokelumne River. The Contra Costa Water District (CCWD) provides water service to the urban areas in the north of the county. The CCWD obtains its water from the Central Valley Project, via the Contra Costa Canal.
The predominant economic resources of the county include the petroleum and chemical industries and agriculture. The dominant trend in local agriculture in Contra Costa County since 1940 has been a significant decrease in the amount of acreage in production. Much of this decline is attributable to the increasing urbanization of the region. In Contra Costa County, land in all types of active agricultural uses (cropland and grazing lands) has declined by almost half, from over 400,000 acres in 1940 (85% of the County’s total land area) to almost 216,000 acres in 1987 (46% of all County lands). The largest money-producing crops now are nursery crops (bedding plants, cut flowers, Christmas trees) and vegetables. Range and pasturelands account for a large portion of total agricultural acreage in the County.
San Francisco Bay Region 83 January 2002

The wide variety of terrain found in Contra Costa County supports several rare and endangered species and provides many acres of open space for recreational use. Major land forms include tidal and freshwater marshes along the bays and delta; sloughs, islands and tracts in the delta itself; and, inland, grasslands and mountain ridges, riparian woodlands, oak and redwood forests, among others.
Significant Issues
Urban Runoff Stream and wetland impacts from new development Water quality impairment from pesticides, fertilizers, animal waste, automobiles, and other
typical urban runoff pollutants Changes to the hydrograph of watersheds due to development and increase of impervious
surfaces Water quality impacts from industrial and commercial site developmentStream and Wetland Habitat Protection New development impacts Loss and degradation of wetland and riparian habitat Destabilization of stream channels due to hydrologic impacts Construction and post-construction sedimentation of streamsImpacts from Point Source Pollutants Wastewater discharges from major industries Increasing major industries in East County (e.g., two new proposed power plants with
proposed water reclamation for cooling) Proposed redevelopment of several industrial sites, with potential use of wetlands for
wastewater treatment along with traditional discharge methods Dioxin and selenium limits in NPDES permits NPDES permits now being scrutinized and appealed more than previously Inclusion of pollution reduction and waste minimization requirements in industry permits Effluent toxicity from POTWs Development and implementation of mass reduction load at petroleum refineriesProgram implementation by RWQCB staff and local partners Continued proactive response to major development plans by RWQCB staff Effective implementation of California’s Nonpoint Source Program Management Measures
by RWQCB, local agencies, and landowners. Effective use of grants as a tool for achieving watershed management and water quality,
through active recruitment of applications, and leveraging and oversight Continue to gain stormwater program improvements through critical review and comment on
annual reports
Proposed Workplan for FY 2002/03 and 2003/04
Urban Runoff Oversee Contra Costa Countywide Stormwater Program including: review annual report,
follow up on requirements issued as a result of our review of the Program, and assist with runoff issues associated with construction and new development
Educate municipal and County staff in the Planning and Building and Grading Inspection departments, to clarify our expectations of their role in protecting water quality
San Francisco Bay Region 84 January 2002

Stream and Wetland Habitat Protection Take action on over 100 anticipated CWA Section 401water quality certifications, including
appropriate WDRs and mitigation monitoring reports; for new development, inspect projects sites and take enforcement actions as necessary.
Train and educate municipal and County staff to enforce water quality at their level, with support from the Regional Board, in cases where their own actions are not sufficient
Impacts from Point Source Pollutants Reissue NPDES and Waste Discharge Permits (see Appendix A, Sections 1-3 for schedule) Complete pretreatment compliance inspections (see Appendix A, Section 4 for schedule) Conduct annual compliance inspections (see Appendix A, Section 5 for schedule) Review reasonable potential analysis for 303(d) pollutants from stormwater NPDES
discharges into impaired water bodies Resolve outstanding issues with major NPDES permitsProgram implementation by RWQCB staff and local partners Take enforcement actions as needed Continue to foster the activities of the Contra Costa County Watershed Forum and associated
organizations, in grant applications. Encourage their partnerships with local government (especially the Contra Costa Clean Water Program and Community Development Department)Encourage education of citizens on water quality issues, especially towards training of a County-wide volunteer-based water quality monitoring program
Utilize grants to: create a volunteer-based water quality monitoring program; support watershed characterization efforts, conduct restoration and invasive species removal activities; foster citizen water quality education programs.
High Priority Unfunded Activities
Wastewater reuse - on-site alternative reclamation projects Support development and implementation of the San Ramon Valley High School’s
Environmental Engineering (E2) Academy Watershed outreach/education
- Continue outreach to Contra Costa Watershed Forum, a group on non-profit creek groups, and county, state and federal agencies; meeting since April, 1998 to address issues involving creeks in the County
High Priority Projects for Grant Funding
(See also Table II.D.4) Development of a citizen monitoring program, through a partnership between the Clean
Water Program and the Watershed Forum (or through equivalent groups) Planning activities at county-wide as well as local watershed levels (through the Contra
Costa Watershed Forum); fostering creek groups and encouraging restoration projects; long-term planning for new development mitigation issues (now under the auspices of the CCWF)
Riparian habitat and stream restoration projects, including further improvements to the Alhambra Creek watershed
San Francisco Bay Region 85 January 2002

0 2 4 6 8 MilesN
County boundaryRegion 2 boundary
Stream
Watershed boundaryMajor watershed nameCoast Cr.
Other waterbody nameLaguna L.
Highway# Novato City
Sonoma Co.
Marin Co.
Walker
Creek
Drakes Estero
LimantourEstero
AbbottsLagoon
Tomales Bay Estuary
Olema Creek
PineGulch
Cr.
Coast Creek
Alamere Creek
Lagunitas
Creek
Bolinas Lagoon
McKennanGulch Cr.
RedwoodCreek
RodeoCr.Coyote
Creek
San Antonio Creek
Novato Creek
Arroyo CorteMadera
del Presidio
Miller Creek
Corte
Madera
Creek
SanRafaelCreek
GallinasCreek
#Novato
#
#
#
#
#
Pt. Reyes Station
Sausalito
Tiburon
Mill Valley
San Rafael
)}
)}
)}
%&'P
<=̄
<=Î
<=N
<=R
<=·
SF Co.Marin Co.
Sonoma Co.Marin Co.
Nicasio Creek
Petaluma RiverArroyo Sausal Cr.
Chileno Cr. Laguna Lake
Keys Cr.
San Geronimo Cr.
BonTempeLake
Devil's Gulch
Eskoot Creek
Figure III-3. Marin County Significant Watersheds
San Francisco Bay Region 86 January 2002

D. Marin Watershed Management Area
Overview
Marin County covers 521 acres and is bounded on the west and south by the Pacific Ocean, with significant coastal bay and lagoon habitats, on the north by Sonoma County, and on the east by San Pablo Bay (Figure II-3). Marin offers a wide variety of topography, climate, and vegetation, from the tidal flats of San Francisco Bay and the rocky intertidal coastline to the slopes of Mt. Tamalpais (2,600 ft), from the dense stands of coastal redwood to inland grasslands and oak woodlands. A significant feature of Marin is the 141,400 acres of recreational open space of Mt. Tamalpais State Park and the Point Reyes National Seashore, which are a draw for the entire Bay Area. The county can generally be divided into two sections, with differing land uses, population densities, and water quality issues. East Marin consists of the relatively heavily urbanized corridor along Highway 101, where land uses are primarily housing, commercial, and light industry, with a few heavier industrial uses, mostly within or adjacent to the Cities of San Rafael and Novato, such as cement manufacturing, rock quarrying, and machine shops. The area around Sausalito has a number of boatyards and marinas, as well as residual sediment contamination from years of wartime boat building activities. The western portion of the county is largely rural, with major land uses being agricultural (dairies, grazing, and some vineyards and specialty farming) and parklands (federal, state, and county). This area has small treatment plants and on-site septic systems.
Watersheds
The major watersheds in eastern Marin County are (from north to south) Miller Creek, Gallinas Creek, Novato Creek, San Rafael, Corte Madera Creek, and Arroyo Corte Madera del Presidio. Miller, Gallinas, San Rafael, and Novato Creeks flow eastward from semi-rural headwaters through urban areas and discharge into San Pablo Bay. Corte Madera Creek and Corte Madera del Presidio flow southeastward through highly urbanized valleys and discharge into San Pablo Bay and Richardson Bay, respectively.
In west Marin, Lagunitas, Olema and Walker Creeks make up the greater Tomales Bay watershed. Lagunitas, with its major tributaries of San Geronimo and Nicasio Creeks, flows northeastward and discharges into Tomales Bay. Olema Creek flows northwest along the San Andreas fault and discharges into Lagunitas Creek near its mouth. Walker Creek flows north-northwest and discharges into Tomales Bay. Both Lagunitas and Redwood Creeks are significant Coho salmon spawning creeks in Central California. On the coastal side, Redwood Creek flows from Mt. Tamalpais through Muir Woods National Monument and discharges into the Pacific Ocean at Muir Beach. Eskoot Creek in Stinson Beach and Pine Gulch Creek in Bolinas, are small coastal streams containing steelhead.
On the west side of the County is Tomales Bay, which at 6800 acres is one of the major estuaries on the Pacific Coast of California. Its diverse ecosystem supports abundant and diverse wildlife, and it is a very popular recreation area for kayaking, hiking, and sightseeing. Tomales Bay is one of four commercial oyster growing areas in the State and is also known for its commercial fisheries and recreational crabbing, clamming and fishing. A local stakeholder group, the
San Francisco Bay Region 87 January 2002

Tomales Bay Watershed Council, was formed in October 2000 and is working to develop a watershed plan.
Bolinas Lagoon, located at the southern end of the Point Reyes Peninsula, is another significant Pacific Coast estuary. In 1998, the Lagoon was designated a Wetland of International Importance by the United States Fish and Wildlife Service in 1997, the only wetland along the west coast of the continental U.S. outside Alaska to be so designated. A total of 447 species of birds, fish and other animals make their home here. The lagoon covers 1,100 acres and is a critical link in the chain of wetlands along the Pacific Coast flyway where migratory birds can feed and roost before moving on. More than 24,000 water birds, such as loons and grebes, and 20,000 shorebirds, including sandpipers and long-billed curlews, visit each year. The lagoon also serves as a nursery about 200 harbor seals, one-fifth of California's harbor seal population, who use the lagoon to rest, molt, warm themselves and give birth to some 50 pups each spring. The foremost resource management issues for Bolinas Lagoon are the continuing sediment accumulation and loss of estuarine habitat. The U.S. Army Corps of Engineers is currently carrying out a feasibility study to determine alternatives for restoring the lagoon’s tidal prism, and the Bolinas Lagoon Technical Advisory Committee (which includes Regional Board staff) is planning to initiate a watershed planning process.
Significant Watershed Issues in West Marin
All of the eastern creeks are on the impaired waterbody list for pesticides. Water bodies in west Marin on the 303(d) list are Tomales Bay (nutrients, sediments, pathogens, and mercury), Lagunitas Creek (nutrients, sediments, and pathogens), and Walker Creek (nutrients, sediment, and mercury). Impacts from sediment are also documented in Bolinas Lagoon. In response to the passage of the state Shellfish Protection Act in 1993, which designated Tomales Bay shellfish beds as threatened by rainfall-related coliform levels, the Regional Board established the Tomales Bay Shellfish Technical Advisory Committee, to determine remediation measures for the shellfish growing areas. Potential coliform sources include dairies and other confined animal facilities, grazing animals, septic systems, recreational use and wildlife. In May 1997 there was an outbreak of Norwalk virus, a human pathogen, transmitted by the consumption of oysters. A TMDL is currently being developed for pathogens in Tomales Bay. Oyster farming in Tomales Bay has also been impacted by sediment build up at the mouth of Walker Creek.
Lagunitas Creek and Walker Creek, the two major tributaries to Tomales Bay, are two of our initial planning watersheds for the Surface Water Ambient Monitoring Program (SWAMP). Lagunitas Creek watershed, the largest in the county, drains 103 square miles of west central Marin, from the headwaters on the north slope of Mount Tamalpais to the southern tip of Tomales Bay. The first eight miles of Lagunitas Creek are dammed for municipal drinking water (21.5 sq. mi. of watershed) by the Marin Municipal Water District (MMWD). as the creek flows through a series of reservoirs to Peters Dam. Much of the watershed is within federal or state park lands or Marin Municipal Water District (MMWD) lands, although a significant portion is residential and ranching land.
Lagunitas and its tributaries, including San Geronimo Creek, Devil’s Gulch, and Olema Creek provide prime habitat for coho salmon, steelhead, and California freshwater shrimp. The
San Francisco Bay Region 88 January 2002

watershed supports 10% of California’s coho salmon runs, approximately 500 fish. The reduced flow from the reservoirs has dramatically altered stream flows, thereby affecting aquatic habitat. The lack of flushing flows means that sand and fine gravels are not transported, so excess bed sedimentation impairs fish habitat. Temperature, dissolved oxygen, and bed composition are all affected by reduced flow.
Grazing impacts, while not as severe as in the Walker Creek watershed, are nonetheless present. The watershed is listed as an impacted water body because of coarse sediment yield, with a focus on San Geronimo Creek.
Order # WR 95-17: Lagunitas Creek from the State Water Resources Control Board (1995) required MMWD to produce and implement a sediment and riparian management plan for the reach between Peters Dam and Tocaloma as mitigation for the 1982 Kent Lake enlargement. The order delineates provisions to protect coho salmon, steelhead, and California freshwater shrimp, including flow and sediment requirements, woody debris placement, and monitoring of turbidity, dissolved oxygen, and water temperature.
In response to this order, MMWD prepared a sediment and riparian management plan. Regional Board staff participate in the Lagunitas Creek Technical Advisory Committee which reviews elements of the plan and provides guidance to MMWD in its implementation.
Water quality sampling for SWAMP is proposed to include: flow, temperature, dissolved oxygen, and biological indicators at reference sites in the protected upper watershed above Peters Dam; flow, temperature, dissolved oxygen, and sediments in Lagunitas Creek below Peters Dam, in Nicasio Creek below Seeger Dam, and San Geronimo and Olema Creeks to monitor conditions for the salmonid fishery and the freshwater shrimp; sediment monitoring up and downstream from the confluence of Lagunitas and San Geronimo Creeks to monitor for erosion control; pathogens and nutrients monitoring to monitor septic system leaks on San Geronimo Creek; and Nutrient and pesticide testing below the golf courses at Bon Tempe Lake and on San Geronimo Creek.
Walker Creek is listed as impaired for nutrients, siltation, and metals and is also considered impaired by exceedances of coliform. The Walker Creek watershed is 73 square miles, mostly in northwestern Marin County, with a small portion in Sonoma County. The northern landscape of the lower watershed has open, low rolling hills, while the upper watershed has rugged canyons toward the southeastern headwaters. The creek is considered protected habitat by the U.S. Fish and Wildlife Service for coho salmon, steelhead trout, and California freshwater shrimp.
An abandoned mercury mine (Gambonini Mine) is located east of Tomales Bay. Baseline monitoring over the last three years indicated that the mine site is discharging a large quantity of mercury-laden sediment and is a significant source of mercury to Walker Creek. The site poses a significant threat to the beneficial uses of Walker Creek and Tomales Bay. Baseline monitoring and investigation are ongoing, with work now shifting towards developing and implementing remedial strategies. The Board is conducting a five-year Gambonini Mine Post-
San Francisco Bay Region 89 January 2002

Remediation Monitoring (begun in winter 1998-99), sampling for dissolved oxygen, salinity, conductivity, pH, temperature, total suspended sediments, and mercury at eight sites near the mine. Cleanup of this mine is a top priority for Marin County and our Planning staff.
Water quality sampling for SWAMP is proposed to include: nutrient, pathogens, and sediments in Walker Creek and the tributaries of Keys, Chileno, Arroyo Sausal, and Salmon Creeks to monitor for the effects from grazing, the major land use impact; pathogens and nutrients at Laguna Lake to monitor levels of input at the headwaters of Chileno Creek; pathogens and nutrients to monitor septic system leaks below Tomales on Keys Creek; and flow, temperature, dissolved oxygen, and sediment below Soulejoule Reservoir to monitor conditions for the salmonid fishery.
Other significant water quality issues in west Marin County watersheds include road erosion, hill and gully erosion and impacts to stream corridors, runoff from confined animal facilities (dairy and horses),The County has been an active participant in the six county FishNet 4C program, which is working with county governments under funding from SB271 to develop ways in which county governments can be more responsive to fishery concerns. Regional Board staff work closely with the FishNet 4C and County staff, and we see this as a landmark effort to work with local government to protect the beneficial uses of the fish bearing streams in both east and west Marin areas.
Significant Watershed Issues in East Marin
In eastern Marin, significant water quality issues include wetland modifications associated with new development and flood control in creeks and along the Bay shoreline, including a proposed flood control project on Corte Madera Creek, a large dredging project in the Bahia lagoon, and a major erosion control project on Novato Creek. Other issues include restoration of tidal and seasonal wetlands, e.g. Hamilton AFB, Petaluma River, Bel Marin Keys. There is also a need for a number of assessments, including on-site sewage systems in Tomales Bay watershed and other rural areas to determine pollutant impacts and potential remediation strategies. Other potential pollutant issues are impacts on San Francisco and Tomales Bays from pollutants from marinas, houseboats, and boatworks and pollutant discharges and dredging impacts from recreational lagoons adjacent to creeks and San Francisco Bay. All of the eastern creeks in Marin are included on the impaired waterbody list for pesticides.
The County has an active countywide stormwater program (Marin County Stormwater Pollution Prevention Program or MCSTOPPP) that has a creek and watershed awareness focus and has been doing pilot creek assessments in several eastern Marin creeks as well as a bioassessment program. The County program is active in working on urban runoff control issues and a large focus of the next two years will be on preparing for Phase II stormwater permitting MCSTOPPP will also be working on the County’s pesticide reduction program as part of the Regional Board’s pesticide TMDL.
Watershed GroupsCurrently, there are watershed management projects in progress in many watersheds throughout the County. These projects are lead by local resource conservation districts, local community
San Francisco Bay Region 90 January 2002

groups, and volunteer monitoring groups. Regional Board staff participate in meetings, provide technical support, and oversee grants.
Watershed Lead(s) ActivitiesCorte Madera Creek County, Friends of Corte Madera Creek
WatershedWatershed plan, fisheries study, sediment study, pilot bioassessment
Arroyo Corte Madera del Presidio (Mill Valley)
Mill Valley StreamKeepers, Marin County Stormwater Program bioassessment
Public education, creek assessment, bioassessment.
Lagunitas Creek Marin Municipal Water District (MMWD), RWQCB, CA Fish & Game, County, etc.
Sediment and riparian corridor management plan, fisheries.
San Geronimo Creek MMWD, Salmon Protection & Watershed Network (SPAWN)
Sediment management plan, fisheries assessment restoration, education.
Miller Creek Marin County Watershed assessment, bioassessment.
Novato Creek Marin County Watershed assessment, bioassessment.
Redwood Creek (Muir Woods)
National Park Service Watershed assessment, volunteer monitoring.
Bolinas Lagoon Bolinas Lagoon TAC/US Army Corps of Engineers
Feasibility studies for abating sedimentation
West Marin Watersheds, Olema Creek, Pt. Reyes
National Park Service Coho salmon studies/restoration.
Tomales Bay Watershed Council
Tomales Bay Watershed Council formed of local stakeholders, Marin RCD, County, agency representatives
Developing watershed plan
Hamilton Wetlands Coastal Conservancy, US Army Corps Proposed tidal wetlands restoration
North Bay Watersheds in Marin and Sonoma
North Bay Watershed Association, a consortium of water agencies, stormwater and local government
Developing regional watershed planning and assessment
Proposed Workplan for FY 2002/03 and 2003/04
Urban Runoff Oversee countywide stormwater program including reviewing MCSTOPPP’s annual report
and conduct annual stormwater program audits of each municipality Work with County on development and implementation of Phase II stormwater permittingStream and Wetland Habitat Protection Take action on over 40 to 50 anticipated 401/404 certifications Work with MCSTOPPP to develop biotechnical bank stabilization guidelines and potential
regional or watershed permitting Work with Marin RCD and Sustainable Conservation on regional permit for restoration
projects on agricultural lands
San Francisco Bay Region 91 January 2002

Impacts from Pollutants Take enforcement actions as needed Confined animal waste program: develop priority inspection program Continue ongoing post-remediation mine site monitoring and assessment Continue ongoing downstream monitoring; focused investigation of the potential impacts of
mercury to the beneficial uses of Tomales Bay Tomales Bay Activities
Oversee Shellfish Technical Advisory Committee and develop Tomales Bay shellfish contamination source identification and remediation strategy in conjunction with pathogen TMDL
Work with Tomales Bay Watershed Council to develop remediation efforts for shellfish pollution and in developing overall watershed stewardship plan
Continue work on the Tomales Bay pathogen TMDL Annual sampling of Richardson Bay for coliform (houseboat and marina areas) Reissue NPDES and Waste Discharge Permits as needed(see Appendix A, Sections 1-3 for
schedule) Complete pretreatment compliance inspections (see Appendix A, Section 4 for schedule) Conduct annual compliance inspections (see Appendix A, Section 5 for schedule)Program Implementation by RWQCB staff and local partners Contract management for 319(h) grant awarded to Marin County RCD for Walker Creek Contract management for Prop 13 grant awarded to Marin RCD for implementation of best
management practices to address runoff from dairy and grazing lands and boating and other recreational activities in Tomales Bay watershed
Participate on Lagunitas Creek Technical Advisory Committee Participate on Bolinas Lagoon Technical Advisory Committee and Habitat Evaluation Panel Revise septic MOU with county to ensure adequate regulation of individual on-site systems
and develop strategy to regulate large on-site systems Work cooperatively with BCDC to improve nonpoint management measures for marinas
High Priority Unfunded Activities
Grazing and rangeland management Investigate development of no-discharge zone in Tomales Bay Inspections of boatyards and marinas and work with private marinas to put in permanent
pump-out stations Lagoon management and potential issuance of WDRs
High Priority Projects for Grant Funding
(see also Table II.D.4) Tomales Bay: pollution source analysis, development of best management practices for
sediment, pathogens, nutrients, and metals, and development of a watershed plan Inspections and remediation strategy for inadequate and/or failing on-site sewage systems in
Tomales Bay, San Geronimo Valley, and other rural areas Miller, Novato, and Corte Madera Creeks: development of watershed plans and
implementation of sediment budget study recommendations; watershed monitoring
San Francisco Bay Region 92 January 2002

Comprehensive watershed analysis and restoration plans to protect threatened and endangered salmonids: Lagunitas Creek, Olema Creek, and Redwood Creek.
Geomorphic analysis of Walker Creek watershed Purchase of existing wetlands and diked baylands for restoration along San Francisco Bay Development and implementation of watershed plan for Tomales Bay Watershed.
San Francisco Bay Region 93 January 2002

Redwood Cr.Carneros Creek
Huichica Cr.
A rro
yo S
eco
Cr.
Napa
River
SonomaCreek
Petaluma
RiverSan Antonio
Creek
Tolay Creek
TolocayCr.
Napa
River
Lake Chabot
Laurel Creek
Ledgewood Creek
Suisun
Creek
Sonoma Co.Marin Co.
Solano Co.Contra Costa Co.
Napa Co.Solano Co.
Solano Co.Contra Costa Co.
Napa Co.Solano Co.
#
#
Petaluma
Sonoma)}
#
#
Calistoga
St. Helena
#
#Napa
Yountville
#
#Fairfield
Vallejo
#Benicia
# Martinez# Hercules
#Novato
)}
<=Î <=Î
<=N <=R
<=R
<=·
<=Ç
<=Y
<=R
!"#E
!"#E%&'T
%&'R
<=Ç
<=·
<=Ç
<=Y
<=·
SuisunBay
Suisun Marsh
Suisun City#
SanPablo
Bay
Carquinez S tra its
Mare I s.Union Cr
.
Santa Rosa#
Lake Hennessy
# American Canyon
Rector Creek
Angwin#
0 2 4 6 8 MilesN
County boundaryRegion 2 boundary
Stream
Watershed boundaryMajor watershed nameNapa R.
Other waterbody nameUnion Cr.
Highway# Sonoma City
Figure III-4. Significant Watersheds in Napa, Sonoma, and Solano Counties
San Francisco Bay Region 94 January 2002

E. Napa Watershed Management Area
The Napa River Watershed (approximately 430 square miles) is the portion of western Napa County within our jurisdiction. Eastern Napa County (approximately 360 square miles) is within the Central Valley Regional Board. The watershed is predominately rural, with the fastest growing landuse is urban housing. The largest community, Napa, has a population of 72,585 (2000 census). The Napa River is intermittent in the northern reach, but becomes perennial due to groundwater discharge. The Napa River is a significant freshwater tributary to San Francisco Bay. Wastewater discharges to the Napa River occur during the wet season only; during dry months 100% of wastewater flows are reclaimed.
The Napa River and numerous tributaries support steelhead, federally listed as a threatened species. Additionally, the California Freshwater Shrimp (Syncaris pacifica), listed as endangered by state and federal government, resides within the watershed. The beneficial uses include: Cold Freshwater Habitat, Warm Freshwater Habitat, Fish Spawning, Fish Migration, Preservation of Rare and Endangered Species Habitat, Wildlife Habitat, and Municipal and Domestic Water Supply. The extensive marshlands bordering the lower river teem with hundreds of thousands of migratory birds during the fall and spring, and host two endangered species, the California clapper rail and the salt marsh harvest mouse.
The watershed supplies 85% of the county’s total water demand through its ground and surface water production. The cities of Calistoga, American Canyon, Napa and Yountville also receive water from the State Water Project.
The Napa River is on the 303(d) list for nutrients, pathogens, and siltation. The sediment listing is based predominately on qualitative visual assessments of the Napa River and its tributaries by Board and CDF&G staff. It is suspected that nutrient loading is one cause of exceedences of the water quality objectives for biostimulatory substances and dissolved oxygen. Staff also believe that the standards for total and fecal coliform are not being achieved in some parts of the watershed.
Many local, state and federal agencies are involved in watershed protection efforts in the Napa River Watershed. The Napa County Board of Supervisors convened a Napa River Watershed Task Force (NRWTF) in February 1999. This task force is comprised of local citizens selected for their expertise and their ability to represent the views of interest groups within the Napa County community. Numerous agencies including the Regional Board, Natural Resources Conservation Service (NRCS) and the Napa County Resource Conservation District (RCD) are advisory to this task force. The short-term mission of this task force is to make recommendations to the County Board of Supervisors regarding interim measures specific to the development of vineyards, and intended to protect the economic, ecological and social health of the community. It is anticipated that this forum will continue to serve as a long-term task force to address important issues in the Napa Valley such as the sediment TMDL, and surface and ground water allocations.
San Francisco Bay Region 95 January 2002

The Napa RCD is a leader in many aspects of Napa County’s watershed management activities. Their efforts have lead to successful implementation of several community based water quality projects.
Significant Issues
Urban Runoff Impacts from new developmentStream and Wetland Habitat Protection Need for comprehensive baseline watershed assessment Alteration of flow regime due to water diversions and flood control levees and
channelization leading to:a) dry season streamflow reduction by surface water diversions and groundwater
extractionb) peak flows during wet season potentially increases flooding and stream bank failurec) flooding and associated flood management practices
Development and loss of wetlands south of Napa in the airport industrial area. Loss of riparian habitat due to farming practices.Impacts from Pollutants Impairment in the Napa River and tributaries due to siltation, nutrients, pathogens, and
possibly dissolved oxygen, high temperature, and eutrophication, impacts in the Napa River. Wastewater discharge impacts on surface water and groundwater.Program implementation by RWQCB staff and local partners More active response to major development plans by RWQCB staff More effective implementation of California’s NPS Program Management Measures by
RWQCB, local agencies, and land owners. More effective leveraging and oversight of grants Stormwater program improvements through review and comment on annual reports
Workplan for FY 2002/03 and 2003/04
Urban Runoff Review and comment on the annual baseline stormwater programStream and Wetland Habitat Protection Take action on over 12 anticipated 401/404 certifications Oversee contract with UC Berkeley to conduct watershed assessment and sediment budget
as part of a sediment TMDL-equivalent process. Coordinate with NRCS, Napa RCD, Fish and Game, Napa Flood Control District and Napa
County government agencies to address erosion sources not covered by county ordinance by participating in monthly Conservation Information Group (CIG) meetings.
Ongoing participation in development of the Napa River Flood Management issues: Oversight of timely cleanup of TPH-impacted sites along the Napa River Oversight and participation on technical advisory committee
Impacts from Pollutants Reissue NPDES and Waste Discharge Permits (see Appendix A, Sections 1-3 for schedule) Complete pretreatment compliance inspections (see Appendix A, Section 4 for schedule) Conduct annual compliance inspections (see Appendix A, Section 5 for schedule)
San Francisco Bay Region 96 January 2002

Program Implementation by RWQCB staff and local partners Pursue enforcement against estimated 2-10 erosion or illegal fill violators Work with the Napa RCD and give priority to RCD/NRCS-funded creek restoration
activities Pursue a general permit and WDR’s for RCD/NRCS-lead creek restoration activities Monitor vineyard conversion (development) in sensitive watersheds such as Angwin lakes,
Lake Hennessy and Rector Creek Take enforcement action as needed
High Priority Unfunded Activities
Conduct CEQA review of new development projects Build upon existing monitoring and assessment efforts to develop linkages to TMDL
baseline monitoring assessment needs
High Priority Projects for Grant Funding
(see also Table II.D.4) Salmonid habitat restoration proposed by Department of Fish and Game. RCD/NRCS has
had success in obtaining these grants. Board should support their efforts. There are 11 additional grant concepts for the Napa River watershed including: development
of a historical reference state model for determination of a sediment TMDL, beneficial use survey and assessment, limiting factor analysis for steelhead, implementation of vineyard erosion best management practices, current and historical hydrology and water budget analyses, study of groundwater discharge effects on stream recharge and temperature, nutrient source assessment and development of source reduction best management practice, implementation of nutrient source reduction best management practices, evaluation of pesticide use and water quality monitoring, radio telemetry flyover to obtain watershed basemap, and development of GIS system to integrate information.
San Francisco Bay Region 97 January 2002

San FrancisquitoCreek
Pescadero Creek
San GregorioCreek
Pomponio Cr.
PilarcitosCreek
BairIsland
San PedroCreek
LakeMerced
Apon
olio
Cr.
Islai
s Cr.
YosemiteCr.
Butano Cr.
Tunit
as Cr.Lo
bitas
Cr.Puris
ma Cr.
San Vincente Cr.
Denniston Cr.
Frenchman's Cr.
LobosCr.
Crystal Springs Reservoir
SanAntonio
LakeSa
n M
ateo
Cr
Redwood Cr.Cordilleras C
r.Belmont Cr.Laurel Cr.
SanBruno
Cr.
Mills Cr. Sanchez Cr.
SFAirport
HuntersPoint
PresidioTreasure Is.
YerbaBuena
Is.Mission
Bay
San Francisco Co.San Mateo Co.
Alameda Co.
San Francisco Co.
Alameda Co.
San Mateo Co.
MissionCr.
Colma Creek
San
Francisco
Bay
##
#
#
#
##
#
#
#
#
#
#
#
#
#
#
#BrisbaneDaly City
S. San Francisco
San Bruno
Pacifica Millbrae
Burlingame
San Mateo Foster City
Belmont
Redwood CitySan Carlos
Half Moon BayEast Palo Alto
Menlo Park
Atherton
Woodside
Portola Valley
S an
Mat
eo C
o.Sa
nta
Clar
a Co
.
0 2 4 6 8 MilesN
County boundaryRegion 2 boundary
Stream
Watershed boundaryMajor watershed nameMills Cr.
Other feature nameBair Is.
Highway# Brisbane City
+§
+§
+§
<=÷
<=÷
<=÷
<=̄
<=̄
<=̄
!"#E
%&'L
%&'L
%&'L
<=ÿ
<=ÿ
<=Ì
<=Ì
Figure III-5. San Francisco and San Mateo Significant Watersheds
San Francisco Bay Region 98 January 2002

N
EW
S
0 2 64
Miles
East
Marina
LobosDowntown
I s l a i s
South
Visitacion
Westside
Bay
Plain
Richmond sub-area
Berkeley
sub-area
Oakland
sub-area
San Leandro
sub-area
San Lorenzo
sub-area
May 12, 1999
Groundwater in these areas is an existing or probabledrinking water resource. The basins are deep, withdepths ranging from 500 to over 1000 feet. Waterquality and well yields are generally sufficient formunicipal supply.
Limited Drinking Water ResourceGroundwater in these areas has a limited potential toserve as a significant drinking water supply. Thebasins are shallow, with depths generally less than300 feet. While water quality is good, well yields aregenerally not sufficient for municipal supply. However,groundwater in these areas is used for backyardirrigation, industrial supply and commercial irrigation.
Non-Potable Water ResourceGroundwater in these areas is non-potable due topoor water quality. In portions of the East Bay andbeneath Treasure Island, shallow groundwater to adepth of about 100 feet is brackish due to naturallyoccuring saltwater intrusion. In the San FranciscoDowntown Basin, water quality is poor due tohistoric industrial development and limited freshwater recharge. Well yields may be sufficient forindustrial or irrigation uses.
Proposed Groundwater Management Zones
Summary of Groundwater Basin Evaluations: Northern San Francisco Peninsula and East Bay Plain
Significant Drinking Water Resource
San Francisco Bay Regional Water Quality Control Board
Groundwater sub-area boundaryHighway
Groundwater basin boundary
August 31, 1999
Figure III-6. San Francisco Groundwater Basins
San Francisco Bay Region 99 January 2002

F. San Francisco Watershed Management Area
At the center of our Region, both geographically and symbolically, is the City and County of San Francisco (the City), which share the same boundary. Located at the tip of a narrow 46.7 sq mi. peninsula, San Francisco County is bounded by the Pacific Ocean to the west and by San Francisco Bay to the north and east. With a population of approximately 776,700 (2000 census), San Francisco is the most densely developed of the Region’s nine counties. Northeast San Francisco is the most developed, with commercial downtown high-rises and apartment buildings. The southeastern part of the City is largely industrial and residential, with limited open space. The eastern shoreline is largely developed and devoted to maritime and industrial uses, some of which are obsolete. Accordingly, there are numerous redevelopment projects along the shoreline. The west side of the City is predominately residential, but also features large open spaces including Golden Gate Park, Lincoln Park, the Golden Gate National Recreation Area (which encompasses the Presidio, Ocean Beach, and Fort Funston), Lake Merced, and several golf courses surrounding the lake. The County also includes Treasure Island and Yerba Buena Island in San Francisco Bay, which belong to the U.S. Navy (Treasure Island is in the process of being transferred to the City as part of the base closure program), and Alcatraz Island, formerly the site of the notorious federal prison and now part of the State Park system. The City also has several other base closure sites (Hunter’s Point, the Presidio) where land is being turned over for redevelopment, with attendant issues of toxic cleanups, groundwater remediation, and redevelopment.
San Francisco is unique in the region in several significant ways: 1) although the City has several large groundwater aquifers, it relies completely on imported surface water from Hetch Hetchy reservoir in the Sierra Nevadas, 2) most of San Francisco has a combined sanitary sewerage and storm water collection system and outfalls (CSOs), 3) the County is almost completely built out and has a very high proportion of impervious surfaces and therefore lack of groundwater recharge areas, and 4) there are virtually no stream systems left in the County, with the exception of some bayside tidal sloughs (Mission Bay, Islais Creek, Yosemite Creek) and a few small lakes and streams within the Presidio and other parks.
Elevated levels of nitrates are the most pervasive groundwater quality problem in San Francisco, with fertilizers and leaking sewers as potential sources. Other water quality issues include toxic cleanups at former military bases, potential water reclamation and groundwater reuse, impacts associated with redevelopment projects on the base sites and along the southeast shoreline, stormwater impacts from non-CSO areas of the City, and direct discharges into San Francisco Bay from shoreline areas. Staff has increased industrial inspections along the shoreline piers and will also be working with the City on Phase II permitting for these areas and other non-CSO parts of the City. Recently, San Francisco County has completed both groundwater and reclaimed water master plans that reflect the goal of diversifying water supplies. There has also been increasing focus on Lake Merced, an important wildlife habitat and recreational area in the southwest corner of the City, since water diversions to nearby golf courses and other uses have had severe impacts on the lake. San Francisco and San Mateo Counties have been working on solutions to the problem, including the possibility of diverting stormwater from the combined sewer facilities in that area or using reclaimed wastewater for irrigation rather than taking water
San Francisco Bay Region 100 January 2002

from the lake. Regional Board staff will be actively involved in reviewing any of these proposals for potential impacts on beneficial uses.
Another major issue in the City and County is the proposed large scale expansion of the San Francisco airport, which would require extensive bay fill. Although the airport is within the County of San Mateo, the City of San Francisco owns and operates the airport facilities and is of course involved in all decision-making. Staff will be part of any pre-project review and permitting activities relating to the airport.
Groundwater Resources
The City is considering further development of its groundwater resources. Current groundwater usage in the City is primarily for irrigation of parks and golf courses. San Mateo County withdraws groundwater for potable uses, resulting in declining water levels of Lake Merced. Seven groundwater basins (Westside, Lobos, Downtown, Marina, Islais Valley, South and Visitation Valley basins) occur beneath the City, delineated and separated on the basis of bedrock ridges and topographic divides. The Lobos, Marina, Downtown and South Basins are contained wholly within the City limits. The Islais Valley Basin extends beneath Daly City, Visitation Valley extends beneath the City of Brisbane, and the Westside Basin extends south of the City across several political boundaries (the Cities of Daly City, Colma, South San Francisco, San Bruno, and Millbrae) past the San Francisco International Airport. Westside Basin is the most promising basin in terms of groundwater development. It is the largest basin in San Francisco in areal and vertical extent, and composed primarily of course-grained materials. Groundwater in the southern portion of the Westside Basin and Lobos Basins is already used for potable purposes and is routinely sampled and analyzed for compliance with drinking water standards; therefore, the groundwater in these basins is considered potable.
Groundwater in the northern portion of the Westside Basin is also considered potable based on limited historic data and preliminary sampling results obtained in 1993; however, the data indicates that occasional concentration of nitrates, chlorides, iron, total dissolved solids, and fecal coliform have been detected above drinking water standards. Downtown Basin groundwater is being considered for nonpotable uses only (i.e., toilet flushing, irrigation, and climate control) because of the historic industrial development and the density of identified hazardous waste sites. Groundwater within the remaining basins (Marina, Islais Valley, South and Visitation Valley Basins) have not yet been fully assessed. The City’s Water Department will need to address several technical and institutional issues (i.e., saltwater intrusion, subsidence, leakage from leaking tanks and sewer utilities, etc.), before utilizing groundwater for potable uses.
San Francisco Groundwater Beneficial Use Designation Project In 1996, the Regional Board’s staff Groundwater Committee completed a report titled “San Francisco and Northern San Mateo County Pilot Beneficial Use Designation Project, Draft Staff Report.” This effort included a comprehensive evaluation of hydrogeology, future groundwater uses, and alternatives for revised beneficial use designations. The results are summarized below and incorporated into the Basin Plan Amendments available at:
San Francisco Bay Region 101 January 2002

http://www.swrcb.ca.gov/%7Erwqcb2/basin_plan_ammend.htm.
The Basin Plan should be amended to include more recent information regarding the boundaries and beneficial uses of groundwater basins on the San Francisco Peninsula.
The MUN beneficial uses should be dedesignated for the Downtown Groundwater Basin and Treasure Island.
A prioritization map for groundwater management is shown in Figure III-6.
Significant Watershed Issues
Military base conversion at Hunter’s Point, Treasure Island, and the Presidio, and associated water quality concerns related to storm water, groundwater contamination, and redevelopment
Stormwater runoff contamination leading to Phase II permitting for non-CSO areas of San Francisco, including federal and state facilities
Water quality impacts of fish processing and other facilities along the waterfront of the Port of San Francisco
Beach closures due to coliform contamination at Baker, China, Ocean and Ft. Funston beaches; beaches proposed for 303(d) listing as impaired waterbodies
Contaminated sediments in Islais, Mission, and Yosemite Creeks Wetland restoration and associated toxic hotspots Caltrans construction of new Bay Bridge and associated stormwater runoff pollutants,
wetland impacts, and impacts to Yerba Buena Island Ground water contamination and associated reclamation and potential drinking water
concerns Re-development projects at Mission Bay, Treasure Island, Ferry Terminal, Port of San
Francisco, and the Presidio Protection of Beneficial Uses and water reclamation at Lake Merced Increasing contaminant levels of PAHs in dredge sediments from yearly dredging at Piers 33
and 35 by the Port of San Francisco Exotic species in nearshore waters of San Francisco and wetland restoration sites
Proposed Workplan for FY 2002/03 and 2003/04
Review and comment on the Port of San Francisco stormwater program Stormwater inspections for fish processing facilities, boatyards, and other waterfront areas;
request and review stormwater management plans Development of a municipal storm water permit under Phase II for non-combined sewer
system areas, including Lake Merced and the Port of San Francisco Staff review of Presidio treatment plant and reclamation proposal Hunter’s Point ecological risk assessment for offshore sediments; records of decision for
groundwater remediation Treasure Island ground water extration and TPH remediation; review proposals for
redevelopment; review dreding proposals Implementation of proposed 303(d) listing for beach closures
San Francisco Bay Region 102 January 2002

Review of dredging proposals by the Port of San Francisco Take action on approximately 20 anticipated 401/404 permits Reissue NPDES Permits as necessary (see Appendix A, Sections 1-3 for schedule) Complete pretreatment compliance inspections (see Appendix A, Section 4 for schedule) Conduct annual compliance inspections for NPDES major and minor permit holders (see
Appendix A, Section 5 for schedule) Review of San Francisco airport expansion proposals and pre-project permitting activities
High Priority Unfunded Activities
Study the effects of CSO on the sediments and water surrounding the outfalls Increased monitoring and assessment of potential contaminants, including the use of marine
mammal testing Beach monitoring Development of a Wellhead Protection Program
High Priority Projects for Grant Funding
(see also Table II.D.4) Best Management Plan for Fish Handling Facilities Best Management Plan for Marinas and Piers Monitoring of beaches to address closures and remediation Education and outreach activities
San Francisco Bay Region 103 January 2002

G. San Mateo Watershed Management Area
San Mateo County is located on a peninsula, bordered on the north and east by San Francisco Bay and on its west by the Pacific Ocean (Figure III-5). The county, which has 20 cities, covers about 450 square miles with the majority of the population concentrated in the eastern part of the county. The San Mateo Range runs north/south through the county on its western side. The western part of the county has considerable amounts of agricultural and open space lands, with pockets of urbanization particularly in the northern part of the county in Daly City and Pacifica and around Half Moon Bay. To the east of the range lies the flat, more densely urbanized area. About 26 percent (74,300 acres) of the county’s total 285,000 acres is considered urbanized.
San Gregorio Creek, Pescadero Creek and San Francisquito Creek are listed as impaired water bodies (303(d) list) for sediment due to degradation of salmonid habitat. All three water bodies support steelhead trout runs. Steelhead trout are Federally-listed as threatened in central California. Coho salmon are still thought to be present in Pescadero and San Gregorio Creeks, and these basins are listed as top priority streams in Department of Fish and Game’s Coho recovery plan for streams south of the Golden Gate. Coho salmon are State-listed as endangered (south of the Golden Gate) and Federally-listed as threatened in central California. National Marine Fisheries Service staff has stated that the risk of extinction of Coho salmon south of the Golden Gate is higher than for almost any other run of salmonids on the west coast (S.Kramer, personal communication).
We have prepared a workplan to establish and implement Total Maximum Daily Loads for sediment to address potential sediment problems in the listed creeks. Of vital importance in this effort is the initiation of holistic watershed assessments to determine whether sediment is actually a major factor limiting salmonid populations or whether watershed disturbances are of equal or greater importance as limiting factors (e.g., water diversion, reduction in large woody debris loading, stream temperature, etc.). A number of stakeholder forums have been established in the west county watersheds as part of locally initiated Coordinated Resource Management Planning (CRMP) processes. These and other ongoing projects are listed in the following table.
Watershed Lead ActivitiesSan Francisquito Creek San Francisquito CRMP CRMP, volunteer
monitoring nutrient pollution assessment, flood management planning, riparian planting
Pilarcitos Creek CA Fish & Game, San Mateo Co RCD Creek Restoration, management plan, fish passage, sediment budget
Pescadero/Butano Creeks San Mateo Co RCDMonterey Bay National Marine Sanctuary
Watershed assessment, sediment budget, creek stabilization
San Gregorio Creek San Mateo Co. RCD Mainstem channel restoration near mouth
Bair Island Peninsula Open Space Trust Tidal marsh, seasonal
San Francisco Bay Region 104 January 2002

Watershed Lead Activitieswetland, upland restoration
San Pedro Creek San Pedro Creek Watershed Coalition Watershed assessment, creekside resident education/outreach, exotic vegetation removal, biotechnical bank stabilization, fecal coliform source ID testing
The coastal waters of San Mateo County are within the Monterey Bay National Marine Sanctuary. This presents opportunities for collaboration with other water resource protection efforts, such as the Sanctuary’s Agricultural Initiative. Pescadero Creek watershed has been selected as a pilot basin for initial implementation of the Agricultural Initiative in San Mateo County; these efforts hold tremendous promise if they can be effectively implemented. In addition, the San Mateo Stormwater Pollution Prevention Program (STOPPP) effort is being expanded to provide baseline watershed inventory and assessment information in the San Francisquito Creek watershed. We are currently working with the San Francisquito Joint Powers Authority (JPA), which includes representatives from the Santa Clara Valley Water District, San Mateo County Flood Control District, and the cities of East Palo Alto, Menlo Park, and Palo Alto, to address water quality and flood control issues within the watershed. The JPA has received a Proposition 13 grant, and we have formed an inter-disciplinary Technical Advisory Committee to initiate a sediment budget study of the watershed.
San Mateo County has implemented a confined animal waste ordinance that has reduced pollution from horse boarding facilities. San Mateo County and the town of Portola are currently considering adopting creek setback ordinances.
On July 21, 1999, the Regional Board reissued an NPDES permit for San Mateo Countywide Stormwater program(twenty cities and towns and unincorporated areas). The permit requires reduction of pollutants in stormwater discharges to the maximum extent practicable and the elimination of unauthorized non-stormwater discharges. It also requires reduction of pollutants that cause or contribute to violations of water quality standards. The permit requires the permit holders to implement Stormwater Management Plans (the Plans), which specify the measures that are needed to control pollutants in stormwater. The Plans consist of a series of pollution control activities designed to identify and implement control measures to reduce, if not eliminate, pollutants in storm runoff to the maximum extent practicable and to demonstrate compliance with water quality objectives in receiving waters. STOPPP is required to submit annual report(s) that include evaluation of the effectiveness of the Best Management Practices and Performance Standards for each pollutant control measure. Furthermore, STOPPP is required to identify types of activities that need improvements and implement them accordingly. STOPPP is also required to evaluate sources and loadings, as well as management measures, for pollutants including diazinon, PCBs, and mercury.
San Francisco Bay Region 105 January 2002
Significant Issues
Urban Runoff Stream and wetland impacts from new development Water quality impairment from pesticide runoff Water quality impacts from industrial and commercial facilities and illicit dischargesStream and Wetland Habitat Protection Declining steelhead and Coho salmon habitats in coastal streams. Uncertainty in current stream conditions due to a lack of watershed assessment data Degrading stream quality from rural road erosion Water quality impacts from proposed San Francisco Airport expansion wetland fill Declining water levels in Lake MercedImpacts from Pollutants Beach pollution and closures from sewage overflows Creek pollution by nutrients from horse stables Water quality impacts from coastal agricultural facilities, including irrigation runoff,
fertilizer and pesticide discharges, and habitat impacts on tributary creeksProgram Implementation by RWQCB staff and local partners Regulating water quality compliance at new Pacifica wastewater treatment facility Groundwater management of the Westside Basin More effective implementation of California’s Nonpoint Source Program Management
Measures by RWQCB, local agencies, and land owners. More effective leveraging and oversight of grants Gain stormwater program improvements through critical review of annual reports Technical assistance and support for county planning and public works staff (streambank
ordinance, rural road maintenance standards, CEQA review)
Proposed Workplan for FY 2002/03 and 2003/04
Urban Runoff Oversee San Mateo County Urban Runoff Program including: review annual report, conduct
annual audit, and assist with runoff issues associated with construction and new development, participate in technical advisory committee meetings.
Amendment municipal storm water permit to include revised new development standardsStream and Wetland Habitat Protection Review and approve or disapprove applications for 401 water quality certifications,
approximately 50 applications per year.Impacts from Pollutants Reissue NPDES and Waste Discharge Permits (see Appendix A, Sections 1-3 for schedule) Complete pretreatment compliance inspections (see Appendix A, Section 4 for schedule) Conduct annual compliance inspections (see Appendix A, Section 5 for schedule) Resolve outstanding issues with major NPDES permits Implement TMDL workplan components Program Implementation by RWQCB staff and local partners Oversee 319(h) grants for Pescadero Creek and Apanolio Canyon Oversee Proposition 13 grant for San Francisquito Creek Oversee Pilarcitos Creek restoration
San Francisco Bay Region 106 January 2002

Take enforcement actions as needed
High Priority Unfunded Activities
Enforce water quality violations from horse stable operations Review of CEQA documents Document and follow-up on suspected septic systems discharges into creeks during storm
events that lead to beach closures Assist in implementing strategies from Agricultural and Rural Lands Action Plan published
by the Monterey Bay National Marine Sanctuary
High Priority Projects for Grant Funding
(see also Table II.D.4) Limiting factor analysis of San Francisquito Creek watershed Watershed assessments to confirm or reject siltation/sediment listings, and determine
whether there are other causes for impairment (e.g., riparian impacts, flow depletion, nutrients)
Implement initial restoration and management actions in impaired watersheds Establish stakeholder forum(s) and watershed management plans to promote proactive
problem solving by local entities. Include priority listing of actions needed to resolve watershed disturbances, and initial recommendations for salmonid recovery
Facilitate multi-agency coordination and consolidation of Endangered Species Act (ESA) and Clean Water Act (CWA) mandates
San Francisco Bay Region 107 January 2002

0 2 4 6 8 MilesN
County boundaryRegion 2 boundary
Stream
Watershed boundaryMajor watershed nameStevens Cr.
Other waterbody nameSilver Cr.
Highway# Milpitas City
Alameda Co.Santa Clara Co.
San
Mat
eo C
o.S a
nta
Cla r
a Co
.#
#
#
#
#
#
#
##
#
#
#
#
##
# Milpitas
Fremont
San Jose
Morgan Hill
Campbell
Los Gatos
Saratoga
Cupertino
SantaClara
Sunnyvale
Mt. View
Los Altos
Palo Alto
Menlo Park
Woodside
Redwood City
Alameda
Creek
Coyote
Creek
Guadalupe
River
San FrancisquitoCreek
Mat
ader
o Cr
.
PermanenteCreek
StevensCreek Ca
laba
zas
Cr.
Sara
toga
Cr.
Los G
atos
Cr.
Guad
alupe Cr.
Alamitos Cr.GuadalupeRes.
Calero Res.
San
Francisco
Bay
Upper Pene tencia Cr.
Silver Creek
+§
+§
+§ %&'V
%&'V
<=¼
<=÷
<=Ì
<=ø
<=Ô %&'R
%&'L
%&'L
Figure III-7. Santa Clara County Significant Watersheds
San Francisco Bay Region 108 January 2002

H. Santa Clara Watershed Management Area (Santa Clara Basin)
The Santa Clara Basin encompasses the extreme South Bay (south of the Dumbarton Bridge) and those areas of Santa Clara County that drain to the South Bay, including the eastern slope of the Santa Cruz Mountains, the Santa Clara ("Silicon") Valley, and the western slope of the Diablo Range. Within Santa Clara County, the Basin consists of eleven watersheds including the Coyote Creek watershed on the east side of the valley, the Guadalupe River watershed which drains the south-central portion of the valley, the southern half of the San Francisquito Creek watershed on the western boundary of the Basin, a series of small, relatively urbanized watersheds that drain the remainder of the west side of the valley, and the Baylands.
The Basin has a population of approximately 1.7 million, and is mostly urbanized, with some agricultural uses in the rural upper watershed areas. It is one of the fastest growing counties in California.
Water Quality and Aquatic Beneficial Use Issues
Wastewater discharges into San Francisco Bay from the Silicon Valley have been an ongoing issue for Board staff. The discharge from the San Jose/Santa Clara wastewater treatment plant goes into historic salt marshes in the South Bay. The discharge has caused conversion of portions of the salt marsh to brackish marsh, which is significant since two endangered species rely on the salt marsh habitat. In response to this the Board has required mitigation for converted habitat and adopted the "South Bay Action Plan" to limit flows from the treatment plant. The Action Plan includes reclamation, conservation, and environmental enhancement projects.
Santa Clara County has more than 700 miles of creeks and rivers (Figure III-7). Agricultural and urban development have encroached into the original floodplains of many reaches of most of these streams. Reduced floodplains in combination with increased runoff from development have increased erosive forces of streams, resulting in increased soil erosion in some locations and increased soil deposition in others. The various types of development have reduced riparian vegetation which historically provided increased channel stability, shading, instream habitat cover, and a food source for aquatic invertebrates. Flood management channel modifications, both concrete and earthen, have, in most instances, eliminated natural floodplains, instream habitat, and riparian vegetative canopy. Urban stormwater runoff has increased the pollutants discharged to the streams. These impacts have not been uniformly distributed throughout all streams. Some reaches of some streams, especially, though not exclusively, in the upper undeveloped areas of the watersheds, have retained sufficient value to sustain fisheries and riparian habitat.
The Basin includes the region's most significant groundwater resource, the Santa Clara Valley. The boundary of the Santa Clara Valley groundwater basin is the contact between valley fill and the bedrock formations at the surface and beneath the fill. The aquifers of the Santa Clara Valley consist of 1) the forebay, 2) upper aquifer zone, and 3) the lower aquifer zone. The Santa Clara Basin receives its major recharge in the forebay from stream infiltration, applied irrigation water, and percolation ponds. Most of the groundwater pumped from the basin is from the lower
San Francisco Bay Region 109 January 2002

aquifer zone. Groundwater supplies approximately 50% of the potable water supply for the residents of the Santa Clara Valley. The other 50 % comes from imported water that is stored in surface reservoirs along with local rainfall and runoff.
Groundwater is extremely important to the Santa Clara Valley and protection of this resource is therefore very important. Industrial and agricultural activities have contributed to the degradation of the groundwater in some parts of the Santa Clara Valley. Pollutants that contaminate shallow groundwater have found their way into the deeper drinking water zones through a combination of leaky aquitards and numerous improperly abandoned wells. Development in the Basin margins has removed large portions of the recharge area from the hydrogeologic regime. This has a two-fold effect on the regions groundwater. First it reduces the amount of surface area available for water to infiltrate into the aquifers and secondly it places potentially polluting activities in the recharge area.
Several water bodies in the Santa Clara Basin have been designated under Section 303(d) of the Clean Water Act as impaired due to certain pollutants. These include South San Francisco Bay for copper, nickel, mercury, selenium, diazinon, polychlorinated biphenols (PCBs), dioxins, furans, dieldrin, chlordane, and DDT. Urban creeks (Calabazas, Coyote, Guadalupe, Los Gatos, Matadero, San Francisquito, Saratoga, and Stevens) have been listed for diazinon. Water bodies in the Guadalupe River watershed (Guadalupe River, Alamitos Creek, Guadalupe Creek, Calero Reservoir, and Guadalupe Reservoir) have been listed for mercury. San Francisquito Creek has been listed for excessive siltation (sediment) These and other possible listings and progress towards their resolution and will be reviewed as part of update of the 303(d) list due April 2002. Resolution of impairment includes development of TMDLs. TMDLs are currently being developed (see Appendix A, Section 8) for copper and nickel in South San Francisco Bay, mercury, and PCBs in San Francisco Bay as a whole, diazinon in urban creeks, mercury in the Guadalupe River watershed, and sediment in San Francisquito Creek.
In response to the many water quality and aquatic beneficial use problems in the county, considerable local effort is underway in addressing a wide range of issues: wastewater disposal and reuse, urban runoff pollutant reduction, wetland fill impact avoidance and mitigation, watershed assessment and action planning, TMDL development, ecologically-sensitive flood management project design, and development of comprehensive multi-year water quality and watershed health monitoring.
Santa Clara Basin Watershed Management Initiative
We initiated our watershed management effort in the Santa Clara Basin in the summer of 1996 with a series of stakeholder focus group meetings at which we solicited stakeholders' interests relative to watershed management in the Basin. The community embraced this opportunity to accept responsibility for local stewardship of the watershed and created the Santa Clara Basin Watershed Management Initiative (WMI). This WMI is a broad-based stakeholder group of 32 signatories from local, state and federal public agencies, business and trade associations, and civic and environmental groups and programs. The declared purpose of the WMI is " to develop and implement a comprehensive watershed management program - one that recognizes that
San Francisco Bay Region 110 January 2002

healthy watersheds mean addressing water quality problems and quality of life issues for the people, animals and plants that live in the watershed." The WMI has established a mission statement, goals, planning objectives for development of the watershed plan, implementation objectives, and a framework for conducting a watershed assessment. Also, stakeholder forums for development of TMDLs have been established for copper and nickel in Lower South San Francisco Bay, mercury in the Guadalupe River watershed, and sediment in San Francisquito Creek.
The WMI is committed to implement a watershed management planning process for the Santa Clara Basin that integrates the following issues:· habitat and water quality protection and enhancement;· water rights and water supply reliability;· flood management;· regulatory compliance;· land use; and · public awareness and involvement.
The Workplan for the WMI includes preparation of 3 volumes: (1) Watershed Characteristics, (2) Watershed Assessment, and (3) Watershed Action Plan. The Watershed Characteristics Report was published in February 2001. The Watershed Assessment for 3 pilot watersheds is anticipated in draft in February 2002. The Watershed Action Plan is completing preliminary planning early in 2002 and is expected to be completed in December 2002. The Watershed Plan will be based on sound science with broad stakeholder involvement and will integrate existing programs and identify what needs to be done to reduce and prevent pollution and provide for effective land use and waterway management. The comprehensive stakeholder process will be used to reach agreement on the Plan, its priorities and long term implementation.
We are promoting the following eleven actions as desired outcomes of watershed management efforts:
1. Implementation of a comprehensive watershed assessment strategy that identifies problems or otherwise establishes steps to resolve unknowns;
2. Implementation of a comprehensive watershed assessment strategy that identifies sources of problems or otherwise establishes steps to resolve unknowns;
3. Implementation of a comprehensive watershed assessment strategy that identifies solutions of problems or otherwise establishes steps to resolve unknowns;
4. Long-term resolution of municipal wastewater permit issues;5. Long-term resolution of San Jose/Santa Clara wastewater discharge flow cap issues;6. Resolution of urban runoff (municipal stormwater) permit issues;7. Establishment of basis for Basin Plan Amendments (includes consideration of site
specific objectives);8. Assessment and resolution of 303(d) impaired water body listings and development of a
phased TMDL (initial priorities are copper and nickel in South San Francisco Bay, mercury in the Guadalupe River and sediment in San Francisquito Creek);
9. Establishment of a streamlined 404 permit/401 certification process for stream and wetlands fill and dredging projects;
San Francisco Bay Region 111 January 2002

10. Implementation of the Urban Runoff Permit stormwater treatment and hydrograph modification requirements for new development and redevelopment projects; and
11. Development/implementation of a Stream Protection Program to prevent further degradation of stream habitats and associated non-support of aquatic habitat beneficial uses.
The first ten of these outcomes were identified by Regional Board staff in 1997. The tenth outcome has been modified slightly to reflect the current status of the Urban Runoff Permit provisions. The eleventh outcome has been added to reflect the emerging focus on stream functions in relation to beneficial use protection.
To date, the most outstanding successes of the WMI have been in sustaining organizational continuity and in the conducting outreach and information dissemination. After five years, the organization still continues to meet, resolve issues and produce products. Staff and volunteers of key agencies and signatory organizations continue to provide input to the WMI coordinating body and its subgroups. The outreach products have been numerous and well implemented, e.g., the WMI Vision Brochure, the Watershed Watch Media Campaign, publication of the Watershed Characteristics Report, funding of a lecture series, Santa Clara Valley Water District Landuse Summit, and watershed grants to community organizations by the Water District and City of San Jose.
The success of its watershed assessment process has been more limited. The WMI’s three watershed assessments (Guadalupe, Upper Penetencia and San Francisquito), due in draft in early to mid-2002, are being prepared with existing data (rather than a result of a substantial field data collection effort), thereby initially limiting their usefulness. Nevertheless, the assessments may be useful for identifying, and creating a plan to fill, data gaps.
An important current focus of the SCB WMI is the completion of a Watershed Action Plan, targeted for December 2002. This Plan will consist of recommended actions and implementation tasks compiled from input from the various WMI subgroups.
More significant progress is being made by individual WMI member agencies rather than directly through the WMI itself. The Santa Clara Valley Water District’s $8 million 1.8 mile Guadalupe Creek Restoration project is nearing completion. Settlement of a water rights complaint in 2002 is expected to result in the Water District making commitments to significant improvements to fisheries habitat on three stream systems. The San Francisquito Creek sediment analysis under the direction of a Joint Powers Authority is moving forward. The Water District has secured legislative approval to include stream stewardship in its mission and is reorganizing and expanding its staffing to accommodate a watershed stewardship program, including improved monitoring and further development of ecologically-sensitive flood management project design approaches. The WMI has the potential to continue to build upon these individual efforts and create a coordinated effort to implement its well articulated watershed vision.
In 2001, the WMI conducted its own self-evaluation of its performance relative to Regional Board goals and to its own internal goals and objectives and has prepared a list of its
San Francisco Bay Region 112 January 2002

accomplishments (see its self-assessment and accomplishments contained in Appendix B). These self-evaluations reflect the depth of commitment and the seriousness of WMI participants in crafting an effective watershed management program. One aspect emphasized in these documents is the important progress in building institutional relationships which we see as laying the essential groundwork for more substantial watershed planning and improvement actions. Though these groundwork laying activities over the past five years are to be commended, it is hoped that the coming years will see a move towards the completion of more substantial watershed planning and project implementation. It is hoped that the assessments, in conjunction with current discussions shaping a five year monitoring program for the basin, will result in a data collection effort that contributes more to action planning and implementation.
The WMI is at a critical juncture in its history. It can take the assessments and lessons learned to date and step up towards the next level of commitment to robust watershed assessment and project implementation. Or it can choose to continue at groundwork laying stage and produce reports which point in the right direction but delay the hard decisions of resource commitment needed to make the WMI fully realize the purpose for which it was created. The coming two years will be pivotal in the WMI’s history.
During this fiscal year, the Regional Board staff will prepare an analysis of the effectiveness of the SCB WMI process. The analysis will include “lessons learned” and the implications of these “lessons learned” for the future of the WMI and for beginning similar initiatives in other counties of the region. The analysis will also be used in dialogue with the SCB WMI and member agencies towards the end of identifying barriers to WMI effectiveness and strategies to overcome them.
Regulatory Framework
The Board’s major regulatory program thrusts in the county include: NPDES Permits for discharges to surface water from 3 major wastewater treatment
plants NPDES Urban Runoff Program (consolidated permit for 13 municipalities, the County
and the Santa Clara Valley Water District) 401 Certifications and Waste Discharge Requirements for major flood management
capital projects and channel maintenance projects 401 Certifications for other wetland/stream fill projects Waste Discharge Requirements for Landfills and other waste-disposal-to-land facilities Site Cleanup Requirements and NPDES Permits for groundwater cleanup sites TMDL Development, including Guadalupe River Mercury TMDL and San Francisquito
Creek Sediment TMDL Monitoring efforts through the Regional Monitoring Program, Surface Water Ambient
Monitoring Program, and Regional Monitoring and Assessment Strategy
The local Watershed Management Initiative efforts are currently without an explicit regulatory permit driver; hence, the WMI priorities tend to be driven by other programs, such as the Urban Runoff Program requirements, conditions placed on wetland fill certifications, requirements of
San Francisco Bay Region 113 January 2002

federal and state fisheries agencies, citizen advocacy group legal actions, or internal institutional needs.
One of the major participants in watershed management activities in the basin is the Santa Clara Valley Urban Runoff Pollution Prevention Program (SCVURPPP). The Regional Board first issued an NPDES municipal storm water permit to the SCVURPPP in 1990, and reissued the permit in 1995 and 2001. The permit and the SCVURPPP seek to reduce urban runoff pollution through such programs as illicit connection and illegal dumping elimination; industrial and commercial discharge control; maintenance of streets, storm drains, and water utilities; pollutant specific control activities (e.g. pesticides, mercury, PCBs); new development planning procedures; construction inspection; comprehensive monitoring, and public information and participation.
Significant Issues
Urban Runoff Lack of permanent stormwater treatment and hydrograph modification management at new
development/redevelopment projects Operation and maintenance of new development stormwater treatment measures Lack of comprehensive water quality monitoring program Erosion during construction of new development projects Pollution from diazinon and other urban pesticides Insufficient inspection/enforcement follow-up actions for industrial and illicit discharges
Channelization/Stream Maintenance/Flood Management Identification of sources, causes and solutions to significant sediment problems Continued improved stream maintenance practices and associated land use practices Habitat loss and sedimentation from ongoing flood management projects Need for new pilot programs to test innovative ecologically-sensitive multi-objective flood
management design approaches
Stream and Wetland Habitat Protection Wetland losses at new developments Protection and enhancement of riparian buffers Improved process for stream alteration and wetland fill permits Protection of endangered species Restoration of bayland wetlands Lack of comprehensive local programs, policies and implementing ordinances for protecting
stream habitats from further degradation
Pollutants Implementation of pollution prevention action plans and site specific objectives for copper
and nickel Hg impairment in SF Bay and upland watersheds from natural sources and abandoned mines
San Francisco Bay Region 114 January 2002

Resolution of potential sediment impairment Lack of watershed data for Guadalupe Hg and San Francisco Bay PCBs TMDL Lack of watershed data for dioxins and pesticides Lact of watershed data for potential listings (e.g., sediment, trash) and emerging issues (e.g.,
polydibromated ethers, endocrine disrupting substances, pharmaceutically active substances) Toxicity from pesticides MTBE, industrial solvents, and gasoline contamination in groundwater
Wastewater Discharges and Reclamation Reclaimed wastewater for environmental enhancement Mandatory enforcement activities under SB2165
Groundwater Protection Protection of high quality groundwater resources and cleanup of polluted groundwater New development in groundwater recharge zones Wellhead protection plans Potential reclamation in recharge areas
Issues from the Santa Clara Basin Watershed Management Initiative Regulatory streamlining Efficiency of the Regional Board Ongoing resources and funding for the WMI Sustainable water supply in light of explosive growth Better coordination of air quality and transportation regulation
Proposed Workplan for FY 2002/03 and 2003/04
Urban Runoff Oversee implementation of Santa Clara Valley Urban Runoff Pollution Prevention Program
Permit Gain stormwater program improvements through thorough review of annual reports Implement effective monitoring program Assure compliance with new development/redevelopment provisions Implement pollutant-specific provisions (e.g., pesticides, mercury, PCBs) Improve followup aspects of industrial inspection program
Stream and Wetland Habitat Protection Adopt Stream Maintenance Multiyear Permit Review potential significant impacts prior to taking 401 certification/WDR action for:
Upper Guadalupe River, Lower Silver Creek, Adobe Creek, Matadero Creek, Lower Guadalupe, Upper Penitencia Creek
Collaborate with eight other organizations to develop integrated solutions for flood protection, habitat restoration, and community recreation on the Upper and Lower Guadalupe River
Track implementation of comprehensive, long-term stream maintenance plans for Alum Rock Park (Upper Penitencia Creek)
San Francisco Bay Region 115 January 2002

Oversee Santa Clara Valley Water District's sediment removal projects Review of Santa Clara Valley Water District design details for bank stabilization, outfall,
cribwall, and bank grading projects Develop strategy to streamline processing of both WDRs and 401/404 certifications Review 310 acre salt pond conversion mitigation bank project and Los Capitancillos
freshwater marsh mitigation project Take action on over 70 anticipated 401/404 certifications
Impacts from Pollutants Oversee NPDES Permit including: review annual report, conduct annual audit, and assist
with runoff issues associated with construction and new development Complete pretreatment compliance inspections (see Appendix A, Section 4 for schedule) Conduct annual compliance inspections (see Appendix A, Section 5 for schedule) Oversee copper/nickel amended permit compliance Initiate Basin Plan Amendment process for Cu/Ni Leadership role in WMI workgroup for Hg TMDL in Guadalupe Watershed
Program Implementation by RWQCB staff Continue in leadership roles in the Watershed Management Initiative Prepare evaluation of current effectiveness of the WMI, recommendations for improving the
WMI effectiveness and lessons learned for application in other counties Develop strategy to implement a comprehensive Stream Protection Program Take enforcement actions as needed More effective leveraging and oversight of grants
High Priority Unfunded Activities Review of CEQA submittals
High Priority Projects for Grant Funding (See also Table II.D.4) Watershed assessments to confirm or reject mercury and siltation/sediment listings, and
determine whether there are other causes for impairment (e.g., riparian impacts, flow depletion, nutrients).
Implement initial restoration and management actions in impaired watersheds. Support for the development of citizen monitoring efforts to characterize watershed health
and identify pollutant sources Support for the development of public/private partnerships in watershed monitoring Pilot project for attaining beneficial uses in modified stream reaches (including Santa Clara
Basin-wide identification and ranking of modified stream reaches with high potential for restoration of more physically and biologically natural channels.)
San Francisco Bay Region 116 January 2002

I. Solano Watershed Management Area
Solano County is the northernmost of the nine counties within the San Francisco Bay Area. The county’s population of 394,500 (2000 census) is concentrated along the Interstate 80 corridor that runs generally in an east-west direction through the center of the county. Of the county’s 828 square mile area, 64% is in agriculture, although, as with most outlying Bay Area counties, suburban development is causing a decrease in farmland acreage. The landscape of Solano County ranges from flat agricultural land in the north to rolling hills in the south. Along its southern and western borders are San Pablo and Suisun Bays, the Napa River and the Mare Island and Carquinez Straits. The Sacramento River is the eastern boundary of the county. Region 2’s jurisdiction in the county comprises the area that drains into San Francisco Bay and the Carquinez Straits, generally the southwestern half of the county. Figure III-4 shows significant watersheds in the North Bay including Solano County.
Solano County has become a leader in Bay Area growth since the 1980s because it possesses some of the last remaining large tracts of easily developable land in the Bay Area. The major cities in our portion of the county are Vallejo and Benicia at its southern most end, and Fairfield and Suisun City in central Solano county. Vallejo is the largest city in the county with a population of 116,760 (2000 census). Fairfield is the County seat and second largest city, characterized by a maturing center and new development at the fringes, surrounded by crop and grazing land.
The western portion of Solano County is characterized by the large expanses of wetlands composed of marshes, farmed wetlands, islands, sloughs and mudflats forming a crescent along the north shoreline of San Pablo Bay. This crescent is anchored by Mare Island at its eastern most point. The former Mare Island Naval Shipyard consists of over 5,000 acres of developed areas, marshlands, and submerged lands. Environmental concerns at the facility include: landfills, underground storage tanks, oil sumps, PCBs, industrial solvents, sandblasting waste, and ordnance.
The Suisun Marsh, a vast expanse of dikes and vegetated wetlands, marshes, sloughs, islands and mudflats, characterizes a large portion of the eastern part of Solano County. The extensive 10,000 acre open space tract of the Tri-City and County Cooperative Plan forms the upland area to the Suisun Marsh. Travis Air Force Base, which occupies over 6,000 acres in eastern Solano County, is an active military base, and employs a large portion of the county residents.
Significant Issues
Upland erosion and downstream sedimentation in Suisun Marsh and tributaries. Urban runoff (new development, pesticides) Protection of endangered species habitat. Mare Island Base conversion and environmental clean-up. Discharges from refineries Highway 80 sliding, south of Fairfield Refinery discharges
San Francisco Bay Region 117 January 2002

Suisun Marsh Wetlands designated as impaired on 303(d) list, due to metals, nutrients, organic enrichment, low D.O. and salinity; medium priority TMDL
Agricultural pesticides, such as dieldrin, are a potentially important watershed issue in the Union Creek watershed, which runs through Travis Air Force Base and into Suisun Marsh. Fish tissue samples taken and analyzed by the Air Force had pesticide concentrations that were an order of magnitude higher than observed in San Francisco Estuary Regional Monitoring Program sampling. This is a potential impact on the recreational fishery in Suisun Bay.
Redevelopment in and near downtown Vallejo (Brownfields), including cleanup and redevelopment of a former PG&E manufactured gas facility across the Strait from Mare Island and other pending development of waterfront industrial properties.
Underground aqueduct running through Fairfield that is posing a concern to the UST Local Oversight Program. There is potential evidence that this aqueduct trench/backfill system is serving as a sink/conduit for contaminants from fuel sites.
Travis Superfund site and environmental cleanup.
Proposed Workplan for FY 2002/03 and 2003/04
Implementation of recently adopted San Francisco Bay shallow-waters effluent limitations Reissue NPDES and Waste Discharge Permits (see Appendix A, Sections 1-3 for schedule) Complete pretreatment compliance inspections (see Appendix A, Section 4 for schedule) Conduct annual compliance inspections (see Appendix A, Section 5 for schedule) Take action on 401 certification for five-year permit Suisun RCD for levee maintenance Reissue Fairfield-Suisun and Vallejo stormwater permits Oversee storm water programs, including: review annual report, conduct annual audit, and
assist with runoff issues associated with construction and new development Issue approximately 30 water quality certifications per year Take enforcement action as needed
High Priority Unfunded Activities
CEQA review
High Priority Projects for Grant Funding
(See also Table II.D.4) Implementation of management practices to reduce sediment discharges to Suisun MarshHabitat restoration in Suisun Marsh
San Francisco Bay Region 118 January 2002

J. Sonoma Watershed Management Area
Region 2 includes the portion of Sonoma County south of the city of Santa Rosa, which contains the drainage basins of the Petaluma River, Sonoma Creek, and Tolay Creek. The northern portion of Sonoma County is located in the North Coast Regional Board’s (Region 1) jurisdiction. Figure III-4 illustrates significant watersheds in the North Bay, including Sonoma County. These water bodies drain into tidal flats adjoining the north end of San Pablo Bay. The cities of Petaluma and Sonoma are within this management area. Sonoma County is one of the fastest growing counties in California. This growth is resulting in land use changes and associated environmental and water quality issues.
These watersheds support an array of land uses such as vineyards, livestock facilities, croplands, state parks and urban areas. The western part of southern Sonoma County is generally low, rolling hills. Reclaimed San Pablo tidal flats form the lower ends of the two valleys. The valley floors and adjacent hills are farmed intensively. The hills in southwestern Sonoma County are used largely for grazing dairy cattle and sheep.
The Petaluma River and its tributaries drain a total area of about 146 square miles and are situated in both Sonoma and Marin counties. The Petaluma watershed has a diverse range of habitats from redwood and fir forests in the headwaters to chaparral, oak woodland, and bayland areas. In Sonoma County, the Petaluma River receives water flowing out from the hills surrounding the city of Petaluma, which is located in one of two long narrow valleys in the southern part of the county. The city of Petaluma has a population of 54,548 (2000 census) and has a 4.8 mgd wet weather discharge to the Petaluma River. The Petaluma wastewater treatment plant is approaching its discharge capacity and is currently planning an expansion of the plant.
Sonoma Creek drains a 170 square mile area from the Sonoma and Mayacamas Mountains into the Valley. The City of Sonoma is located in the central portion of the valley. The headwaters of Sonoma Creek are located in the upland areas of Sugarloaf Ridge State Park. Sonoma Creek and its tributaries drain onto Sonoma Valley, an area dominated by hillside and valley vineyards. The lower portion of Sonoma creek is tidally influenced and low-lying areas support hay farming, wetlands, and other uses. The City of Sonoma, the largest city in the watershed, has a population of 9,128, and the Sonoma County Water Agency operates a 3 mgd wastewater treatment plant that discharges to Schell Slough from December through April and reclaims water in the summer.
Tolay Creek drains about 10.9 square miles. There are no major tributaries, but there are springs and seasonal drainage ways in the watershed. The Sears Point Raceway is located within the Tolay Creek watershed.
The Sonoma Creek and Petaluma River watersheds support beneficial uses for cold and warm freshwater habitat, fish migration, and preservation of rare and endangered species, fish spawning, wildlife habit, and contact and non-contract recreation. In addition, groundwater is a source of drinking and irrigation water in rural areas of the county. Impacts from agriculture runoff, construction, hillside development, and urban runoff have resulted in the 303(d) listing of Sonoma Creek and Petaluma River for nutrients, pathogens, and sediment.
San Francisco Bay Region 119 January 2002

The lack of up-to-date water quality and watershed information poses the most significant obstacle to developing a meaningful and effective TMDL for nutrients, pathogens, and sediment in both the Sonoma Creek and Petaluma River watersheds. It is suspected that nutrient loading is causing exceedences of the water quality objectives for toxicity, biostimulatory substances, un-ionized ammonia, dissolved oxygen, and total dissolved solids in some waterways. Staff also believe that the standards for total and fecal coliform are not being achieved in some parts of the watersheds. Preliminary sediment evaluation work has been completed in both watersheds; however, a broader watershed study has not been undertaken.
Watershed management efforts are underway in Sonoma Creek and Petaluma River watersheds. The Sonoma Conservancy has been established as a consortium of stakeholders led by the Sonoma Ecology Center and the Southern Sonoma Resource Conservation District. The RCD has completed the “Sonoma Creek Watershed Enhancement Plan” and the “Sonoma Creek Habitat Inventory.” The TMDL stakeholder forum has been established and a project management plan has been prepared. In the Petaluma River watershed, CALFED funds were awarded to the San Francisco Estuary Institute for monitoring and restoration work. The RCD has also completed a “Petaluma River Watershed Enhancement Plan.”
Significant Watershed Issues
Petaluma River High levels of metals at the Regional Monitoring Program Station at the mouth of the
Petaluma River; need to resolve whether the Petaluma River is a source of the metals Nutrient problems documented by CDFG need urgent actions including source identification,
more frequent inspections of confined animal facilities (dairy, horse boarding, livestock producers) to evaluate compliance with State minimum standards, issue requests for corrective action and ROWD (conservation ranch plans with nutrient budgets), and associated follow-up actions, including inspections, permit issuance, report review and enforcement as appropriate.
Sedimentation problems in tributaries associated with new development, gullying and agricultural land use practices necessitate staff involvement with BMP outreach programs, management of watershed enhancement grant contracts, watershed monitoring and assessment, and TMDL development
Baseline watershed assessment targeting 303(d) impairment listing is needed, including coordination with stakeholder groups collecting water quality monitoring and watershed assessment data to update the 303(d) list and support TMDL development
County-wide baseline stormwater management program needs Tier 2/Tier 3 level encouragement
Water quality and habitat impacts due to waterway maintenance and improvements Wastewater treatment plant reconstruction forthcoming Implementation of Nonpoint Source Program Management Measures:
Erosion and Sediment Control; Confined Animal Facilities; Grazing Management; Education/Outreach; Urban Areas; and Hydromodification
Sonoma Creek
San Francisco Bay Region 120 January 2002

Sedimentation, nutrient and pathogen impacts require baseline watershed assessment targeting 303(d) listing and TMDL development
Expansion of wineries and resultant wastewater management issues Development of hillside vineyards and associated erosion and runoff Increasing water diversions to support increasing vineyard acreage may be affecting stream
habitat and anadromous fish survival rate. Need to review Sonoma County on-site septic program, participate in quarterly meetings
with the County, review proposals for large projects (> 1500 gal/day) and projects requesting variances to siting requirements, respond to public concerns, issue permits and enforce as necessary
County-wide baseline stormwater management program needs Tier 2/Tier 3 encouragement Wastewater treatment plant capacity deficiencies Waterway maintenance and capacity “improvements” Implementation of Nonpoint Source Program Management Measures: Erosion and Sediment Control; Grazing Management; Education/Outreach; Forestry; Urban
Areas; and Hydromodification County approval of a grading ordinance
Tolay Creek
Sears Point Raceway expansion requiring project review, permitting and follow-up Animal waste management Recurrent flooding of homes and domestic septic systems in lower Tolay Creek requires
urgent corrective action Implementation of Nonpoint Source Program Management Measures: Erosion and Sediment
Control; Confined Animal Facilities; Grazing Management; Education and Outreach; and Hydromodification
Proposed Workplan for FY 2002/03 and 2003/04
Conduct Sonoma Valley and Petaluma NPDES inspections Review and comment on Petaluma and Sonoma urban runoff program reports Consider permit for urban runoff programs Complete inspections of 30 confined animal facilities Take action on over 25 anticipated 401/404 certifications Resolve outstanding issue with major NPDES permits Take enforcement action as necessary Manage 319(h) grant contracts for both the Sonoma Creek and Petaluma River Watersheds Review the Sonoma County on-site septic program, participate in quarterly meetings with
the County, review projects requesting variances to siting requirements, respond to public concerns, and enforce as necessary
Development of TMDL, including stakeholder outreach, water quality monitoring and watershed assessment, coordination with volunteer monitoring activities
Work with the countywide baseline stormwater program to address impacts due to waterway maintenance and improvements
Reissue NPDES and Waste Discharge Permits (see Appendix A, Sections 1-3 for schedule)
San Francisco Bay Region 121 January 2002

Complete pretreatment compliance inspections (see Appendix A, Section 4 for schedule) Conduct annual compliance inspections (see Appendix A, Section 5 for schedule)
High Priority Unfunded Activities
Water quality and biological monitoring, and watershed assessment activities to facilitate development and implementation of TMDL workplans for sediment, nutrients, or pathogens, including coordination of existing monitoring and assessment efforts
Increased field presence sufficient to conduct a comprehensive compliance assessment of all Region 2 dairies
Need to review the Sonoma County on-site septic program, participate in quarterly meetings with the County, review projects requesting variances to siting requirements, respond to public concerns, and enforce as necessary
CEQA review
High Priority Projects for Grant Funding
(See also Table II.D.4) Sonoma Creek: Sediment budget analysis to identify sources of sediment, impacts to aquatic
life, and improved sediment management practices. Petaluma River: expansion of the Watershed Enhancement Plan, implementation of BMP
demonstration projects, development of conservation ranch plans and nutrient budgets for confined animal facilities, water quality and biological monitoring, and watershed assessment activities to facilitate development and implementation of TMDL workplans for sediment, nutrients, or pathogens
San Francisco Bay Region 122 January 2002

K. Total Maximum Daily Load (TMDL)
The Clean Water Act requires states to identify impaired waterbodies and the pollutants causing the impairment and to establish the Total Maximum Daily Load (TMDL) of the pollutant to the waterbody necessary to eliminate the impairment. The state must also identify pollutant sources and allocate the allowable pollutant load to the sources. An implementation plan must also be established. The complete TMDL including allocations and implementation plan must be incorporated into the Basin Plan.
A complete TMDL includes the following specific elements: Problem Statement:
Description of which standards are not being attained, which beneficial uses are impaired and the nature of the impairment.
Numeric Targets: The Desired Future Condition:Measurements that will describe protection of the beneficial uses that are impaired, and attainment of standards. They should provide a basis to assess progress towards, or attainment of standards. Numeric targets may be existing, new, or site-specific numeric water quality objectives. Alternatively they may be a quantitative measure that is a surrogate for a narrative water quality objective or a surrogate for a numeric water quality objective that provides a better basis to link sources to the impairment.
Source Analysis:Amount, timing, and point of origin of pollutants of concern.
Linkage Analysis: Description of the relationship between numeric target(s) and sources and estimation of the assimilative (loading) capacity of the water body for the pollutant. The loading capacity is the quantitative link between the applicable water quality standard (as interpreted through numeric targets) and the TMDL.
TMDL and Allocations:The TMDL may be all or part of the loading capacity. The TMDL is then allocated amongst point, nonpoint, and background sources. Allocations may be specific to agencies or persons (businesses) or generally by source category or sector.
Margin of Safety: A margin of safety must be incorporated into the TMDL. The margin of safety may be implicit (using conservative assumptions) or explicit (a discrete allocation assigned to the margin of safety).
Implementation Plan:Actions, responsible parties, and schedules necessary to alleviate the impairment and meet the allowable TMDL and allocations. Identifies enforceable features (e.g. prohibition), and triggers for Regional Board action (e.g. performance standards). May be part of a watershed management plan.
Monitoring / Revaluation:Monitoring strategy to track implementation of actions and elimination of impairment, and, if necessary, consideration of TMDL revisions.
San Francisco Bay Region 123 January 2002

Our strategy is to approach each TMDL from the perspective that solution of the water quality problem is the goal not the TMDL itself. As such, we will evaluate the need and benefit of tasks in each of the complete TMDL elements and focus resources on tasks most critical to the ultimate solution. For example, problem definition would be a high priority for waterbodies that may be listed as impaired based on limited, outdated or poor quality data. Source analysis may be the critical gap for other TMDLs. Consideration of implementation alternatives, enforcement mechanisms, and watershed management will be critical for TMDLs that have nonpoint sources as the primary source of the water quality impairment.
Table III.K.1 contains a complete list of all TMDL projects in the San Francisco Bay Region. A TMDL project is defined to establish a TMDL for one or more pollutants in one or more water bodies. The table also includes the projected start date for each TMDL project and projected completion date for a TMDL Report (which contains all the elements of a complete TMDL except for an implementation plan), a draft complete TMDL with Implementation Plan, and a complete TMDL with Implementation Plan adopted as a Basin Plan Amendment. Although the TMDL Report does not include an implementation plan, it does provide opportunity to identify implementation opportunities, challenges, and issues and sets the stage for completing the implementation plan. Appendix A, Section 8, includes the list of TMDL projects and schedule of TMDL activities planned for the next five years. This schedule is for planning purposes only, as is the schedule in Table III.K.1. Specific TMDL project commitments that reflect project status and available funds will be made in annual TMDL program workplans.
The WMI provides an operative framework to meet the challenges associated with the development and implementation of TMDLs for pollutants causing impairment of waters. A complete TMDL encompasses many tasks and activities directly or indirectly associated with watershed/waterbody characterization, assessment, and management and other programs (e.g., NPDES, Nonpoint Source Program, Monitoring and Assessment, and Basin Planning). Consequently, TMDL development and implementation must be closely coordinated with watershed and program tasks on both the regionwide and county watershed management area levels. Accordingly, TMDL related issues and tasks are appropriately noted in other sections of this Chapter. Appendix A, Section 8 includes a list of affected or involved water quality programs for each TMDL project.
Stakeholder participation and support will be essential for all TMDL projects. We continually identify and create opportunities to enhance involvement and collaboration with stakeholders. These efforts include improved outreach and communication associated and improved descriptions and use of stakeholder involvement and collaboration opportunities and mechanisms. Integral to this effort will be the recognition that stakeholders may bring information and expertise to the table. For each TMDL project, we will strive for the most focused and efficient process that allows all stakeholders to effectively participate and ensures balanced representation on any recognized “watershed” or stakeholder forum. Mechanisms will range from compilation and maintenance of interested parties lists to formally recognized and facilitated stakeholder forums. Appendix A, Section 8 identifies the level of stakeholder participation (high, medium, or low) that we currently envision for each TMDL project. Other state and federal agencies are key stakeholders in the development and implementation of TMDLs. Our TMDL efforts overlap authorities and programs of other agencies. Certain
San Francisco Bay Region 124 January 2002

TMDLs are dependent on efforts by these other agencies (e.g., pesticide TMDLs and the USEPA and DPR). In some cases, actions by other agencies may even conflict with or create barriers to TMDL efforts. We will seek opportunities to enhance coordination and collaboration with other agencies, and overlaps, conflicts, and barriers will be identified and appropriate resolutions, agreements, etc. will be pursued. Appendix A, Section 8 identifies the agencies relevant to each TMDL project.
There are a number of significant challenges that do not have easy resolution that we must overcome to succeed. San Francisco Bay is an estuary with complex hydrodynamics and sediment and biochemical fate and transport processes, and there are significant limitations to existing quantitative fate and transport models. A number of water quality problems are due to chemicals that are no longer in use and have no known active discharges (e.g., DDT). Others are due to sources beyond the jurisdiction of the Regional Board (e.g., mercury, pesticides). A number of waterbodies are impaired due to excessive siltation, but it is very difficult to distinguish between natural and human caused sources of sediment, and to distinguish between excessive siltation and impairment due to flow alterations. These challenges and the potential high costs associated with their resolution provide further cause to work within the Watershed Management Initiative to set priorities and identify cost-effective tasks to establish and attain TMDLs through integration with other efforts and collaboration with stakeholders. As previously noted, the WMI provides the operative framework for allocation of these resources and identification of priorities and additional resource needs. We have regionwide project and program management resource needs in addition to specific TMDL project resource needs. These include management of the TMDL program (roundtable participation, preparation of workplans and reports, program development and budget planning, outreach and education, participation in workshops and other forums) and development of a regionwide sediment TMDL strategy.
Numerous water bodies in the San Francisco Bay Region are listed as impaired due to excessive siltation or sedimentation. Consequently, sediment TMDLs including implementation plans are required to remedy the impairments. A regional approach to this challenge (versus one watershed at a time) provides economies of scale in terms of both resources and time. The regional approach is founded on the premise that subwatershed areas with common attributes that influence sediment input (geology, vegetation, land use, and topography) can be defined and characterized. Characterization and assessment of representative subwatershed areas will provide reference states, a quantitative understanding of sediment production and its relationship to habitat quality, and a basis for distinguishing sediment associated with natural processes from sediment from land-use activities. A key first step is in this strategy is the compilation of data relevant to the findings of impairment in the listed water bodies.
Another challenge concerns the pending federal TMDL rule and the next and future 303(d) list process. The next revision of the 303(d) list is planned for the summer of 2002, and there is a need for a clear and comprehensive listing process due to increased public awareness and NPDES permit implications. As noted in Section II.C, Monitoring and Assessment, we have prepared a Regional Monitoring and Assessment Strategy that specifically addresses this need.
San Francisco Bay Region 125 January 2002

Implementation of the RMAS includes development of Environmental Indicators and associated data requirements and monitoring protocols that will provide the basis for determination of impaired waters. We will evaluate some of the impairment assessment and listing issues through tasks associated with TMDL projects. Confirmation or revision of the impairment listing and possible consideration of delisting is a critical element of some TMDLs. These include copper, nickel, mercury, and PCBs in San Francisco Bay segments, diazinon in urban creeks, siltation in several creeks, pathogens in Tomales Bay, and mercury in the Guadalupe River watershed. There is also the issue of TMDLs for waters not currently listed. If and when additional waters and/or pollutants are included on the 303(d) list, we will review and revise schedules for TMDLS based on the current 303(d) to account for such additions and their relative priorities.
We are fortunate to have dedicated resources for TMDL development. We have 8.7 PYs for TMDLs (2.5 from federal funds provided by the USEPA and 6.2 from state general funds) and $228,000 in contract funds. Eight of these positions are included in one TMDL Unit that promotes a team approach and provides a focal point for TMDL activities in the Region. In addition to the TMDL Unit, we coordinate and integrate actions and activities of our Planning and Policy Division and Watershed Management and NPDES Divisions. Improved coordination and integration among these areas and other functions of the Regional Board are a high priority.
San Francisco Bay Region 126 January 2002

Table III.K.1 TMDL PROJECTS and SCHEDULEFor the San Francisco Bay Region as of December 2001
WATERBODY(S)POLLUTANT(S) Start Date
Current Projected Completion DateTMDL Report
TMDL with Implementation Plan
Basin Plan Amendment
All San Francisco Bay Segments
Mercury January 1998
June 2000 January 2002 June 2002
All San Francisco Bay Segments
Exotic Species July 1998 April 2002
June 2005 June 2006
South SF Bay Copper January 1999
Not Applicable
Not Applicable June 2002
South SF Bay Nickel January 1999
Not Applicable
Not Applicable June 2002
All SF Bay Segments
PCBs July 1999 June 2002 June 2003 June 2004
SF Bay Urban Creeks (36)
Diazinon July 1999 June 2002 June 2003 June 2004
Tomales Bay Pathogens July 1999 June 2002 June 2003 June 2004
SF Bay Segments, except South San Francisco Bay
Copper January 2000
June 2002 June 2003 June 2004
SF Bay Segments, except South San Francisco Bay
Nickel January 2000
June 2002 June 2003 June 2004
Guadalupe River Watershed:Calero ReservoirGuadalupe ReservoirAlamitos CreekGuadalupe CreekGuadalupe River
Mercury July 2000 June 2003 June 2004 June 2005
Napa River Siltation, Nutrients, Pathogens
July 1999 June 2003 June 2004 June 2005
San Francisco Bay Region 127 January 2002

Table III.K.1 TMDL PROJECTS and SCHEDULEFor the San Francisco Bay Region as of December 2001
WATERBODY(S)POLLUTANT(S) Start Date
Current Projected Completion DateTMDL Report
TMDL with Implementation Plan
Basin Plan Amendment
San Francisquito Creek
Siltation July 2000 June 2003 June 2004 June 2005
Walker Creek / Tomales Bay
Metals (Mercury)
July 2001 June 2003 June 2004 June 2005
Sonoma Creek Siltation, Nutrients, Pathogens
July 2000 June 2004 June 2005 June 2006
Pescadero / Butano Creeks
Siltation July 2002 June 2004 June 2005 June 2006
Petaluma River Sediment, Nutrients, Pathogens
July 2002 June 2005 June 2006 June 2007
San Gregorio Creek
Siltation July 2003 June 2005 June 2006 June 2007
All SF Bay Segments
Diazinon July 2003 June 2005 June 2006 June 2007
Tomales Bay Siltation, Nutrients
July 2003 June 2005 June 2006 June 2007
Walker Creek Siltation, Nutrients
July 2003 June 2005 June 2006 June 2007
Lagunitas Creek Siltation, Nutrients, Pathogens
July 2003 June 2005 June 2006 June 2007
All SF Bay Segments
Chlordane, DDT, Dieldrin
July 2003 June 2005 June 2006 June 2007
Richardson Bay Pathogens July 2004 June 2006 June 2007 June 2008
Suisun Marsh Metals, Nutrients, Low DO, Organic Enrichment, Salinity
July 2004 June 2006 June 2007 June 2008
Lake Herman Mercury July 2005 June 2008 June 2009 June 2010
San Francisco Bay Region 128 January 2002

Table III.K.1 TMDL PROJECTS and SCHEDULEFor the San Francisco Bay Region as of December 2001
WATERBODY(S)POLLUTANT(S) Start Date
Current Projected Completion DateTMDL Report
TMDL with Implementation Plan
Basin Plan Amendment
All SF Bay Segments
Selenium July 2005 June 2008 June 2009 June 2010
Lake Merritt Floatables July 2005 June 2008 June 2009 June 2010
All SF Bay Segments
Furans Listed by USEPA
To be determined
To be determined
To be determined
All SF Bay Segments
Dioxins Listed by USEPA
To be determined
To be determined
To be determined
San Francisco Bay Region 129 January 2002

SF Bay Region - WMI Chapter - Appendix A
Section 1 - NPDES Major Wastewater Permit Reissuance Schedule
NPDES NO DISCHARGER
FY02
/03
FY03
/04
FY04
/05
FY05
/06
FY05
/06
Exp Date* denotes reissuance pending
ALAMEDACA0037613 DUBLIN SAN RAMON SERVICES DIST X 050816CA0037702 EAST BAY MUD (SD NO. 1) X 060531CA0037869 EAST BAY DISCHARGERS
AUTHORITYX 050816
CA0038008 LIVERMORE, CITY OF X 050816CONTRA COSTACA0037770 MT. VIEW SANITARY DIST X 050816CA0037796 PINOLE, CITY OF X 060930CA0037826 RODEO SANITARY DISTRICT X 060930CA0038539 WEST COUNTY AGENCY X 061031CA0005240 CALIFORNIA AND HAWAIIAN SUGAR X 050419CA0037648 CENTRAL CONTRA COSTA SAN DIST X 060531CA0006165 RHONE-POULENC BASIC CHEMICALS X 031021CA0004961 ULTRAMAR – GOLDEN EAGLE REFIN. X 050216CA0005053 TOSCO CORP. – RODEO REFINERY X 050315CA0005134 CHEVRON USA INC X 060531CA0038547 DELTA DIABLO SANITATION DIST. X 981119CA0004910 DOW CHEMICAL COMPANY X 061031CA0004880 MIRANT PITTSBURG X *001115CA0005789 EQUILON – MARTINEZ REFINERY X 061031CA0005002 USS-POSCO X 051129CA0004979 GENERAL CHEM (ALLIED) CORP X *010320MARINCA0038628 CENTRAL MARIN SANITATION AG. X 060830CA0037851 LAS GALLINAS VALLEY S.D. X 031021CA0037753 MARIN COUNTY SD #5 X *000913CA0037958 NOVATO SANITARY DISTRICT X 040525CA0038067 SAUSALITO-MARIN CITY SAN DIST X 050719CA0037711 SEWERAGE AGENCY OF SO. MARIN X 060531NAPACA0037575 NAPA SANITATION DISTRICT 050719SAN FRANCISCO CA0038610 SAN FRANCISCO, CITY & CO. CSO X *000215CA0037681 SAN FRANCISCO, CITY & CO OCEANSIDE X 020318CA0037664 SAN FRANCISCO, CITY & CO. S.E. X *991019CA0110116 TREASURE ISLAND X 000621SAN MATEO CA0037788 BURLINGAME, CITY OF X *001018CA0037532 MILLBRAE, CITY OF X 061031CA0037737 NORTH SAN MATEO COUNTY SD X 050315CA0038776 CALERA CREEK WATER RECYCLING X 040915CA0028070 SAN FRANCISCO INT’L AIRPORT IND X *970916
Appendix A Section 1 A-1 January 2002

SF Bay Region - WMI Chapter - Appendix A
NPDES NO DISCHARGER
FY02
/03
FY03
/04
FY04
/05
FY05
/06
FY05
/06
Exp Date* denotes reissuance pending
WWTPCA0038318 SAN FRANCISCO INT’L AIRPORT 000315CA0037541 SAN MATEO, CITY OF X 060531CA0038598 SEWER AUTHORITY MID-COASTSIDE X 050315CA0038369 SOUTH BAYSIDE SYSTEM AUTHORITY X 060201CA0038130 SOUTH SAN FRANCISCO X 020716SANTA CLARACA0037834 PALO ALTO, CITY OF X 030617CA0037842 SAN JOSE/SANTA CLARA WPCP X 030617CA0037621 SUNNYVALE, CITY OF X 030617SOLANOCA0038091 BENICIA, CITY OF X 060731
CA0038024 FAIRFIELD-SUISUN SEWER DISTRCT X 030715CA0037699 VALLEJO SAN AND FLOOD CONT DIS X 050419SONOMACA0037810 PETALUMA, CITY OF X 030715CA0037800 SONOMA VALLEY COUNTY S. D. X *031021
Appendix A Section 1 A-2 January 2002

SF Bay Region - WMI Chapter - Appendix A
Section 2 - NPDES Minor Wastewater Permit Reissuance Schedule
NPDES NO DISCHARGER
FY02
/03
FY03
/04
FY04
/05
FY05
/06
FY06
/07
Exp Date
ALAMEDACA0030007 OAKLAND, PORT OF - GALBRAITH X 990921CA0006751 ALAMEDA COUNTY WATER DIST X 020629CA0038059 ALAMEDA COUNTY WATER DIST X 050419CA0038474 ALAMEDA, CITY OF – WET WEATHER X *990921CA0038471 ALBANY, CITY OF – WET WEATHER X *990921CA0030121 BAY SHIP AND YACHT X 030819CA0027791 BERKELEY READY MIX CO. to be rescinded X 970219CA0038466 BERKELEY, CITY OF – WET WEATHER X *990921CA0027829 CAL MAT CO. – PLEASANTON QUARRY X *010417CA0028703 CARGILL SALT DIVISION X 981116CA0038440 EAST BAY MUD (SD #1) – WET WEATHER X 030121CA0038237 EAST BAY MUD – SAN LEANDRO FILTR X 020219CA0006246 GENERAL ELECTRIC COMPANY X 020219CA0038636 HAYWARD SHORE MARSH X 040525CA0038580 HERCULES, CITY OF to be rescinded X 980217CA0030112 KOBE X 021217CA0038679 LIVERMORE-AMADOR VALLEY WMA X 040525CA0038512 OAKLAND, CITY OF – WET WEATHER X *990921CA0038504 PIEDMONT, CITY OF – WET WEATHER X *990921CA0005363 RMC LONE STAR INDUS., INC. - ELLIOT X *990817CA0028789 RMC LONE STAR INDUS, INC. - SUNOL X *010417
CA0030147 HANSON AGGREGATE X 031216CA0038733 UNION SANITARY DISTRICT – WET WR X 000315CA0038351 HARBOR BAY ISLE to be rescinded X 980519CONTRA COSTACA0037885 CONTRA COSTA COUNTY-SD NO.5 X 000621CA0038580 HERCULES, CITY OF to be rescinded X 030827CA0038245 EAST BAY MUD – LAFAYETTE X 020219CA0038253 EAST BAY MUD – SAN PABLO X 020219CA0038261 EAST BAY MUD – EL SABRANTE X 020219CA0038270 EAST BAY MUD – WALNUT CRK. X 020219CA0038342 EAST BAY MUD - ORINDA X 020219CA0038482 STEGE SANITARY DISTRICT – WET WTHR X *990921CA0006335 U.S. NAVY – PT. MOLATE X 000118CA0028541 WICKLAND OIL COMPANY X 041115CA0038750 WICKLAND OIL COMPANY X 030520CA0029149 CASTROL INC. to be rescinded X 030819CA0029904 CROCKETT COGENERATION X 030916CONTRA COSTACA0028321 HANSON AGGREGATES X *001114CA0029106 GWF POWER SYSTEMS CO, INC X 040719
Appendix A Section 2 A-3 January 2002

SF Bay Region - WMI Chapter - Appendix A
NPDES NO DISCHARGER
FY02
/03
FY03
/04
FY04
/05
FY05
/06
FY06
/07
Exp Date
CA0029122 GWF POWER SYSTEMS CO, INC X 040719CA0030082 SHELL POND X 040525CA0030074 USN POINT MOLATE GW CLEANUP X 020319CA0006157 ZENECA to be rescinded 000118MARINCA0037401 ANGEL ISLAND STATE PARK X 030617CA0037427 MARIN CO NO. 5 X 030617NAPACA0028681 CARGILL SALT DIVISION X 051129CA0038016 ST. HELENA X 990817
CA0037966 CALISTOGA X 051129CA0038121 YOUNTVILLE X 981215SAN FRANCISCOCA0005649 PACIFIC GAS & ELEC CO. – HUNTERS PT. X 040420CA0005657 MIRANT - POTRERO X 040420CA0029581 NEPTUNE SOCIETY to be rescinded XCA0005321 CARLYLE GROUP X 040525CA0030139 HANSON AGGREGATES X 030715CA0028282 ASTORIA METALS X 030916SAN MATEOCA0029947 BFI – OX MOUNTAIN LANDFILL X 981119SANTA CLARACA0029939 SAN JOSE – STORY ROAD LANDFILL X 981020CA0028631 NAT'L SEMI to be rescinded X 990119CA0028185 FAIRCHILD X 041118CA0027961 IBM X 041118SONOMACA0037810 PETALUMA, CITY OF X 030715CA0037800 SONOMA VALLEY COUNTY S. D. X 031021
Appendix A Section 2 A-4 January 2002

SF Bay Region - WMI Chapter - Appendix A
Section 3 - NPDES Stormwater Permit Reissuance ScheduleNPDES NO DISCHARGER REISSUANCE DATE
SCHEDULED SCHEDULED
Contra Costa CA0029912 Contra Costa County Stormwater Program FY 2004/05
San MateoCA0029921 San Mateo County Stormwater Program FY 2004/05
Santa ClaraCAS029718 San Clara Valley Urban Runoff Pollution FY 2005/06
Prevention Program
SolanoCAS612006 Vallejo Stormwater Program FY 2003/04
Appendix A Section 3 A-5 January 2002

SF Bay Region - WMI Chapter - Appendix A
Section 4 - NPDES Pretreatment PCIs / Audits ScheduleNPDES # PROGRAM 2002-2003 2003-2004 2004-2005 2005-2006 2006-2007CA0038091 Benicia PCI Audit PCI PCI PCICA0037788 Burlingame PCI PCI Audit PCI PCICA0037648 Central Contra Costa SD PCI PCI PCI PCI AuditCA0038628 Central Marin SA PCI PCI Audit PCI PCICA0038547 Delta Diablo SD Audit PCI PCI PCI PCICA0037613 Dublin San Ramon SD PCI PCI Audit PCI PCICA0037702 East Bay MUD Audit PCI PCI PCI PCICA0038024 Fairfield-Suisun SD Audit PCI PCI PCI PCICA0037869 Hayward PCI Audit PCI PCI PCICA0038008 Livermore PCI PCI PCI Audit PCICA0037532 Millbrae PCI PCI PCI Audit PCICA0037575 Napa SD PCI PCI PCI Audit PCICA0037958 Novato SD PCI PCI PCI PCI AuditCA0037869 Oro Loma SD PCI PCI Audit PCI PCICA0037834 Palo Alto Audit PCI PCI PCI PCICA0037810 Petaluma PCI PCI PCI PCI AuditCA0038539 Richmond PCI Audit PCI PCI PCICA0037664 San Francisco PCI Audit PCI PCI PCICA0037842 San Jose/Santa Clara PCI PCI PCI PCI AuditCA0037869 San Leandro PCI PCI Audit PCI PCICA0037541 San Mateo Audit PCI PCI PCI PCICA0038369 South Bayside SA PCI PCI PCI Audit PCICA0038130 South SF/San Bruno PCI PCI PCI Audit PCICA0037621 Sunnyvale PCI PCI PCI PCI AuditCA0037869 Union SD PCI PCI PCI Audit PCICA0037699 Vallejo S&FCD PCI PCI PCI Audit PCICA0038539 West County WWD PCI Audit PCI PCI PCI
Appendix A Section 4 A-6 January 2002

SF Bay Region - WMI Chapter - Appendix A
Section 5 - NPDES Compliance Inspections Schedule
The following is considered our goal; however resources may be insufficient to accomplish this goal and our program commitment will be adjusted to reflect the level of resources available.
I. At least one compliance inspection per year per major wastewater permit will be completed.
II. Minor wastewater dischargers will be inspected once every five years III. An annual compliance audit will be completed for each municipal stormwater
permit.
Appendix A Section 7 A-7January 2002

SF Bay Region - WMI Chapter - Appendix A
Section 6 - Chapter 15 WDR Reissuance Schedule
Not included.
Appendix A Section 7 A-8January 2002

SF Bay Region - WMI Chapter - Appendix A
Section 7 - Non-Chapter 15 WDR Reissuance Schedule
FY 03-042 019129002 93-070 Livermore-Amador Valley WMA Lavwma, EBMUD, Caltrans 7/21/93 7/21/03 VBP 2 B REC NEW2 494062001 93-073 Sonoma Co, Dept Of Public Wrks SCDPW, Soil Bioremediation 7/21/93 7/21/03 FA 2 C WDR NEW2 019295001 93-159 Alameda Co FC&WCD,Zone 7,Et Al Lv-Am Valley Water Reuse 12/15/93 12/15/03 VBP 2 A REC NEW2 438103001 93-160 Palo Alto, City Of Palo Alto Regional WQCP - Reuse 12/15/93 12/15/03 WKB 2 B REC REV2 438047001 94-025 Browning Ferris Industries Newby Island Landfill 2/16/94 2/16/04 ADF 2 B WDR NEW2 283009002 94-039 Napa Sanitation District Napa S.D. - Reclamation 3/16/94 3/16/04 CL 2 B REC REV2 283032001 89-049 Napa Valley Country Club Waste Water Ponds & Spray 4/19/89 4/19/04 WBH 3 B WDR REV2 283019002 89-074 Yountville, Town Of Yountville Reclamation 5/17/89 5/17/04 GK 3 C REC REV2 417171001 99-037 San Francisco, City & County San Francisco Int'l Airport 5/25/99 5/24/04 SMM 1 A WDR NEW2 153505001 99-030 US Army Corps Of Engineer-SF Maintenance Dredging 5/25/99 5/25/04 GC 1 A WDR REV2 438382001 94-069 Sunnyvale, City Of Sunnyvale WPCP, Et Al - Reuse 6/15/94 6/15/04 WKB 2 B REC REV
Notes about the data table:
Review Date: This is the theoretical review date, based on Order adoption date (or NAR date), and SWRCB/RWQCB WDR Review period criteria. Given current resources, these dates remain goals, not commitments. SWRCB/RWQCB WDR Review period criteria are based on the facility's designated TTWQ: For TTWQ = 1, 2, or 3, Review period = 5, 10, or 15 years, respectively.
Appendix A Section 7 A-9 January 2002
WDID Order No. Agency Facility Adopt Date ReviewDate Staff TWQ CPX Type ActionFY 01-02
2 215126001 86-051 Blue Mntn Cntr Of Meditation Blue Mntn Cntr Sewage Ponds 7/16/86 7/16/01 FG 3 C WDR NEW2 019210001 91-131 East Bay Dischargers Authority Skywest Golf Course Recl 9/18/91 9/18/01 VBP 2 C REC REV2 482005002 91-147 Fairfield-Suisun Sewer Distrct Fairfield-Suisun Reclamation 10/16/91 10/16/01 TT 2 B REC REV2 215072001 86-086 Tomales Village Csd Tomales Sewage Pond System 11/19/86 11/19/01 FG 3 B WDR REV2 283012001 91-162 Pacific Union College Pacific Union College - Reuse 11/20/91 11/20/01 WBH 2 B REC REV2 215053001 91-181 Ca Dept. Of Parks & Recreation Samuel P Taylor St Pk- Ww Sys. 12/11/91 12/11/01 FG 2 B WDR REV2 283079001 86-097 Napa Valley Marina Spoils Disp + Sewage Ponds 12/17/86 12/17/01 WBH 3 C WDR REV2 071181001 92-007 Central Contra Costa San Dist Bollinger Canyon Leachfld 1/15/92 1/15/02 WBH 2 C WDR REV2 494033001 87-031 Port Sonoma Marina Port Sonoma Marina 4/15/87 4/15/02 GC 3 C WDR REV2 494051001 87-046 Benedetti Farms, Inc. Slaughterhouse 5/20/87 5/20/02 WBH 3 C WDR REV2 215022002 92-065 Novato Sanitary District Novato And Ignacio Reclama 6/17/92 6/17/02 GK 2 B REC REV2 494030001 92-067 Sonoma Valley County S. D. Sonoma Valley County S.D.-Reuse 6/17/92 6/17/02 TT 2 B REC REV
FY 02-032 283034001 87-121 Hess Collection Winery Hess Winery Wastewater Ponds 9/16/87 9/16/02 BDA 3 B WDR REV2 438028001 87-124 Union Of American Hebrew Cong Uahc Camp Swig Ww System 9/16/87 9/16/02 JRW 3 B WDR REV2 417133001 92-124 University Of California Elkus 4-H Ranch 10/21/92 10/21/02 AMC 2 B WDR NEW2 494001001 87-153 Sears Point Intl Raceway Sears Pt Raceway-Ponds 11/18/87 11/18/02 WBH 3 C WDR REV2 283006001 87-159 Kelleher Corporation Brix Restaurant WW Ponds 12/16/87 12/16/02 WBH 3 B WDR REV2 482059001 88-007 Seeno Duck Club Seeno Duck Club Wastewater 1/20/88 1/20/03 SLB 3 B WDR NEW2 019021001 88-037 Sunol Valley Golf & Recrea Co Sunol Valley Golf Course 3/16/88 2/17/03 MYM 2 B WDR REV2 019201001 88-008 San Leandro, City Of Galbraith Golf Course Recl 1/20/88 2/17/03 VBP 2 B REC NEW2 215103001 88-011 Richardson Bay SD/City Of Tib. Rbsd- Reclamation Plant 1/20/88 3/17/03 SFG 2 B REC REV2 019251001 93-037 Industrial Asphalt Calmat 52 El Charro Rd-Gw Rechrge 4/21/93 4/19/03 BG 2 B WDR NEW2 215132001 88-078 Spirit Rock Meditation Center Spirit Rock M.C. - WW Systems 5/18/88 5/18/03 FG 3 C WDR NEW2 283098001 88-079 St. Michael Winery St. Michael Winery Ponds 5/18/88 5/18/03 WBH 3 C WDR NEW2 494040001 88-076 Petaluma Farms Oscar Miller Chick R Land 5/18/88 5/18/03 WBH 3 C WDR REV2 283093001 88-102 Napa Sanitation District Algae Sludge Land Disp. 6/15/88 6/15/03 CL 3 C WDR NEW

SF Bay Region - WMI Chapter - Appendix A
Appendix A Section 7 A-10 January 2002

SF Bay Region - WMI Chapter - Appendix A
Section 8 - 303(d) Listing / TMDLs Schedule for Development
Detailed Schedule of TMDL Activities (next five years)
Waterbody Name South SF Bay, Lower SF Bay, Central SF Bay, Richardson Bay, San Pablo Bay, Carquinez Strait, Suisun Bay, Delta
South SF Bay, Lower SF Bay, Central SF Bay, Richardson Bay, San Pablo Bay, Carquinez Strait, Suisun Bay, Delta
South SF Bay, Lower SF Bay, Central SF Bay, Richardson Bay, San Pablo Bay, Carquinez Strait, Suisun Bay, Delta
Watershed Name SF Bay Region SF Bay Region SF Bay Region
Hydrologic Unit #203-207 #203-207 #203-207
Stressor(s) Mercury Exotic Species PCBs
Stakeholder Participation
Medium Medium High
Program Integration NPDES WW
NPDES SW
401 WQ Cert
NPDES WW
NPDES SW
401 WQ Cert
SLIC / DOD
Interagency Coordination
USFWS
CalF&G
DTSC
USFWS
CalF&G
DTSC
Activity dates Start End Start End Start End
TMDL Development 1997/98 2001/02 1998/99 1999/00 1999/00 2002/03
Implementation Planning
1997/98 2001/02 2003/04 2004/05 1999/00 2002/03
Basin Plan Amendment 2001/02 2002/03 2004/05 2005/06 2003/04 2003/04
Implementation Oversight and Tracking
2002/03 ? 2005/06 ? 2003/04 ?
Appendix A Section 9 A-11 January 2002

SF Bay Region - WMI Chapter - Appendix A
Detailed Schedule of TMDL Activities (next five years)
Waterbody name South SF Bay, Lower SF Bay, Central SF Bay, Richardson Bay, San Pablo Bay, Carquinez Strait, Suisun Bay, Delta
Lower SF Bay, Central SF Bay, Richardson Bay, San Pablo Bay, Carquinez Strait, Suisun Bay, Delta
South SF Bay, Lower SF Bay, Central SF Bay, Richardson Bay, San Pablo Bay, Carquinez Strait, Suisun Bay, Delta
Watershed Name SF Bay Region SF Bay Region SF Bay Region
Hydrologic Unit #203-207 #203-207 #203-207
Stressor(s) Diazinon Copper Nickel
Stakeholder Participation
High High High
Program Integration NPDES WW
NPDES SW
NPS
NPDES WW
NPDES SW
NPDES WW
NPDES SW
Interagency Coordination
DPR CalF&G CalF&G
Activity dates Start End Start End Start End
TMDL Development 2003/04 2005/06 2000/01 2002/03 2000/01 2002/03
Implementation Planning
2003/04 2005/06 2000/01 2002/03 2000/01 2002/03
Basin Plan Amendment 2005/06 2006/07 2003/04 2003/04 2003/04 2003/04
Implementation Oversight and Tracking
2006/07 ? 2003/04 ? 2003/04 ?
Appendix A Section 9 A-12 January 2002

SF Bay Region - WMI Chapter - Appendix A
Detailed Schedule of TMDL Activities (next five years)
Waterbody Name Urban Creeks Tomales Bay Tomales Bay, Walker Creek
Watershed Name SF Bay Region Marin Marin
Hydrologic Unit #203-207 #201 #201
Stressor(s) Diazinon Pathogens Nutrients,
Siltation
Stakeholder Participation
High Medium Medium
Program Integration NPDES SW NPS NPS
Interagency Coordination
DPR
Activity dates Start End Start End Start End
TMDL Development 1999/00 2002/03 1999/00 2002/03 2003/04 2005/06
Implementation Planning
1999/00 2002/03 1999/00 2002/03 2003/04 2005/06
Basin Plan Amendment 2003/04 2003/04 2003/04 2003/04 2006/07 2006/07
Implementation Oversight and Tracking
2003/04 ? 2003/04 ? 2006/07 ?
Appendix A Section 9 A-13 January 2002

SF Bay Region - WMI Chapter - Appendix A
Detailed Schedule of TMDL Activities (next five years)
Waterbody Name Tomales Bay, Walker Creek
Walker Creek Lagunitas Creek
Watershed Name Marin Marin Marin
Hydrologic Unit #201 #201 #201
Stressor(s) Metals (mercury) Nutrients,
Siltation
Nutrients,
Pathogens
Siltation
Stakeholder Participation
Low Medium Medium
Program Integration NPS NPS
Interagency Coordination
Activity dates Start End Start End Start End
TMDL Development 2001/02 2003/04 2003/04 2005/06 2002/03 2005/06
Implementation Planning
2001/02 2003/04 2003/04 2005/06 2002/03 2005/06
Basin Plan Amendment 2005/06 2005/06 2006/07 2006/07 2006/07 2006/07
Implementation Oversight and Tracking
2005/06 ? 2006/07 ? 2006/07 ?
Appendix A Section 9 A-14 January 2002

SF Bay Region - WMI Chapter - Appendix A
Detailed Schedule of TMDL Activities (next five years)
Waterbody Name Napa River Pescadero Creek
Butano Creek
San Gregario Creek
Watershed Name Napa San Mateo San Mateo
Hydrologic Unit #206 #202 #202
Stressor(s) Siltation
Nutrients
Pathogens
Siltation Siltation
Stakeholder Participation
Medium Medium Medium
Program Integration NPS NPS NPS
Interagency Coordination
CalF&G
CalFed
CalF&G CalF&G
Activity dates Start End Start End Start End
TMDL Development 1999/00 2003/04 2002/03 2004/05 2003/04 2005/06
Implementation Planning
1999/00 2003/04 2002/03 2004/05 2003/04 2005/06
Basin Plan Amendment 2004/05 2004/05 2005/06 2005/06 2006/07 2006/07
Implementation Oversight and Tracking
2004/05 ? 2005/06 ? 2006/07 ?
Appendix A Section 9 A-15 January 2002

SF Bay Region - WMI Chapter - Appendix A
Detailed Schedule of TMDL Activities (next five years)
Waterbody Name San Francisquito Creek
South San Francisco Bay
Guadalupe River,
Calero Reservoir,
Guadalupe Reservoir,
Alamitos Creek,
Guadalupe Creek
Watershed Name Santa Clara Santa Clara Santa Clara
Hydrologic Unit #205 #205 #205
Stressor(s) Siltation Copper,
Nickel
Mercury
Stakeholder Participation
High High High
Program Integration NPDES SW
NPS / 401 WQ Cert
NPDES WW
NPDES SW
NPS / 401 WQ Cert NPDES SW
Interagency Coordination
CalF&G
CalFed
CalF&G CalF&G
USFWS
Activity dates Start End Start End Start End
TMDL Development 2000/01 2003/04 1998/99 2001/02 2000/01 2003/04
Implementation Planning
2000/01 2003/04 1998/99 2001/02 2000/01 2003/04
Basin Plan Amendment 2004/05 2004/05 2001/02 2002/03 2004/05 2004/05
Implementation Oversight and Tracking
2004/05 ? 2002/03 ? 2004/05 ?
Appendix A Section 9 A-16 January 2002

SF Bay Region - WMI Chapter - Appendix A
Detailed Schedule of TMDL Activities (next five years)
Waterbody Name Petaluma River Sonoma Creek South SF Bay, Lower SF Bay, Central SF Bay, Richardson Bay, San Pablo Bay, Carquinez Strait, Suisun Bay, Delta
Watershed Name Sonoma Sonoma SF Bay Region
Hydrologic Unit #206 #206 #203-207
Stressor(s) Nutrients,
Pathogens,
Siltation
Nutrients,
Pathogens,
Siltation
Chlordane,
DDT,
Dieldrin
Stakeholder Participation
Medium High High
Program Integration NPS NPS NPDES WW
NPDES SW
401 WQ Cert
SLIC
Interagency Coordination
CalF&G
CalFed
CalF&G
CalFed
USFWS
CalF&G
DTSC
Activity dates Start End Start End Start End
TMDL Development 2002/03 2005/06 2000/01 2004/05 2003/04 2005/06
Implementation Planning
2002/03 2005/06 2000/01 2004/05 2003/04 2005/06
Basin Plan Amendment 2006/07 2006/07 2005/06 2005/06 2006/07 2006/07
Implementation Oversight and Tracking
2006/07 ? 2005/06 ? 2006/07 ?
Appendix A Section 9 A-17 January 2002

SF Bay Region - WMI Chapter - Appendix A
Section 9 - Basin Plan Updates Schedule
Estimated completion of the next triennial review is FY 2001/02 Basin Plan Amendments for groundwater management have been approved by the
Regional Board and are pending State Board action. Stream protection basin plan amendments are planned for FY 2001/02
Subsequent reviews/actions will depend on statewide plans and completion of TMDLs Estimated completion of the next triennial review is FY 2000/01
Amendments to incorporate USEPA Water Quality Criteria into Basin Plan scheduled for FY 2001/02
Amendments to incorporate site specific water quality objectives for copper and nickel south of the Dumbarton Bridge into Basin Plan scheduled for FY 2001/02
Subsequent reviews/actions will depend on statewide plans and completion of TMDLs
Appendix A Section 9 A-18 January 2002

SF Bay Region - WMI Chapter - Appendix B
Section 1 - Santa Clara Basin Watershed Management Initiative
Evaluation of the Regional Board Top 10
Fully completed or soon to be completed = *****Substantive progress (major progress = 50%-75%) = ****Moderate progress (clear strides have been made = 25%-50%) = ***Some progress (up to 25%) = **Negligible progress or not yet started = *Progress not documented = ?
Progress Report for Santa Clara Basin Watershed Management Initiative in addressing Regional Water Quality Control Board “desired outcomes” of watershed management efforts - first articulated at the Planning Retreat, Saratoga, Spring 1997:
1. Implementation of a comprehensive watershed assessment strategy that identifies problems or otherwise establishes steps to resolve unknowns.
Comment: ** Limiting factors and suspected causes of limiting factors for the three pilot watersheds will be listed later this year for the SCBWMI assessment framework (a water body assessment for four beneficial uses (COLD, RARE, REC1, MUNI) and a stakeholder interest (PFF)).
Challenges: Need for guidance on watershed assessments that cover all beneficial uses on a watershed (not water body) basis and on data requirements for 305(b) water quality assessments.
2. Implementation of a comprehensive watershed assessment strategy that identifies sources of problems or otherwise establishes steps to resolve unknowns.
Comment: *** Some problem source identification is in progress through the Brakepad Partnership, the San Francisquito SOILS sediment work, and the “Compare and Contrast” questionnaire, and contracting is underway for the initial Guadalupe watershed mercury studies.
Challenges: Work on “management issues” approach has been suspended.
3. Implementation of a comprehensive watershed assessment strategy that identifies solutions to problems or otherwise establishes steps to resolve unknowns
Comment: *** Work on solutions is underway through South Bay POTW and SCVURPPP efforts on the Copper and Nickel Action Plans, the SCVWD stream maintenance BMPs, and potentially through the SCVURPPP Pesticide Management Plan.
Appendix B Section 1 B-1 January 2002

SF Bay Region - WMI Chapter - Appendix B
Challenges: Need an integrating process for establish multi-agency priorities.
4. Long-term resolution of municipal wastewater permit issues
Comment: **** (Maybe we can check off “done that” by the next permits???)
Challenges: Litigation over potential mass load increase to South Bay is in progress
5. Resolution of urban runoff (municipal stormwater) permit issues
Comment: ** Program management has stabilized.
Challenges: Continuing contention over development issues. Need to develop approach meaningful effectiveness evaluations and performance reviews.
6. Establishment of basis for Basin Plan Amendments (includes consideration of site specific objectives
Comment: **** Copper/Nickel Basin Plan Amendment is in progress
Challenges: Need continued attention to resolution of uncertainties. Need RWQCB completion of Stream Protection Policy/Program because its objective is to provide “...a technical framework for linking stream functions to beneficial uses, criteria for protecting the beneficial uses, and recommended management practices for minimizing impacts to streams and stream corridors.” 7. Assessment and resolution of 303(d) impaired water body listings and development of
phased TMDLs (Initial emphasis will be on copper and nickel in South San Francisco Bay, followed by mercury in the Guadalupe River watershed and sediment in the San Francisquito Creek watershed)
Comment: **** for initial priorities; ** for additional listings for pesticides, PCBs; and * not yet started for proposed listings for trash, PAHs, and dioxins.
Challenges: Need adequate resources and attention to both contaminants of concern and watershed-based approach to Santa Clara Basin priorities.
8. Long-term resolution of San Jose/Santa Clara wastewater discharge flow cap issues
Comment: *** Streamflow augmentation pilot on hold pending resolution of SCVWD monitoring needs, FAHCE recommendations, and energy requirements for cooling.
Challenges: SCBWMI not engaged in Cargill salt pond acquisition discussions. Resolution of current questions about endocrine disrupting compounds (EDCs) and pharmaceutically active compounds (PhACs).
Appendix B Section 1 B-2 January 2002

SF Bay Region - WMI Chapter - Appendix B
9. Establishment of streamlined 404 permit/401 certification process for stream and wetlands fill and dredging projects
Comment: **** SCVWD using JARPA (Joint Aquatic Resource Permit Application) and multi-year stream maintenance permit is pending.
Challenges: Need better linkage between planning for flood protection and stream corridor enhancement. Need RWQCB completion of Stream Protection Strategy (or “Policy”)
10. Implementation of Regional Board staff recommendations for new development
Comment: * Need findings from “Compare and Contrast” questionnaire
Challenges: Need RWQCB update of staff recommendations and resolution of runoff permit issues.
The WMI is committed to implement a watershed management planning process for the Santa Clara Basin that integrates the following issues:
Habitat and water quality protection and enhancement Water rights and water supply reliability Flood management Regulatory compliance Land use Public awareness and involvement
Comment: * Action plan development is just getting started.
Challenges: Delay in starting assessments and completion of Action Plan. Discussion on long-term governance structure has not yet started.
The Regional Board goal of the Watershed Management Initiative is to effectively use staff and grant resources for the prevention and control of water pollution on a watershed scale while meeting regulatory program mandates.
Comment: *** RWQCB staff resources generally good
Challenges: Staff turnover and loss of baylands planning staff have been problematic.
Grants to Santa Clara Basin since 1996: 319(h): San Francisquito CRMP and San Jose Riparian Action Plan Demo205(j): SCBWMIProp 13: San Francisquito JPA sediment budgetCALFED: SCVWD Water Use Efficiency & Mercury Restoration, GCRCD, San Francisquito Watershed Council
Appendix B Section 1 B-3 January 2002

SF Bay Region - WMI Chapter - Appendix B
(This Page Left Intentionally Blank)
Appendix B Section 1 B-4 January 2002

SF Bay Region - WMI Chapter - Appendix B
Section 2 - WATERSHED MANAGEMENT INITIATIVE:
GOALS & PLANNING OBJECTIVES, April 1999
STATUS REVIEW, June 2001
The following table indicates the goals and planning objectives for the Santa Clara Basin WMI process. The overall objectives for the process are divided into two types: Planning Objectives and Implementation Objectives.
Planning Objectives are distinct, specific, measurable statements that reflect and define each goal. They are designed to direct, track and measure progress over the next several years of preparing the Watershed Plan, but they do not necessarily guide implementing “on the ground” actions in the watershed. By definition, Planning Objectives will be one or several Implementation Objectives.
Implementation Objectives are also distinct, measurable statements that reflect the goals, but are meant to guide ongoing implementation actions in the watershed. The Implementation Objectives will become part of the Watershed Plan and can be used to measure long-term progress. (Note: Implementation Objectives are not in this draft.)
The WMI is reviewing its progress toward implementing the planning objectives.
Ratings:
***** Fully completed or soon to be completed
**** Substantive progress (major progress 50 – 75%)
*** Moderate Progress (clear strides have been made 25-50%)
** Some Progress (up to 25%)
* Negligible progress or not yet started
? Progress not documented
Appendix B.Section 2 B-5 January 2002

SF Bay Region - WMI Chapter - Appendix B WMI GOALS & PLANNING OBJECTIVES EVALUATION
June 2001
GOAL PLANNING OBJECTIVES Status Comments
1. Ensure that the Watershed Management Initiative is a broad, consensus-based process.
Actively involve policy-makers and the public in the WMI process and activities. This includes: Feedback on the WMI process itself. Input on the Watershed Assessment, State of the Watershed
and Watershed Plan. Education, awareness and buy-in for future watershed
activities.
*** Regulatory Executive Forum and growing list of signatories, but not much public involvement
B. Continue to implement, refine and document decision-making and conflict resolution procedures and the organizational structure of the WMI process (e.g. continue to use sub-groups as vehicle for stakeholder involvement).
***** Adoption date:Successful use in TMDL process
C. Participate and/or cooperate with other relevant planning and implementation processes that have similar goals.
**** Seat on Estuary project, JPA as signatory, good coordination with SCVWD,Need more coordination with SFO
2. Ensure that necessary resources are provided for the implementation of the Watershed Management Initiative.
A. Provide broad overall planning for the WMI. ** No plan for Action Plan adoption and implementation, no continuing structure identified.
B. Provide for effective and responsible management of WMI: Develop a fiscal management structure.
Need to continue financial reporting.
Appendix B.Section 2 B-6 January 2002
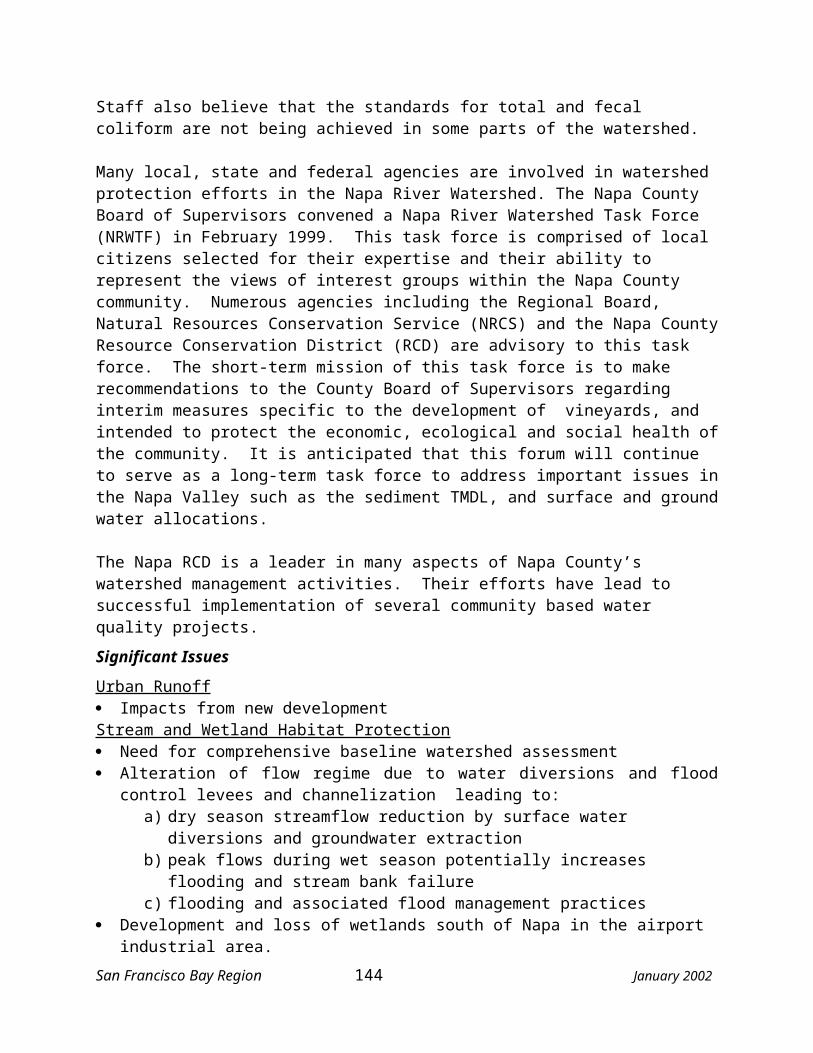
SF Bay Region - WMI Chapter - Appendix B Determine and receive appropriate contributions from
participants. Direct financial resources to priority actions. Track expenditures and stakeholder contributions. Identify, submit, and oversee grant proposal and management.
City and SCVWD mechanism identified only.
C. Identify and obtain possible funding opportunities for implementation of watershed management activities.
** e.g., Riparian Project
D. Ensure that appropriate weight is given to spending funds on both planning and implementation. Direct resources toward priority actions that directly support the approved objectives and goals.
** Not much funding for implementation
E. Identify and work with other monitoring programs in the Santa Clara Basin to ensure cost effective use of field monitoring funds.
*** FAHCE, RWQCB/RMAs, SCVURPPP
3. Simplify compliance with regulatory requirements without compromising environmental protection.
A. Identify regulatory requirements that affect watershed management, and develop criteria for their evaluation.
**** Regulatory chapter of watershed characterization report and gaps and overlaps survey (survey recommendations not yet implemented)
B. Recommend policies, regulations and permit procedures that balance environmental protection with regulatory certainty and streamlining.
*** Cu & Ni Action Plans, SCVWD stream maintenance and streamflow augmentation permitDifficulties with stormwater permit
C. Identify mechanisms to:Streamline the permitting process by integrating or combining related permits, establishing consistency in permits across regulatory agencies and improving certainty.Implement the most cost-effective pollutant control strategies.
Stream maintenance, SCVWD use of JARPA
Success on Action
Appendix B.Section 2 B-7 January 2002

SF Bay Region - WMI Chapter - Appendix B
Implement mechanisms for early public involvement in the permitting process.Improve land use policies and regulations of local jurisdictions and ensure consistency with State and Federal regulatory requirements.Include water quality and water quantity requirements in local land use permitting processes.
Plans, difficulty w/ stormw. PermitSome experience with RB permits
Compare and contrast questionnaire was done, still needs implementation
E. Continue to address permit re-issuance and modifications that occur during the watershed planning process.
*****
F. Develop mechanisms to advocate for regulatory requirements that are scientifically based and continuously improved to focus on priority action.
**** Cu & Ni Action Plans, streamflow augmentation monitoring plan
4. Balance the objectives of water supply management, habitat protection, flood management and land use to protect and enhance water quality.
A. Identify the relationships between water supply management, flood management, habitat protection and land use.
**** Watershed Characteristics Report, FAHCE, new water supply subgroup (SWSS)
B. Develop a decision-making process that integrates the results of the analysis identified in objective 4.A above.
** Just beginning with Action Worksheet process
C. Identify ways to enhance water quality in Santa Clara Basin *** Compare/contrast
Appendix B.Section 2 B-8 January 2002

SF Bay Region - WMI Chapter - Appendix B waterways and the Lower Bay through improved land use practices, pollution prevention and other means.
survey, source control activities for POTWs and SCVURPPP
D. Identify ways to integrate flood management planning and activities with the goals and objectives of the WMI process.
*** Coyote Stream stewardship, Guadalupe collaborative effort, Measure B
E. Identify ways to integrate water supply planning activities with the goals and objectives of WMI, including issues of water conservation, reuse/recycling, surface and ground water quality, and source protection.
** Sustainable Water Supply subgroup, IWRP update, Regional Board groundwater report
5. Protect and/or restore streams, reservoirs, wetlands and the bay for the benefit of fish, wildlife and human uses.
A. Complete a comprehensive watershed assessment, at minimum based on the approved outline of the Report Preparation Team including topics such as: Natural history of the Santa Clara Basin. State of the South Bay. Plant, fish and wildlife habitats and special status species. Water features, water bodies and associated beneficial uses. Quantified criteria for estimating the level of protection for each
beneficial use.
Some done in Watershed characteristics report. Ongoing monitoring by City of San Jose and RMP
K. Identify water bodies with urgent problems and prioritize and implement actions to resolve these problems.
** Workgroup D
L. Participate in the TMDL process and/or establish alternative control strategies for impediments/ stressors.
*****
M. Develop and implement short-term (during WMI) and long-term monitoring strategies, including establishment of baseline information.
** SOILS, SCVURPPP
N. Identify and analyze alternatives to protect and restore wetland, *** Action Sheets
Appendix B.Section 2 B-9 January 2002

SF Bay Region - WMI Chapter - Appendix B riparian and stream habitats.
O. Identify opportunities to increase biodiversity within the basin. ** FAHCE, Focus on burrowing owls
P. Identify important issues for water supply, agriculture and recreational-use protection or restoration.
**** Vision and implementation objectives
6. Develop an implementable Watershed Management Plan that incorporates science and is continuously improved.
A. Prepare a Quality Management Plan and use it throughout the preparation of the Watershed Assessment, State of the Watershed and Watershed Plan.Convene independent experts to review data collection, the Watershed Assessment and other documents.Ensure adequate public review of all technical reports produced by the WMI.
** Prepared Quality Management Plan but not using it. Captains were identified, but watershed assessment contract has not yet started
C. Establish priority actions in the Watershed Plan and have a process for continual improvement.
** Just starting with Action Plan
D. Develop mechanism to regularly review and update the Watershed Plan.
* Not started
Appendix B.Section 2 B-10 January 2002

SF Bay Region - WMI Chapter - Appendix B Section 3 - 2000-2001 Successes and Accomplishments of the SCBWMI
by Core Group, August 2, 2001
Consensus Process Succeeding in Regulatory Setting
1) Compromise reached through consensus process by stakeholders and the SCVWD on the SCVWD’s Upper Guadalupe capital project to include thermal impact monitoring plan, and action plan to protect anadromous fish
2) Moved almost all stormwater permit issues into the permit language and conditions (excepting C3 requirements)
3) There was uncontested adoption of the South Bay’s amended wastewater (NPDES) permits which is unprecedented in the RWQCB’s history and the permits included pollution prevention activities (Cu/Ni Action Plans) to address anti-degradation in lieu of a TMDL
4) Progress on Guadalupe R. Mercury TMDL Workplan through the stakeholder process (departure from a historical command and control approach) (not withstanding the NRDA process)
SCBWMI Process Evolution
5) Development of our “Vision” brochure
6) WMI process is making more effective contributions through its short term issue process and through its subgroups (an example is the success of our item #1)
7) We made it to our 5th birthday
8) We have name recognition (an example is the referral of the issues surrounding Endocrine Disrupting Compounds in wastewater that the City of San Jose wants resolved using the WMI process)
9) We are still getting new signatories, e.g. the San Francisquito JPA
10) We share our decision-making processes among cities, environmentalists and business groups– it is a democratic process, based on reaching consensus
11) We finished and distributed the Watershed Characteristics Report, Abridged, Unabridged, and on CD-ROM in February 2001
12) We are a broad stakeholder group and we are productive
13) We are making progress on Volumes 2 and 3
Appendix B.Section 3 B-11 January 2002

SF Bay Region - WMI Chapter - Appendix B 14) Project ideas are brought forward and further developed
15) The action planning process is developing
16) We are sticking with it– evidenced in that there is not a lot of turnover of staff/people around the table
Partnership Building (including Funding)
17) SCBWMI chosen by the SWRCB as a watershed pilot
18) Permanent monitoring stations on San Francisquito
19) The Watershed Watch campaign
20) The CSJ and the SCVWD’s watershed grants programs
21) SCVWD’s land use summit
22) SCVWD granted official WMI representative to IWRP process
23) Grants received by SCVWD, GCRCD, and San Francisquito Watershed Council from CALFED
24) Funding of an environmental representative for the assessment planning
25) Funding from CSJ as a member of the WMI for community foundation to hold lecture series
26) San Francisquito Joint Power Authority received a Prop 13 grant for sediment studies
27) The San Jose Riparian Restoration Action Plan demonstration project at the William Street Park on Coyote Creek
Appendix B.Section 3 B-12 January 2002


![Richard B. Spencer - Wikipedia B. Spencer … · 2017-01-21 · Richard B. Spencer Born Richard Bertrand Spencer May 11, 1978 Boston, Massachusetts, U.S.[1] Residence Whitefish,](https://static.fdocuments.in/doc/165x107/5f0934117e708231d425b6fb/richard-b-spencer-wikipedia-b-spencer-2017-01-21-richard-b-spencer-born-richard.jpg)