Limits of data transfer rate in optical...
20
Transcript of Limits of data transfer rate in optical...
University of LjubljanaFaculty of Mathematics and Physics
Limits of data transfer rate in
optical communications
SEMINAR
Author: Gregor Traven
28030377Mentor: prof. Irena Dreven²ek
Date: 26. May 2010
Abstract
This seminar's purpose is to explain in some detail the physical limitations to nowa-
days optical communication systems. The basic component of such systems is naturally
an optical �bre and its properties will be at the heart of our discussion trying to demon-
strate the limits to maximum data transfer rate. These limits are imposed mainly due
to attenuation and dispersion of light signals travelling along the �bre. We will also see
where do di�erent kinds of attenuation and dispersion come from and what are (or were)
the optimum combinations of optical sources (wavelength), receivers and �bre cables. The
end results will demonstrate the limitations of classical systems that are still most widely
used nowadays, though many new technologies and principles are already developed and
applied.
Contents
1 Introduction to optical communications . . . . . . . . . . . . . . . . . . . . . . . 22 Optical vs classical data transfer . . . . . . . . . . . . . . . . . . . . . . . . . . . 33 Components of the optical �ber link . . . . . . . . . . . . . . . . . . . . . . . . . 4
3.1 Optical �bers . . . . . . . . . . . . . . . . . . . . . . . . . . . . . . . . . 43.2 Sources for Optical transmitters . . . . . . . . . . . . . . . . . . . . . . . 103.3 Detectors for optical receivers . . . . . . . . . . . . . . . . . . . . . . . . 11
4 Fiber-optic systems . . . . . . . . . . . . . . . . . . . . . . . . . . . . . . . . . . 124.1 Digital communication system performance . . . . . . . . . . . . . . . . . 124.2 Evolution of Optical Fiber Communication Systems . . . . . . . . . . . . 134.3 The Bit Error Rate . . . . . . . . . . . . . . . . . . . . . . . . . . . . . . 144.4 Receiver Sensitivity . . . . . . . . . . . . . . . . . . . . . . . . . . . . . . 144.5 Design Strategy . . . . . . . . . . . . . . . . . . . . . . . . . . . . . . . . 144.6 Attenuation-Limited Performance . . . . . . . . . . . . . . . . . . . . . . 154.7 Dispersion-Limited Performance . . . . . . . . . . . . . . . . . . . . . . . 16
5 All together performance and conclusion . . . . . . . . . . . . . . . . . . . . . . 17
1
1 Introduction to optical communications
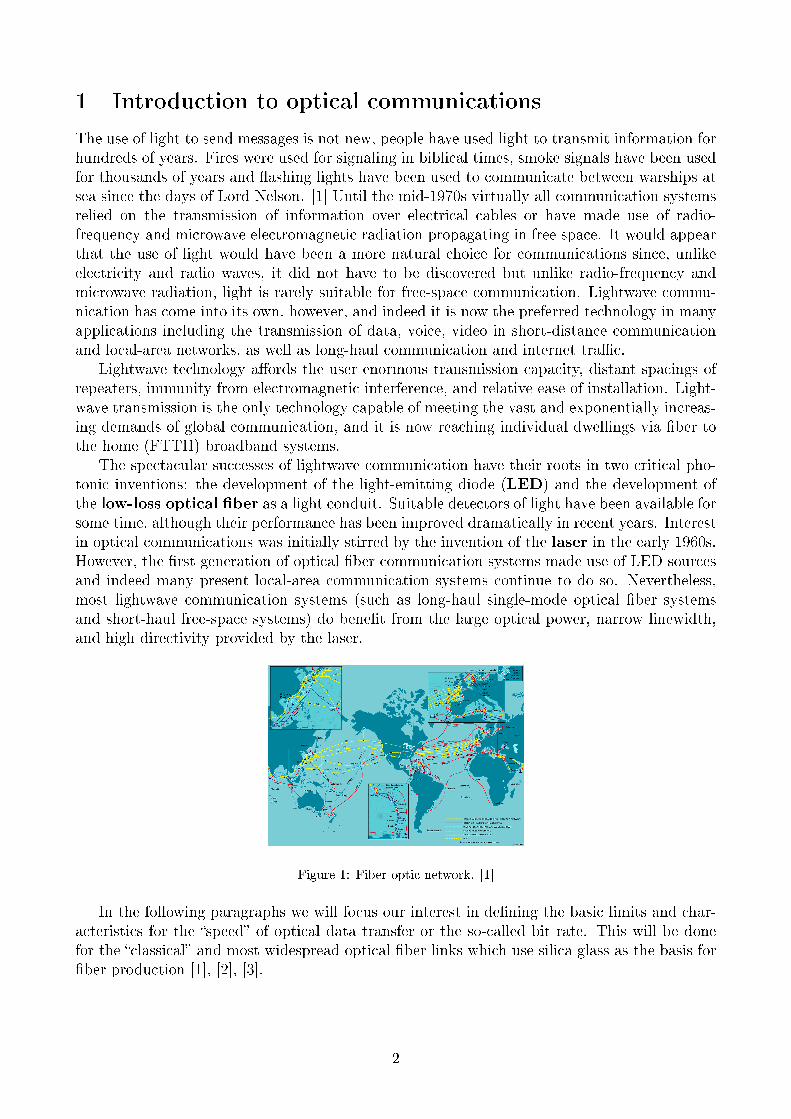
The use of light to send messages is not new, people have used light to transmit information forhundreds of years. Fires were used for signaling in biblical times, smoke signals have been usedfor thousands of years and �ashing lights have been used to communicate between warships atsea since the days of Lord Nelson. [1] Until the mid-1970s virtually all communication systemsrelied on the transmission of information over electrical cables or have made use of radio-frequency and microwave electromagnetic radiation propagating in free space. It would appearthat the use of light would have been a more natural choice for communications since, unlikeelectricity and radio waves, it did not have to be discovered but unlike radio-frequency andmicrowave radiation, light is rarely suitable for free-space communication. Lightwave commu-nication has come into its own, however, and indeed it is now the preferred technology in manyapplications including the transmission of data, voice, video in short-distance communicationand local-area networks, as well as long-haul communication and internet tra�c.
Lightwave technology a�ords the user enormous transmission capacity, distant spacings ofrepeaters, immunity from electromagnetic interference, and relative ease of installation. Light-wave transmission is the only technology capable of meeting the vast and exponentially increas-ing demands of global communication, and it is now reaching individual dwellings via �ber tothe home (FTTH) broadband systems.
The spectacular successes of lightwave communication have their roots in two critical pho-tonic inventions: the development of the light-emitting diode (LED) and the development ofthe low-loss optical �ber as a light conduit. Suitable detectors of light have been available forsome time, although their performance has been improved dramatically in recent years. Interestin optical communications was initially stirred by the invention of the laser in the early 1960s.However, the �rst generation of optical �ber communication systems made use of LED sourcesand indeed many present local-area communication systems continue to do so. Nevertheless,most lightwave communication systems (such as long-haul single-mode optical �ber systemsand short-haul free-space systems) do bene�t from the large optical power, narrow linewidth,and high directivity provided by the laser.
Figure 1: Fiber optic network. [1]
In the following paragraphs we will focus our interest in de�ning the basic limits and char-acteristics for the �speed� of optical data transfer or the so-called bit rate. This will be donefor the �classical� and most widespread optical �ber links which use silica glass as the basis for�ber production [1], [2], [3].
2

2 Optical vs classical data transfer
It is best to �rst describe some of the aspects of optical versus classical (copper wire, coaxialcable) communication systems.
Pros:
• Less expensive - Several miles of optical cable can be made cheaper than equivalent lengthsof copper wire.
• Thinner and lightweight - Optical �bers can be drawn to smaller diameters than copperwire, weigh less and take up less space in the ground
• Higher carrying capacity - The capacity of a �ber for optical data transmission is ordersof magnitude higher than for any electric cable.
• Less signal degradation - The transmission losses of a �ber can be very low: well below 1dB/km for the optimum wavelengths
• A large number of channels can be reampli�ed in a single �ber ampli�er, if required forvery large transmission distances.
• Optical data connections via �bers are comparatively hard to intercept and manipulate,which gives additional security even without using encryption techniques.
• Fiber connections are immune to electromagnetic interference, problems with groundloops, and the like.
• Low power - Because signals in optical �bers degrade less, lower-power transmitters canbe used instead of the high-voltage electrical transmitters needed for copper wires.
• Non-�ammable - Because no electricity is passed through optical �bers, there is no �rehazard or the risk of triggering explosive substances
• Flexible - Because �ber optics are so �exible and can transmit and receive light, they areused in many �exible digital cameras for the following purposes:
� Medical imaging - in bronchoscopes, endoscopes, laparoscopes
� Mechanical imaging - inspecting mechanical welds in pipes and engines (in airplanes,rockets, space shuttles, cars)
� Plumbing - to inspect sewer lines
Cons:
• Fiber connections are comparatively sensitive and di�cult to handle, particularly whensingle-mode �bers are used. Precise alignment and high cleanliness are required.
• Fibers may not be bent very tightly, because this can cause high bend losses or evenbreakage. This can be a problem e.g. in the context of �ber-to-the-home technologies.
• At least unprotected glass �bers are mechanically less robust than metallic wires.
[1], [3]
3
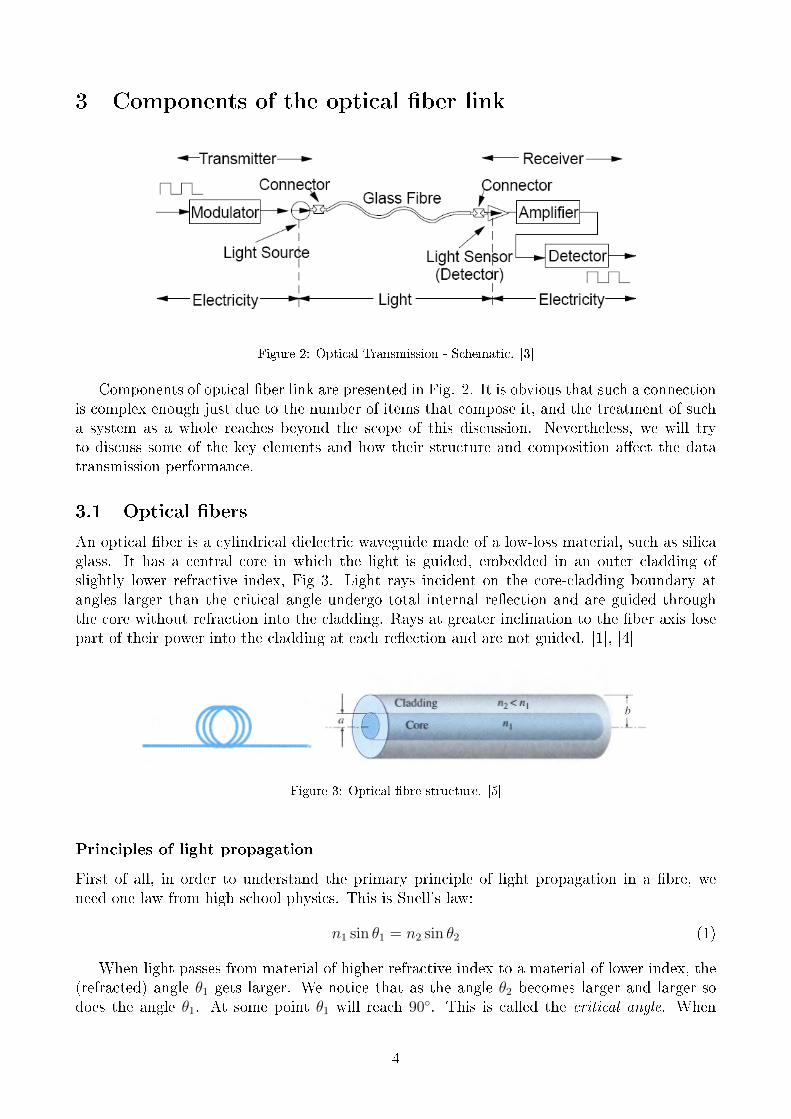
3 Components of the optical �ber link
Figure 2: Optical Transmission - Schematic. [3]
Components of optical �ber link are presented in Fig. 2. It is obvious that such a connectionis complex enough just due to the number of items that compose it, and the treatment of sucha system as a whole reaches beyond the scope of this discussion. Nevertheless, we will tryto discuss some of the key elements and how their structure and composition a�ect the datatransmission performance.
3.1 Optical �bers
An optical �ber is a cylindrical dielectric waveguide made of a low-loss material, such as silicaglass. It has a central core in which the light is guided, embedded in an outer cladding ofslightly lower refractive index, Fig 3. Light rays incident on the core-cladding boundary atangles larger than the critical angle undergo total internal re�ection and are guided throughthe core without refraction into the cladding. Rays at greater inclination to the �ber axis losepart of their power into the cladding at each re�ection and are not guided. [1], [4]
Figure 3: Optical �bre structure. [5]
Principles of light propagation
First of all, in order to understand the primary principle of light propagation in a �bre, weneed one law from high school physics. This is Snell's law:
n1 sin θ1 = n2 sin θ2 (1)
When light passes from material of higher refractive index to a material of lower index, the(refracted) angle θ1 gets larger. We notice that as the angle θ2 becomes larger and larger sodoes the angle θ1. At some point θ1 will reach 90◦. This is called the critical angle. When
4
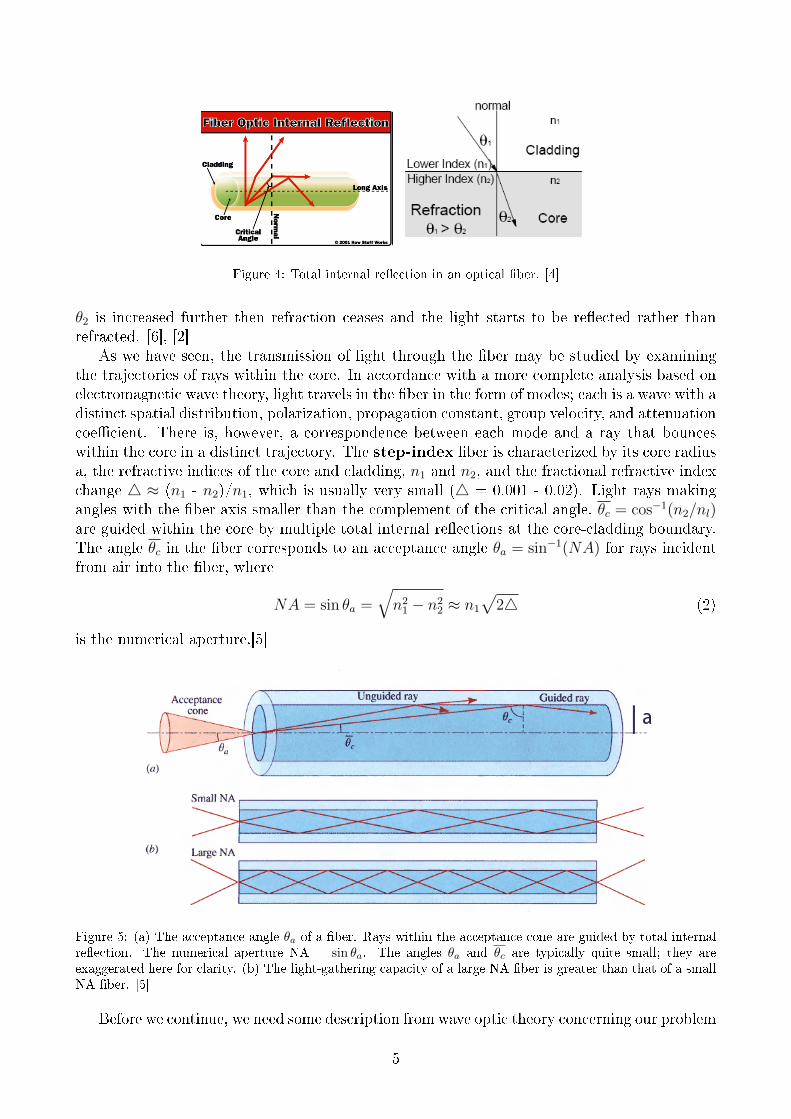
Figure 4: Total internal re�ection in an optical �ber. [4]
θ2 is increased further then refraction ceases and the light starts to be re�ected rather thanrefracted. [6], [2]
As we have seen, the transmission of light through the �ber may be studied by examiningthe trajectories of rays within the core. In accordance with a more complete analysis based onelectromagnetic wave theory, light travels in the �ber in the form of modes; each is a wave with adistinct spatial distribution, polarization, propagation constant, group velocity, and attenuationcoe�cient. There is, however, a correspondence between each mode and a ray that bounceswithin the core in a distinct trajectory. The step-index �ber is characterized by its core radiusa, the refractive indices of the core and cladding, n1 and n2, and the fractional refractive indexchange 4 ≈ (n1 - n2)/n1, which is usually very small (4 = 0.001 - 0.02). Light rays makingangles with the �ber axis smaller than the complement of the critical angle, θc = cos−1(n2/nl)are guided within the core by multiple total internal re�ections at the core-cladding boundary.The angle θc in the �ber corresponds to an acceptance angle θa = sin−1(NA) for rays incidentfrom air into the �ber, where
NA = sin θa =√n21 − n2
2 ≈ n1
√24 (2)
is the numerical aperture.[5]
Figure 5: (a) The acceptance angle θa of a �ber. Rays within the acceptance cone are guided by total internalre�ection. The numerical aperture NA = sin θa. The angles θa and θc are typically quite small; they areexaggerated here for clarity. (b) The light-gathering capacity of a large NA �ber is greater than that of a smallNA �ber. [5]
Before we continue, we need some description from wave optic theory concerning our problem
5

and the solutions arising from it. We write Maxwell's equations for the core and cladding areaand impose core-cladding boundary conditions where each of the monochromatic electric andmagnetic �elds obeys the Helmholtz equation, ∇2U + n2(r)k20U = 0, where k0 = 2π/λ0.
Figure 6: Cylindrical coordinate system. [5]
In a cylindrical coordinate system (Fig. 6) the Helmholtz equation is written as
∂2U
∂r2+
∂U
r∂r2+
1
r2∂2U
∂φ2+∂2U
∂z2+ n2k20U = 0,
where U = U(r, z, φ). Solutions are the family of Bessel functions. Excluding functions thatapproach ∞ at r = 0 in the core, or r →∞ in the cladding, we obtain the bounded solutionswhich are the family of Bessel functions, some seen in Fig. 7.
Figure 7: Examples of the radial distribution u(r) for l = 0 and l = 3. The shaded and unshaded areasrepresent the �ber core and cladding, respectively. The parameters kT and γ have been selected such that u(r)is continuous and has a continuous derivative at r = a. Larger values of kT and γ lead to a greater number ofoscillations in u(r). [5]
Multimode Fibers (MMF)
The number of guided modes M is governed by the V parameter also called normalized fre-quency, V = 2π(a/λ0)NA, where a/λ0 is the ratio of the core radius a to the wavelength λ0.In a �ber with V � 1, there are a large number of modes, M = V 2/2. Since the modes travelwith di�erent group velocities, this results in pulse spreading, which increases linearly with the�ber length, an e�ect called modal dispersion. When an impulse of light travels a distance
6

L in the �ber, it arrives as a sequence of pulses centered at the mode delay times, as illustratedin Fig. 9. The composite pulse has an approximate RMS width
στ ≈42c1
L, (3)
where c1 = c0/n1. It is therefore more desirable to use �bers with small 4. For example, ifn1 = 1.46 and4 = 0.01, the response time per km ≈4/2c1 ≈ 24 ns/km. For a 100-km �ber, animpulse spreads to a width of 2.4 µs. Modal dispersion can also be reduced by use of graded-index (GRIN) �bers. In such �bers the refractive index of the core varies gradually from amaximum value n1 on the �ber axis to a minimum value n2 at the core-cladding boundary. Raysfollow curved trajectories, with paths shorter than those in the step-index �ber. The axial raytravels the shortest distance at the smallest phase velocity (largest refractive index), whereasoblique rays travel longer distances at higher phase velocities (smaller refractive indexes), sothat the delay times are approximately equalized. [5], [2]
Single-Mode Fibers (SMF)
When the core radius a and the numerical aperture NA of a step-index �ber are su�cientlysmall so that V < 2.405 (the smallest root of Bessel function Jl−1), only a single mode is allowedand the �ber is called a single-mode �ber (SMF). One advantage of using an SMF is the elim-ination of pulse spreading caused by modal dispersion. Pulse spreading occurs, nevertheless,since the initial pulse has a �nite spectral linewidth and the group velocities (and therefore thedelay times) are wavelength dependent. This e�ect is called chromatic dispersion. There aretwo origins of chromatic dispersion: material dispersion, which results from the dependenceof the refractive index of silica glass on the wavelength, and waveguide dispersion, which isa consequence of the dependence of the group velocity of the mode on the ratio between thecore radius and the wavelength (a/λ0). Material dispersion is usually larger than waveguidedispersion.[5]
A short optical pulse of spectral width σλ spreads to a temporal width
στ = |D|σλL (4)
proportional to the propagation distance L (km) and to the source linewidth σλ (nm), where Dis the dispersion coe�cient (ps/km-nm). The parameter D involves a combination of materialand waveguide dispersion. For weakly guiding �bers (4 � 1), D may be separated into a sumDλ +Dw of the material and waveguide contributions.
The material dispersion coe�cient Dλ is
Dλ = −λ0c0
d2n
dλ20(5)
where n is refractive index and λ0 is the wavelength in vacuum. The wavelength dependenceof the dispersion coe�cient Dλ for a silica-glass �ber is displayed in Fig. 8. At wavelengthsshorter than 1.3 µm the dispersion coe�cient is negative, so that wavepackets of long wave-length travel faster than those of short wavelength.[5]
The waveguide dispersion coe�cient Dw is
Dw =d
dλ0
(1
v
)= − ω
λ0
d
dω
(1
v
)(6)
7

Figure 8: Dispersion coe�cient Dλ for a silica-glass �ber as a function of wavelength λ0. [5]
where v is group velocity.As an example, an SMF with a light source of spectral linewidth σλ = 1 nm (from a typical
single-mode laser) and a �ber dispersion coe�cient D = 1 ps/km-nm (for operation near λ0 =1300 nm with minimal waveguide dispersion), the pulse extension is στ/L = 1 ps/km. A �berof length 100 km has a 100 ps broadening time. The geometries, refractive-index pro�les, andpulse broadening in multimode step-index and graded-index �bers and in single-mode �bersare schematically compared in Fig. 9.
Figure 9: (a) Step-index multimode �bers (MMF): relatively large core diameter; uniform refractive indexesin the core and cladding; large pulse spreading due to modal dispersion. (b) Graded- index (GRIN) MMF:refractive index of the core is graded; there are fewer modes; pulse broadening due to modal dispersion isreduced. (c) Single-mode �bers (SMF): small core diameter; no modal dispersion; pulse broadening is due onlyto material and waveguide dispersion.[5]
Attenuation and Dispersion in optical �bre
Attenuation and dispersion limit the performance of the optical-�ber medium as a data-transmission channel. Attenuation, associated with losses of various kinds, limits the magnitudeof the optical power transmitted. Dispersion, which is responsible for the temporal spread ofoptical pulses, limits the rate at which such data-carrying pulses may be transmitted. Disper-sion was already discussed in previous paragraphs so we shall now consider attenuation.
8

Attenuation Coe�cient
The power of a light beam traveling through an optical �ber decreases exponentially withdistance as a result of absorption and scattering. The attenuation coe�cient is conventionallyde�ned in units of decibels per kilometer (dB /km) and is denoted by the symbol α,
α =1
L10 log10
1
T, (7)
where T = P (L)/P (0) is the power transmission ratio (ratio of transmitted to incident power)for a �ber of length L km. An attenuation of 3 dB/km, for example, corresponds to a powertransmission of T = 0.5 through a �ber of length L = 1 km. For light traveling through acascade of lossy systems, the overall transmission ratio is the product of the constituent trans-mission ratios. By virtue of the logarithm the overall loss in dB therefore becomes the sum ofthe constituent dB losses. For a propagation distance of z km, the loss is αz dB.[5]
Absorption
The attenuation coe�cient α of fused silica (Si02) is strongly dependent on wavelength,as illustrated in Fig. 10. This material has two strong absorption bands: a mid-infrared ab-sorption band resulting from vibrational transitions and an ultraviolet absorption band arisingfrom electronic and molecular transitions. The tails of these bands form a window in the nearinfrared region of the spectrum in which there is little intrinsic absorption.[5]
Scattering
Rayleigh scattering is another intrinsic e�ect that contributes to the attenuation of lightin glass. The random localized variations of the molecular positions in the glass itself createrandom inhomogeneities in the refractive index that act as tiny scattering centers.
Figure 10: Attenuation coe�cient α of silica glass versus wavelength λ0. There is a local minimum at 1.3 µm(α ≈ 0.3 dB/km) and an absolute minimum at 1.55 µm (α ≈ 0.15 dB/km).[5]
In the visible region of the spectrum, Rayleigh scattering is a more signi�cant source of lossthan is the tail of the ultraviolet absorption band, as shown in Fig. 10. However, Rayleigh lossbecomes negligible in comparison with infrared absorption for wavelengths greater than 1.6 µm.We conclude that the transparent window in silica glass is bounded by Rayleigh scattering on
9

the short-wavelength side and by infrared absorption on the long-wavelength side (indicated bythe dashed curves in Fig. 10).
Lightwave communication systems are of course deliberately designed to operate in thiswindow.
Extrinsic E�ects
There are also other factors causing the loss and absorption of light in a �ber, such asabsorption bands that result from the presence of impurities, principally metallic ions andOH radicals associated with water vapor dissolved in the glass. Most metal impurities canbe readily removed but OH impurities are somewhat more di�cult to eliminate. In general,wavelengths at which glass �bers are used for lightwave communication are selected to avoidthe OH absorption bands. Light-scattering and losses also come from added dopants (indexgrating), small random variations in the geometry of the �ber, bends and losses in the cladding.
Figure 11: Ranges of attenuation coe�cients for silica-glass single-mode �bers (SMF) and multimode �bers(MMF).[5]
We have more or less thoroughly described the largest in size but smallest in cost of thecomponents of optical data transfer, an optical �ber. It is time to move on to the peripheryor better said to the start and end components of optical link. We will not go into detailson modulators, connectors, ampli�ers, ADCs ... However, some insight on optical sources anddetectors is almost necessary and we shall make an overview of what exists and is being mostcommonly applied.
3.2 Sources for Optical transmitters
Both light-emitting diodes (LEDs) and laser diodes (LDs) are used as sources in optical �bercommunication systems. Light-emitting diodes are fabricated in two basic structures: surfaceemitting and edge emitting. Surface-emitting diodes have relatively broad linewidth, which canexceed 100 nm in the 1300-1600 nm band. When operated at maximum power, modulationfrequencies up to 100 Mb/s are possible, but higher speeds (up to 500 Mb/s) can be attained atreduced powers. The edge-emitting diode produces more power output with relatively narrowerspectral linewidth, at the expense of increased complexity. Laser diodes have the advantagesof high power (tens of W), high modulation speeds (many Gb/s), narrow spectral linewidths(tens of MHz), and ease of coupling into single-mode �ber. However, they are sensitive to
10

temperature variations.[5]
The most common laser-diode con�guration is the distributed feedback (DFB) laser (Fig.12). This device makes use of a corrugated-layer grating adjacent to the active region, whichacts as a distributed re�ector that substitutes for the mirrors of a Fabry-Perot laser. Thisdesign is compatible with on-chip integration.
Figure 12: Buried-heterostructure multiquantum-well distributed- feedback laser used for optical �ber commu-nications. The dielectric �lm provides gain guiding while the alternating p and n-type layers allow current �owonly in the vicinity of the active region. Lasers such as these o�er ample gain at modest current levels, andprovide output powers of 1 W or more in a single spatial mode.[5]
3.3 Detectors for optical receivers
Two types of detectors are commonly used in optical communication systems: the p-i-n pho-todiode and the avalanche photodiode (APD). The APD has the advantage of providing gainbefore the �rst electronic ampli�cation stage in the receiver, thereby reducing the detrimentale�ects of circuit noise. However, the gain mechanism itself introduces noise and has a �niteresponse time, which may reduce the bandwidth of the receiver.
• Detectors at 0.87 µm: Silicon p-i-n photodiodes and APDs are used at these wave-lengths. In state-of-the-art preampli�ers, silicon APDs enjoy a 10-to-15-dB sensitivityadvantage over silicon p-i-n photodiodes because their internal gain makes the noise ofthe preampli�er relatively less important. The sensitivity of Si APDs at bit rates up toseveral hundred Mb/s corresponds to about 100 photons/bit. This is still somewhat 10times larger than the prescribed limit of 10 photons/bit.
• Detectors at 1.3 and 1.55 µm: Silicon is not usable in this region because its bandgapis greater than the photon energy. Germanium and InGaAs p-i-n photodiodes are bothused; InGaAs is preferred because it has greater thermal stability and lower dark noise.Typical InGaAs p-i-n photodiodes have quantum e�ciencies ranging from 0.5 to 0.9 andresponse times that are in the tens of ps (corresponding to bandwidths up to 60 GHz).
11

Figure 13: SAGM (separate absorption, grading, multiplication) APD in which the absorption takes place inInGaAs and the multiplication in InP. Quantum e�ciencies are in the range 0.75 to 0.9, bandwidths extend upto ≈ 10 GHz, and gain-bandwidth products are as high as ≈ 75 GHz.[5]
4 Fiber-optic systems
The simplest communication system is a point-to-point link. The information is carried by asignal modulated at one point and observed at the other. We can modulate optical intensity,amplitude, frequency, phase, or polarization. The simplest example is the intensity modula-tion communication system illustrated in Fig. 14 and we will concentrate on this modulationfor the evaluation of system performance. The majority of commercial �ber communicationsystems at present use intensity modulation. The power of the source is modulated by varyingthe injected current in a LED or a diode laser [3].
Figure 14: Optical �ber communication system using intensity-modulation. Digital ON-OFF keying: bits �1�and �0� are represented, respectively, by the presence and absence of an optical pulse. [5]
4.1 Digital communication system performance
Let's take a �ber-optic communication system using an LED or a laser diode of power Ps (mW)and spectral width σλ (nm); an optical �ber of attenuation coe�cient α (dB/km), broadeningtime στ/L (ns/km), and length L (km); and a p-i-n or APD photodetector. The intensityof light is modulated in an on-o� keying (OOK) system by turning the power on and o� torepresent bits �0� and �1�. The link transmits B0 bits/s. Several of these links may be cascadedto form a longer link. An intermediate receiver-transmitter unit connecting two adjacent linksis called a regenerator or repeater. Here we are concerned only with the design of a single link.The purpose of the design is to determine the maximum distance L over which the link cantransmit B0 bits/s with a rate of errors smaller than a prescribed rate. An equivalent problemis to determine the maximum bit rate B0 a link of length L can transmit. The maximum (bitrate) (distance) product LB0 serves as a single number that describes the capability of the link.We shall determine the typical dependence of L on B0, and derive expressions for the maximum(bit rate) (distance) product LB0 for various types of �bers [5], [3].
12

4.2 Evolution of Optical Fiber Communication Systems
As illustrated earlier, the minimum attenuation in silica glass occurs at ≈ 1550 nm, whereas theminimum material dispersion occurs at ≈ 1312 nm. The choice between these two wavelengthsdepends on the relative importance of power loss versus pulse spreading as explained later on.However, the availability of an appropriate light source is also a factor. First-generation optical�ber communication systems operated at ≈ 870 nm (the wavelength of AlGaAs light-emittingdiodes and laser diodes), where both attenuation and material dispersion are relatively high.More advanced systems operate at 1300 and 1550 nm [5].
The following systems describe the historical evolution in the �eld of optical communicationsand Fig. 15 depicts the increase in LB0 over the years.
• System 1: Multimode �ber (MMF) at 870 nm. This is the early technology of the1970s. Fibers are either step-index or graded-index, light source is either an LED ora laser and both silicon p-i-n and APD photodiodes are used. The performance of thissystem is limited by the �ber's high attenuation and modal dispersion. A typical intercitycommunication link of this era operated at B0 = 100 Mb/s, with a repeater spacing L =10 km, i.e., LB0 = 1 km-Gb/s.
• System 2: Single-mode �ber (SMF) at 1310 nm. Material dispersion is minimal andperformance is limited by �ber attenuation. InGaAsP lasers are used with either InGaAsp-i-n or APD photodetectors. A typical long-haul link in this class operated at OC-12(622 Mb/s) with repeater spacing L = 40 km and LB0 ≈ 25 km-Gb/s.
• System 3: Single-mode �ber (SMF) at 1550 nm. At this wavelength the �ber has itslowest attenuation and performance is limited by material dispersion. An example ofthis system is a long-haul terrestrial or undersea link operating at 2.5 Gb/s (OC-48) overa distance L = 100 km, for which LB0 ≈ 250 km-Gb/s. Advances in transmitters andreceivers have boosted this system to 10 Gb/s (OC-192), bringing LB0 to one km-Tb/s.
Figure 15: The history of optical �ber communication systems comprises continuous improvement of the (bitrate) (distance) product LB0. [5]
The three systems, which are often referred to as the �rst three generations of optical �bersystems, have achieved a 1000-fold increase in LB0 from 1974 to the 1990s. These technologies
13
will be used as examples in the discussion of system performance. Other more advanced sys-tems (seen in Fig. 15) exist but are either still in development and experimentation or not sowidely used. To describe them quickly:
Coherent system: Rather than measuring the intensity of the signal light directly by aphotodetector, a coherent system makes use of coherent detection, in which light from a localsource (called the local oscillator) is mixed with the signal light at the detector. The useof coherent detection enhances the receiver sensitivity thus allowing greater communicationdistances;
OFA: Optical �ber ampli�ers are placed periodically along the �ber, they compensate at-tenuation and therefore extend the distance between electronic repeaters.
Optical soliton system: Solitons are short (typically 1 to 50 ps) optical pulses that can travelthrough long optical �bers without changing the shape of their pulse envelope. The e�ects of�ber dispersion and nonlinear self-phase modulation (arising, for example, from the opticalKerr e�ect) precisely cancel each other, so that the pulses act as if they were traveling througha linear nondispersive medium.
Wavelength-division multiplexing (WDM): Use of multiple wavelengths (channels) transmit-ted through the same �ber. Broad- band optical ampli�ers are used to provide simultaneousampli�cations for all channels.
Before continuing, let's de�ne some terms needed to evaluate the overall system performance.
4.3 The Bit Error Rate
No data transmission is perfect and there are always �some bits� missing. The performance ofa digital communication system is therefore measured by the probability of error per bit, whichwe refer to as the bit error rate (BER). If p1 is the probability of mistaking �1� for �0� and p0 isthe probability of mistaking �0� for �1� and if the two bits are equally likely to be transmitted,then BER = 1
2p1 +
12p0. A typical acceptable BER is 10−9 (i.e., an average of one error every
109 bits). An average of at least n0 = 10 photons per bit is required to ensure that BER <10−9 [5].
4.4 Receiver Sensitivity
The sensitivity of the receiver is de�ned as the minimum number of photons (or the corre-sponding optical energy) per bit necessary to guarantee that the rate of error (BER) is smallerthan a prescribed rate (usually 10−9). Errors occur because of the randomness of the numberof photoelectrons detected during each bit, as well as the noise in the receiver circuit itself. Forthe purposes of illustration we shall use the nominal receiver sensitivities of n0 = 300 photonsper bit for receivers operating at λ0 = 0.87µm and 1.3 µm, and n0 = 1000 photons per bit forreceivers operating at λ0 = 1.55µm.
4.5 Design Strategy
Once we know the minimum power required at the receiver, the power of the source, and the�ber attenuation per kilometer, a power budget may be prepared from which the maximum�ber length is determined. We must also prepare a budget for the pulse spreading that resultsfrom dispersion in the �ber. If the width στ of the received pulses exceeds the bit time interval
14

1/B0 adjacent pulses overlap and cause inter-symbol interference, which increases the errorrates. There are therefore two conditions for the acceptable operation of the link:
• The received power must be at least equal to the receiver power sensitivity Pr. A marginof 6 dB above Pr is usually speci�ed.
• The received pulse width στ must not exceed a prescribed fraction of the bit time interval1/B0 [5].
4.6 Attenuation-Limited Performance
Attenuation-limited performance is assessed by preparing a power budget. Since �ber attenu-ation is measured in dB units, it is convenient to also measure power in dB units. Using 1 mWas a reference, dBm units are de�ned by
P = 10 log10 P, P in mW; P in dBm (8)
For example, P = 0.1 mW, 1 mW, and 10 mW correspond to P = - 10 dBm, 0 dBm, and10 dBm, respectively. In these logarithmic units, we can sum together all power losses. If Psis the power of the source (dBm), α is the �ber loss in dB/km, Pc is the splicing and couplingloss (dB), and L is the maximum �ber length such that the power delivered to the receiver isthe receiver sensitivity Pr (dBm), then
Ps − Pc − Pm − αL = Pr (9)
where Pm is a safety margin [5].
Figure 16: Power budget of an optical link. [5]
The optical power is plotted schematically in Fig. 16 as a function of the distance from thetransmitter. The receiver power sensitivity Pr = 10 log10 Pr ( dBm ) is obtained from (??),
Pr = 10 log10hνn0B0
10−3dBm (10)
Thus Pr increases logarithmically with B0.The maximum length of the link is obtained by substituting (10) into (9),
L =1
α
(Ps − Pc − Pm − 10 log10
hνn0B0
10−3
), (11)
from which
L = L0 −10
λlogB0 (12)
where L0 = [Ps − Pc − Pm − 30 − 10 log(hνn0)]/α. The length drops with increase of B0
at a logarithmic rate with slope 10/α. Figure 17 is a plot of this relation for the operatingwavelengths 0.87, 1.3, and 1.55 µm.
15

Figure 17: Maximum �ber length L as a function of bit rate B0 under attenuation-limited conditions for a fusedsilica-glass �ber operating at wavelengths λ0 = 870, 1300 and 1550 nm assuming �ber attenuation coe�cientsα = 2.5, 0.35, and 0.16 dB/km, respectively; source power Ps = 1 mW (Ps = 0 dBm); receiver sensitivity n0 =300 photons/bit for receivers operating at 870 and 1300 nm and n0 = 1000 for the receiver operating at 1550nm; and Pc = Pm = 0. For comparison, the LB0 relation for a typical coaxial cable is also shown. [5]
4.7 Dispersion-Limited Performance
The propagated pulse width σT depends on the original pulse width σs, the response time of thetransmitter σtx, the response time of the �ber στ which results from various forms of dispersion,and the response time of the receiver a σrx. For the purpose of demonstration we shall simplifyand only consider στ .
When στ exceeds the bit time interval, T = 1/B0, the performance begins to deteriorateas a result of intersymbol interference (overlapping of signals). We shall select the maximumallowed width to be one-fourth of the bit-time interval,
στ =T
4=
1
4B0
. (13)
Figure 18: Dispersion-limited maximum �ber length L as a function of bit rate B0. [5]
The choice of the factor 1/4 is clearly arbitrary and serves only to compare the di�erenttypes of �bers:
16

• Step-Index Fiber. The width of the received pulse after propagation a distance L in amultimode step-index �ber is governed by modal dispersion. Substituting (3) into (13),we obtain the LB0 relation
LB0 =c124
(14)
where c1 = c0/n1 is the speed of light in the core material and 4 = (n1 − n2)/n1 is the�ber fractional index di�erence.
• Graded-index Fiber. In a multimode graded-index �ber of optimal (approximately parabolic)refractive index pro�le, the pulse width is given by
LB0 =c142
(15)
• Single-Mode Fiber. Assuming that pulse broadening in a single-mode �ber results frommaterial dispersion only (i.e., neglecting waveguide dispersion), then for a source oflinewidth σλ the width of the received pulse is given by (4), so that
LB0 =1
4|Dλ|σλ, (16)
where Dλ is the dispersion coe�cient of the �ber material.
The distance versus bit-rate relations for these dispersion-limited examples are plotted inFig. 18.
5 All together performance and conclusion
The attenuation-limited and dispersion-limited bit-rate-distance relations are combined in Fig.19 by superposing Figs. 17 and 18. These relations describe the performance of three gener-ations of optical �bers operating at λ0 = 0.87 µm (multi-mode step-index and graded-index),at 1.3 µm (single-mode), and at 1.55 µm (single-mode), respectively. In creating these LB0
curves, many simplifying assumptions and arbitrary choices have been made. The values ob-tained should therefore be regarded as only indications of the order of magnitude of the relativeperformance of the di�erent types of �bers.
Nevertheless, a number of important conclusions can be made:
• At low bit rates, the �ber link is generally attenuation limited; L drops with Bo logarith-mically. At high bit rates, the link is dispersion limited and L is inversely proportionalto B0 for optical pulses limited by the source linewidth and inversely proportional to B2
0
for transform-limited.
• For high data rate long-haul communication links, single-mode �bers are essential. Thechoice between the 1300-nm and the 1550-nm wavelengths is not obvious since, for con-ventional �bers, chromatic dispersion is smallest at 1300 nm while the attenuation issmallest at 1550 nm. This explains the cross-over of the LB0 lines at these wavelengths.
• By use of dispersion-shifted �bers (modern enhancement), it is possible to reduce theoverall chromatic dispersion coe�cient at 1550 nm, making operation at 1550 nm generallysuperior to operation at 1300 nm.
17

Figure 19: Maximum distance L versus bit rate B0 for four examples of �bers. This graph is obtained bysuperposing the graphs in Figs. 17 and 18. Each curve represents the maximum distance L of the link at eachbit rate B0 that satis�es both the attenuation and dispersion limits, i.e., guarantees the reception of the requiredpower and pulse width at the receiver. At low bit rates, the system is attenuation limited; L drops with B0
logarithmically. At high bit rates, the system is dispersion limited and L is inversely proportional to B0. [5]
In the end, we could not really answer the question �how fast can we go� or �is there a speedlimit�. There is much development and research in the �eld of optical communications andevery once in a while there is a new breakthrough because someone, for example, invented anew way of sending a signal to the �bre or a new type of �ber has been produced that containsmuch less impurities, etc. The system is complex and of course in the end it's the nature thatlimits us, we can't go faster than the light and probably we can't modulate and receive a signalfaster than with the frequency of light.
18

Bibliography
[1] http://www.wikipedia.org (1.4.2010).
[2] http://www.tpub.com/neets/tm/106-11.htm (1.4.2010)
[3] Harry J. R. Dutton, Understanding Optical. Communications(1998)
[4] http://communication.howstu�works.com/�ber-optic-communications (1.4.2010)
[5] Bahaa E. A. Saleh and Malvin Carl Teich, Fundamentals of Photonics, (John Wiley &Sons, 1991).
[6] http://www.rp-photonics.com (1.4.2010).
19