LIMITS OF CARBON DIOXIDE IN CAUSING GLOBAL …€”a world-wide controversy involving the political...
52
LIMITS OF CARBON DIOXIDE IN CAUSING GLOBAL WARMING Northern California Section American Nuclear Society Bryce Johnson May 23, 2012
Transcript of LIMITS OF CARBON DIOXIDE IN CAUSING GLOBAL …€”a world-wide controversy involving the political...
LIMITS OF CARBON DIOXIDE IN CAUSING GLOBAL WARMING
Northern California SectionAmerican Nuclear Society
Bryce JohnsonMay 23, 2012
9/27/2012 Bryce Johnson CO2 limits 2
History of the ControversyThe Intergovernment Panel on Climate Change (IPCC), Established 1988 by
the UN.
Charter: “Assess the scientific, technical and socio- economic information relative to understanding the risk of human-induced climate change.
Four assessment reports: 1990,1995, 2001 and 2007: with successively increasing claims of the validity of AGW.
Skeptics started early with organizations and publications.
Highly politicized, with sharp dividing line—as between left wing and right wing—a world-wide controversy involving the political leadership of most nations.
Implications for our economic and energy future cannot be underestimated
Major focus of the problem has been on human production of carbon dioxide.
9/27/2012 Bryce Johnson CO2 limits 3
FROM PREVIOUS ANS TALKS
Late 90’s: By LLNL speaker: “all arguments against AGW have been refuted”
Circa 2004: By the late Stephen Schneider, Stanford Nobel Laureate with Al Gore:
“preponderance of evidence supports AGW; proof beyond reasonable doubt not required”
2010: By second LLNL speaker:“all knowledgeable scientists support AGW”
9/27/2012 Bryce Johnson CO2 limits 4
This talk uses “conservative, engineering” Approach to counter the previous assertions
Conservative: Don’t overestimate supporting evidence or underestimate contravening evidence
Engineering: Use available, proven physics and mathematics tools to obtain useful, reliable answers
“Modtran” and “SpectralCalc” computer codes plus classical physics and mathematics are employed
9/27/2012 Bryce Johnson CO2 limits 5
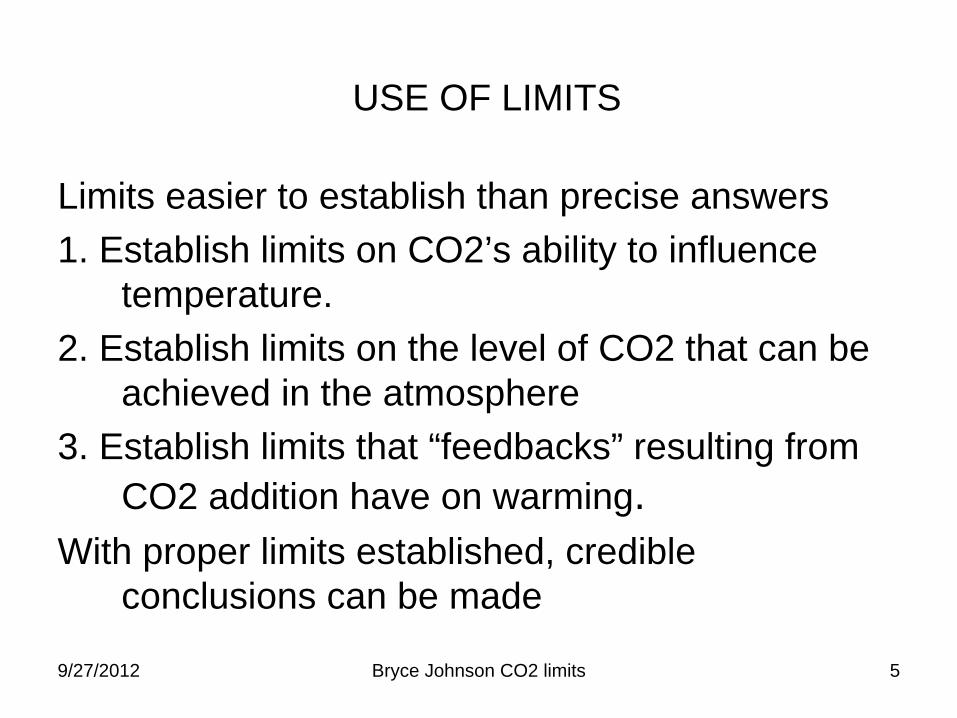
USE OF LIMITS
Limits easier to establish than precise answers1. Establish limits on CO2’s ability to influence
temperature.2. Establish limits on the level of CO2 that can be
achieved in the atmosphere3. Establish limits that “feedbacks” resulting from
CO2 addition have on warming.With proper limits established, credible
conclusions can be made
9/27/2012 Bryce Johnson CO2 limits 6
Nature of the Problem
Greenhouse gases absorb infrared radiation (IR) from the earth and thereby impede the escape of its heat, frequently compared to a blanket or an overcoat
The essence of AGW lies with the physics of the interaction of infrared (IR) radiation with the molecules of the atmosphere, with emphasis on CO2
9/27/2012 Bryce Johnson CO2 limits 7
INFRARED CHARACTERISTICS
Infrared = Heat
Molecules are heated by IR absorption and cooled by IR emission
There is no direct connection between IR absorption and subsequent IR emission.
After being heated by IR absorption, molecules can lose heat by any transfer mechanism including IR emission.
9/27/2012 Bryce Johnson CO2 limits 8
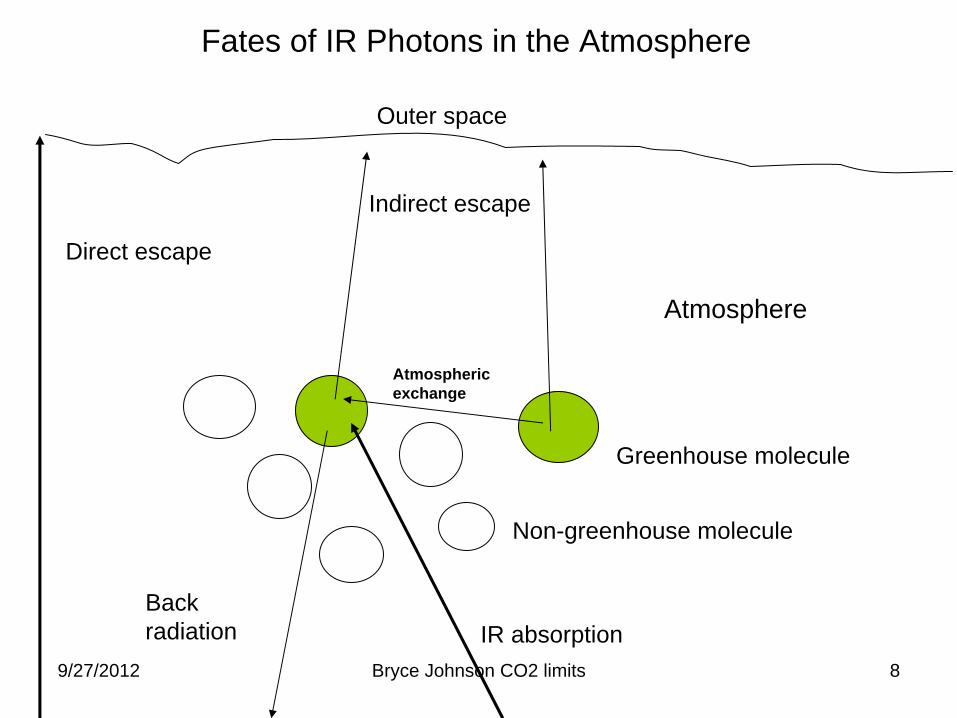
Outer space
Atmosphere
Direct escape
Indirect escape
Back radiation
Atmospheric exchange
IR absorption
Greenhouse molecule
Fates of IR Photons in the Atmosphere
Non-greenhouse molecule
9/27/2012 Bryce Johnson CO2 limits 9
What happens inside the atmosphere?
The atmosphere is a roiling mass of molecules undergoing all known mechanisms of heat transfer.
This study “trusts” that the authors of the “standard” IR transport codes know what they are doing about those mechanisms.
The CO2 effect is determined by the heat entering and the heat exiting the atmosphere and the effect that CO2 has on each. These are all calculable with standard codes and classical heat transfer mathematics, and can be measured (but with controversial accuracy).
9/27/2012 Bryce Johnson CO2 limits 10
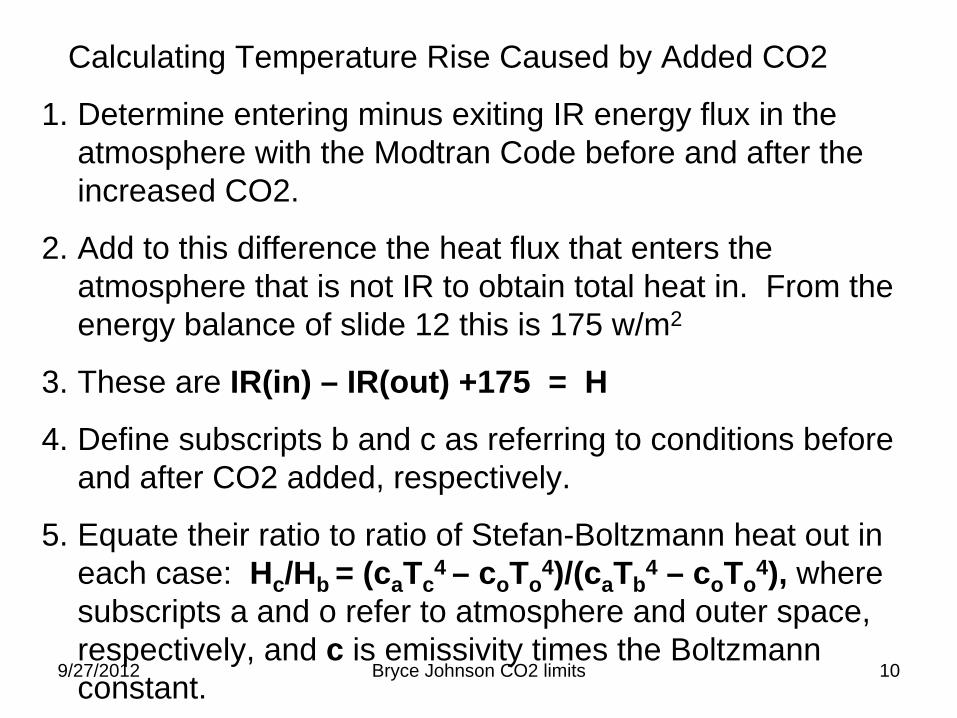
Calculating Temperature Rise Caused by Added CO2
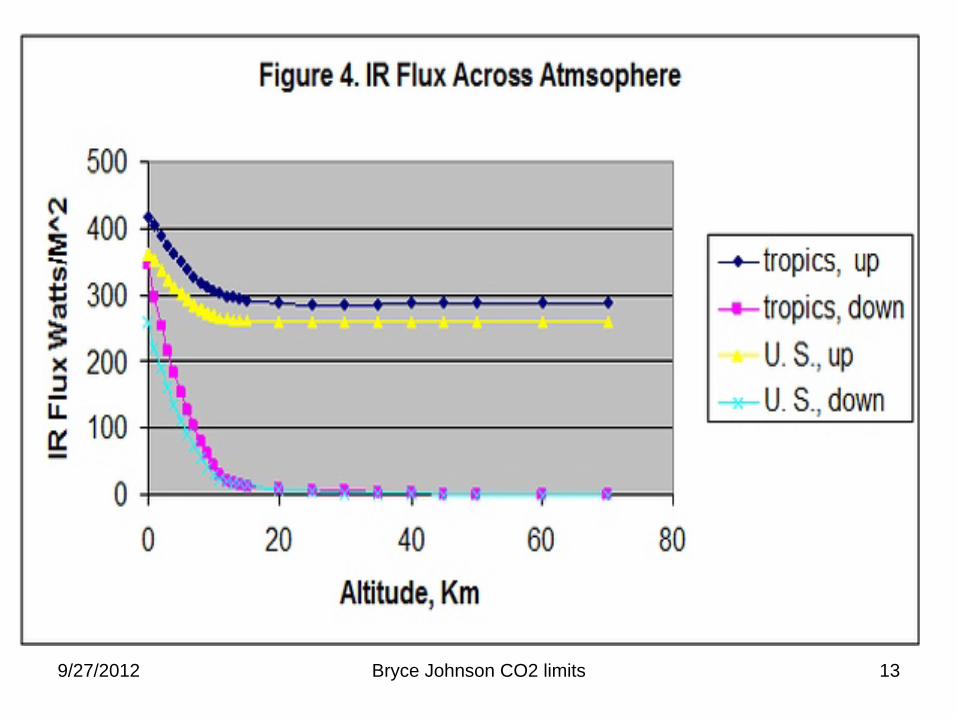
1. Determine entering minus exiting IR energy flux in the atmosphere with the Modtran Code before and after the increased CO2.
2. Add to this difference the heat flux that enters the atmosphere that is not IR to obtain total heat in. From the energy balance of slide 12 this is 175 w/m2
3. These are IR(in) – IR(out) +175 = H
4. Define subscripts b and c as referring to conditions before and after CO2 added, respectively.
5. Equate their ratio to ratio of Stefan-Boltzmann heat out in each case: Hc /Hb = (ca Tc
4 – co To4)/(ca Tb
4 – co To4), where
subscripts a and o refer to atmosphere and outer space, respectively, and c is emissivity times the Boltzmann constant.
9/27/2012 Bryce Johnson CO2 limits 11
Calculating temperature rise from CO2, continued
To4 is roughly a ten million times smaller than either
Taa 44 or Tor Tcc
44 so the second term in the parentheses terms on the right can be ignored to reduce the equation to this much simplified form
Tc = Tb (Hc /Hb )1/4,
and the temperature rise, T = Tc – Tb
9/27/2012 Bryce Johnson CO2 limits 12
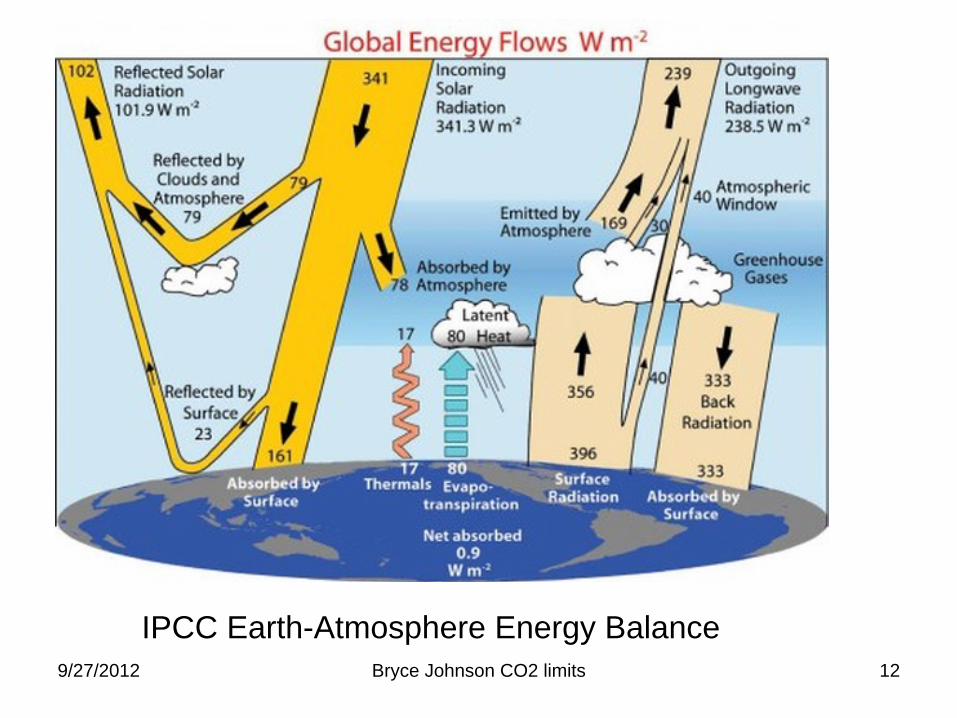
Figure 5. Energy Balance by IPCC (5)
IPCC Earth-Atmosphere Energy Balance
9/27/2012 Bryce Johnson CO2 limits 13
9/27/2012 Bryce Johnson CO2 limits 14
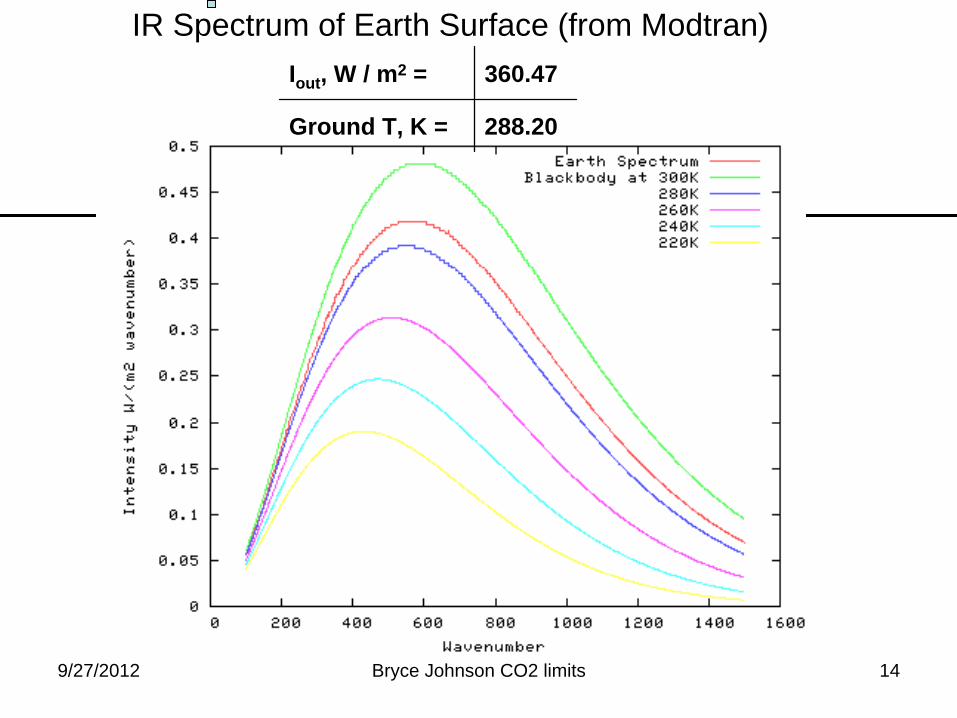
Iout , W / m2 = 360.47
Ground T, K = 288.20
IR Spectrum of Earth Surface (from Modtran)
9/27/2012 Bryce Johnson CO2 limits 15
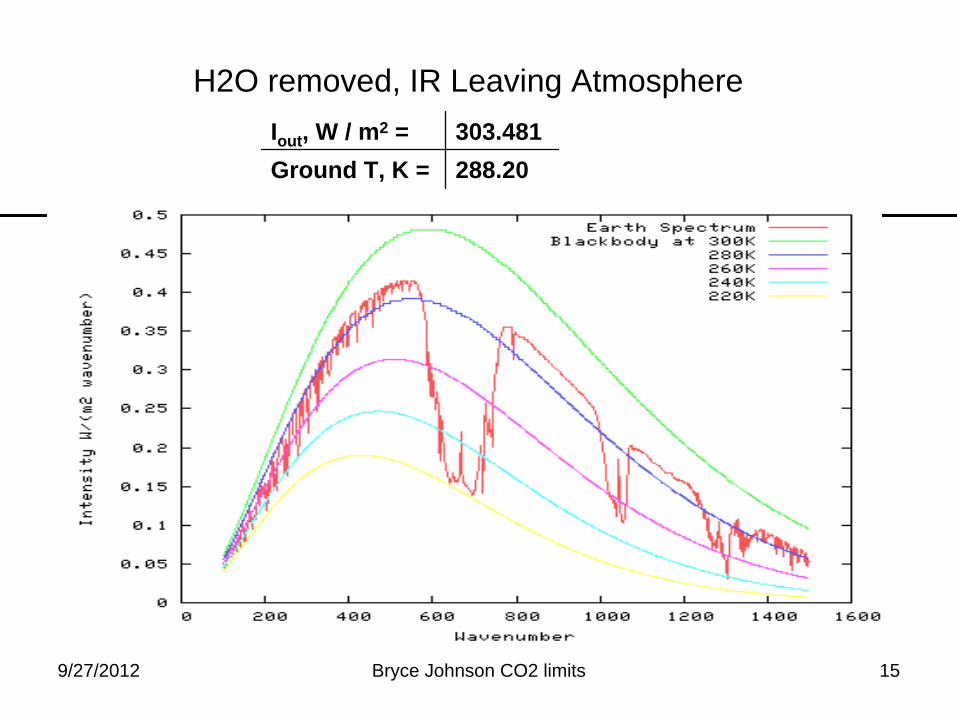
Iout , W / m2 = 303.481 Ground T, K = 288.20
H2O removed, IR Leaving Atmosphere

9/27/2012 Bryce Johnson CO2 limits 16
Iout , W / m2 = 286.242
Ground T, K = 288.20
CO2 removed, IR exiting atmosphere
9/27/2012 Bryce Johnson CO2 limits 17
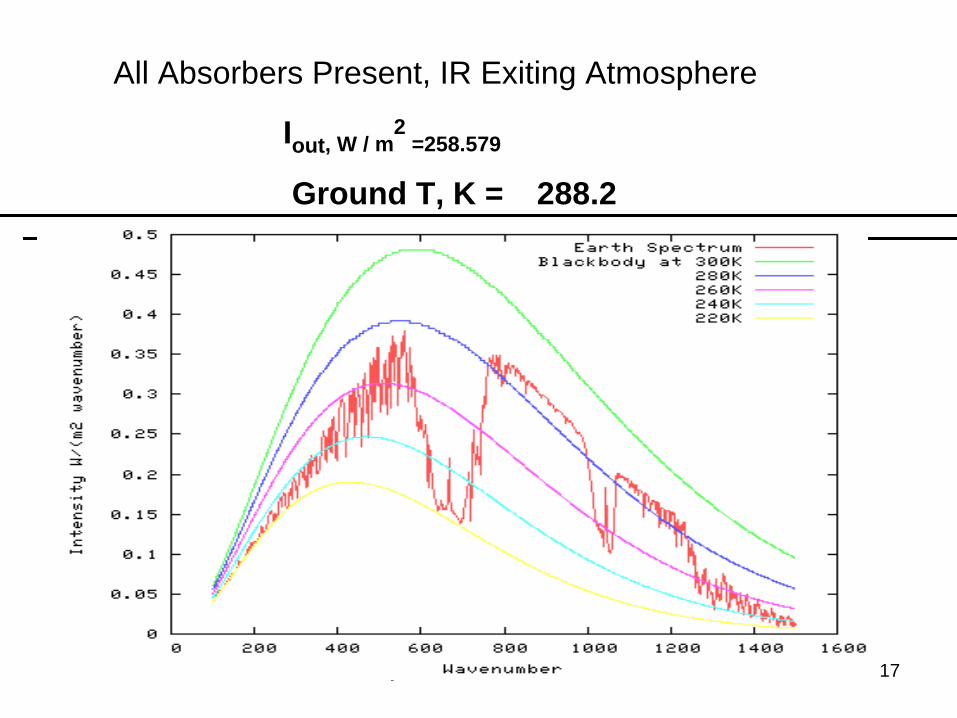
All Absorbers Present, IR Exiting Atmosphere
Iout, W / m2
=258.579
Ground T, K = 288.2
9/27/2012 Bryce Johnson CO2 limits 18
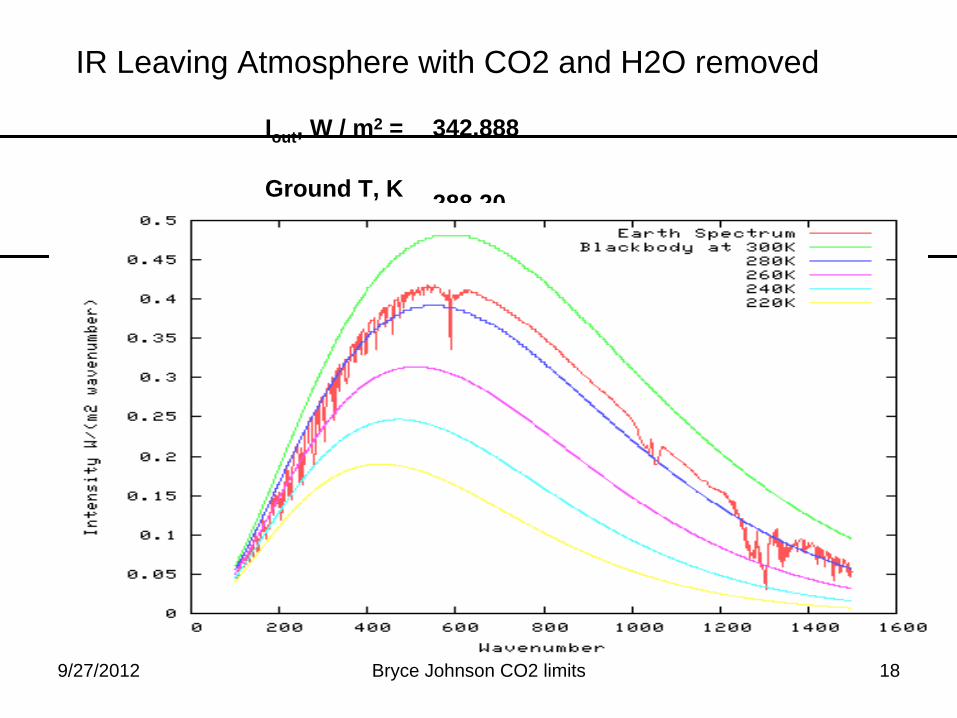
Iout , W / m2 = 342.888
Ground T, K = 288.20
IR Leaving Atmosphere with CO2 and H2O removed
9/27/2012 Bryce Johnson CO2 limits 19
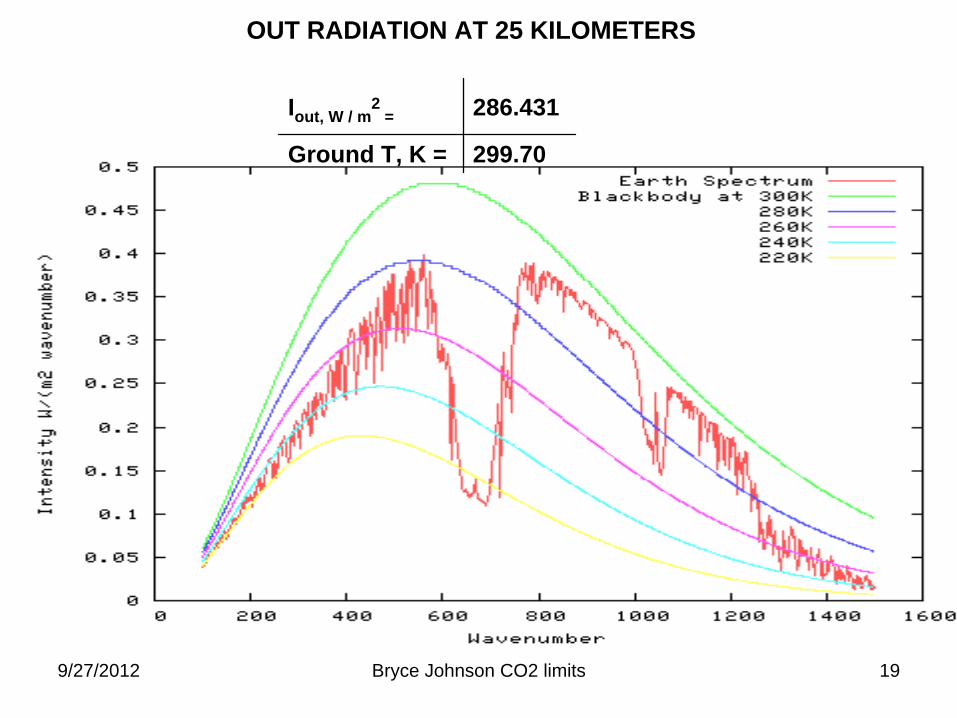
Iout, W / m2
= 286.431
Ground T, K = 299.70
OUT RADIATION AT 25 KILOMETERS
9/27/2012 Bryce Johnson CO2 limits 20
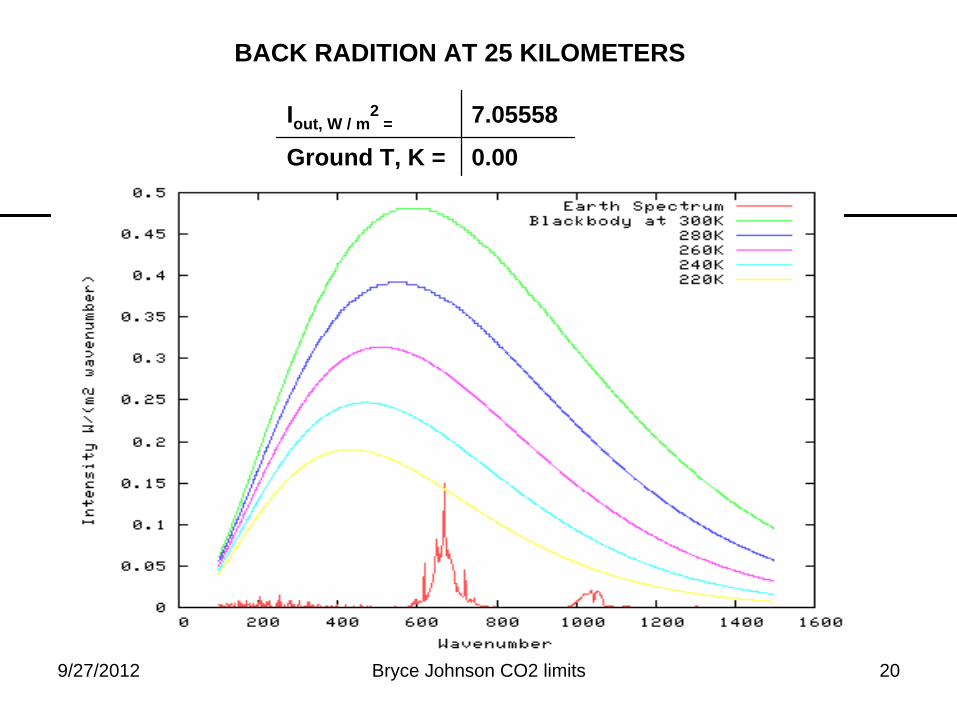
Iout, W / m2
= 7.05558
Ground T, K = 0.00
BACK RADITION AT 25 KILOMETERS
9/27/2012 Bryce Johnson CO2 limits 21
PRECEDING SLIDE DUPLICATES IR CROSS SECTION OF CO2. (same frequency distribution for emission and absorption)
CO2 IS ESSENTIALLY THE ONLY EMITTER AT THAT ALTITUDE.
VERY LOW ATMOSPHERIC DENSITY CAUSES LOW EMISSION.
SHARPLY PEAKED DISTRIBUTION ILLUSTRATES CO2’S HIGH SATURATION RATE WITH INCREASED DENSITY.
INCREASING CO2 APPROACHES UNIT ABSORPTION PROBABILITY MUCH FASTER THAN H20 WHICH HAS OVERALL BROAD DISTRIBUTION WITH NO HUGE PEAKS.
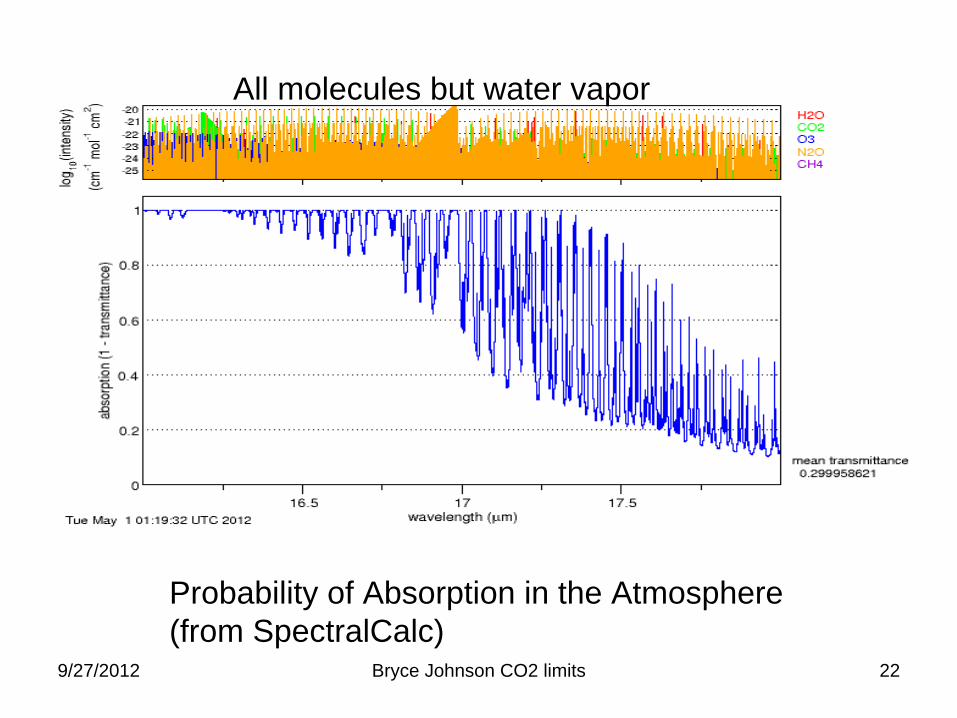
9/27/2012 Bryce Johnson CO2 limits 22
All molecules but water vapor
Probability of Absorption in the Atmosphere (from SpectralCalc)
9/27/2012 Bryce Johnson CO2 limits 23
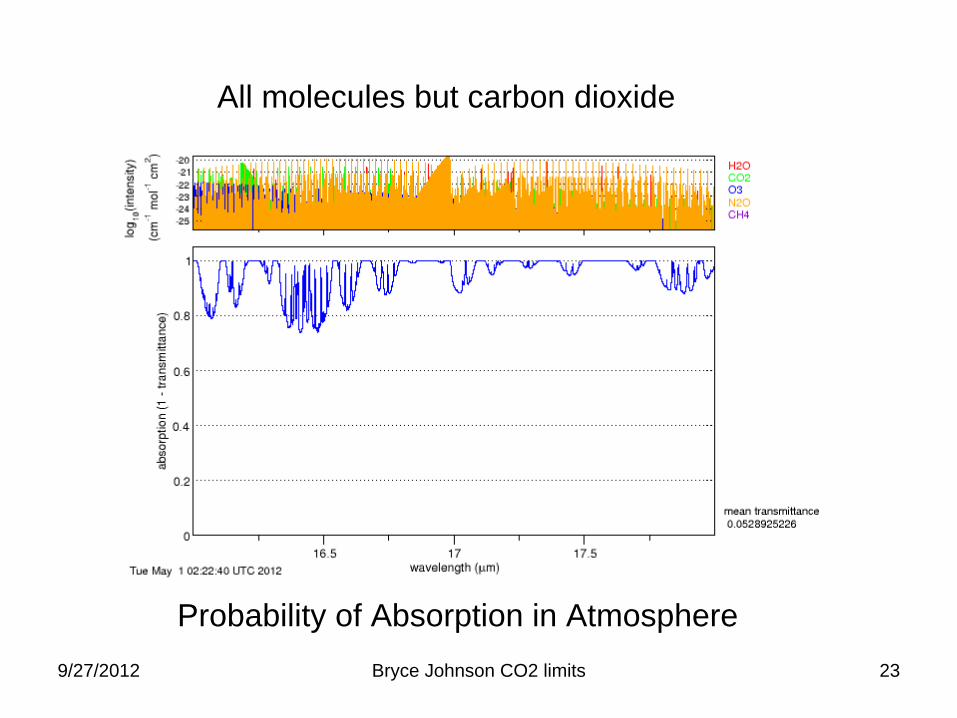
All molecules but carbon dioxide
Probability of Absorption in Atmosphere
9/27/2012 Bryce Johnson CO2 limits 24
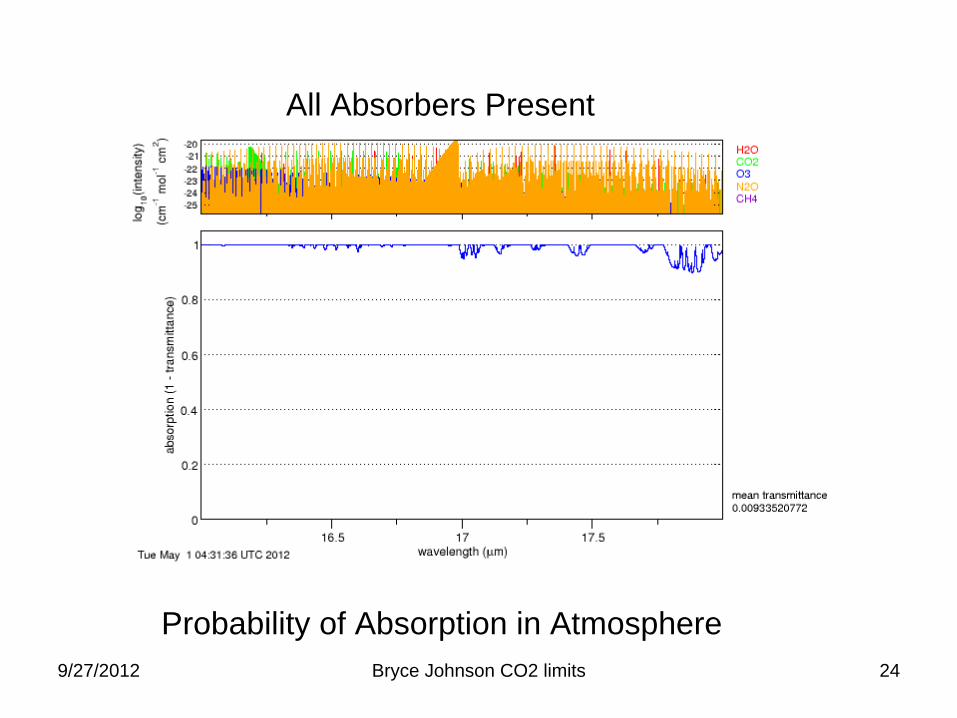
Probability of Absorption in Atmosphere
All Absorbers Present
9/27/2012 Bryce Johnson CO2 limits 25
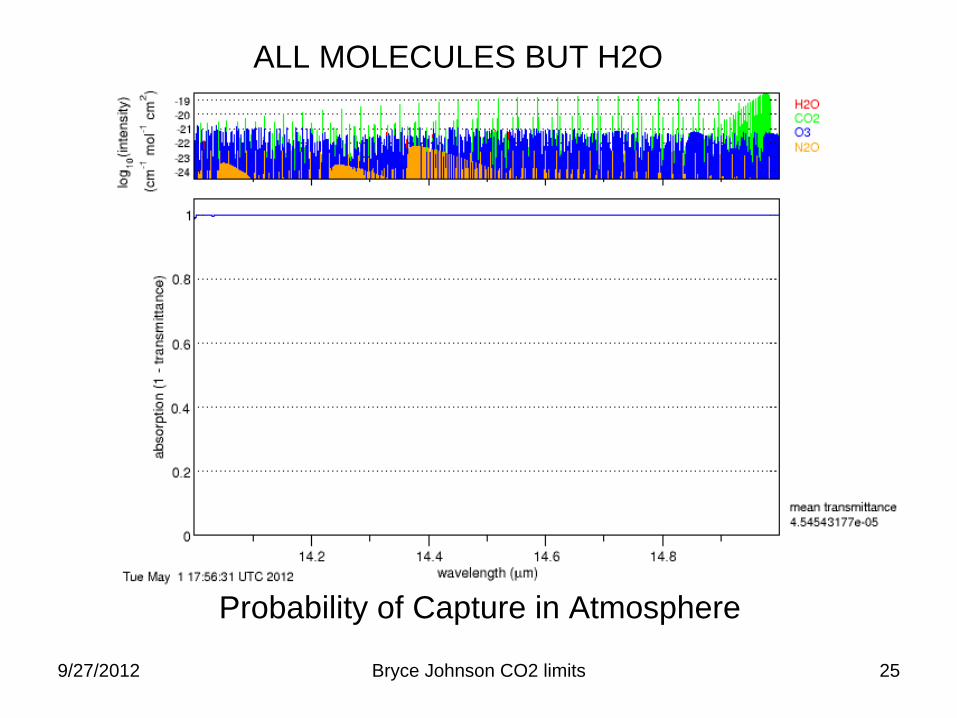
ALL MOLECULES BUT H2O
Probability of Capture in Atmosphere

9/27/2012 Bryce Johnson CO2 limits 26
Probability of Absorption In Atmosphere
ALL MOLECULES BUT CO2
9/27/2012 Bryce Johnson CO2 limits 27
MESSAGE OF PREVIOUS SLIDES IS THE SYNERGISM OF SATURATION
BOTH H2O AND C2O SATURATE (REACH A POINT WHERE CERTAIN FREQUENCIES HAVE HAD ALL THEIR ENERGY ABSORBED)
CO2 AND H20 AUGMENT EACH OTHER’S SATURATION WHEN THEY OVERLAP
THE TWO TOGETHER PRODUCE MORE SATURATION THAN THE SUM OF THE TWO IF THEY ACTED SEPARATELY (DID NOT OVERLAP)
9/27/2012 Bryce Johnson CO2 limits 28
Figure 1 (from Reference 1)
9/27/2012 Bryce Johnson CO2 limits 29
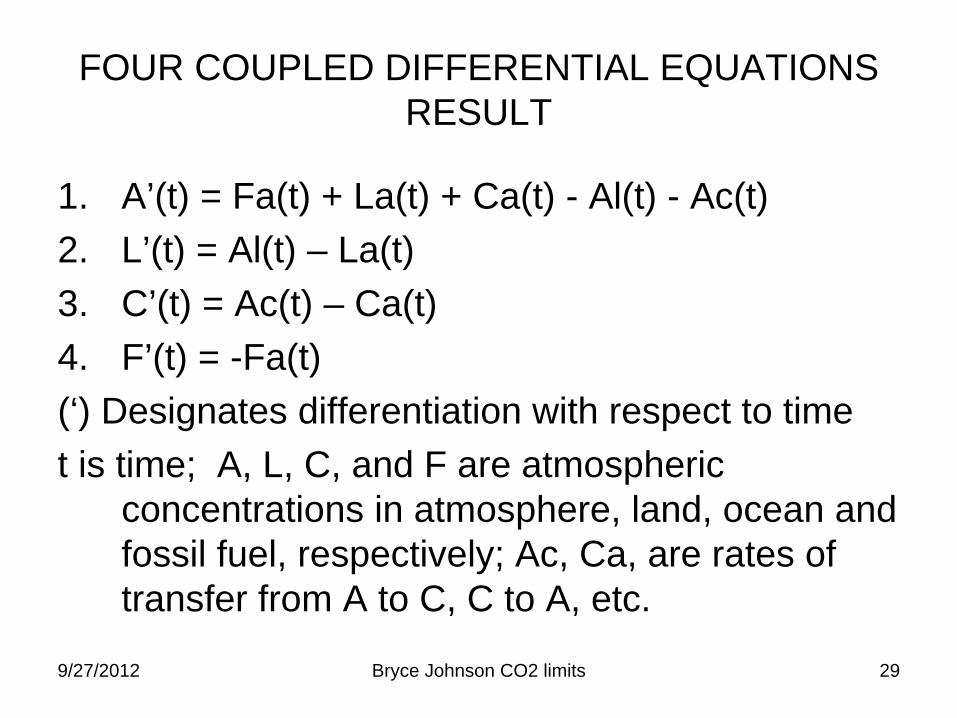
FOUR COUPLED DIFFERENTIAL EQUATIONS RESULT
1. A’(t) = Fa(t) + La(t) + Ca(t) - Al(t) - Ac(t)2. L’(t) = Al(t) – La(t)3. C’(t) = Ac(t) – Ca(t)4. F’(t) = -Fa(t)(‘) Designates differentiation with respect to timet is time; A, L, C, and F are atmospheric
concentrations in atmosphere, land, ocean and fossil fuel, respectively; Ac, Ca, are rates of transfer from A to C, C to A, etc.
9/27/2012 Bryce Johnson CO2 limits 30
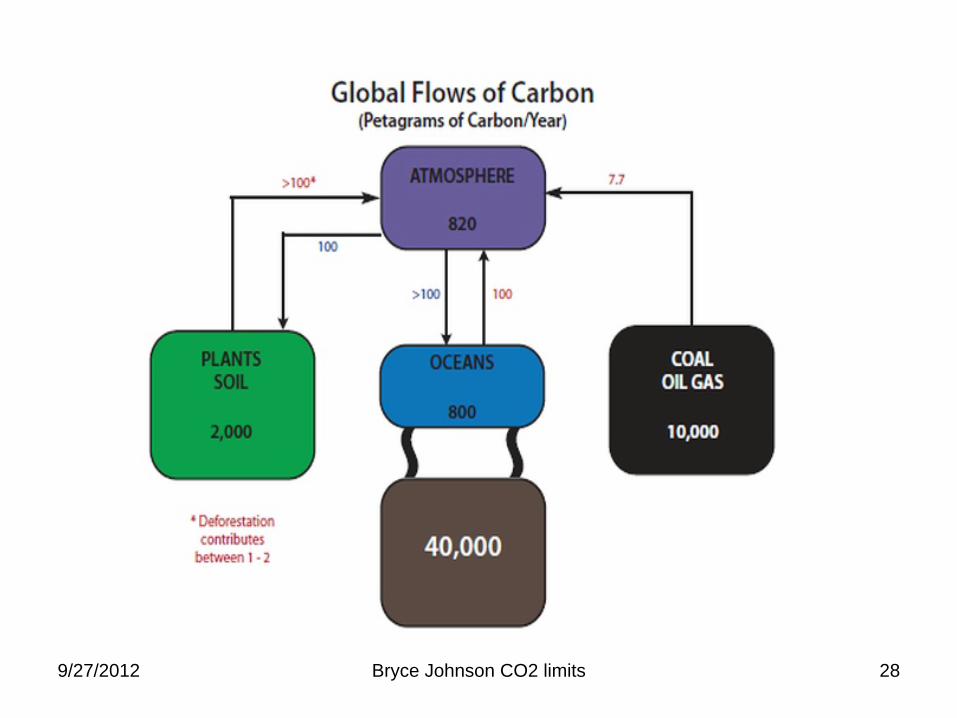
FROM VALUES SHOWN IN SLIDE 28, AND THE ASSUMPTION THAT EXPULSION RATE FROM EACH REGION IS PROPORTIONAL TO ITS CONCENTRATION (no physical justification for the assumption), THE FOLLOWING RATES APPLY :
Al = 0.122A(t); Ac = 0.122A(t); La =0.05L(t); Ca = 0.002451C(t)
Fa(t) IS ARBITARILY CHOSEN AS THE RATE AT WHICH FOSSIL FUEL DEPOSITS CARBON IN THE ATMOSPHERE AND IT IS INCLUDED WITH THE EQUATION FOR A.
THE EQUATIONS ARE INTEGRATED NUMERICALLY WITH ONE-YEAR TIME INCREMENTS AS ILLUSTRATED IN THE NEXT SLIDE
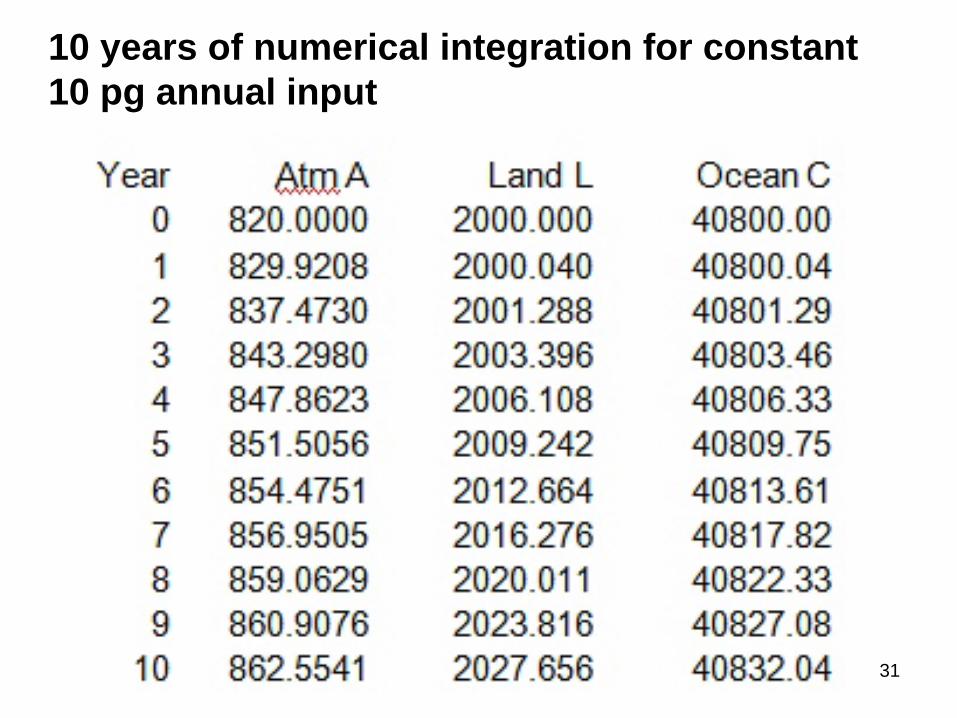
9/27/2012 Bryce Johnson CO2 limits 31
10 years of numerical integration for constant 10 pg annual input
9/27/2012 Bryce Johnson CO2 limits 32
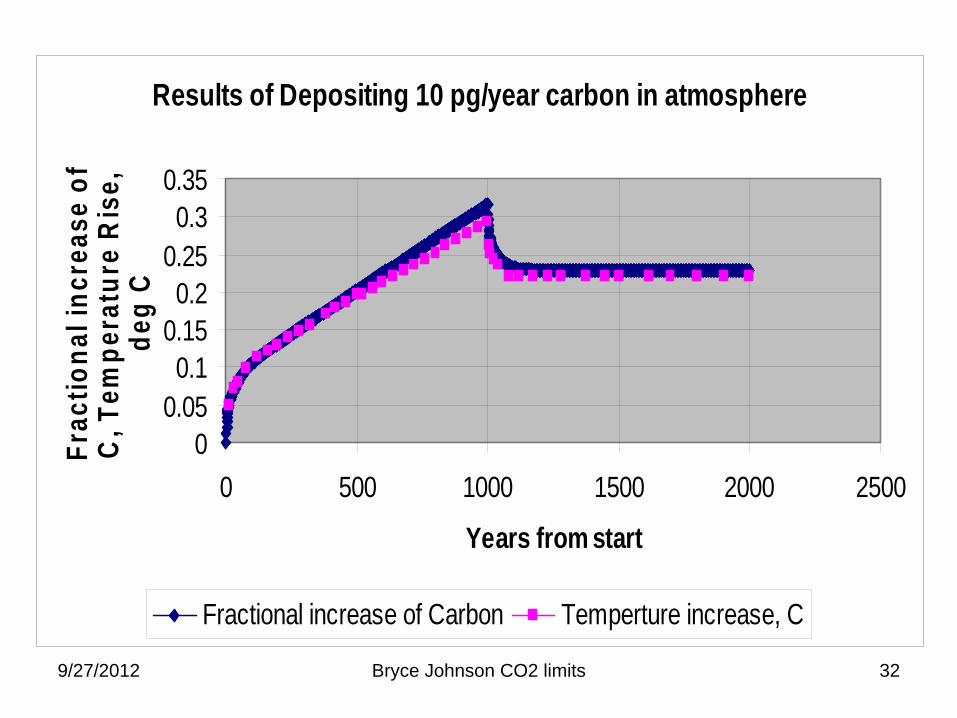
Results of Depositing 10 pg/year carbon in atmosphere
00.050.1
0.150.2
0.250.3
0.35
0 500 1000 1500 2000 2500
Years from start
Frac
tiona
l inc
reas
e of
C
, Tem
pera
ture
Ris
e,
deg
C
Fractional increase of Carbon Temperture increase, C
9/27/2012 Bryce Johnson CO2 limits 33
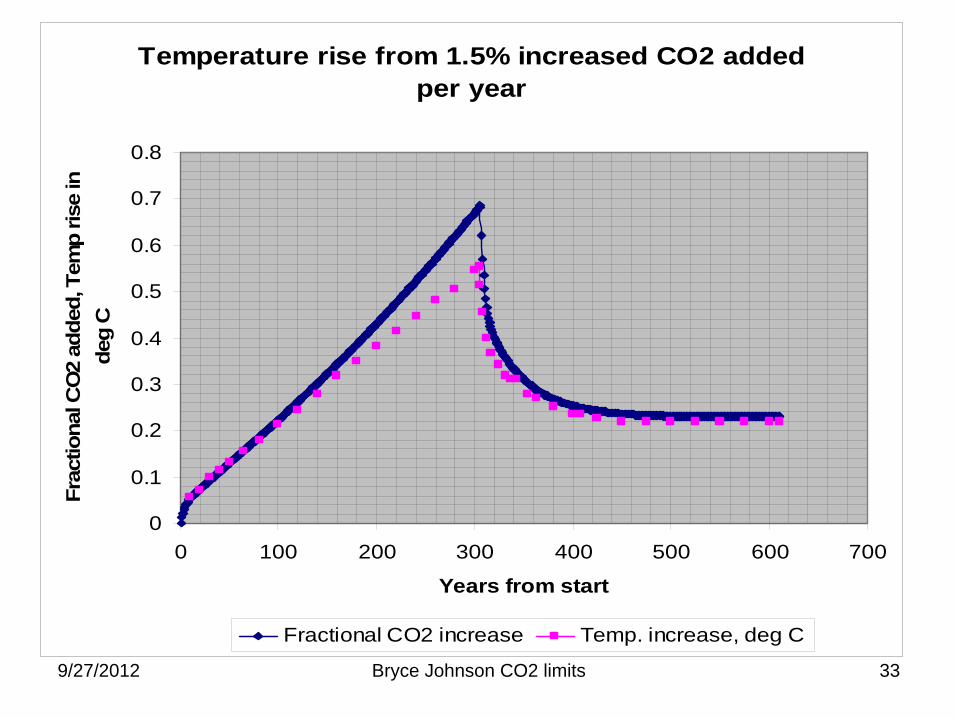
Temperature rise from 1.5% increased CO2 added per year
0
0.1
0.2
0.3
0.4
0.5
0.6
0.7
0.8
0 100 200 300 400 500 600 700
Years from start
Frac
tiona
l CO
2 ad
ded,
Tem
p ris
e in
de
g C
Fractional CO2 increase Temp. increase, deg C
9/27/2012 Bryce Johnson CO2 limits 34
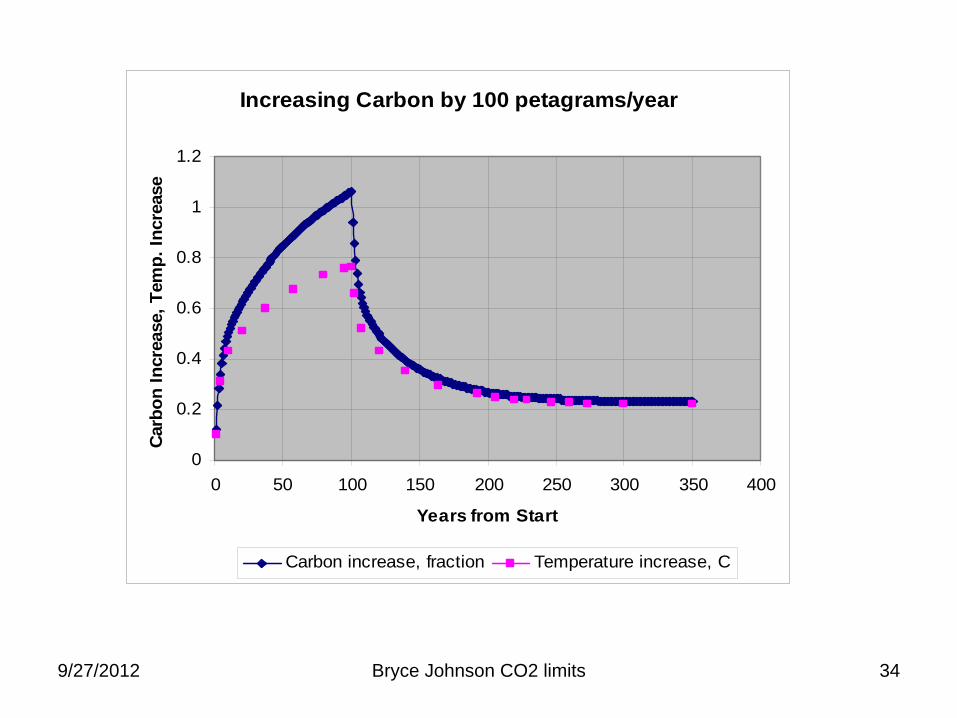
Increasing Carbon by 100 petagrams/year
0
0.2
0.4
0.6
0.8
1
1.2
0 50 100 150 200 250 300 350 400
Years from Start
Carb
on In
crea
se, T
emp.
Incr
ease
Carbon increase, fraction Temperature increase, C
9/27/2012 Bryce Johnson CO2 limits 35
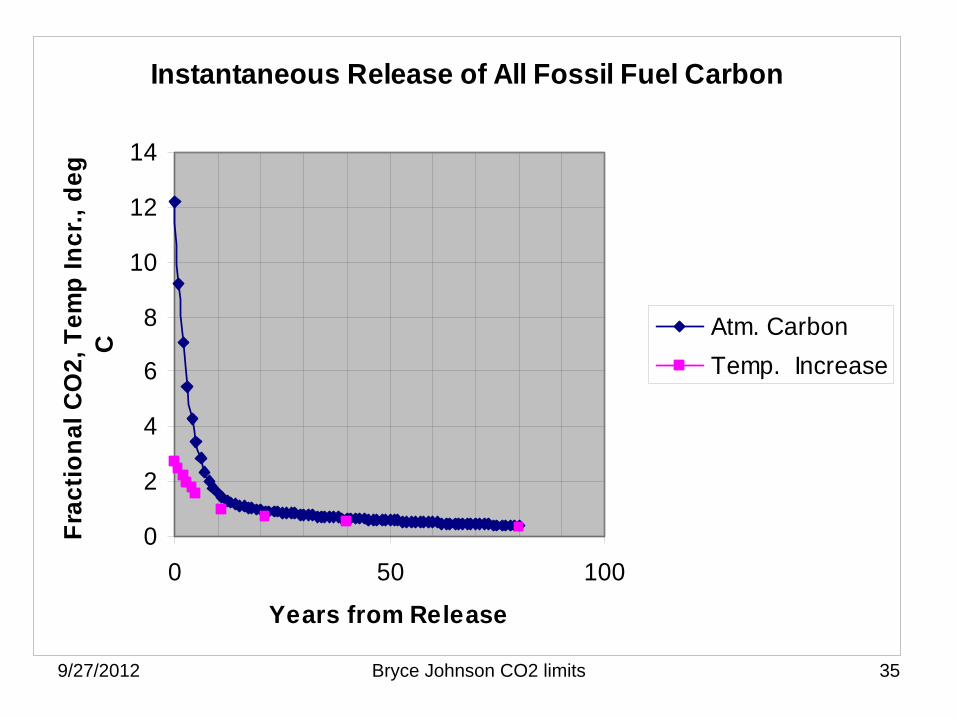
Instantaneous Release of All Fossil Fuel Carbon
0
2
4
6
8
10
12
14
0 50 100
Years from Release
Frac
tiona
l CO
2, T
emp
Incr
., de
g C
Atm. CarbonTemp. Increase

9/27/2012 Bryce Johnson CO2 limits 36
Instantaneous Release of World C in Fossil Fuel as CO2 in Atmosphere
0
2
4
6
8
10
12
14
0 50 100 150 200 250
Years from Release
Rat
io o
f Car
bon
Con
tent
; Te
mpe
ratu
re R
ise
Atmosphere CLand COcean CTemperature Rise
9/27/2012 Bryce Johnson CO2 limits 37
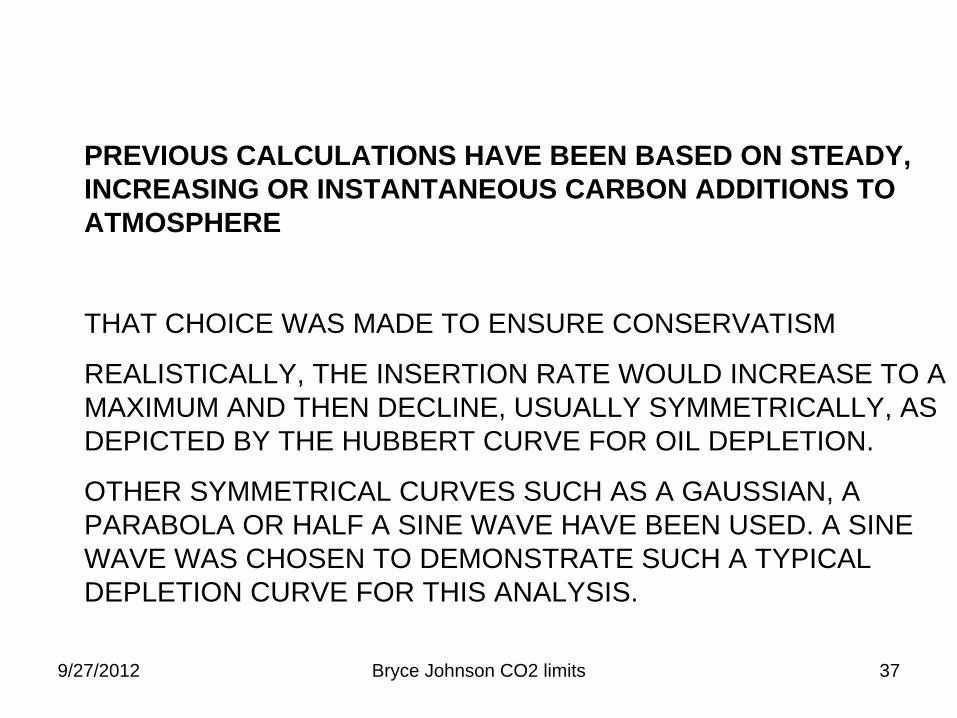
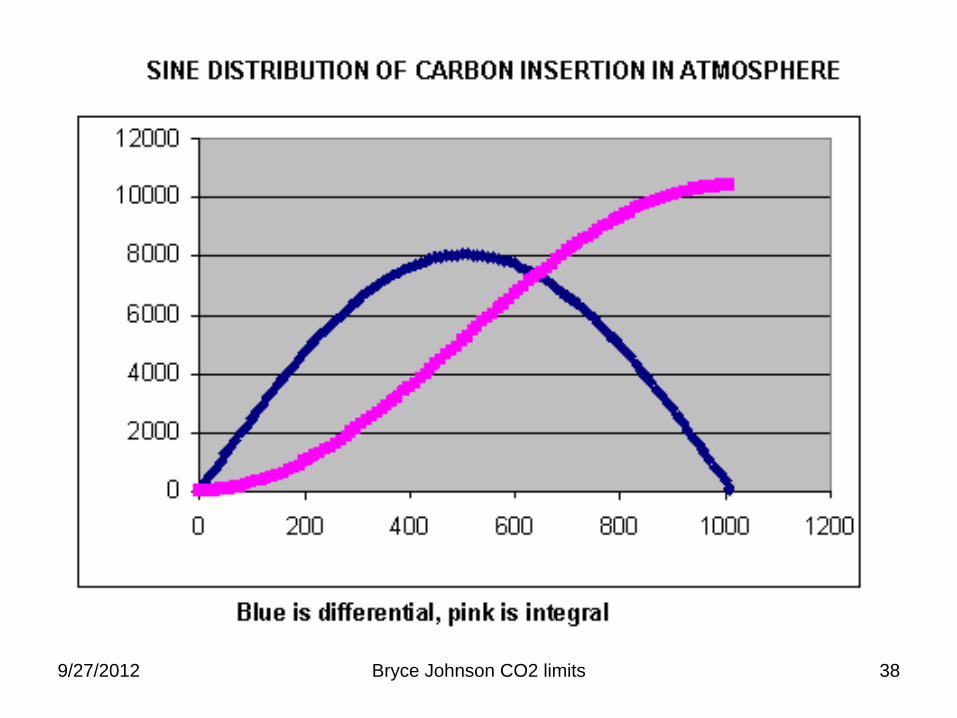
PREVIOUS CALCULATIONS HAVE BEEN BASED ON STEADY, INCREASING OR INSTANTANEOUS CARBON ADDITIONS TO ATMOSPHERE
THAT CHOICE WAS MADE TO ENSURE CONSERVATISM
REALISTICALLY, THE INSERTION RATE WOULD INCREASE TO A MAXIMUM AND THEN DECLINE, USUALLY SYMMETRICALLY, AS DEPICTED BY THE HUBBERT CURVE FOR OIL DEPLETION.
OTHER SYMMETRICAL CURVES SUCH AS A GAUSSIAN, A PARABOLA OR HALF A SINE WAVE HAVE BEEN USED. A SINE WAVE WAS CHOSEN TO DEMONSTRATE SUCH A TYPICAL DEPLETION CURVE FOR THIS ANALYSIS.
9/27/2012 Bryce Johnson CO2 limits 38
9/27/2012 Bryce Johnson CO2 limits 39
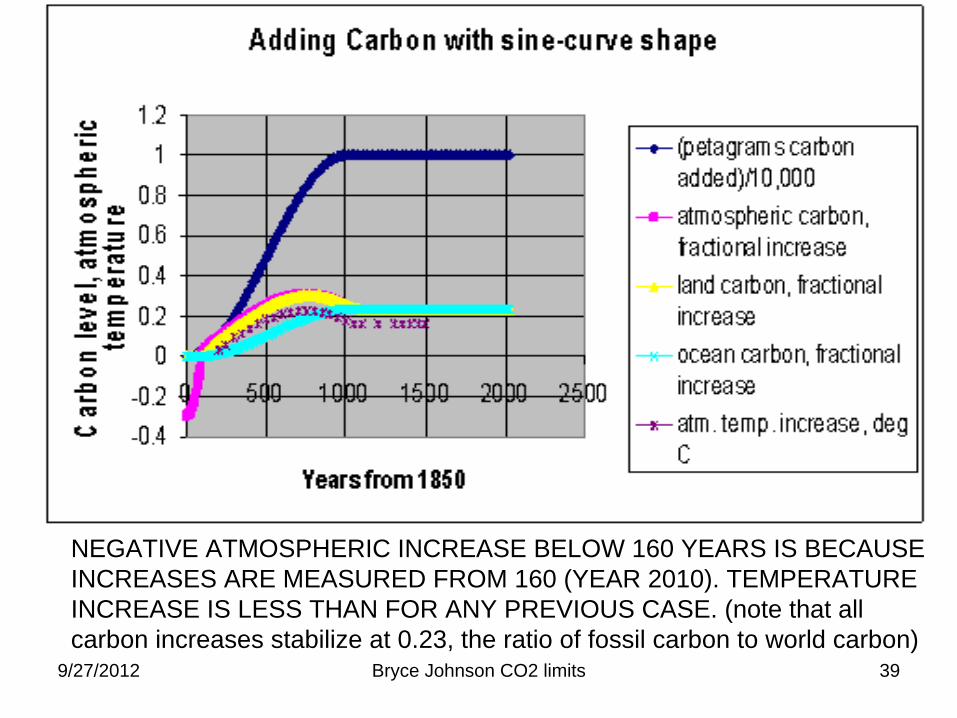
NEGATIVE ATMOSPHERIC INCREASE BELOW 160 YEARS IS BECAUSE INCREASES ARE MEASURED FROM 160 (YEAR 2010). TEMPERATURE INCREASE IS LESS THAN FOR ANY PREVIOUS CASE. (note that all carbon increases stabilize at 0.23, the ratio of fossil carbon to world carbon)
9/27/2012 Bryce Johnson CO2 limits 40

9/27/2012 Bryce Johnson CO2 limits 41
FEEDBACK DEMONSTRATION
In-atmosphere feedback depends on creation of added water vapor.
Following slides demonstrate combined effects of added CO2 and H2O with Modtran calculations plus heat transfer calculations to outer space.
Note that added atmospheric H20 either as vapor, aerosols (clouds) or rain diminishes temperature effect of CO2 in all cases.
As levels of both increase, fractional increases in H2O can reverse the temperature effect of similar increases in CO2.
Cloud cover, by itself, lowers world temperature
9/27/2012 Bryce Johnson CO2 limits 43
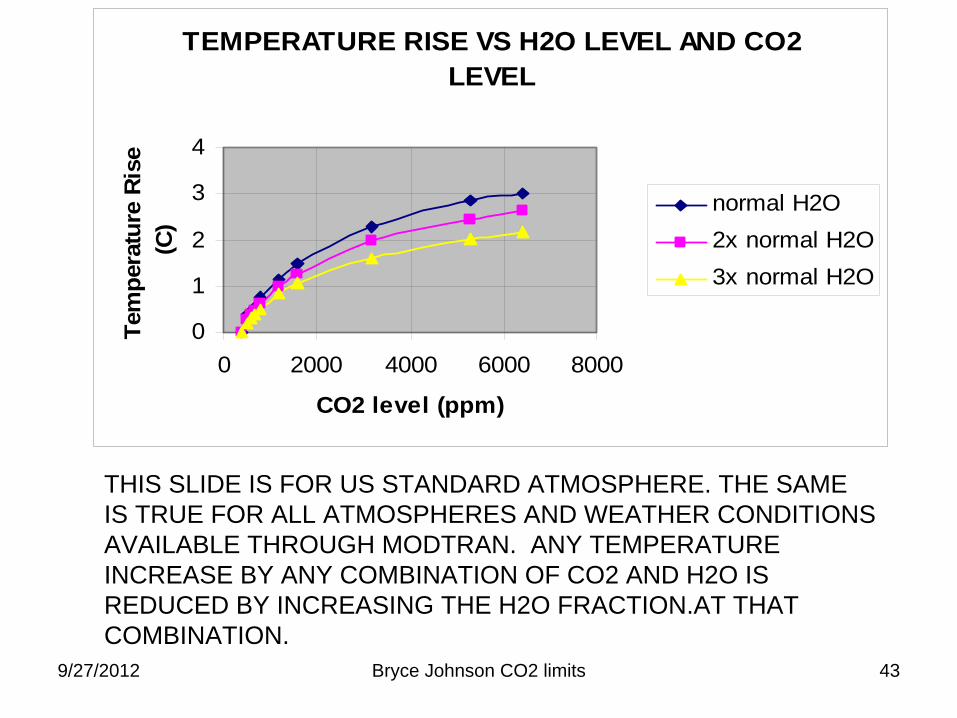
TEMPERATURE RISE VS H2O LEVEL AND CO2 LEVEL
0
1
2
3
4
0 2000 4000 6000 8000
CO2 level (ppm)
Tem
pera
ture
Ris
e (C
)normal H2O2x normal H2O3x normal H2O
THIS SLIDE IS FOR US STANDARD ATMOSPHERE. THE SAME IS TRUE FOR ALL ATMOSPHERES AND WEATHER CONDITIONS AVAILABLE THROUGH MODTRAN. ANY TEMPERATURE INCREASE BY ANY COMBINATION OF CO2 AND H2O IS REDUCED BY INCREASING THE H2O FRACTION.AT THAT COMBINATION.
9/27/2012 Bryce Johnson CO2 limits 44
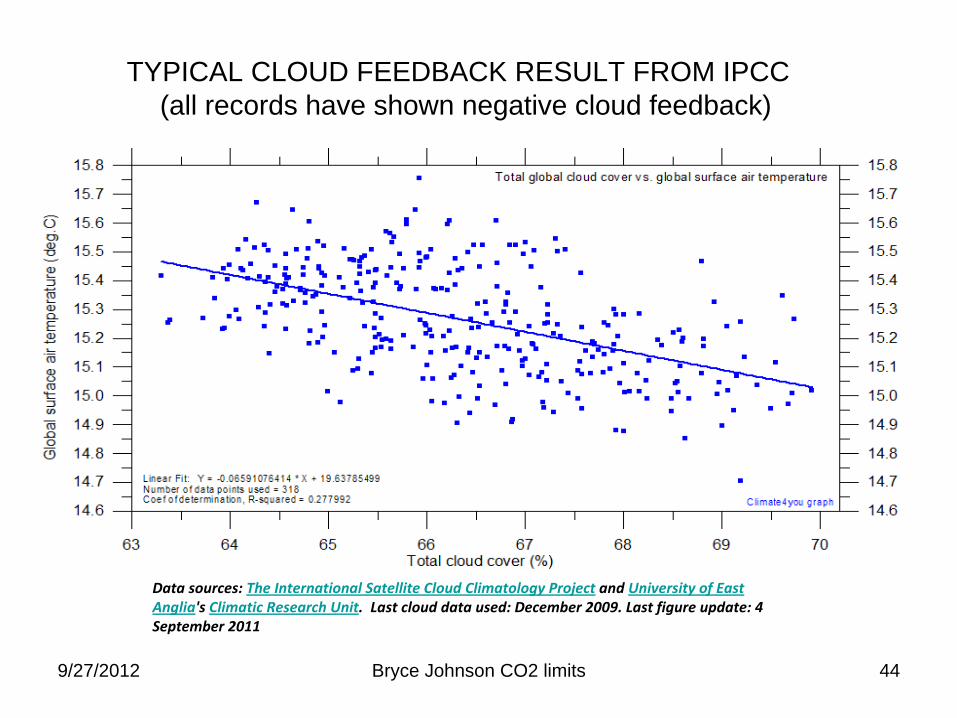
Data sources: The International Satellite Cloud Climatology Project
and University of East
Anglia's Climatic Research Unit. Last cloud data used: December 2009. Last figure update: 4
September 2011
TYPICAL CLOUD FEEDBACK RESULT FROM IPCC (all records have shown negative cloud feedback)
9/27/2012 Bryce Johnson CO2 limits 45
VARIABILITY OF WATER AND CO2 CONTENT
CO2 WELL KNOWN, WATER NOT WELL KNOWN
NO RELIABLE DATA AVAILABLE ON WIDE-AREA GEOGRAPHICAL OR TEMPORAL VARIATION OF WATER DUE TO RAPID CHANGES IN BOTH—GREATEST UNCERTAINTY IN THIS ANALYSIS...
USE DATA AVAILABLE FROM PREVIOUS SLIDES TO INFER VARIATION
WATER CAN VARY AS MUCH AS A FACTOR OF 3 IN A MATTER OF HOURS WITH A REPETITION RATE OF SUCH VARIATION OF SEVERAL TIMES PER YEAR
CO2 REQUIRES MANY HUNDREDS OF YEARS TO ACHIEVE A FACTOR OF 2 INCREASE
9/27/2012 Bryce Johnson CO2 limits 46
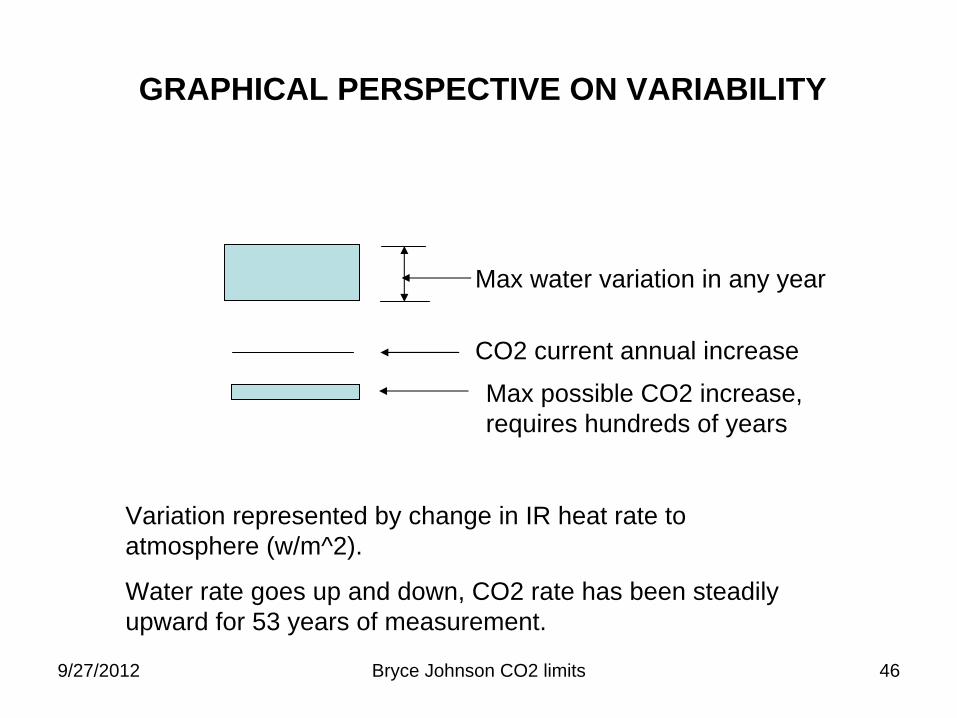
GRAPHICAL PERSPECTIVE ON VARIABILITY
Max water variation in any year
CO2 current annual increase
Max possible CO2 increase, requires hundreds of years
Variation represented by change in IR heat rate to atmosphere (w/m^2).
Water rate goes up and down, CO2 rate has been steadily upward for 53 years of measurement.
9/27/2012 Bryce Johnson CO2 limits 47
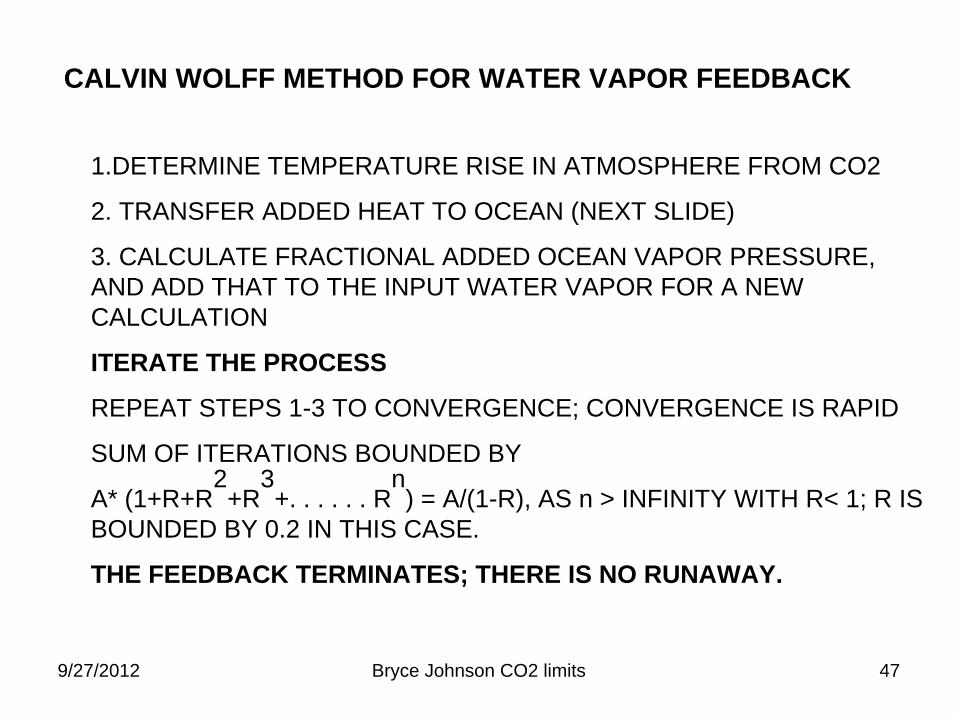
CALVIN WOLFF METHOD FOR WATER VAPOR FEEDBACK
1.DETERMINE TEMPERATURE RISE IN ATMOSPHERE FROM CO2
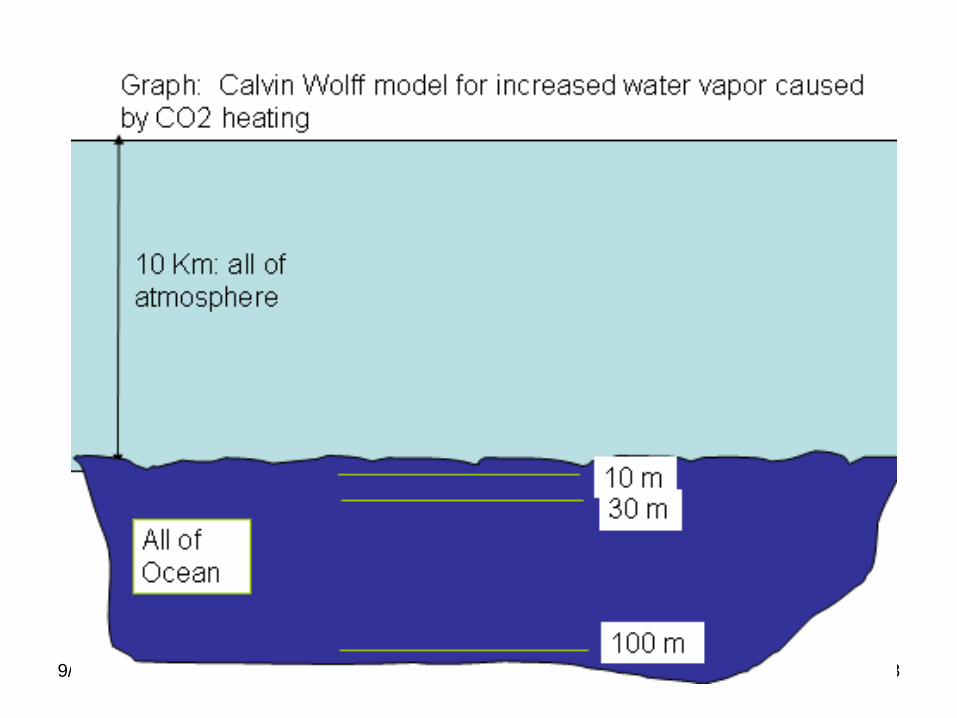
2. TRANSFER ADDED HEAT TO OCEAN (NEXT SLIDE)
3. CALCULATE FRACTIONAL ADDED OCEAN VAPOR PRESSURE, AND ADD THAT TO THE INPUT WATER VAPOR FOR A NEW CALCULATION
ITERATE THE PROCESS
REPEAT STEPS 1-3 TO CONVERGENCE; CONVERGENCE IS RAPID
SUM OF ITERATIONS BOUNDED BY
A* (1+R+R2+R
3+. . . . . . R
n) = A/(1-R), AS n > INFINITY WITH R< 1; R IS
BOUNDED BY 0.2 IN THIS CASE.
THE FEEDBACK TERMINATES; THERE IS NO RUNAWAY.
9/27/2012 Bryce Johnson CO2 limits 48
9/27/2012 Bryce Johnson CO2 limits 49
CONSERVATISM IN FEEDBACK CALCULATION
ALL HEAT TO ATMOSPHERE FROM CO2 IS ADDED TO OCEAN TO PRODUCE MORE VAPOR
DEPTH OF OCEAN INTERACTION IS CHOSEN TO MAXIMIZE INCREASE IN VAPOR PRESSURE OF OCEAN
EVAPORATIVE COOLING (PERSPIRATION) IS IGNORED
CLOUD FORMATION (A KNOWN COOLING MECHANISM) IS IGNORED

9/27/2012 Bryce Johnson CO2 limits 50

9/27/2012 Bryce Johnson CO2 limits 51
Predicted temperature rise much less than IPCC claimsRise above 3 C is impossibleRise above 0.5 C is very unlikelyMost likely rise < 0.3 CTime to reach maximum measured in centuriesMaximum temperature is not sustained (it drops)Evidence shows that feedback from CO2 induced water
vapor is strongly negativeClaimed “runaway” temperature rise is not possible.
SUMMARY OF FINDINGS
9/27/2012 Bryce Johnson CO2 limits 52
CONCLUSIONS
EVIDENCE TO SUPPORT SIGNIFICANT EARTH WARMING FROM ADDED CO2 IS LACKING
PROPOSED EFFORTS TO REDUCE CO2 ARE NOT JUSTIFIED