
LIMITING FACTORS IN PHOTOSYNTHESIS: LIGHT AND CARBON …
15
LIMITING FACTORS IN PHOTOSYNTHESIS: LIGHT AND CARBON DIOXIDE BY EMIL L. SMITH (From the Laboraiory of Biophysics, Columbia University, New York) (Acceptedfor publication, May 11, 1938) I INTRODUCTION It was F. F. Blackman (1905) who first recognized that in photo- synthesis where the "process is conditioned as to its rapidity by a number of separate factors, the rate of the process is limited by the pace of the 'slowest' factor". 1 In terms of this idea it was possible to identify two processes in photosynthesis, one, a photochemical reaction, and the other, a temperature-sensitive (Blackman) reaction (Warburg, 1919, 1920; Emerson and Arnold, 1932), both involving chlorophyll in a cycle. Using this cycle as a first approximation, kinetic descriptions have been developed for some of the properties of photosynthesis (e.g., Baly, 1935; Burk and Lineweaver, 1935; Smith, 1937). However, no complete description, either experimental or theo- retical, has yet been given of the interrelationships of the different factors which may limit the photosynthesis rate. The present paper deals with light intensity and CO2 concentration as limiting factors. We intend first, to show that this relationship may be derived from the equations which we have used to describe other properties of photosynthesis; and second, to present a series of measurements which have been made to test the validity of these ideas. II Theoretical We have shown (Smith, 1937) that the measurements of photo- synthesis rate (p) as a function of light intensity (f) or of COs con- 1 Full accounts of the controversy over Blackman's ideas are given by both Stiles (1925) and Spoehr (1926) in their monographs. 21 The Journal of General Physiology Downloaded from http://rupress.org/jgp/article-pdf/22/1/21/1238890/21.pdf by guest on 10 February 2022
Transcript of LIMITING FACTORS IN PHOTOSYNTHESIS: LIGHT AND CARBON …

LIMITING FACTORS IN PHOTOSYNTHESIS: LIGHT AND CARBON DIOXIDE
BY EMIL L. SMITH
(From the Laboraiory of Biophysics, Columbia University, New York)
(Accepted for publication, May 11, 1938)
I
INTRODUCTION
It was F. F. Blackman (1905) who first recognized that in photo- synthesis where the "process is conditioned as to its rapidity by a number of separate factors, the rate of the process is limited by the pace of the 'slowest' factor". 1 In terms of this idea it was possible to identify two processes in photosynthesis, one, a photochemical reaction, and the other, a temperature-sensitive (Blackman) reaction (Warburg, 1919, 1920; Emerson and Arnold, 1932), both involving chlorophyll in a cycle. Using this cycle as a first approximation, kinetic descriptions have been developed for some of the properties of photosynthesis (e.g., Baly, 1935; Burk and Lineweaver, 1935; Smith, 1937). However, no complete description, either experimental or theo- retical, has yet been given of the interrelationships of the different factors which may limit the photosynthesis rate.
The present paper deals with light intensity and CO2 concentration as limiting factors. We intend first, to show that this relationship may be derived from the equations which we have used to describe other properties of photosynthesis; and second, to present a series of measurements which have been made to test the validity of these ideas.
I I
Theoretical
We have shown (Smith, 1937) that the measurements of photo- synthesis rate (p) as a function of light intensity (f) or of COs con-
1 Full accounts of the controversy over Blackman's ideas are given by both Stiles (1925) and Spoehr (1926) in their monographs.
21
The Journal of General Physiology
Dow
nloaded from http://rupress.org/jgp/article-pdf/22/1/21/1238890/21.pdf by guest on 10 February 2022

22 LIMITING FACTORS IN PHOTOSYNTHESIS
centration at the stationary state can be described by the expres- sion:
p = ktI(a ~ -- x=) 11' = k2[CO2]x (1)
where a may be regarded as representing the total concentration of chlorophyll, and x the amount of chlorophyll activated by light. The terms containing I and [C02], describe the velocities of the light and dark processes. If x is eliminated and equation (1) is solved for p as a function of I at constant [COs], or as a function of [COs] at con- stant I, we obtain equations which describe accurately the available data. In logarithmic form, these equations are:
log p .= log p.,, -1/21og ( l + T~zi2 ) (2)
and
log P = log Pmb -- 1/2 log (1 + K = ~ ) (3)
where the maximum photosynthesis rates, Pm~ = ks[CO2]a and p,,~ = klla; K1 = kl/ks[COs] and Ks = ks/k~_r. If log p is plotted against log / (or log [COs]), the shape of the curve obtained is independent of the constants K and pro.
This curve is linear at low intensities, gradually curving to a maxi- mum photosynthesis rate at high intensities. This maximum varies with the COs concentration. A precise way of determining the limit- ing conditions is to secure a family of curves relating photosynthesis and intensity at different COs concentrations and from them to find the relationship between the intensity and the CO2 concentration required to produce a definite photosynthesis rate. A family of COs- photosynthesis curves at different intensities can be treated similarly. If equation (1) has more than acl hoc value, it should be possible to predict from it the nature of the relationship to be expected.
Starting with equation (1), x may be eliminated by substituting p/ks[COs]. The expression is then solved for [COs] as a function of / when p is constant. This yields in logarithmic form
log A,[CO=] = -- 1/2 log (1 -- A-~/~) (4)
Dow
nloaded from http://rupress.org/jgp/article-pdf/22/1/21/1238890/21.pdf by guest on 10 February 2022

E. L. SMITH 23
where A1 = kla/p and A2 = k,a/p. Equation (4) may be plotted as log [CO,] against log I giving a curve whose shape is independent of the constants A1 and A, which define the asymptotes. Reversing the position of [ and [CO~] in the equation yields the same function, so that either variable can be considered as dependent or independent.
Equations similar to (4) but having somewhat different shapes may be obtained by changing the exponents in equation (1). Where the terms for the light and dark processes are those of a simple first order nature, as in
p = k l I (a -- x) = k2[CO2]x (5)
solving at constant p yields
log As[COs] =- log (1 - ~ - 1 ) (6)
Where the exponents are second order, as in
p ffi k l I (a -- x)* ffi k,[CO~]x* (7)
solving as before, gives
( ' ) log At[CO2] = - 2 log 1 A~l'~.ll12 (8)
The properties of equations (6) and (8) are similar to those of (4) and can be treated in the same way. The curves obtained from the three equations are drawn for comparison in Fig. 1. In addition to these three curves, many others of different curvature may be obtained by changing the exponents for the light and dark processes. Thus, all curves obtained on the basis of a two process cycle are in agreement with the idea of limiting factors; the form of the curve depends on the nature of the functions which describe the light and dark reactions.
The log I and log [CO~] asymptotes represent the minima necessary to produce a definite photosynthesis value. When either of these two variables is greater than the necessary minimum, the magnitude of the other factor can be reduced accordingly, until finally its mini- mum is reached. Since the rate of curvature depends on the kinetic properties of the light and dark processes, information on this point can be obtained from the data. I t should be emphasized that such data present information somewhat different from that given by an
Dow
nloaded from http://rupress.org/jgp/article-pdf/22/1/21/1238890/21.pdf by guest on 10 February 2022

24 LIMITING FACTORS IN PHOTOSYNTHESIS
investigation of the effect of a single variable. For the effect of light intensity (or [CO2]) on photosynthesis, equations (1) and (4) give curves which have the same slope at low intensities. The two equa- tions differ only in their rate of curvature at high photosynthesis
2
z
0
I ' /
\ d
Z
FIG. 1. The relation between light intensity and COs concentration necessary for a constant amount of photosynthesis. Curves A, B, and C represent equations (4), (6), and (8). The three curves are drawn to asymptotes 0.25 log units apart.
values as they approach the maximum rate. By using the data of COs concentration versus light intensity, the kinetics of the process can be independently evaluated at all measured values of the photo- synthesis rate.
I I I
RESULTS
In order to test the theoretical curves developed in section II, it is necessary to have families of curves for photosynthesis at different COs
Dow
nloaded from http://rupress.org/jgp/article-pdf/22/1/21/1238890/21.pdf by guest on 10 February 2022
E. L. SM'~TH 25
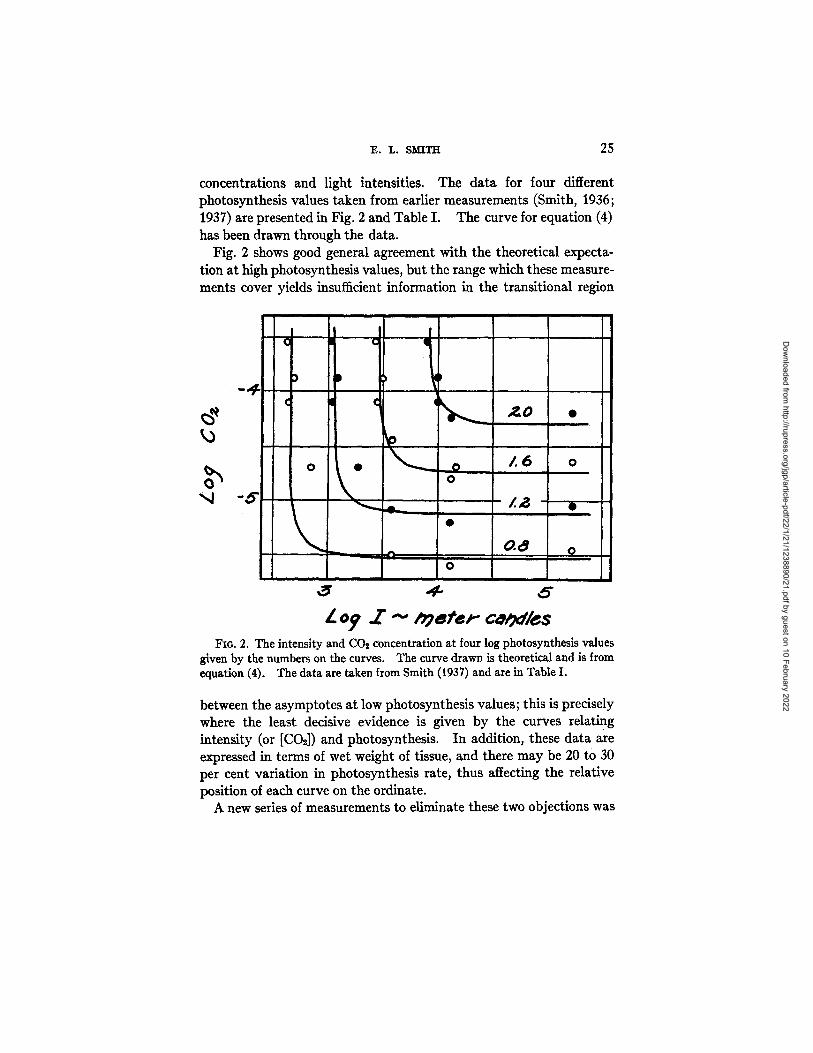
concentrations and light intensifies. The data for four different photosynthesis values taken from earlier measurements (Smith, 1935; 1937) are presented in Fig. 2 and Table I. The curve for equation (4) has been drawn through the data.
Fig. 2 shows good general agreement with the theoretical expecta- tion at high photosynthesis values, but the range which these measure- ments cover yields insufficient information in the transitional region
-4.
' ,4 - ,5"
¢
)
0
J ~ UP
| • ~ - - 0 0
,,T,O
/ . 6 0
• I
_ 0 . ~ o '~' 0 i
I
FIo. 2. The intensity and CO2 concentration at four log photosynthesis values given by the numbers on the curves. The curve drawn is theoretical and is from equation (4). The data are taken from Smith (1937) and are in Table I,
between the asymptotes at low photosynthesis values; this is precisely where the least decisive evidence is given by the curves relating intensity (or [CO2]) and photosynthesis. In addition, these data are expressed in terms of wet weight of tissue, and there may be 20 to 30 per cent variation in photosynthesis rate, thus affecting the relative position of each curve on the ordinate.
A new series of measurements to eliminate these two objections was
Dow
nloaded from http://rupress.org/jgp/article-pdf/22/1/21/1238890/21.pdf by guest on 10 February 2022

26 L I M I T I N G ]~ACTORS I N P H O T O S Y N T H E S I S
therefore undertaken. The photosynthesis of the fresh water p lant Cabomba caroliniana was studied as in the previous investigation, using the Warburg apparatus with the same methods for the control of light intensi ty and CO2 concentration. All of the measurements were
made at 25.3°C. In order to eliminate the variat ion caused by the use of different
fronds, a measurement of the photosynthet ic act iv i ty of each frond was made under s tandard conditions: [C02] = 2.90 × 10 -4 moles per liter (Warburg buffer No. 11), I = 123,000 meter candles. All of the
TABLE I
Intensity and C02 Concentration for Constant Photosynthesis
These data drawn in Fig. 2 represent interpolated values from the measure- ments given in Tables III and IV of an earlier publication (Smith, 1937). The intensities in Table IV of that paper have been corrected for the absorption of the red filter (Coming No. 246) as determined by measuring photosynthesis-intensity curves on the same plant with white and with red light. The effective absorption of the filter as determined twice was 0.22 log units. Bold-face values are for the factor that was constant in the measurements.
log p : 0.8 log p : 1.2 log p : 1.6 log p = 2.0
log [C02] log I
--5.50 --5,59 4.12 --5.45 6.23 - 4 . 6 9 2 .84 - 4 . 1 0 2.53 --3.88 2.68 --3.64 2.62
log [CO,]
-5.08 -5.20 -5.05 - 4 . 6 9 - 4 . 1 0 -3 .88 -3.64
log [
4.12 5 .23 3.27 3.03 3.08 3.02
log [CO=]
--4.45 --4.80 --4.64 --4.69 --4.10 - 3 . 8 8 - 3 . 6 4
log I log [CO2] log I
3 .58 - - - - 4.12 --4.24 4.12 5.23 - - 4 . 2 0 5 .23 4.17 -- -- 3.45 --4.10 4.00 3.49 - - 3 . 8 8 4.00 3.43 --3.M 3.90
da ta were then corrected in terms of an assigned arb i t ra ry photosyn- thesis value of 200 c. mm. of oxygen produced per hour per 100 rag. wet weight of tissue for the s tandard determination. This value is within 5 per cent of the average actual ly found.
To cover a sufficient range, measurements were made at five light intensities and six CO2 concentrations. Within a single experiment, the photosynthesis of a frond was investigated as a function of light intensi ty at a constant CO, concentration, and then repeated for one or two additional CO2 concentrations. Three runs were made at
Dow
nloaded from http://rupress.org/jgp/article-pdf/22/1/21/1238890/21.pdf by guest on 10 February 2022

E. L. SMITH 2 7
each CO2 concentration, a total of eighteen for the series, and the data averaged. While the data were all obtained as photosynthesis at dif- ferent intensities, they may also be used to obtain the CO,. curves at constant intensity. Two complete series of such measurements were made; they are presented in Table II.
To find the light intensity necessary to attain a definite amount of photosynthesis at a constant CO2 concentration, or the converse, it is
TABLE I I
Photosynthesis at Different Intensities and C02 Concentrations
Data of Figs. 3 and 4. Photosynthesis in cubic millimeters of oxygen evolved per hour per 100 nag. wet weight of material corrected for respiration. Tem- perature = 25.3°C. CO,. concentrations × 106 in moles per liter. All d the data are in terms of a standard value of 200 when the [CO,.] -- 290 × 10 -6 and I = 123,000 meter e~ndles. Each set of data represents the averages of three similar experiments.
Series Intensity
meier candles
I 4O7 1,740 6,310
21,900 123,000
I I 407 1,740 6,310
21,900 123,000
ICOn] ~ , Buffer N
2.8! 7.5! 9.7~ 9.9:
10.4
2.0¢ 7.1~
10.8 11.9 11.6
Photosynthesis rate
[C021 = Buffer 1~
3 .0 9 .6
19.2 21 .0 21.1
3 .2 11.2 20 .4 23.2 23.5
uffer N
3.0 13.7 33.7 43 .8 46 .5
3 . ~ 14.2 35 .9 48 .3 48 .4
O.S [C021 = ,. ? Buffer N
3 .& 16.5 45 .9 66 .4 71.5
3.7, 19.5 54.7 79.1 84.9
72 [COsl = 78 . ~ Buffer No.
4 .08 17.0 62.1
119 145
3.67 17.4 55.2
119 146
[CO~I =29o Buffer No. 1!
3 .66 18.7 62.5
150 200
4 .49 20.5 68 .4
159 200
necessary to interpolate between the measured values. To do this, there was drawn through all of the data, the smooth curve of equa- tion (2). That this curve gives a satisfactory description of these data is shown in Figs. 3 and 4. In Fig. 3 are presented the data of series I for photosynthesis as a function of intensity. All of the data have the curve of equation (2) drawn through them.
The mass plots of Fig. 4 contain all of the data in Table II. The
Dow
nloaded from http://rupress.org/jgp/article-pdf/22/1/21/1238890/21.pdf by guest on 10 February 2022

28 LIMITING FACTORS IN PHOTOSYNTHESIS
curve of equation (2) was drawn through all of the log photosynthesis v e r s u s log I da ta at the different CO, concentrations. These curves
If' 3"
H
9
--4,Z.5
2.,2
/ o
8
7 c-
---I/.,9
/-6
6" o. A/ .3
,.6" ZO
Zoo Z - - m e t e r ca~dles FIG. 3. Photosynthesis as a function of light intensity for different CO~ con-
centrations indicated on each curve by the Warburg buffer number. The photo- synthesis ordinates are correct only for the uppermost curve; the others have been displaced downwards in steps of 0.2 of a log unit, with their correct positions given on the right side of the figure. The insert shows the absolute positions of the six curves drawn to exactly half the ordinates. All of the curves are drawn from equation (2). These are from the data of series I given in Table II.
were then superimposed and the points t raced on a single graph. This is possible because the shape of the curve is invar iant in form.
Dow
nloaded from http://rupress.org/jgp/article-pdf/22/1/21/1238890/21.pdf by guest on 10 February 2022

~. ~:. S~ZTE 29
The same procedure was also used for the log photosynthesis-log CO2 data, except for the measurements at the lowest light intensity (407 meter candles) which are omitted because they were not suffi- ciently precise to determine the position of the curve. The excellent fit of these new data incidentally confirms and strengthens the validity of equations (2) and (3) as quantitative descriptions of the effect of these two variables on photosynthesis.
.,
~ ,
o ;~ ,, , , , .,i ;
/-.0 9 Z o r COo
Fzo. 4. Photosynthesis as a function of intensity (upper curve) and of COs concentration (lower curve). The points represent all of the data in Table I[, The curve from equation (2) was drawn through all of the different sets of data. These were then superimposed and traced on a single graph.
In Fig. 5 and Table I I I are presented the data obtained for the log CO2 concentrat ion-log intensity relationship at four log photo- synthesis values. These four values were chosen to express best the actual data obtained, The lowest photosynthesis value is near the lower limit of the actual measurements, and in a few cases represents a small extrapolation. The higher values of the log photosynthesis rate were selected to eliminate successively one or more curves from consideration, thus giving whatever real changes in form occur in low as compared with higher photosynthesis rates.
Dow
nloaded from http://rupress.org/jgp/article-pdf/22/1/21/1238890/21.pdf by guest on 10 February 2022

30 LIMITING I~ACTORS IN PHOTOSYNTHESIS
Equation (4) has been drawn through the data in Fig. 5. A good description of the data is obtained at the three higher photosynthesis rates, as is also the case for the older data given in Fig. 2. However, at the lowest photosynthesis value, a much better description is given by equation (6), which is drawn in broken lines.
!
~ - Y ",,. Q a , f l
4. 5"
Z mster coddle, s" I~G. S. Intensity and CO2 concentration at four log photosynthesis values
indicated on each curve. The curves are theoretical and represent equation (4). At the lowest photosynthesis value, a better fit of the data is given by equation (6) indicated by dashed lines. The open circles are from series I, and the solid circles are from series II. The numerical values are given in Table III.
After the first series of measurements had been completed, it was thought that the difference in curve form might be due to large errors or variation at low photosynthesis rates, and it was for this reason that a second series of measurements was undertaken. The data show no significant difference between the two series. The average difference in the determination of log I or of log [CO2] between the two
Dow
nloaded from http://rupress.org/jgp/article-pdf/22/1/21/1238890/21.pdf by guest on 10 February 2022

E. L. SMITH 31
series is about 0.07 log units. This value is actually an exaggeration of the uncertainty in placing the curve, because there is a distinct shift in the best position of the curves independently drawn through the two series. This shift is about 0.05 log units with respect to both
TABLE III
Intensity and COs Concentration for Constant Photosynthesis
Data of Fig. 5. These are graphically interpolated values from the measure- ments in Table II. The numbers in bold-face type represent the constant factor.
I I
log p ffi 0.80 Series
log [COx]
- -5 .32 - 5 . 5 2 - 5 . 5 4 - 5 . 5 6 - 5 . 3 6 - 6 . 0 6 - 4 . 6 9 - 4 . 4 3 - -4 .10 - 3 . M
- -5 .41 - -5 .58 - -5 .61 - -5 .59 - § . 3 6 - 5 . 0 6 - -4 .69 - -4 .43 - 4 . 1 0 - - 3 . M
log p
log I og [CO=]
8 .24 - 4 . 5 5 3.80 - 5 . 1 2 4.~I - 5 . 1 4 5.09 - 5 . 1 7 3.07 2.98 - 6 . 0 6 2.92 - 4 . 6 9
ffi 1.2o
log I
3.24 3.80 4.84 5.09
3.55 3.33
2.83 - 4 . 4 3 3 .24 2 .80 - -4 .10 3 .20 2 .80 - -3 .54 3 .20
3 .24 - -4 .75 3 .24 8.80 - 5 . 1 7 8.80 4.34 --5 .21 4.34 6.09 - -5 .20 5.09 3.17 - - - - 2.92 --5.06 3.43 2.84 --4.69 3.24 2.77 - -4 .43 3 .16 2.84 - - 4 . 1 0 3 .24 2.75 - - 3 . 6 4 3.15
log p ffi 1.60
log [CO,]
- -4 .62 - -4 .74 - -4 .76
- 4 , 6 9
- -4 .43 --4.10 --3.54
- - 4 . 6 6 - -4 .81 - -4 .80
- I - 4 . 6 9 - 4 . 4 3 - -4 .10 - 3 . r a I
log i~ ffi 2.00
log___~l log[CO,]__ log____~I
3 . 8 0 - - I - -
i
-423L 4,4 # - 31 I _
4.02 3.72 - - - - 3.61 - - 4 . 1 0 4 .14 3.60 - -3 .M 4.06
3 . 8 0 - - - -
4.34 - - 4 . 30 4 .34 5.09 - - 4 . 3 5 ! 6.09
3.82 - - - - 3.61 - - - - 3 .65 - - 4 . 1 0 4.17 3.55 - - 3 . M 4.01
ordinates and may be due to some specific difference in the plants used, since the two series were run some 6 months apart.
I t is possible that the curve obtained at low photosynthesis repre- sents some specific kinetic difference as compared with those at high photosynthesis values. If this is so, then the curves for photosynthesis as a function of intensity should have different shapes at low and at high COs concentrations; or the photosynthesis-COs curves should
Dow
nloaded from http://rupress.org/jgp/article-pdf/22/1/21/1238890/21.pdf by guest on 10 February 2022

32 LIMITING FACTORS IN PHOTOSYNTHESIS
vary with light intensity. The published data on these relationships (Smith, 1936; 1937) as well as those given in this paper do not show such variation except where a CO~ diffusion factor is involved. Such measurements, however, have been usually made with the constant factor at moderate or high values. In order to test this possibility, new measurements were undertaken.
For the photosynthesis- intensi ty measurements, a buffer (No. 2) of low CO~ concentration was selected which gave measurements of photosynthesis below the compensation point even at high intensities.
L o o
~J - $ I 5 /
/ f
/ j w V I
,Z ~ -Z- .a"
FIa. 6. Photosynthesis as a function of intensity at a low constant C02 concen tration (0.902 × 10 -8 moles per liter). The curve is from equation (2) and is of the same form as those obtained at higher CO~ concentrations. The dsta are given in Table IV.
For such low photosynthesis rates, the readings had to be of long duration; respiration was measured for at least 1 hour, and the deter- minations at each light intensity for 30 minutes. Three fronds were used in each run to increase the accuracy of the measurements.
The data which are given in Fig. 6 and Table IV represent the aver- ages of three similar runs. These measurements are adequately described by equation (2) and therefore do not differ from the results obtained when higher CO2 concentrations are used.
I t is more difficult to determine the curve for photosynthesis as a function of CO~ concentration at low intensity. The tissue has to be
Dow
nloaded from http://rupress.org/jgp/article-pdf/22/1/21/1238890/21.pdf by guest on 10 February 2022

E. L. SMITH 33
removed from the manometer vessel after each determination and replaced in a buffer mixture of a different COs concentration. Such handling has little effect on measurements made at high intensities, but at low intensities it is sufficient to invalidate the measurements ob- tained. Moreover, one cannot use several fronds because they cannot be replaced in the vessel without altering the overlapping and partial shading. The form of the photosynthesis- COs curve at low intensi- ties can be determined only with the use of more suitable material.
TABLE IV
Photosynthesis and Intensity at Logo CO~ Concentration
Data of Fig. 6. Measurements at constant CO2 concentration = 0.902 × 10-e, Buffer No. 2. Averages of three similar runs, using three large fronds in each run. Temperature = 25.3"C. Respiration determined for at least 60 minutes, other measurements for 30 minutes each. Photosynthesis in cubic millimeters of oxygen per hour per 100 rag. wet weight of tissue.
Intensity Photosynthesis
45.7 87.1
166 4O7 933
1,740 6,310
123,000
0.32 0.79 1.26 2.27 2.94 2.93 3.13 2.96
Iv
DISCUSSION
In addition to the data presented in this paper, there have been only two attempts to obtain a comprehensive picture of the mutual effects of intensity and COs concentration on photosynthesis, those of Harder (1921) on Fontinalis, and those of Hoover, Johnston, and Brackett (1933) on wheat. We have studied their results in the same way that we have done for Cabomba.
For the higher photosynthesis values of Harriet's measurements, the uncertainty in drawing the individual curves makes difficult a
Dow
nloaded from http://rupress.org/jgp/article-pdf/22/1/21/1238890/21.pdf by guest on 10 February 2022

34 LIMITING FACTORS IN PHOTOSYNTHESIS
choice between equations (4) and (6); but at the low values, equation (6) definitely gives a better fit than (4). This is entirely consistent with the results on Cabomba.
The two experiments of Hoover, Johnston, and Brackett present a somewhat different picture. The data for their first experiment give curves which change their shape at low and high photosynthesis values in much the same way as those for Cabomba and Fontinalis. However, for reasons which are at present obscure, the measurements for their second experiment differ considerably from all of the other data. Here the curvature in the log COs versus log intensity graphs becomes very gradual and fits equation (8) best.
The explanation for the difference in the limiting factor equations at low and high photosynthesis rates depends on the interpretation of the exponents in these equations. Franck and Herzfeld (1937), after assuming the existence of back-reactions in photosynthesis, arrived at an equation similar to equation (2). While equation (2) gives a slightly more precise description of the data than does their equation, the latter does provide a possible explanation of the change in curve form at high photosynthesis rates in terms of an appreciable back-reac- tion at high intensities and a negligible back-reaction at low intensi- ties. In the latter situation, the light-limiting reaction (assuming that there must be four) would be first order, and a scheme such as given by equation (5) would hold. With appreciable amounts of energy loss caused by back-reaction, the data would fit the descriptions given by (1).
Whatever may be the eventual explanation for this change in kinetic properties at low and high photosynthesis rates, the general form of the limiting factor relationship seems dear. This relationship follows from the relative effects of the light and dark processes in the photosynthetic cycle; in fact, such a relationship must obtain when- ever such a cycle occurs.
SUMMARY
1. Extensive measurements have been obtained (a) relating photo- synthesis and light intensity for a large range of COs concentrations and (b) relating photosynthesis and COs at different light intensities. From these families of curves, the limiting factor relationship can be secured for any value of the photosynthesis rate.
Dow
nloaded from http://rupress.org/jgp/article-pdf/22/1/21/1238890/21.pdf by guest on 10 February 2022

E. L. sm~ 35
2. In terms of previous work an equation has been derived for de- scribing these relations between the intensity and C~), concentration necessary to produce a definite amount of photosynthesis. This equa- tion furnishes an exact description for all the data, except those for low rates of photosynthesis where a slightly different equation is required. The nature of the two equations suggests that a simple first order reaction determines the velocity of the light process at low photosynthesis rates, but that at high rates the mechanism is com- plicated by another factor.
The author gratefully acknowledges the friendly advice and criti- cism of Professor Selig Hecht.
BIBLIOGRAPHY
Baly, E. C. C., The kinetics of photosynthesis, Proc. Roy. Soc. London, Scde~ B, 1935, I17~ 218.
Blackman, F. F., Optima and limiting factors, Ann. Bot., 1905, 19, 281. Burk, D., and Lineweaver, H., The kinetic mechanism of photosynthesis, Cold
Spring Harbor symposia on quantitative biology, Cold Spring Harbor, Long Island Biological Association, 1935, 3, 165.
Emerson, R., and Arnold, W., A separation of the reactions in photosynthesis by means of intermittent light, J. Gen. Physiol., 1932, 16, 391.
Franck, J., and Herzfeld, K. F., An attempted theory of photosynthesis, J. Chem. Physics, 1937, 5, 237.
Harder, R., Krifische Versuche zu Blackmans Theorie der 'Begrenzenden Fak- toren' bei der Kohlens~ureassimilation, Jahrb. ~ssensch. Bot., 1921, 60, 531.
Hoover, W. H., Johnston, E. S., and Brackett, F. S., Carbon dioxide assimilation in a higher plant, Smithsonian Misc. Coll., 1933, 87, No. 16.
Smith, E. L., Photosynthesis in relation to light and carbon dioxide, Proc. Nat. Acad. So., 1936, 22, 504.
Smith, E. L., The influence of light and carbon dioxide on photosynthesis, J. Gen. Physiol., 1937, 20, 807.
Spoehr, H. A., Photosynthesis, New York, The Chemical Catalog Co., 1926. Stiles, W., Photosynthesis, London, Longraans, Green and Co., 1925. Warburg, O., tJber die Geschwindigkeit der photochemischen Kohlens~urezer-
setzung in lebenden Zellen, Biochem. Z., Berlin, 1919, 100, 230. Warburg, O., ~ber die Geschwindigkeit der photochemischen Kohlensgurezer-
setzung in lebenden Zellen. II, Biochem. Z., Berlin, 1920, 103, 188.
Dow
nloaded from http://rupress.org/jgp/article-pdf/22/1/21/1238890/21.pdf by guest on 10 February 2022