Optimal lengths of moving averages for the MACD oscillator ...

www.stockoptionsystem.com

www.stockoptionsystem.com
Disclaimer
• It should not be assumed that the methods, techniques, or indicators presented in these products
will be profitable or will not result in net losses. Past results are not necessarily indicative of
future results. Examples presented here are for educational purposes only. These examples are
not solicitations to buy or sell. The author, publisher, and all affiliates assume no responsibility
for your trading results.
• There is a high risk in trading.
• HYPOTHETICAL OR SIMULATED PERFORMANCE RESULTS HAVE CERTAIN INHERENT LIMITATIONS.
UNLIKE AN ACTUAL PERFORMANCE RECORD, SIMULATED RESULTS DO NOT REPRESENT ACTUAL
TRADING. ALSO, SINCE THE TRADES HAVE NOT ACTUALLY BEEN EXECUTED, THE RESULTS MAY
HAVE UNDER- OR OVER-COMPENSATED FOR THE IMPACT, IF ANY, OF CERTAIN MARKET
FACTORS, SUCH AS LACK OF LIQUIDITY. SIMULATED TRADING PROGRAMS IN GENERAL ARE ALSO
SUBJECT TO THE FACT THAT THEY ARE DESIGNED WITH THE BENEFIT OF HINDSIGHT. NO
REPRESENTATION BEING MADE THAT ANY ACCOUNT WILL OR IS LIKELY TO ACHIEVE PROFITS OR
LOSSES SIMILAR TO THOSE SHOWN.
• U.S. Government Required Disclaimer -Stock trading has large potential rewards, but also large
potential risk. You must be aware of the risks and be willing to accept them in order to invest in
the stock markets. Don’t trade with money you can’t afford to lose. This web site is neither a
solicitation nor an offer to Buy/Sell stock. No representation is being made that any account will
or is likely to achieve profits or losses similar to those discussed on this web site. The past
performance of any trading system or methodology is not necessarily indicative of future results.

www.stockoptionsystem.com
Modern technology has made the stock market
more accessible than any other time in the
financial history of the world yet traders still
struggle to find worthy investments to trade.
Despite having access to advanced charting
packages, real-time news, and instant access to
a company’s financial performance, finding
worthy stocks to trade continues to be as much
of a challenge in the 21st century as it was in
the past centuries.
Explanations as to why this is so difficult are as numerous as the challenges that they attempt to
explain away. Like the Hydra, you chop off one head only to have another head grow back to
take its place, and you’re left with more unanswered questions leading to frustration and
overwhelm.
The focus of this article is to offer a framework to find winning stocks to trade. Rather than offer
some step-by-step, “one-size fits all” approach, this framework will act as a guide to find stocks
that stand the greatest chance of emerging as a potential leader in the stock market. It is a flexible
approach that is based on what works that allows some deviation. Flexibility is important
because if you get too locked in to the “right” way or become to rigid in your approach then you
will fail to miss out on viable opportunities. Later on, I’ll go into more detail about that later but,
for now, understand that these 4 keys will act as a guide to help you find stocks with leadership
potential in the stock market.
Stock leaders are responsible for taking the overall market to higher levels but, more importantly
to you, they offer the greatest overall return. They have “runaway” potential where they outrun
the overall market and go on to rack up returns of 25%, 50%, 100%, and even greater.
To help, you’ll need an understanding of the two dominant schools of trading: fundamental and
technical.
Fundamental vs. Technical
There are two schools of speculation that are often at odds with one another which are
fundamental and technical.
www.stockoptionsystem.com
The fundamental school teaches that a
company’s performance in its marketplace is the
sole focus of determining its worth as an
investment. Fundamentalists focus a great deal
on all of the company’s operations with a
particular focus on earnings growth and cash
flow but also spend countless hours deciphering
everything from earnings, return on capital,
accounts receivable turnover, average in-store
sales, sales revenue, asset value, debt-to-income,
and more.
The strength of this approach is that by understanding how a company is operating and
generating profits at a core level allows you to “see” whether a company is being managed
properly.
Going back to earnings, its also important to note that the stock market lives on earnings, or
rather is fueled by earnings reports. Four times a year, earnings are reported faithfully by every
publicly-traded company and their stock price lives or dies based on what they report. If they are
achieving sales and market-share, then it should be reflected positively in their share price.
If it isn’t, then eventually a company’s bad fundamentals are going to catch up to it’s share price.
Key Point: no stock’s price action can outrun bad fundamentals forever.
This is important to keep in mind as you read the rest of this report and when considering a stock
as a trade candidate.
The weakness of this approach is that a company that is fundamentally sound could still be
under-performing the stock market despite superior fundamental performance. This can be
maddening for you as a speculator when you find an undervalued company with great profits and
earnings but the stock stays flat and there is no share appreciation.
Its not unheard of to buy a stock that goes nowhere for years despite record-breaking
fundamental performance. Starting in 1973, Warren Buffett began buying shares in the
Washington Post but experienced no return for almost 3 years before the stock began to show a
pulse. That can be a frustrating test of patience for any trader or investor, no matter how
experienced.
Adding to that frustration, a stock with no earnings or profits or any compelling fundamental
criteria can soar to breathtaking heights in a short time. When Amazon first went public it had no
earnings or profits for years but if you had invested a $1,000 in the stock it would have
appreciated to over $65,000 in just 18 months after its initial public offering (IPO)!
The technical school prefers the study of price action rather than the company’s fundamental
performance. The technical approach takes into account that all data - both known and unknown
- are reflected in a stock’s price action. Whether the company is recording huge profits,

www.stockoptionsystem.com
encountering stiff competition, retaining earnings, or losing key leadership, students of the
technical approach brush off such events as irrelevant as they believe that everything is
accounted for in a stock’s price action.
Price action is the movement that take place as a stock is traded in the stock market. Price charts
are used by technicians to track the open, close, high, and low of a stock’s movement over a set
period of time. By tracking a stock’s movement this way, the market technician seeks to uncover
the trend in the stock’s price movement. Trends, to a trader, and a technician, are the cornerstone
of profitable trading because they believe that they determine the future direction of the stock.
Then, the technical method of trading uses a series of tools like chart patterns, trendlines,
support/resistance, price/volume to pinpoint the ideal place to enter and exit the price trend.
For the purist, price action is the only key factor when making a trading decision. Setup
conditions, the triggering of the trade, and when to take profits are all based on what price is
doing in the present, not value or future potential.
However, there are technical indicators that can be used to help the technician confirm their
trading decisions. Indicators like MACD (moving average convergence divergence), Williams
%R, Relative Strength Indicator (RSI), and others are examples of technical indicators that can
help the technician make reliable trading decisions.
The benefits of such an approach is that it will let you find stocks that are trending and allow you
to take advantage of that price movement. You won’t have to worry about earnings or the stock’s
intrinsic value, just the price action. As a result, you won’t have to sit in a position for years
waiting for the stock to appreciate and, instead, will just concentrate on trading in stock’s that are
trending either upward or downward.
The weakness of such an approach is that there are almost as many technical methods of trading
as there are stocks to trade themselves. Elliot Wave, astral movement, breakout trading,
stochastics, trend-trading, Fibonacci Zones, Two-step Bearish Patterns, Keltner Channels,
Bullish Butterflies, Wolfe Waves, Bollinger Bands, moving averages, and on and on. To the
novice, and even the veteran traders, the technical school can be confusing and overwhelming.
Worse, you’re left with the challenge of how to put all these different methods and indicators
into a workable framework that assists you in knowing where to trade along with when to enter
and exit.
Now that you have an overview of the two primary schools of trading, as well as their strengths
and weaknesses, which should you use to help you find winning stocks? The answer is that by
indicating the best aspects of both approaches work best.
The leads to the question of what parts to eliminate, which to keep, and how to combine them for
the best results?
The cornerstone to picking the best stocks to trade centers around 4 key factors:
www.stockoptionsystem.com
Rocket Fuel and the Stock Market
The stock market lives, breathes, and dies by earnings. Let me repeat: The stock market lives,
breathes, and dies by earnings.
Repeat this to yourself till you sear into your mind and soul. Everything on Wall Street revolves
around earnings reports because their lives and careers are dictated solely on how well they
interpret them.
On Main Street, people’s lives are impacted by what happens when a company that they’ve
invested in or are considering investing in by what that company’s earnings are or predicted to
be. An elderly couple’s pension benefits are going to be impacted by the earnings by the
companies that their pension has invested in; what college a mother and father are going to be
able to send their children to from the investment they made in a fund; someone hoping to retire
early will find their investments impacted by the earnings a company makes and then reports.
Earnings are to the stock market what air is to both you and I - it is the very foundation to life.
For stocks with homerun potential, earnings are an indicator of runaway potential.
In a study of the biggest stock winners in the last century, there was a common thread that
signaled their spectacular performance which was accelerated earnings being reported. This
performance indicator gives you the ability to discern which stocks are run-of-the-mill and which
are set to emerge as leaders.
www.stockoptionsystem.com
Consider the following examples from William O’Neil’s classic “How To Make Money In
Stocks” book:
“Dell Computer’s earnings per share surged 74% and 108% in the two quarters prior to
its price increase from November 1996.
Cisco posted earnings gains of 150% and 155% in the two quarters ending October
1990, prior to its giant run-up over the next three years.
Google showed earnings gains of 112% and 123% in the two quarters before it made it
runaway move after its IPO.
Going back as far as 1914, Studebaker’s earnings were up 296% before it sped from $45
to $190 in eight months.
In 1916, Cuban American Sugar’s earnings skyrocketed 1,175% and climbed from $35 to
$230 during the same year.
In 1926, du Pont de Nemours showed earnings up 259% before its stock took off from
$41 and surged to $230 before the 1929 stock market crash.”
Earnings are what allow competitive companies to break free of the stock market’s gravity and
ratchet up superior returns.
They are the match that lights the charge that leads to…
Explosive Price Moves
The school of technical trading teaches that there are two forms of price action: contraction and
expansion.
When price is contracting, it appears to be trading back and forth with no real direction or
movement. Neither the bulls nor the bears have control of the stock’s price movement and until
one side gains enough critical mass, then the status quo will remain and the stock will remain
range-bound.
When price enters a period of expansion, however, price will trade with noticeable conviction in
a given direction. If a stock is bullish, then price action will trade upward in a steady series of
higher highs and higher lows. For a bearish stock, price action will trade downward in a steady
series of lower highs and lower lows.
www.stockoptionsystem.com
When a stock is experiencing a period of contraction it will take a catalyst of some type to ignite
either the bulls or bears to enter a position in sufficient number to force the stock’s price action
into expansion.
Like the Yin/Yang philosophy, price will move back and forth between contraction and
expansion with each containing the seed of potential of another. Accelerated earnings act as the
spark that sets off a change reaction and drives one side to act to push the stock over the tipping
point where it explodes in a given direction.
But, leading up to that breakaway run, you can spot stocks with runaway potential as they trade
close to…
New Price Highs
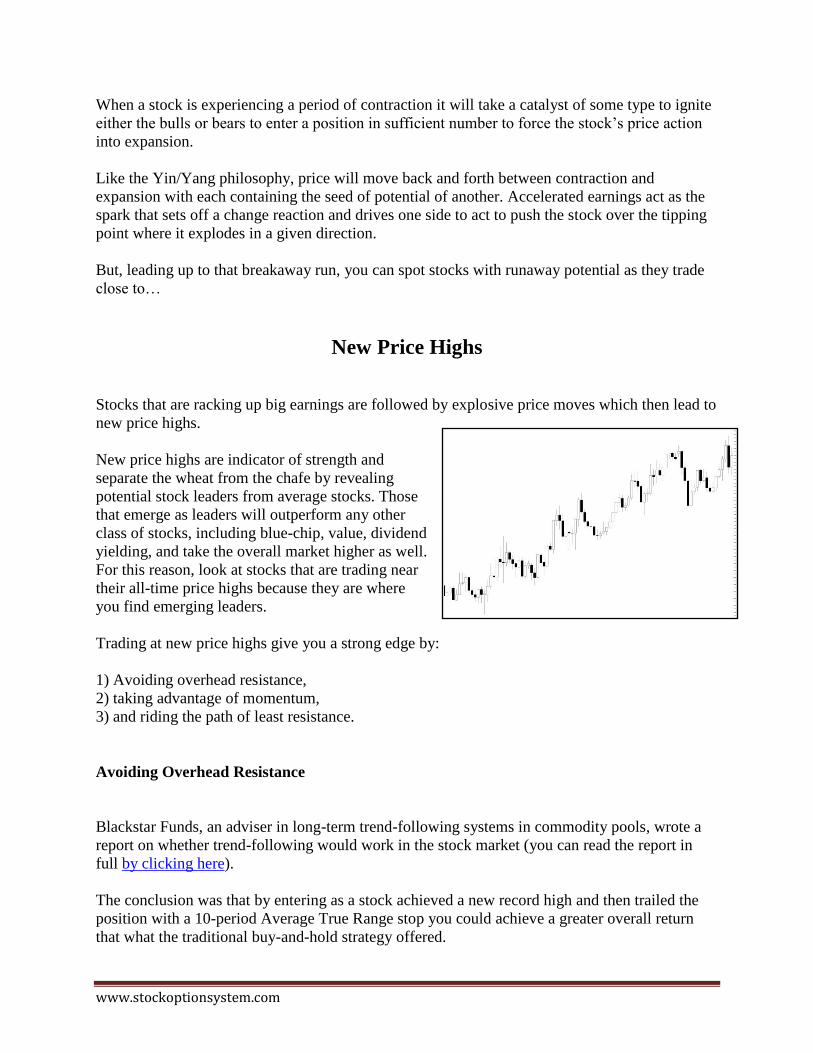
Stocks that are racking up big earnings are followed by explosive price moves which then lead to
new price highs.
New price highs are indicator of strength and
separate the wheat from the chafe by revealing
potential stock leaders from average stocks. Those
that emerge as leaders will outperform any other
class of stocks, including blue-chip, value, dividend
yielding, and take the overall market higher as well.
For this reason, look at stocks that are trading near
their all-time price highs because they are where
you find emerging leaders.
Trading at new price highs give you a strong edge by:
1) Avoiding overhead resistance,
2) taking advantage of momentum,
3) and riding the path of least resistance.
Avoiding Overhead Resistance
Blackstar Funds, an adviser in long-term trend-following systems in commodity pools, wrote a
report on whether trend-following would work in the stock market (you can read the report in
full by clicking here).
The conclusion was that by entering as a stock achieved a new record high and then trailed the
position with a 10-period Average True Range stop you could achieve a greater overall return
that what the traditional buy-and-hold strategy offered.
www.stockoptionsystem.com
One of the reasons was no “overhead resistance”. Overhead resistance forms when a stock
declines and begins to reverse its direction and make up lost ground but encounters resistance at
each significant price point on the way back up. This resistance occurs at these levels because
investors who had bought at these price points before the stock declined have been sitting there
and waited for the stock to come back rather than sell and take a loss. As price begins trading
back up through those price points then those investors sell at breakeven to get out the position.
When they do this, volatility enters the market and throws off the stock’s price trend that was in
motion.
Taking Advantage of Momentum
This can slow the upward momentum of the stock’s movement and even shake you out of your
position by hitting your trailing stop.
Without any overhead resistance, momentum can accelerate the stock’s trend in absence of any
drag on its price action.
Momentum is the ability of a stock’s price to get from Point A to Point B in as little time as
possible.
Stocks that have strong earnings attract legions of investors but, most importantly, they attract
institutional investors like mutual funds or pensions. These institutions command billions of
dollars and can literally move the market higher or lower due to the shear size of the capital that
they have at their disposal. Earnings drive the majority of the investment decisions by major
institutions who are hungrily looking for new up-and-coming companies to get in early and
invest in.
On the tail-end of strong earnings, these big institutions will jump in and aggressively take
positions in these companies which causes a change reaction of events that all lead to greater
momentum in the stock’s price action. By focusing in on these key factors, you can take
advantage of the momentum caused by these events and find stocks that make 25%, 50%, 100%,
or greater in a short period of time. It happens every day if you know where to look and what to
look for.
By taking this approach, you will find yourself on the right side of the market more often than
not. This is the “path of least resistance” which is a by-product of trading on the side of the trend.
The Path of Least Resistance
The easiest way to come out ahead in the stock market is to find good stocks and then enter as
they form a price trend. Trend-trading in the stock market is the most reliable method of scoring
huge returns and avoiding losses.

www.stockoptionsystem.com
Everything that you’re reading in the report is designed to give you a number advantages in order
to model successful stocks that are likely to emerge as a stock leader and move in your favor.
This is the “Path of Least Resistance” that you want to strive for when selecting stocks because it
keeps you on the side of the winners.
Too many people attempt to buy stocks as they are
going down but find that their investment
continues to decline. They obviously are trying to
catch the stock on the cheap, maybe even time its
movement to catch it as it turns back up, but this is
a painful exercise. In trading, this is called trying
“to catch a falling knife”.
Trading in the right side of the trend is infinitely
more profitable over the long-run and much less
stressful.
Still, millions of investors avoid buying as a stock goes up and avoid selling when the stock goes
down. Why?
Conventional stock market wisdom has taught generations of investors that trading is risk and
that you should buy-and-hold stocks forever. The problem with that mentality is that stocks can
stay stuck at certain price levels or, worse, keep declining. Trading stocks is about finding the
strongest companies and then having a method to separate stocks with potential and avoid the
laggards.
For decades, people have been conditioned by the big brokerage houses and investment firms to
buy a stock because its “cheap”. Cheap stocks are synonymous with value in the eyes of Wall
Street but that doesn’t mean that their idea of value translates into a decent return for you.
Facebook (FB) was going to be the next big growth stock and was hyped more than any other
IPO in recent memory yet the stock tanked within days of its launch. It may recover or it may
not, but how would you like to have your life savings tied up in a stock that is going down with
no idea of when its going to stop?
That is the problem with value investing as a whole. If that is your cornerstone strategy to build
your assets and get rich, how do you know which stocks are a value and when those stocks are
going to throw off a decent return? Warren Buffett may be a legend and icon of value investing
but his ability to pick winning stocks on the cheap is a talent built through a combination of hard
work and decades of experience. Not many people can match that skill, not even most traders.
But, the ability to read price action and identify strong stocks can help you stay on the Path of
Least Resistance and, as a result, end up on the winning side of the trend instead of being run
over by it.

www.stockoptionsystem.com
Trading Where the Market is the Strongest
In the stock market, the prevailing thought is that when a stock has fallen by a wide margin then
it is a “bargain” that should be bought.
On the opposite end of that thought, when a stock is soaring higher, the Novice becomes nervous
and waits for it to come down a bit before considering buying into the move.
Profitable trading is a bit of a paradox where though the two above examples make sense on the
surface, unfortunately, they will lead to losses more often than profits. The reason is that
“bargains” in the stock market are often bargains for a reason - they have no inherent value until
they rise in price. Warren Buffett and Benjamin Graham - two of the most recognized value
investors in the financial world - may have gotten rich by picking value stocks that no one else
wants but many people, including you, are not going to be able to match their performance. Also,
you may have a hard time sitting on a position for years and waiting for it come back.
But, by looking for the strongest stocks in the stock market in the present moment may yield
quicker results as well as much better returns.
Profitable trading then is more about focusing on market selection than market timing.
So, the first method to find winning stocks is to find the strongest sectors of the stock market and
then track the stocks that make up those sectors.
There are several sources but I use a free service over at Barchart.com to help navigate my way
through 185 industry groups, stock, and Exchange Traded Funds (ETF’s) and locate the strongest
sectors that are leading the market in real-time. I prefer the 6-month performance which you can
find at -
http://www.barchart.com/stocks/sectors/change.php?page=6mo
The securities that make up these sectors are displaying the highest Relative Strength in the
market. Relative Strength (RS) is a technical indicator that compares the performance of a given
security in comparison with the overall market. Stocks are scored from 1 to 99 with 1 being the
weakest score and 99 being the strongest score. In that range, you will find which stocks have the
strongest performance to determine where to go long and, on the opposite end of the spectrum,
which stocks to ignore or short.
I prefer to look at the 6-month RS but you can look at any time depending on your preference.
Once you have a list of high RS stocks that also match the previous criteria, you’ll have list of
candidates to trade.

www.stockoptionsystem.com
Flexibility in the Application of the 4 Keys
I mentioned in the beginning that this is a flexible approach that allows for some deviation. That
seems a bit confusing but now that you understand the foundational principles involved allow me
to expand on that statement.
Stock selection is a bit of an art and a science. If you’ve been trading for awhile then I’m sure
you realize that. If not, let me explain that you can go through the painstaking hard work of
checking out every financial ratio of a stock and double check every analyst’s report but still fall
short of finding a winner. The reason is that the market is fickle and just because a stock has
every trait you look for in a winning stock, it can still fail.
There is no hard and fast rules to stock selection that leads to the perfect trade but guidelines are
offered to help you find the winners and avoid the dogs. A stock may have poor earnings but its
still in a strong trend, trading at a new high while displaying explosive price movement. A stock
may not display explosive price movement but its fundamentals are strong and it trades in a
steady trend with high RS. Each stock has to be judged on the merits of the key traits that it is
displaying and in its own context.
For example, I like stocks that are over $100 a share. It’s been my experience that high-priced
stocks trend better and have compelling price action that can be exploited easier than stocks that
are below that price point.
Go look at a chart of Chipotle (CMG) or Priceline (PCLN) and you’ll see what I mean. It takes
less for them to gain a quick 10%, 20%, or more than lower-priced stocks. I have alot of theories
as to why - volatility, big volume, strong institutional sponsorship - but the bottom line is that it
takes less effort for those stocks to gain a quick 10 - 20%.
So, when I’m scanning for stocks, I always take notice of what this class of stocks is doing.
When I use a scanner to uncover potential stock trades, I have a separate set of criteria of looking
at this stock class by themselves. I then use these 4 keys to help filter out the best of the best and
see what I find.
If I can’t find a perfect match for all 4 keys, I may alter my trading approach and use options or
trade with half the risk in mind (quick tip: this is one of the reasons why understanding how to
trade with options can give you an edge in the market).
Using the 4 Keys in Real-Time
In the past decade, give or take a few years, sorting through thousands of stocks to find these
common characteristics was an overwhelming task. The amount of work that it took made it

www.stockoptionsystem.com
almost not worth it for the smaller trader with a few thousand dollars to trade. Only the uber-
motivated with lots of time on their hands were able to apply themselves to the huge task of
sifting through papers and reports to find a kernel of gold, and even then there was no guarantee
that they would find anything worth trading.
Fast forward to present, the internet has opened up a wealth of resources for today’s traders.
Whether on Main Street or Wall Street, you can get access to institutional-level information and
sort through it with the touch of a button. Some charge a fee but there are others that are free and
the information is just as good, if not better.
To help you sort through the stock market universe, you’re going to need a scanner. I’ve listed
several scanners and other valuable resources on my site at www.StockOptionSystem.com, and
am constantly updating them, but in this
report I am going to use FinViz.com.
FinViz.com is short for “Financial
Visualizations”. Its an impressive
scanner that has both free and paid for
features. The paid for features are
mostly for real-time data but you can
setup a free account and use its scanning
capabilities at no charge.
Before going any further, let me warn
you that FinViz.com has alot of features.
The information can be overwhelming
and counter-productive if you try to use
every feature to find the “perfect” stock
to trade. The site has everything from maps, groups, futures, Forex, and more. Its a great tool but
in the beginning be mindful of information overload and keep it simple.
Remember: The essence of trading mastery (or mastery of anything) boils down to the beautiful
simplicity of what you do.
That said, the scanner section of FinViz.com allows you input a number of fundamental and
technical criteria for the type of stock you’re looking for.
So, for a basic scan of the 4 keys, create a free account and click the “Screener” tab at the top of
the screen.
When you get to the screener, you’ll see 4 tabs at the top: Descriptive, Fundamental, Technical,
and All.
Just go to the “All” tab and click it. The All selection is just what it sounds like and pulls up all
the criteria from the other tab selections.

www.stockoptionsystem.com
Locate the following criteria and input the following:
1) 52-Week High/Low - select “New High” from the drop down box.
2) EPS Growth Qtr Over Qtr - select “Over 30%”.
Next, you’ll pull up a series of stocks that meet this criteria and have their charts displayed for
your review.
Depending on the quality of the economy and the state of the stock market, this list could be as
many as 100 to as little as a dozen. You’re job is to find the best of the best and ignore the rest.
Remember, you are striving to identify the stars among a universe of stocks.
If you have a large number of results, you can use the link mentioned previously at
BarCharts.com to identify the strongest sectors currently in the market -
http://www.barchart.com/stocks/sectors/change.php?page=6mo
Now, you’ll want to visually scan through these charts and confirm that the stocks are in a
uptrend. A quick method is to identify whether the stock’s price action starts at the bottom of the
left-hand side of the screen and is trading up towards the upper right-hand side of the screen,
then the stock is trending upward, which is what you want to see. If not, or if the price action is
jagged versus trading in a smooth, easily identified bullish trend, then scratch off your list of
candidates.
You also want to look for explosive price action in the stock’s movement. This can be breakouts
above resistance points, price laps, price gaps, breakaway price bars, and other types of price
action that display runaway movement in the stock’s price action.
If you go through and filter through the stock results from you scan, you’ll begin to develop a list
of strong candidates for your “hit list” of candidates. Each day, you will look to this list to find
potential trades that are triggered by your trading system.
One shortcoming of FinViz.com that keeps it from being a perfect scanner, in my opinion, is that
it doesn’t screen for Relative Strength. Of course, you can go and search the internet for a stock’s
RS reading and find several sources. Or, you can use one of the paid, inexpensive services like
the scanner at MorpheusTrading.com by clicking here -
https://www.morpheustrading.com/services/stock-screener
They offer a $4.95 30-day trial and then its $11.95 every 30 days which is pretty cheap. There
scanner allows you to screen the stock market for stocks using several similar features found at
FinViz.com as well.
Whichever way you decide to go, you can play with several types of filters to find the best stocks
with runaway potential by using these 4 key criteria as the foundation for your research.

www.stockoptionsystem.com
The Wrap-Up
In closing, I want to warn you of one thing when trading stocks.
Be cautious of trading in front of earnings releases. The fact is that you don’t know how a
stock’s price action will react when earnings are released and how the market will react.
Naturally, you want to be in front of a stock when it breaks higher after an earnings report where
accelerated earnings blow past the expectations of Wall Street. After a company announces that
kind of success, everyone wants a piece and that’s when you can ride the momentum to huge
returns.
If you try to play earnings in advance of the announcement, tighten up your risk control. Use
options for a straight trade by themselves or create an option spread or use as a hedge with a
stock position. At the very least, when using stocks alone, take a small position and then scale in
if the stock acts favorably to your outlook. That way, you won’t take on more risk than you
should but still have the potential to gain a windfall by getting in early in a stock with runaway
potential.
Also, trading stocks with these 4 key factors can be enormously profitable but, keep in mind,
there is risk that comes with that potential. Overall, these 4 keys in stock selection are just one
part of your overall strategy in trading stocks. Use them wisely and you’ll have a real edge in
finding winning stocks but don’t mistake this one part as a total strategy. Instead, see it for what
it is - one part of many that make up a winning strategy.
No method of stock selection will help you if you don’t have a system of risk control in place.
But, if you understand the risks and have a reliable trading method, then these 4 keys should help
find the stocks with the greatest potential for large gains and avoid the ones with lesser potential.
Actions To Take:
Go now and start using what you learned.
Create a list of worthy trade candidates and begin tracking their performance.
Over time, you’ll be able to screen and select the best stocks to trade with your system and prove
to yourself what works and, more importantly, what works for your style of trading.
Good luck and good trading.