Lightning Arrestor Connector Lead Magnesium Niobate Qualification
24
SANDIA REPORT SAND2009-0331 Unlimited Release Printed February 2009 Lightning Arrestor Connector Lead Magnesium Niobate Qualification Pellet Test Procedures Bruce A. Tuttle, Jill S. Wheeler, Patrick Mahoney and Wayne Tuohig Prepared by Sandia National Laboratories Albuquerque, New Mexico 87185 and Livermore, California 94550 Sandia is a multiprogram laboratory operated by Sandia Corporation, a Lockheed Martin Company, for the United States Department of Energy’s National Nuclear Security Administration under Contract DE-AC04-94AL85000. Approved for public release; further dissemination unlimited.
Transcript of Lightning Arrestor Connector Lead Magnesium Niobate Qualification

SANDIA REPORT SAND2009-0331 Unlimited Release Printed February 2009
Lightning Arrestor Connector Lead Magnesium Niobate Qualification Pellet Test Procedures Bruce A. Tuttle, Jill S. Wheeler, Patrick Mahoney and Wayne Tuohig Prepared by Sandia National Laboratories Albuquerque, New Mexico 87185 and Livermore, California 94550 Sandia is a multiprogram laboratory operated by Sandia Corporation, a Lockheed Martin Company, for the United States Department of Energy’s National Nuclear Security Administration under Contract DE-AC04-94AL85000. Approved for public release; further dissemination unlimited.

2
Issued by Sandia National Laboratories, operated for the United States Department of Energy by Sandia Corporation. NOTICE: This report was prepared as an account of work sponsored by an agency of the United States Government. Neither the United States Government, nor any agency thereof, nor any of their employees, nor any of their contractors, subcontractors, or their employees, make any warranty, express or implied, or assume any legal liability or responsibility for the accuracy, completeness, or usefulness of any information, apparatus, product, or process disclosed, or represent that its use would not infringe privately owned rights. Reference herein to any specific commercial product, process, or service by trade name, trademark, manufacturer, or otherwise, does not necessarily constitute or imply its endorsement, recommendation, or favoring by the United States Government, any agency thereof, or any of their contractors or subcontractors. The views and opinions expressed herein do not necessarily state or reflect those of the United States Government, any agency thereof, or any of their contractors. Printed in the United States of America. This report has been reproduced directly from the best available copy. Available to DOE and DOE contractors from U.S. Department of Energy Office of Scientific and Technical Information P.O. Box 62 Oak Ridge, TN 37831 Telephone: (865) 576-8401 Facsimile: (865) 576-5728 E-Mail: [email protected] Online ordering: http://www.osti.gov/bridge Available to the public from U.S. Department of Commerce National Technical Information Service 5285 Port Royal Rd. Springfield, VA 22161 Telephone: (800) 553-6847 Facsimile: (703) 605-6900 E-Mail: [email protected] Online order: http://www.ntis.gov/help/ordermethods.asp?loc=7-4-0#online

3
SAND2009-0331 Unlimited Release
Printed February 2009
LIGHTNING ARRESTOR CONNECTOR
LEAD MAGNESIUM NIOBATE QUALIFICATION PELLET TEST PROCEDURES
B.A. Tuttle, J. S. Wheeler, and P. A. Mahoney
Electronic & Nanostructured Materials Department
Sandia National Laboratories P.O. Box 5800
Albuquerque, NM 87185-1411
W. Tuohig Honeywell FM&T Kansas City, MO
Abstract
Enhanced knowledge preservation for DOE DP technical component activities has recently received much attention. As part of this recent knowledge preservation effort, improved documentation of the sample preparation and electrical testing procedures for lead magnesium niobate – lead titanate (PMN/PT) qualification pellets was completed. The qualification pellets are fabricated from the same parent powders used to produce PMN/PT lightning arrestor connector (LAC) granules at HWF&T. In our report, the procedures for fired pellet surface preparation, electrode deposition, electrical testing and data recording are described. The dielectric measurements described in our report are an information only test. Technical reasons for selecting the electrode material, electrode size and geometry are presented. The electrical testing is based on measuring the dielectric constant and dissipation factor of the pellet during cooling from 280oC to 220oC. The most important data are the temperature for which the peak dielectric constant occurs (Curie Point temperature) and the peak dielectric constant magnitude. We determined that the peak dielectric constant for our procedure would be that measured at 1 kHz at the Curie Point. Both the peak dielectric constant and the Curie point parameters provide semi-quantitative information concerning the chemical and microstructural homogeneity of the parent material used for the production of PMN/PT granules for LACs. Finally, we have proposed flag limits for the dielectric data for the pellets. Specifically, if the temperature of the peak dielectric constant falls outside the range of 250oC ± 30oC we propose that a flag limit be imposed that will initiate communication between production agency and design agency personnel. If the peak dielectric constant measured falls outside the range 25,000 ± 10,000 we also propose that a flag limit be imposed.

4
Acknowledgments
The authors would like to acknowledge the technical efforts of Jill Wheeler who
spearheaded the FY08 technical efforts for this project. The pioneering efforts of Roy Holt, Willie Washington and David Goy for development of PMN/PT materials and LACs are respectfully noted. Further, the technical expertise and program leadership of Jeff Christensen, Terry Ernest and Dennis Eichorst are acknowledged. Alice Kilgo and Geoff Brennecka made important contributions with regard to sample preparation and technical discussions. We especially acknowledge Steve Lockwood for his exemplary technical efforts at the beginning of this program. Finally, Robert Fleming provided great insight and knowledge with his quantitative determination of the effects of electrode size on the measured dielectric constant as it compares to the true dielectric constant. Sandia is a multiprogram laboratory operated by Sandia Corporation, a Lockheed Martin Company, for the United States Department of Energy under contract DE-ACO4-94AL85000.

5
Table of Contents Page Title Page .............................................................................................................................3 Acknowledgments................................................................................................................4 Introduction..........................................................................................................................7 Experimental Procedure
Source of PMN/PT Qualification Pellets.................................................................8 Polishing Equipment and Sputter Deposition Apparatus……………………….....9 Electrical Test Equipment and Procedures ............................................................10
Results Previous Testing.....................................................................................................10 FY08 Objectives ....................................................................................................11 Electrical Test Results for Five Different Qualification Pellets ............................13
Summary ............................................................................................................................21 References..........................................................................................................................22 Figures 1. Electroded Qualification Pellets Using Old and New Procedure ..................................12 2. Dielectric Constant Versus Temperature for Qualification Pellet 9725B .....................14 3. Dielectric Constant Versus Temperature for Qualification Pellet 9743B …...….….…15 4. Dielectric Constant Versus Temperature for Qualification Pellet 9825B ....................... 16 5. Dielectric Constant Versus Temperature for Qualification Pellet 9937B ....................... 17 6. Dielectric Constant Versus Temperature for Qualification Pellet 0027A ....................... 18 Tables Table 1: Peak Dielectric Constants and transformation temperatures for Qualification Pellets Using New Geometry and Measuring Procedure...............................................................19 Table 2: Peak dielectric Constants and Transformation Temperatures for Qualification Pellets Using Old Geometry and Measuring Procedure………………………………………….20

6

7
Introduction: A brief history of lead magnesium niobate / lead titanate (PMN/PT) LAC development and the reasons for PMN/PT qualification pellets is presented. Our recent work concerning the development of a repeatable electrical test procedure for PMN/PT qualification slugs is then described. The concept of developing a LAC that would have the excellent insulation resistance of rutile granules but with fast-rise breakdown voltage (FRB) characteristics that were more similar to those of varistor granules was first proposed by Roy Holt. [1] In the course of studies at SNL and GEND in the late 1980’s and early 1990s, PMN/PT 50/50 ceramics were determined to have the proper insulation resistance, fast-rise breakdown behavior and high temperature performance for LAC applications. These early PMN/PT fabrication and characterization efforts [2] at GEND Pinellas were headed by Willie Washington, David Goy (now in SNL Dept. 2454) and Chris Whitehouse. Further fabrication and development efforts occurred at Sandia National Laboratories with Steve Lockwood, Bruce Tuttle, Roy Holt, Dave Goy and Jill Glass among the active participants. From these technical efforts, the LAC PMN/PT drawing set was developed in the mid 1990’s by Roy Holt and collaborators. Bruce Tuttle, Wayne Tuohig (HWFM&T) and coworkers were responsible for the drawings for qualification of raw materials and granule fabrication. The PMN/PT qualification pellets that are the subject of this report have been fabricated by Wayne Tuohig at HWFM&T since 1995. The fabrication of these pellets was initially used to provide a quick determination if the powder batch was suitable for subsequent fabrication of PMN/PT granules. The reason for qualification pellet fabrication arose early in the development / qualification program at Sandia National Laboratories in the 1992 to 1994 time frame. There was initially some variability [3] in the quality (particularly density) of PMN/PT ceramics from batch to batch. Good batches yielded fired pellets that were 96% dense versus 84% density for bad batches. Room temperature dielectric constants were 13% lower for the bad batch ceramics. Further, PMN/PT granules from bad batches had roughly an order of magnitude lower insulation resistance and 3.5 times less fracture strength than those of the good batches. Mean value FRB voltages were 3% to 12% higher than those from good batches. It is noted that statistically the FRB values overlapped each other for the good and bad PMN/PT batches. The technical process changes that caused bad batches has not been determined. There has been no evidence during HWFM&T production, under Wayne Tuohig, of the sporadic, low density PMN/PT slugs that were observed in the early stages of the SNL development effort. SNL component engineers, SNL scientists and HWFM&T production engineers have felt that the low labor hours and low cost process of fabricating a slug from the parent powder batch for tests of density and dielectric properties is a prudent procedure. Specifically, if there is an anomaly in PMN/PT LAC properties, having information concerning pellet properties that are critically dependent on chemical composition and microstructure will facilitate a rapid determination of the technical issues causing the anomaly. The dielectric constant and dissipation factor of normal ferroelectric materials is very dependent on mechanical stress and chemical composition. For example, with regard to composition, the Curie point changes [4] approximately 5.5 oC per mole percent change in Ti

8
mole fraction. Microstructural features such as grain size, presence of second phases due to microstructural inhomogeneities or contamination by foreign materials can also result in substantial changes in the dielectric constant. As grain size decreases, the peak dielectric constant will decrease and there may be a slight change in transformation temperature due to internal stress within the ceramic. The Curie point (peak dielectric constant temperature) decreases in temperature for higher internal stress levels which results in overall compression of the average unit cell and thus enhances the range of temperature for which the smaller volume cubic paraelectric phase is stable. The Clausius – Clapeyron equation is often used to describe this behavior (Equation 1) near the Curie Point (Tc). For Equation 1, π is hydrostatic stress, ΔV is the volume change between the ferroelectric and paraelectric phases and ΔH is the enthalpy of the phase transition. dTc / dπ = (ΔV/ΔH) (1) Another factor that can influence PMN/PT dielectric behavior is the formation of second phases other than the desired perovskite phase. These minor phases can substantially lower the dielectric constant, especially if they surround grains in the form of a lower dielectric constant layer. All known different phases, such as PbO, TiO2, MnO2 etc. have a lower dielectric constant than the desired perovskite structure PMN/PT phase. Thus measurement of a significantly lower dielectric constant than expected can indicate the presence of a second phase and strongly indicates that the powder batch is unsuitable for production. Experimental Procedure: Source of PMN/PT Qualification Pellets
The PMN/PT qualification slugs used in this study were obtained from Wayne Tuohig of HWFM&T. It is noted that Dennis Eichorst (HWFM&T) has become familiar with PMN/PT granule processing and is expected to assume responsibility for the PMN/PT granule production, including qualification pellet processing within the next few years. Powder to form the PMN/PT qualification pellets is taken from every batch of ball milled PMN/PT powder used by HWFM&T to make granules. A minimum of two pellets is made from each batch of powder. Nominally 10 grams of powder is used to form the pellets and the powder is pressed in a one inch diameter cylindrical die at 15 ksi pressure that results in green densities of 4.7 to 4.8 g/cm3. Given that the theoretical density is 8.14 g/cm3 for this simple tetragonal perovskite with lattice parameters of a = 3.975 and c = 4.057 angstroms, the green density is 58.3%. No binder is added to the powder other than the residual water content from milling. The process to fabricate the pellets has been described by Wayne Tuohig in a Honeywell knowledge preservation video. One of the pellets is preserved at HWFM&T (in most cases it is labeled with an A) as an archive sample and the other slug (usually given a B designation) is sent to SNL. Both the PMN/PT powder and the slugs are labeled with the year and date. For example, the designation PMN/PT qualification slug 9725 indicates that the slug was fabricated in 1997 during the 25th week of the year. The PMN/PT slugs used in our present study were from lots 9725, 9743, 9825, 9937and 0027 and were labeled 9725B, 9743B, 9825B, 9937B and 0027A. They were processed

9
according to specification SS704588 Issue B and were fabricated in 1997, 1998, 1999 and 2000 at what was Allied Signal Kansas City Division (now HWFM&T) by Wayne Tuohig. The nominal composition of the PMN/PT granules given in terms of mole fraction is 0.5 Pb(Mg0.33Nb0.67)O3 + 0.5 PbTiO3. The qualification pellets are put into an alumina boat and then bisque fired at 750oC in air for 60 minutes. They are subsequently imbedded in lead zirconate powder in a closed crucible and the assembly is placed inside a closed dome with additional lead zirconate and fired at 1050oC for 90 minutes. These are the same firing conditions used for the PMN/PT granules. The approximate fired pellet density is 7.8 g/cm3
(96.4% theoretical) with approximate dimensions of 2.1 cm diameter and 0.35 cm thickness.
Polishing Equipment and Sputter Deposition Apparatus The grinding / polishing operations and associated equipment that were used to obtain the desired thickness and surface finish for the PMN/PT qualification slugs were under the auspices of Alice Kilgo (Dept. 1822). The polishing equipment consisted of a Struers RotoPol with a RotoForce head and Multi-doser semi-automatic polishing apparatus. First, 600 grit SiC abrasive was used to smooth the fired surfaces of the PMN/PT pellets that were roughly 3.5 mm thick. Polishing of PMN/PT pellets was accomplished using Struers poly-crystalline diamond suspensions ranging from 9µm to 1µm. Tap water was used as the lubricant for the SiC abrasive media, while the lubricants for the diamond suspensions used were: (1) DP-Green (a water soluble environmentally safe lubricant) for the 9 and 6 micron steps, and (2) DP-Red (oil based) lubricant for the 3 and 1 micron steps, both of these lubricants are Struers products. The cloths used for polishing were as follows: (1) 9µm - MD Largo, a hard platen used to remove the 600 grit scratches and provide a uniformly flat surface, (2) 6µm - DP-Dac which is a satin woven acetate cloth that provides a flat semi-polished surface, (3) 3µm - MD-Mol a woven 100% wool cloth, and 1µm - MD-Nap a short nap synthetic cloth. These last two cloths give the samples a highly polished mirror-like finish. The reason for grinding / polishing the slugs to 2.5 mm thickness is two fold: 1) remove the slight edge damage of the pellets so that a uniform geometry is obtained and 2) have a uniform thickness for measurement. Work by Carlson and coworkers [5] indicate that the dielectric constant measured is a function of the electrode diameter and the thickness of the sample. Our overall goal in having similar sample geometry and surface finish is to provide better reproducibility for our dielectric property measurements. A number of different sputter deposition parameter and electrode combinations have been investigated for the PMN based dielectrics used in LAC programs over the last several years. For this study, we investigated sputter deposition of two different electrode materials: (1) gold by itself and (2) gold with a chromium adhesion layer. Sputter deposition was done in a 3 ft diameter stainless steel vacuum chamber with 2 sputter gun capability. An Alcatel mechanical pump was used to obtain a rough vacuum of 1 mTorr and then a CTI 8 cryogenic pump was used to get to the base pressure of 10-6 Torr suitable for sputter deposition. While the nominal thickness value for the Cr was 40 nm, the nominal thickness value for the gold was 450 nm. Typical sputter deposition rates were 40 nm per minute for chromium and 90 nm per minute for gold. Previous dielectric measurements over the last 12 years have used four 5 mm diameter electrodes that are aligned on both the top and the bottom of the wafer. We have changed this

10
procedure to obtain more accurate area measurements of the electrodes. The higher accuracy for electrode area provides more accurate dielectric constant readings from slug to slug. Our present process is to deposit 40 nm thick Cr and then 450 nm thick Au electrodes that cover the entire surface of the slug. Electrode deposition was performed using VWR Laboratory Labeling tape (VWR part number 36428) that has a 1 inch diameter core and is 0.5 inches wide to mask off the pellet edges. Prior to the electrode deposition, the tape is rolled around the edge of the sample and the excess is removed with a sharp scalpel or razor blade. After electroding, the tape was gently removed from the pellet to not lose any portion of the electrodes from the top and bottom surfaces of the sample. While no solvent was used to clean the edges of the pellet before electrical testing, some slight sanding (using 600 grit SiC abrasive) of excess Au from the edge of the pellet was sometimes required. Electrical Test Equipment and Procedures A Hewlett Packard model 4284A Precision LCR meter was used to measure capacitance and dissipation factor. Temperature control was via a Sun Systems temperature chamber microcontroller interfaced with Lab View Software. Initial testing before 2008 was performed using measurements at three different frequencies (100 Hz, 1 kHz, and 10 kHz) with data being taken at roughly 1oC/ minute. Our current practice is to make measurements at the one frequency of 1 kHz. This was done to simplify the data and to reduce the time for making measurements such that capacitance and dissipation factor measurements could be made at 0.1oC temperature intervals. Specifically, our software is designed to take a capacitance / DF reading once every 12 seconds. We obtain 9 readings per degree centigrade and thus have 0.1 o C resolution for measurements of peak dielectric constant and transformation temperature.
Results: Previous Testing: Previous testing of PMN/PT qualification pellets was performed by Bruce Tuttle and Walter Olson (SNL Center 1800) from 1997 through 2002. The slugs that were received from Wayne Tuohig (HWFM&T) were prepared for electroding using a light 600 grit SiC abrasive surface grind. Pellets were then electroded using a nominal 60 nm Cr // 200 nm Au deposition. The thickness of the pellets after the surface preparation procedure was typically 3.3 mm ± 0.2 mm. A sputter deposition mask was used to deposit 4 each 5 mm diameter electrode patterns on the PMN/PT pellets. The mask used consisted of two separate stainless steel plates that could be clamped around the sample using wing nuts. This permitted alignment of the electrodes on the top and bottom surface of the qualification pellet. Some electrode shadowing did occur that affected the electrode shape / dimensions and thus the magnitude of the measured dielectric constant values. High temperature cement was used to attach Cu wires to the electrodes so that electrical measurements could be made in a temperature controlled sample test furnace. The dielectric constant behavior in the vicinity of the Curie Point (280oC to 220oC) was measured for an approximately 1oC/min cooling rate. While this test provided data with 0.1oC resolution, data

11
points were only taken roughly every 1oC during cooling. Three different frequencies of measurement were used: 100 Hz, 1 kHz, and 10 kHz. FY08 Objectives: Our overall objective in FY08 was to develop procedures to characterize appropriate dielectric properties of PMN/PT qualification slugs that will result in sufficient reproducibility write a test procedure (SS document format). We developed procedures for qualification pellet dimensions, surface finish, electroding techniques and electrical measurements that result in reproducible measurements of dielectric properties in the vicinity of the ferroelectric to paraelectric transition temperature (i.e. Curie Point or transformation temperature at approximately 250oC). The individual tasks in FY08 consisted of the following 7 tasks: (1) Determine materials and fabrication procedures for electrodes, (2) Determine and specify procedure to mask qualification slug, (3) Determine electrical connections for capacitance and DF versus temperature test, (4) Determine the geometry of the sample to be used, (5) Determine the electrical test and heating procedures to measure dielectric constant for the acceptance pellet. (6) Using the above procedures: machine / grind 4 other acceptance pellets to appropriate thickness dimension, electrode and test as determined by tasks 1 through 4. (7) Determine the mean and standard deviation for the peak dielectric constant and the temperature of the peak dielectric constant The status and outcome of the seven tasks are summarized below. Task 1: Determine / select electrode material to use for repeatable dielectric property tests. Status: Sputtered Cr//Au electrodes will be used (Cr 40 nm// Au 200 nm). We performed test depositions of Cr and Au to determine the sputter deposition rates. 150 watts RF power was used for both the Cr and Au depositions. A Veeco Dektak Model 6M Stylus Profiler Profilometer was used for the film thickness calibration. We determined a sputter deposition rate of 40 nm / minute for Cr in this recent work for 150 watts RF power for the sputter guns. We initially used a deposition time of 30 seconds to get 20 nm thick Cr film, but felt that 40 nm would give us a more reliable adhesion layer from run to run with our particular sputter deposition unit. Further, we determined that there was no difference in the dielectric properties measured in the vicinity of the Curie Point for pure Au electrodes versus 40 nm Cr// 200 nm Au. Several repeat tests were made in this temperature range showing no change within experimental error limits in data. Thus, we determined that the Cr adhesion layer did not impact electrical results. The use of Au only as an electrode material was not chosen due to peeling of small portions of the electrode from the qualification slug during handling of the sample.

12
OLD NEW Figure 1: Electroded Qualification Slugs Using Old and New Procedure
Task 2: Determine and specify procedure to mask sample for electrode deposition Status: The task has been completed. We used masking tape cut to appropriate dimensions to prevent electrode metal from depositing on thickness edge of the PMN/PT disk. The procedure for getting appropriate tape size, removal of tape after deposition and removal of Cr//Au from edges of sample was documented earlier in this report. Task 3: Determine electrical connections for capacitance and dissipation factor (DF) versus temperature test. Status: The task has been completed. A mullite (alumino-silicate ceramic material) // stainless steel screw fixture for sample measurement was determined to be acceptable for repeatable electrical measurements. The brass nuts to hold the screws were embedded in the mullite using Omega CC High temperature cement. The screw used to make connections was approximately 7/8 inch long and 1/8 inch in diameter. Previous techniques that included attachment of copper wires by epoxy will no longer be used. Task 4: Determine the geometry of the sample to be used. Status: The pellet will have a nominal thickness of 2.54 mm thickness ± 0.25 mm. (100 ± 10 mils). The qualification pellet will be ground or machined to this thickness dimension to minimize edge damage and to provide a technique that yields a reasonable reproducible dielectric constant that is relatively insensitive to the dielectric thickness value within the thickness range shown above. Task 5: Determine the electrical test and heating procedures to measure dielectric constant for the qualification pellet. Status: The task has been completed. The qualification pellet is heated in the Sun Systems Chamber that is programmed to 310oC. The pellet is allowed to soak for roughly 30 minutes

13
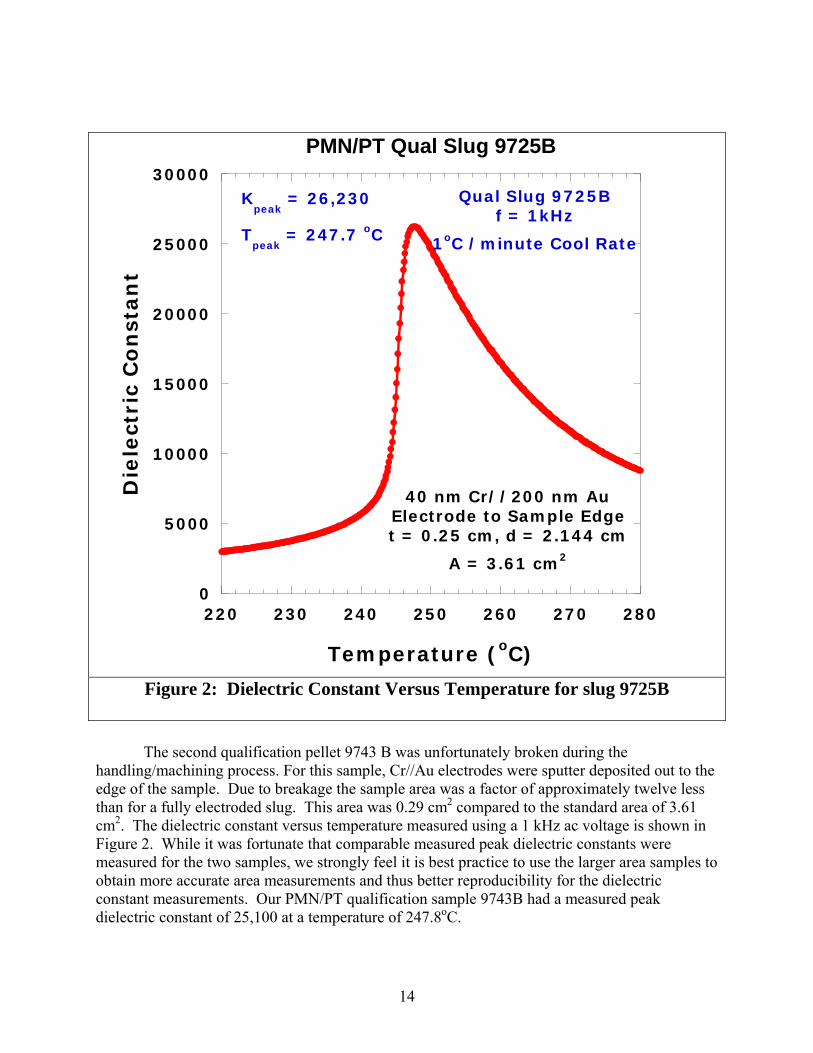
once the program temperature is reached so that the temperature of the pellet is 285oC to 287oC. The pellet is then cooled to 220oC at a nominal furnace controlled rate of 1oC/min ± 0.2oC/min. Task 6: Using the above procedures: machine / grind other acceptance slugs to appropriate thickness dimension, electrode and test as determined by tasks 1 through 4. Qualification pellets to be electrically tested and results documented include: Lot 9725 (B) full size sample of 3.61 cm2 area obtained, Lot 9743 (B) (broke into pieces, cut to square cross-section (0.29 cm2 area), Lot 9825 (B) (broke, cut to square cross-section (0.48cm2 area)), Lot 9937 (B), Full size sample obtained, and Lot 0027 (A), Full size sample. Status: All five pellets were ground and polished to appropriate thickness dimension. Unfortunately, slugs 9743B and 9825B broke during handling. While the electroded area of the three intact slugs was approximately 3.61 cm2, the areas of the other two slug pieces were 0.29 and 0.48 cm2 for slugs 9743B and 9825B, respectively. From dielectric tests on the qualification pellets and knowledge of electronic ceramic processing we have proposed flag limits on the dielectric data for the pellets. Specifically, if the temperature of the peak dielectric constant falls outside the range of 250oC ± 15oC, which corresponds to ± 3% change in B-site cation ratio, we propose that a flag limit be imposed. If the peak dielectric constant measured falls outside the range 25,000 ± 3,000, we propose that a flag limit be imposed. This range was chosen based on the 13% decrease in dielectric constant of previous bad batches in development. Once a flag limit is imposed appropriate personnel from the design and production agencies need to communicate with each other. The term flag limits arose from discussions between Jeff Christensen (Dept. 1732) LAC engineer and Gerald Gurule (SNL Dept. 12341). It was felt that flag limits rather than pass/fail criteria were appropriate. Specifically, flag limits simply imply that a flag being raised means a result fell outside the limits such that the Design and Production Agencies need to get together to understand what the data means and decide on disposition. The data ranges cited above would not be rigid pass/fail limits. Electrical Test Results for Five Different Qualification Pellets: Five different PMN/PT pellets were processed, electroded and electrically tested as part of the present knowledge preservation activity. The different pellets were 9725B, 9743B, 9825B, 9937B and 0027A. All pellets were ground and polished to 2.5 mm thickness ± 0.2 mm. Electrodes consisting of 40 nm Cr followed by deposition of 200 nm Au were RF sputter deposited onto the PMN/PT pellets. The pellets were then put into our mullite – stainless steel screw test fixture and taken above 280oC and allowed to soak for 2 hours. The furnace was programmed to cool at 1oC.minute and the dielectric measurements were made every 12 seconds. This resulted in readings essentially every 0.1 oC. The dielectric constant measured for a 1 kHz, 1 volt ac rms signal during cooling is shown in Figure 1 for pellet 9725B. A peak dielectric constant of 26,230 was measured at 247.7 oC. Dissipation factor readings were also measured but were not plotted. .
14
0
5000
10000
15000
20000
25000
30000
220 230 240 250 260 270 280
PMN/PT Qual Slug 9725BD
iele
ctri
c C
on
stan
t
Temperature (oC)
Qual Slug 9725Bf = 1kHz
1oC /minute Cool Rate
Kpeak
= 26,230
Tpeak
= 247.7 oC
40 nm Cr//200 nm AuElectrode to Sample Edget = 0.25 cm, d = 2.144 cm
A = 3.61 cm2
Figure 2: Dielectric Constant Versus Temperature for slug 9725B
The second qualification pellet 9743 B was unfortunately broken during the handling/machining process. For this sample, Cr//Au electrodes were sputter deposited out to the edge of the sample. Due to breakage the sample area was a factor of approximately twelve less than for a fully electroded slug. This area was 0.29 cm2 compared to the standard area of 3.61 cm2. The dielectric constant versus temperature measured using a 1 kHz ac voltage is shown in Figure 2. While it was fortunate that comparable measured peak dielectric constants were measured for the two samples, we strongly feel it is best practice to use the larger area samples to obtain more accurate area measurements and thus better reproducibility for the dielectric constant measurements. Our PMN/PT qualification sample 9743B had a measured peak dielectric constant of 25,100 at a temperature of 247.8oC.

15
Figure 3. Dielectric Constant and Dissipation Factor for Slug 9743B The dielectric constants measured at 1 kHz for qualification pellet 9825B in the temperature range of 220oC to 280oC are shown in Figure 4. A peak dielectric constant of 24,700 was measured at 247.8oC. This sample also broke during processing and has an electroded area of 0.48 cm2. This is roughly a factor of seven less area than for the full size qualification pellet. We electroded the sample surface completely out to the edge of the rectangular sample as was done for the previous qualification pellet 9743B. While the breakage of two out of 5 qualification pellets is a concern, it is felt that we have our mechanical polishing process and associated handling procedures such that the breakage observed should not occur in the future.
0
5000
10000
15000
20000
25000
30000
220 230 240 250 260 270 280
Kpeak
= 25,100
Tpeak
= 247.8 oC
40 nm Cr//200 nm AuFull Electrode to Sample Edge
t = 0.27 cm; A = 0.29 cm2
Qual Slug 9743Bf = 1 kHz
1oC / minute Cooling

16
Figure 4: Dielectric Constant and Dissipation Factor for slug 9825B
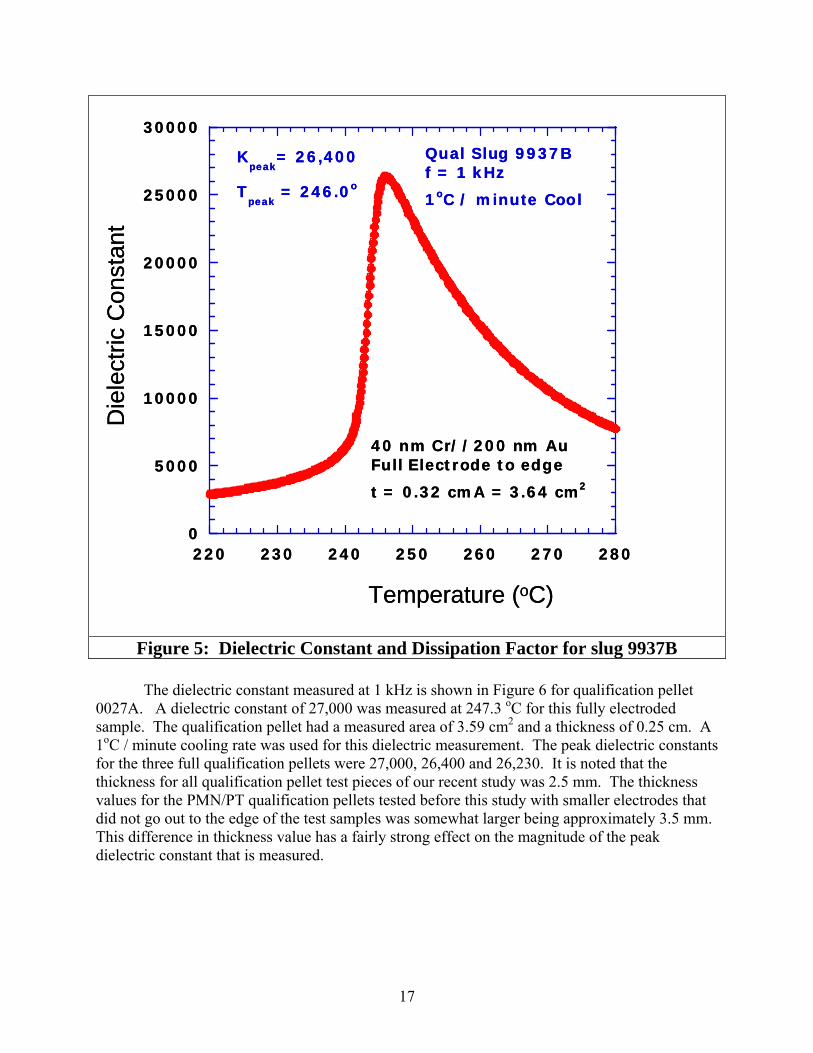
The dielectric constant for qualification pellet 9937B is shown in Figure 5. A peak dielectric constant of 26,400 was measured at 246.0oC for the 1oC/minute cooling rate used between 280oC and 220oC. This qualification pellet was completely intact and had an electroded area of 3.64 cm2. We also note that there is no monotonic relationship between the electrode size and the magnitude of the peak dielectric constant, although the average peak dielectric constant of the two small qualification pellets is slightly less than that for the full qualification slugs of larger area. Specifically, the average of the peak dielectric constant of the three large qualification pellets was 26,540. The average of the peak dielectric constant for the two smaller samples made from qualification pellets 9825B and 9743 B was 24,900. There is a 6.2% difference in the values of the small and large qualification pellet test samples.
Temperature (oC)
Die
lect
ric C
onst
ant
0
5000
10000
15000
20000
25000
30000
220 230 240 250 260 270 280
p p
Kpeak
= 24,700
Tpeak
= 248.1 oC
Qual Slug 9825Bf = 1 kHz
1oC / minute cool
40 nm Cr//200 nm AuFull electrode to sample edge
t = 0.28 cm; A = 0.48 cm2
Temperature (oC)
Die
lect
ric C
onst
ant
0
5000
10000
15000
20000
25000
30000
220 230 240 250 260 270 280
p p
Kpeak
= 24,700
Tpeak
= 248.1 oC
Qual Slug 9825Bf = 1 kHz
1oC / minute cool
40 nm Cr//200 nm AuFull electrode to sample edge
t = 0.28 cm; A = 0.48 cm2
17
Figure 5: Dielectric Constant and Dissipation Factor for slug 9937B
The dielectric constant measured at 1 kHz is shown in Figure 6 for qualification pellet 0027A. A dielectric constant of 27,000 was measured at 247.3 oC for this fully electroded sample. The qualification pellet had a measured area of 3.59 cm2 and a thickness of 0.25 cm. A 1oC / minute cooling rate was used for this dielectric measurement. The peak dielectric constants for the three full qualification pellets were 27,000, 26,400 and 26,230. It is noted that the thickness for all qualification pellet test pieces of our recent study was 2.5 mm. The thickness values for the PMN/PT qualification pellets tested before this study with smaller electrodes that did not go out to the edge of the test samples was somewhat larger being approximately 3.5 mm. This difference in thickness value has a fairly strong effect on the magnitude of the peak dielectric constant that is measured.
Die
lect
ric C
onst
ant
Temperature (oC)
0
5000
10000
15000
20000
25000
30000
220 230 240 250 260 270 280
Kpeak
= 26,400
Tpeak
= 246.0o
40 nm Cr//200 nm AuFull Electrode to edge
t = 0.32 cmA = 3.64 cm2
Qual Slug 9937Bf = 1 kHz
1oC / minute Cool
Die
lect
ric C
onst
ant
Temperature (oC)
0
5000
10000
15000
20000
25000
30000
220 230 240 250 260 270 280
Kpeak
= 26,400
Tpeak
= 246.0o
40 nm Cr//200 nm AuFull Electrode to edge
t = 0.32 cmA = 3.64 cm2
Qual Slug 9937Bf = 1 kHz
1oC / minute Cool

18
Figure 6: Dielectric Constant and Dissipation Factor for slug 0027A The Curie Point and peak dielectric constant are shown for all 5 qualification pellets using our present test procedure in Table 1. The uniformity in properties is excellent for these pellets. The Curie Point measured based on our dielectric property analysis was 248.2oC ± 1.0 oC. The peak dielectric constant values ranged from 24,300 to 27,000 (25,850 ± 1150 midpoint range) and thus also exhibited excellent uniformity. Some of the pellets were of smaller dimension due to breakage during processing. Specifically the data for qualification pellets 9785 and 0027 came from square samples that were of smaller dimension than the standard disk pellets. For comparison purposes we show the same parameters as shown in Table 1 for the same five PMN/PT qualification slugs using our original procedure of smaller patterned electrodes that did not go all the way out to the edge of the test samples in Table 2. While there is little change in the Curie Point, the difference in peak dielectric constant value is rather large when compared
0
5000
10000
15000
20000
25000
30000
220 230 240 250 260 270 280
Temperature (oC)
Kpeak
= 27,000
Tpeak
= 247.3 oC
Qual Slug 0027Af = 1 kHz
1oC /min Cool
40 nm Cr // 200nm AuFull Electrode to Edge
t = 0.25 cm, A = 3.59 cm2

19
to our new data. This difference is due to the effects of having a small electrode diameter to thickness ratio and the electrodes not being all the way to the edge of the sample with a relatively large thickness as shown by Carlson and coworkers. 2
Table 1: Peak Dielectric Constant and Transformation Temperatures for Qualification Pellets Using New Geometry and Measuring Procedure
Slug ID Transformation
Temperature (oC) Peak Dielectric Constant
9725B 247.7 26,230 9743B 247.8 25,100 9825B 248.1 24,700 9937B 246.0 26,400 0027A 247.3 27,000
The transformation temperatures of these five pellets shown in Table 1 are very similar. While the transformation temperatures range from 246.0 oC to 248.1oC, the mean value of the transformation temperature is 247.4 oC with a standard deviation of 0.822 oC. The values of the peak dielectric constants for these five fully electroded samples range from 24,700 to 27,000. The mean peak dielectric constant value is 25,890 with a standard deviation of 955. We note once again that the average dielectric constant of the smaller dimension test pieces is slightly less (6.2%) than those of the larger electrode area samples. Older Geometry and Measuring Procedures Comparison between the qualification pellets using our older procedure with 5 mm diameter electrodes that did not go to the edge of the sample with our new procedure is interesting. Data for the older, smaller electrode diameter technique is shown in Table 2. The transformation temperatures for these qualification pellets measured using the old procedure range between 242oC and 251oC. The peak dielectric constants range from 40,530 to 43,770. While the mean and standard deviation for the transformation temperature measurements is 247.2 oC ± 3.3 oC, the mean and standard deviation for the peak dielectric constant is 41,940 ± 1,226. The transformation temperatures measured are in reasonable agreement for the older sample geometry and newer sample geometry measurements. The magnitude of the difference between the two mean values for the peak dielectric constant for the two different geometries is at first surprising. While the mean value of the peak dielectric constant for the new geometry pellets is 25,890 the mean value of the older geometry pellets is 41,940. Two major factors that can influence this difference are electric fringe fields and the dielectric thickness to electrode diameter ratios. We have taken into account the two different areas of the electrodes (3.6 cm2 and 0.2 cm2) and two different thickness values (0.25 cm and 0.35 cm) of the pellet test pieces which are used to determine the difference in the measured dielectric constants for the two geometries. Colson and coworkers [4] determined

20
combined fringe field and diameter to thickness effects by modeling sample geometries of an infinite dielectric for a series of different electrode diameters and dielectric thickness values. Their analysis using Love’s function indicates that the difference in measured peak dielectric constant of our two sample geometries should be approximately a factor of 1.6. This is in very good agreement with the difference of 1.62 between the large and small electrode values of the dielectric constant for the qualification slugs measured using our two different geometries. We determined that this factor of roughly 1.6 not only holds for near Curie Point measurements of dielectric constant but also for measurements of dielectric constants for all other temperatures from 25oC to 280oC, as expected.
Table 2: Peak Dielectric Constant and Transformation Temperatures for Qualification Pellets Using Old Geometry and Measuring Procedure
Qualification Slug ID Transformation
Temperature (oC) Peak Dielectric Constant
9725B 248.8 39,300 9743B 248.5 42,300 9825B 248.5 40,230 9937B 248.8 43,770 0027A 250.8 41,900
Dev #1 (AS#1) 250 40,500 Dev#2 (AS#2) 252 40,500
9525 250.5 35,000 (10 kHz) 9526 250.5 35,000 (10 kHz)
9535 No crucible 251 27,600 (10 kHz) 9537 Normal Fire 252 32,000 (10 kHz)
The dielectric constant and transformation temperature for six other qualification pellets are also shown (for completeness) in the bottom portion of Table 2. Peak dielectric constant and transformation temperature values were measured using the older electrode geometry and electrical measurement technique. The transformation temperatures measured were very close to one another ranging over a very small temperature interval from 250oC to 252oC. This small range of temperature indicates that the b-site cation ratios and the Pb stoichiometry are very similar from sample to sample. From the results of Table 2, the b-site stoichiometry values are within 0.2 mol% of each other. These results once again indicate the excellent repeatability of the HWF&T manufacturing process. The peak dielectric constants of the last 5 pellets in Table 2 were measured at 10 kHz and exhibited a decrease in peak dielectric constant magnitude of roughly 14% to 20%. It is expected that the peak dielectric constant will decrease with increasing frequency for these materials.

21
Summary The process procedures for preparing fired PMN/PT qualification pellets for electrical measurements have been described. These procedures developed in FY08 included those for obtaining desired pellet thickness, pellet surface finish, and masking techniques for electrodes. The appropriate electrode area and electrode sputter deposition parameters for repeatable electrical results were described. For our procedure, nominal 3.5 mm thick fired PMN/PT qualification pellets were ground to 2.5 mm using grinding media with a final 3 micron diamond abrasive paste polish to control surface roughness. Electrodes were deposited over the entire surface of the pellet providing an electrode diameter of roughly 2.14 cm (area = 3.61 cm2). Electrodes were sputter deposited with a nominal thickness of 40 nm Cr and 450 nm Au. Further, the electrical test procedures including the frequency of measurement, the cooling rate and the voltage were determined. A 1 kHz signal of 1 volt ac amplitude was decided upon for dielectric measurements. Dielectric measurements were taken at 0.1oC intervals using a cooling rate of 1 oC/min between the temperatures of 280oC and 220oC. It was shown that the Curie Point and the peak dielectric constant measured for five different PMN/Pt qualification pellets were very consistent. The mean and the standard deviation for the peak dielectric constant of the 5 different pellets was 25,900 ± 850. The temperature at which the peak dielectric constant was measured had a mean value of 247.4 oC with a standard deviation of 0.82 oC.

22
References:
1. R. D. Holt, “Alternate Materials: A General Model of LAC Performance,” Internal report July 25, 1990. 2. D. Goy and C. Whitehouse, “Fabrication and Properties of Bulk and Granular PT-PMN Ceramics,” Laboratory Operation Internal Report FC-1699, TA1416-501, October 1, 1991. 3. B. Tuttle, W. Washington, S.J. Glass, D.C. Goodnow, S. J. Lockwood, S. Monroe and R.D. Holt, “Long Term Testing of Chem-Prep Varistor Granules; PMN/PT Granule Issues,” Sandia Internal Presentation, LAC Review Meeting, February 23, 1994. 4. A. Safari, R. Panda, V. Janas, Ferroelectric Ceramics: Processing, Properties and Applications, www.rci. Rutgers.edu (1994). 5. G.T. Carlson and B.L. Illman, “The Circular Disk Parallel Plate Capacitor,” American Journal of Physics, 62(12) pp. 1099 – 1105 (1994).

23
Distribution: 1 MS0899 Technical Library (electronic copy), 9536 5 MS1411 B. Tuttle, 1816 1 MS1411 P. Mahoney, 1816 1 MS1411 J. S. Wheeler, 1816 1 MS1411 J. Voigt, 1816 1 MS1411 D. Tallant, 1812 1 MS0447 P. Hoover, 2111 1 MS0447 K. Eklund, 2111 1 MS0481 S. Barnhart, 2132 1 MS0481 B. Blankenship, 2132 1 MS0481 M. Taylor, 2132 1 MS0523 T. Ernest, 1733 1 MS0523 J. Christensen, 1733 1 MS0523 L. Andrews, 1733 1 MS0523 W. Cain 1733 1 MS0523 R. Berget, 1733 1 MS0829 J. Zurbersky, 12337 1 MS0829 M. Decker, 12337 1 MS0829 K. Pierce, 12337 1 MS0829 W. Moffatt, 12337 1 MS0829 J. Clauss, 12337 1 MS0830 M. Terchila, 12335 1 MS0885 R. Salzbrenner, 1820 1 MS0885 J. Braithewaite, 1826 1 MS0888 F.D. Wall, 1823 1 MS0889 R. Tandon, 1825 1 MS9013 R. Sauls, 8231 1 MS9013 B. Markel, 8231