Light Level (lx) Test Introduction
20
Introduction DataSweet’s Data Logging module includes features that will change the way students are able to analyse data and present their experiments in a completely new medium, added to this is the ease-of-use that DataSweet brings to data logging. Data logging devices, and their sensors, are automatically detected as they are plugged-in. Recording video is done with the click of a switch. Read below to find out what you can do with data logging. A Great Modern Application for Mac OS X DataSweet makes full use of the modern features that Mac OS X has to offer. The graphs and meters are drawn using the latest Quartz® graphics technology, which means beautifully presented graphics that can be copy and pasted from the clipboard with no loss in quality. Create Movies of your Experiments It’s all about time! Logging data happens over a period of time. The medium of video also plays along a time line, so it's completely natural that a data logging experiment should be presented as a movie. The Data Logging module creates movies from your captured data with animated graphs and meter readings being displayed exactly as they were when the data was captured. Capture Video as you Log your Experiments DataSweet has the facility to record video while logging data from your experiment. This breakthrough feature means students can present their experiments and findings though the medium of digital video. Light Level 22 lx 0 100 200 300 400 500 600 700 800 900 1000 Page 1
Transcript of Light Level (lx) Test Introduction

Introduction
DataSweet’s Data Logging module includes features that will change the way
students are able to analyse data and present their experiments in a
completely new medium, added to this is the ease-of-use that DataSweet
brings to data logging. Data logging devices, and their sensors, are
automatically detected as they are plugged-in. Recording video is done with
the click of a switch. Read below to find out what you can do with data
logging.
A Great Modern Application for Mac OS X
DataSweet makes full use of the modern
features that Mac OS X has to offer. The
graphs and meters are drawn using the
latest Quartz® graphics technology,
which means beautifully presented
graphics that can be copy and pasted from the clipboard with no loss in
quality.
Create Movies of your
Experiments
It’s all about time!
Logging data happens over a period
of time. The medium of video also
plays along a time line, so it's completely natural that a data logging
experiment should be presented as a movie. The Data Logging module
creates movies from your captured data with animated graphs and meter
readings being displayed exactly as they were when the data was captured.
Capture Video as you Log your Experiments
DataSweet has the facility to record video while logging
data from your experiment. This breakthrough feature
means students can present their experiments and
findings though the medium of digital video.
Test
100
200
300
400
500
600
700
Light Level (lx)
50.0
60.0
70.0
80.0
Sound Level (dBA)
0 5 10 15 20 25
Elapsed Time
Sound Level
52 dBA
40
47
54
6168 75 82
89
96
103
110Light Level
22 lx
0
100
200
300400 500 600
700
800
900
1000
Page 1
Fetch Files from a Data Logger
If the data logging device supports
remote logging then DataSweet is able
to fetch this data from the device.
DataSweet presents a list of files stored
in the data logger with information
about each data file along with the time
and date when the data was captured.
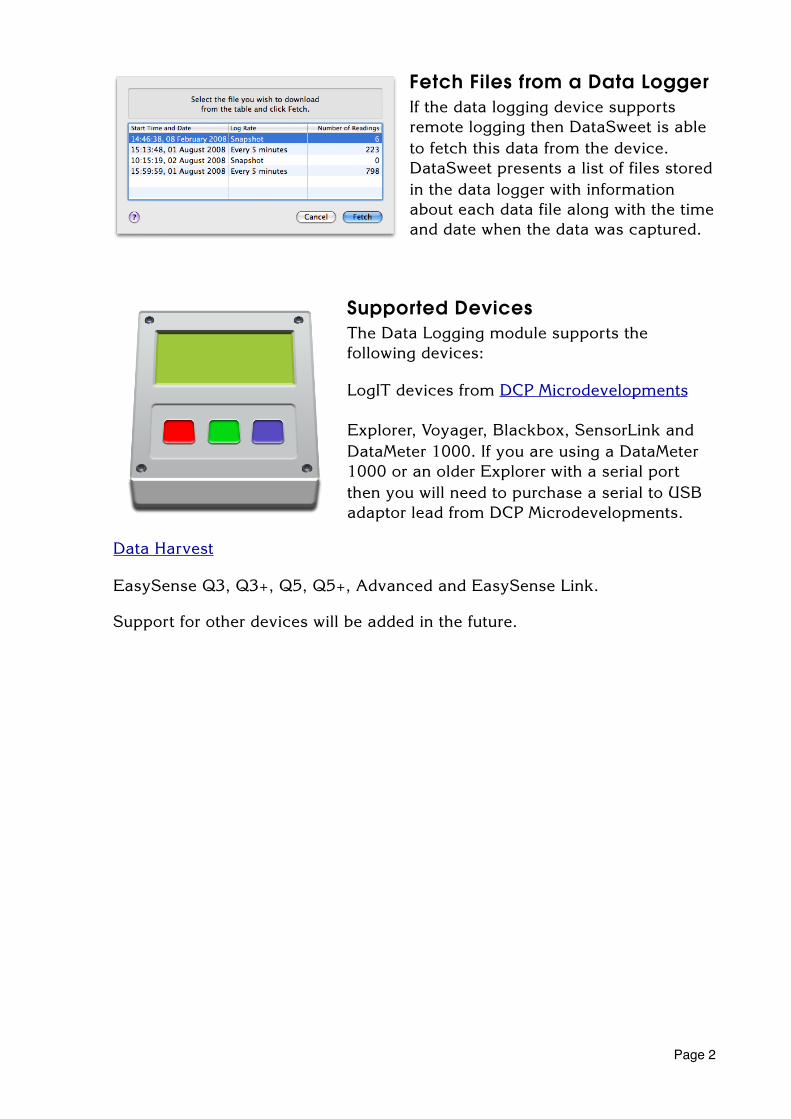
Supported Devices
The Data Logging module supports the
following devices:
LogIT devices from DCP Microdevelopments
Explorer, Voyager, Blackbox, SensorLink and
DataMeter 1000. If you are using a DataMeter
1000 or an older Explorer with a serial port
then you will need to purchase a serial to USB
adaptor lead from DCP Microdevelopments.
Data Harvest
EasySense Q3, Q3+, Q5, Q5+, Advanced and EasySense Link.
Support for other devices will be added in the future.
Page 2

System Requirements
A Macintosh computer running Mac OS X 10.4 or later, a minimum of 256 MB
of memory is recommended.
iLife ‘04 containing iMovie version 4 or higher if you wish to export and edit
an iMovie project.
The DataSweet application requires around 5 MB of disc space.
User Requirements
To be generally familiar with using the Mac OS X operating system, launching
applications, opening and saving files.
Installation
1. Insert the CD ROM into the CD/DVD ROM drive.
2. Run the DataSweet package and follow the instructions in the installer.
3. Once installation is complete, run the DataSweet application from the
Applications folder on your computer.
4. Choose Register Software… from the DataSweet application menu.
5. Enter your details and the serial number which can be found on the licence
card included in the software pack.
If you have correctly entered your serial number then the Register button
should become enabled. Click on the Register button, you should only
need to do this once.
Connecting a Data Logger
You do not need to install any drivers for use with either the DCP or Data
Harvest devices, DataSweet takes care of all of this for you.
1. Simply connect the device to a powered USB port on the Macintosh.
If DataSweet has been previously run, then by default, plugging in a
supported data logging device will automatically launch DataSweet with a
data logging template.
This document is copyright © Kudlian Software Limited 2009
This manual documents the features in DataSweet – Data Logging
Published: Monday, 20 April 2009
Page 3

Getting Started
When you launch DataSweet a new
document will be created and a
sheet will drop down asking you to
choose a DataSweet document
template.
1. Select the Data Logging template and click the Choose button. A new data
logging document will be created as shown:
The main document window displays by default a graph of any logged data.
When you create a new document there is no data to be displayed.
Page 4

Logging Data
Automatic Logging
Let’s get started and log some data so that we can see how DataSweet lets
you present your experiment.
If you have a supported device plugged into the computer then the
Start Logging item on the toolbar should be enabled.
Ensure that the device has any necessary sensors plugged in and
we’re ready to start collecting data.
Click the Start Logging button.
As the sensor values are read from the device DataSweet will display them as
a graph in the main document window. Try and get the sensors to change
their readings by either pointing a light sensor at a light source, making some
noise for a sound sensor or squeeze a temperature sensor to raise its
readings.
When you have finished click the button that now reads Stop Logging.
Underneath the graph you will see that the timeline is enabled.
Click on the play button and DataSweet will playback the graph as when it
was collecting the data.
At anytime you can pause the playback to click and drag the time marker up
and down the time line.
Changing the Time Scale
The slider to the right and under the timeline allows you to scale the time
displayed on the horizontal axis of the graph. By dragging the slider knob to
the right, you can zoom in on the graph over time. If you now playback the
graph then you will see that it scrolls along as it plays.
Changing the Playback Rate
You can also adjust the playback rate. If you have carried out a data logging
experiment over a long period of time then the graph will playback very
slowly, i.e. at the same rate as the experiment took. Increasing the playback
Page 5

rate means that you can create an animated graph playing back the
experiment much quicker. To do this:
1. Either click on the stepper buttons to the right of the playback rate text
field or click in the text field and enter a value directly.
If you have carried out an experiment over many days then you may need
to increase the playback rate to around 10,000 before you see the graph
start to draw.
The Graph pane in the inspector allows you to control how the graph is
displayed and you can use this to analysis various aspects of the data.
Page 6
Saving and Opening
Documents
DataSweet saves and opens documents in the typical way that a document
based application does on Mac OS X.
To save a document:
Choose File > Save from the menu bar.
To open a document:
Either double click on the document you wish to open from the Finder or
choose File > Open… from the menu bar and navigate to the document you
wish to open.
You can also use the File > Open Recent > item on the menu bar to quickly
open any recently saved or edited documents.
Page 7

The Inspector
The inspector window opens by default with the main document window and it
allows you to control and configure how data is logged, how the graph is
presented and also provides some analysis information as well. Each pane in
the inspector is designed to be used progressively as you carry out a data
logging experiment.
Devices
The devices pane displays a list of data
logging devices currently plugged into the
computer. Each device has a set of sensors
which may be either internal to the device or
externally plugged-in. By default all of these
sensors will be read when you start logging.
Additional information such as a device's
battery level is also shown where appropriate.
To find out information on the device and
sensors:
1. Click on the device in the device browser to
view additional information about the device
and its battery level where appropriate.
When a device is selected, clicking on the devices item in the menu bar
offers additional options such as setting its clock and a security stamp.
Some devices also support the facility to fetch data that has been logged
remotely.
2. If necessary click on the disclosure triangle to view the device's sensors.
3. Click on the sensors to view additional information on the sensors.
4. Before you start logging you can click on the check boxes to select which
sensors are going to be recorded. If you log a sensor that isn’t important to
you then you can later choose not to display that sensor in the graph,
however you cannot later retrieve a sensor’s values that were not logged.
5. Each sensor is represented by a colour on the graph. You can later change
this colour when we start to configure the graph.
Note: Do not confuse this table of devices and sensors with those shown in
the Graph pane. The devices and sensors displayed here are those that are
currently plugged into the computer whilst those shown in the graph pane are
the devices and sensors that were used when the data was logged.
Page 8

Settings
The settings pane allows you to set various
logging options before you start logging. Once
you have logged data in the document these
settings are disabled. There are three types of
logging: Automatic, Manual and Snapshot.
With automatic and manual you can set both
the log rate and the maximum number of
readings.
You also use this pane to tell DataSweet to
record video while logging data.
Automatic Logging
Automatic logging is most suitable when you do not know how long the
experiment will take. It does not require any setting up although you can set
the initial log rate and the maximum number of readings if you wish.
Once the maximum number of readings is reached, the log rate is halved and
half of the previous readings are discarded. This continues until the maximum
number of readings is reached again. When using automatic logging you must
tell DataSweet when you wish to stop logging by clicking the Stop Logging
button on the toolbar.
Manual Logging
Manual logging means that you set the rate at which you wish to capture
sensor readings and how many readings you wish to capture, together these
settings then determine how long the logging will take place and DataSweet
will display this time when you select Manual.
To increase the length of time over which logging will occur it is better to set
the log rate to a longer time than to just keep increasing the number of
readings. 1000 readings is usually enough samples to give a smooth graph.
You start logging in the same manner as automatic by clicking on the Start
Logging button. You can click on Stop Logging at any time to stop the logging
but if not then DataSweet will automatically stop logging once the required
number of readings have been sampled.
Page 9

Snapshot Logging
If Snapshot logging is selected then the sensor readings are captured on
demand and are displayed as a bar chart rather than a line graph.
To start snapshot logging:
1. Click on the Start Logging button on the toolbar.
2. Click on the Store Reading button from the toolbar or choose Analysis >
Store Reading from the menu bar. You can also use the keyboard shortcut
⎇⌘S.
3. When you have finished capturing readings, click on the Stop Logging
button.
Recording Video
For more information on recording video please refer to the Recording Video
chapter.
Meters
The meters pane shows a list of meters which
display the values of the sensors for the
currently selected item in the data table.
As data is captured the meters display the
value of each sensor at that time and they also
display the current reading when playing back
the captured data.
Page 10
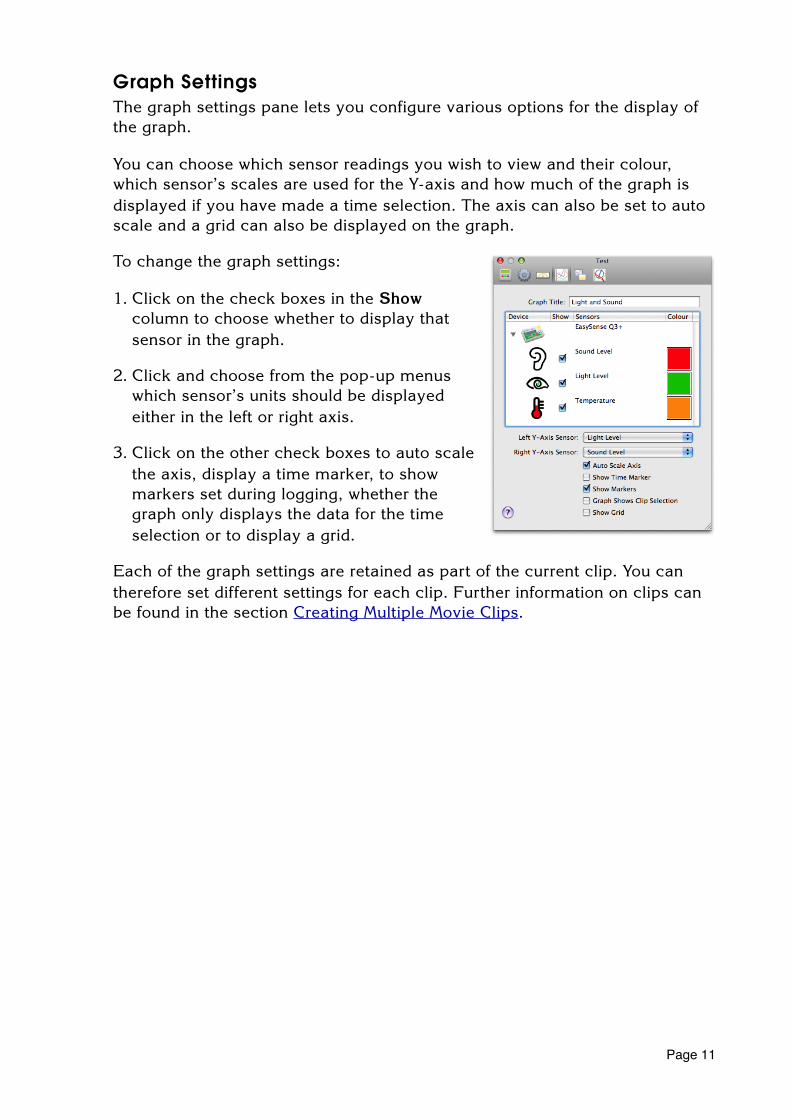
Graph Settings
The graph settings pane lets you configure various options for the display of
the graph.
You can choose which sensor readings you wish to view and their colour,
which sensor’s scales are used for the Y-axis and how much of the graph is
displayed if you have made a time selection. The axis can also be set to auto
scale and a grid can also be displayed on the graph.
To change the graph settings:
1. Click on the check boxes in the Show
column to choose whether to display that
sensor in the graph.
2. Click and choose from the pop-up menus
which sensor’s units should be displayed
either in the left or right axis.
3. Click on the other check boxes to auto scale
the axis, display a time marker, to show
markers set during logging, whether the
graph only displays the data for the time
selection or to display a grid.
Each of the graph settings are retained as part of the current clip. You can
therefore set different settings for each clip. Further information on clips can
be found in the section Creating Multiple Movie Clips.
Page 11

Layout
The layout pane allows you to set various options to configure the content of
the movie preview.
You can choose from a variety of backgrounds
and set which sensor’s meters you would like
to be displayed. Each object in the layout can
be moved around and have various settings
changed.
1. Click on the check box for each item in the
list to set whether it is displayed.
2. Each item in the preview can be dragged to
reposition it where required.
3. The video and graph can be resized in the
movie preview if they are not set as the background item.
Like the graph settings, each of the layout settings are retained as part of the
current clip. Further information on clips can be found in the section Creating
Multiple Movie Clips.
The graphic below illustrates how you can layout the movie preview:
Video Test
5000
10000
15000
Light (LUX)
50
55
60
65
70
Sound (dB)
0 5 10 15 20 25 30
Elapsed Time
Light
382 LUX
0
2000
4000
600080001000012000
14000
16000
18000
20000Sound
50 dB
50
55
60
6570 75 80
85
90
95
100
Page 12

Analysis
The analysis pane lets you smooth the
captured data and displays statistics for each
sensor.
Each sensor can have different smoothing
attributes applied and statistics for each sensor
can be selected and copied to the clipboard.
Data Smoothing
When data is captured from each sensor you
can sometimes see lines on the graph rapidly
jumping up and down over each time interval, we call this noise. It may
become obvious if you auto scale the axis with a sensor whose readings vary
over a small range, for example when looking at small rises or falls of
temperature. By smoothing the data the noise is removed and the line on the
graph will display a general trend for how the values of the sensor changed
over time.
How to smooth the captured data:
1. Select the sensor for the data you wish to smooth.
2. Click on the segmented control to either use the preset Auto settings, or
Advanced if you want more control over how the data is smoothed.
3. Repeat for any other sensors.
The data smoothing works by averaging a number of values either side of
each sample.
The greater the smoothing factor the further away from each sample is the
averaging calculated which has a greater tendency to remove large spikes.
By default we use a central moving average, that is we calculate the average
by looking at the values either side of each sample, you can also choose to
use a prior moving average which only averages the values prior, or before,
the sample being averaged. This has a tendency to drag sample values back
to the previous values thus slowing down any changes in the graph.
For each type of average you can choose whether to use an arithmetic
weighting or no weighting. The arithmetic weighting gives greater emphasis
to the sample value being averaged and less emphasis to values further away
from it. This means that any large, sudden changes in values are better
reflected in the graph.
The Auto setting uses a central moving average, with a smoothing factor of
20 with arithmetic weighting.
Page 13
Statistics
The statistics text field displays the minimum, maximum and average values
for each sensor. By clicking on this field you can select and copy the text to
the clipboard which can then be pasted either into the Notes for the
experiment or any other application that accepts text input.
Note: The values displayed are those after the data has been smoothed. This
can sometimes substantially affect the minimum and maximum values,
although the average values should remain relatively unchanged.
Page 14
Recording Video
DataSweet has the facility to record video while logging data from your
experiment. DataSweet will work with built-in and external iSight cameras, a
DV camcorder and the iMage webcam.
To record video while logging data:
1. Click on the settings button either on the main toolbar or the inspector's
toolbar.
2. In the section labelled Video: check the Record Video button.
If everything is working correctly, you should now see a preview of the
video in the graph view.
Once you start logging, the video will be recorded along with any data
logged from the logging device.
Troubleshooting Camera Problems
If you are having problems with your camera we suggest you go through each
of these check points.
• Check that there are no other applications running that are also using the
camera. These might include: iMovie, iChat, Photo Booth, I Can Animate…
• If it is a DV camcorder, you will need to ensure that the tape is removed
and that it is running from a power supply and not its battery. You should
also check that it is not configured to run in a 'demo mode'.
• If it is a webcam, you must be sure that it is compatible with your
Macintosh. We can supply small webcams that are compatible with the
Macintosh. Further information on the iMage webcam can be found here.
If you are already using the iMage webcam, please ensure that you have
installed the necessary driver for it.
• You might need to download and reinstall QuickTime. We are aware that
sometimes users do not have all the necessary QuickTime components to
use video cameras. You can download QuickTime from here.
Page 15

Fetching Data Files
DataSweet can download data files from a device that has been used to log
data remotely. To do this:
1. Select the device that you wish to fetch the data from in the devices pane in
the inspector.
2. Click on the Fetch Data item on the toolbar of the document window or
choose Device > Fetch Data from the menu bar.
If there are any data files to download then a sheet will drop down listing the
data files on the device.
The sheet will list each file in a table along with the start time and data, the
log rate and the number of readings.
3. Select the data file you wish to download and click Fetch.
The data will be downloaded and you can view and playback the graph as
you would with data that has been logged using DataSweet.
Page 16
Exporting Data and Video
DataSweet allows you to export your captured data in various formats.
Exporting the Data
Data can be exported either as CSV, (comma separated values), tab
separated values or text. The text format is the same as TAB but with the .txt
and .tsv respective file extension.
To export a data file:
1. Choose File > Export… from the menu bar.
2. Choose the appropriate file format from the pop-up menu.
3. Save the file in the usual manner.
Copy Table Data to the Clipboard
When you are viewing the table of data, the data can also be copied to the
clipboard as tab separated values. This data can be pasted into a number of
applications that paste tabular data.
To copy the table of data to the clipboard:
1. Click the Table tab button to display the table of data.
2. Click the table of data so that it has the blue focus ring around it.
3. Either choose Edit > Copy from the menu bar or use the keyboard shortcut
⌘C.
Exporting a Movie
Movies can be exported in two formats; either as a folder containing each clip
as a separate movie file or as an iMovie project. This project file is for use
with the previous version of iMovie or as it was later known iMovie HD. If you
are using iMovie 7 or later then you are better to export the folder of clips and
import each clip into iMovie.
To export a movie:
1. Choose File > Export from the menu bar.
2. Choose the appropriate movie format from the pop-up menu.
3. Save in the usual manner.
Page 17

Sharing a Movie to iTunes
DataSweet can also share your movie directly to iTunes. This is particularly
useful if you want to display your experiment on a device such as an iPod as
the movie needs to be in a particular format in order to be played on either
the classic iPod, iPod Touch or iPhone.
To send the movie to iTunes:
1. Choose Share > Send Movie to iTunes from the menu bar.
2. Select an appropriate format from the pop-up menu and click Export.
Copying the Graph to the Clipboard
You can also copy the graph, and any displayed meters and video to the
clipboard as a single graphic for pasting into another application that
supports the pasting of graphic files. The graphic is copied to the clipboard as
both a loss less PDF and TIFF formatted graphic. This means that if the PDF
graphic is pasted into an application the resolution of all the graphics and
shadings remains beautifully sharp and crisp at high resolutions.
To copy the graph to the clipboard:
1. Click the Graph tab button to display the table of data.
2. Click on the graph so that it has the blue focus ring around it.
3. Either choose Edit > Copy from the menu bar or use the keyboard shortcut
⌘C.
Page 18

Creating Multiple Movie Clips
You may find during your experiment that there a number of interesting
moments that you only wish to include in your movie. You can do this by
selecting a region of the graph by clicking and dragging the selection markers
on the time line.
Under the time line there is a disclosure button labelled Show Clips.
1. Click on the Show Clips disclosure button to reveal the clips drawer.
By default there is always at least one clip and you cannot delete it. Many of
the graph and layout settings are contained within the selected clip. When you
have the selection and layout that you wish, clicking on the + button in the
clips drawer will create and select a duplicate clip. Now any changes you
make to the graph settings and layout, including the time selection, will be
part of the new clip. Changing the selected clip will change the selection and
layout for that clip. Each clip can also be given a name which is used when
the clip is exported as an iMovie project.
Once you have exported the clips you can import them into an application
such as iMovie to add transitions, titles and perhaps a voice over to the movie
presentation.
Page 19

Miscellaneous Settings
There are various features within DataSweet that you can use to help
administer your data logging devices. If any of these menu items are disabled
it is because either you do not have the device selected in the devices browser
in the inspector or because the device does not support this feature.
Set Date and Time
Some data logging devices will allow you to use the computer to set their
internal clock’s date and time. This can be easier than trying to do it through
the device’s interface. To set the date and time:
1. Select the device in the Devices pane in the inspector.
2. Choose Device > Set Date and Time from the menu bar.
Set Security Stamp
Some data logging devices allow you to set a security stamp so that you can
uniquely identify the device. Currently this is only supported by Explorer,
Voyager and Blackbox. If the device supports this feature and the security
stamp can be read then DataSweet uses this text within the devices browser in
the inspector. To set the security stamp:
1. Select the device in the Devices pane in the inspector.
2. Choose Device > Set Security Stamp from the menu bar.
A sheet will appear that requests the text for the security stamp and a
password to protect students from setting this to an undesirable value.
Upload System Software
Some data logging devices allow you to update the system software that is
used in the device. To update the system software:
1. Select the device in the Devices pane in the inspector.
2. Choose Device > Upload System Software from the menu bar.
This item may also be disabled if the device already has the most up-to-
date system software.
Page 20