Light Emitting Diode (LED) Street and Area Lighting Reportled... · LED Street and Area Lighting...
29
Light Emitting Diode (LED) Street and Area Lighting Report July 2013
Transcript of Light Emitting Diode (LED) Street and Area Lighting Reportled... · LED Street and Area Lighting...
Light Emitting Diode (LED) Street and Area Lighting Report
July 2013

LED Street and Area Lighting Report Ameren Missouri
Page 2
Table of Contents
Executive Summary ....................................................................................................................................... 3
Key Issues ...................................................................................................................................................... 6
Cost-effectiveness ......................................................................................................................................... 7
DSMore Modeling ..................................................................................................................................... 9
Revenue Requirement Modeling ............................................................................................................ 12
Risk and Uncertainty ............................................................................................................................... 13
Financial Impacts to Ameren .................................................................................................................. 17
Rate Design ................................................................................................................................................. 18
Conclusions ................................................................................................................................................. 18
Appendices .................................................................................................................................................. 19
Appendix A – Street and Area Lighting Replacement Data ................................................................... 19
Appendix B: EPRI Report Summary ......................................................................................................... 20
Appendix C: Procurement Standard Draft .............................................................................................. 26
Ameren Missouri LED Street and Area Lighting Report
Page 3
Executive Summary Key Insights
• A recent EPRI study concluded that light-emitting diode (LED) street and area lighting (SAL) technology is ready for utility adoption.
• Although LED SAL technology may be ready for efficiency programs, the technology is not yet cost-effective for all LED lighting applications.
• Key uncertain factors regarding LED SAL cost-effectiveness include the labor cost of installation, maintenance trip savings, LED price trends, and the effective useful life of LED SAL.
• Potential stranded costs and regulatory lag in Missouri are additional implementation barriers for LED SAL.
• There is a high level of risk and uncertainty associated with installing LED SAL. • Ameren Missouri will enhance customer choice of light options by proposing a tariff to allow
customers to own and install LED SAL.
Ameren Missouri has been proactive in monitoring the status of LED technology. The Company engaged the Electric Power Research Institute (“EPRI”) to conduct a pilot program, testing 11 street lights in the city of Ballwin, Missouri beginning in 2009 and lasting approximately 36 months. This pilot, part of a larger, national effort, provided key insights into the performance of LED SAL technology.
While there were multiple findings from the report, there were a few important observations to note:
• Reliability –EPRI uncovered multiple issues with the products submitted in the demonstration project including failures directly “out of the box” from the manufacturer, failures caused by faulty circuitry, LED driver failure, and manufacturer recalls.
• Varying Power Draw Compared to Specifications – EPRI discovered that many of the manufacturers’ claims on power draw were optimistic and inconsistent with their field testing results.
• Good light distribution – LEDs were able to produce lighting patterns more uniformly than existing lighting technologies.
Overall, EPRI's study indicated that the LED SAL technology was “ready for energy efficiency programs for utilities.” The scope of EPRI's study was limited to the feasibility of the technology; therefore, no economic analyses were conducted (see Appendix B for a full summary of the EPRI report). Given EPRI’s findings, Ameren Missouri undertook a study of the economics of replacing its existing street lighting system with LEDs1 (Company owned street lights which represent greater than 90% of the street lights on Ameren Missouri’s system). Ameren Missouri conducted multiple analyses to evaluate the economics of LED street lighting facilities and also conducted multiple risk analyses to provide more insight into the results.
1 This effort was spurred by testimony filed by Missouri Public Service Commission Staff in ER-2011-0028.

LED Street and Area Lighting Report Ameren Missouri
Page 4
Two stages of analysis were utilized to evaluate cost-effectiveness; the first stage was a detailed screening analysis using the DSMore modeling tool and the second stage was an Excel-based revenue requirement model built by the Company. DSMore is the same tool that Ameren Missouri used to evaluate its recently approved energy efficiency programs. This tool, built by Integral Analytics, is the leading demand side management (DSM) cost-effectiveness model and is used in more than 27 states for DSM program planning. Although the DSMore tool is very powerful, to more accurately model the revenue requirement impacts associated with capitalizing long-lived assets, an Excel-based model was utilized. The Excel-based model used the quantified energy benefits directly from DSMore to ensure maximum consistency between the two models. The flexibility of the DSMore model makes it a good screening tool to find trends in the analysis, but the Excel-based model represents a more accurate representation of the costs and benefits.
The economic modeling has shown that an outright replacement of all existing street lights with LEDs is not cost-effective at this time. Although LEDs do save energy, the primary value proposition of LEDs is the longer economic life and associated reduction in maintenance trips to replace existing lamps. However, these benefits are rarely enough to overcome the up-front capital cost of the more expensive LED lights. This initial cost is still a major hurdle to adoption for both customers and the Company.
There are four key input assumptions that drive the economic modeling results:
• The labor rate for installing the new LEDs • The time associated with changing-out existing light bulbs (i.e. avoided maintenance trip costs) • The forecasted LED price trend, and • The LED effective useful life.
While some of these assumptions may appear trivial, they can have significant influence on the results. Ameren Missouri conducted multiple sensitivity analyses to estimate the impacts of changing each of these uncertain factors. For instance, when reviewing the impacts of changing the operation and maintenance (O&M) time to change an existing lamp, the net benefits can swing from -$7 million in the unfavorable case to $4 million in the favorable case, an $11 million change in net benefits.
Another key finding of the LED business case is a deeper understanding of the value proposition. While it is true the LEDs save energy (anywhere from 10 – 80% depending on the light being replaced), the LED capital cost can be up to 4 times greater than the existing baseline lights. Furthermore, when the existing 5(M) rate (Company owned lighting) structure is reviewed, the variable energy component only represents approximately 9% of the monthly cost of an individual light. The existing poles, wiring, transmission system, and other infrastructure would still be utilized for the LEDs and there would be no savings associated with these underlying cost components. This is supported by the EPRI report:
“Both laboratory and field results support the claim that a fixture using LED technology can in some applications provide acceptable illumination and energy savings. Saving money, however, is another
issue. Many city engineers and politicians are surprised to learn that a 50% reduction in fixture energy use does not typically equal a 50% reduction in their electricity bill. The savings may be closer to 15%,
Ameren Missouri LED Street and Area Lighting Report
Page 5
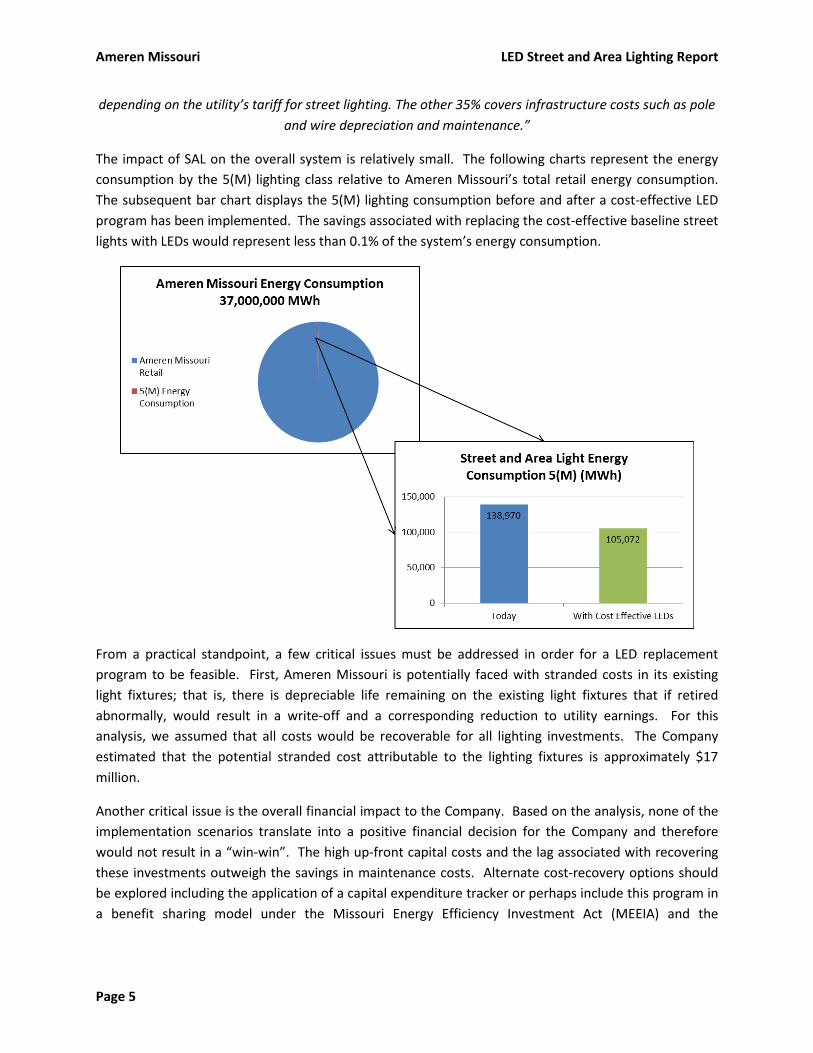
depending on the utility’s tariff for street lighting. The other 35% covers infrastructure costs such as pole and wire depreciation and maintenance.”
The impact of SAL on the overall system is relatively small. The following charts represent the energy consumption by the 5(M) lighting class relative to Ameren Missouri’s total retail energy consumption. The subsequent bar chart displays the 5(M) lighting consumption before and after a cost-effective LED program has been implemented. The savings associated with replacing the cost-effective baseline street lights with LEDs would represent less than 0.1% of the system’s energy consumption.
From a practical standpoint, a few critical issues must be addressed in order for a LED replacement program to be feasible. First, Ameren Missouri is potentially faced with stranded costs in its existing light fixtures; that is, there is depreciable life remaining on the existing light fixtures that if retired abnormally, would result in a write-off and a corresponding reduction to utility earnings. For this analysis, we assumed that all costs would be recoverable for all lighting investments. The Company estimated that the potential stranded cost attributable to the lighting fixtures is approximately $17 million.
Another critical issue is the overall financial impact to the Company. Based on the analysis, none of the implementation scenarios translate into a positive financial decision for the Company and therefore would not result in a “win-win”. The high up-front capital costs and the lag associated with recovering these investments outweigh the savings in maintenance costs. Alternate cost-recovery options should be explored including the application of a capital expenditure tracker or perhaps include this program in a benefit sharing model under the Missouri Energy Efficiency Investment Act (MEEIA) and the
LED Street and Area Lighting Report Ameren Missouri
Page 6
Commission's MEEIA rules. Regardless of the implementation path, full recovery of costs is necessary for this program to be a viable and attractive investment opportunity.
The overall conclusion is that while LEDs appear to be a viable technology, current economics and associated uncertainty do not support near-term adoption. Ameren Missouri will continue to monitor the various critical assumptions identified through this analysis, and will update the analysis as needed. In the meantime, Ameren Missouri will file a tariff that will allow customers the choice to install LED street and area lights when the light is purchased, owned, and maintained by the customer.
Key Issues Several issues have been identified by Ameren Missouri regarding LED technology. Based upon the results of this analysis, Ameren Missouri was able to advance its level of understanding for each issue.
First cost is a significant hurdle to overcome and has proven to be a main driver of cost-effectiveness. The LED cost estimates were obtained by working directly with a manufacturer who provided price quotes for multiple types of lights (post top, open bottom, closed bottom, etc.) and at levels that would reflect large-scale change-outs (i.e. bulk pricing). It is important to note, however, that while there have been historically steep declines in prices, those are not likely to continue as fixture designs are maturing. Operational issues identified by the EPRI study resulted in several failures associated with the fixtures. Many of these issues were manufacturer recalls, but Ameren Missouri believes most of these issues have been addressed through manufacturer experience and the market maturing. LED quality has advanced considerably over the past four years as manufacturers have been forced to improve production quality to meet utility procurement standards. National agencies developing quality standards have also improved the operational failure issues witnessed in the EPRI project (which did not fully exist at the time of EPRI's study). Procurement issues have been addressed by applying the American National Standards Institute’s specification 136.37-2011 and the Department of Energy’s Municipal Solid-State Street Lighting Consortium specifications to develop a hybrid procurement specification that Ameren Missouri would anticipate implementing. A copy of this draft procurement specification is attached as Appendix C to this document.
Equivalent lighting types have been identified for all types of 5(M) lights on its system, including roadway lighting, post-top lighting, and area lighting applications.
Cost – effectiveness testing has been completed using DSMore and an Excel based revenue requirement model the company created.
Other issues have been identified. First, there are inventory-related costs of stocking new LED light fixtures. The overall impact on inventory costs was determined to be minimal in this analysis, as Ameren Missouri can implement various control measures to mitigate the cost impact. No inventory cost impacts were included in this study. Manpower is another issue that will become clearer if a

Ameren Missouri LED Street and Area Lighting Report
Page 7
detailed implementation plan is developed. There could be a mix of internal labor and hired contractors completing this work but those detailed implementation complexities have not been explored at this point. There are also early replacement and disposal costs which were determined to be insignificant to the results of the analysis. While this analysis assumed no stranded cost recovery issues in the modeling, there is no clear indication on how this would ultimately be resolved. Finally, there were no disposal costs included in the cost-effectiveness because it was assumed that the recycling benefits will offset those costs.
Cost-effectiveness Ameren Missouri completed the cost-effectiveness analysis in two stages. First a detailed screening analysis was completed using DSMore and then a revenue requirement analysis was completed for those LED SAL that passed the initial screening analysis. The Company then performed additional risk and uncertainty analyses to test the impact of key uncertain factors on the net benefit results. The following graphic illustrates the analytic process used.
Figure 1: LED Analytic Process Flow

LED Street and Area Lighting Report Ameren Missouri
Page 8
There are several input variables that the Company used to investigate a Company-owned street light replacement program. These inputs were used in both models.
Annual Turn-over rate – how many lights does Ameren Missouri replace each year? To estimate the annual turnover by lighting type, three different sources were utilized to triangulate to an answer. Ameren Missouri worked with its procurement team to identify the number of bulbs and fixtures purchased each year and then its operations handling store to identify how many bulbs and fixtures were issued for replacement each year. As a third source, Ameren Missouri reviewed and manufacturer estimates on life of bulb, as measured in total hours. Using all of this data and the mix of wattages in the field, 16.6% was used as turnover rate.
Hourly Labor rate – to estimate the maintenance trip savings (O&M) as well as the capital expenditure labor for installing LED lights, Ameren Missouri utilized a productive hourly labor rate of $189.80. This rate represents an “all-in” cost representing not only labor, but benefits, transportation, supervision, customer support, engineering, tools, and supplies required to perform the multiple job functions linemen complete on a daily basis.
Maintenance Trip Time –with a 16.6% turnover rate, there is significant and ongoing annual expense to change lamps for existing street light technologies. Estimating these avoided maintenance trip costs is a crucial part of the analysis. One hour was used as the time required to change an existing lamp, which came from an internal analysis of various street lighting related jobs completed in the past. This encompasses driving time, set-up, actual change-out, and any other activities that are required during a change-out. This assumes one lineman is replacing the existing bulb.
LED Life – One of the difficulties in evaluating LED technologies is the estimation of how long LEDs will last. Manufacturers claim anywhere from 15 – 25 years, but in reality, mature LED lighting technology has not been around long enough for appropriate testing to be conclusive. As a base assumption, Ameren Missouri used 15 years, which is in line with many manufacturer estimates.
LED Fixture Cost and Replacement Wattage – Ameren Missouri worked extensively to gather the best market data for LED equivalent replacements. Both replacement wattages and costs were derived from manufacturer quotes. Appendix A contains a table of the lighting technologies evaluated which includes the baseline characteristics compared to the equivalent LED characteristics.
LED Cost Trend – Based on market data gathered, the EPRI pilot, and speaking with industry professionals, it appears that the dramatic cost decreases witnessed over the last 4 years will slow. To assess this uncertainty, several declining price scenarios were evaluated, ranging from 3% to 10% annually.
LED installation time – Ameren Missouri field operations estimates and experience gained from the EPRI pilot indicate that fixture replacement takes a two-man crew 0.75 hours to complete.
Baseline Fixture/Lamp Costs – These costs were provided by the internal Ameren Missouri Energy Standards department and reflect the cost, by wattage, of the light bulb and the fixture.
Ameren Missouri LED Street and Area Lighting Report
Page 9
Additional lighting control technologies – Ameren Missouri did not account for any additional costs associated with control technologies that would allow the utility to monitor, control light output, and other automation options. This technology is still immature and in an even earlier stage of development relative to LEDs. Including these costs would have a significant negative impact on the cost-effectiveness as it would increase the fixture price by nearly 50%.
Disposal costs/recycling benefits – The Company receives, on average, $0.31/lb. of iron and aluminum associated with the fixtures and lamps it recycles. The cost of preparing the materials for recycling is $0.20/lb. In 2012, Ameren Missouri recycled approximately 131,000 pounds of lighting materials, equating to $14,324 in net benefits. If we multiply this by 6 (17% turnover rate), the total net benefit for replacing the entire system would be about $86,000. Even in this extreme case, this variable would not have a material impact on the results and was therefore not included in the modeling
Inventory –As we target and replace existing mercury vapor and high pressure sodium fixtures, we would be increasing the number of LED units in stock. The overall cost impact of such an exercise is minimal and would have little or no financial impacts on the results of this study. There are several ways for Ameren Missouri to actively monitor and manage the inventory costs which include developing an implementation timeline identifying number of lights needed to be ordered each year and have sufficient stock of LEDs to replace to limit the potential for large swings in inventory levels. Another consideration in assessing the inventory cost is the reduction in stock keeping units (SKU) of the baseline technology. While LEDs are considerably more expensive initially, one LED fixture can replace multiple types of HPS/MV lights, therefore, the number of different light fixtures in inventory would likely be reduced. Overall, while this is an issue Ameren Missouri would continuously monitor, including any impacts in this study would not have a meaningful affect the results.
DSMore Modeling The DSMore cost-effectiveness tool is utilized for demand side management analyses, including Ameren Missouri’s most recent MEEIA filing. The power of DSMore lies in its ability to process millions of calculations resulting in thousands of cost effectiveness results that vary with weather and/or market prices. DSMore is utilized as a first stage screening tool to identify those technologies that are cost-effective. The primary metric used to evaluate cost-effectiveness is the Total Resource Cost (TRC). This test measures the benefits and costs from the perspective of the utility and the system as a whole. The benefits are the net present value of the energy saved by the measures. . In this analysis, no demand savings were included since the lights are not active during system peak periods. The costs are the net present value of all costs to implement those measures. While DSMore can perform multiple cost-effectiveness tests, only the TRC was used in this analysis. The Participant Cost Test (PCT) and Ratepayer Impact Test (RIM) are irrelevant in the replacement scenarios where 100% of the Company owned lights are replaced as there is no distinction between participants and non-participants within the 5(M) lighting class. In addition, there is no distinction between the Utility Cost Test and the TRC because there are no additional "out of pocket" costs for participants since all costs are captured in the revenue requirement.

LED Street and Area Lighting Report Ameren Missouri
Page 10
For the LED SAL analysis, a key consideration is the value of avoided maintenance costs. Because LEDs last two to three times longer, there are significant benefits through the reduction in maintenance trips. The analysis assumed that fixtures are replaced in groups as opposed to sporadically replacing fixtures when lamps burn out. A primary reason for using group replacement was the probability of customer resentment associated with having mixed lighting technologies on the same street, each with very different photometric characteristics. Using the base assumptions in this analysis, we assumed both high pressure sodium (HPS) and mercury vapor (MV) lights last 6 years and the replacement LED lasts 15 years. This indicates a savings of two maintenance trips, but not all of these benefits will be observed in a single year since Ameren Missouri has an approximate 16.6% turnover rate of existing lights (i.e. a replacement every six years). In reality, only one sixth of the benefits occur every year, which has a smoothing effect on the benefit stream in comparison to lumping the avoided maintenance trips in the replacement year.
To arrive at an incremental cost estimate, the present value of the avoided maintenance trips plus the equipment cost of the baseline light are calculated over the life of the LED (15 years). This is compared to the up-front capital cost of the LED and associated labor to install the fixture, which is required since a retrofit into the existing fixture is not recommended.
The energy savings are calculated in a straightforward manner. The wattage of the existing light less the wattage of the replacement:
𝑘𝑊ℎ 𝑠𝑎𝑣𝑖𝑛𝑔𝑠 = (𝐻𝑃𝑆/𝑀𝑉 𝑤𝑎𝑡𝑡𝑎𝑔𝑒 − 𝐿𝐸𝐷 𝑤𝑎𝑡𝑡𝑎𝑔𝑒) ∗ 𝐴𝑛𝑛𝑢𝑎𝑙 𝐵𝑢𝑟𝑛 𝐻𝑜𝑢𝑟𝑠
1000
Where: • HPS/MV wattage = wattage of the existing lighting system • LED wattage = wattage of replacement LED fixture • Annual Burn Hours = 4,000 per existing lighting tariffs 5(M) and 6(M).
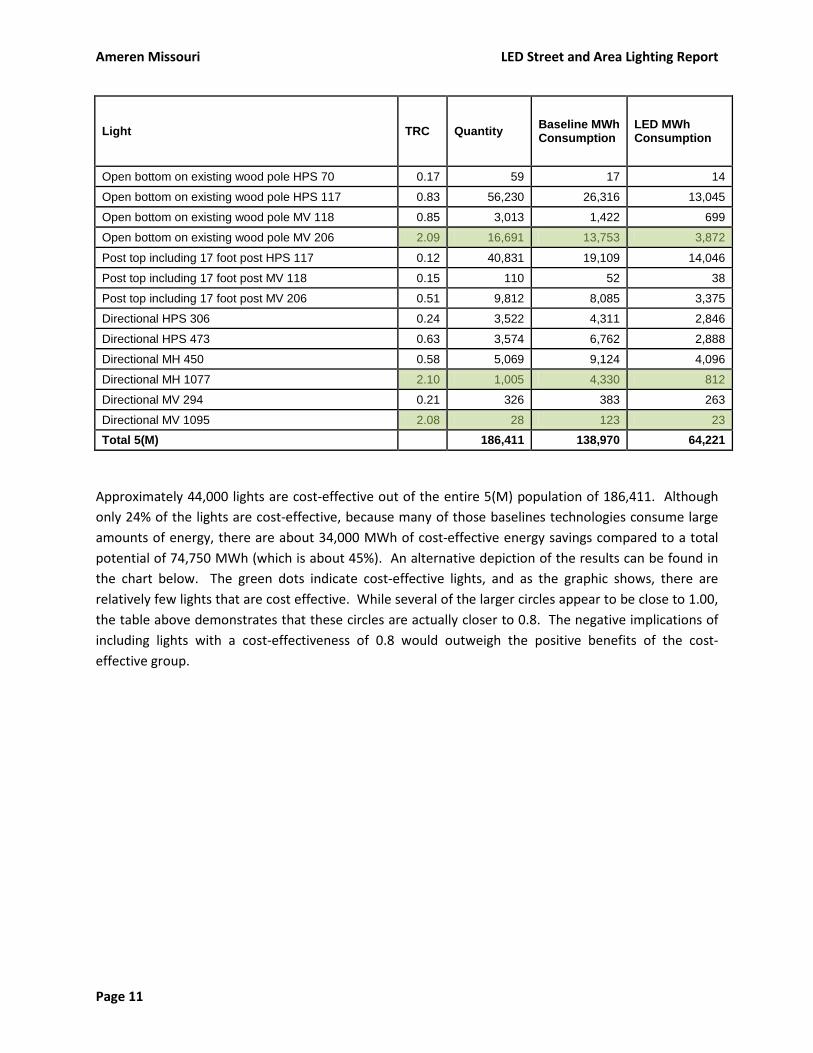
Measure level estimates for every lighting type within the 5(M) rate class was conducted (except for incandescent and legacy, grandfathered lights prior to April 9, 1986). The results are summarized in the table below and the technologies that are cost-effective are highlighted.
Table 1: DSM Cost-effectiveness Screening Results
Light TRC Quantity Baseline MWh Consumption
LED MWh Consumption
Horizontal - enclosed on existing wood pole HPS 117 0.83 16,975 7,944 3,938
Horizontal - enclosed on existing wood pole HPS 306 0.96 13,639 16,694 7,092
Horizontal - enclosed on existing wood pole HPS 473 0.54 2,993 5,663 3,089
Horizontal - enclosed on existing wood pole MV 206 2.09 8,506 7,009 1,973
Horizontal - enclosed on existing wood pole MV 477 1.89 3,952 7,540 2,055
Horizontal - enclosed on existing wood pole MV 1095 3.63 76 333 56
Ameren Missouri LED Street and Area Lighting Report
Page 11
Light TRC Quantity Baseline MWh Consumption
LED MWh Consumption
Open bottom on existing wood pole HPS 70 0.17 59 17 14
Open bottom on existing wood pole HPS 117 0.83 56,230 26,316 13,045
Open bottom on existing wood pole MV 118 0.85 3,013 1,422 699
Open bottom on existing wood pole MV 206 2.09 16,691 13,753 3,872
Post top including 17 foot post HPS 117 0.12 40,831 19,109 14,046
Post top including 17 foot post MV 118 0.15 110 52 38
Post top including 17 foot post MV 206 0.51 9,812 8,085 3,375
Directional HPS 306 0.24 3,522 4,311 2,846
Directional HPS 473 0.63 3,574 6,762 2,888
Directional MH 450 0.58 5,069 9,124 4,096
Directional MH 1077 2.10 1,005 4,330 812
Directional MV 294 0.21 326 383 263
Directional MV 1095 2.08 28 123 23
Total 5(M) 186,411 138,970 64,221
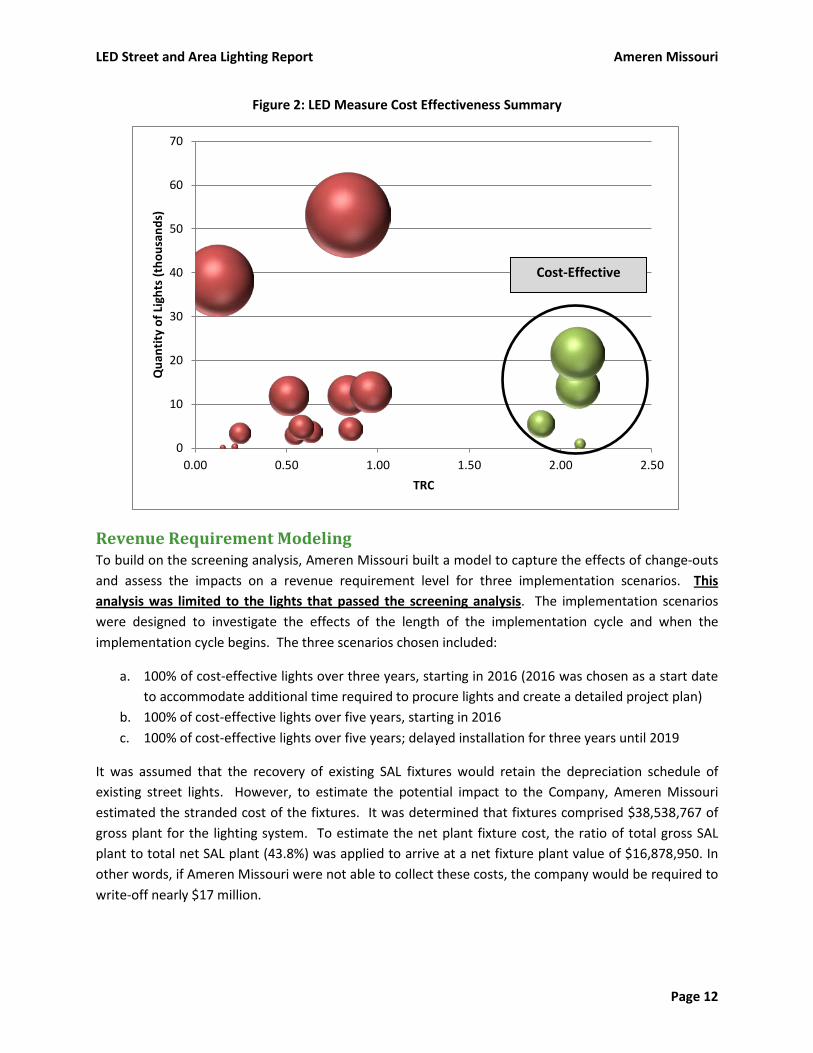
Approximately 44,000 lights are cost-effective out of the entire 5(M) population of 186,411. Although only 24% of the lights are cost-effective, because many of those baselines technologies consume large amounts of energy, there are about 34,000 MWh of cost-effective energy savings compared to a total potential of 74,750 MWh (which is about 45%). An alternative depiction of the results can be found in the chart below. The green dots indicate cost-effective lights, and as the graphic shows, there are relatively few lights that are cost effective. While several of the larger circles appear to be close to 1.00, the table above demonstrates that these circles are actually closer to 0.8. The negative implications of including lights with a cost-effectiveness of 0.8 would outweigh the positive benefits of the cost-effective group.
LED Street and Area Lighting Report Ameren Missouri
Page 12
Figure 2: LED Measure Cost Effectiveness Summary
Revenue Requirement Modeling To build on the screening analysis, Ameren Missouri built a model to capture the effects of change-outs and assess the impacts on a revenue requirement level for three implementation scenarios. This analysis was limited to the lights that passed the screening analysis. The implementation scenarios were designed to investigate the effects of the length of the implementation cycle and when the implementation cycle begins. The three scenarios chosen included:
a. 100% of cost-effective lights over three years, starting in 2016 (2016 was chosen as a start date to accommodate additional time required to procure lights and create a detailed project plan)
b. 100% of cost-effective lights over five years, starting in 2016 c. 100% of cost-effective lights over five years; delayed installation for three years until 2019
It was assumed that the recovery of existing SAL fixtures would retain the depreciation schedule of existing street lights. However, to estimate the potential impact to the Company, Ameren Missouri estimated the stranded cost of the fixtures. It was determined that fixtures comprised $38,538,767 of gross plant for the lighting system. To estimate the net plant fixture cost, the ratio of total gross SAL plant to total net SAL plant (43.8%) was applied to arrive at a net fixture plant value of $16,878,950. In other words, if Ameren Missouri were not able to collect these costs, the company would be required to write-off nearly $17 million.
0
10
20
30
40
50
60
70
0.00 0.50 1.00 1.50 2.00 2.50
Qua
ntity
of L
ight
s (t
hous
ands
)
TRC
Cost-Effective
Ameren Missouri LED Street and Area Lighting Report
Page 13
The analytic approach for the revenue requirements analysis used a stock accounting model. The first step is to identify the existing stock of lights classified by wattage, fixture type, technology type, and rate class. This data came from the Company’s Customer Service System. Each implementation scenario was modeled according to a timeline where existing technologies are phased out proportionally and replaced with LEDs. The model accounts for the additional capital for the new LEDs, the maintenance savings attributable to LEDs, and the energy savings of LEDs (which were taken from DSMore).
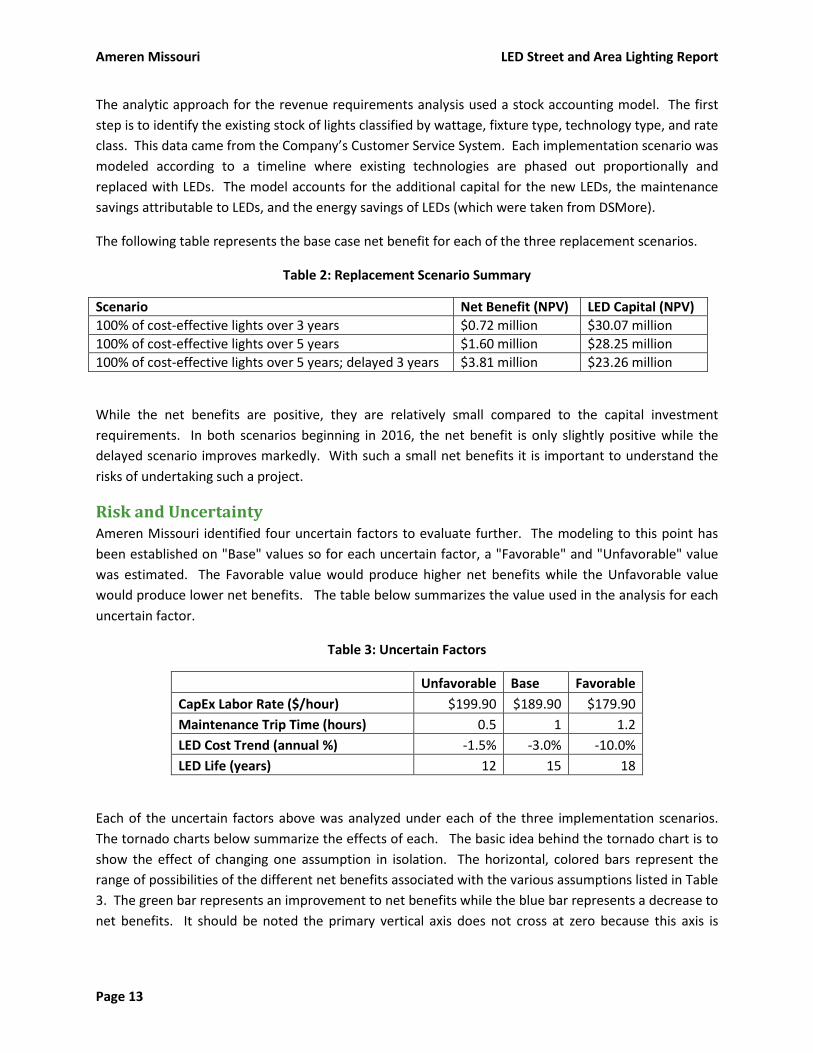
The following table represents the base case net benefit for each of the three replacement scenarios.
Table 2: Replacement Scenario Summary
Scenario Net Benefit (NPV) LED Capital (NPV) 100% of cost-effective lights over 3 years $0.72 million $30.07 million 100% of cost-effective lights over 5 years $1.60 million $28.25 million 100% of cost-effective lights over 5 years; delayed 3 years $3.81 million $23.26 million
While the net benefits are positive, they are relatively small compared to the capital investment requirements. In both scenarios beginning in 2016, the net benefit is only slightly positive while the delayed scenario improves markedly. With such a small net benefits it is important to understand the risks of undertaking such a project.
Risk and Uncertainty Ameren Missouri identified four uncertain factors to evaluate further. The modeling to this point has been established on "Base" values so for each uncertain factor, a "Favorable" and "Unfavorable" value was estimated. The Favorable value would produce higher net benefits while the Unfavorable value would produce lower net benefits. The table below summarizes the value used in the analysis for each uncertain factor.
Table 3: Uncertain Factors
Unfavorable Base Favorable
CapEx Labor Rate ($/hour) $199.90 $189.90 $179.90 Maintenance Trip Time (hours) 0.5 1 1.2 LED Cost Trend (annual %) -1.5% -3.0% -10.0% LED Life (years) 12 15 18
Each of the uncertain factors above was analyzed under each of the three implementation scenarios. The tornado charts below summarize the effects of each. The basic idea behind the tornado chart is to show the effect of changing one assumption in isolation. The horizontal, colored bars represent the range of possibilities of the different net benefits associated with the various assumptions listed in Table 3. The green bar represents an improvement to net benefits while the blue bar represents a decrease to net benefits. It should be noted the primary vertical axis does not cross at zero because this axis is

LED Street and Area Lighting Report Ameren Missouri
Page 14
measuring the net benefit. In the first chart, the vertical axis aligns at $0.7 million (i.e. the net benefit if all uncertain factors are set at the baseline).

Ameren Missouri LED Street and Area Lighting Report
Page 15
These charts are telling of which assumptions have the largest impact on the results. In a majority of the cases, the maintenance trip time has the largest impact on the results no matter the implementation scenario. In reviewing the first chart, if we hold all other assumptions constant, but only change the maintenance trip time required to change an existing light, the result would be a net cost of $7 million (which is a negative net benefit) in the unfavorable scenario (0.5 hours), but could improve to $4 million of net benefits if the favorable assumption is true (1.2 hours). It is evident that in all implementation scenarios, the independent uncertain factors of avoided maintenance costs and LED useful life are significant enough factors to eliminate all net benefits. The delayed implementation scenario has overall better results but still faces significant risk of resulting in little or no net benefits.
While the tornado charts above captured the effects on the net benefit by changing each of the uncertain factors in isolation, it is valuable to look at how each combination of uncertain factors affect the results. A total of 81 possible outcomes were analyzed by combining all four uncertain factors with each of their three scenario values. The chart below plots all 81 permutations for each implementation scenario which shows the continuum and range of the analyzed outcomes. This analysis shows that in the first two implementation scenarios beginning in 2016, approximately 55% of the combinations yield a positive benefit. This number increases substantially when delaying the start until 2019, where almost 72% of the combinations produce a positive net benefit. This speaks to the value of delaying the implementation to achieve savings associated with lower LED costs and higher energy benefits.

LED Street and Area Lighting Report Ameren Missouri
Page 16
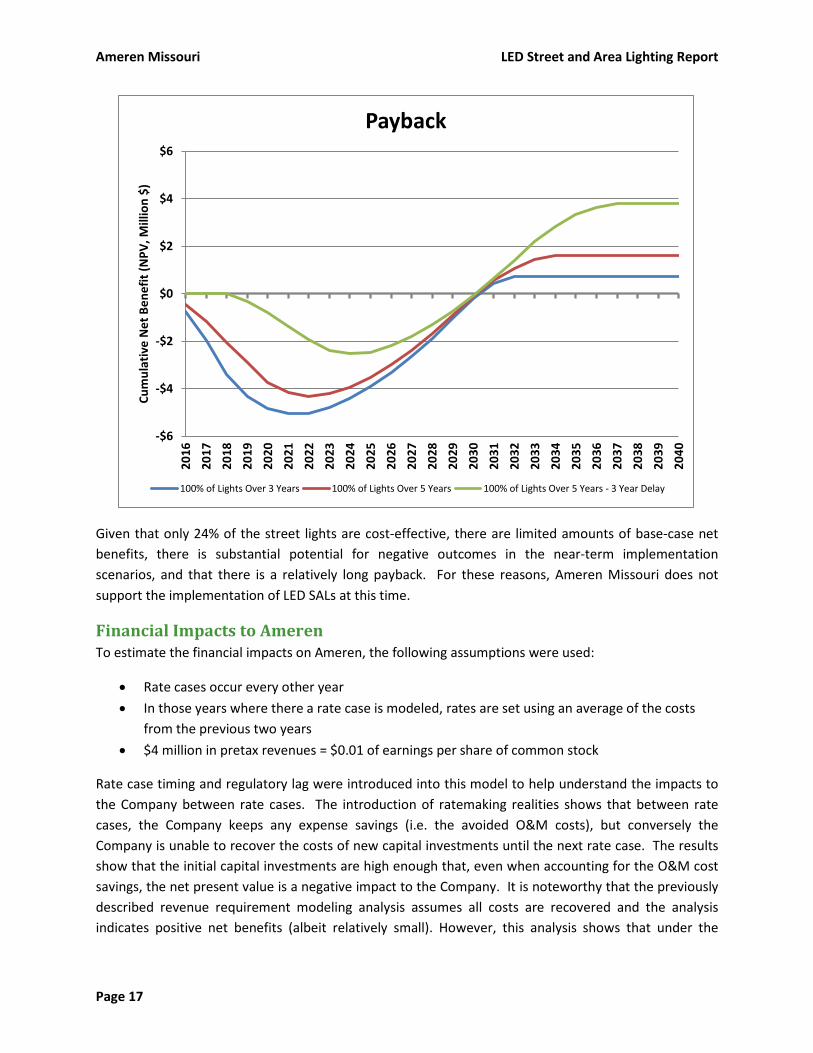
Another way to evaluate the risk is to estimate the length of time required to pay back the investment. The charts below illustrate the cumulative present value of net benefits by year. When the line crosses above the horizontal axis, then the net benefits are positive. The point where the horizontal axis is crossed indicates how many years it takes to achieve payback. The implementation scenarios that start in 2016 take 15 years to payback while the delayed case takes 12 year to payback. Again, pointing to the benefits of waiting.
($15)
($10)
($5)
$0
$5
$10
$15
$20
1 11 21 31 41 51 61 71 81
Net
Ben
efit
($ m
illio
ns)
Risk Sensitivity
100% of Lights Over 3 Years
100% of Lights Over 5 Years
100% of Lights Over 5 Years - 3 Year Delay
Ameren Missouri LED Street and Area Lighting Report
Page 17
Given that only 24% of the street lights are cost-effective, there are limited amounts of base-case net benefits, there is substantial potential for negative outcomes in the near-term implementation scenarios, and that there is a relatively long payback. For these reasons, Ameren Missouri does not support the implementation of LED SALs at this time.
Financial Impacts to Ameren To estimate the financial impacts on Ameren, the following assumptions were used:
• Rate cases occur every other year • In those years where there a rate case is modeled, rates are set using an average of the costs
from the previous two years • $4 million in pretax revenues = $0.01 of earnings per share of common stock
Rate case timing and regulatory lag were introduced into this model to help understand the impacts to the Company between rate cases. The introduction of ratemaking realities shows that between rate cases, the Company keeps any expense savings (i.e. the avoided O&M costs), but conversely the Company is unable to recover the costs of new capital investments until the next rate case. The results show that the initial capital investments are high enough that, even when accounting for the O&M cost savings, the net present value is a negative impact to the Company. It is noteworthy that the previously described revenue requirement modeling analysis assumes all costs are recovered and the analysis indicates positive net benefits (albeit relatively small). However, this analysis shows that under the
-$6
-$4
-$2
$0
$2
$4
$6
2016
2017
2018
2019
2020
2021
2022
2023
2024
2025
2026
2027
2028
2029
2030
2031
2032
2033
2034
2035
2036
2037
2038
2039
2040
Cum
ulat
ive
Net
Ben
efit
(NPV
, Mill
ion
$)
Payback
100% of Lights Over 3 Years 100% of Lights Over 5 Years 100% of Lights Over 5 Years - 3 Year Delay

LED Street and Area Lighting Report Ameren Missouri
Page 18
current ratemaking paradigm in Missouri, the Company would not recover all of its costs. The table below summarizes the analysis for each scenario.
Table 4: Ameren Financial Impacts
Implementation Scenario NPV of After Tax Earnings 100% over 3 years -$1.44 million 100% over 5 years -$1.42 million 100% over 5 years; 3 year delay -$1.38 million
Rate Design While Ameren Missouri is not pursuing a 5(M) tariff rate at this time, the Company does plan to offer a customer owned, non-metered 6(M) tariff rate option for those customers wishing to install LED lighting. The Company will only provide energy service to these customers, with the purchasing, maintenance, and installation responsibilities residing with the customer. The Company is working to develop and update to the existing tariff and will file an appropriate update on or by September 30, 2013.
Conclusions The results of the various studies indicate that LED technology is not suitable for a mass change-out at this time. Through this analysis, however, Ameren Missouri has learned a great deal about LEDs and recognizes the technology holds promise in the future. The key observations from this analysis include:
• Although LED SAL technology may be ready for efficiency programs, the technology is not yet cost-effective for all LED lighting applications.
• Key uncertain factors regarding LED SAL cost-effectiveness include the labor cost of installation, maintenance trip savings, LED price trends, and the effective useful life of LED SAL.
• Potential stranded costs and regulatory lag in Missouri are additional implementation barriers for LED SAL.
• There is a high level of risk and uncertainty associated with installing LED SAL. • Ameren Missouri will enhance customer choice of light options by proposing a tariff to allow
customers to own and install LED SAL.
Ameren Missouri will continue to analyze LED SALs and will share its advances in assessing LED SAL potential.

Ameren Missouri LED Street and Area Lighting Report
Page 19
Appendices
Appendix A – Street and Area Lighting Replacement Data
Description Lumens Watts
Baseline Equipment
Cost Replacement Lumens Watts Life
Years
Efficient Equipment
Cost Life
(years) kWh
Savings
Horizontal - enclosed on existing wood pole 9,500 117 $120 LED 4,000 58 6.00 $215 15 236 Horizontal - enclosed on existing wood pole 25,500 306 $141 LED 1,000 130 6.00 $385 15 704 Horizontal - enclosed on existing wood pole 50,000 473 $176 LED 14,000 258 6.00 $700 15 860 Horizontal - enclosed on existing wood pole 6,800 206 $120 LED 4,000 58 6.00 $215 15 592 Horizontal - enclosed on existing wood pole 20,000 477 $141 LED 1,000 130 6.00 $385 15 1,388 Horizontal - enclosed on existing wood pole 54,000 1095 $176 LED 14,000 185 6.00 $485 15 3,640 Horizontal - enclosed on existing wood pole 108,000 2160 $175 LED 14,000 185 6.00 $485 15 7,900
Open bottom on existing wood pole 5,800 70 $83 LED 4,000 58 6.00 $215 15 48 Open bottom on existing wood pole 9,500 117 $83 LED 4,000 58 6.00 $215 15 236 Open bottom on existing wood pole 3,300 118 $83 LED 4,000 58 6.00 $215 15 240 Open bottom on existing wood pole 6,800 206 $83 LED 4,000 58 6.00 $215 15 592
Post top including 17 foot post 9,500 117 $456 LED 4,000 89 6.00 $450 15 112 Post top including 17 foot post 3,300 118 $456 LED 4,000 89 6.00 $400 15 116 Post top including 17 foot post 6,800 206 $456 LED 4,000 89 6.00 $450 15 468
Directional 25,500 306 $194 LED 1,000 202 6.00 $750 15 416 Directional 50,000 473 $197 LED 14,000 202 6.00 $750 15 1,084 Directional 34,000 450 $180 LED 1,000 202 6.00 $750 15 992 Directional 100,000 1077 $291 LED 14,000 202 6.00 $750 15 3,500 Directional 20,000 294 $194 LED 1,000 202 6.00 $750 15 368 Directional 54,000 1095 $197 LED 14,000 202 6.00 $750 15 3,572

LED Street and Area Lighting Report Ameren Missouri
Page 20
Appendix B: EPRI Report Summary EPRI’s pilot program was developed in hopes to answer several key questions surrounding LED lighting.
• How does the light from an LED differ from a traditional source? Just as metal-halide lamps differ from high-pressure sodium, so too do LEDs. EPRI will investigate the differences and how they impact design.
• What is the actual performance of LED-based fixtures in the field, both initially and over time? How does this compare to both the control and the modeled performance? Traditional fixtures are a well known quantity. What additional considerations are needed because of LED technology?
• Is the light output stable? What about degradation over time and secondary effects such as temperature?
• How does the distribution pattern compare? Is it possible to substitute an existing fixture for one using an LED technology? What changes are needed?
• What are the actual energy savings compared to both manufacturers’ estimates and design estimates? Is it possible to accurately predict energy savings?
• Does the type of control strategy affect energy savings? Control strategy can include timers, photocells, and computers. What is the effect of each on energy savings?
• Are the fixtures reliable? If they are installed in the field, what is the expected mean time between failures?
• Do users accept the lighting? Lighting is subjective. How do users accept the change in technology?
• What are the differences in terms of efficiency and driver performance among manufactures? There are a lot of vendors now offering LED products. What makes one better than another?
The overall objective of the demonstration was to assess LED technology. To find the strengths and weaknesses and to make recommendations both to manufacturers and to utilities with regard to the worthiness of the technology and to comment on the technical barriers that still impede widespread adoption.
Results
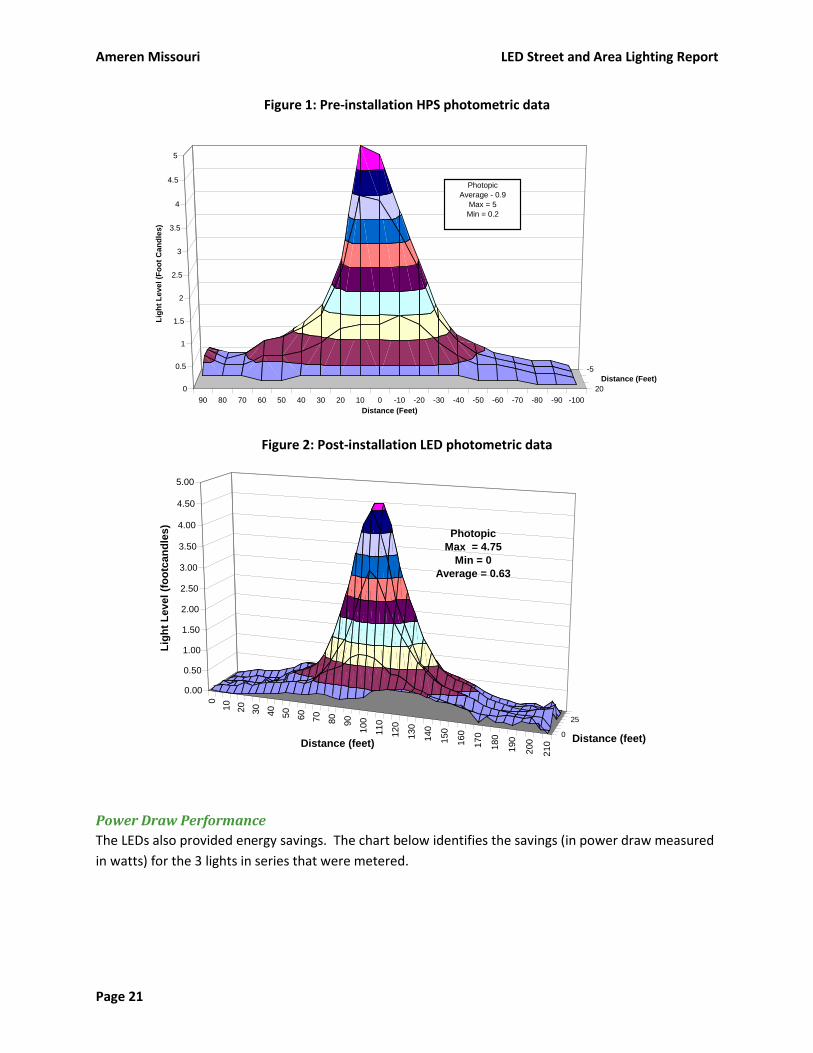
Photometric Performance The results from the study indicated that the LED light did an acceptable job of mimicking existing lumen levels at the test site. The charts below represent lumen levels at the test-site. While the LED provided an overall comparable lumen plot, the average lumens went down slightly from 0.9 to 0.63 lumens/square foot.
Ameren Missouri LED Street and Area Lighting Report
Page 21
Figure 1: Pre-installation HPS photometric data
Figure 2: Post-installation LED photometric data
Power Draw Performance The LEDs also provided energy savings. The chart below identifies the savings (in power draw measured in watts) for the 3 lights in series that were metered.
-100-90-80-70-60-50-40-30-20-100102030405060708090
-5
200
0.5
1
1.5
2
2.5
3
3.5
4
4.5
5Li
ght L
evel
(Foo
t Can
dles
)
Distance (Feet)
Distance (Feet)
PhotopicAverage - 0.9
Max = 5Min = 0.2
010 20 30 40 50 60 70 80 90
100
110
120
130
140
150
160
170
180
190
200
210
0
25
0.00
0.50
1.00
1.50
2.00
2.50
3.00
3.50
4.00
4.50
5.00
Ligh
t Lev
el (f
ootc
andl
es)
Distance (feet) Distance (feet)
PhotopicMax = 4.75
Min = 0Average = 0.63
LED Street and Area Lighting Report Ameren Missouri
Page 22
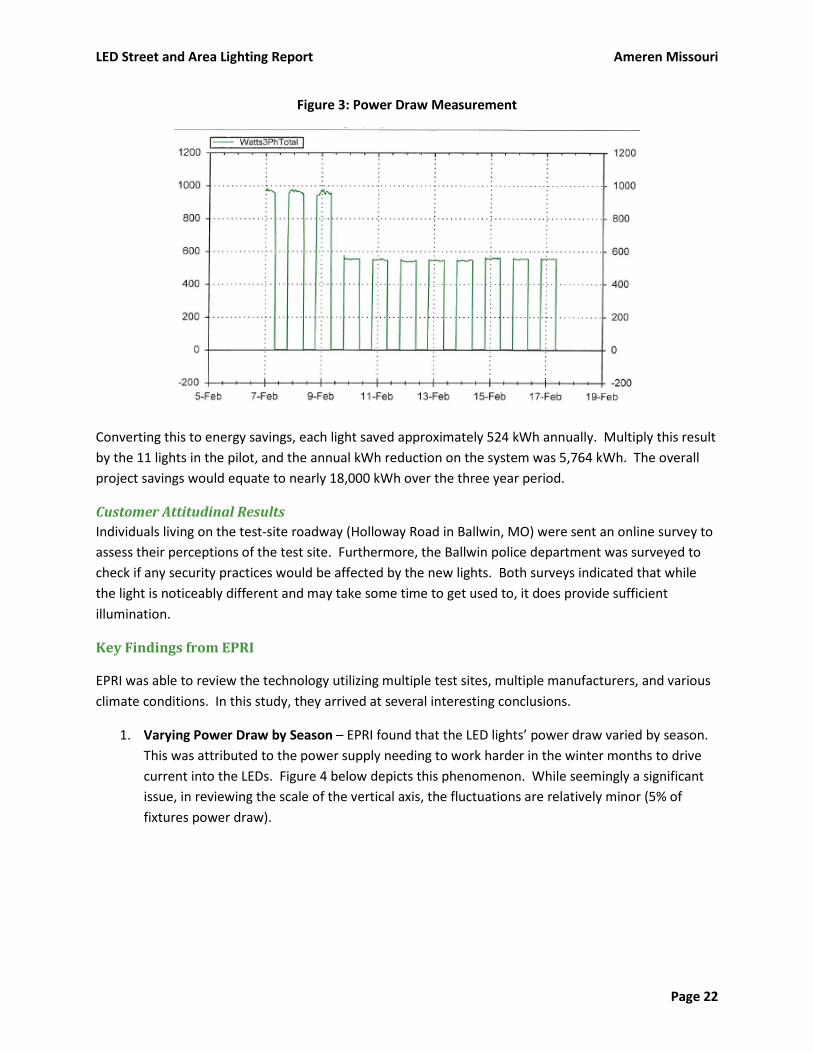
Figure 3: Power Draw Measurement
Converting this to energy savings, each light saved approximately 524 kWh annually. Multiply this result by the 11 lights in the pilot, and the annual kWh reduction on the system was 5,764 kWh. The overall project savings would equate to nearly 18,000 kWh over the three year period.
Customer Attitudinal Results Individuals living on the test-site roadway (Holloway Road in Ballwin, MO) were sent an online survey to assess their perceptions of the test site. Furthermore, the Ballwin police department was surveyed to check if any security practices would be affected by the new lights. Both surveys indicated that while the light is noticeably different and may take some time to get used to, it does provide sufficient illumination.
Key Findings from EPRI
EPRI was able to review the technology utilizing multiple test sites, multiple manufacturers, and various climate conditions. In this study, they arrived at several interesting conclusions.
1. Varying Power Draw by Season – EPRI found that the LED lights’ power draw varied by season. This was attributed to the power supply needing to work harder in the winter months to drive current into the LEDs. Figure 4 below depicts this phenomenon. While seemingly a significant issue, in reviewing the scale of the vertical axis, the fluctuations are relatively minor (5% of fixtures power draw).

Ameren Missouri LED Street and Area Lighting Report
Page 23
Figure 4: Average Monthly Power Draw
2. Reliability –EPRI uncovered multiple issues with the products submitted in the demonstration
project. Overall, the national project sites witnessed a 15% failure rate, 2.5% of which were failures directly “out of the box” from the manufacturer. Other failures were caused by faulty circuitry, LED driver failure, and manufacturer recalls.
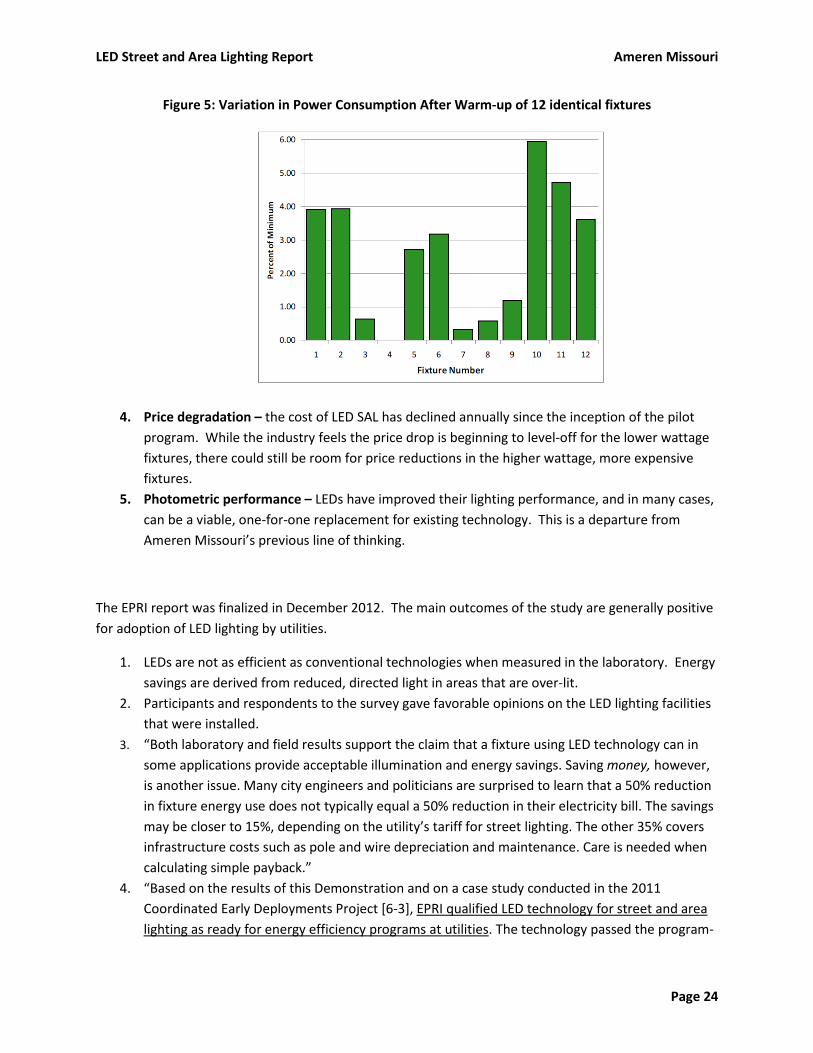
3. Varying Power Draw by Manufacturer – EPRI discovered that many of the manufacturers’ claims on power draw were optimistic and inconsistent with their field testing results. A fine example of this is depicted in Figure 4, which shows the variation in minimum power draw tested, versus minimum power draw claimed by the manufacturer. There were twelve identical fixtures selected for this sample study, and the variation among each unit is an interesting observation.
LED Street and Area Lighting Report Ameren Missouri
Page 24
Figure 5: Variation in Power Consumption After Warm-up of 12 identical fixtures
4. Price degradation – the cost of LED SAL has declined annually since the inception of the pilot program. While the industry feels the price drop is beginning to level-off for the lower wattage fixtures, there could still be room for price reductions in the higher wattage, more expensive fixtures.
5. Photometric performance – LEDs have improved their lighting performance, and in many cases, can be a viable, one-for-one replacement for existing technology. This is a departure from Ameren Missouri’s previous line of thinking.
The EPRI report was finalized in December 2012. The main outcomes of the study are generally positive for adoption of LED lighting by utilities.
1. LEDs are not as efficient as conventional technologies when measured in the laboratory. Energy savings are derived from reduced, directed light in areas that are over-lit.
2. Participants and respondents to the survey gave favorable opinions on the LED lighting facilities that were installed.
3. “Both laboratory and field results support the claim that a fixture using LED technology can in some applications provide acceptable illumination and energy savings. Saving money, however, is another issue. Many city engineers and politicians are surprised to learn that a 50% reduction in fixture energy use does not typically equal a 50% reduction in their electricity bill. The savings may be closer to 15%, depending on the utility’s tariff for street lighting. The other 35% covers infrastructure costs such as pole and wire depreciation and maintenance. Care is needed when calculating simple payback.”
4. “Based on the results of this Demonstration and on a case study conducted in the 2011 Coordinated Early Deployments Project [6-3], EPRI qualified LED technology for street and area lighting as ready for energy efficiency programs at utilities. The technology passed the program-

Ameren Missouri LED Street and Area Lighting Report
Page 25
readiness criteria developed in the Coordinated Early Deployments Project: energy savings must be proven, there must be line of sight to acceptable total resource cost test and payback period, there must be positive adoption experiences, and there must be a robust supply chain.”

LED Street and Area Lighting Report Ameren Missouri
Page 26
Appendix C: Procurement Standard Draft LUMINAIRE, LED, OPEN BOTTOM AND ROADWAY Description: Outdoor light emitting diode (LED) luminaire for roadway lighting application (asymmetric wide pattern) consisting of all-die-cast aluminum housing with heat sink, electronic driver and door assembly latched for gloved hand (tool less) access. Luminaire mounted via 2-bolt slip-fitter, adjustable for 1-1/4 to 2 inch pipe arm (1-5/8” to 2-3/8” OD) with leveling adjustment. Gray finish. Luminaire shall include ANSI photocontrol receptacle. Minimum warrantee shall be five (5) years on complete luminaire assembly and finish. Performance Standards: Voltage: 120-277V (+/-5%) Drive Current: < 530mA (Preferred) or >700mA (Max) Surge suppression: Integral device tested in accordance with ANSI/IEEE Std. C62.41991, for standard and optional waveforms defined in, Category B3, 6kV/3kA (120 events) Power Factor: > 90% at full load Total Harmonic Distortion: < 20% at full load Sound Rating: Class A Certifications: Listed to U.S. safety standards for wet locations Minimum Optical Enclosure Rating: IP 65 Maximum BUG Rating: B-3 U-0 G-2 Vibration Rating: 2G, ANSI C136.31 Temperature rating: -40○C to 40○C Optical Standards: Initial Lumens: As Required per Optical Performance Requirements Luminaire Efficacy: ≥ 70 Lumens/watt Nominal Color Corrected Temperature CCT: 4000○K Color Rendering Index CRI: ≥ 70 Photometric Test Report: IESNA LM-79 Lumen Maintenance: IESNA L85, 85% minimum at 50,000 hours at 25○C ambient temperature Control: Twist-lock, rotatable, photocell receptacle, 3-wire ANSI C136.10 Optical Performance: LED Optical(s) utilizing reflector and or refractive technology with glass lens is preferred over exposed acrylic lenses. Optical performance shall be demonstrated by photometric calculation based on the Illuminance and Luminance Method of Roadway Lighting Design, IENSNA RP-8-00. The following criteria are required minimum values for the following roadway and lighting design criteria: 70W HPS Open Bottom Equivalent LED General Area Light: 1 Fixtures
Area of Analysis: 100’ x 100’ Luminaire Placement: 50-X and 25-Y
Luminaire Mounting Height: 30 Ft. above finished grade Maintained Average Illuminance: 0.1 foot-candles Light Lumen Depreciation: 0.70 LLF
Light Dirt Depreciation: .90 LDD Glass or .85 Acrylic
100W HPS Open Bottom Equivalent LED General Area Light: 1 Fixtures
Area of Analysis: 100’ x 100’ Luminaire Placement: 50-X and 25-Y
Luminaire Mounting Height: 30 Ft. above finished grade Maintained Average Illuminance: 0.2 foot-candles Light Lumen Depreciation: 0.70 LLF
Ameren Missouri LED Street and Area Lighting Report
Page 27
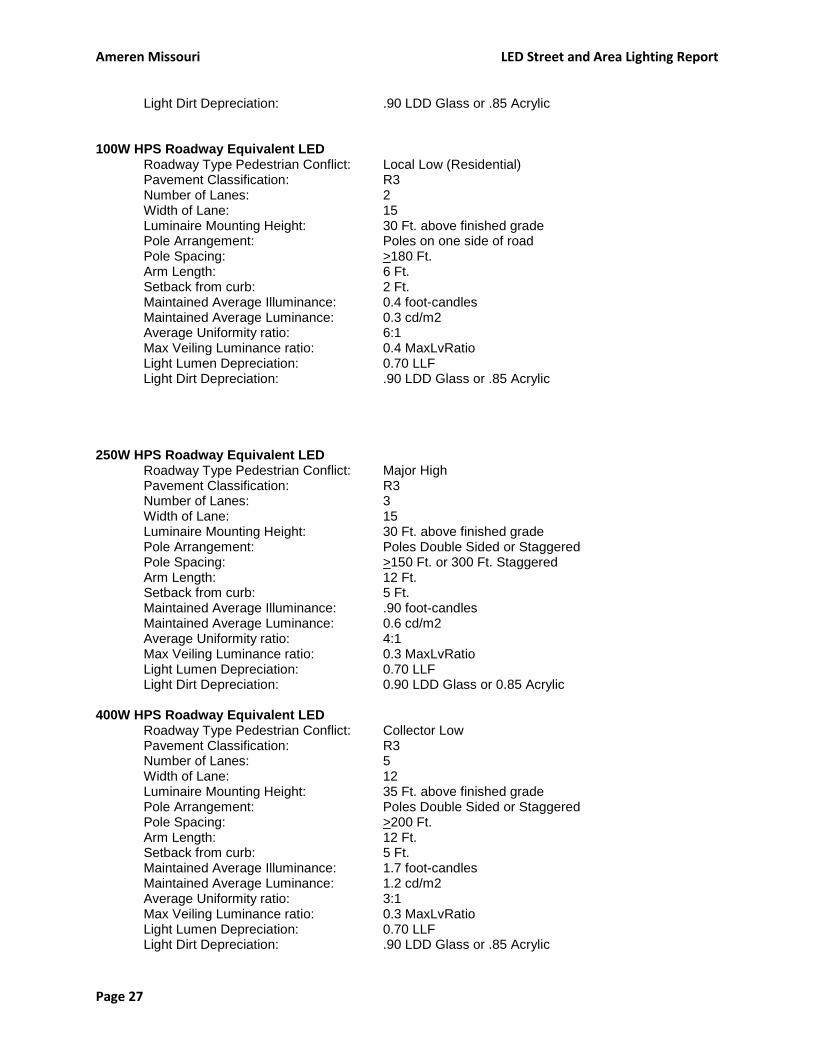
Light Dirt Depreciation: .90 LDD Glass or .85 Acrylic 100W HPS Roadway Equivalent LED Roadway Type Pedestrian Conflict: Local Low (Residential) Pavement Classification: R3
Number of Lanes: 2 Width of Lane: 15
Luminaire Mounting Height: 30 Ft. above finished grade Pole Arrangement: Poles on one side of road
Pole Spacing: >180 Ft. Arm Length: 6 Ft. Setback from curb: 2 Ft. Maintained Average Illuminance: 0.4 foot-candles Maintained Average Luminance: 0.3 cd/m2 Average Uniformity ratio: 6:1 Max Veiling Luminance ratio: 0.4 MaxLvRatio Light Lumen Depreciation: 0.70 LLF
Light Dirt Depreciation: .90 LDD Glass or .85 Acrylic
250W HPS Roadway Equivalent LED Roadway Type Pedestrian Conflict: Major High Pavement Classification: R3
Number of Lanes: 3 Width of Lane: 15
Luminaire Mounting Height: 30 Ft. above finished grade Pole Arrangement: Poles Double Sided or Staggered
Pole Spacing: >150 Ft. or 300 Ft. Staggered Arm Length: 12 Ft. Setback from curb: 5 Ft. Maintained Average Illuminance: .90 foot-candles Maintained Average Luminance: 0.6 cd/m2 Average Uniformity ratio: 4:1 Max Veiling Luminance ratio: 0.3 MaxLvRatio Light Lumen Depreciation: 0.70 LLF
Light Dirt Depreciation: 0.90 LDD Glass or 0.85 Acrylic 400W HPS Roadway Equivalent LED Roadway Type Pedestrian Conflict: Collector Low Pavement Classification: R3
Number of Lanes: 5 Width of Lane: 12
Luminaire Mounting Height: 35 Ft. above finished grade Pole Arrangement: Poles Double Sided or Staggered
Pole Spacing: >200 Ft. Arm Length: 12 Ft. Setback from curb: 5 Ft. Maintained Average Illuminance: 1.7 foot-candles Maintained Average Luminance: 1.2 cd/m2 Average Uniformity ratio: 3:1 Max Veiling Luminance ratio: 0.3 MaxLvRatio Light Lumen Depreciation: 0.70 LLF
Light Dirt Depreciation: .90 LDD Glass or .85 Acrylic

LED Street and Area Lighting Report Ameren Missouri
Page 28
Submittals: Light fixture cut sheet, complete with model number and required optional accessories Photometric calculations for straight roadway demonstrating the specified Optical Performance IES LM-79 test report for intensity distribution, light output and color rendition IES L85 report data including temperature correction factors for 25○C average ambient temperature In-Situ LED temperature test showing measured TMP at solder point ≤ LED manufacturer’s max TMP value IES photometric file in LM63 format Warrantee Terms and Conditions Types Accepted: Manufacturer Product

Ameren Missouri LED Street and Area Lighting Report
Page 29
LUMINAIRE, LED, COLONIAL POST TOP Description: Four (4) Sided Colonial Style Post Top. Outdoor light emitting diode (LED) luminaire for residential post top roadway lighting application (asymmetric pattern) consisting of all-die-cast aluminum housing with heat sink and electronic driver. Luminaire mounted via 3” OD Tenon Top Mount. Black luminaire finish. Luminaire shall include ANSI photo control receptacle. Minimum warrantee shall be five (5) years on complete luminaire assembly and finish. Performance Standards: Voltage: 120-277V (+/-5%) Drive Current: < 530mA (Preferred) or >700mA (Max) Surge suppression: Integral device tested in accordance with ANSI/IEEE Std. C62.41991, for standard and optional waveforms defined in, Category B3, 6kV/3kA (120 events) Power Factor: > 90% at full load Total Harmonic Distortion: < 20% at full load Sound Rating: Class A Certifications: Listed to U.S. safety standards for wet locations Minimum Optical Enclosure Rating: IP 65 Maximum BUG Rating: B-1 U-2 G-1 Vibration Rating: 2G, ANSI C136.31 Temperature rating: -40○C to 40○C Optical Standards: Initial Lumens: As Required per Optical Performance Requirements Luminaire Efficacy: ≥ 50 Lumens/watt Nominal Color Corrected Temperature CCT: 4000○K +/- 300K Color Rendering Index CRI: ≥ 70 Photometric Test Report: IESNA LM-79 Lumen Maintenance: IESNA L85, 85% minimum at 50,000 hours at 25○C ambient temperature Control: Twist-lock, rotatable, photocell receptacle, 3-wire ANSI C136.10 Optical Performance: LED Optical(s) utilizing reflector and or refractive technology design for multiple point light source in lieu of existing HID design optical. Submittals: Light fixture cut sheet, complete with model number and required optional accessories IES LM-79 test report for intensity distribution, light output and color rendition IES L85 report data including temperature correction factors for 25○C average ambient temperature In-Situ LED temperature test showing measured TMP at solder point ≤ LED manufacturer’s max TMP value IES photometric file in LM63 format Warrantee Terms and Conditions Types Accepted: Manufacturer Product