Computational Methods for Calculation of Ligand-Receptor ...

ACTAUNIVERSITATIS
UPSALIENSISUPPSALA
2015
Digital Comprehensive Summaries of Uppsala Dissertationsfrom the Faculty of Pharmacy 200
Ligand-based Methods for DataManagement and Modelling
JONATHAN ALVARSSON
ISSN 1651-6192ISBN 978-91-554-9237-3urn:nbn:se:uu:diva-248964

Dissertation presented at Uppsala University to be publicly examined in B22 BMC,Husargatan 3, Uppsala, Friday, 5 June 2015 at 09:15 for the degree of Doctor of Philosophy(Faculty of Pharmacy). The examination will be conducted in English. Faculty examiner: PhDJohn P. Overington (The European Bioinformatics Institute).
AbstractAlvarsson, J. 2015. Ligand-based Methods for Data Management and Modelling. DigitalComprehensive Summaries of Uppsala Dissertations from the Faculty of Pharmacy 200.73 pp. Uppsala: Acta Universitatis Upsaliensis. ISBN 978-91-554-9237-3.
Drug discovery is a complicated and expensive process in the billion dollar range. One way ofmaking the drug development process more efficient is better information handling, modellingand visualisation. The majority of todays drugs are small molecules, which interact withdrug targets to cause an effect. Since the 1980s large amounts of compounds have beensystematically tested by robots in so called high-throughput screening. Ligand-based drugdiscovery is based on modelling drug molecules. In the field known as Quantitative Structure–Activity Relationship (QSAR) molecules are described by molecular descriptors which are usedfor building mathematical models. Based on these models molecular properties can be predictedand using the molecular descriptors molecules can be compared for, e.g., similarity. Bioclipseis a workbench for the life sciences which provides ligand-based tools through a point and clickinterface.
The aims of this thesis were to research, and develop new or improved ligand-based methodsand open source software, and to work towards making these tools available for users throughthe Bioclipse workbench. To this end, a series of molecular signature studies was done andvarious Bioclipse plugins were developed.
An introduction to the field is provided in the thesis summary which is followed by fiveresearch papers. Paper I describes the Bioclipse 2 software and the Bioclipse scripting language.In Paper II the laboratory information system Brunn for supporting work with dose-responsestudies on microtiter plates is described. In Paper III the creation of a molecular fingerprintbased on the molecular signature descriptor is presented and the new fingerprints are evaluatedfor target prediction and found to perform on par with industrial standard commercial molecularfingerprints. In Paper IV the effect of different parameter choices when using the signaturefingerprint together with support vector machines (SVM) using the radial basis function (RBF)kernel is explored and reasonable default values are found. In Paper V the performance ofSVM based QSAR using large datasets with the molecular signature descriptor is studied, and aQSAR model based on 1.2 million substances is created and made available from the Bioclipseworkbench.
Keywords: QSAR, ligand-based drug discovery, bioclipse, information system,cheminformatics, bioinformatics
Jonathan Alvarsson, Department of Pharmaceutical Biosciences, Box 591, UppsalaUniversity, SE-75124 Uppsala, Sweden.
© Jonathan Alvarsson 2015
ISSN 1651-6192ISBN 978-91-554-9237-3urn:nbn:se:uu:diva-248964 (http://urn.kb.se/resolve?urn=urn:nbn:se:uu:diva-248964)


List of papers
This thesis is based on the following papers, which are refered to in thetext by their Roman numerals.
I Spjuth O, Alvarsson J, Berg A, Eklund M, Kuhn S, Mäsak C,Torrance G, Wagner J, Willighagen EL, Steinbeck C, and Wik-berg JES Bioclipse 2: A scriptable integration platform for the lifesciences. BMC bioinformatics 2009, 10:397.
II Alvarsson J, Andersson C, Spjuth O, Larsson R, and Wikberg JESBrunn: An open source laboratory information system for microplateswith a graphical plate layout design process. BMC bioinformatics2011, 12:179.
III Alvarsson J, Eklund M, Engkvist O, Spjuth O, Carlsson L, Wik-berg JES, and Noeske T Ligand-based target prediction with signa-ture fingerprints. Journal of chemical information and modeling,2014, 54, 2647−2653.
IV Alvarsson J, Eklund M, Andersson C, Carlsson L, Spjuth O, andWikberg JES Benchmarking study of parameter variation when usingsignature fingerprints together with support vector machines. Journalof chemical information and modeling, 2014, 54, 3211–3217.
V Alvarsson J, Lampa S, Schaal W, Andersson C, Wikberg JES, andSpjuth O Ligand-based modelling of chemical properties on largedata sets. [In manuscript]
v

List of additional papers
• Willighagen EL, Alvarsson J, Andersson A, Eklund M, Lampa S,Lapins M, Spjuth O, and Wikberg JES Linking the resource de-scription framework to cheminformatics and proteochemometrics.Journal of biomedical semantics, 2011 2(Suppl 1): S6.
• O’Boyle NM, Guha R, Willighagen EL, Adams SE, Alvarsson J,Bradley JC, Filippov IV, Hanson RM, Hanwell MD, HutchisonGR, James CA, Jeliazkova N, Lang AS, Langner KM, Lonie DC,Lowe DM, Pansanel J, Pavlov D, Spjuth O, Steinbeck C, Tender-holt AL, Theisen KJ and Rust PM Open data, open source andopen standards in chemistry: The Blue Obelisk five years on Journalof cheminformatics, 2011, 3:37.
• Spjuth O, Carlsson L, Alvarsson J, Georgiev V, Willighagen E,and Eklund M Open source drug discovery with Bioclipse Currenttopics in medicinal chemistry, 2012, 12 (18), 1980-1986.
• Spjuth O, Georgiev V, Carlsson L, Alvarsson J, Berg A, Wil-lighagen E, Wikberg JES, and Eklund M Bioclipse-R: integratingmanagement and visualization of life science data with statisticalanalysis Bioinformatics, 2013, 29 (2), 286-289.
• Moghadam BT, Alvarsson J, Holm M, Eklund M, Carlsson L,and Spjuth O Scaling predictive modeling in drug development withcloud computing Journal of chemical information and modeling,2015, 55 (1), pp 19–25.
vi

Summary in Swedish
Ligandbaserade metoder för datahanteringoch modellering
Introduktion
Läkemedelsutveckling är en dyr och komplicerad process som baraverkar bli alltmer dyr och alltmer komplicerad ju mer tiden går. Ett sättatt effektivisera läkemedelsutvecklingen är att införa bättre informati-onshantering, bättre datamodellering och bättre datavisualisering. Denhär avhandlingen handlar om informationshantering och datamodelle-ring, samt om programmet Bioclipse som är ett ramverk för att samlamjukvara för bland annat läkemedelsutveckling.
Figur 1: En robot som lyfter enmikrotiterplatta med 384 småbrunnar.
Läkemedelsutveckling börjar ofta med att man väl-jer substanser med lovande egenskaper bland ett stortantal substanser. Startpunkten är vanligen att man valtett så kallat målprotein, till exempel en receptor, ochsedan försöker man hitta en substans som via dettamålprotein har en önskvärd effekt. Detta steg görs oftain vitro med robotar (figur 1) som testar egenskaperpå substanser från stora substansbibliotek. Om någonav de testade substanserna visar sig ha önskvärd effektgår man vidare och försöker vidareutveckla den funnasubstansen.På 1990-talet hade datorerna blivit så kraftfulla att
man började försöka flytta läkemedelsutvecklingspro-cessen in i dem. Ett sätt att med hjälp av datorer hittasubstanser som binder till ett målprotein är att simu-lera själva bindningsprocessen i datorn. Att simulerabindningen är dock en beräkningskrävande process ochen annan variant är att utgå från att liknande substan-ser tenderar att bete sig på liknande sätt. Då kan man
vii

…
…
Figur 2: Ett exempel på ett enkelt molekylärt fingeravtryck. Varje position i listan avettor och nollor symboliserar huruvida en viss substruktur finns i molekylen eller ej.
starta med en känd substans och sedan söka i läkemedelsdatabaserefter substanser som liknar den kända substansen och på så vis hittasubstanser som borde ha en liknande effekt. Även om en del initialtsäkert hoppades att sådana datorbaserade metoder skulle kunna er-sätta våtlaborativa metoder så är det mer rimligt att se dem som ettkomplement.
För att modellera kemisk likhet kan man beskriva substanser med såkallade molekylära deskriptorer. Molekylära fingeravtryck är en sortsmolekylära deskriptorer som traditionellt sett består av en lista avettor eller nollor som anger om en viss fördefinierad substruktur finnsi molekylen eller inte (figur 2). Dessa molekylära deskriptorer kananvändas för att förutsäga molekylära egenskaper (så som exempelvisom en viss substans binder till ett målprotein) genom att man byggerprediktionsmodeller med så kallade maskininlärningsmetoder.Bioclipse är en programplattform som tillhandahåller ligandbase-
rade verktyg genom ett peka och klicka-gränssnitt. Den första ver-sionen släpptes under 2005 och tillhandahöll bland annat 2D och3D-visualisering av molekylära strukturer och andra allmänna kemin-formatikfunktioner. Bioclipse bygger på en flexibel arkitektur där olikakomponenter kan bidra med olika funktioner.De övergripande målen med denna avhandling var att utveckla nya
eller förbättrade ligandbaserade metoder och programvara med öppenkällkod, samt att göra dessa verktyg tillgängliga som komponenter iBioclipse. Öppen källkod innebär att man låter källkoden för ett pro-gram vara fritt tillgänglig för hela världen. En fördel hos vetenskapligaprogram med öppen källkod är då att vem som helst med tillräckligkunskap kan kontrollera om de resultat som genereras är korrekta ellerberor på felaktigheter i programmet.
viii

Figur 3: En dos-responskurva. Effekten ökar när koncentrationen ökas. EC50 är denkoncentration som motsvarar 50% av maximal effekt.
Resultat
Bioclipse skrevs om fullständigt inför version 2 för att få en versionmed bättre stöd för skriptning. Programkoden delades upp i separataenheter som enklare kan underhållas och testas. Utifrån dessa enheterskapades sedan ett skriptspråk för Bioclipse. Bioclipse 2 försågs ocksåmed en tabell för molekylvisualisering som stöder gigabytestora filermed molekylsamlingar.
Brunn utvecklades som ett laboratorieinformationssystem (LIS) somstödjer dos-responsstudier på mikrotiterplattor. Projektet gjordes fören cancerläkemedelsanalys vid universitetssjukhuset i Uppsala. Befint-liga lösningar var antingen Excel-filer eller ett kommersielt LIS. Ex-cel-filslösningen blev svårarbetad och det var svårt att sammanstäl-la gamla resultat. Det kommersiella LIS systemet var svårhanterligtoch ett skräddarsytt systemet behövdes. Det konstruerade systemet,Brunn, kan hantera data från analyser på mikrotiterplattor, skapa dos-responskurvor och beräkna -värden (figur 3) genom ett peka ochklicka-gränssnitt och alla resultat lagras i en databas så att de kan nåsför framtida forskningsprojekt.För att förbättra likhetssökning bland kemiska ämnen skapades mo-
lekylära fingeravtryck baserade på den molekylära signaturdeskriptorn.Utvärdering av de molekylära fingeravtrycken gjordes genom jämförelsemed några tidigare använda molekylära fingeravtryck med avseendepå förmågan att prediktera bindning till målproteiner. Detta gjordesmed en enkel maskininlärningsalgoritm på en stor datamängd frånChEMBL-databasen. De molekylära signaturfingeravtrycken består avatomsignaturer representerade av siffror för atomerna i molekylen, ochen signaturhöjdsparameter bestämmer avståndet (dvs antal atomer)från den centrala atomen som skall ingå i varje atomsignatur. Koden
ix

Figur 4: Bioclipse med en molekylvisualisering öppen. Nere i vänstra hörnet visasprediktioner av molekylära egenskaper.
för att skapa de molekylära signaturfingeravtrycken gjordes publikttillgänglig via Chemistry Development Kit (CDK). De nya molekylärafingeravtrycken presterade lika bra som branchstandarden ECFP6 frånden kommersiella programvaran Pipeline Pilot.
En mer avancerad maskininlärningsmetod som har gett bra resultat ärSupport Vector Machines (SVM) med en så kallad Radial Basis Function(RBF)-kärna. SVM med RBF är en beräkningsintensiv metod som hartvå parametrar ( och ) som måste justeras. Då mer informationvisserligen borde ge bättre resultat men även leder till längre körtiderså är det relevant att välja en lagom signaturhöjd. En studie gjordes därmånga olika varianter av dessa parametrar testades, vilket resulterade ien uppsättning av optimala startvärden. Resultaten kan användas vidframtida modellering för att minska beräkningskostnaderna.Slutligen undersöktes hur pass stora datamängder som var rimliga
att använda för att bygga en prediktor för en molekylär egenskap medhjälp av SVM. Dels testades SVM med RBF kärna från programvaranSVM och dels linjär SVM från den nyare programvaran LIBLINEAR,
som är enklare och snabbare men som inte nödvändigtvis presterar likabra. Det visade sig att LIBLINEAR var mycket snabbare och presteradeungefär lika bra som SVM. Då LIBLINEAR var så mycket snabbare såkunde vi använda mer data och ändå genomföra modelleringen inomrimlig tid. Den ökade datamängden gjorde att modellens noggrannhetblev bättre än det bästa vi kunde generera med SVM. De resulterandeprediktorerna gjordes publikt tillgängliga från Bioclipse (figur 4).
x

Abbreviations
ADMET Absorption, Distribution, Metabolism, Excretion, and Toxicity 8
ADR Adverse Drug Reaction 2
AOP Aspect Oriented Programming 31
AUC Area Under ROC Curve 27, 28, 34, 35, 36, 42
BSL Bioclipse Scripting Language 31, 34, 42
CDK The Chemistry Development Kit 17, 34
GNU GNU’s Not Unix! 14
GUI Graphical User Interface 6, 23, 39, 41, 42
HTS High-Throughput Screening 3, 4, 5
LIS Laboratory Information System 33, 40
NRI Net Reclassification Improvement 28, 34, 35
OSGi historically: Open Services Gateway initiative 17, 40, 42
QSAR Quantitative Structure–Activity Relationship 8, 19, 24, 35, 36, 40, 41,43, 45
RBF Radial Basis Function 13, 36, 41, 45
RMSD Root Mean Square Deviation 36
ROC Receiver Operating Characteristics 27, 28
RSS Rich Site Summary 17
SQL Structured Query Language 6, 34
SVM Support Vector Machine 13, 14, 35, 36, 41, 45
SWT Standard Widget Toolkit 17
UI User Interface 17, 41
VS Virtual Screening 4, 5
xi


Contents
1 Introduction 11.1 Drug discovery . . . . . . . . . . . . . . . . . . . . . . 11.2 Information systems and informatics . . . . . . . . . . 51.3 Cheminformatics . . . . . . . . . . . . . . . . . . . . . 71.4 Predicting molecular properties by machine learning . 121.5 Open source software and free software . . . . . . . . 141.6 Bioclipse . . . . . . . . . . . . . . . . . . . . . . . . . . 17
2 Aims 19
3 Materials and methods 233.1 Software development and integration . . . . . . . . . 233.2 Datasets . . . . . . . . . . . . . . . . . . . . . . . . . . 243.3 Calculations and statistical methods . . . . . . . . . . . 25
4 Results 314.1 Scripting in a workbench for the life sciences . . . . . 314.2 A laboratory information system for microtiter plates . 334.3 Molecular fingerprints based on signatures . . . . . . . 344.4 Effects of parameter variation in signature fingerprint
support vector machine models . . . . . . . . . . . . . 354.5 QSAR regression models from large training sets . . . . 36
5 Discussion 395.1 The power of an open source graphical user interface
combined with a scripting language . . . . . . . . . . . 395.2 Lessons from a laboratory information system . . . . . 405.3 QSAR studies using SVM and molecular signatures . . 415.4 The problem of evaluating binary QSAR classification . 425.5 Visions for the future . . . . . . . . . . . . . . . . . . . 43
6 Conclusions 45
xiii

7 Acknowledgements 47
References for chapter 1 to 6 51
I Bioclipse 2: A scriptable integration platform for the lifesciences 59Abstract . . . . . . . . . . . . . . . . . . . . . . . . . . . . . 61Background . . . . . . . . . . . . . . . . . . . . . . . . . . . 62Implementation . . . . . . . . . . . . . . . . . . . . . . . . . 62Results and discussions . . . . . . . . . . . . . . . . . . . . . 62Conclusion . . . . . . . . . . . . . . . . . . . . . . . . . . . 64Availability and requirements . . . . . . . . . . . . . . . . . 64Authors’ contributions . . . . . . . . . . . . . . . . . . . . . 64Acknowledgements . . . . . . . . . . . . . . . . . . . . . . . 64References . . . . . . . . . . . . . . . . . . . . . . . . . . . . 64
II Brunn: An open source laboratory information system formicroplates with a graphical plate layout design process 67Abstract . . . . . . . . . . . . . . . . . . . . . . . . . . . . . 69Background . . . . . . . . . . . . . . . . . . . . . . . . . . . 69Implementation . . . . . . . . . . . . . . . . . . . . . . . . . 70Results . . . . . . . . . . . . . . . . . . . . . . . . . . . . . . 70Discussion . . . . . . . . . . . . . . . . . . . . . . . . . . . . 75Conclusion . . . . . . . . . . . . . . . . . . . . . . . . . . . 75Availability and requirements . . . . . . . . . . . . . . . . . 76
III Ligand-based target prediction with signature fingerprints 77Abstract . . . . . . . . . . . . . . . . . . . . . . . . . . . . . 79Introduction . . . . . . . . . . . . . . . . . . . . . . . . . . . 79Methods . . . . . . . . . . . . . . . . . . . . . . . . . . . . . 80Results . . . . . . . . . . . . . . . . . . . . . . . . . . . . . . 82Discussion . . . . . . . . . . . . . . . . . . . . . . . . . . . . 82Conclusion . . . . . . . . . . . . . . . . . . . . . . . . . . . 84Associated content . . . . . . . . . . . . . . . . . . . . . . . 84Author information . . . . . . . . . . . . . . . . . . . . . . . 84Acknowledgements . . . . . . . . . . . . . . . . . . . . . . . 84References . . . . . . . . . . . . . . . . . . . . . . . . . . . . 84
IV Benchmarking study of parameter variation when using sig-nature fingerprints together with support vector machines 87Abstract . . . . . . . . . . . . . . . . . . . . . . . . . . . . . 89Introduction . . . . . . . . . . . . . . . . . . . . . . . . . . . 89Methods . . . . . . . . . . . . . . . . . . . . . . . . . . . . . 90Results . . . . . . . . . . . . . . . . . . . . . . . . . . . . . . 91
xiv

Discussion . . . . . . . . . . . . . . . . . . . . . . . . . . . . 92Conclusions . . . . . . . . . . . . . . . . . . . . . . . . . . . 93Associated content . . . . . . . . . . . . . . . . . . . . . . . 94Author information . . . . . . . . . . . . . . . . . . . . . . . 94Acknowledgements . . . . . . . . . . . . . . . . . . . . . . . 94References . . . . . . . . . . . . . . . . . . . . . . . . . . . . 94
V Ligand-based QSAR modelling of chemical properties onlarge data sets 97Abstract . . . . . . . . . . . . . . . . . . . . . . . . . . . . . 99Introduction . . . . . . . . . . . . . . . . . . . . . . . . . . . 99Materials and methods . . . . . . . . . . . . . . . . . . . . . 101Results and discussion . . . . . . . . . . . . . . . . . . . . . 104Conclusion . . . . . . . . . . . . . . . . . . . . . . . . . . . 107References . . . . . . . . . . . . . . . . . . . . . . . . . . . . 108
xv


Chapter 1
Introduction
Figure 1.1: An overview of theclassical drug discovery process.
This thesis touches upon a number of different fieldsand methods related to drug discovery. I will in thischapter give brief introductions to the different fieldsand present the building blocks needed for understand-ing the remaining chapters and the individual papers.I will introduce drug discovery, high throughput screen-ing, informatics, cheminformatics, open source software,and finally, I will describe version 1 of the open sourcesoftware project named Bioclipse.
1.1 Drug discovery
Drug discovery, i.e., the discovery of new medications,is often associated with big corporations and long time-frames. Often, medications consist of small drug likemolecules but comprise also so-called biologics, whichare larger molecules such as antibodies that can be usedas medicines. The classical drug discovery process, ofwhich an overview is shown in Figure 1.1, begins witha drugable target and, hopefully, ends with the launchof a new drug.
Probably less than targets are covered by thera-peutic drugs [1]. To commence the process based on aknown target is a very common approach. Once a tar-get has been selected, the next step typically consistsof identifying a lead compound that affects this targetin some way. This lead compound forms a base to bebuilt on and optimised in the making of the final drug.
1

1. Introduction
Lead identification is commonly done by screening chemical librariesof small molecules against cell samples in vitro and also is increasinglycomplemented by screening computer representations of moleculesvirtually in computers. There are also other approaches such as de novodesign where the substances are designed from scratch [2, 3], drugre-purposing where a drug found for one disease later is found to beuseful against another [4], and, of course, all the natural substancesfrom plants and other organisms [5]. Once a promising drug candidatehas been produced by the lead optimisation process, preclinical studiesto determine the safety of the drug candidate takes place, then followedby multiple clinical studies were the drug candidate is tested, oftenfirst on healthy volunteers and then on patients. Finally, if everythinghas gone well, a new drug can be launched. However, many initiallypromising candidate drugs gets weeded out at one stage or another inthis process.
Drug discovery is an expensive undertaking in the billion dollarrange, and although the actual estimated average cost of developing anew drug is not agreed upon [6], the general trend is that drug devel-opment cost estimates have increased over time [7]. In other words,although a lack of consensus exists, our best guess is that drug develop-ment is becoming more and more expensive, at least counted per newdrug released on the market. One might think this is because of theso-called low-hanging-fruit problem, i.e., that all easy to discover drugshave already been discovered and drugs remaining to be discoveredare much more difficult and hence more expensive to find. However,Scannell et. al. [8] argues that other explanations are more likely. Forexample, they blame it on what they call the “better than the Beatles”problem, i.e., that all new drugs have to compete against all yesterdays“star” drugs. Medicines are not outdated per se (well, antibiotics in somesense seems to be), neither do they go out of fashion. If somethingworks there is no reason to stop using it just because something newcomes around. Nevertheless, regardless of the reasons, although thenumber of new drugs has been somewhat constant over time (takinginto account inflation), the number of new US Food and Drug Admin-istration approved drugs per invested billion US dollar has more or lesshalved every years since the 1950s [8].
Many potential drugs fail in their making, and a major reason is,so called, Adverse Drug Reaction (ADR). An ADR is “an appreciablyharmful or unpleasant reaction, resulting from an intervention relatedto the use of a medicinal product, which predicts hazard from futureadministration and warrants prevention or specific treatment, or alter-ation of the dosage regimen, or withdrawal of the product” [9]. In fact,it has been argued that ADRs might be as high as the fourth to seventh
2

1.1. Drug discovery
most common cause of death in the United States [10]. ADRs havemany causes; one example of an ADR is when a drug interacts withother targets than what was the original plan. This is called secondarypharmacology.
High-throughput screening and microplates
The systematic experimental in vitro testing of large number of com-pounds, or in other words, High-Throughput Screening (HTS) wasestablished in the 1980s [11]. In industry HTS is mainly used in thelead identification step and usually a lot of chemical optimisationsremain to be done before a screening hit can be turned into a drug-likemolecule that can be of any potential use [12].
Today microplates with a standardised number of wells are com-mon for laboratory work related to HTS. The first microtiter plate wasmade in 1951 in Hungary during the study of a serious influenza epi-demic [13]. The methods used at that time were both expensive, timeconsuming and unreliable, so the microtiter plate and the equipmentcreated to work with multiple wells on them in parallel was soon asuccess.
During 1967 the first prototype of an automatic titer machine wasshown and somanual microplate handling became less and less common.In order to facilitate automatic handling of microplates their size wasstandardised in 1998 by the Society of BioMolecular Screening [14].The common plate sizes today are , (Figure 1.2) and wells.
Figure 1.2: A microtiter platewith 96 wells.
Dose response curves and related measures
When a substance is tested over a multitude of concentrations andthe effect of a response of some sort is measured the concentrationcorresponding to half of the maximum effect ( ) is often used as ameasurement of how effective the drug is with regards to concentration.Note that effect in this case does not necessarily mean clinical effect,but just a measurable effect of some kind. The result from such adose-response experiment can be plotted in a dose response curve,as shown in Figure 1.3. As the concentration is increased the effect
3

1. Introduction
Figure 1.3: A dose responsecurve. The effect increaseswhen the concentration isincreased. EC50 is theconcentration thatcorresponds to 50% of themaximum effect.
increases. If what is measured is inhibition then the value is often calledhalf inhibiting concentration, , instead. Hence dose responsecurves are also used when studying inhibition.
, the dissociation constant, is in the simple case where a largersubstance ( ) falls apart into two smaller objects ( ), a similarmeasurement as ; then corresponds to the concentration ofat which of has fallen apart.
In radio-ligand binding the inhibition constant, , can, for example,correspondsto the dissoci-ation constant
but whenobtained from
receptor bindingcompetition studies
be related to the value when substance is inhibiting the bindingof another substance to a receptor by the following equation:
usually known as the Cheng-Prusoff equation [15], where is theconcentration of substance and is the concentration of substance
that results in of the receptor having bound the other substance.Although is an assay specific measurement (whereas is not)more values are reported than , and it has been suggested that
values can be used to further increase an dataset using a factorof to convert between the values [16].
Virtual screening
During the 1990s, an alternative to HTS started to become com-mon [11]. Moving the screening into a computer, so called VirtualScreening (VS), turned into an interesting alternative as computersbecame faster. As HTS normally took place in vitro, VS was said to takeplace in silico, as a reference to the silica making up the microchipsin the computers performing the actual screening. The process of VScan be seen as a process where a big set of substances is reduced toa smaller set of substances which are more likely to have the sought-after properties; an enrichment of compounds having the beneficialproperties takes place by removal of compounds likely to be of no use.
4

1.2. Information systems and informatics
Probably, the most classic setting for VS is virtual docking, where theligand docking process is simulated in the computer [17].
Another variant is more of a ligand-centred approach based onthe similarity principle, i.e., that similar compounds will likely behavein a similar way [18]. In the latter approach databases of drug-sizedmolecules are searched by chemical similarity with the goal of findingligand candidates based on the chemistry of known ligands.
The main benefit of VS is that no compounds have to be purchasedor synthesised, whichmakes it a both time- and cost-efficient alternativeto HTS [19]. When VS was introduced the expectations were high.However, VS has so far not proven to be the ultimate replacementof HTS, which some people had hoped for. Instead, perhaps a morerealistic view is to see it as a complement to other approaches.
1.2 Information systems and informatics
The first electronic computers were, just as the word indicates, con-structed to perform computations. However, during the 1960s com-puters began to be used not only for doing pure computations but alsofor handling large sets of data for various administrative purposes; thecomputers started to be used for building information systems [20].These information systems drove the database field forward and alsohelped make computers mainstream. In fact, advanced calculationswere not needed by so many people, but administrative data processingwas useful on a much broader front.
Later, around the year 2000, the focus shifted again, this time awayfrom the development of information systems and onto the usage ofinformation technology in more general terms. As a consequence, inSweden the academic field of administrative data processing changedname to informatics [20]. However, multiple definitions for the word“informatics” exist.
The term informatics is currently enveloped in chaos.
Carles P Friedman 2012 [21]
The term informatics has been argued to be used casually for almostany activity that uses a computer [21]. In Europe it has arguably beenused synonymously with computer science but in the US the meaninghas been applied computing [22]. I prefer the, perhaps somewhatAmerican, definition of informatics: “an interdisciplinary field that isconcerned with the study of the nature of information and technologywith a focus on how people bring them together to produce and manageinformation and knowledge” [23]. Also, the term is often used together
5

1. Introduction
with other terms to signify the addition of domain knowledge from aparticular field, e.g., medical informatics, bioinformatics, cheminfor-matics, etc. pharmaceutical bioinformatics is a field that aims to mergethe cheminformatics and bioinformatics fields, and it also serves as anaid in the study of all aspects of life processes using computers [24].
Database systems
At the core of most information systems is the data storage or database.Imagine a simple data storage in the form of a sequential file made upof entries. For example in a storage of personal information, it storesfor each person their name, address, birth date, and occupation. Sucha storage can be extended by an index (pretty much like an index in abook) telling at what position a certain entry starts so that the entryfor, e.g., Mary Smith can be found without having to look through theentire file. However, this is still a sequential data file containing onekind of entry. When we talk about databases today, we mostly think ofthe more advanced constructions termed relational databases.
The relational database is, at least in computer science terms, an oldtechnology (stemming from the 1970s [25]) which is used for storingmore than one kind of entity, and for storing also the relations betweenthese entities.
This revolution in thinking is changing the programmerIn 1973, Bach-man called the
new database usera mobile navi-
gator. Comparewith the “map”for the Brunn
data model in Fig-ure 4.4 on page 34
from a stationary viewer of objects passing before himin core into a mobile navigator who is able to probe andtraverse a database at will.
Charles W. Bachman 1973 [26]
The relational databases are based on so called relational algebra whichdescribes operations that can be performed on the relational view ofthe data. However, it is not this relational algebra that the databaseuser types when constructing a relational database. Instead he uses adatabase specific language on a higher abstraction level. Today Struc-tured Query Language (SQL) is the industry standard language forinteracting with relational databases. SQL allows the database user (of-ten a programmer) to leave it to the system to determine the technicaldetails of how to store things, and it also allows for handling of multipleentries without doing iteration [27]. Generally the user of a relationaldatabase interacts with a series of tables much like those in Figure 1.4.
6

1.3. Cheminformatics
id name address birth date Occupation.id
1 Mary Smith Main street 1 1970-04-17 1
2 John Doe Highway 2 1972-07-24 1
3 Clara Doe Highway 2 1995-11-11 2
Person
parent.id child.id
2 3
Child
id title location1 Secretary Enterprises ltd
2 Student The University
Occupation
Figure 1.4: An example of tables in a database. The tables are linked by their idcolumns. There are three persons in the database. Clara is the child of John and sheis a student whereas Mary and John are secretaries.
Desktop applications and user interfaces
As computers became mainstream and were used for not only computa-tions, the ways to interact with them began to incorporate the so calledGraphical User Interface (GUI) as a complement to the powerful butdifficult to use command line interface. Windowing systems appearedtogether with the mouse and the point-and-click interfaces on top ofsomething that looked like a virtual desktop inside the computer. Todaydesktop applications may already feel a bit like yesterdays news whenweb based applications, such as for example Google Drive or “apps”for smart-phones and surf pads are the new tools in everyone’s hand.However, still these developments are to a high degree based on oldand proven design concepts. When looking at software for the personalcomputer, the classic desktop application still has some benefits overtheir web based versions; e.g., it does not need to have an Internetconnection — something that can be very important when workingon corporate secrets — but can nevertheless take advantage of an In-ternet connection if available. Also the desktop applications, at leasttraditionally, tends to have a more responsive user interfaces and a richvariety of GUI controllers.
1.3 Cheminformatics
Cheminformatics, sometimes known as chemoinformatics or chemical in-formatics is the field of the use of computer technologies for processing
7

1. Introduction
of chemical data and information [28, 29]. The term “chemoinformat-ics” was first used as recently as 1998 [30] but the activities incorporatedin the term had been practised in drug industries long before that [31].Today the term “cheminformatics” seems to have become the favouredterm used for example by the Journal of cheminformatics [32].
Mostly cheminformatics is about chemical structures in one way oranother. Among the future challenges where cheminformatics mightplay an important role are:
• To provide efficient in silico tools for predicting Absorption, Dis-tribution, Metabolism, Excretion, and Toxicity (ADMET) prop-erties [28].
• To help overcome the stalled drug discovery by efficient in silicoexperiments in order to prioritise for in vitro experiments [32].
Molecular descriptors and molecular fingerprints
In the field known as Quantitative Structure–Activity Relationship(QSAR) [33] molecules are described by measured and calculatedmolecular properties, i.e., molecular descriptors, which are used forbuilding mathematical regression or classification models. Based onthese models molecular properties can be predicted and using themolecular descriptors molecules can be compared for, e.g., similarity.
QSAR models are based on the similarity principle. A multitude ofmolecular descriptors have been developed over the years, and wholesoftware suites has been created for calculating these descriptors, e.g.,Dragon software [34]. Figure 1.5 shows an example of some very
Figure 1.5: A fewexamples of moleculardescriptors calculatedfor paracetamol byCDK using Bioclipse.
Descriptor Value
Molecular weight 151.06Number of rotatable bonds 2Number of carbon atoms 8
8

1.3. Cheminformatics
…
…
Figure 1.6: An example of a simple bit fingerprint. Each position in the list of onesand zeros symbolises whether or not a certain substructure is present in themolecule.
simple calculated molecular descriptors. Molecular descriptors can bein the form of a numerical value or for example a character string.
Molecular fingerprints are a sort of molecular descriptor. Theyare molecular properties represented as a list of numbers in orderto simplify computerised handling. A simple molecular fingerprintcould be a bit fingerprint based on substructures as the one shownin Figure 1.6. Here each number is either or , corresponding towhether a predefined substructure exists in the molecule or not. Inthe most classical setting molecular fingerprints are bit vectors but socalled count fingerprints or “holographic fingerprints” [35] also existswhere the fingerprint instead consists of an integer vector.
A common use case for molecular fingerprints is molecular similar-ity searching, both in the wide “similar compound” sense and in themore strict substructure sense. In a substructure search the goal is tofind compounds in a database that contains an exact query structure asa substructure of their atom graph. When doing substructure search-ing, merely basing a search on fingerprints will not go all the way toidentifying molecules with a certain substructure but some fingerprintscan be used to at least speed up the search. Because of the way manymolecular fingerprints are constructed, if substance does not haveat least the same bits set to as a substance , then can not be asub-structure of . With this information at hand such molecules canbe discarded when searching for substructures and fewer substancesremain for a complete, slow graph matching, and thus the search can bemade faster. However, not all fingerprints can be used for optimisingsubstructure searches in this way.
It can at first sight be difficult to say exactly when a moleculardescriptor can be regarded as a fingerprint. For this thesis the key
9

1. Introduction
Height Molecular signature
012
Figure 1.7: Signatures of height 0 to 2 for ethanol. Notice that so called implicithydrogen atoms are used and that the hydrogen atoms are not included in thesignatures. A molecular signature is made up of atom signatures for all heavy atomsin the molecule. The height parameter governs, for each atom, how much of itsneighbourhood is to be included in the atom signature. The ethanol molecule is sosmall that increasing the signature height beyond height 2 makes no difference.Figure taken from Paper V.
element will be that a fingerprint is somehow mapped to a list ofdistinct and predefined numbers whereas a descriptor can possiblytake a range of values which are difficult or impossible to enumerate.Figure 1.8 illustrates this by showing an example where the signaturedescriptor [36–38] of signature height 0 is used both to construct a bitfingerprint and a descriptor consisting of an integer list, but first have alook at Figure 1.7 for a short introduction to the signatures moleculardescriptor and signature heights. In the fingerprint approach the integera signature corresponds to is defined upfront. In the descriptor approachthe list of unknown signatures is built up as new signatures are found,and the signatures then corresponds to an integer according to theirposition in that list.
Distance measure – the Tanimoto coefficient
Molecular similarity searching typically aims at finding small moleculeswith similar biological activity, and molecular fingerprints are some ofthe most popular tools for such similarity searching [39]. Fingerprintsof a certain type are often pre-calculated for all molecules in a libraryand for a new query molecule the calculation of the fingerprint forthat query molecule can be made relatively fast. The similarity searchcan then be performed by pairwise comparison of which bits in thefingerprints are set to .
10

1.3. Cheminformatics
Fingerprint approach
In the fingerprint approach eachatom is hashed into a numberaccording to a hash function. Inthis simple example, according tothe letter position in the alphabet.For elements represented by morethan one letter we will naïvelyadd the values up. This meansthat multiple elements may havethe same hash code, a so calledhash collision, as with andin the example below.
Descriptor approach
In the descriptor approach first allfound atom types are ordered in alist. The order in that list is thenused as numeric representationfor the signatures. This meansthat all possible signatures mustbe counted before the numericrepresentation can be created, atleast if multiple molecules are tobe described separately. However,there will be no hash collisions inthis approach.
Fingerprints Molecule Descriptors
3, 14, 15 1, 2, 3
Signatures: [ ], [ ], [ ]
3, 15 1, 3
Signatures: [ ], [ ]
3, 6, 15 1, 3, 4, 5
Signatures: [ ], [ ], [ ], [ ]
Figure 1.8: The signature descriptor of height 0 consists of the non hydrogen atomtypes in the molecule. If we want to create a list of integers describing whichdescriptors of height 0 are found in each molecule there are at least twoapproaches, here called the fingerprint approach and the descriptor approach.Note that this is a simple example that deals only with signature height 0 and has anaïve hash function.
11

1. Introduction
The Tanimoto coefficient ( ) [40] has become the most favouredmeasure of fingerprint similarity [39]. is a symmetrical similarity, i.e.,comparing fingerprint with fingerprint is equivalent to comparingfingerprint with fingerprint . When comparing fingerprint withfingerprint the Tanimoto coefficient is defined as:
where is the number of bits set to in molecule , is the numberof bits set to in molecule and is the number of bits that are set toin both molecule as well as in molecule . Note that only bits set
to are used in the calculation of . Larger molecules have a tendencyto set more bits and such saturated fingerprints have a tendency to givehigher Tanimoto coefficients [41]. However, unless there is specialreason to avoid the effect of that size-bias, the Tanimoto coefficient isstill the recommended method of choice [42].
1.4 Predicting molecular properties by machine learning
As alreadymentioned, the hypotheses that similar substances tend to be-have in a similar manner makes it possible to use molecular descriptorsfor predicting properties of a substance. Machine learning is commonlyused for performing such predictions and consists of the applicationof induction algorithms [43]. A model is built and then used to solvethe task at hand. The model is often said to “learn” or to “be trained”.Machine learning is divided into unsupervised and supervised learning.In unsupervised learning the goal is to find patterns and associations,while in supervised learning the goal is to predict a property based oninput data [44]. I will in this thesis mainly concentrate on supervisedlearning. The property might be a continuous variable, in which casethe process is called regression or it could be a class label in which casethe process is called classification. In building the model a set of knowndata is used, commonly named a training set, from which the model iscreated. The model, in some sense, describes the training set. However,if the model describes specific things in the training set too well thenthe model might not generalise well when trying to predict values for anew substance. This phenomenon is called over-fitting.
It is reasonable to expect that predictions on data points from thetraining set will have a tendency to give a better result than a randomdata point not in the training data. In order to get an estimate of howthe model will perform on new unseen data a test set with data thatis not used for training is usually created. A slightly different way isto split the original data into multiple sets, then train and test all the
12

1.4. Predicting molecular properties by machine learning
models. This is called cross validation. The cross validation is said to bedone -fold, which means that the original data is divided into partsand then each one of them are held as a test set separately while therest is used as the training set. This means that each data entry is usedboth for training and testing, and exactly once for testing.
Many approaches based on different descriptors and machine learn-ings algorithms have been used for building predictive models. There isreason to believe that different methods will top-perform on differentproblems and that their combined results are worth looking at [45].However, if a certain combination of machine learning method anddescriptor exists that works sufficiently well on average on a sufficientlysmall problem space then that would be very valuable in that it wouldgreatly simplify the prediction of molecular properties by machinelearning.
K nearest neighbours
An easy approach when trying to predict a property on a new entitybased on a known training set of entities is to find themost similar entityin the training set and say that the unknown property for entity is thesame as for the most similar entity. A somewhat more sophisticatedapproach is to instead look not only at the one nearest neighbour buton nearest neighbours and draw a conclusion from them, for exampleby a voting procedure for classification or a mean value for regression.This latter approach is called nearest neighbours. The value of tobe chosen can, for example, be determined using cross validation.
Support vector machines
A Support Vector Machine (SVM) [46, 47] finds a hyperplane thatseparates classes from each other in space. The SVM method has atuning parameter which governs the cost of misclassifying a trainingpoint. Large values of means that points near the hyperplane becomesmore important which will tend to lead to an over-fit boundary whereaslower values mean that points further away are included which leadsto a smoother boundary [48].
Linear SVM finds these hyperplanes in the input feature space.With, so called, kernel functions the feature space can be transformedinto higher dimensions which tends to make it easier to find a goodhyperplane. Probably the most common kernel function to be usedtogether with SVM is the Radial Basis Function (RBF) which is oftenpresented as a reasonable first choice, and which has the potential toalso behave like the linear kernel for some parameter set ups [49]. TheRBF kernel has a parameter which affects it. Although originally
13

1. Introduction
a classification method, SVM has been extended to do regression aswell [48].
A multitude of SVM implementations exist. LIBSVM is one of themost widely used SVM software libraries [50] and it can be used frommany programming languages. For example, there is a Java implementa-tion, and interfaces for other languages like for example the R package
which uses LIBSVM. A distributed implementation of SVM isavailable through the SVM software which can be used to run SVMin parallel on a compute cluster. Also a fast implementation of linearSVM is available through the LIBLINEAR [51] software.
1.5 Open source software and free software
Open source software refers to software in which the source code isopen for the world to view. Often it is made public on the Internet.Obviously this kind of openness means that not many commercialsoftware companies go down this path. After all, it is hard to sellsomething that is free. Free software refers to the freedom of the user ofthe software. The user of free software is free to do whatever they wantwith the software; a free software user is free to study, modify and sellthe software for profit among other things. The terms open source andfree software are closely related and sometimes used interchangeablybut they are not the same thing. All free software is open sourcesoftware but all open source software can’t be considered to be freesoftware.
History and background
Sharing of software [...] is as old as computers, just assharing of recipes is as old as cooking.
Richard Stallman in “The GNU Project”, originally published in thebook “Open Sources”
The first versions of Unix [52] were distributed freely during the sev-enties but in 1979 it was commercialised [53]. In the first half ofthe 1980s Richard Stallman started the free software movement andlaunched the GNU’s Not Unix! (GNU) project by publishing the GNUmanifesto [54] where he called for software that were free to be mod-ified and redistributed. The GNU project (Figure 1.9) has since thenproduced a lot of software.
Figure 1.9: TheGNU-logo.
During the 1990s the free operating system GNU/Linux appeared.In the text “The Cathedral and the Bazaar” [55] Raymond made astrong case for the open source way of software development used in
14
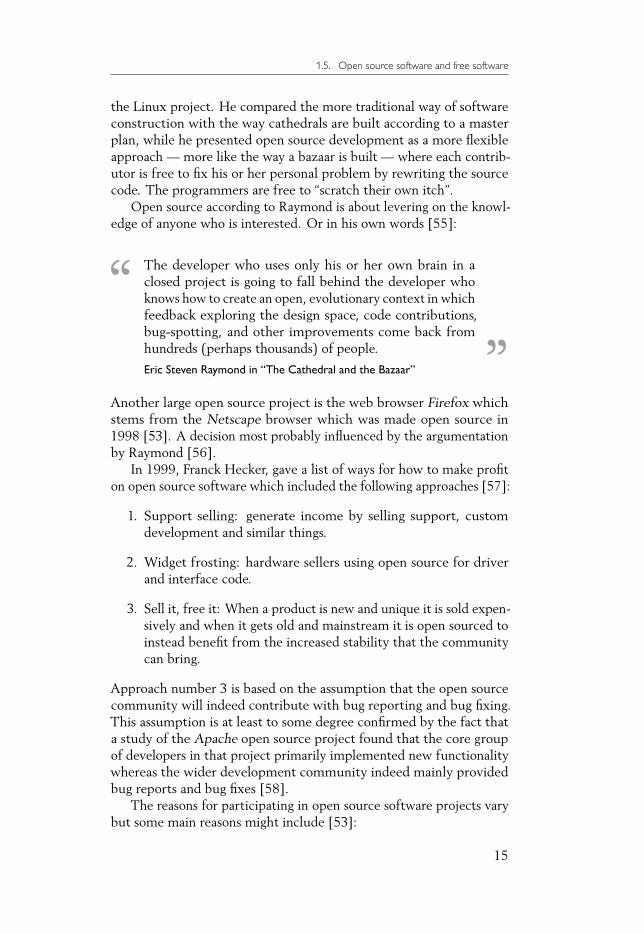
1.5. Open source software and free software
the Linux project. He compared the more traditional way of softwareconstruction with the way cathedrals are built according to a masterplan, while he presented open source development as a more flexibleapproach — more like the way a bazaar is built — where each contrib-utor is free to fix his or her personal problem by rewriting the sourcecode. The programmers are free to “scratch their own itch”.
Open source according to Raymond is about levering on the knowl-edge of anyone who is interested. Or in his own words [55]:
The developer who uses only his or her own brain in aclosed project is going to fall behind the developer whoknows how to create an open, evolutionary context in whichfeedback exploring the design space, code contributions,bug-spotting, and other improvements come back fromhundreds (perhaps thousands) of people.
Eric Steven Raymond in “The Cathedral and the Bazaar”
Another large open source project is the web browser Firefox whichstems from the Netscape browser which was made open source in1998 [53]. A decision most probably influenced by the argumentationby Raymond [56].
In 1999, Franck Hecker, gave a list of ways for how to make profiton open source software which included the following approaches [57]:
1. Support selling: generate income by selling support, customdevelopment and similar things.
2. Widget frosting: hardware sellers using open source for driverand interface code.
3. Sell it, free it: When a product is new and unique it is sold expen-sively and when it gets old and mainstream it is open sourced toinstead benefit from the increased stability that the communitycan bring.
Approach number 3 is based on the assumption that the open sourcecommunity will indeed contribute with bug reporting and bug fixing.This assumption is at least to some degree confirmed by the fact thata study of the Apache open source project found that the core groupof developers in that project primarily implemented new functionalitywhereas the wider development community indeed mainly providedbug reports and bug fixes [58].
The reasons for participating in open source software projects varybut some main reasons might include [53]:
15

1. Introduction
1. Altruism: the participator seeks to increase the welfare of othersby producing free software for them.
2. Intrinsic motivation: some programmers are motivated by thefeeling of competence and satisfaction that arise from program-ming.
3. Community identification: Programmers may identify with anopen source community. Maslow [59] lists belonging and love asa big human motivator.
4. Personal needs: many open source programs are created by per-sons who wish to use that software. For example the type settingsystem was built by Knuth because of a personal need [60].
5. External rewards: Programmers may participate in open sourceprojects to learn and for self-marketing purposes.
Open source software in the drug discovery field
Geldenhuys et al. [61] argue that many open source projects for drugdiscovery exists, but as they in many cases are difficult to install andprovide poorly written graphical user interfaces, they have not had asignificant impact on the drug discovery field. Open source softwarediffers from more classic licensing models in a number of ways whichDelano et al. [62] has argued beneficial for drug discovery. Among themain benefits they list can be mentioned:
1. No black boxes, i.e., all entities can be opened up because thesource code is available, and anyone sufficiently skilled can checkif an unexpected behaviour is correct or due to a bug.
2. Flexibility to tailor-make the system. Since the source code isavailable and allowed to be changed it is always possible to tailorthe software for corner-case-behaviour that only a small group ofpeople is interested in.
3. Availability. Since the software is available on the Internet it canbe obtained right away and quickly tested and evaluated withoutbig prior investments.
Of course it is important to remember that with classic commercialsoftware comes monetary income and resources which can be investedin projects which are less popular for open source programmers towork with. Linus Torvalds argues that although not a necessity, theopen source development model is mostly suitable for projects whereprogrammers will be using the software [63]. However, programmers
16

1.6. Bioclipse
use a lot of different software and not only software directly related toprogramming.
1.6 Bioclipse
During 2005 and 2006 the first versions of an open source softwareplatform for bioinformatics and cheminformatics termed Bioclipse(Figure 1.10) was released. Bioclipse is a workbench for the life scienceswith the aim of integrating cheminformatics and bioinformatics intoa single framework with a user friendly interface [64]. It is mainlytargeted at pharmaceutical use cases.
Figure 1.10: TheBioclipse logo.
Bioclipse is written in the programming language Java, and madeopen source under the Eclipse Public License and allows for any licens-ing of external plugins. Both open source as well as commercial pluginsare possible. Bioclipse integrates a multitude of life science software, allheavily specialised on their own thing. Each of these different softwarepackages is made to work inside Bioclipse and each one contribute theirspecial features, and together they make up the Bioclipse framework.For a list of the main features, see Table 1.1.
Plugin architecture and user interface
From the start Bioclipse was based on the Eclipse rich client platformand benefited from its OSGi-based (historically: Open Services Gate-way initiative) plugin architecture. The OSGi framework providesfunctionality for extending the framework with plugins including ver-sion handling. Since Bioclipse, to a high degree, is about integratingdisparate software projects, written by different people with differentgoals, the importance of the plugin framework should not be underes-timated.
Eclipse provides Bioclipse with the basic User Interface (UI) whichmakes up the Bioclipse workbench. In the Java world, where programsare platform-independent and should be runnable onmultiple operatingsystem, e.g., Windows, Mac and Unix, a couple of different approachescan be found when it comes to the UI. One is to create generic graphicalcomponents in Java. Then the program will look the same on alloperating systems but it will not look and “feel” like the rest of theoperating system. This approach has the risk of leading to a softwarethat the user think doesn’t “feel right”. Another approach is to use thenative components, but then separate UI code needs to be maintainedfor each supported operating systems windowing systems. This is theapproach taken by the Standard Widget Toolkit (SWT) used for theUI in Eclipse and hence by the Bioclipse workbench. This means that
17

1. Introduction
Table 1.1: The main features of the Bioclipse 1 series.
Feature Comments
Generalcheminformatics
General cheminformatics functionality pro-vided by CDK [65, 66].
3D visualisation Visualisation of 3D structures provided byJmol [67, 68] and also Jmol-scripting.
2D visualisation Visualisation of 2D molecular structures pro-vided by JChemPaint [69].
Bioinformatics Basic bioinformatics functionality provided byBiojava [70].
Web services Downloading of entries from various biologicaldatabases provided through the WSDbfetchweb service [71].
Spectrum analysis Visualisation of spectrum.
JavaScript Access to the JavaScript programming lan-guage from within Bioclipse provided by theMozilla Rhino engine [72]
RSS viewer Rich Site Summary (RSS) viewer providingspecial functionality for the viewing of chemi-cal entities.
in Windows the Bioclipse workbench looks like any other Windowsprogram and on a Mac it looks and behaves like a Mac program. Pluginshowever are not forced to use SWTmeaning that some parts of Bioclipsemight have a different look and feel.
Difficult to extend
The last release of the Bioclipse 1.x series was done in December 2007.Bioclipse had become a bit of a patch-work and the general feelingwas that making new features interact with what was already there hadbecome more and more complicated. It seemed that all parts wereentangled with each other and when something new was added some-thing seemingly unrelated could break down. Some sort of clean-upwas needed and the Bioclipse 2 project was started.
18

Chapter 2
Aims
Drug development is a complex process that is becoming more andmore expensive. There is a need to make drug development more effi-cient. One way to do this is to enable better decisions in the preclinicalphase of the drug development so that better drug leads are prioritisedto move down the drug discovery pathway. The foundation for betterdecisions is improved information management and standardisation,more accurate modelling tools and well-structured visualisation toolsfor summarising information and data. The papers in this thesis arefocused on improving decision making in the preclinical phase.
Paper I describes the Bioclipse 2 workbench, a system for manag-ing, analysing, and visualising chemical and biological data. Paper IIdescribes the Brunn software, a laboratory information system for work-ing with dose-response studies on microtiter plates. Papers III and IVdescribe methods for improving the use of molecular signatures forQSAR and for making them practically applicable. Paper V describesthe development of QSAR models based on a large dataset with themethods developed in Papers II and III. The QSAR models developedin Paper V were made available in Bioclipse. Overall the work in thisthesis lead to plugins in Bioclipse which can communicate and leverageeach other (Figure 2.1).
Overall aims
• To research, and develop new or improved ligand based methodsand open-source software for pharmaceutical bioinformatics, and
• to work towards making these tools available for users throughthe Bioclipse workbench.
19

2. Aims
Figure 2.1: Overview showing how the papers in this thesis fit together. The piecesof the puzzle are Bioclipse components and the clouds are results and conceptsused for making the Bioclipse components.
Specific aims
Paper I
• To make a better Bioclipse with full support for scriptability inorder to simplify automation and integration.
Paper II
• To construct an easy to manage laboratory information systemfor dose-response studies and to provide a database to supportfuture research.
Paper III
• To create an open-source fingerprint-based on the signature de-scriptor to get better similarity searching and to evaluate thefingerprint by comparing it with some other commonly usedfingerprints with regards to performance in target prediction.
20

Paper IV
• To study the effect of different choices of parameter values whenusing the signatures fingerprint with support vector machinesusing the radial basis function kernel and to give suggestions fordefault values for the tested parameters.
Paper V
• To build models on a large training set for a molecular propertytabulated in the ChEMBL database, to evaluate the trade-offbetween training dataset size and model performance and finallyto make the produced model publicly available through Bioclipse.
21


Chapter 3
Materials and methods
3.1 Software development and integration
In Paper I a complete rewrite of the Bioclipse framework is described.Although the mere action of making such a rewrite might seem like afailure, it should not be viewed in that way. In fact, Brooks goes as faras to say that: “You will do that” and suggests that a good developmentmethod is to: “plan to throw one away” [73].
In making the different software incorporated into Bioclipse 2 worktogether we used an adapter approach. An adapter is normally some-thing that sits in between two things and facilitates or enables their inter-action. In every-day-life we often come into contact with adapters whencoupling electronic equipment together. In Bioclipse these adaptersencapsulate the foreign software in standardised shells and thus showsonly parts that is known by the Bioclipse framework to the rest ofthe framework. We call these adapters manager objects and had themencapsulating all the control code. The encapsulated control code isoften completely different libraries written by other programmers whodid not have their usage inside Bioclipse in their minds when writing it.The manager objects make up separate entities that can be separatelymanaged and unit tested. In unit testing each part of a software is testedseparately and preferably continuously during development [74]. Con-tinuous unit testing was used when building Brunn which is presentedin Paper II.
The manager objects were then injected into a scripting environ-ment so that expert-users can access all the functionality of the frame-work through scripting, as illustrated in Figure 3.1. The idea here isthat the scripting expert-user would call the same code on the man-agers as the graphical user interface was calling when it was clicked
23

3. Materials and methods
Figure 3.1: In Bioclipse 2 the same manager code was made reachable from boththe graphical user interface and the scripting language. (The figure is taken fromSpjuth and Alvarsson 2009 [75] and licensed under the Creative CommonsAttribution 3.0 License.)
on. This made development of the scripting components a part of thedevelopment of the GUI components.
3.2 Datasets
A dataset from ChEMBL for time-based validation
In Paper III a dataset was extracted from the ChEMBL [76–78] databaseand set up for time-based validation so that we could evaluate howwell “new” chemistry can be predicted based on “old” chemistry. Thissimulates how QSAR models are used in real drug discovery projectsin that the model is built using “old” known chemistry and then usedto predict “new”, unknown chemistry. ChEMBL is an open databasewith curated data for small, bioactive drug-like molecules. The datasetwas extracted from ChEMBL, filtered based on a set of filtering criteriaand then split into training and test set based on date of addition to thedatabase. The training set consisted of molecules added before 2011and the test set of molecules were those added during 2011. Datafor different targets were extracted and the data were handled as
datasets, each one for different targets. For details on the filteringcriteria see Paper III.
24

3.3. Calculations and statistical methods
Small datasets for parameter benchmarking
In Paper IV, when we wanted to benchmark the parameter variationin signature fingerprints together with support vector machines, thelarge datasets from Paper III would have been too big to work with.We used a series of relatively small datasets, which had previouslybeen used for benchmarking purposes by some of the co-authors ofPaper IV [79]. These datasets span a wide range of use cases, whichwas important since we wanted to see if generalisations in parametervalue choices could be done. The datasets cover various types of data,like cyclooxygenase-2 inhibitors, toxicology data, mutagenicity dataand human tumour cell-line screening data. For more details on thedatasets, see Paper IV.
Molecular property dataset extracted from ChEMBL
For Paper V we again looked into the ChEMBL database for our dataset.We wanted to test model building with large datasets and ChEMBLcontained calculated molecular properties for a very large number ofmolecules, so we accordingly extracted a dataset of substances withACDs LogD calculated from the ChEMBL database version 17. LogP isthe partition coefficient, which is a measurement of hydrophobic orhydrophilic a substance is, and LogD is LogP for a specific pH, in thiscase pH= . We found a total of substances with the LogDproperty calculated.
3.3 Calculations and statistical methods
Plate based statistics
In Paper II, it is explained how Brunn is used for calculating the follow-ing statistics:
• Survival index ( ), corresponds to the percentage of survivingcells in a well. The for well is calculated as:
where is the measured measured number of surviving cells forthe well, is the average for the blank wells and is the averagefor the control wells.
• Coefficient of variation , is a distribution measurement.The for the values for some wells of interest is calculatedaccording to:
25

3. Materials and methods
where is the standard deviation and is the average forthe wells .
• -scores are used for identifying results that stand out from therest of the results on a plate from high throughput screening.Results with high deviation from the mean might later turn outto be hits. The -score for well is calculated according to: [80]
where is the measured value for the well, is the mean of allsample values on the plate and is the standard deviation of allthese sample values.
Evaluation of binary classifiers
A binary classifier divides a set of entities into two classes. The classifi-cation of an entity made by such a classifier can be either true ( ) orfalse ( ), i.e., correct or not correct, and the actual value of the entitycan be either positive ( ) or negative ( ). Thus, four different casesexist: the classification being a true positive ( ), false positive ( ),true negative ( ) or a false negative ( ) prediction. This can bevisualised in a contingency table, as shown in Table 3.1.
Table 3.1:Contingency tablefor binaryclassification.Actual values versuspredicted values.
Actual
Pred
icted
From these classification values, other measures are often defined.I will here list five measures which are relevant for the work at hand.The first measure is which corresponds to the propor-tion of actual positives that are predicted as positives. The second is
which corresponds to the proportion of actual negativesthat are predicted as negatives:
High values for these measures generally corresponds to good classifiers.If, for example, every positive entity is predicted as positive then
will be , but that is of course true if also all the negativeentities are predicted as positive as well. This is not a very goodclassifier of course, as in this case the will be . Thus, ifeither or is used when a classifier is evaluated,it is necessary that the other be taken into account as well.
26

3.3. Calculations and statistical methods
Figure 3.2: A receiver operatingcharacteristic curve. The area underthe curve is here referred to as AUC.
AUC
The next two measurements are ( )and ( ) which corresponds to the pro-portion of positive and negative predictions which are correct, respec-tively [81]:
These predictive values depend on the , i.e., the proportionof positive entities in the population they are sampled from. Thatmeans that in order to use and a has to be chosenand if the of the population is unknown this is problematic.However, and can still be used [82].
Finally there is , which corresponds to proportion of cor-rect classifications:
where is the number of positives and is the number of negatives.The measurement is a simple way of evaluating binary clas-sifiers.
Area under the receiver operating characteristic curve
Quite commonly binary classifiers are constructed by first producing ascore between and corresponding to some sort of estimate of theprobability of an entity being positive. In order to determine whichentities in fact are to be predicted as positive, a cut-off needs to bedetermined. E.g., if the score is higher than it could be regarded asa prediction that the entity is positive. However, the determinationof this cut-off threshold can be difficult to do and it often dependson whether high or high is most desired (andhow low a value for the other measurement is acceptable) in a specificproject. Thus, it might be of interest to evaluate a classifier withouthaving to set this threshold; that is to, sort of, look at an average valuefor all possible thresholds. It is also always useful to have one singlevalue for the performance of a classifier. One such value is derived from
27

3. Materials and methods
the Receiver Operating Characteristics (ROC) curve by calculating thearea underneath it (AUC) [83].
A ROC curve (Figure 3.2) plots the performance of a binary clas-sifier as the threshold used for cut-off is varied. On the vertical axisthe is plotted and on the horizontal axisis plotted. The area underneath the curve is usually known as AUC.Generally, the bigger AUC the better the classifier. An AUC of cor-responds to a random classification, i.e., the diagonal line in Figure 3.2.For the general problem of evaluating machine learning algorithmsthe ROC curve is commonly used for characterisation and AUC is arecommended measurement for comparison of accuracy [84]. AUCalso has the nice property of corresponding to the probability that arandomly chosen positive has a higher score than a randomly chosennegative [85].
Net reclassification improvement
It has been indicated in the literature that the statistical power of AUCis not always as high as it would be wished for [86], and Net Reclas-sification Improvement (NRI) has been suggested as a higher powercomplement to AUC [87]. The classifier outputs a list of moleculesranked by their probability to belong to a certain class. Comparison ofperformance between two predictors can be done by comparing thecorresponding ranked lists. NRI is based on whether positives ( ) andnegatives ( ) have moved up or down when comparing two rankedlists according to:
NRI
where is a movement indicator defined as:
for upward movement
for no movement
for downward movement
where and are sets of negative and positive observations, respec-tively, is the number of negatives (i.e. the cardinality of N),
is the number of positives (i.e. the cardinality of P), and thevariables and index the elements in and , respectively.
Non-superiority testing
In the field of medicine, randomised blinded controlled trials wheredrug effect is evaluated against placebo is considered the golden stan-dard [88]. Such a trial is called a superiority trial and tries to prove
28

3.3. Calculations and statistical methods
that a drug has an effect compared to a placebo. This is usually doneby rejecting the null hypothesis ( ) that the two treatments have thesame effect based on the observed data ( ) [89]. However,when working with fatal diseases, for which a curing treatment is al-ready known, it is problematic to run a trial in which some patientsreceive placebo. Perhaps the new drug indeed is cheaper or have lessside effects but it still needs to be shown to have an effect. In thissituation a non-inferiority trial with the aim of showing that the newdrug is not necessarily better than an old tested drug but at least notworse might be an alternative. This is done by rejecting the null hy-pothesis that the new drug is worse than the old one with a marginal
( , where is the difference between the old and thenew drug).
In paper IV a similar problem materialised in the problem of choos-ing a signature height cut-off. Each extra height-level corresponded toa much bigger footprint with respect to memory usage and executiontime. However, each extra level meant the addition of more infor-mation and more information should lead to a better model. Thus, amargin for how big a difference in model performance that wouldbe meaningful was decided on and then the height was found by aseries of non-superiority trials where the null hypothesis that the dif-ference between two height levels where bigger than the margin couldbe rejected when the sought after height was found ( ).
29


Chapter 4
Results
4.1 Scripting in a workbench for the life sciences
Paper I introduces a fully scriptable open source software for the lifesciences in which the researcher can access the tools needed in the dailywork from a graphical user interface. The paper describes a completerewrite of the open source workbench Bioclipse [64] which lead toversion 2 of the workbench, and which was a necessary technical stepto allow the efficient implementations of other aspects of this thesis.The motivation for this was briefly mentioned above in the problemsinherent to the Bioclipse 1 platform. The major difference in designfor version 2 was the use of the Spring framework [90] for AspectOriented Programming (AOP) and more tangibly the separation of
Figure 4.1: The Bioclipse Scripting Language, JavaScript variant. These are the latestversions of the scripts appearing in Paper I Figure 2 page 64.
31

4. Results
Figure 4.2: Bioclipse 2.0 introduced a molecules table able to open and browsegigabyte sized files with molecules.
control code into separate classes called managers. The managers wereinjected into a JavaScript environment to create what was called theBioclipse Scripting Language (BSL) (see Figure 4.1).
Version 2.0 mainly constituted a rewrite of the functionality fromversion 1. Bioclipse 2 also contains a rewritten editor for chemicalstructures (JChemPaint) and introduced a table for multiple molecu-lar structures (Figure 4.2) that supported browsing of gigabyte sizedmolecule collection files.
Scripting in Bioclipse was set up to be accessed interactively througha console view, or in a more batch-like fashion by running JavaScriptfiles (for example, written in the JavaScript editor inside Bioclipse).JavaScript was chosen as the scripting language for Bioclipse 2 but thereis nothing JavaScript-specific about the way the manager objects wereused. In fact Bioclipse scripting console views with the manager objectsinjected into other scripting languages were successfully tested at a latertime [91] and was functional in the 2.6 release. In the 2.6.2 version
32

4.2. A laboratory information system for microtiter plates
of Bioclipse scripting console views for the three scripting languagesJavaScript, Groovy and Python is available in the workbench.
4.2 A laboratory information system for microtiter plates
Laboratory Information Systems (LISs) are often heavy weight, expen-sive and complicated to manage. In Paper II a light-weight, open-sourceLIS for working with dose-response experiments on microtiter plateswas introduced. It was built for the substance screening taking place instudies of cytostatica resistance at the division of Clinical Pharmacologyat the Uppsala University Hospital, but includes much of general thingsthat applies when working with microtiter plates, such as plate layouts,controls and Excel-like calculation formulæ to compile the results. Theplate layouts specifies which wells should be used for controls, dilutionseries, blanks, and so on.
The system, named Brunn, is a LIS with a point and click inter-face for managing plate layouts and screening data. It can producedose response curves and calculate IC -values (Figure 4.3) using thecalculation formulæ. The representation of a plate is built up in an iter-ative process where the layouts and calculation formulæ can be reused.Brunn automatically performs some calculations, such as coefficient of
Figure 4.3: Paper II introduced the laboratory information system Brunn whichamong other things can be used for creating dose-response curves and calculateIC50 values for dose-response studies with microtiter plates.
33

4. Results
Instrument
Measurement
Result
AbstractOperation
WorkList SampleContainer
WellFunction
AbstractSample
PatientSample
PatientOrigin
CellSample
CellOrigin
DrugSample
DrugOrigin
SampleMarker
Well AbstractPlate
Plate MasterPlate
AbstractWell
LayoutWell
LayoutMarker
AbstractBasePlate
PlateLayout
PlateType
PlateFunction
UniqueFolder Folder «BrunnObject» AuditLog User
Figure 4.4: A simplified version of Brunn’s data model. The figure is an adaptation ofFigure 1 in Paper II.
variation for wells marked as controls. Other user-specified calculationscan be entered manually.
The Brunn database ensures that data can be retrieved in a consistentmanner over time. Figure 4.4 shows a simplified version of the Brunndata model. BSL can be used to retrieve data in a batch-like manner,or the SQL database can be queried directly. The decision to baseBrunn on Bioclipse meant that the scripting functionality as well asthe reporting framework (based on JasperReports [92]) was alreadyavailable.
4.3 Molecular fingerprints based on signatures
In Paper III a chemical fingerprint based on the molecular signaturesdescriptor for predicting target binding by nearest neigbour based onthe Tanimoto distance was evaluated. The open source Java-projectCDK [65, 66] was extended to support count fingerprints and sparserepresentations of fingerprints. The new signature fingerprints werethen implemented in CDK and made available from the CDK coderepository which can be found at https://github.com/cdk. A dataset wasextracted from ChEMBL and used for time-based evaluation of theperformance of the signature fingerprint when compared to a few otherfingerprints.
Based on the AUC values together with the higher statistical powerof the NRI values the count signature fingerprint was found to perform
34

4.4. Effects of parameter variation in signature fingerprint support vector machine models
on par with the industry standard ECFP6 fingerprint generated fromPipeLine Pilot, and with the AstraZeneca in-house fingerprint ECFI(see Table 4.1). The count signature fingerprint was found to be slightlymore powerful than the bit fingerprint, but it requires more memoryand computation power.
Table 4.1: AUC values and NRI values in comparison to the bit signature fingerprintfor the data from Paper III with 95% confidence interval in parentheses. UsingBonferroni corrections the corresponding 0.05 p-value threshold becomes 0.00714for AUC and 0.0083 for NRI. Tc,1 and Tc,2 refers to two different ways ofgeneralising the Tanimoto coefficient to count fingerprints. See Paper III for alldetails regarding the fingerprints.
AUC p-value NRI p-value
Bit sign. Fp.
Count sign. Fp.( , )
Count sign. Fp.
CDK extended)
FOYFI
ECFP
ECFI
4.4 Effects of parameter variation in signature fingerprintsupport vector machine models
In Paper IV we studied the effect of varying the , andparameters when building QSARmodels using the signature fingerprintsand SVM. We tested a large number of different and values inlogarithmic steps with from to and fromto and repeatedly found that we got good result with betweenand and between and . In order to determine a goodcombination of heights we, somewhat arbitrarily, decided that a AUCof was a relevant difference and using the best combination ofand for each set up we started from and continuously addedone height at a time to the fingerprint until adding another height wasnon-superior compared to not adding another height. The results forthis are summarised in Table 4.2. Based on the non-superiority tests inTable 4.2 for the bit fingerprint it can be concluded that the addition of
35

4. Results
signature height 4 was non-superior to staying at height 3; and for thecount fingerprint the addition of height 3 was non-superior to stayingat height 2. However we did get a significant difference (a positiveconfidence interval) when adding height 3 for the bit fingerprint butthe difference was not large enough to turn up in the non-superioritytest.
In Bioclipse Decision Support [93] a molecule visualisation canbe coloured by the molecular signatures that contribute the most tothe prediction. Since signature corresponds to just atomtypes, colouring the molecule visualisation by that information isn’tvery meaningful; e.g., all atoms of one type would get the same colour.In our studies we also tried to continuously remove the lowest heightand found that did not make any relevant contribution to theperformance. This means that when building QSAR models, to be usedby the visualising framework in Bioclipse Decision Support, signature
can be removed without any problem.
Table 4.2: Wilcox tests from Paper IV performed on the best performingcombination of and C with 95% confidence intervals in parentheses. Thep-values come from the non-superiority Wilcox tests performed on the change inAUC when another height was added using H0: AUC>0.01.
Bit fingerprint Count fingerprint
AUC p-value AUC p-value
height 0
adding height 1
adding height 2
adding height 3
adding height 4
adding height 5
4.5 QSAR regression models from large training sets
In Paper V we set out to test how many substances we could use in thetraining set when building QSAR regression models using the signaturedescriptor and SVM.We tested a distributed RBF kernel based approachusing SVM and a linear SVM approach using LIBLINEAR. In Paper IVwe found a sweet-spot for the values of and for classification and
36

4.5. QSAR regression models from large training sets
Figure 4.5: In Paper V Bioclipse DS was extended to support LIBLINEAR modelsand two QSAR models for LogD regression were made available from withinBioclipse. The bottom left view shows the two models’ predictions of LogD valuesfor the tested molecule.
in Paper V we found a similar sweet-spot for regression. The LIBLIN-EAR software was (as advertised) dramatically faster than SVM, and italso showed very similar performance in Root Mean Square Deviation(RMSD). Bioclipse was extended to handle LIBLINEAR models and twosuch models were made available from Bioclipse (see Figure 4.5). Oneof these models was based on thousand molecules and the other onewas based on million molecules.
37

Chapter 5
Discussion
5.1 The power of an open source graphical user interfacecombined with a scripting language
Geldenhuys et al. [61] argued in 2006 that much open source softwarefor drug discovery exist but that it suffers from being difficult to install,manage and use because of being designed not for Windows systemsbut for Unix based platforms, and that much of it comes with bad userinterfaces. Packaging these sort of tools as an easy to install programwith a unified graphical user interface in the way that the Bioclipseproject does should be a step in the right direction. In order to havethese programs communicate with each other Bioclipse has to act as anintegration platform that knows what parameters different software use,what file format different software need, and how to translate betweenthese file formats and then run all the different software smoothly.Such a system promises for great increases in both productivity andcreativity.
It is not always so easy to predict and create an easy to use graphicalworkbench for all problems that a user might want to solve. Anotherapproach often used in the field is, so called, workflow systems, e.g.,Taverna [94, 95] and Knime [96], in which the researcher puts togethercomponents into a workflow. Each node interacts with data and passesdata on in a data flow. This seems like a very good way of setting up astandard operation once all the details of each step in that operation iswell known. However, in science it is common to iteratively try differ-ent things, and then perhaps take a step back and try something else.For this situation we believe that a programming language is a bettertool. To provide a programming language from within the graphicaluser interface makes it possible to handle many more situations than
39

5. Discussion
not providing one. This iteratively trying of things is something that thefamily of programming languages known as scripting languages are some-what suited for as many of them provide a command line mode wherecode statements can be given one at a time as opposed to the approachwhere everything must be first written and then compiled, which is thecase for many other families of programming languages. Even if a useris not capable of writing their own scripts, maybe someone else canwrite them for him or her. Another effect of introducing scripting inBioclipse is that it has proven a very pleasant way of development, firstto write a Bioclipse manager and then test-run it from the scriptingenvironment before building a GUI for it.
It is thus my opinion that the combination of graphical point-and-click interface and scripting which is provided by Bioclipse 2 is avery powerful, and suiting mix. Today Bioclipse includes for exampleQSAR [97], site-of-metabolism prediction [98], a framework for deci-sion support [93], semantic web support [99], and integration withthe statistical programming language R [100]. All of these featuresdepend on the foundations set in the 2.0 version.
As mentioned before, Brooks [73] claims that the first version of thesoftware could be thought of as a pilot version and the lessons learnedin building it could be used in building the next version. Brooks thenalso warns about the “second-system effect” [101], in that the secondsystem might be an over-designed beast full of all the things that wasnot done in the first system but saved for another day. In some casesthis might have been for a good reason; perhaps the cost of the workinvolved simply would be more than the gain of actually having it done.Maybe we are all doomed to fall into the second-system effect pit andbuild a huge over-designed monster when building version 2. Lately ithas been painfully obvious that Bioclipse 2 is laden with dependenciesand a heavy core that makes it hard to integrate into other OSGi basedprojects in the field. This integration of Bioclipse components intoother systems is something that we did not have in mind at all whendesigning version 2.
5.2 Lessons from a laboratory information system
In 2007 I started work on a laboratory information system for thedivision of Clinical Pharmacology at the Uppsala University Hospitalnamed Brunn. Alternatives available at that time were a hard to managecommercial LIS and Excel spreadsheets. At that time Brunn was mainlydesigned as an easier to use, tailormade system for the scientists. In2009 Brunn was suggested for use in a clinical setting and work beganto integrate it into a clinical referral system where patient samples are
40

5.3. QSAR studies using SVM and molecular signatures
analysed. The first clinical referrals answered using Brunn was donein the beginning of 2015. Brunn is finally at use in the location it wasbuilt for and although I have received inquires about Brunn I do notknow of it being used anywhere else.
Brunn was designed using a bottom up approach which althoughit works very well led to a slightly over-designed data model. Thereare unused things in the data model that do not add anything that iscurrently needed and which should probably have been removed atsome earlier point. Although these extra database tables neither havepositive nor negative effects today they make it more complicated fora new person to come in and add new functionality to Brunn simplybecause they add complexity to the model.
In the beginning there was hope for synergy effects between Bio-clipse and Brunn. I learned a lot about how to work with databases inthe Bioclipse setting. However, in the end it turned out that the Brunnusers regard a drug as simply a name and thus are (at least so far) notvery interested in the cheminformatics tools found in Bioclipse. TheEclipse based GUI was very useful for building the Brunn UI though,and also the scripting environment from Bioclipse 2 was, at least tosome degree, useful when developing further Brunn components.
5.3 QSAR studies using SVM and molecular signatures
When using the RBF kernel with SVM both the parameters andhave to be determined. In Paper IV an extensive grid search through
and for a group of classification datasets covering a wide numberof use cases was performed. The same sweet spot was repeatedly found,meaning that when using the signatures descriptor together with RBFbased SVM the full grid search does not seem to be necessary. A slightdifference was noted among the datasets so a grid search around thesweet spot values might be of value in some cases. In Paper V theregression case was tested with the result that a very similar sweet spotseemed to exist for the regression. The best performing andcombinations for the two models were not the same but neighbouringgrids in the grid searches performed the best and if the grids would havebeen placed slightly differently it is reasonable to believe that the samecombination would have turned up. Thus it seems like similar defaultvalues for and can be used for both regression and classificationusing the signatures descriptor together with an RBF based SVMwithoutthe risk of under-performing too badly.
In Paper V we explored the use of the linear SVM found in theLIBLINEAR software for SVM based QSAR-modelling based on themolecular signatures descriptor. For the large data set tested the vastly
41

5. Discussion
faster approach used in LIBLINEAR made it possible to train a modelusing the entire dataset. Although the methods seemed to performsimilarly well for datasets of the same size in our study, a more thoroughstudy to ascertain that the predictive performance of LIBLINEAR is asgood as RBF SVM on QSAR datasets seems prudent. If that would befound to be the case there probably is no reason to not use the faster,but less tested, LIBLINEAR approach also for smaller datasets.
5.4 The problem of evaluating binary QSAR classification
For the field of virtual screening the AUC has been criticised for nothandling the “early recognition” problem, and other measurements suchas BEDROC has been suggested [102]. Although AUC corresponds tothe probability that a randomly chosen positive has a higher score thana randomly chosen negative, that is just true on the average. Whenworking with a ranked list of substances in a virtual screening perhapsonly a fixed number of best scoring substances are further evaluated.Thus the argument in that case is that what is interesting to evaluate isnot performance on average, but performance among the top scorers.One reason might for example be that the in silico method is used forchoosing a subset of molecules to test experimentally in vitro, and ex-perimental testing comes with higher costs so only the best performersin silico go on to the in vitro step.
In 2008 Nicholls [85] wrote a text that, among other things, arguedthat the importance of “early recognition” is based on an assumed coststructure that may or may not hold. For example, if it is consideredunthinkable to have a screening method that miss some of the positiveentities then that corresponds to assigning an infinite cost for a . Ifexplicit costs could be assigned for , , , and then it would bepossible to say whether early recognition was indeed important for theproblem and to know what value to set for the parameter of methodsdeveloped for early recognition determining how much the measure-ment should focus on the top of the list. Without a cost structure allthe early recognition weight parameter does is to complicate compar-isons between studies. Also, the BEDROC measurement depends onthe number of actives and inactives in the study, and the BEDROCmeasurement has been observed to be strongly correlated with theAUC [85]. Thus, for the studies that are described in Paper III the AUCmeasurement was used.
42

5.5. Visions for the future
5.5 Visions for the future
It seems that the Bioclipse future might be a version 3 with similarfunctionality but redesigned to be easier to use inside other OSGi basedsystems. Also a GUI free version of Bioclipse consisting of only the BSLwould be a powerful way to run batchlike cheminformatics operationson a compute cluster.
The next step on QSAR models in Bioclipse is to produce QSARmodels using conformal prediction and publish those using Bioclipse.A conformal predictor is a type of confidence predictor; the conformalpredictor does not give a single value but a region which with a specifi-able confidence level will cover the correct value [103]. This meansthat instead of the user needing to worry about whether the QSARmodel was applicable for the tested substance the model will give awide confidence region when unsure and a narrower one when moresure. A future addition of conformal prediction to ease the interpreta-tion of the results as well makes the future of QSAR in Bioclipse seemlike a bright one.
We have shown that it is possible to build QSAR models based onmillion substances, and that they can be made easily reachable for
users through the Bioclipse workbench. The fact that all this is madewith open-source software means that not only big pharmaceuticalcompanies can afford it. Providing these kind of tools under and opensource license means that smaller companies and academics can po-tentially use the tools for producing medicine against less profitablediseases.
43


Chapter 6
Conclusions
The studies in this thesis have developed new and improved ligand basedmethods and open source software for pharmaceutical bioinformaticsand made some of these new tools available through the Bioclipseworkbench. The main conclusions from the papers were:
• The second version of Bioclipse has full support for scriptingusing a number of scripting languages.
• A laboratory information system for microtiter plates namedBrunn with a database where results are stored for future researchwas constructed as a Bioclipse plugin and is now in use.
• Open source molecular fingerprints were created based on thesignature descriptor and found to perform on par with industry-standard fingerprints for target prediction by nearest neighbourTanimoto on binding data extracted from ChEMBL.
• The effect of different parameter values when using our finger-prints together with SVM was studied and height to , SVMparameters from to and from to were foundto be a good set of values as they performed well on average.
• The linear SVM implementation in LIBLINEAR software wasfound to be perform on par with the RBF SVM in SVM on QSARmodelling, but vastly faster. In fact, so much faster that largertraining sets could be used which resulted in a model with muchbetter performance than the best of the models built using SVM.The obtained models were published in Bioclipse.
45


Chapter 7
Acknowledgements
This work was carried out at the Department of Pharmaceutical Bio-sciences, division of Pharmacology, Faculty of Pharmacy, Uppsala Uni-versity, Sweden.
I would like to thank:
My main supervisor professor Jarl Wikberg for giving me thisopportunity and all the freedom I could ask for. You have anincredible way of answering E-mails at whatever time of theday and regardless of wherever on the planet you currently arelocated!
My co-supervisors for guiding me and rescuing me when things didn’tquite work out. Ola Spjuth, without your positive enthusiasm,leadership and visions this would never have happened. Youare probably the best person imaginable to have in a supervisorteam. Martin Eklund, you came in and rescued a projectthat had lost its drive and manoeuvrability and in the processmanaged to teach me a lot about statistics and about organisinga scientific text. Thank you. Claes Andersson, thank you forall our long conversations over lunches or over Friday nightbeers. Thanks for listening to my strange thoughts aboutstatistics and thanks for explaining both the embarrassingly easyand the sometimes strange and peculiar statistics questions Ihave thrown at you. If only I had started questioning you aboutthese things much earlier! Rolf Larsson, you gave me theopportunity to do my master thesis work, the Brunn-project,and took the co-supervisor role at the start before handing itover to Claes. I think it all turned out excellently!
47

7. Acknowledgements
My fellow Bioclipse developers and in particular, Carl Mäsak I havelearned a lot from you, and I hope to get to play Hex againstyou again some day soon. We had fun designing Bioclipse 2,and I hope you have had as much fun out in the “real world” faraway from the University . Egon Willighagen, your passionfor open source and cheminformatics as well as your enthusiasmfor new projects never cease to amaze me. Arvid Berg myfellow gamer, will you ever come back to EVE? You finally gotthe Bioclipse build process tamed! Where would Bioclipsebe today without you? Samuel Lampa, it’s been a pleasureworking together with you and I look forward to more projects.Valentin Georgiev who also seem to have been stung by thebee-keeping hobby. I hope you will find it as interesting as Ido! Wesley Schaal thanks for deepening my knowledge of theEnglish language and thanks for proofing my thesis. Hope wewill play more board games soon!
The teacher team, including Lena Bergström, Anne-Lie Svensson,Ingrid Nylander, Ernst Oliw who has supported me when Ihave been in the student lab teaching receptor binding andpipetting. It is not always so easy for a computer guy in the labbut you have put up with me and in the end I think I managedreally OK thanks to you. Tomas Nilsson thanks for introducingme to the course lab. Loudin Daoura, Linnea Granholm,Stina Lundberg, Anneli Wennman and Sara Palm thanks forhelping me out with teaching in the course lab. And Sara, yeathat statistics report we did sure was aesthetically pleasingwasn’t it? And I learned a lot! Johanna Svensson, withoutyou I don’t know how we would manage. Also thank you tothe rest of the teachers Shima Momeni, Erika Roman andInga Hoffman.
Colleagues Polina Georgiev, Maris Lapins, Iryna Shutava, Aleh Ya-horau and, always so helpful, Sviatlana Yahorava.
Co-authors, Lars Carlsson, Ola Engkvist, Gilleain Torrance, Ste-fan Kuhn, Tobias Noeske, Christoph Steinbeck, and Jo-hannes Wagener.
All other people I have met working at the Department of Pharmaceu-tical Biosciences at BMC. Magnus Jansson and Tobias Holmmy gratitude for keeping my computer working can notbe underestimated. Agneta Hortlund, Marina Rönngren,Kjell Åkerlund, Magnus Efverström, and Ulrica Bergströmthanks for making things run smoothly. Erica Johansson youwere the best and you will always be missed!
48

The computer game EVE online and all fellow gamers, especiallythemightyhunter. EVE has provided both distraction and anexcellent reason and platform for practising the English language.Something that definitely has been helpful in the process ofwriting this thesis.
Tuesday lunches as Yukikos Sushi, it just isn’t Tuesday without sushiin Sommarro.
My family, Mamma, although Uppsala is nice I will always missyour food! (Except maybe on Tuesday lunches) Pappa, I stillremember the feeling the day you no longer could answer everysingle one of my questions of how? and why? I guess since Ican remember it that must mean I was quite old at that timeand that you had patiently answered many questions by then.Emil , brother, how can we be so alike but yet with so differentinterests? Oh well, I guess the world will always need historyteachers! Jenny, my little sister, why does it feel so scary towrite something for you? Maybe you, as a new psychologist,can answer that? Congrats by the way, you are not so little anylonger!
and
Finally, and most importantly Cecilia, thanks for sharing my life andfor putting up with me this last (I was about to say couple ofmonths but we both know I started panicking about this muchearlier than that, so let’s go with the word) time. Anyways, nowthe thesis is written and there is not a thing left to worry about!
…or is there? What was it you said about lifeafter the thesis defence again?
// Jonathan Alvarsson
49


Referencesfor chapter 1 to 6
[1] Overington, J. P.; Al-Lazikani, B.; Hopkins, A. L. How many drugtargets are there? Nature reviews drug discovery 2006, 5, 993–6.
[2] Hartenfeller, M.; Schneider, G. De novo drug design. Methods inmolecular biology (Clifton, N.J.) 2011, 672, 299–323.
[3] Hubbard, R. E. Can drugs be designed?Current opinion in biotechnology1997, 8, 696–700.
[4] Ashburn, T. T.; Thor, K. B. Drug repositioning: identifying and devel-oping new uses for existing drugs. Nature reviews drug discovery 2004,3, 673–683.
[5] Molinari, G. In Pharmaceutical Biotechnology; Springer: 2009; Chap-ter Natural products in drug discovery: present status and perspectives,pp 13–27.
[6] Collier, R. Drug development cost estimates hard to swallow. CMAJ :Canadian medical association journal = journal de l’Association medicalecanadienne 2009, 180, 279–80.
[7] Morgan, S.; Grootendorst, P.; Lexchin, J.; Cunningham, C.; Greyson,D. The cost of drug development: a systematic review. Health policy2011, 100, 4–17.
[8] Scannell, J. W.; Blanckley, A.; Boldon, H.; Warrington, B. Diagnosingthe decline in pharmaceutical R&D efficiency. Nature reviews drugdiscovery 2012, 11, 191–200.
[9] Edwards, I. R.; Aronson, J. K. Adverse drug reactions: definitions,diagnosis, and management. The lancet 2000, 356, 1255–1259.
[10] Lazarou, J. Incidence of Adverse Drug Reactions in HospitalizedPatients: A Meta-analysis of Prospective Studies. JAMA: the journal ofthe American medical association 1998, 279, 1200–1205.
[11] Tanrikulu, Y.; Krüger, B.; Proschak, E. The holistic integration ofvirtual screening in drug discovery. Drug discovery today 2013, 18,358–364.
51

References for chapter 1 to 6
[12] The academic pursuit of screening. Nature chemical biology 2007, 3,433–433.
[13] Drecker, S. Necessity is the Mother of Invention. GIT labor-fachzeitschrift 2004.
[14] Astle, T. W. Recollections of Early Microplate Automation. Journal ofthe association for laboratory automation 2000, 5, 30–31.
[15] Yung-Chi, C.; Prusoff, W. H. Relationship between the inhibition con-stant ( ) and the concentration of inhibitor which causes 50 per centinhibition ( ) of an enzymatic reaction. Biochemical pharmacology1973, 22, 3099–3108.
[16] Kalliokoski, T.; Kramer, C.; Vulpetti, A.; Gedeck, P. Comparabilityof Mixed IC50 Data - A Statistical Analysis. PloS one 2013, 8, ed. byCavalli, A., e61007.
[17] Sliwoski, G.; Kothiwale, S.; Meiler, J.; Lowe, E. W. Computationalmethods in drug discovery. Pharmacological reviews 2014, 66, 334–395.
[18] Martin, Y. C.; Kofron, J. L.; Traphagen, L. M. Do structurally sim-ilar molecules have similar biological activity? Journal of medicinalchemistry 2002, 45, 4350–4358.
[19] Waszkowycz, B.; Perkins, T. D. J.; Sykes, R. A.; Li, J. Large-scale virtualscreening for discovering leads in the postgenomic era. IBM systemsjournal 2001, 40, 360–376.
[20] Dahlbom, B. The new informatics. Scandinavian journal of informationsystems 1996, 8, 29–48.
[21] Friedman, C. P. What informatics is and isn’t. Journal of the Americanmedical informatics association 2013, 20, 224–226.
[22] Groth, D.; MacKie-Mason, J. Why an informatics degree? Communi-cations of the ACM 2010, 53.
[23] He, S. Informatics: a brief survey. Electronic library, the 2003, 21, 117–122.
[24] Wikberg, J.; Eklund, M.; Willighagen, E.; Spjuth, O.; Lapins, M.; En-gkvist, O.; Alvarsson, J., Introduction to pharmaceutical bioinformatics;Oakleaf Academic: 2010.
[25] Codd, E. F. A relational model of data for large shared data banks.Communications of the ACM 1970, 13, 377–387.
[26] Bachman, C. W. The programmer as navigator. Communications of theACM 1973, 16, 653–658.
[27] Codd, E. F. Relational database: a practical foundation for productivity.Communications of the ACM 1982, 25, 109–117.
[28] Xu, J.; Hagler, A. Chemoinformatics and drug discovery. Molecules2002, 7, 566–600.
52

[29] Kurt Wegner, J.; Sterling, A.; Guha, R.; Bender, A.; Faulon, J.-L.; Hast-ings, J.; O’Boyle, N.; Overington, J.; van Vlijmen, H.; Willighagen,E. Cheminformatics-Open-source chemistry software and moleculardatabases broaden the research horizons of drug discovery. Communi-cations of the ACM-Association for computing machinery-CACM 2012,55, 65.
[30] Brown, F. K. Chemoinformatics: What is it and how does it impactdrug discovery. Annual reports in medicinal chemistry 1998, 33, 375–384.
[31] Hann, M.; Green, R. Chemoinformatics – a new name for an oldproblem? Current opinion in chemical biology 1999, 3, 379–383.
[32] Wild, D. J. Grand challenges for cheminformatics. Journal of chemin-formatics 2009, 1, 1.
[33] Hansch, C. Quantitative approach to biochemical structure-activityrelationships. Accounts of chemical research 1969, 2, 232–239.
[34] Molecular descriptors calculation - Dragon - Talete srl., http://www.talete.mi.it/prod-ucts/dragon_description.htm (accessed 04/10/2015).
[35] Fechner, U.; Paetz, J.; Schneider, G. Comparison of three holographicfingerprint descriptors and their binary counterparts. QSAR & combi-natorial science 2005, 24, 961–967.
[36] Faulon, J.-L.; Visco, D. P.; Pophale, R. S. The signature moleculardescriptor. 1. Using extended valence sequences in QSAR and QSPRstudies. Journal of chemical information and computer sciences 2003,43, 707–20.
[37] Faulon, J.-L.; Churchwell, C. J.; Visco, D. P. The signature moleculardescriptor. 2. Enumerating molecules from their extended valencesequences. Journal of chemical information and computer sciences 2003,43, 721–734.
[38] Faulon, J.-L.; Collins, M. J.; Carr, R. D. The signature molecular de-scriptor. 4. Canonizing molecules using extended valence sequences.Journal of chemical information and computer sciences 2004, 44, 427–436.
[39] Stumpfe, D.; Bajorath, J. Similarity searching. Wiley interdisciplinaryreviews computational molecular science 2011, 1, 260–282.
[40] Rogers, D. J.; Tanimoto, T. T. A computer program for classifyingplants. Science 1960, 132, 1115–1118.
[41] Flower, D. R. On the properties of bit string-based measures of chem-ical similarity. Journal of chemical information and computer sciences1998, 38, 379–386.
[42] Willett, P. Similarity-based virtual screening using 2D fingerprints.Drug discovery today 2006, 11, 1046–1053.
[43] Kohavi, R.; Provost, F. Glossary of terms. Machine learning 1998, 30,271–274.
53

References for chapter 1 to 6
[44] R Andersson, C.; G Gustafsson, M.; Strombergsson, H. Quantitativechemogenomics: machine-learning models of protein-ligand interac-tion. Current topics in medicinal chemistry 2011, 11, 1978–1993.
[45] Sheridan, R. P.; Kearsley, S. K. Why do we need so many chemicalsimilarity search methods? Drug discovery today 2002, 7, 903–911.
[46] Boser, B. E.; Guyon, I. M.; Vapnik, V. N. In Proceedings of the fifthannual workshop on Computational learning theory, 1992; Chapter Atraining algorithm for optimal margin classifiers, pp 144–152.
[47] Cortes, C.; Vapnik, V. Support-vector networks. Machine learning1995, 20, 273–297.
[48] Hastie, T.; Tibshirani, R.; Friedman, J.; Hastie, T.; Friedman, J.; Tibshi-rani, R., The elements of statistical learning; 1; Springer: 2009; Vol. 2.
[49] Hsu, C.-W.; Chang, C.-C.; Lin, C.-J., et al. A practical guide tosupport vector classification., http://www.csie.ntu.edu.tw/~cjlin/paper-s/guide/guide.pdf (accessed 04/10/2015).
[50] Chang, C.-C.; Lin, C.-J. LIBSVM: a library for support vector machines.ACM transactions on intelligent systems and technology (TIST) 2011, 2,27.
[51] Fan, R.-E.; Chang, K.-W.; Hsieh, C.-J.; Wang, X.-R.; Lin, C.-J. LIB-LINEAR: A library for large linear classification. The journal of machinelearning research 2008, 9, 1871–1874.
[52] Ritchie, D. M.; Thompson, K. The UNIX Time-Sharing System. Thebell system technical journal 1978, 57, 1905–1929.
[53] Hars, A.; Ou, S. Working for free? Motivations of participating inopen source projects. International journal of electronic commerce 2002,6, 25–39.
[54] Stallman, R. The GNU Manifesto., http://www.gnu.org/gnu/mani-festo.html (accessed 04/10/2015).
[55] Raymond, E. The cathedral and the bazaar (and extended versionfrom http://www.unterstein.net/su/docs/CathBaz.pdf). Knowledge technol-ogy policy 1999, 12, ed. by O’Reilly, T., 23–49.
[56] Leonard, A. Let my software go!, http://www.salon.com/1998/03/30/fea-ture947788266/ (accessed 04/10/2015).
[57] Hecker, F. Setting up shop: The business of open-source software.Software, IEEE 1999, 16, 45–51.
[58] Mockus, A.; Fielding, R. T.; Herbsleb, J. D. Two case studies of opensource software development: Apache and Mozilla. ACM transactionson software engineering and methodology 2002, 11, 309–346.
[59] Maslow, A. H. A theory of human motivation. Psychological review1943, 50, 370.
[60] Knuth, D. E., Digital Typography; Publications, C., Ed.; CSLI LectureNotes 78 2, Vol. 249; CSLI Publications: 1999; Chapter 1, pp xvi +685.
54

[61] Geldenhuys, W. J.; Gaasch, K. E.; Watson, M.; Allen, D. D.; Van derSchyf, C. J. Optimizing the use of open-source software applicationsin drug discovery. Drug discovery today 2006, 11, 127–32.
[62] DeLano, W. L. The case for open-source software in drug discovery.Drug discovery today 2005, 10, 213–7.
[63] Ghosh, R. A. Interviews with Linus Torvalds:What motivates softwaredevelopers., http://firstmonday.org/ojs/index.php/fm/article/view/1475/1390(accessed 04/10/2015).
[64] Spjuth, O.; Helmus, T.; Willighagen, E. L.; Kuhn, S.; Eklund, M.;Wagener, J.; Murray-Rust, P.; Steinbeck, C.; Wikberg, J. E. S. Bioclipse:an open source workbench for chemo- and bioinformatics., eng BMCbioinformatics 2007, 8, 59.
[65] Steinbeck, C.; Han, Y.; Kuhn, S.; Horlacher, O.; Luttmann, E.;Willigha-gen, E. The Chemistry Development Kit (CDK): an open-source Javalibrary for Chemo- and Bioinformatics. Journal of chemical informationand computer sciences 2003, 43, 493–500.
[66] Steinbeck, C.; Hoppe, C.; Kuhn, S.; Floris, M.; Guha, R.; Willighagen,E. L. Recent developments of the Chemistry Development Kit (CDK)- An open-source java library for chemo- and bioinformatics. Currentpharmaceutical design 2006, 12, 2111–2120.
[67] Herráez, A. Biomolecules in the computer: Jmol to the rescue. Bio-chemistry and molecular biology education 2006, 34, 255–261.
[68] Hanson, R. M. Jmol-a paradigm shift in crystallographic visualization.Journal of applied crystallography 2010, 43, 1250–1260.
[69] Krause, S.; Willighagen, E.; Steinbeck, C. JChemPaint-using the collab-orative forces of the internet to develop a free editor for 2D chemicalstructures. Molecules 2000, 5, 93–98.
[70] Holland, R. C. G.; Down, T. A.; Pocock, M.; Prlic, A.; Huen, D.; James,K.; Foisy, S.; Drager, A.; Yates, A.; Heuer, M.; Schreiber, M. J. BioJava:an open-source framework for bioinformatics., eng Bioinformatics2008, 24, 2096–2097.
[71] Pillai, S.; Silventoinen, V.; Kallio, K.; Senger, M.; Sobhany, S.; Tate, J.;Velankar, S.; Golovin, A.; Henrick, K.; Rice, P., et al. SOAP-basedservices provided by the European Bioinformatics Institute. Nucleicacids research 2005, 33, W25–W28.
[72] Rhino | MDN., https://developer.mozilla.org/en-US/docs/Rhino (accessed04/10/2015).
[73] Brooks Jr, F. In The mythical man-month–essays on software engineering,Anniversary Edition; Addison-Wesley: 1995; Chapter Plan to throwone away, pp 115–123.
[74] Beck, K.; Gamma, E. Test infected: Programmers love writing tests.,http://www-public.it-sudparis.eu/~gibson/Teaching/CSC7302/ReadingMate-rial/BeckGamma00.pdf (accessed 04/10/2015).
55
References for chapter 1 to 6
[75] Spjuth, O.; Alvarsson, J. Bioclipse 2: Towards integrated biochemin-formatics. EMBnet. news 2009, 15, pp–25.
[76] Gaulton, A.; Bellis, L. J.; Bento, A. P.; Chambers, J.; Davies, M.; Hersey,A.; Light, Y.; McGlinchey, S.; Michalovich, D.; Al-Lazikani, B.; Over-ington, J. P. ChEMBL: a large-scale bioactivity database for drug dis-covery. Nucleic acids research 2011, 44, 1–8.
[77] Bento, A. P.; Gaulton, A.; Hersey, A.; Bellis, L. J.; Chambers, J.; Davies,M.; Krüger, F. A.; Light, Y.; Mak, L.; McGlinchey, S., et al. TheChEMBL bioactivity database: an update. Nucleic acids research 2014,42, D1083–D1090.
[78] Papadatos, G.; Overington, J. P. The ChEMBL database: a taster formedicinal chemists. Future medicinal chemistry 2014, 6, 361–364.
[79] Eklund, M.; Norinder, U.; Boyer, S.; Carlsson, L. Benchmarking Vari-able Selection in QSAR. Molecular informatics 2012, 31, 173–179.
[80] Brideau, C.; Gunter, B.; Pikounis, B.; Liaw, A. Improved statisticalmethods for hit selection in high-throughput screening. Journal ofbiomolecular screening 2003, 8, 634–647.
[81] Heston, T. F. Standardizing predictive values in diagnostic imagingresearch. Journal of magnetic resonance imaging : JMRI 2011, 33, 505,505.
[82] Altman, D. G.; Bland, J. M. Statistics notes: Diagnostic tests 2: pre-dictive values. BMJ 1994, 309, 102–102.
[83] Huang, J. H. J.; Ling, C. Using AUC and accuracy in evaluating learningalgorithms. IEEE transactions on knowledge and data engineering 2005,17.
[84] Bradley, A. P. The use of the area under the ROC curve in the eval-uation of machine learning algorithms. Pattern recognition 1997, 30,1145–1159.
[85] Nicholls, A. What do we know and when do we know it? Journal ofcomputeraided molecular design 2008, 22, 239–255.
[86] Ware, J. H. The limitations of risk factors as prognostic tools. The NewEngland journal of medicine 2006, 355, 2615–2617.
[87] Pencina, M. J.; D’Agostino, R. B.; Vasan, R. S. Evaluating the addedpredictive ability of a new marker: from area under the ROC curve toreclassification and beyond. Statistics in medicine 2008, 27, 157–172.
[88] Hwang, I. K.; Morikawa, T. Design Issues in Noninferiority/Equiva-lence Trials*. Drug information journal 1999, 33, 1205–1218.
[89] Schumi, J.; Wittes, J. T. Through the looking glass: understandingnon-inferiority. Trials 2011, 12, 106.
[90] Spring application framework., http://www.springsource.org/.
[91] Willighagen, E. L. Hacking Bioclipse scripts in Groovy., http://chem-bla-ics.blogspot.se/2011/08/hacking-bioclipse-scripts-in-groovy.html (accessed04/10/2015).
56

[92] JasperReports® Library | Jaspersoft Community., https://commu-nity.jaspersoft.com/project/jasperreports-library (accessed 04/10/2015).
[93] Spjuth, O.; Eklund, M.; Ahlberg Helgee, E.; Boyer, S.; Carlsson, L.Integrated decision support for assessing chemical liabilities. Journalof chemical information and modeling 2011, 51, 1840–1847.
[94] Hull, D.; Wolstencroft, K.; Stevens, R.; Goble, C.; Pocock, M. R.;Li, P.; Oinn, T. Taverna: a tool for building and running workflows ofservices. Nucleic acids research 2006, 34, W729–W732.
[95] Wolstencroft, K.; Haines, R.; Fellows, D.; Williams, A.; Withers, D.;Owen, S.; Soiland-Reyes, S.; Dunlop, I.; Nenadic, A.; Fisher, P., etal. The Taverna workflow suite: designing and executing workflowsof Web Services on the desktop, web or in the cloud. Nucleic acidsresearch 2013.
[96] KNIME | Open for Innovation., https://www.knime.org/ (accessed04/10/2015).
[97] Spjuth, O.; Willighagen, E. L.; Guha, R.; Eklund, M.; Wikberg, J. E.Towards interoperable and reproducible QSAR analyses: Exchange ofdatasets. Journal of cheminformatics 2010, 2, 5.
[98] Carlsson, L.; Spjuth, O.; Adams, S.; Glen, R. C.; Boyer, S. Use ofhistoric metabolic biotransformation data as a means of anticipatingmetabolic sites using MetaPrint2D and Bioclipse. BMC bioinformatics2010, 11, 362.
[99] Willighagen, E.; Alvarsson, J.; Andersson, A.; Eklund, M.; Lampa, S.;Lapins, M.; Spjuth, O.; Wikberg, J. Linking the resource descriptionframework to cheminformatics and proteochemometrics. Journal ofbiomedical semantics 2011, 2, S6.
[100] Spjuth, O.; Georgiev, V.; Carlsson, L.; Alvarsson, J.; Berg, A.; Wil-lighagen, E.; Wikberg, J. E.; Eklund, M. Bioclipse-R: Integrating man-agement and visualization of life science data with statistical analysis.Bioinformatics 2012.
[101] Brooks Jr, F. In The mythical man-month–essays on software engineering,Anniversary Edition; Addison-Wesley: 1995; Chapter The second-system effect, pp 53–58.
[102] Truchon, J.-F.; Bayly, C. I. Evaluating virtual screening methods: Goodand badmetrics for the ”early recognition” problem. Journal of chemicalinformation and modeling 2007, 47, 488–508.
[103] Norinder, U.; Carlsson, L.; Boyer, S.; Eklund, M. Introducing con-formal prediction in predictive modeling. A transparent and flexiblealternative to applicability domain determination. Journal of chemicalinformation and modeling 2014, 54, 1596–1603.
57

Acta Universitatis UpsaliensisDigital Comprehensive Summaries of Uppsala Dissertationsfrom the Faculty of Pharmacy 200
Editor: The Dean of the Faculty of Pharmacy
A doctoral dissertation from the Faculty of Pharmacy, UppsalaUniversity, is usually a summary of a number of papers. A fewcopies of the complete dissertation are kept at major Swedishresearch libraries, while the summary alone is distributedinternationally through the series Digital ComprehensiveSummaries of Uppsala Dissertations from the Faculty ofPharmacy. (Prior to January, 2005, the series was publishedunder the title “Comprehensive Summaries of UppsalaDissertations from the Faculty of Pharmacy”.)
Distribution: publications.uu.seurn:nbn:se:uu:diva-248964
ACTAUNIVERSITATIS
UPSALIENSISUPPSALA
2015