
Lifetime Cost of Battery, Fuel-Cell, and Plug-in Hybrid...
42
CHAPTER TWO Lifetime Cost of Battery, Fuel-Cell, and Plug-in Hybrid Electric Vehicles Mark A. Delucchi *1 and Timothy E. Lipman ** * Institute of Transportation Studies, University of California at Davis, Davis, CA 95616, USA ** Transportation Sustainability Research Center, University of California–Berkeley, 2614 Dwight Way, MC 1782, Berkeley, CA, 94720-1782, USA Contents 1. Introduction 20 2. Lifetime Cost of Battery-Electric Vehicles 22 2.1 Introduction 22 2.2 BEV concepts 23 2.3 BEV drivetrain costs 24 2.3.1 Batteries for BEVs 24 2.3.2 Electric motors and motor controllers for BEVs 26 2.3.3 Accessory systems for BEVs 26 2.4 Nonenergy operating and maintenance costs 27 2.5 Energy-use costs for BEVs 27 2.5.1 Energy use of BEVs 27 2.5.2 Cost of electric fuel 28 2.6 External costs of BEVs 28 2.7 Discussion of BEV cost estimates 29 3. Lifetime Cost of Plug-In Hybrid Electric Vehicles 31 3.1 Introduction 31 3.2 PHEV concepts 32 3.3 Component costs 32 3.3.1 Overview 32 3.3.2 Batteries 32 3.3.3 Electric motor and motor controller 35 3.3.4 Engine, exhaust system, and transmission 35 3.3.5 Accessory power 37 3.4 Nonenergy operating and maintenance costs 37 3.4.1 Overview 37 3.4.2 Maintenance and repair costs 37 3.4.3 Other nonenergy operating costs 39 3.5 Energy-use costs 39 3.5.1 Overview 39 3.5.2 Energy use of PHEVs 39 3.5.3 The price of electricity and the total annual electricity cost 42 1 Corresponding author: [email protected] Electric and Hybrid Vehicles © 2010 Elsevier B.V. ISBN 978-0-444-53565-8, DOI: 10.1016/B978-0-444-53565-8.00002-6 All rights reserved. 19
Transcript of Lifetime Cost of Battery, Fuel-Cell, and Plug-in Hybrid...
CHAPTER TWO
Lifetime Cost of Battery, Fuel-Cell, andPlug-in Hybrid Electric VehiclesMark A. Delucchi*1 and Timothy E. Lipman***Institute of Transportation Studies, University of California at Davis, Davis, CA 95616, USA**Transportation Sustainability Research Center, University of California–Berkeley, 2614 Dwight Way, MC 1782, Berkeley,CA, 94720-1782, USA
Contents
1. Introduction 202. Lifetime Cost of Battery-Electric Vehicles 22
2.1 Introduction 222.2 BEV concepts 232.3 BEV drivetrain costs 24
2.3.1 Batteries for BEVs 242.3.2 Electric motors and motor controllers for BEVs 262.3.3 Accessory systems for BEVs 26
2.4 Nonenergy operating and maintenance costs 272.5 Energy-use costs for BEVs 27
2.5.1 Energy use of BEVs 272.5.2 Cost of electric fuel 28
2.6 External costs of BEVs 282.7 Discussion of BEV cost estimates 29
3. Lifetime Cost of Plug-In Hybrid Electric Vehicles 313.1 Introduction 313.2 PHEV concepts 323.3 Component costs 32
3.3.1 Overview 323.3.2 Batteries 323.3.3 Electric motor and motor controller 353.3.4 Engine, exhaust system, and transmission 353.3.5 Accessory power 37
3.4 Nonenergy operating and maintenance costs 373.4.1 Overview 373.4.2 Maintenance and repair costs 373.4.3 Other nonenergy operating costs 39
3.5 Energy-use costs 393.5.1 Overview 393.5.2 Energy use of PHEVs 393.5.3 The price of electricity and the total annual electricity cost 42
1Corresponding author: [email protected]
Electric and Hybrid Vehicles © 2010 Elsevier B.V.ISBN 978-0-444-53565-8, DOI: 10.1016/B978-0-444-53565-8.00002-6 All rights reserved. 19

3.6 External costs of PHEVs 423.7 Discussion of PHEV cost estimates 44
4. Lifetime Cost of Fuel-Cell Electric Vehicles 454.1 Introduction 454.2 Component costs 45
4.2.1 Overview 454.2.2 Fuel-cell system 464.2.3 Hydrogen storage system 49
4.3 Nonenergy operating and maintenance costs 504.3.1 Maintenance and repair costs 504.3.2 Other nonenergy operating costs 53
4.4 Energy-use costs 534.4.1 Energy use of FCEVs 534.4.2 Cost of fuel 54
4.5 External costs of FCEVs 554.6 Discussion of FCEV cost estimates 56
5. Discussion 57Acknowledgments 58References 58
1. INTRODUCTION
Concerns about climate change, urban air pollution, and dependence onunstable and expensive supplies of foreign oil have lead policy makers and researchersto investigate alternatives to conventional petroleum-fueled internal combustionengine vehicles (ICEVs) in transportation. Because vehicles that get some or all oftheir power from an electric drivetrain can have low or even zero emissions ofgreenhouse gases (GHGs) and urban air pollutants (see Lipman and Delucchi, thisvolume, for a review of the climate-change impacts of advanced electric vehicles(EVs)) and can consume little or no petroleum, there is considerable interest indeveloping and evaluating advanced EVs, including battery electric vehicles (BEVs),plug-in hybrid electric vehicles (PHEVs), and fuel-cell electric vehicles (FCEVs).However, although there are no technical barriers to developing EVs that perform aswell as do petroleum ICEVs, it is not yet clear whether advanced EVs can bedeveloped economically. No manufacturer is producing advanced EVs in largequantities, and the prices quoted for demonstration vehicles produced in smallquantities tell us nothing about long-run manufacturing costs at high productionvolumes. Moreover, the manufacturing cost is not the only relevant cost metric:vehicles that have higher initial costs might have lower operating and maintenancecosts and as a result might have lower total costs over their lifetime. And even ifadvanced EVs have higher lifetime consumer costs than do comparable ICEVs, theystill might have lower lifetime social costs, on account of having lower “external”costs (which we will explain below).
20 Mark A. Delucchi and Timothy E. Lipman

To address these issues, in this chapter we review estimates of the full social lifetimecost of BEVs, PHEVs, and FCEVs. The full social lifetime cost of a vehicle comprises allof the initial and periodic costs of owning and operating a vehicle, including somenonmarket costs that are incurred by society as a whole (external costs). Because initialcosts, such as the cost of the whole vehicle, and future periodic costs, such as the cost offuel, are incurred at different times, and in cost–benefit analysis the timing of costs andbenefits matters (because of the opportunity, cost of money, and for other reasons),initial costs and periodic costs must be put on the same temporal basis before they can beadded together. This can be accomplished either by taking the present value (PV) of futurecosts and adding this PV to actual initial costs, or else by amortizing initial costs over thelife of the vehicle or component and adding the amortized cost stream to actual periodiccosts. These two approaches give the same results, because they are just differentexpressions of the same mathematical relationship between present and future costs.
Researchers typically distinguish between initial costs, such as the cost of the wholevehicle, and periodic costs, such as fuel and operating costs, because initial costs are animportant part of the total lifetime cost but also because the initial cost of the vehicle is ofinterest in itself. The initial cost of an advanced EV typically is estimated by starting withthe cost of a comparable gasoline ICEV and then subtracting the costs of componentsnot used in the EV (e.g., an exhaust and emission control system) and adding the cost ofextra or modified components in the EV. The extra or modified components in the EVcan include a traction battery, an electric motor, a motor controller, a fuel cell, ahydrogen storage system, and a modified engine and transmission.
Operating and maintenance costs include energy, insurance, maintenance, repair,registration, tires, oil, safety- and emission-inspection fees, parking, and tolls. Because allof these costs except parking and tolls are related to vehicle cost, total vehicle weight, orvehicle power train characteristics, and EVs have a different cost, weight, and powertrain than do ICEVs, all types of EVs can have different operating and maintenance coststhan do ICEVs. A comprehensive comparative lifetime cost analysis therefore shouldestimate all operating and maintenance costs except parking and tolls (and in fact, eventhe private cost of parking and tolls can be different for EVs, if public policy providesincentives for clean vehicles by subsidizing parking and toll costs). However, as we shallsee, most EV lifetime cost studies conducted to date have considered only energy costs.
Initial costs and the operating and maintenance costs described above are explicitdollar costs that consumers pay in market transactions as part of the cost of owning andusing a vehicle. They constitute what we will call the private or consumer lifetime cost.However, the production and use of motor vehicles also generates other impacts, such asthose related to air pollution, that are not borne entirely by consumers in their markettransactions related to vehicle ownership and use, but rather are borne diffusely bysociety as a whole. Economists call these impacts externalities because they are “external”to private decision making in market transactions. The estimated dollar value of an
Lifetime Cost of Battery, Fuel-Cell, and Plug-in Hybrid Electric Vehicles 21

externality is an external cost. Private costs plus external costs, with adjustments fornoncosts transfers (see Section 4.6), constitute the social lifetime cost of the vehicle.
The production and use of motor vehicles and motor-vehicle infrastructure generatesa wide range of externalities: air pollution, climate change, the macroeconomic impactsof dependence on unstable and expensive foreign oil, water pollution, noise, death andinjury and destruction from crashes, delay from congestion, habitat destruction, andmore. For a review of the external costs of transportation in the United States, see Ref[1]. The substitution of an electric drivetrain for an internal combustion engine (ICE)drivetrain can affect the external costs of motor-vehicle air pollution, climate change, oildependence, noise, and water pollution (which, as noted above, is why EVs are beingconsidered as alternatives to petroleum ICEVs.) Several studies, reviewed below, haveincluded at least some of these external costs as part of an analysis of the social lifetimecost of advanced EVs.
In the following sections, we discuss component costs, nonenergy operating andmaintenance costs, energy costs, and external costs, for BEVs, PHEVs, and FCEVs. Weconclude each section and then the whole chapter with a general discussion of theestimates.
2. LIFETIME COST OF BATTERY-ELECTRIC VEHICLES
2.1 IntroductionOf the advanced EV types examined here, BEVs have the longest history. In fact, BEVsdate back to the late 1800s. However, a modern series of vehicles was introduced byvarious automakers in the 1980s and 1990s. Along with the introduction of vehicles suchas the General Motors EV-1, the Toyota RAV4-EV, and the Ford Ranger EV, a seriesof battery EV cost studies were conducted to examine the commercial prospects of thesevehicles should they become further developed and reach higher volumes of production.These include several studies conducted by us (Lipman and Delucchi) that form the earlybasis for this assessment [2–5].
The introduction of BEVs in the 1990s was occurring as the California Air ResourcesBoard (CARB) was looking to battery technology as the leading near term path to“zero-emission” vehicles (ZEVs). The term ZEV was used to describe vehicles thatproduced no tailpipe emissions of regulated pollutants, ignoring pollution from thepower plants used to recharge EVs.
An important point with regard to the analysis of the potential manufacturing, retail,and lifetime costs of BEVs is that the critical issue of battery cost and performance hasevolved greatly over the past 15 years and will continue to evolve for the foreseeablefuture. In the early 1990s, the dominant battery technology was lead-acid, with inves-tigations into other chemistries such as sodium–sulfur and zinc–bromine. By the mid-1990s the nickel-metal hydride (NiMH) battery chemistry emerged as a more attractive
22 Mark A. Delucchi and Timothy E. Lipman

option for many EV applications owing to better energy density than lead-acid, but stillwith good power characteristics. At this point, lithium-ion (Li-ion) was only an emer-ging technology, with highly uncertain cost and performance characteristics and con-cerns about safety from battery flammability.
Moving forward to 2010, NiMH is still the main battery technology used in hybridvehicles, but the next generation of PHEVs and BEVs is demanding the use of Li-iontechnologies because of their superior performance and energy storage characteristics.What is clearer now than in the late 1990s with regard to Li-ion is that the technology canoffer excellent performance but at what appears to be a relatively high cost (in $/kWh) inthe near term. How far and how quickly Li-ion battery prices can fall in higher volumeproduction, while still assuring good battery durability, remains a critical question.
Thus, early studies of BEVs based on Li-ion batteries appear to be somewhatoptimistic regarding those battery costs, based on what is now known, although wenote that the “learned out” high-volume production cost of key Li-ion technologies isstill unknown. Perhaps what was most unappreciated several years ago is that it is notonly the costs of the Li-ion battery modules that are of issue, but also the costs of the restof the battery management system (BMS), which is necessarily more intricate than forNiMH owing to the specific characteristics of Li-ion batteries that require special care(e.g., owing to their thermal characteristics and needs for voltage monitoring of groupsof cells to ensure good performance). The life of Li-ion batteries also is quite important,because as mentioned in the introduction the cost per mile of the battery is a function ofthe cycle life (which translates into mileage life) as well as of the initial cost.
2.2 BEV conceptsBEVs are the simplest type of EV from a conceptual perspective, using electrical powerfrom a single source—the electrochemical battery—to power one or more electricmotors. Typically, a single electric motor is connected to the front axle through a simpleone- or two-speed gearbox, but there are several other possible variations in thedriveline architectures. One significant variation is to use a series of four “hub motors”attached to each wheel rather than a single drive motor.
Of course, the battery itself is composed of many cells that are composed intomodules, which in turn are grouped into packs. This can be done various ways usingseries and parallel connections between groups of cells and/or modules. BEV electricmotors typically operate at a few hundred volts, meaning that a minimum of about 100cells is required (e.g., 100 Li-ion batteries with cell voltage of 3.6V could produce 360Vif arranged in series). However some vehicles have many more but smaller cells, up totens of thousands, configured in complex arrays with parallel and series connections.Also, in addition to the basic battery pack, a “balance of plant” of thermal managementand voltage-monitoring systems is required to prevent overcharging and to detectearlier-than-expected cell degradation or failure.
Lifetime Cost of Battery, Fuel-Cell, and Plug-in Hybrid Electric Vehicles 23

The battery pack is typically the largest and most expensive component of the BEV,often by several-fold for longer-range vehicles. Especially since it is the sole powersource, BEV applications require combined performance from the battery in producingboth power (for acceleration) and energy (for sustained driving range). In practice, thismeans that battery engineers must strive to provide the best combination possible for thevehicle application they are targeting, within the limits of the battery chemistry they areusing.
Finally, it is worth noting that one concept for BEVs is to have the battery pack itselfbe readily removable and “swappable.” This allows for extended driving range throughthe use of battery swap stations and an arrangement for consumers to lease rather thanown their batteries. Systems have been demonstrated that can accomplish the batteryswap very rapidly, in around 1min for the battery pack swap itself and a few minutesfor the complete operation [6]. While somewhat complex to administer, this type ofservice could help to reduce the key issue of limited range coupled with long rechargetime for BEVs.
2.3 BEV drivetrain costsThe costs of manufacturing BEVs versus conventional vehicles can be estimated througha series of “parts replacement” exercises, where the components not needed in the BEVare “stripped out” and the replacement components needed for the EV are added in.This method has been widely used, and is generally appropriate for BEVs that are builtalong those lines—for example, on a conventional vehicle chassis “platform” that isadapted for use for the EV. Alternately, one may consider the concept of a much lighterweight design, to reduce the costs of the EV drivetrain components. This is a strategywidely advocated by some industry analysts; for example, see reference [7]. Clearly, thisbasic vehicle design choice has major implications for BEV driveline costs, as smaller andcheaper drivetrain components can be traded off with the costs of producing lighter (buttypically more expensive) vehicle chassis based on high-strength steel, aluminum, and/orcarbon fiber composite materials.
In a series of studies in the late 1990s we reviewed and analyzed the costs of completeEVs as well as their drivetrains and key components [2–5]. Subsequent to these studies,noteworthy efforts in the 2000s included those by university and other research groups[8–10]. The results of these more recent EV driveline cost analysis efforts are summarizedin Table 2.1.
2.3.1 Batteries for BEVsThe costs of batteries for BEVs were the subject of many cost studies in the 1990s,including two by us [1, 3]. We add to those previous reviews here and in Section 3.3.2.
Kromer and Heywood [8] consider two sets of battery assumptions for a 200-milerange BEV: (1) 150Wh/kg and $250/kWh and (2) a much more optimistic case of
24 Mark A. Delucchi and Timothy E. Lipman

$
$
$
$
$
$
$$
$$
$$
$$
$
$
$$
$$$
$$$
$$$
$
$
$
$
$
$
$
$
$
$
$
$
$
$
$
$
$
$

300Wh/kg and $200/kWh. In the first case (their base case) the battery cost for the 200-mile range BEV is $12,000 and in the optimistic case it is $8,400 (for batteries of 48 and42 kWh, respectively, owing to the smaller and lighter vehicle and battery possible withthe better battery energy density).
Eaves and Eaves [9] arrive at a Li-ion battery cost of $16,125 for a BEV that has a64.5 kWh battery pack that makes it capable of a 300-mile (500 km) range (thusassuming a battery specific energy of 143Wh/kg). This is derived from a $250/kWhestimate for high-volume production of Li-ion batteries in a previous national lab study.
Offer et al. [10] consider a much smaller BEV battery pack of 25 kWh as “the lowerlimit considered acceptable for an electric vehicle.” They estimate a current cost of$25,000 (or $1,000/kWh), with year 2030 “optimistic,” “pessimistic,” and “average”estimates of $5,000, $7,500, and $6,250, respectively (translating to $200/kWh, $300/kWh, and $250/kWh).
One difficulty with some of these studies of battery costs for vehicles is the need toconsider the BMS or more generally the “balance of plant” needed to support the use ofthe battery in the vehicle. This is especially important in the case of Li-ion batteries,which have significant needs for cooling and are sensitive to overcharging. The BMS is asignificant cost item for advanced batteries, acting as the integration component for thebattery and vehicle systems, but some studies are not explicit about the extent to whichthey include the costs of the BMS as well as the battery pack itself.
2.3.2 Electric motors and motor controllers for BEVsThe electric motor and motor controller propulsion systems comprise the other key setof components for BEVs, along with the battery power system. The motor controller inparticular has evolved in recent years with the use of insulated gate bipolar transistors(IGBTs) as high-power switching devices in place of the previously used MOSFETs(metal–oxide–semiconductor field-effect transistors). Along with better integration ofother components and reduced parts counts, motor controllers have improved inperformance and decreased in cost and complexity over the past few decades. Mean-while, electric motors have also improved in terms of their torque and power density andenergy efficiency characteristics. See Subsection 3.3.3 and Lipman [5] for more discus-sion of these electric motor and controller costs.
2.3.3 Accessory systems for BEVsBEVs require battery chargers that can be included onboard the vehicle or evenintegrated into the motor controller unit. There has been previous experience withboth conductive and inductive charging systems, but a new standard has emerged basedon the SAE J1772 standard and a plug design pioneered by the Yazaki Group. Thisstandard allows up to what has come to be defined as “Level 2” charging at power levelsof up to 16.8 kW (120–240VAC power at up to 70A). Along with these charging
26 Mark A. Delucchi and Timothy E. Lipman

standards, an active area of research and industry interest is the interface between thecharging system, and when and how it is operated, and the local utility grid. For detailson these BEV charging and utility grid issues, see this recent review [11].
Also the presence of a fuel-fired heater can have a significant impact on vehicleenergy use, and to some extent cost as well. For example, for use in colder climates the1997/1998 General Motors S-10 Electric pickup truck had the option of a fuel-firedheater, using diesel fuel stored in a 1.7-gallon tank [12]. The off-board charger (if any)and potential addition of a fuel-fired heater are the main accessory issues for BEVscompared to regular vehicles.
2.4 Nonenergy operating and maintenance costsIn addition to costs of electric fuel, discussed below, BEVs typically offer the advantageof lower maintenance costs compared with conventional vehicles. There are many fewermoving parts in BEVs, the electric motors are essentially maintenance free, and there isno need for periodic oil changes. There are needs for periodic battery pack inspections,but overall maintenance costs for BEVs are expected to be relatively low. For example,we have previously estimated that the annual maintenance costs for BEVs could be about28% lower than for conventional gasoline vehicles on an annualized basis [2]. Bycontrast, MIT’s On the Road in 2020 study [13] assumes that maintenance costs forBEVs are the same as for gasoline ICEVs.
2.5 Energy-use costs for BEVsThe following sections describe the energy use of BEVs, and the costs associated with theelectric fuel that they consume. Unlike PHEVs, which use a somewhat complexcombination of electricity and another fuel, or FCEVs, which use hydrogen withuncertain costs in a consumer setting, the costs of refueling BEVs are relatively morestraightforward and well-understood.
2.5.1 Energy use of BEVsThe energy use of BEVs is relatively straightforward to estimate, particularly in theabsence of auxiliary fuel-fired heaters that have been proposed for colder climates asalternatives to electric heaters. Since the amount of waste heat produced from theresistance of the BEV battery system and electric motor controller is much lower thanfrom conventional vehicles, auxiliary cabin heating can be an issue.
Energy use of BEVs is typically expressed in watt-hours per mile or kilometer(Wh/mile or Wh/km), and can be defined and measured at the battery pack terminalsor the “wall plug.” This value typically ranges from about 200Wh/mile (124Wh/km)for small EVs to up to 400Wh/mile (249Wh/km) for larger vehicles. For example, theextensively tested Toyota RAV4 “small SUV” type of EV has an energy-use value(measured at the battery terminals) of 301Wh/mile or 187Wh/km. This energy use rate
Lifetime Cost of Battery, Fuel-Cell, and Plug-in Hybrid Electric Vehicles 27

is based on reported energy use of 270 Wh/mi (168 Wh/km) city and 340 Wh/mi(211 Wh/km) highway [14] and assuming the “55/45” city/highway mileage splitestablished for U.S. government certification purposes.
As BEV technology slowly improves in the future, vehicle energy use should also besomewhat reduced (assuming vehicle performance remains relatively constant). Thiscould be the result of improved motors and motor controllers, improved batterieswith lower internal resistance characteristics, better integration of components, andlower auxiliary system losses. In an overall sense, however, vehicle size and weight andlevel of performance are the key determinants of overall energy use, as is the case forconventional vehicles.
2.5.2 Cost of electric fuelElectricity for BEVs is generally less costly than other fuels including gasoline. Manyutilities now offer special “time of use” (TOU) rates for EV owners that can be used inconjunction with separate utility meters to charge for the electricity used for EVcharging. Since BEVs can typically be recharged at night when power is typicallycheaper, they benefit from these TOU rates. Furthermore, separate metering allowsBEV owners to prevent their electricity usage from accruing to their regular householdelectrical bill, which in many regions has a tiered structure that penalizes high rates ofusage.
For a recent review of the electricity costs associated with BEV charging in variousregions of the United States, including utility regions where TOU rates are available, seeLidicker et al. [15]. The study examines three different gasoline price periods incomparing the costs of fueling BEVs and conventional vehicles, and finds that dependingon region and price period (during 2008–2009 when prices where highly variable),BEVs can cost consumers from a few hundred to a few thousand dollars per year less thanconventional vehicles to fuel. The savings associated with charging off-peak versuson-peak is found to be relatively modest, however, on the order of $1.00–$2.00/day.This suggests that to avoid on-peak charging, consumers may need stronger “pricesignals” than are typically available—an issue that could become important withsignificant levels of BEV market penetration.
2.6 External costs of BEVsThe external costs of BEVs differ from those of conventional vehicles in that airpollutants are produced in different places and in different types and amounts, andthere are reduced externalities associated with oil use, GHG emissions, and vehiclenoise. In previous work [2], we have estimated the difference in external costs betweenBEVs and conventional vehicles to be in the range of 0.4–3.7 cents per mile, with a bestestimate of 1.1 cents per mile (in year 2000 US$). These external cost differencesbetween BEVs and conventional vehicles are primarily in the form of air pollution
28 Mark A. Delucchi and Timothy E. Lipman
and oil-use related externalities, with climate change and noise being smaller factors [2].See also the discussion in Section 4.5 of Thomas [16], who estimates air pollution,climate change, and oil-dependence external costs of ICEVs, BEVs, PHEVs, andFCEVs.
2.7 Discussion of BEV cost estimatesAlong with the earlier “generation 1” cost studies conducted in the 1990s, a fewadditional BEV cost studies have been performed more recently in the 2000s, andthese are also reviewed here. For an earlier review and presentation of modeling resultsfocusing on the details of the cost studies conducted in the early 1990s, see our previouswork [2, 3].
The BEV cost studies conducted thus far, by academic groups, government researchlaboratories, and consulting firms, have generally concluded that the incremental retailpurchase prices of BEVs were at least a few and up to tens of thousands of dollars morethan those of conventional vehicles. However, it is important to note that studies thathave considered vehicle costs on a lifetime basis have often shown that the additionalpurchase costs of BEVs can potentially be recouped through reduced fuel and otheroperational costs over time. Key factors in that regard are not only the relative vehiclecosts, but also the relative costs of electricity and gasoline for consumers in particularsettings.
Tables 2.1 and 2.2 present the initial cost and lifetime cost estimates from studiesperformed by government agencies, coalitions, and research organizations from the mid-1990s through the present. As shown in Table 2.1, all studies conclude that BEVmanufacturing costs and retail prices will be higher than conventional vehicle costs inthe near-term, but a few studies suggest that BEV costs could relatively quickly drop tolevels comparable to those of conventional vehicles, particularly on a lifetime basis.
The differences in the results of the studies summarized in Table 2.1 can be explainedpartly by variations in assumptions regarding the types of vehicles analyzed, the assumedvolume of vehicle production, the range and energy efficiency of the analyzed vehicle,the life and cost of the battery, and the costs of accessories and additional equipmentneeded for the BEV. This additional equipment includes battery chargers, vehicleheating and cooling systems, and electrical power steering units. Key characteristics inthis regard are called out in the table, but we refer readers to the original studies foradditional details, with regard to key assumptions and the relative level of the full rangeof BEV drivetrain components that are included.
Overall, BEV costs are estimated to be from ten thousand dollars or more(US$10,000+) in the near-term than the comparable ICE vehicles to which they arecompared, falling to a projected several thousand dollars (US$3,500–US$12,000) in thefuture in high-volume production in some studies (and depending on the size and typeof battery pack assumed). See the results in Table 2.1 for details. Note that there is
Lifetime Cost of Battery, Fuel-Cell, and Plug-in Hybrid Electric Vehicles 29

$$
$$
$$
$$$$$
$
$ $
$
$
$
$
$
$
$
$
$
$
$
$
$
$
$
$
$
$
$
$$
$ $ $ $
$$
$$
$$
considerable variation in the results of the studies, showing the wide range of possiblevariation depending on the type and size of battery included, the manufacturingproduction volume of the vehicles, and the timeframe considered (where potential“learning curve” improvements can be considered for the future).
Some studies estimate the vehicle lifetime cost, which includes the costs of operatingand maintaining the vehicles as well as purchasing them (Table 2.2). As shown in Table2.2, BEV lifetime costs are typically somewhat higher than for conventional vehicles butthe results depend significantly on the gasoline price and (to a lesser extent) the electricityprices assumed. As discussed above, the addition of social costs adds more to the overallcosts of conventional vehicles than for BEVs, owing to the lower emissions, oil-use, andnoise from BEVs, by perhaps 1 cent per mile (as a central estimate within a range ofabout 0.5–4 cents per mile) on a vehicle lifetime cost basis [2].
3. LIFETIME COST OF PLUG-IN HYBRID ELECTRIC VEHICLES
3.1 IntroductionPHEVs have attracted the interest of researchers and policy makers because they canreduce consumption of petroleum [21], emissions of GHGs, and emissions of urban airpollutants [22]. PHEVs are likely to cost more than conventional ICE gasoline vehicles,primarily because of the relatively high cost of batteries, but also may have lower energy-use costs. In this section we analyze the lifetime cost of PHEVs, focusing on detailedoriginal research published over the last 10 years.1
The lifetime cost of a PHEV includes amortized initial costs and operating costs. Theinitial cost of a PHEV typically is estimated with respect to the initial cost of a gasolineICEV, by adding the cost of the additional components in a PHEV (e.g., battery, motor,controller, transmission, and small engine) and subtracting the cost of gasoline ICEVcomponents not used in a PHEV (e.g., a large engine and exhaust system). Operatingcosts include energy, maintenance and repair, and insurance costs. Most studies estimateonly the cost of major PHEV components and the cost of energy.
We begin with an overview of basic PHEV concepts. We then examine estimates ofcomponent costs, non-energy operation and maintenance costs, and energy costs. In thediscussion of energy costs, we review simulations of the power train energy use ofPHEVs. We conclude with a discussion of the strengths and weaknesses of currentPHEV cost estimates and highlight some directions for future research. In this PHEVsection, we express all costs in year 2009 dollars unless noted otherwise.
1 We do not consider simple calculations, such as those of Scott et al. [23] and Silva et al. [24] in which an assumed pricepremium for PHEVs ($1,000–$10,000 per car in Ref. [23] and $4,000–$10,000 in Ref. [24]) is compared with thereduced energy costs (based on gasoline at $2.50–$3.50/gallon and electricity at $0.12/kWh in Ref.[23], and gasolineat 0.54–1.35 /l and electricity at 0.057–$0.104 euros/kWh in [24]), at an assumed discount rate (8% in [24]).
Lifetime Cost of Battery, Fuel-Cell, and Plug-in Hybrid Electric Vehicles 31
3.2 PHEV conceptsTwo important differences separate a PHEV from a non-plug-in hybrid electric vehicle(HEV). PHEVs have (1) a larger battery and (2) the ability to recharge the battery from theelectricity grid. A PHEV can operate in two different modes depending on the state ofcharge (SOC) of the battery. The first is charge-depleting (CD) mode, during which thebattery discharges from its beginning state (e.g., 100% charged). We describe PHEVs bytheir CD range, which we express as PHEV-X, where X is the number of km a PHEVcan be driven in CD mode. For example, PHEV-32 specifies that the plug-in hybrid has arange of 32 km (20 miles). After reaching the end of its CD range, a PHEV will switch tocharge-sustaining (CS) mode, during which the PHEV operates much like an HEV, usingregenerative braking and power from the engine to keep the average SOC constant. Theswitch to CS operation is triggered by the battery reaching a specified SOC (e.g., 30%).
The control strategy and vehicle design determine whether the PHEV’s CD mode ofoperation is all-electric or blended. All-electricmeans that the vehicle operates on only theelectric motor for the specified CD range. In this case, the CD range is often referred toas the all-electric range (AER). If the CD mode is blended, the electric motor and ICE areboth used to power the vehicle. In general, an all-electric PHEV will require a largerelectric motor and battery than a blended PHEV. We discuss this more in Section 3.5.2.
3.3 Component costs3.3.1 OverviewPHEVs have several components that conventional ICEVs do not have: a large tractionbattery, an electric motor, and a motor controller. The engine, transmission, and emissioncontrol and exhaust system in a PHEV are different from those in an ICEV, and the climatecontrol system also might be different. In the following sections, we review estimates of thecosts of the components that are different in PHEVs. In some cases we express componentcosts relative to the total “incremental” cost of a PHEV, which is the difference between thetotal initial cost of a complete PHEV and the total initial cost of a complete gasoline ICEV.
3.3.2 BatteriesAll cost studies reviewed here estimate that the battery pack is the most expensivecomponent of a PHEV. A battery pack comprises individual modules, an enclosure forthe modules, management systems, terminals and connectors, and any other pertinentauxiliaries. The studies shown in Table 2.3 find that the battery pack cost is 50–87% ofthe estimated incremental cost of the PHEV at high-volume production.
The earliest study in our review, published by the Electric Power Research Institute(EPRI) [25], is one of the most comprehensive. Graham et al. [25] used CARB’s BatteryTechnical Advisory Panel (BTAP) report [27] to estimate the cost of NiMH batteriesproduced at 100,000 or more units per year. The BTAP report estimated that the lowestprobable specific cost for batteries in BEVs is $250/kWh. To calculate the specific cost of
32 Mark A. Delucchi and Timothy E. Lipman
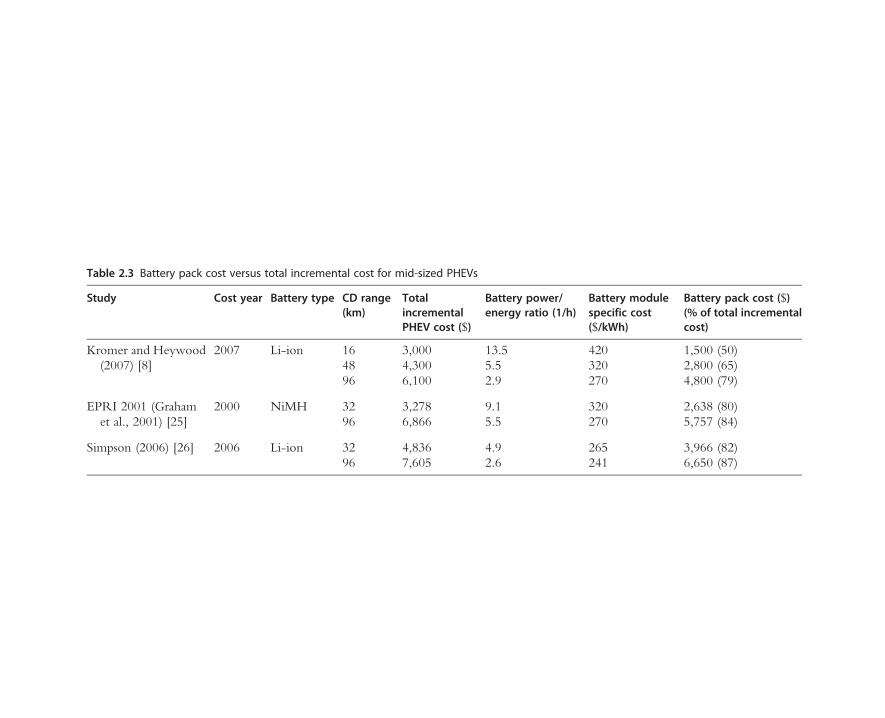
Table 2.3 Battery pack cost versus total incremental cost for mid-sized PHEVs
Study Cost year Battery type CD range(km)
TotalincrementalPHEV cost ($)
Battery power/energy ratio (1/h)
Battery modulespecific cost($/kWh)
Battery pack cost ($)(% of total incrementalcost)
Kromer and Heywood(2007) [8]
2007 Li-ion 16 3,000 13.5 420 1,500 (50)48 4,300 5.5 320 2,800 (65)96 6,100 2.9 270 4,800 (79)
EPRI 2001 (Grahamet al., 2001) [25]
2000 NiMH 32 3,278 9.1 320 2,638 (80)96 6,866 5.5 270 5,757 (84)
Simpson (2006) [26] 2006 Li-ion 32 4,836 4.9 265 3,966 (82)96 7,605 2.6 241 6,650 (87)

the PHEV battery, Graham et al. [25] multiplied the BTAP battery cost estimate by theratio of the specific energy of the PHEV battery to the specific energy of the EV battery.This method assumes that materials costs are the largest influence on the cost of thebattery module and that the material cost of the battery is inversely proportional to thespecific energy of the battery for a given storage capacity.
EPRI also published a report in 2004 that deals primarily with advanced batteries forvarious EVs, including PHEVs [28]. Duvall et al. [28]. used an updated version of theyear 2000 CARB’s life cycle cost model, with new assumptions about other majorcomponent costs, but used the assumptions of Graham et al. [25] for NiMH battery cost.
Simpson [26] used the vehicle-energy-use simulator ADVISOR tomodel several PHEVdesigns with various CD ranges, and then estimated the cost of both Li-ion and NiMHbatteries at the module and pack level for each PHEV design. He used battery-cost curvesdeveloped in the 2001 EPRI [25] report to estimate module and pack costs, as follows:
Battery module cost ðlong-termÞ : $=kWh ¼ 11:1� P=Eþ 211:1
where P/E= power/energy ratio.
Battery pack cost : $ ¼ ð$=kWhþ 13Þ � kWhþ 680
Simpson assumed that NiMH batteries would be used in near-term PHEVs (2005–2010)and that Li-ion batteries would be available for use in the longer term (2015–2020). Onthe basis of interviews with battery suppliers and other experts, he estimated that NiMHbatteries for near-term PHEVs would be twice as expensive as Li-ion batteries for long-term PHEVs.
Kromer and Heywood [8] based their estimates of future Li-ion battery costs onprevious studies, such as Refs. [27] and [29]. Consistent with the BTAP report [27], theyassumed that material costs for batteries are 50% of the total cost, that materials costsdecrease by 2.5%/year, that manufacturing costs and profit margin remain constant overtime, and that the present cost of high-energy batteries is $300/kWh. They estimatecosts for production volumes above 100,000 units/year.
Table 2.3 presents the specific cost estimates in the studies reviewed above. All of thestudies cited estimate the specific cost of the battery module as a function of the power-to-energy ratio. The power-to-energy ratio and the specific cost decrease as the CDrange increases because the battery will require the same peak power to meet therequirements of the drive cycle used to design the PHEV, regardless of the CD range.
The lifetime cost per mile of the battery is a function of the initial cost of the battery,the cycle life of the battery, and the salvage value of the battery at the end of its life. BothEPRI studies in Table 2.3 suggest that the battery in a PHEV may have a nonzerosalvage value at the end of its useful life in the vehicle. The 2001 EPRI report [25] uses asalvage value of $100/kWh, assuming that the battery is replaced when its capacity has
34 Mark A. Delucchi and Timothy E. Lipman

been reduced to 80% of its original capacity. The 2004 EPRI report [28] takes a moreconservative approach and estimates the salvage value of the battery by multiplyingthe projected new module cost at the time of replacement by the percentage of batterylife remaining. This assumes that the battery has another useful application after beingused in a PHEV and that the value is proportional to the remaining battery life. For aPHEV-32, the 2004 EPRI report [28] estimates a salvage value of about $15/kWh.
3.3.3 Electric motor and motor controllerThe electric motor provides motive power to the axle, and the motor controller variesthe torque and speed of the electric motor as needed. The cost of these components canbe a significant proportion of the total incremental cost of a PHEV.
The 2001 EPRI report [25] modeled PHEVs with a DC brushless permanent magnetmotor, because this type of motor is smaller, less complex, and typically more efficientthan an induction motor and is easier to control than an AC motor. The authorsestimated the cost of the motor on the basis of several studies of traction motor costs[5, 30, 31] and came up with the cost formula of $13.70/kW+ $190, which equates toabout $16/kW for the motor sizes considered in their study. Based on a review ofprevious cost estimates, Graham et al. [25] projected the cost of a PHEV motorcontroller to be equal to $7/kW+ $165.
The 2004 EPRI report [28] estimated the cost of a brushless permanent magnetmotor to be about $16/kW, but suggested that with high production volumes of thesemotors and other devices that use permanent magnets the cost could drop to $10.50/kW. The study estimated that motor controllers for PHEVs will cost around $10/kW,assuming that the IGBTs used in the controllers will also be used in fuel cell anddistributed power systems and therefore will be produced in relatively high volumes.
On the basis of a 2005 National Research Council (NRC) report on FreedomCAR[32] and a 2002 report by Energy and Environmental Analysis, Inc. [33] on the cost andperformance of conventional vehicles and hybrids, Kromer and Heywood [8] estimatedthe cost of the PHEV motor and controller in 2030 to be $15/kW+ $200 (2007 $).Table 2.4 summarizes estimates of the cost of electric motors and controllers in PHEVcost studies. See Lipman and Delucchi [34, 35] for a detailed analysis of the cost ofelectric motors and controllers for HEVs.
3.3.4 Engine, exhaust system, and transmissionThe engine and exhaust system are likely to be smaller for a PHEV than for an ICEVbecause the electric power train shares the burden of propulsion. The 2001 EPRI report[25] estimated engine costs using a set of curves developed at General Motors that showbase-engine cost versus engine power in kilowatt. For a 4-cylinder engine, the base-engine cost function was approximately $11/kW+ $400. EPRI estimated that the totalengine cost, including a thermal management system at $0.236/kW of peak engine
Lifetime Cost of Battery, Fuel-Cell, and Plug-in Hybrid Electric Vehicles 35

power, was $2,107 for the ICEV, $1,170 for a PHEV-32, and $889 for the PHEV-96(in 2000 $) [25].
The 2001 EPRI report [25] also calculated the cost of the exhaust system (includingthe catalytic converter) based on the engine size. For the ICEV, the exhaust system costs$250; for the PHEV-32, the exhaust system costs $200; and for the PHEV-96, theexhaust system costs $150 (in 2000 $) [25].
Simpson [26] used the aforementioned engine-cost equations in EPRI 2001 tocalculate an engine cost of $2,300 for the ICEV, $1,706 for a PHEV-32, and $1,749for a PHEV-96 (in 2006 $).
In their 2001 report, EPRI assumed that PHEVs would have a continuously variabletransmission (CVT) rather than an automatic transmission with discrete gearing ratiosbecause of the lower cost and performance advantage of the CVT [25]. EPRI estimatedthat the CVT in a PHEV-32 and a PHEV-96 would cost $625 (in 2000 $), which isabout 60% of the cost of an automatic transmission from a model year 2000 ChevroletLumina. Table 2.4 summarizes the estimates of the cost of the electric motor andcontroller, engine, transmission, and exhaust system.
EPRI’s estimates of the cost of the electric motor are significantly higher than theestimates from the other studies, but its estimate of the engine cost is lower. This
Table 2.4 OEM cost estimates for mid-sized car PHEV components (2008 $, converted from originaldollar basis by the PPI)
Author CD range (km)and controlstrategya
Motor andcontroller ($)
Engine ($) Transmission ($) Exhaustsystem ($)
Simpson (2006) [26] 16 1,170 1,855 NR NRB
Kromer and Heywood(2007) [8]
16, 48, 96B
803 3,715b w/engine 301
EPRI 2001 (Grahamet al., 2001) [25]
32 1,933 1,469 785 251AE
Simpson (2006)c [26] 32 1,503 1,887 NR NRB
Burke (2007) [36] 32 1,099 1,500 NR NRB
Simpson (2006)c [26] 96 1,575 1,937 NR NRB
EPRI 2001 (Grahamet al., 2001) [25]
96 3,154 1,116 785 188AE
NR=not reported, OEM=original equipment manufacturer.a AE= all-electric, B= blended.b Kromer and Heywood [8] reported engine and transmission cost as one value.c Engine, battery, and motor cost calculated from equations given in Simpson’s study [26].
36 Mark A. Delucchi and Timothy E. Lipman

difference stems from EPRI’s choice of a PHEV with an AER, which demands a largerelectric motor to meet the peak power demand without engaging the correspondinglysmaller engine.
3.3.5 Accessory powerEPRI’s 2001 report estimated that, in a PHEV, a power steering pump, an air-conditioning compressor and condensor, and an accessory power module to run light-ing and other electrical loads would cost a total of $300 (in 2000 $) [25]. The 2004 EPRIreport [28] assumed the same cost. For comparison, in an ICEV, a power steering pump,an air-conditioning compressor and condenser, and a generator/alternator were esti-mated to cost a total of $210.
3.4 Nonenergy operating and maintenance costs3.4.1 OverviewAs discussed in the introduction to this chapter, operating and maintenance costs includeenergy (which we consider in a separate subsection), insurance, maintenance, repair,registration, tires, oil, safety- and emission-inspection fees, parking, and tolls. Most ofthese are likely to be different for PHEVs than for gasoline ICEVs. However, PHEVlifetime cost studies conducted to date generally have considered only energy costs and,in some instances, maintenance and repair costs.
3.4.2 Maintenance and repair costsTable 2.5 summarizes estimates of PHEV maintenance costs from the EPRI 2001 and2004 studies [25, 28] and estimates of HEV (not PHEV) maintenance costs from Lipmanand Delucchi [35] and a cost calculator of the U.S. Department of Energy (DOE) [37].
Both of the EPRI studies report that PHEV maintenance costs, including parts andlabor, are likely to be lower than those for ICEV [25, 28], in part because in a PHEV theengine shares the propulsion load with the electric drivetrain and hence is likely to haveless wear than the engine in an ICEV. Both EPRI studies also assume that the front brakepads and rotors in a PHEV would last about twice as long as they would in an ICEV,because regenerative braking spares the front brake pads and rotors in a PHEV fromwearing as quickly as those in an ICEV.
The DOE cost calculator also indicates that an HEV is slightly cheaper to maintainthan a comparable ICEV, but the DOE estimates in general are much lower thanEPRI’s. Because the methods and assumptions used in DOE cost calculator are notcompletely explicit, it is impossible to fully explain the differences between the DOEand EPRI estimates. The calculator documentation notes that it bases annual mainte-nance costs on mileage and estimates developed by Vincentric, LLC, an automotive dataservices company, but does not report the detailed estimates. It appears from thedocumentation that the estimate of lower HEV maintenance costs is based on longer
Lifetime Cost of Battery, Fuel-Cell, and Plug-in Hybrid Electric Vehicles 37

service intervals for components like the brakes and spark plugs. It follows that forPHEVs, which would have smaller engines and larger electric drivetrains compared toHEVs, the maintenance costs would likely be even lower.
By contrast, the maintenance cost estimates by Lipman and Delucchi [35], which arethe most detailed, result in HEVs having slightly higher maintenance costs than ICEVs.Their estimation method has several steps: (1) estimate fleet-average lifetime mainte-nance and repair costs for ICEVs, in dollars per vehicle per year, using data from theBureau of the Census data; (2) distinguish maintenance and repair costs that are the samefor HEVs and ICEVs, costs that are unique to ICEVs or HEVs, and costs that are“common to but not exactly the same” for ICEVs and HEVs; (3) estimate the HEV costsrelative to the ICEV costs for those costs that are unique to HEVs and common to butnot the same for HEVs and ICEVs; (4) convert the fleet-average lifetime estimates intoyear-by-year maintenance cost schedules, for different vehicle types; (5) update costs to atarget year using the consumer price index (CPI); and (6) estimate HEV maintenanceand repair “common” costs relative to ICEV costs based on components sizes and then
Table 2.5 Maintenance cost estimates (2008 $)a for mid-sized vehicles
Study Vehiclelifetime(km)
Vehicle type Lifetimemaintenancecost
Lifetimemaintenance cost($/km)
EPRI 2001 (Grahamet al., 2001)b [25]
161,000 ICEV 5,853 0.0364HEV 5,371 0.0334PHEV-32 4,861 0.0302PHEV-96 4,464 0.0277
EPRI 2004 (Duvallet al., 2004)b [28]
188,000 ICEV 6,450 0.0342PHEV-32 4,122 0.0219
241,000 ICEV 8,475 0.0352PHEV-32 5,118 0.0212
Lipman and Delucchi(2003)c [35]
273,530 ICEV 12,094 0.0442HEV “full” hybrid 13,407 0.0490
U.S. DOE (2008)d [37] 161,000 ICEV 3,301 0.0205HEV 3,107 0.0193
aAdjusted from the original dollars to year 2008 dollars using the CPI for vehicle maintenance and repair [38].b To put the two EPRI studies on the same basis, we used the nondiscounted maintenance costs from Appendix A inEPRI 2004 [28] and subtracted tire costs from the total maintenance costs, because EPRI 2001 [25] did not include tirecosts.
c Lipman and Delucchi [35] report maintenance costs for a mid-sized ICEV (based on Ford Taurus) and a comparablemid-sized “advanced full” HEV with an electric drivetrain that provides 40% of the total vehicle power requirement.They estimate maintenance costs of $617/year for the ICEV and $684/year (year 2000 $) for the HEV, and a vehiclelifetime of 15 years.
dWe used the DOE cost calculator to obtain estimates of average annual maintenance costs for several mid-sized ICEVs(the Toyota Camry, Honda Civic, Nissan Altima, and Hyundai Elantra) and HEVs (the Toyota Prius and Camry, HondaCivic, and Nissan Altima). We ran the calculator for 10,000 miles/year (16,100 km/year) and multiplied the averageannual cost by 10 years to obtain a lifetime maintenance cost without discounting—comparable to what is reported inthe EPRI studies.
38 Mark A. Delucchi and Timothy E. Lipman
aggregate all maintenance and repair cost estimates for each vehicle type. This methodresults likely in relatively high maintenance cost estimates because it assumes that thereare maintenance requirements for the novel HEV components (which are assumed zeroin some studies) and in effect accounts for the more complex nature of the HEVdriveline. We also note that the studies in Table 2.5 assume that EV batteries requireno maintenance. This assumption probably is reasonable, because maintenance costs foradvanced EV batteries are likely to be relatively minor, but there are small costsassociated with periodic inspecting and tightening battery connectors that could beincluded in a more complete study.
3.4.3 Other nonenergy operating costsCompared with ICEVs, PHEVs will have different insurance costs, because these arepartly a function of vehicle value (which is different for PHEVs); different tire costs,because these are partly a function of vehicle weight; different registration costs, becausethese are a function of vehicle value or vehicle weight; and different emission-inspectionfees, because these are related to the characteristics of the engine and emission controlsystem, which will be different for PHEVs. However, as indicated above, we have notfound an analysis that quantifies these differences for PHEVs specifically. Lipman andDelucchi [34, 35] evaluate these other nonenergy operating costs for a range of non-plug-in HEVs, and estimate that an “advanced” mid-sized HEV with a relatively largeelectric power train (providing 40% of the total required power) has a 15% higherinsurance cost per kilometer than does the comparable ICEV, due to the higher initialcost of the HEV, but lower lubricating oil, tire, and registration costs, the latter two onaccount of the lower estimated vehicle weight of the HEV. We expect that resultswould be qualitatively similar for PHEVs.
3.5 Energy-use costs3.5.1 OverviewThe energy cost per mile of a PHEV is the product of two independent factors: the priceof energy, in $/British thermal unit (BTU) and the energy-use rate, in BTUs/mile, foreach source of energy. In this section we focus on the electricity cost per mile. The priceof electricity depends in part on whether the utility’s pricing structure distinguishes peakdemand periods from off-peak periods. The energy-use rate depends in part on the sizeand control strategy of the electric power train. We discuss both of these factors next.
3.5.2 Energy use of PHEVsThe power train energy use of PHEVs depends on a number of factors that have beentreated differently in the literature. A particularly important and uncertain factor is thecontrol strategy that dictates if the PHEV will operate on battery power alone or if boththe gasoline engine and electric motor will propel the vehicle. One control option is to
Lifetime Cost of Battery, Fuel-Cell, and Plug-in Hybrid Electric Vehicles 39

design the PHEV to have an AER over a specified drive cycle; in this case, the enginewill turn on only once the battery has reached a predetermined SOC and from then untilthe next recharging will operate as a CS hybrid (e.g., the Toyota Prius). We refer to thisas the all-electric or AE design strategy.
An alternate strategy, termed blended mode, allows the engine to turn on in responseto power demands that exceed the capacity of the electric drivetrain. Gonder and Markel[39] described two variations on the blended control scheme. The first, an engine-dominant blended strategy, uses battery power to supplement engine operation andkeep the engine running at its best possible efficiency. This provides the best petroleumfuel economy over the longest distance. The other control option is the electric-dominantblended strategy. Under this scheme, the objective is to power the vehicle using theelectric power train as much as possible and to turn on the engine only if the vehicleencounters a transient load beyond the capabilities of the electric motor and battery. Asshown in Table 2.6, most PHEV studies have selected the electric-dominant blendedcontrol strategy, which we will designate ED.
A PHEV with an AE control strategy will have higher power train costs but lowerenergy costs than will a PHEV with a blended ED control strategy. It will have higherpower train costs because it will need a larger battery and power train in order to providemaximum driving range on electricity. However, this can be offset somewhat by thelower cost of a smaller engine. It will have lower energy costs because the cost per mileof electricity is less than the cost per mile of gasoline and an AE PHEV is designed to runalmost exclusively on electricity. The design that minimizes the total lifetime cost(amortized initial costs plus operating costs) depends on the desired AER, the actualdriving patterns, the power demands of the drive cycle, and other factors. To ourknowledge nobody has analyzed in detail the lifetime costs of different PHEV designs.
Table 2.6 summarizes the results of several studies of PHEV design and energy use.Simpson [26] used an iterative Microsoft Excel spreadsheet model to estimate theappropriate component sizes based on performance requirements such as 0–60mphacceleration time and maximum speed, and then calculated the mass of the sizedcomponents and the resultant total mass of the vehicle. This designed vehicle then wassimulated in ADVISOR, a dynamic vehicle energy-use model that determines gasolineand electricity consumption over various drive cycles [26]. The resultant energy-useestimates are shown in Table 2.6.
Gonder et al. [40] also used ADVISOR to simulate the performance of PHEVs.They simulated PHEV performance over standard driving cycles, such as the US06cycle, but also simulated a real-world driving cycle based on GPS data from 227 vehiclesin the St. Louis metropolitan area. As shown in Table 2.6, the modeled gasolineconsumption was lower for the real-world, GPS-based drive cycle than for the com-bined UDDS/HWFET and US06 drive cycles (4.06 l/100 km vs. 4.34 l/100 km and5.06 l/100 km, respectively). Conversely, electricity consumption was higher for the
40 Mark A. Delucchi and Timothy E. Lipman

Table 2.6 Modeled component specifications and fuel consumption for mid-sized PHEVs
Author Model Controlstrategya
CDRange(km)b
Enginepower(kW)
Motorpower(kW)
ESSpower(kW)
ESSenergy(kWh)
Curbmass(kg)
Drivecyclec
Fuelconsumption(l/100 km)
Electricityconsumption(Wh/km)
SOCwindowd
Gonder et. al(2007) [39]
ADVISOR ED 32 79.4 43.6 47 9.4 1,488 Comb. 4.36 59 NRRW 4.06 87US06 5.94 NR
64 81.9 48 51.8 18.5 1,567 Comb. 3.49 97.6 NRRW 3.10 131.1US06 4.57 NR
Simpson (2006)(near-term) [26]
Excel Model andADVISOR
ED 32 85 47 62.23 12.7 1,678 Comb. 6.0 60 47%64 91 51 68.64 20.8 1,824 Comb. 4.8 104 59%
Simpson (2006)(long-term) [26]
Excel Model andADVISOR
ED 32 81 43 57.82 11.8 1,531 Comb. 5.7 58 47%64 83 45 60.8 19 1,598 Comb. 4.5 96 59%
Kromer &Heywood(2008) [8]
ADVISOR ED 16 48 38 43 3.2 1,296 Comb/Adj 2.3 119.9 60%48 50 40 45 8.2 1,338 Comb/Adj 1.54 115.6 70%96 53 42 48 16.5 1,434 Comb/Adj 1.09 113.7 75%
Burke (2007) [36] ADVISOR AE 32 75 65 80–100 10 1,372 NRe 6.2 154.7 50%aED= electric-dominant, AE= all-electric.b CD range is the design goal, not actual range on each cycle.c Drive cycles: RW= real-world as modeled by GPS in Gonder et al. [40]. Comb.=weighted combination of HWFET and UDDS cycles. Comb/Adj: combined, adjusted HWFET/FTP drivecycle, calculated as follows: Comb/Adj = (0.45) (FCHW/0.78) + (0.55) (FCFTP/0.9), where FCHW and FCFTP are the fuel consumption in the HWFET and FTP drive cycles, respectively.FTP=Federal Test Procedure; HWFET=Highway Fuel Economy Test; UDDS=Urban Dynamometer Driving Schedule.
d SOC window= ratio of required energy to ESS total energy. Describes the amount by which the battery may be discharged.eDrive cycle not specified. Assumed to be driven such that 70% of miles are in CD mode and 30% in CS mode [41].

real-world cycle than in the combined UDDS/HWFET drive cycle (87Wh/km vs.59Wh/km). These findings suggest that the standard EPA test driving cycles do notcapture the range of speeds and accelerations in real-world driving, and that thesedifferences can significantly affect energy use of PHEVs. Specifically, it is possible thatPHEV analyses based on the EPA drive cycles (e.g., [8, 36]) underestimate the electricityconsumption and overestimate the gasoline consumption of PHEVs.
3.5.3 The price of electricity and the total annual electricity costTable 2.7 shows how five studies treat several factors in the calculation of the total annualelectricity bill for a PHEV: annual driving distance, CD range, charging time of day, andelectricity prices. Of particular interest here are the assumptions related to the electricityprice.
The EPRI 2001 and 2004 reports [25, 28] and Kromer and Heywood [8] assumedthat PHEV charging would occur at off-peak times and would face relatively low off-peak electricity prices of 5.0–7.5 cents/kWh. By contrast, Parks et al. [42] assumed thatthe PHEV would be charged once per day at an average electricity price of 8.6 cents/kWh, and Simpson [26] assumed that PHEV charging would face the 2005 U.S. averageelectricity price of almost 10 cents/kWh. Which assumption is more reasonable—anaverage electricity price or an off-peak price—depends on how people respond to pricedifferentials. On this issue there have been conflicting findings: although several studiesshow that in general (as opposed to in the specific case of EV charging), time-of-use ratesdo cause consumers to shift their electricity usage to low-price off-peak periods [43–45];other studies (e.g., [46]) have shown little to no effect on consumer behavior due toprice differentials. Furthermore, to our knowledge there are no studies of the effects oftime-of-use rates specifically on consumers who own EVs.
The annual electricity cost of a PHEV depends on the number of miles traveledon electricity and the price of electricity. Parks et al. [42] and the EPRI 2001 report[25] estimate higher annual electricity use, and subsequently higher annual electricitycost, than the other studies. EPRI 2004 [28] and Kromer and Heywood [8] estimatesimilar annual costs; the differences are due to the choice of annual mileage and CDrange.
3.6 External costs of PHEVsThomas [16] has estimated the external costs of gasoline ICEVs, BEVs, PHEVs, andhydrogen FCEVs. We discuss these in Section 4.5. In general, we can say that to theextent that PHEVs have lower emissions of GHGs (see Lipman and Delucchi, Chapter 5of this volume) and urban air pollutants and use less petroleum than do petroleumICEVs, PHEVs will tend to have lower external costs. Because PHEVs still usesome petroleum, whereas BEVs and FCEVs do not, the reduction in external costs
42 Mark A. Delucchi and Timothy E. Lipman
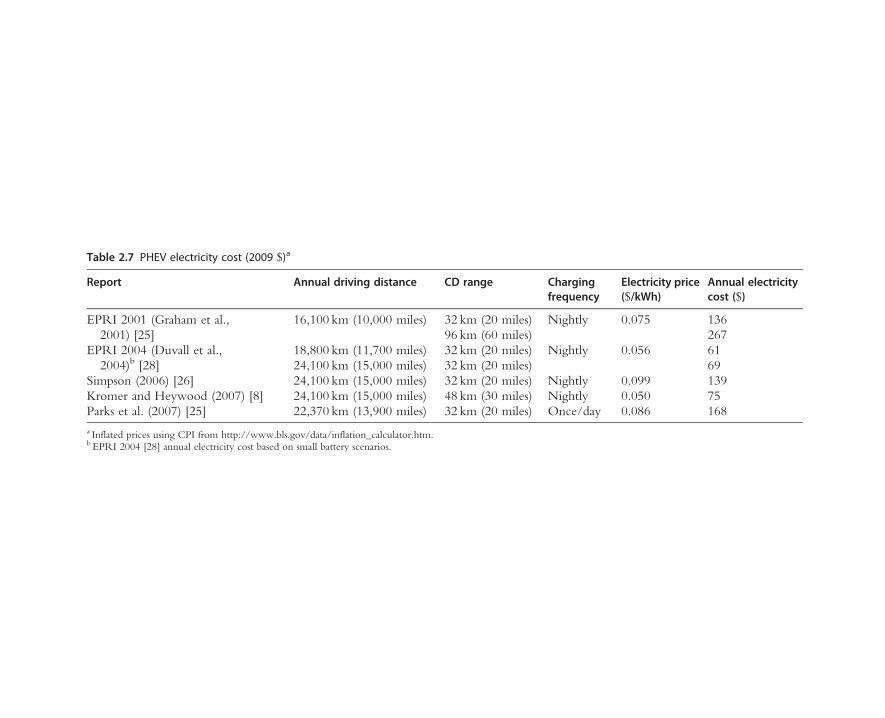
Table 2.7 PHEV electricity cost (2009 $)a
Report Annual driving distance CD range Chargingfrequency
Electricity price($/kWh)
Annual electricitycost ($)
EPRI 2001 (Graham et al.,2001) [25]
16,100 km (10,000 miles) 32 km (20 miles) Nightly 0.075 13696 km (60 miles) 267
EPRI 2004 (Duvall et al.,2004)b [28]
18,800 km (11,700 miles) 32 km (20 miles) Nightly 0.056 6124,100 km (15,000 miles) 32 km (20 miles) 69
Simpson (2006) [26] 24,100 km (15,000 miles) 32 km (20 miles) Nightly 0.099 139Kromer and Heywood (2007) [8] 24,100 km (15,000 miles) 48 km (30 miles) Nightly 0.050 75Parks et al. (2007) [25] 22,370 km (13,900 miles) 32 km (20 miles) Once/day 0.086 168a Inflated prices using CPI from http://www.bls.gov/data/inflation_calculator.htm.b EPRI 2004 [28] annual electricity cost based on small battery scenarios.

with PHEVs will be less than the reduction with BEVs and FCEVs (this is consistentwith Thomas’s [16] results).
Furthermore, as discussed more fully in Section 4.6 (the social lifetime costs of FCEVs),in a social-cost analysis the relevant cost metric for petroleum fuel is not the price of the fuelbut rather the cost of the fuel, and in the case of petroleum the cost can be much less thanthe price. This by itself reduces the social cost of petroleum ICEV relative to the private costof petroleum ICEVs, because the private cost is based on the price that consumers actuallypay. These two factors—the relatively modest reduction in external costs with PHEVs,and the price-cost effect that tends to reduce the social lifetime cost of petroleum ICEVs—are likely to result in the social cost of PHEVs relative to the social cost of ICEVs beingsimilar to the private cost of PHEVs relative to the private cost of ICEVs.
We believe that the conclusion of Lipman and Delucchi [34] who analyze theexternal costs of HEVs, applies generally to the external costs of PHEVs:
The general conclusion is that the most likely value of external costs (e.g., about $0.20/gallonfor our best estimates) are not large relative to either absolute gasoline prices…or to therange of the breakeven price due to uncertainty in the private lifetime costs. We do not thinkthis means that external costs should be ignored, but rather that one should not expect theresults of a social-cost analysis of HEVs to be dramatically different from the results of aprivate-cost analysis. In other words, consideration of external costs is not likely to appreciablyrelieve us of the need to find the most cost-effective vehicle designs and to reduce batterycosts as much as possible (p. 131).
3.7 Discussion of PHEV cost estimatesIn this chapter, we reviewed the recent literature on lifetime cost of PHEVs. In allstudies, battery cost is the main driver of the incremental cost of a PHEV over an ICEvehicle, but none of the studies we reviewed conducted detail original research in thisarea. Although PHEV batteries currently are very expensive, with some advances inbattery technology and manufacturing processes, batteries have the potential to be muchcheaper when mass produced. However, we are interested here in the lifetime cost permile of the battery, and this is a function of the battery lifetime, which is uncertain andhas not yet been modeled in detail. Further research on the cost and lifetime of batteriesand other EV components is warranted.
Nonenergy operating and maintenance and repair costs are likely to be different forPHEVs than for ICEVs, but no study has examined all of these differences systematicallyand in detail for PHEVs specifically. A few studies have considered maintenance costs,generally not in great detail. More work in this area is needed.
As mentioned above, estimates of the energy-use cost of PHEVs depend critically onassumptions regarding the price of electricity and the energy use of the vehicle. Thecontrol strategy is particularly important in determining energy use and is one of the
44 Mark A. Delucchi and Timothy E. Lipman

most uncertain aspects of PHEV design. In addition, the drive cycle (i.e., the range ofspeeds and accelerations over a given distance) the vehicle is subjected to can have asignificant effect on the vehicle’s energy consumption. Both the control strategy and testdrive cycle warrant further examination so PHEV energy use can be modeled moreaccurately.
Our qualitative assessment of the external costs of PHEVs compared with ICEVssuggests that the social cost of PHEVs relative to the social cost of ICEVs will be similarto the private cost of PHEVs relative to the private cost of ICEVs. Overall, we feel thatthe current analyses are not comprehensive or detailed enough to allow for a fulldelineation of the differences in social lifetime cost between PHEVs and ICEVs.
4. LIFETIME COST OF FUEL-CELL ELECTRIC VEHICLES
4.1 IntroductionFCEVs use a fuel cell to convert the chemical energy in hydrogen and oxygen directlyinto electrical energy. A fuel cell differs from both a rechargeable (or secondary) storagebattery, such as is used in BEVs, and a heat engine, although it is much more similar tothe secondary battery than to the heat engine. Fuel cells and batteries are electrochemicaldevices; the main difference between them is that in a battery, the electricity-producingreactants are regenerated in the battery by the recharging process, whereas in a fuel cell,the electricity-producing reactants are continually supplied from sources external to thefuel cell itself: oxygen from the air and hydrogen from a separate onboard storage tank.The hydrogen can be stored as such on the vehicle, or can be stored on the vehicle in theform of methanol and then reformed into hydrogen and CO2 onboard the vehicle.However, because methanol reforming reduces the energy efficiency of the vehicle, addscomplexity, and produces CO2 and other pollutants, most analysts assume that hydrogenis stored on the vehicle as such, typically at high pressures. All of the recent cost analysesreviewed here assume that FCEVs have high-pressure hydrogen storage tanks.
Hydrogen FCEVs combine the best features of battery EVs—zero emissions, highefficiency, quiet operation, and long life—with the long range and fast refueling time ofICE vehicles. If FCEVs can be developed economically, they will be general-purposeZEVs, and will be an important component of a strategy for reducing dependence onoil, mitigating global warming, and improving urban air quality, at an acceptable cost.
4.2 Component costs4.2.1 OverviewA hydrogen FCEV has an electric motor and transmission, an electric motor controller,a fuel cell, and a high-pressure hydrogen storage system. It also may have a battery orother electricity storage device, such as an ultracapacitor, to be able to store the electrical
Lifetime Cost of Battery, Fuel-Cell, and Plug-in Hybrid Electric Vehicles 45
energy from regenerative braking and to supplement the power supply from the fuel cell.In previous subsections (Sections 2.3.1, 3.3.2, and 3.3.3), we have reviewed estimates ofcosts of electric motors, motor controllers, and batteries for EVs. Here we discuss estimatesof the cost of fuel cells and the cost of onboard hydrogen storage systems.
4.2.2 Fuel-cell systemThe cost of a fuel-cell system can be analyzed in several parts: (1) the fuel-cell stack,consisting mainly of the electrodes, electrolyte, flow field, and housing; (2) the fuel-cellauxiliaries for heating, cooling, and water management; (3) the air-compression system;(4) the fuel processing system, if the vehicle stores methanol rather than hydrogen; and(5) electronic controls and electrical integration. In a cost analysis, key parts of the fuel-cell stack itself are the platinum catalyst and the proton-conducting polymer membrane.
Here we review a series of detailed estimates of fuel-cell system costs by DirectedTechnologies, Inc. (DTI) [47–49] and by Arthur D. Little (ADL) (later TIAX) [50–52].DTI and ADL estimated costs in detail, at high volumes of production, for currenttechnology and future technology systems. We then review a recent detailed analysis bySun et al. [53] that relies in part on the work of DTI and ADL.
Directed Technologies Inc. (DTI). DTI has done detailed cost analyses of FCVs forover 10 years, with sponsorship from DOE and auto companies. In 1998 theypublished a detailed report on hydrogen fuel cell costs in high-volume production(500,000 power plants per year), based on prototypes or “reasonable extrapolations,”but no technological “breakthroughs” [47]. The results of this are shown in Table 2.8.In 2001, DTI carried out another analysis of FC costs as a function of productionvolume (500, 10,000, 30,000, and 500,000 units/year), this time assuming methanolrather than hydrogen and explicitly based on then-currently available technology [48].As shown in Table 2.8, the DTI 2001 estimates of the cost of current fuel-celltechnology are nearly an order of magnitude higher than their 1998 estimates of“future” technology costs.
DTI updated its analysis again in 2007, estimating the cost of a direct hydrogen fuel-cell system at three technology levels (year 2006, 2010, and 2015), and five differentannual vehicle production volumes (1,000, 30,000, 80,000, 130,000, and 500,000vehicles per year) [49] (Table 2.8). The 2007 analysis uses an extremely detailed costingmethod that consider machine costs, machine utilization rates, detailed materials costs,corporate taxes, equipment life, and so on. The 2007 analysis indicates that fuel cells withyear 2015 technology produced in high volume will cost $59/kWe-net (Table 2.8), orabout $4,700 for the 80-kWe-net system.
Arthur D. Little (ADL)/TIAX LLC. Like DTI, ADL/TIAX has performed a series offuel-cell cost analyses over the past decade. (When ADL declared bankruptcy in 2002,TIAX LLC hired the ADL personnel involved in analyses of fuel-cell systems andcontinued that line of work.) First, ADL [50] did a detailed “factory” cost analysis of
46 Mark A. Delucchi and Timothy E. Lipman

Table 2.8 DTI estimates of fuel-cell system cost ($/kWe-net, except as noted)
Fuel Reformate Hydrogen Hydrogen
Study author (year) James et al. (2001)a [48] Lomax et al. (1998)b [47] James and Kalinoski (2007)c [49]FC net power (kWe) 50 50 80
Year of technology ~2001 ~2000–2010 2006 2015
Units/year 500,000 500,000 30,000 500,000 30,000 500,000Fuel cell subsystemMembrane 26 0.4–0.6 15.00 4.31 12.04 3.30Catalyst 86 8–13 49.01 43.77 10.07 8.98Balance of stack 58 11–16 41.18 18.65 27.56 12.70Fuel-cell stack subtotal 170 20–30 105 67 50 25Air, water, coolant, misc. 30 n.e. 60 43 50 34Subtotal fuel-cell subsystem 200 n.e. ~165 110 ~100 59Controls, BOP, misc. 12 n.e. See air, water, coolants, miscFuel processord 49 n.e. n.a.Total 262 n.e. n.a.
n.e. = not estimated, n.a. = not applicable.a The estimates of membrane and catalyst cost include fabrication as well as material costs. The “controls, BOP, misc.” category includes stack assembly.b Estimates are for the stack only, and do not include: turbo-compressor, humidifiers, or cooling system. Lomax et al. [47]. report costs per kWe-gross; we assume costs perkWe-electric net are 10% higher. (The gross output of the fuel-cell stack is before any system auxiliaries; the net output is net of the power consumption of systemauxiliaries.)
c Estimates converted from $/kW-gross by multiplying by ratio of gross power to net power (87.1/80= 1.089). Year of dollars not specified. “Balance of stack” includes stackassembly and stack conditioning and testing, and is calculated by difference between reported stack total and reported membrane and catalyst costs. “Air, water, coolant,misc.” is calculated as the difference between “subtotal fuel-cell subsystem” and “fuel-cell stack subtotal.”
d The “fuel processor” cost category includes the reactor, the reformate loop, and the fuel loop.

fuel cells for transportation. They assumed year–2000 performance data, but highvolumes of production. They defined their “factory” cost basis explicitly and in detail.Their estimates for a mass-produced (500,000 units/year) 50 kWe-net system (with amethanol reformer) are shown in Table 2.9.
In 2002, ADL complemented its analysis of costs given current technology with ananalysis of future costs assuming projected technology [51]. The future-technology scenarioassumedmuch higher current density, much lower platinum loading, and lower membraneand balance-of-plant costs than in the current-technology scenario. The resulting estimatesfor a mass-produced (500,000 units/year), 50 kWe-net future-technology system, witheither hydrogen or methanol storage, are shown in Table 2.9. In the ADL analyses, thecatalysts, reformers, membrane, and other fuel-cell subsystem components cost much less inthe future-technology scenario than in the current-technology scenario.
Finally, Lasher et al. [52] report the most recent results from this line of research(Table 2.9). They estimate costs of high-volume production of a direct-hydrogen fuel-cell system, for year 2010 and 2015 technology levels. They use the same manufacturingcost software used by James and Kalinoski [49], but they estimate that the complete fuel-cell subsystem costs $67/kWe-net (Table 2.9)—much less than James and Kalinoski’sestimate for year 2006 technology (Table 2.8).
Table 2.9 ADL estimates of fuel-cell-system cost ($/kWe-net)
Fuel Reformate Reformate Hydrogen Hydrogen
Study author (year) ADL (2000) [50] Carlon andThijssen(2002)a [51]
Carlon andThijssen(2002)a [51]
Lasher et al.(2007) [52]
FC net power (kWe) 50 50 50 80
Year of technology ~2000 “Future” “Future” ~2007
Units/year 500,000 500,000 500,000 500,000Fuel-cell subsystemPrecious metals in stack 52 14 10Membrane, plates, air
supply, cooling, other125 58 44
Subtotal fuel-cell subsystem 177 72 54 67 (31 stackonly)
Balance of plant 10 5 3Fuel processor/H2 storage 86 28 30 n.eAssembly/labor/
depreciation21 14 15
Total 294 118 102
n.e. = not estimated.aNote: values read from graph in Carlson and Thijssen [51].
48 Mark A. Delucchi and Timothy E. Lipman

Comparison of DTI and ADL/TIAX estimates. The ADL definition of “factory” costappears to be very similar to the DTI definition of cost, and the definition of high-volume production is identical (500,000/year) in both sets of studies, so the DTIestimates are reasonably comparable with the ADL estimates. Specifically, we cancompare estimates of complete systems using reformate with current technology[48, 50], and estimates of the fuel-cell stack only using hydrogen, with future technology[47, 51]. The most recent ADL and DTI estimates cannot be directly compared becauseof lack of detail in the most recent ADL estimates.
These comparisons reveal the following:• The DTI and ADL estimates of total system costs for current-technology fuel-cell
systems are similar, but there are differences in the details;• DTI estimates lower costs for future-technology hydrogen fuel-cell stacks;• DTI estimates lower costs for current-technology reformers;• DTI and ADL estimate similar membrane costs in the current-technology scenarios,
but DTI’s estimate of future-technology membrane costs appears to be much lowerthan ADL’s; and
• DTI and ADL estimate similar platinum costs in the future-technology scenarios, butDTI estimates a higher cost in the current-technology scenario, mainly because of ahigher assumed platinum price. This highlights the importance of carefully estimatingplatinum-catalyst cost.Sun et al. (2010). Sun et al. [53] combine cost estimates from DTI and ADL with
independent estimates of catalyst costs, and estimate that a fuel-cell system, including thestack, air management, water management, and thermal management, will cost $57/kWof stack power output, at high volumes of production. This is close to DTI’s estimate ofthe cost of a future-technology fuel-cell system (Table 2.8).
4.2.3 Hydrogen storage systemHydrogen must be compressed, liquefied, or reacted with or contained in other materialsin order to be stored conveniently onboard a vehicle. It is simplest and perhaps mosteconomical to compress hydrogen and store it in specially designed high-pressure vesselsconsisting of a metal or metal–polymer container wrapped with carbon fiber. In thissection we analyze the cost of these sorts of high-pressure vessels for hydrogen.
The cost and weight of high-pressure vessels is a function of the cost and weight ofthe materials, the manufacturing process, the storage pressure, and the amount ofhydrogen stored. For high-pressure fiber-wrapped cylinders, one of the key cost factors isthe cost of the carbon fiber used to wrap the metal or metal–polymer container. Table 2.10summarizes several detailed estimates of the manufacturing cost of high-pressure hydrogenstorage containers.
For storage at 10,000 psi, the estimates of the cost of storing 4.6 kg of hydrogen—enough for a 300-mile range in a mid-sized FCEV that gets an gasoline-equivalent fueleconomy of 61mpg—range from about $1,800 to $3,000, with our best estimate being
Lifetime Cost of Battery, Fuel-Cell, and Plug-in Hybrid Electric Vehicles 49
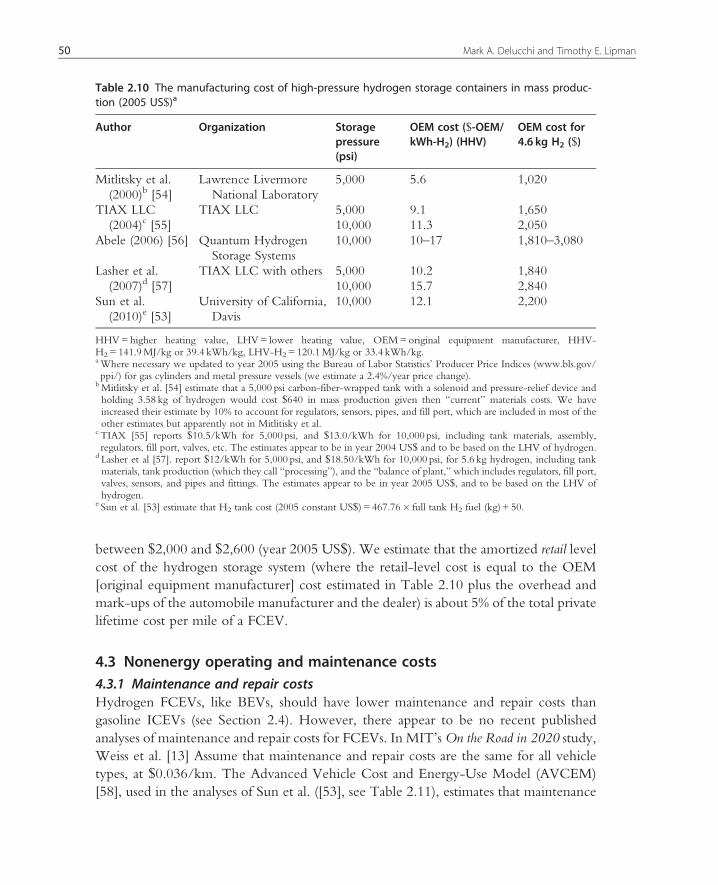
between $2,000 and $2,600 (year 2005 US$). We estimate that the amortized retail levelcost of the hydrogen storage system (where the retail-level cost is equal to the OEM[original equipment manufacturer] cost estimated in Table 2.10 plus the overhead andmark-ups of the automobile manufacturer and the dealer) is about 5% of the total privatelifetime cost per mile of a FCEV.
4.3 Nonenergy operating and maintenance costs4.3.1 Maintenance and repair costsHydrogen FCEVs, like BEVs, should have lower maintenance and repair costs thangasoline ICEVs (see Section 2.4). However, there appear to be no recent publishedanalyses of maintenance and repair costs for FCEVs. In MIT’sOn the Road in 2020 study,Weiss et al. [13] Assume that maintenance and repair costs are the same for all vehicletypes, at $0.036/km. The Advanced Vehicle Cost and Energy-Use Model (AVCEM)[58], used in the analyses of Sun et al. ([53], see Table 2.11), estimates that maintenance
Table 2.10 The manufacturing cost of high-pressure hydrogen storage containers in mass produc-tion (2005 US$)a
Author Organization Storagepressure(psi)
OEM cost ($-OEM/kWh-H2) (HHV)
OEM cost for4.6 kg H2 ($)
Mitlitsky et al.(2000)b [54]
Lawrence LivermoreNational Laboratory
5,000 5.6 1,020
TIAX LLC(2004)c [55]
TIAX LLC 5,000 9.1 1,65010,000 11.3 2,050
Abele (2006) [56] Quantum HydrogenStorage Systems
10,000 10–17 1,810–3,080
Lasher et al.(2007)d [57]
TIAX LLC with others 5,000 10.2 1,84010,000 15.7 2,840
Sun et al.(2010)e [53]
University of California,Davis
10,000 12.1 2,200
HHV=higher heating value, LHV= lower heating value, OEM=original equipment manufacturer, HHV-H2= 141.9MJ/kg or 39.4 kWh/kg, LHV-H2=120.1MJ/kg or 33.4 kWh/kg.aWhere necessary we updated to year 2005 using the Bureau of Labor Statistics’ Producer Price Indices (www.bls.gov/ppi/) for gas cylinders and metal pressure vessels (we estimate a 2.4%/year price change).
bMitlitsky et al. [54] estimate that a 5,000 psi carbon-fiber-wrapped tank with a solenoid and pressure-relief device andholding 3.58 kg of hydrogen would cost $640 in mass production given then “current” materials costs. We haveincreased their estimate by 10% to account for regulators, sensors, pipes, and fill port, which are included in most of theother estimates but apparently not in Mitlitisky et al.
c TIAX [55] reports $10.5/kWh for 5,000 psi, and $13.0/kWh for 10,000 psi, including tank materials, assembly,regulators, fill port, valves, etc. The estimates appear to be in year 2004 US$ and to be based on the LHV of hydrogen.
d Lasher et al [57]. report $12/kWh for 5,000 psi, and $18.50/kWh for 10,000 psi, for 5.6 kg hydrogen, including tankmaterials, tank production (which they call “processing”), and the “balance of plant,” which includes regulators, fill port,valves, sensors, and pipes and fittings. The estimates appear to be in year 2005 US$, and to be based on the LHV ofhydrogen.
e Sun et al. [53] estimate that H2 tank cost (2005 constant US$) = 467.76� full tank H2 fuel (kg) + 50.
50 Mark A. Delucchi and Timothy E. Lipman

Table 2.11 Overview of recent hydrogen FCEV cost studies
Studygroup
MIT [8,13,60] Oak Ridge NationalLaboratory (ORNL) [61]
National ResearchCouncil [62]
EUCAR [63] Imperial CollegeLondon [10]
Region U.S. and severalEuropean countries
U.S. U.S. Europe UK
Timeframe 2020, 2030, 2035 2012–2025 2010–2050 2010+ 2010, 2030Vehicle
typeMid-sized car, light
truckLight-duty vehicle Light-duty vehicle Compact five-seater
European sedanSaloon car
Vehicleenergy-usemodel
ADVISOR simulation No formal model No formal model ADVISOR simulation No formal model
Vehiclecost
Retail price and OEMcost estimates fromliterature review andindustry experts:$3,000–$5,300incremental retailprice of future FCEVrelative to futureICEV
Drive train cost estimatefrom HyTrans model[64] assuming aconstant glider costand that DOEtechnical targets aremet for fuel cellsystem
ORNL learning curvemodel for estimatesof FCEV cost andinvestment costs
Vehicle retail priceincrement expectedbeyond 2010 at 50Kvehicles per year;maintenance costs notconsidered
Power train costestimates formreports by theInternationalEnergy Agency
Fuel cost Estimated cost of rawmaterials plus cost offuel production pluscost of fueldistribution, in theyear 2020, withaccounting foruncertainty
Estimates of full costof dispensed H2
from DTI’s HyPromodel [65]($2.5–$3.25/kg-H2)
Estimates of dispensedH2 costs from UCDavis hydrogen-supply cost modelSSCHISM [66]
Estimated cost of rawmaterials plus cost offuel production pluscost of fueldistribution andrefueling
Optimistic andpessimisticassumptionsregarding fuelprice, based onliterature review
Externalcosts
Not included Not included Not included Not included Not included
(Continued)

Table 2.11 (continued)
Study group Princeton [67] Lee et al. [68] H2Gen [16,17] UC Davis [53]
Region U.S. (Southern California) Korea U.S. U.S.Timeframe Not specified 2007, 2015 2005–2100 2010–2025Vehicle type Mid-sized automobile (four
to five passengers)Sport utility vehicle Light-duty vehicle Mid-sized automobile
Vehicleenergy-use model
No formal model No formal model No formal model Advanced Vehicle Cost andEnergy-Use Model(AVCEM) [58]
Vehicle cost Vehicle first cost estimates(retail costs of drivetrainand body) based onengineering and costmodels from severalsources)
Vehicle price estimated fromthe data given by HyundaiMotor Company.
Based on FCEV costestimates by Kromer andHeywood [8]
Based on AVCEM [58] withextensive supplementalanalysis of fuel-cell costs,using learning-curvemodel
Fuel cost Lifetime fuel cost calculatedfrom fuel economy andlevelized fuel price (8%discount rate, 12,000miles/year, 10-yearlifetime)
Fuel utilization costscalculated based on fuelefficiency and drivingdistance, using data fromHyundai motors
Assume NRC estimate,based on DOE H2Aproject (www.hydrogen.energy.gov/h2a_analysis.html), of H2 cost at timeof hydrogen fueling system“break even” ($3.30/kg-H2)
Estimates of dispensed H2
costs from UC Davishydrogen-supply costmodel SSCHISM [66,69];~3.50/kg-H2
Externalcosts
Estimates of damage costsfrom air pollution GHGemissions, and oil supplyinsecurity, based onliterature review andadditional analysis
Damage costs or preventioncosts for regulated airpollutants and GHGemissions
Estimates of external costsof urban air pollution,GHG emissions and oildependence, based onreview and analysis ofliterature
Detailed estimates of damagecosts from air pollution(including upstreampollution), climate change,energy security, and noise

and repair and oil-filling costs are 20% lower for hydrogen FCEVs, but this specific resultis not reported in Sun et al. [53].
4.3.2 Other nonenergy operating costsIn MIT’s On the Road in 2020 study, Weiss et al. [13] Assume that the insurance cost perkilometer for an ICEV is $0.05 and that the cost for an FCEV is equal to $0.025+ $0.025(RPFCEV/RPICEV), where RPFCEV is the estimated retail price of the FCEV and RPICEVis the estimated retail price of the ICEV. This method, which assumes that half of theinsurance cost is proportional to vehicle value, is a simplified version of the moredisaggregated calculation in AVCEM [58], used in Sun et al. [53]. Weiss et al. [13]Estimate that the insurance cost per kilometer of a hydrogen FCEV is 14% higher thanthe insurance cost per kilometer of a gasoline ICEV, whereas AVCEM estimates that theFCEV insurance cost is only 5% higher. The method of Weiss et al. [13] Probablyoverestimates the insurance cost of FCEVs, because the portion of insurance that is relatedto vehicle value probably does not scale linearly with vehicle value, and because insurancerelated to vehicle value typically is not carried for the life of the vehicle.
Weiss et al. [13] Assume that license, registration, and “excise tax” costs per kilometerscale with vehicle value and are 25% higher for FCEVs than for gasoline ICEVs. Bycontrast, AVCEM assumes that registration fees are based on weight and hence are nothigher for FCEVs, and that vehicle emission-inspection fees are lower.
4.4 Energy-use costs4.4.1 Energy use of FCEVsFCEVs generally will have two to three times the fuel economy (in miles per kilojoule oftravel) of comparable gasoline ICEVs, because electric drivetrains are extremely efficient(over 80% on a work-out/energy-in basis), and fuel cells themselves are up to 50%efficient. Sun et al. [53] Use the detailed energy-use model built into AVCEM [58] toestimate that a mid-sized hydrogen FCEV gets 57 miles per gasoline-energy-equivalentgallon versus 20.1mpg for the comparable gasoline ICEV. AVCEM performs a second-by-second simulation of all of the forces acting on a vehicle over a specified drive cycle.This energy-use simulation is used to accurately determine the amount of energyrequired to move a vehicle of particular characteristics over a specified drive cycle,with the ultimate objective of calculating the energy cost per mile and the size of theengine, battery, fuel-cell system, fuel-storage system, and electric drivetrain necessary tosatisfy user-specified range and performance requirements.
The cost of these components is directly related to their size; hence, the importanceof an accurate energy-use and performance analysis within a lifetime cost analysis. Theenergy-use simulation in AVCEM is the standard textbook application of the physics ofwork, with a variety of empirical approximations, to the movement of motor vehicles.For more details on this type of modeling, see also Haraldsson [59].
Lifetime Cost of Battery, Fuel-Cell, and Plug-in Hybrid Electric Vehicles 53
As indicated in Table 2.11, most analyses of the lifetime cost of hydrogen FCEVshave not used a formal model of vehicle energy use. In studies that do not simulateenergy consumption in detail, energy use either is assumed or else is estimated on thebasis of assumptions regarding absolute or relative drivetrain efficiency. However, two ofthe studies in Table 2.11—the MIT studies and the EUCAR study—have used theADVISOR model to simulate FCEV energy use. Like AVCEM, ADVISOR simulatesvehicle energy use second-by-second over specified drive cycles. ADVISOR is a“backward facing” model, which means that every second, the required torque androtational speed are calculated at the wheel and then traced backward to the engine. Thealgorithms in ADVISOR are similar to but in some cases more detailed than those inAVCEM.
Using ADVISOR, Kromer and Heywood [8] estimate that an FCEV has 2.3 timesgreater gasoline-energy-equivalent fuel economy than a year 2030 gasoline ICEV. Bycomparison, in the Sun et al. [53] Work using AVCEM, described above, the FCEV isestimated to have 2.8 times greater gasoline-energy-equivalent fuel economy.
4.4.2 Cost of fuelA number of studies have made or used detailed estimates of the cost of hydrogen fuel(Table 2.11). Much of this work uses cost information from the U.S. DOE’s HydrogenAnalysis (H2A) project. The H2A project brought together a range of hydrogen expertsto thoroughly review and analyze data pertaining to the cost of producing, delivering,and dispensing hydrogen. Estimates from H2A are used directly or indirectly inthe NRC, ORNL (Oak Ridge National Laboratory), H2Gen, and UC Davis studies(Table 2.11).
Sun et al. [53] Estimate hydrogen fuel cost with the UC Davis Steady State CityHydrogen Infrastructure SystemModel (SSCHISM) [66, 69]. SSCHISM combines census,geographic, and energy price data for different cities with hydrogen infrastructure models toestimate hydrogen costs, efficiency and emissions as a function of the hydrogen pathway,and themarket penetration of hydrogen vehicles. The cost estimates in SSCHISM are basedon DOE’s H2A program and other sources. The SSCHISM model estimates that the fullcost of compressed hydrogen (from natural gas or coal) delivered to motorists is in the rangeof $3/kg to $4/kg, or about $21/GJ to $28/GJ, excluding taxes. As shown in Table 2.11, inSun et al., [53] the delivered cost, in the year 2025, is about $3.50/kg.
The ORNL [61] analysis of FCV market penetration used the HyPro model devel-oped by Directed Technologies, Inc. [65]. HyPro estimates the $/kg cost of hydrogen atthe pump as the sum of production, terminal, delivery, dispensing, and other costs [65].Like SSCHISM, HyPro uses estimates and data developed in the DOE’s H2A project.HyPro estimates that the full cost of compressed hydrogen delivered to the motorist isin the range of $2.50/kg to $3.50/kg, depending on the feedstock cost and otherfactors [65].
54 Mark A. Delucchi and Timothy E. Lipman
The most comprehensive analyses thus indicate that the full cost of hydrogendispensed to the motorist is in the range of $2.50/kg to $4.00/kg, with the cost of ahigh-pressure dispensing station being around $0.50/kg to $1.00/kg of this. The range$2.50/kg to $4.00/kg corresponds to a pretax gasoline cost of about $2.30 to $3.70, on agasoline-energy-equivalent basis. This is slightly above current gasoline pretax costs inthe United States (on the order of $2.50/gallon), but when the fuel price (in $/gallon-gasoline-energy-equivalent) is divided by the fuel economy, which as discussed inSection 4.4.1 is 2–3 times higher for FCEVs, the resultant fuel cost per mile of anFCEV is roughly half that of a gasoline ICEV.
4.5 External costs of FCEVsOgden et al. [67], Thomas [16], and Sun et al. [53] Estimate the external costs of FCVs aspart of an analysis of the social lifetime cost of FCEVs (Table 2.11). Ogden et al. [67]Estimated air pollution, climate change, and energy-security costs. Air pollution andclimate-change costs, in $/km, were estimated by multiplying emissions in g/km bydamages in $/g. GHG emissions were taken from the GREET model [70], and unitdamage costs in $/g were calculated by adjusting estimates of damages in Europe [71] toU.S. population density. An oil-supply insecurity cost was estimated based on U.S.military expenditures for the Persian Gulf and the fraction of Persian Gulf exports to theUnited States.
Thomas [16] estimated the external costs of urban air pollution, GHG emissions, andoil dependence for HEVs, PHEVs, BEVs, and hydrogen FCEVs. The GREET model[70] was used to calculate emissions of air pollutants and GHGs and consumption of oil.Unit health damage costs from air pollution were derived from the average of severalestimates of costs in the United States and Europe. The GHG damage cost was assumedto be $25 per metric ton of CO2 in 2010, increasing linearly to $50/ton by 2100. Asocietal cost of $60/barrel was assumed for “oil dependence,” including the “militarycosts of securing petroleum” and the “economic costs of oil dependence.” With theseassumptions, Thomas [16] estimated the total external cost (air pollution, plus GHGs,plus oil dependence) for a light-duty vehicle fleet using different fuels and power trainsin the United States In the year 2100. The study found costs of about $515 billion/yearfor a fleet of gasoline ICEVs; about $225 billion/year for gasoline PHEVs; and about $30billion/year for BEVs and hydrogen FCEVs. Thus, Thomas [16] estimates that BEVs andhydrogen FCEVs reduce external costs by over 90%.
Sun et al. [53] Provide the most comprehensive estimates of the external costs ofhydrogen FCEVs. They use the AVCEM model [58] and additional analysis (includedreferences [72–75]) to estimate the external costs associated with oil use, air pollution,climate change, and noise. Oil-use costs comprise the cost of the Strategic PetroleumReserve, macroeconomic costs from oil price shocks, wealth transfers from U.S. con-sumers to foreign oil producers (a cost only in the U.S. national accounting), the military
Lifetime Cost of Battery, Fuel-Cell, and Plug-in Hybrid Electric Vehicles 55

costs of oil use, and the cost of water pollution due to oil use. Air pollution costscomprise health effects (such as premature mortality), reduced visibility, crop losses, anddamages to forests and materials. The external costs of air pollution include the impactsof emissions from the “upstream” life cycle of fuels as well as emissions from vehiclethemselves, and the external costs of climate change include the impacts of emissionsfrom the vehicle life cycle as well as from the full life cycle of fuels. The upstream lifecycle of fuels includes energy feedstock production, transportation, and storage, and fuelproduction, transportation, storage, and distribution. The vehicle cycle includes vehicleassembly and the life cycle of materials used in vehicles.
Sun et al. [53] Estimate that the present value of the total lifetime external cost rangesfrom about $200 to almost $5,000 for hydrogen FCEVs and from about $800 to$11,500 for gasoline ICEVs. By comparison, the present value of the total lifetimeconsumer cost is about $62,000 for hydrogen FCEVs, and $58,000 for gasoline ICEVs.
4.6 Discussion of FCEV cost estimatesGenerally, in the studies of Table 2.11, the higher initial cost of hydrogen FCEVscompared with gasoline ICEVs, due mainly to the high cost of the fuel cell and thehydrogen storage system (Sections 4.4.2 and 4.4.3), is not offset by lower fuel costs(Subsection 4.4.2), and as a result the private lifetime cost per kilometer of hydro-gen FCEVs is estimated to be higher than that of gasoline ICEVs. However,because hydrogen FCEVs have lower external costs of air pollution, climate change,and oil dependency (Section 4.5), and because the social lifetime cost often isestimated as the private lifetime cost plus external costs, it is possible that the sociallifetime cost of hydrogen FCEVs is comparable to or even less than the sociallifetime cost of gasoline ICEVs. This is the general finding of Ogden et al. [67](Table 2.11).
There is, however, one last issue to consider, mentioned in passing in Section 1. Asdiscussed in Sun et al. [53], the social lifetime cost is equal to the private lifetime cost,plus external costs (discussed immediately above), less any noncost transfers. Examples ofnoncost transfers include fuel taxes, which are a transfer from consumers to the govern-ment, and producer surplus, which is producer revenue in excess of cost and is a noncosttransfer from consumers to producers. Producer surplus in the oil industry can be verylarge, because many producers—especially those in the Middle East—have total long-run production costs well below the market price of oil. The result is that the social costof gasoline—equal to the market price less the producer surplus per unit—can be muchless than the private cost of gasoline, which is based on the market price. This means that,by this factor alone, the social cost of gasoline is less than the private cost of gasoline. Inthe case of gasoline ICEVs, this reduction of cost (over $1,000, in present value terms)due to accounting for producer surplus, can be almost as large as the increase in cost dueto accounting for external costs, especially when external costs are at the low end of an
56 Mark A. Delucchi and Timothy E. Lipman

estimated range. This means that in some cases—when external costs are relativelylow— a social-cost comparison of gasoline with, say hydrogen FCEVs does not giveappreciably different results than does a private-cost comparison [53].
5. DISCUSSION
Compared with conventional gasoline ICEVs, advanced EVs—BEVs, PHEVs,and FCEVs—have higher initial costs, lower fuel costs, lower external costs, possiblyhigher insurance costs, and possibly lower maintenance and repair costs. It thus is notimmediately obvious how the full social lifetime cost of advanced EVs compares withthe full social lifetime cost of gasoline ICEVs.
The formal estimation of the full social lifetime cost depends on a number ofuncertain analytical details, including the following:• the size of key components for EVs (batteries, fuel cells, hydrogen pressure vessels,
electric motors), which depends on the desired performance and driving range andthe energy efficiency of the vehicle;
• the cost of key materials for EV components, including, for example, lithium forbatteries, platinum and membranes for fuel cells, and carbon fiber for pressure vessels;
• the lifetime of key components (e.g., cycles for batteries and pressure vessels, hours ofoperation for fuel cells);
• how manufacturing costs change with increasing production due to technologicallearning and economies of scale;
• the energy use of the EV, which depends on the technology and design of the powertrain, the drive cycle, the weight of the EV, the desired performance, and otherfactors;
• the cost of energy for the EV, which depends on feedstock costs, fuel productioncosts, fuel distribution costs, and fuel dispensing/delivery costs; fuel dispensing ordelivery costs, in turn, depend on the type of fuel and the desired fuel deliverymethod (e.g., compressed vs. liquefied hydrogen; slow overnight battery charging vs.fast commercial battery charging);
• the relationship between insurance costs and vehicle value;• the maintenance and repair requirements of advanced EV components and
drivetrains;• the magnitude of the changes in oil use and emissions of air pollutants and GHGs,
and the dollar value of these changes, which in turn depend on assumptions andmethods used to address a range of difficult-to-model problems, such as the costs ofcatastrophic climate change or the macroeconomic costs of oil-supply disruptions;and
• the treatment of noncost transfers, such as producer surplus and taxes and fees.
Lifetime Cost of Battery, Fuel-Cell, and Plug-in Hybrid Electric Vehicles 57

The analyses reviewed here suggest that with reasonably anticipatable technologicalprogress, the social lifetime cost of advanced EVs can be close to the social lifetimecost of gasoline EVs. More work is needed in the areas listed above for more definitiveconclusions, particularly as new advanced EV designs and concepts continue to emerge.
ACKNOWLEDGMENTSWe thank Andrew Lentz for extensive research assistance and preparation of the material on the cost ofPHEVs. We also thank the UC Davis STEPS program, the UC Davis PHEV Research Center, and theNational Science Foundation’s Material Use: Science Engineering, and Society (MUSES) program forsupport for research upon which this chapter is partly based.
REFERENCES1. M.A. Delucchi, D.M. McCubbin, External Cost of Transport in the U.S.A., A. de Palma, E. Quinet
and R. Vickerman (Eds.), Handbook in Transport Economics, Edward Elgar Publishing, 2010, in press(Chapter 9), www.its.ucdavis.edu/publications/2010/UCD-ITS-RP-10-10.pdf.
2. M.A. Delucchi, T.E. Lipman, Transport. Res. D 6 (2001) 371.3. T.E. Lipman, A Review of Electric Vehicle Cost Studies: Assumptions, Methodologies, and Results,
Report No. UCD-ITS-99-8, Institute of Transportation Studies, University of California, Davis, 1999.4. T.E. Lipman, The Cost of Manufacturing Electric Vehicle Batteries, Report No. UCD-ITS-99-5,
Institute of Transportation Studies, University of California, Davis, 1999.5. T.E. Lipman, The Cost of Manufacturing Electric Vehicle Drivetrains, Report No. UCD-ITS-99-7,
Institute of Transportation Studies, University of California, Davis, 1999.6. J. Murphy, A high-tech twist on the filling station; in Japan, a California start-up unveils system for
quickly swapping batteries in electric cars, The Wall Street Journal, May 9, 2009.7. A. Lovins, D.R. Cramer, Int. J. Vehicle Des. 35 (2004) 50.8. M. Kromer, J. Heywood Electric Power Trains: Opportunities and Challenges in the US Light-Duty
Vehicle Fleet, Sloan Automotive Laboratory, Massachusetts Institute of Technology, Publication No.LFEE 2007-03 RP, May 2007.
9. S. Eaves, J. Eaves, J. Power Sources 130 (2004) 208.10. G.J. Offer, D. Howey, M. Contestabile, R. Clague, N.P. Brandon, Energy Policy 38 (2010) 24.11. T.E. Lipman, Traffic Technol. Int., February/March (2009) 44–50.12. General Motors Corp., General Motors’ Electric Vehicles: Emergency Response Information, 1998.13. M.A. Weiss, J.B. Heywood, E.M. Drake, A. Schafer, F.F. AuYeun, On the Road in 2020 — A
Life-Cycle Analysis of New Automobile Technologies, Energy Laboratory Report MIT EL00-003,Massachusetts Institute of Technology, October 2000.
14. Alternative Fuels Data Center, Model Year 2002: Alternative Fuel Vehicles, National RenewableEnergy Laboratory, 2001.
15. J. Lidicker, T.E. Lipman, S.A. Shaheen, Economic Assessment of Electric-Drive Vehicle Operation inCalifornia and the United States, Transportation Research Board Meeting, Paper #10-3667, 2010.
16. C.E. Thomas, Int. J. Hydrogen Energy 34 (2009) 9279.17. C.E. Thomas, Int. J. Hydrogen Energy 34 (2009) 6005.18. A.D. Vyas, R. Cuenca, L. Gaines, An Assessment of Electric Vehicle Life Cycle Costs to Consumers,
SAE Technical Paper Series #982182, Society of Automotive Engineers, Warrendale, PA, 1998.19. New York State Energy Research and Development Authority, Zero-Emission Vehicle Technology
Assessment (Report No. 95-11), McLean, Virginia, Prepared by Booz-Allen and Hamilton, 1995.20. International Energy Agency/Organization for Economic Cooperation and Development (IEA/
OECD), Transport Energy and CO2: Moving Toward Sustainability, 2009.21. L. Sanna, EPRI J. (2005) 8–17.22. J. Douglas, EPRI J. (2008) 6–15.
58 Mark A. Delucchi and Timothy E. Lipman
23. M.J. Scott, M. Kintner-Meyer, D.B. Elliott, W.M.Warwick, J. EUEC, 1 (2007), http://energytech.pnl.gov/publications/pdf/PHEV_Economic_Analysis_Part2_Final.pdf.
24. C. Silva, M. Ross, T. Farias, Energy Convers. Manag. 50 (2009) 1735.25. R. Graham, S. Unnasch, E. Kassoy, R. Counts, C. Powars, L. Browning, D. Taylor, J. Smith, et al.,
Comparing the Benefits and Impacts of Hybrid Electric Vehicle Options, Electric Power ResearchInstitute (EPRI), 2001.
26. A. Simpson, 22nd International Battery, Hybrid and Fuel Cell Electric Vehicle Symposium andExhibition, Yokohama, Japan, 2006.
27. M. Anderman, F.R. Kalhammer, D. MacArthur, Advanced Batteries for Electric Vehicles: An Assessmentof Performance, Cost, and Availability, California Air Resources Board, Sacramento, CA, 2000.
28. M. Duvall, L. Browning, F. Kalhammer, W. Warf, D. Taylor, M. Wehrey, N. Pinsky, AdvancedBatteries for Electric-Drive Vehicles: A Technology and Cost-Effectiveness Assessment for BatteryElectric Vehicles, Power Assist Hybrid Electric Vehicles, and Plug-in Hybrid Electric Vehicles, ElectricPower Research Institute (EPRI), 2004.
29. L. Gaines, R. Cuenca, Costs of Lithium-Ion Batteries for Vehicles, Center for Transportation Research,Energy Systems Division, Argonne National Laboratory, Argonne, IL, 2000.
30. A. Vyas, D. Santini, HEV Cost Analysis for the EPRI Working Group, Argonne National Laboratory,Argonne, IL, 2000.
31. R.M. Cuenca, L.L. Gaines, A. Vyas, Evaluation of Electric Vehicle Production and Operating Costs,Argonne National Laboratory, Argonne, IL, 1999.
32. National Research Council (NRC), Review of the Research Program of the FreedomCar and FuelPartnership, Washington, D.C., 0-309-09730-4, 2005.
33. Energy and Environmental Analysis Inc. (EEA), Analysis and Forecast of the Performance and Cost ofConventional and Electric-Hybrid Vehicles, Contract No. 500-00-002 (WA 8), 2005.
34. T.E. Lipman, M.A. Delucchi, Transport. Res. D 11 (2006) 115.35. T.E. Lipman, M.A. Delucchi, Retail and Lifecycle Cost Analysis of Hybrid Electric Vehicle Designs,
UCD-ITS-RR-03-01, Institute of Transportation Studies, University of California, Davis, April 2003.36. A.F. Burke, Proc. IEEE 95 (2007) 806.37. U.S. Department of Energy, Hybrid Cost Calculator, Alternative Fuels & Advanced Vehicle Data
Center, National Renewable Energy Laboratory, 2008.38. US Bureau of Labor Statistics, Consumer Price Index, Government online database, 2008.39. J. Gonder, T. Markel, SAE World Congress & Exhibition, Detroit, MI, 2007.40. J. Gonder, T. Markel, A. Simpson, M. Thornton, Transport. Res. Record 2017 (2007) 26.41. A. Burke, Electric and Hybrid Vehicle Design and Performance, in: M. Kutz (Ed.), Environmentally
Conscious Transportation, John Wiley & Sons, Inc., Hoboken, NJ, 2008, pp. 129–190.42. K. Parks, P. Denholm, T. Markel, Costs and Emissions Associated with Plug-in Hybrid Electric Vehicle
Charging in the Xcel Energy Colorado Service Territory, National Renewable Energy Laboratory,NREL/TP-640-41410, 2007.
43. R.J. Sexton, N.B. Johnson, A. Konakayama, J. Consum. Res. 14 (1987) 55.44. F.A. Wolak, Residential Customer Response to Real-Time Pricing: The Anaheim Critical Peak
Pricing Experiment, Center for the Study of Energy Markets, UC Berkeley, 2007.45. K. Herter, S. Wayland, Energy 25 (2009) 1561.46. S. Lutzenhiser, J. Peters, M. Moezzi, J. Woods, Beyond the Price Effect in Time-of-Use Programs:
Results from a Municipal Utility Pilot, 2007–2008, International Energy Program Evaluation Con-ference, Portland, OR, 2009.
47. F.D. Lomax, B.D. James, G.N. Baum, C.E. Thomas, Detailed Manufacturing Cost Estimates forPolymer Electrolyte Membrane (PEM) Fuel Cells for Light Duty Vehicles, Contract DE-AC02-94CE50389, Directed Technologies, Inc., Arlington, VA, August 1998.
48. B.D. James, C.E. Thomas, J. Ho, F.D. Lomax, Jr., DFMA Cost Estimates of Fuel-Cell/Reformer Systemsat Low/Medium/High Production Rates, part II.F. of Fuel Cells for Transportation, FY 2001 ProgressReport, U.S. Department of Energy Office of Transportation Technologies, December 2001, pp 44–49.
49. B.D. James, J.A. Kalinoski, Mass Production Cost Estimation for Direct H2 PEM Fuel Cell System forAutomotive Applications, DOE Hydrogen Program 2007 Annual Merit Review Proceedings, ProjectID:FC28, Arlington, VA, May 15–18, 2007.
Lifetime Cost of Battery, Fuel-Cell, and Plug-in Hybrid Electric Vehicles 59

50. D. Arthur. Little (ADL), Cost Analysis of Fuel Cell System for Transportation, Baseline System CostEstimate, Task 1 and 2 Final Report to the U.S. Department of Energy, Report 49739, Cambridge,MA, March 2000.
51. E.J. Carlson, J.H.J. Thijssen, Cost Analyses of Fuel Cell Stacks/Systems, part IV.A.4. of Hydrogen, FuelCells and Infrastructure Technologies, FY 2002 Progress Report, U. S. Department of Energy, Office ofHydrogen, Fuel Cells, and Infrastructure Technologies,Washington, D.C., November 2002, pp. 279–282.
52. S. Lasher, J. Sinha, Y. Yang, S. Sriramulu, Direct Hydrogen PEMFC Manufacturing Cost Estimationfor Automotive Applications, DOE Hydrogen Program 2007 Annual Merit Review Proceedings,Reference D0362, Arlington, VA, May 15–18, 2007.
53. Y. Sun, J.M. Ogden, M.A. Delucchi, Societal Lifecycle Buy-Down Cost of Hydrogen Fuel-CellVehicles, Transport. Res. Record (2010, in press).
54. F. Mitlitsky, A.H. Weisberg, B. Myers, Vehicular Hydrogen Storage Using Lightweight Tanks,Proceedings of 2000 U.S. DOE Hydrogen Program Review, NREL/CP-570-28890, NationalRenewable Energy Laboratory, Golden, CO, 2000.
55. TIAX LLC, Cost Analysis of Fuel Cell Systems for Transportation — Compressed Hydrogen and PEMFuel Cell System, Discussion Fuel Cell Tech Team FreedomCar, Detroit, MI, October 20, 2004.
56. A.R. Abele, Quantum Hydrogen Storage Systems, California ARB ZEV Technology Symposium,September 25–27, 2006.
57. S. Lasher, K. McKenney, Y. Yang, B. Rancatore, S. Unnasch, M. Hooks (TIAX LLC) Analyses ofHydrogen Storage Materials and on-Board Systems, DOE Merit Review, May 17, 2007.
58. M.A. Delucchi, Advanced-Vehicle Cost and Energy Use Model: Overview of AVCEM, UCD-ITS-RR-05-17(1), Institute of Transportation Studies, University of California, Davis, October 2005.
59. K. Haraldsson, On Direct Hydrogen Fuel Cell Vehicles — Modeling and Demonstration, DoctoralThesis, KTH—Royal Institute of Technology, Department of Chemical Engineering and TechnologyEnergy Processes, Stockholm, Sweden, 2005.
60. M.A. Weiss, J.B. Heywood, A. Schafer, V.K. Natarajan, Comparative Assessment of Fuel Cell Cars,Massachusetts Institute of Technology, Laboratory for Energy and the Environment, MIT LFEE 2003-001 RP, February 2003.
61. D.L. Greene, P.N. Leiby, B. James, J. Perez, M. Melendez, A. Milbrandt, et al., Analysis of theTransition to Hydrogen Fuel Cell Vehicles & the Potential Hydrogen Energy Infrastructure Require-ments, ORNL/TM-2008/30, Oak Ridge National Laboratory, Oak Ridge, TN, March 2008.
62. National Research Council, Transitions to Alternative Transportation Technologies — A Focus onHydrogen, The National Academies Press, Washington, D.C., 2008.
63. C. European, Well-to-Wheels Analysis of Future Automotive Fuels and Powertrains in the EuropeanContext, EUCAR/JRC/CONCAWE, Well-to-Wheels Report Version 2c, March 2007.
64. D.L. Greene, P.N. Leiby, Integrated Analysis of Market Transformation Scenarios with HyTrans, OakRidge National Laboratory, Oak Ridge, TN, ORNL/TM-2007/094, June 2007.
65. B. James, HyPro: Modeling the H2 Transition, Prepared for the DOE Hydrogen Program, DirectedTechnologies Inc., May 9, 2007.
66. C. Yang, J. Ogden, Int. J. Hydrogen Energy 32 (2007) 268.67. J.M. Ogden, R.H. William, E.D. Larson, Energy Policy 32 (2004) 7.68. J.-Y. Lee, M. Yoo, K. Cha, T.W. Lim, T. Hur, Int. J. Hydrogen Energy 34 (2009) 4243.69. C. Yang, J.M. Ogden, Steady State Model of Hydrogen Infrastructure for US Urban Areas, Institute of
Transportation Studies, University of California, Davis, 2008.70. M.Q.Wang, GREET 1.5—Transportation Fuel-CycleModel: Volume 1:Methodology, Development,
Use, and Results, Report ANL/ESD-39, Argonne National Laboratory, Argonne, IL, August 1999.71. A. Rabl, J.V. Spadaro, Annu. Rev. Energy Environ. 25 (2000) 601.72. M.A. Delucchi, J. Transp. Econ. Policy 34 (2000) 135.73. M.A. Delucchi, J. Murphy, Energy Policy 36 (2008) 2253.74. P.N. Leiby, Estimating the Energy Security Benefits of Reduced U.S. Oil Imports, ORNL/TM-2007/
028, Oak Ridge National Laboratory, Oak Ridge, TN, February 28, 2007.75. M.A. Delucchi, D.R. McCubbin, The Contribution of Motor Vehicles and Other Sources to Ambient
Air Pollution, UCD-ITS-RR-96-3 (16) rev. 2, Institute of Transportation Studies, University ofCalifornia, Davis, 2004.
60 Mark A. Delucchi and Timothy E. Lipman