Lifestyle QFD - Incorporating Emotional Appeal in Product
12
The 17th Symposium on Quality Function Deployment 2005 - Portland - 1 - Lifestyle QFD: Incorporating Emotional Appeal in Product Development Glenn H. Mazur, QFD Institute, Japan Business Consultants, Ltd. Abstract Outsourcing and the search for the lowest cost producer has lead to increasing commodi- tization of products. Companies in developed nations are searching for the next "edge" that will help them produce highly profitable, differentiated products and services. This paper will explore an emerging area in applying QFD to lifestyle, image, and psy- chological needs. The basics approach, easily available software tools, and case studies will be presented, including a review of Boeing's application of these methods to their new B787 Dreamliner commercial aircraft, which is priced higher than competitor Airbus and yet is "set to jet past " them, according to a recent article in the Wall Street Journal. 1 Key Words QFD, Kansei, Lifestyle, Product Development, Aesthetic Introduction Quality Function Deployment (QFD) has roots in Function Analysis, a technique devel- oped by Lawrence D. Miles along with Value Engineering as an approach to identifying and costing primary and secondary functions of a product. 2 Dr. Miles describes two broad types of functions – use functions and esteem functions; the former causing the product to perform, while the latter causing the product to sell. In QFD, we define Customer Needs as: • Solve a customer problem • Enable a customer to grasp an opportunity • Customer looks good to someone whose opinion he/she values • Customer feels good about him/herself. The first two definitions describe use and the last two describe esteem. QFD practitioners have long used QFD to understand and solve for improvements of use functions, and with Lifestyle Deployment, esteem functions can also be addressed. Esteem, Style, Aesthetics and Engineering Merriam-Webster OnLine Dictionary defines esteem as “the regard in which one is held.” 3 To design products that will help customers achieve this is the goal of Lifestyle Deployment. In most cases, this will refer to a product’s shape, color, decorative design, or some other aesthetic or artistic design element. In products such as home furnishings, fashion clothing, automobiles, and consumer electronics, this might be called style.
Transcript of Lifestyle QFD - Incorporating Emotional Appeal in Product
The 17th Symposium on Quality Function Deployment 2005 - Portland
- 1 -
Lifestyle QFD: Incorporating Emotional Appeal in Product Development
Glenn H. Mazur, QFD Institute, Japan Business Consultants, Ltd.
Abstract Outsourcing and the search for the lowest cost producer has lead to increasing commodi-tization of products. Companies in developed nations are searching for the next "edge" that will help them produce highly profitable, differentiated products and services. This paper will explore an emerging area in applying QFD to lifestyle, image, and psy-chological needs. The basics approach, easily available software tools, and case studies will be presented, including a review of Boeing's application of these methods to their new B787 Dreamliner commercial aircraft, which is priced higher than competitor Airbus and yet is "set to jet past " them, according to a recent article in the Wall Street Journal.1
Key Words QFD, Kansei, Lifestyle, Product Development, Aesthetic
Introduction Quality Function Deployment (QFD) has roots in Function Analysis, a technique devel-oped by Lawrence D. Miles along with Value Engineering as an approach to identifying and costing primary and secondary functions of a product.2 Dr. Miles describes two broad types of functions – use functions and esteem functions; the former causing the product to perform, while the latter causing the product to sell. In QFD, we define Customer Needs as:
• Solve a customer problem • Enable a customer to grasp an opportunity • Customer looks good to someone whose opinion he/she values • Customer feels good about him/herself.
The first two definitions describe use and the last two describe esteem. QFD practitioners have long used QFD to understand and solve for improvements of use functions, and with Lifestyle Deployment, esteem functions can also be addressed.
Esteem, Style, Aesthetics and Engineering Merriam-Webster OnLine Dictionary defines esteem as “the regard in which one is held.”3 To design products that will help customers achieve this is the goal of Lifestyle Deployment. In most cases, this will refer to a product’s shape, color, decorative design, or some other aesthetic or artistic design element. In products such as home furnishings, fashion clothing, automobiles, and consumer electronics, this might be called style.

The 17th Symposium on Quality Function Deployment 2005 - Portland
- 2 -
When use functions become commonplace and commoditized, esteem functions carry a greater burden to attract the customer and win their loyalty. Esteem functions have be-come so critical that it has been suggested that “aesthetics have become too important to be left to the aesthetes.”4 Engineers must take this matter seriously. Since aesthetics are the way we communicate through the senses (taste, touch, sight, sound, smell, and cognition), engineers must determine which design elements best ad-dress the esteem, style, or aesthetic image the customer wants, and then optimize those elements’ interactions with the senses. In the US, at least, aesthetics are taught in Indus-trial Design courses usually in the School of Art, not the School of Engineering. Lifestyle Deployment can help bridge both these disciplines and improve time-to-market and product differentiation.5
Origins of Lifestyle Deployment Lifestyle Deployment is an adaptation for QFD of Kansei Engineering developed by Mitsuo Nagamachi and Mazda Motors. The term Kansei Engineering was first used in 1986 by Mr. Kenichi Yamamoto, past chairman of Mazda Motors, in a special lecture given at the University of Michigan. In his speech, Mr. Yamamoto discussed “Cultural Views on Automobiles,” arguing automobiles must contribute to our culture. He used the word Kansei Engineering as an approach to achieve this mission. He promoted making a car which ride and interior feel meet the needs and kansei or self-image of the person rid-ing in it. As a result, a Kansei Research Office was created in the company's Yokohama Research Center and a passenger car, the Persona was developed through a newly pro-posed concept called “interiorism.” The author first met Dr. Nagamachi at his Kansei Laboratory at Hiroshima University in 1993, after earlier translating some of materials into English for GOAL/QPC, a Massachusetts based quality organization. The QFD Insti-tute later invited Dr. Nagamachi to conduct a full-day Kansei Engineering workshop in 1999 at the Symposium on QFD.6 Based on Kansei Engineering projects with products from aircraft to off-road vehicles to consumer products to fashion design, the author has integrated Kansei Engineering into the QFD process, calling it Lifestyle Deployment. Some of the Kansei Engineering tools have been modified and augmented to make the methodology more accessible to non-Japanese users, in response to difficulties accessing Japanese software used by Naga-machi. Lifestyle Deployment was coined because the role of aesthetics in product development is to help the customer or consumer use the product to send a message to others or to themselves. The product becomes a metaphor for their attitudes, their motivations, their dreams and aspirations. Because this is so very personal, the term Lifestyle seemed apro-pos.
Integrating Lifestyle and Quality Deployment Figure 1 illustrates the process of Lifestyle Deployment and how it integrates with Qual-ity Deployment in a modern QFD process.7 In many ways it parallels the exploration,

The 17th Symposium on Quality Function Deployment 2005 - Portland
- 3 -
prioritization, and solution steps in modern Quality Deployment (a subset of Akao’s Comprehensive QFD).8 There are common inputs to get customer images (steps 1-3) and common outputs to fulfill them through design and manufacturing (steps 8-11). What dif-fer are steps 4-7 in the upper box of Figure 1. This paper will explore these differences using a strictly esteem function item as a case study – a necktie, the one element of a man's attire with no obvious use function. Additional case studies will also be used.
Step 3. Gemba The QFD team should include industrial or fashion design, marketing, brand manager, retail sales, merchandising, and engineering, at a minimum. Market segments to visit will have been decided in step 2 in the process flow chart. A good description of US segments can be found at www.melissadata.com/listservices/PRIZMsegment.doc While at the Gemba (where the targeted customer lives, works, and plays), the QFD team will interview the customers to discuss their lifestyle choices, preferences, aspirations, motivations, and other matters related to how they appear to others and how they think about themselves. These interviews are sometimes called ethnographies. Table 1 shows sample questions. Table 1. Ethnography Interview
What is your biggest opportunity, concern, challenge, difficulty: Who do you relate to? Who is your favorite politician or movie star? What event in the last 6 months has affected you the most? What does your clothing say about you: What clothing article do you care most about and why: How much time do you spend selecting clothes? What brands do you like to buy and why: How long do you usually wear clothes in terms of hours, seasons, years:
Figure 1. Integrating Lifestyle Deployment and Quality Deployment
The 17th Symposium on Quality Function Deployment 2005 - Portland
- 4 -
Questions such as these help us understand the attitudes, motivators, inclinations, and other factors that influence the consumer. For example, despite our best planning, if a popular movie character or television personality wears a particular style or color of tie, or in some combination with a shirt and blazer, that may become a hot product and quickly sell out. One of the problems in the clothing industry is that reorder lead times usually exceed the selling season, making inventory replenishment impossible. Knowing our customers lifestyle preferences may help us spot trends and increase the likelihood of balancing our inventory to minimize stock-outs and over-stocks.
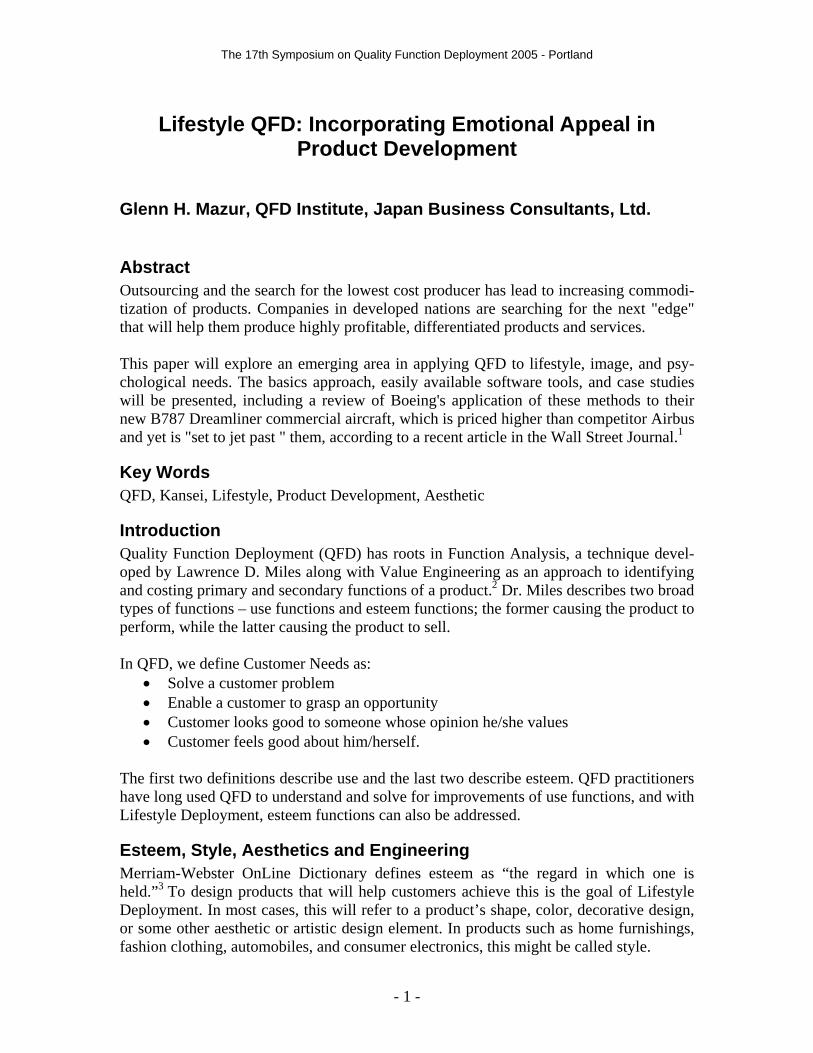
Step 4. Consumer Lifestyle table The responses are then arranged in a Consumer Lifestyle table (CLT), as shown in Table 2. The CLT attempts to parse and make sense of the somewhat random data in from the ethnographies. This will later help in interpreting the data and extracting image words. The basic CLT makes use of the 5W1H data structuring used in several other steps in the QFD process.9 A simple algorithm to remember is:
I am a [who] going to [where] in the [when] because I like to [what activity] because it makes me feel [why]; so I want [how product fulfills], and there-fore I usually buy [which brand].
Table 2. Consumer Lifestyle table
Who Where When What activity Why How product
fulfillsWhich brand
Lifestyle Words
Urban Uptown, Money & Brains
Work at the client's place of business
Year round
I like to lead people and projects.
Many years of experience have lead to prominance in my field. I am respected and expected to teach others.
My clothing should be subtle and distinctive. My ties should exude power without pretension.
Therefore I buy Kenneth Cole.
Leader, Experienced, Prominent, Smart, Respected, Teacher, Power, Subtle, Distintive.
Step 5. Lifestyle Words Affinity Diagram Lifestyle words are then presented to consumers for structuring, which produces an Af-finity diagram. This sorting technique was developed in Japan by Kawakita Jiro, a cul-tural anthropologist, to better understand cultural attitudes of communities he was study-ing. Details of this method have been known since Dr. Akao introduced it to the US in the 1980s, and have been described in many publications.10 The topmost general header can often be used as a meta-metaphor for the product and may be adapted into an adver-tising theme. Note that the process is done by the consumers, not by the QFD team.
Step 6. Lifestyle Words Hierarchy Diagram The Affinity diagram is rotated into a Hierarchy diagram to identify which of the senses are employed to elicit the lifestyle words, and then identify which product features (sys-tems, design elements and quality characteristics, components, and performance levels to be considered as critical to portraying the most valued lifestyle images. Table 3 depicts

The 17th Symposium on Quality Function Deployment 2005 - Portland
- 5 -
an example Nagamachi presented from his work with Mazda on the development of the Miata automobile. Design, marketing, and engineering lead this step. Table 3. Lifestyle Hierarchy diagram for Mazda Miata11
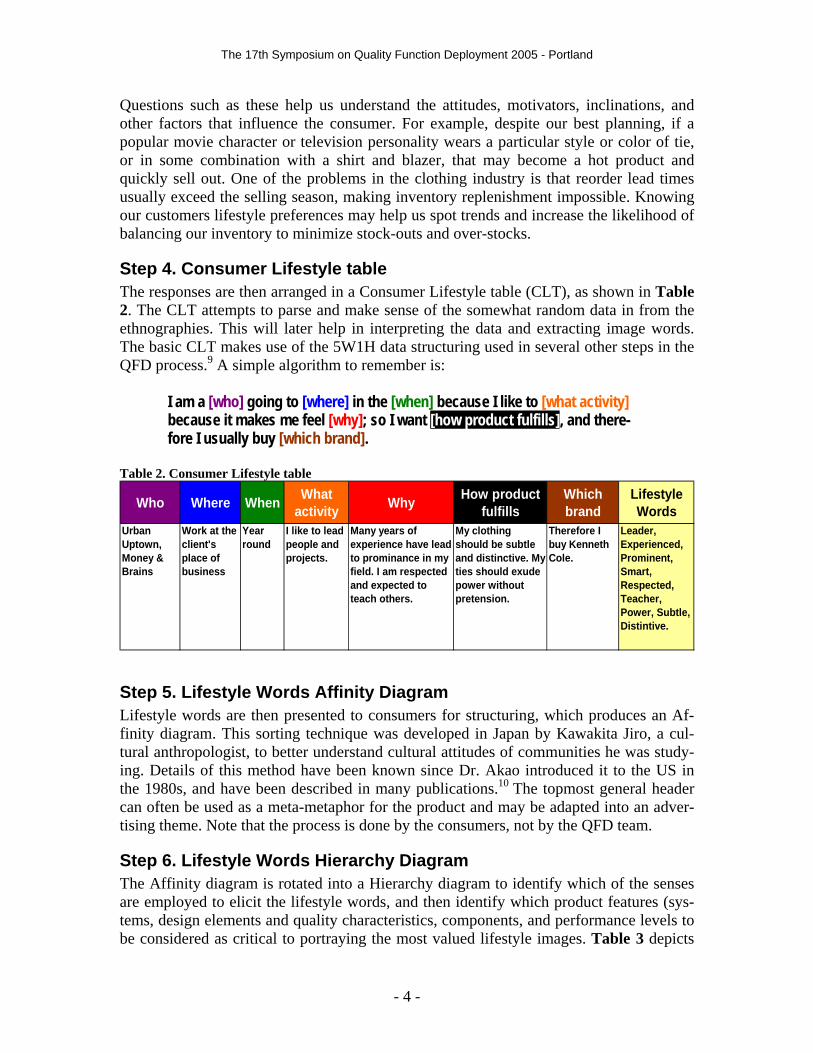
Step 7. Multivariate Analysis to Determine Best Design The Hierarchy diagram is the transition from the qualitative study of lifestyle and image to the quantitative study of how best to achieve it with the new product. Quantification of such “soft” data as lifestyle words is done using methods used psychologists. Quantifica-tion will help us “explain” which of the lifestyle words best represents the market seg-ment we are studying, which design elements best explain the lifestyle words, and which specification or performance level of those design elements optimizes the lifestyle ex-perience. To do this, we use powerful analytic tools common in market research – Multi-variate Analysis. When developing mathematical models of behavior, we must make sure the tools we se-lect are valid for the numbers we are trying to calculate. First, we must understand the importance of using proper scales. S.S. Stevens, director of Harvard University’s PscyoAcoustic Laboratory in the 1940s, participated in a 1930s committee to consider the possibility of “quantitative estimates of sensory events.” One definition of measurement that emerged was that is was the assignment of numerals to objects or events according to rules, and those different rules led to different kinds of scales and measurements. Four scales are commonly identified, as shown in Table 4 with their permissible statistics which are cumulative, meaning that each scale includes the operations of the scales pre-ceding it.12 The four scales are nominal, ordinal, interval, and ratio. Statistics performed on numbers whose scale does not support such statistics can be said to produce illegal or meaningless results. QFD, in its early years before the availability of personal computers, often mis-used ordinal scale numbers by performing on them mathematical operations reserved for
The 17th Symposium on Quality Function Deployment 2005 - Portland
- 6 -
interval or ratio scale numbers. While the Japanese corrected this in the 1980s, most non-Japanese QFD practitioners still make these mistakes in prioritizing customer needs and in the House of Quality. The QFD Institute Belt training courses corrected this in 2000. Table 4. Scales and Permissible Statistics
Basically, we are trying to clarify and explain what relationships exist among a number of variables. There are two major types – target variables (also called dependent variables, y variables, response variables) and explanatory variables (also called independent vari-ables, x variables, regressors). The target variable is usually the outcome of some obser-vation or event, and the explanatory variables attempt to explain the variance among out-comes. When there are three or more variables, we can use Multivariate Analysis to look at these relationships at the same time. Sometimes we may find a direct causal relation-ship between variables and sometimes we may find that two variables do not have a causal relationship but correlate with a third variable, and we need to study its influence in order to explain and predict other similar scenarios. Each of these variables can be either numerical (interval scale or ratio scale) or category (nominal scale or ordinal scale). We sometimes find “near-ordinal” nominal scales and “near-interval” ordinal scales, as well. Table 5 recommends different statistical methods depending on the types of variables. 13 In Lifestyle Deployment, it is more common to find category data, which are data like fun, conservative, red, blue, etc. In other words, there is no mathematical relationship be-tween red and blue (other than wavelength absorption which is usually not the purpose of the study), but rather they represent different classes or groups of color. The late Dr. Chikio Hayashi of Japan developed a series of statistical methods to help quantify cate-gory data, which are known as Quantification Theories (QT) I-IV. QT-I, which is rec-ommended by Nagamachi as a basic approach, is a variation of Multiple Regression that works with categorical (nominal or near-ordinal) explanatory variables. Calculation of
Coefficient of Variation
temperature in °Kelvin
equality of ratios ratio
+,-,x,÷ Mean, Standard. Deviation Correlation
temperature in °F or °C
equality of inter-vals or differ-ences
interval
Median Percentiles
team standings determination of greater or less
ordinal
Number of cases Mode
numbers on foot-ball players
determination of equality
nominal
permissible sta-tistics
example empirical opera-tions
scale

The 17th Symposium on Quality Function Deployment 2005 - Portland
- 7 -
the Multiple Correlation Coefficient and Partial Correlation Coefficients can determine the best explanatory Lifestyle words and correlated design elements. Standard Multiple Regression typically uses numerical continuous explanatory variables and produces less reliable results.
Until very recently, Hayashi’s methods were unavailable in non-Japanese statistical packages, and so the author together with a colleague, Dr. Anders Gustaffson of the Uni-versity of Karlstad in Sweden and an expert in applying Conjoint Analysis to QFD, de-veloped an alternative method that uses Factor Analysis tools accessible in English lan-guage statistical packages such as SPSS, SAS, or Minitab.
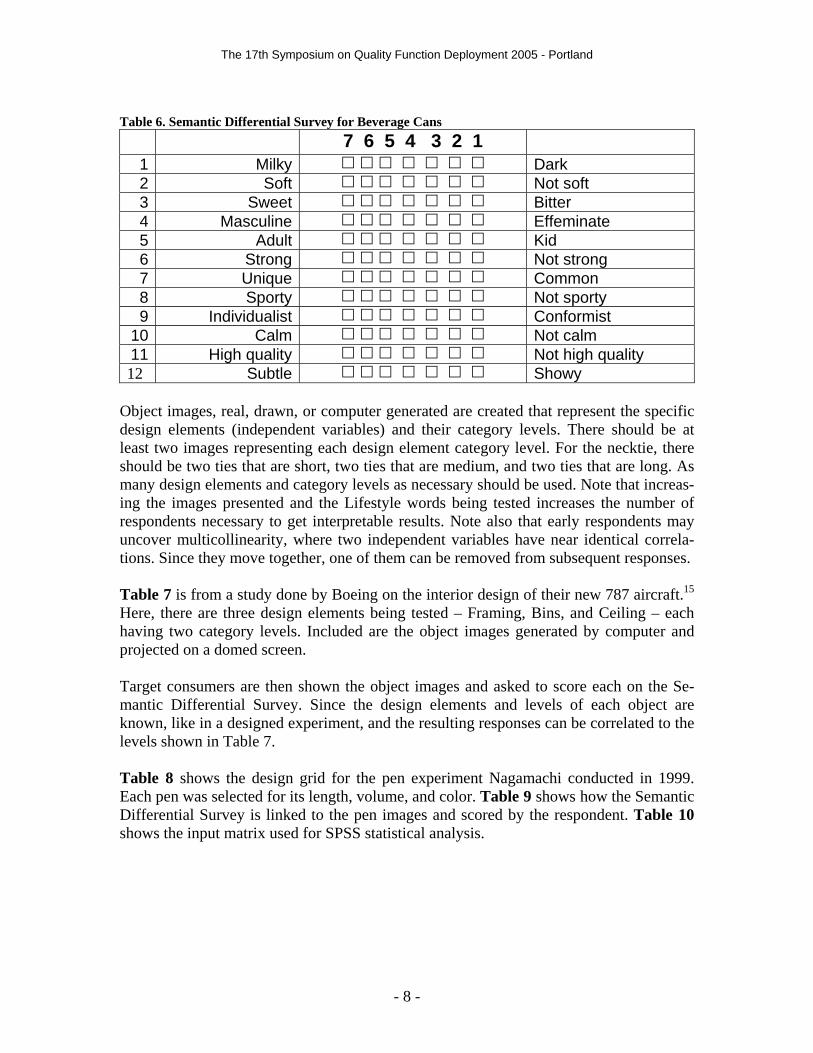
Semantic Differential Method First, we must quantify the target variables, the Lifestyle words. The target variable should be measured on an interval, continuous scale. We will use the Semantic Differen-tial Scale developed by Charles Osgood which is useful in looking at the links between attitude and behavior. Osgood’s method is to plot the differences between individuals' connotations for words and thus map the psychological “distance” between words. Life-style words are presented along with their antonym at either end of a seven-point scale. In practice an ordinal (ranking or rating) scale is usually good enough unless the number of levels is small. The trend these days is to use a “not” antonym to avoid confusion over interpretation of opposite words. Table 6 is an example from a project done on beverage can design.14 Milky vs. Not Milky might be substituted for Milky vs Dark since dark may carry additional connotations with the respondent. The independent variables should be measured on interval scales. Numerical variables such as length are converted into categories, such as short, medium, long. Evaluation ob-jects shown to consumers (discussed below) should try to exhibit equal intervals between these category levels. In other words, the actual length difference between a short tie (for example) and a medium length necktie should be the same as between a medium length and a long tie. Design and Engineering play a lead role in determining these variables.
Quantification Theory III Correspondence Analysis
Category -
Multiple RegressionNumericalNumerical
Quantification Theory I CategoryNumerical
Quantification Theory II CategoryCategory
Principle Component Analysis Factor Analysis
Numerical -
No (data re-duction, the-ory-generation)
Discriminant Analysis NumericalCategory
Yes (to explain cause & ef-fect)
Explanatory Target
Statistical Method Type of Respondent Variable Target Variable?
Table 5. Statistical Methods and Types of Variables
The 17th Symposium on Quality Function Deployment 2005 - Portland
- 8 -
Table 6. Semantic Differential Survey for Beverage Cans
7 6 5 4 3 2 1 1 Milky Dark 2 Soft Not soft 3 Sweet Bitter 4 Masculine Effeminate 5 Adult Kid 6 Strong Not strong 7 Unique Common 8 Sporty Not sporty 9 Individualist Conformist
10 Calm Not calm 11 High quality Not high quality 12 Subtle Showy
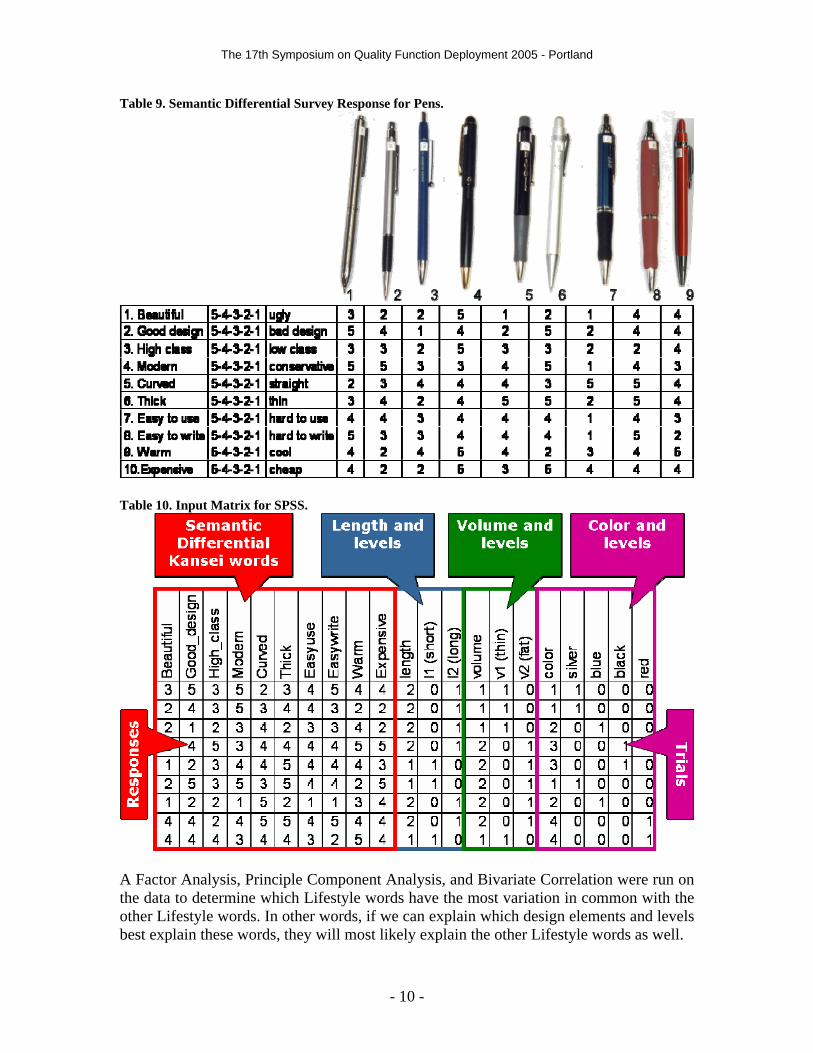
Object images, real, drawn, or computer generated are created that represent the specific design elements (independent variables) and their category levels. There should be at least two images representing each design element category level. For the necktie, there should be two ties that are short, two ties that are medium, and two ties that are long. As many design elements and category levels as necessary should be used. Note that increas-ing the images presented and the Lifestyle words being tested increases the number of respondents necessary to get interpretable results. Note also that early respondents may uncover multicollinearity, where two independent variables have near identical correla-tions. Since they move together, one of them can be removed from subsequent responses. Table 7 is from a study done by Boeing on the interior design of their new 787 aircraft.15 Here, there are three design elements being tested – Framing, Bins, and Ceiling – each having two category levels. Included are the object images generated by computer and projected on a domed screen. Target consumers are then shown the object images and asked to score each on the Se-mantic Differential Survey. Since the design elements and levels of each object are known, like in a designed experiment, and the resulting responses can be correlated to the levels shown in Table 7. Table 8 shows the design grid for the pen experiment Nagamachi conducted in 1999. Each pen was selected for its length, volume, and color. Table 9 shows how the Semantic Differential Survey is linked to the pen images and scored by the respondent. Table 10 shows the input matrix used for SPSS statistical analysis.

The 17th Symposium on Quality Function Deployment 2005 - Portland
- 9 -
Table 7. Example of Design Elements, Levels, and Object Images from Boeing 787. Framing and level Bins and level Ceiling and level Concepts Sketches
1 1 1
767-400 as a practice
1 2 1 Concept 1
1 1 2 Concept 2
2 2 2 Concept 3
2 1 1 Concept 4
2 1 2 Concept 5
Didn’t need to be tested
Table 8. Pen Design Grid.
The 17th Symposium on Quality Function Deployment 2005 - Portland
- 10 -
Table 9. Semantic Differential Survey Response for Pens.
Table 10. Input Matrix for SPSS.
A Factor Analysis, Principle Component Analysis, and Bivariate Correlation were run on the data to determine which Lifestyle words have the most variation in common with the other Lifestyle words. In other words, if we can explain which design elements and levels best explain these words, they will most likely explain the other Lifestyle words as well.

The 17th Symposium on Quality Function Deployment 2005 - Portland
- 11 -
The resulting statistics can then be examined to determine which design elements at which levels are optimal for conveying the Lifestyle image to the consumer, which de-sign elements make no difference, and which design element levels could have a negative impact on the Lifestyle image. A winning combination may be one of the original images or a combination of more than one image. In the pen experiment, the respondent group of 25 middle aged engineers resulted in the short, thin, silver pen being selected. Designers can then fine tune the images consistent with their overall artistic sense, and the results are presented to focus groups for final determination.
Steps 8-11. Integrating Lifestyle Deployment into QFD The selected design elements and levels can now be entered into the Maximum Value table and House of Quality (if needed), and integrated into the final design. The Quality Deployment will cover the use functions while the Lifestyle Deployment has covered the esteem functions.
Conclusion By combining Lifestyle Deployment based on Nagamachi’s Kansei Engineering with Quality Deployment, new product developers can assure superior performance in terms of solving customers’ problems and enabling opportunities with superior use functions, and making customers look good to others and feel good about themselves with superior esteem functions. The goal of highly differentiated products that satisfy customer needs can be achieved.
About the Author Glenn H. Mazur has been active in QFD and Kansei Engineering since their inception in North America, and has worked extensively with the founders of QFD and Kansei Engi-neering on their teaching and consulting visits from Japan. He is a leader in the applica-tion of QFD to service industries and consumer products, conducts advanced QFD re-search, and is the Conference Chair for the annual North American Symposium on Qual-ity Function Deployment and sits on the Scientific Board of the International Symposium on QFD. Glenn is the Executive Director of the QFD Institute and International Council for QFD, Adjunct Lecturer (retired) on TQM at the University of Michigan College of Engineering, President of Japan Business Consultants Ltd., and is a senior member of the American Society for Quality Control (ASQC), and the Japanese Society for Quality Control (JSQC). He has been certified by Dr. Akao as one of only two QFD Red Belts® outside Japan, the highest level of QFD mastery. www.mazur.net
References 1 Lunsford, J. Lynn and Daniel Michaels. 2005. “After Four Years in the Rear, Boeing Is Set to Jet Past Airbus.” The Wall Street Journal. Vol. CCXLV No. 113. June 10, 2005. Page 1. 2 Akiyama Kaneo, 1989. Function Analysis: Systematic Improvement of Quality and Performance. Trans-lated by Andrew P. Dillon. Cambridge, MA Productivity Press. ISBN: 0-915299-81-X 3 http://www.m-w.com/cgi-bin/dictionary 4 Postrel, Virginia. 2003. The Substance of Style. Harper-Collins. p. 4. ISBN: 0-06-018632-1 5 Mazur, Glenn H and Jeremy Brochtner. 1999. “Brand Engineering using Kansei Engineering and QFD.” Transactions of the11th Symposium on QFD. QFD Institute. ISBN: 1-889477-11-7
The 17th Symposium on Quality Function Deployment 2005 - Portland
- 12 -
6 Nagamachi, Mitsuo. 1999. Special Lecture on Kansei Engineering. www.qfdi.org/books/tutorial_materials.htm#Special%20Lectures 7 QFD Green Belt® Workshop Manual. QFD Institute. 8 Akao, Yoji, ed. 1990. Quality Function Deployment: Integrating Customer Requirements into Product Design. Translated by Glenn Mazur. Cambridge, MA: Productivity Press. ISBN: 0-915299-41-0 9 Mazur, Glenn H. 1997. “Task Deployment: Managing the Human Side of QFD.” Transactions of the 9th Symposium on QFD. QFD Institute. ISBN: 1-889477-09-5 10 Mazur, Glenn H. 1996. “Voice of Customer Analysis: A Modern System of Front-End QFD Tools, with Case Studies.” Proceedings of the 50th AQC. http://www.mazur.net/works/voice_of_customer.pdf 11 Nagamachi, Mitsuo. 1999. Special Lecture on Kansei Engineering. www.qfdi.org/books/tutorial_materials.htm#Special%20Lectures 12 Adapted from Stevens, S.S. 1946. “On the Theory of Scales and Measurement,” Science. Vol. 103, Issue 2684. June 7, 1946. pp. 677-680. 13 Kan, Tamio. 1998. Analysis of Questionnaire Data. [in Japanese]. Modern Mathematics Co. Tokyo. P. 284 ISBN 4-7687-0253-8. 14 Ishihara, Shigekazu et al. “”Neural Networks approach to Kansei analysison canned coffee design.” Tsuchiya, T. et al. 1999. “A method for learning decision tree and its application for deisgn of canned cof-fee.” Proceedings of the Conference on Human Factors. Linkoping Sweden. 15 Guérin Jeanne. 2004. “Kansei Engineering for Commercial Airplane Interior Architecture.” Transac-tions of the 16th Symposium on QFD. QFD Institute. ISBN: 1-889477-16-8