Foreign Exchange Reserves, Exchange Rate Regimes, and Monetary Policy: Issues in Asia
MILLIMAN RESEARCH REPORT
Life insurance capital regimes in Asia Comparative analysis and implications of change Summary report
July 2019
MILLIMAN RESEARCH REPORT
Table of Contents
INTRODUCTION ..................................................................................................................................................... 2
EXECUTIVE SUMMARY ........................................................................................................................................ 3
COMPARISON OF TECHNICAL SPECIFICATIONS ........................................................................................... 11
COMPARATIVE ANALYSIS OF KEY CAPITAL RESULTS ACROSS THE REGION ......................................... 25
ACRONYMS ......................................................................................................................................................... 30
MILLIMAN RESEARCH REPORT
Life insurance capital regimes in Asia 2 July 2019
Introduction Capital regulations for life insurance companies in Asia are complex and varied. They are also subject to
change, with such changes often impacting how insurers manage their ongoing business. In many markets in
the region, regulators are introducing new risk based capital (RBC) regimes or “upgrading” existing RBC
frameworks, with increasing consideration being given to consistency with the new International Financial
Reporting Standard 17 (IFRS 17), the International Capital Standard (ICS), and other capital regimes across the
region/worldwide.
In view of the pace of change and the increasing focus on regulatory capital across the region, we have produced
a detailed report covering the capital regimes in ten markets in Asia plus the 2018 ICS field test (which may be a
reasonable proxy for the future RBC regimes in some markets like Japan, South Korea and Taiwan). The report
also makes reference to Solvency II, Bermuda Solvency Capital Requirements (BSCR), Canada’s Life Insurance
Capital Adequacy Test (LICAT) and the United States’ RBC regime (US RBC).
The report aims to:
i) compare and contrast life insurance RBC regimes across selected Asian markets;
ii) highlight some of the potential implications for businesses arising from the future development of
capital regulations; and
iii) contribute to the wider discussion on the potential impact of changes in regulation on the life
insurance industry in Asia.
The report seeks to provide a comparison of key quantitative and qualitative aspects of life insurance capital
regimes in Asia and an analysis of key capital results (e.g. capital ratio, risk charges, factors impacting capital)
based on information publicly available and other market sources. It does not attempt to provide all of the
applicable detail behind the capital regulations governing life insurance companies in the various markets
analysed. It is important to recognise that the regulatory environment in Asia is changing fast and, therefore, the
information contained in this report is time sensitive. The various capital regimes covered in the report are based
on the applicable regulatory environment as at 15 June 2019. Some of these regulations may have changed
since this date.
We have produced a summary of the full report, which we are sharing here.
Please contact one of the Milliman consultants listed at the end of the report to request a copy of the full report or
to discuss the RBC frameworks in any of the markets in more detail.
MILLIMAN RESEARCH REPORT
Life insurance capital regimes in Asia 3 July 2019
Executive summary Comparison of technical specifications of capital regimes
Overview
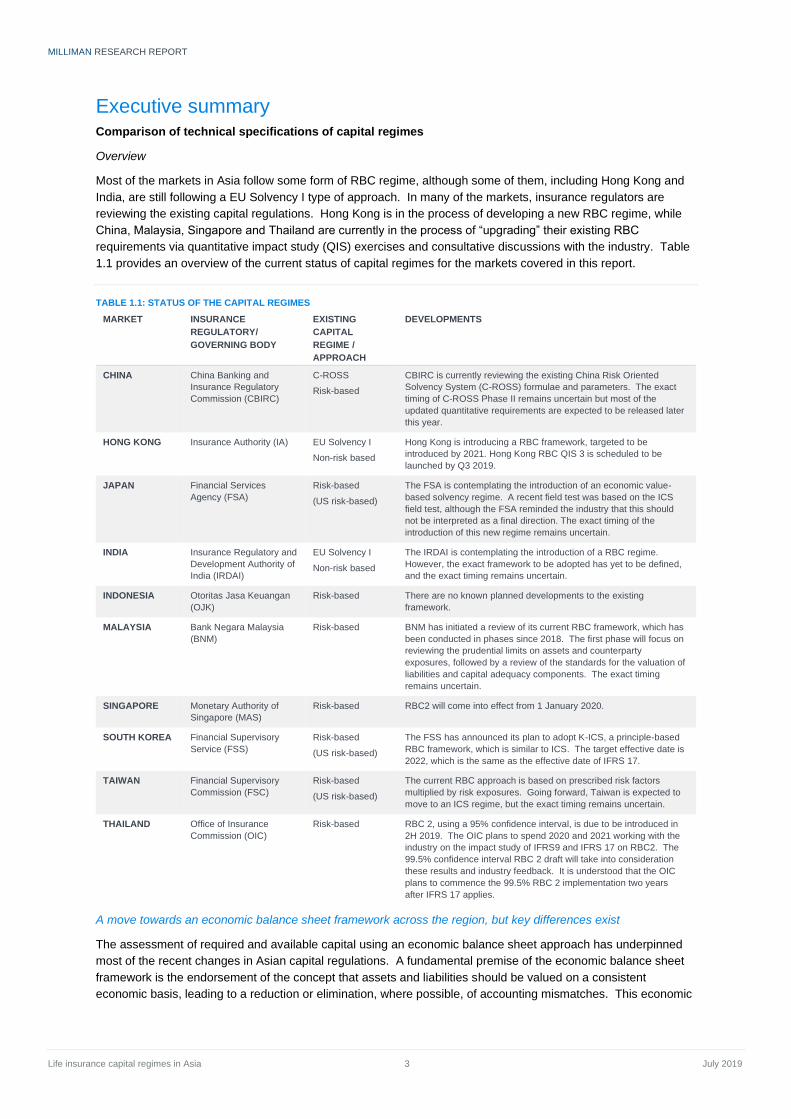
Most of the markets in Asia follow some form of RBC regime, although some of them, including Hong Kong and
India, are still following a EU Solvency I type of approach. In many of the markets, insurance regulators are
reviewing the existing capital regulations. Hong Kong is in the process of developing a new RBC regime, while
China, Malaysia, Singapore and Thailand are currently in the process of “upgrading” their existing RBC
requirements via quantitative impact study (QIS) exercises and consultative discussions with the industry. Table
1.1 provides an overview of the current status of capital regimes for the markets covered in this report.
TABLE 1.1: STATUS OF THE CAPITAL REGIMES
MARKET INSURANCE
REGULATORY/
GOVERNING BODY
EXISTING
CAPITAL
REGIME /
APPROACH
DEVELOPMENTS
CHINA China Banking and
Insurance Regulatory
Commission (CBIRC)
C-ROSS
Risk-based
CBIRC is currently reviewing the existing China Risk Oriented
Solvency System (C-ROSS) formulae and parameters. The exact
timing of C-ROSS Phase II remains uncertain but most of the
updated quantitative requirements are expected to be released later
this year.
HONG KONG Insurance Authority (IA) EU Solvency I
Non-risk based
Hong Kong is introducing a RBC framework, targeted to be
introduced by 2021. Hong Kong RBC QIS 3 is scheduled to be
launched by Q3 2019.
JAPAN Financial Services
Agency (FSA)
Risk-based
(US risk-based)
The FSA is contemplating the introduction of an economic value-
based solvency regime. A recent field test was based on the ICS
field test, although the FSA reminded the industry that this should
not be interpreted as a final direction. The exact timing of the
introduction of this new regime remains uncertain.
INDIA Insurance Regulatory and
Development Authority of
India (IRDAI)
EU Solvency I
Non-risk based
The IRDAI is contemplating the introduction of a RBC regime.
However, the exact framework to be adopted has yet to be defined,
and the exact timing remains uncertain.
INDONESIA Otoritas Jasa Keuangan
(OJK)
Risk-based There are no known planned developments to the existing
framework.
MALAYSIA Bank Negara Malaysia
(BNM)
Risk-based BNM has initiated a review of its current RBC framework, which has
been conducted in phases since 2018. The first phase will focus on
reviewing the prudential limits on assets and counterparty
exposures, followed by a review of the standards for the valuation of
liabilities and capital adequacy components. The exact timing
remains uncertain.
SINGAPORE Monetary Authority of
Singapore (MAS)
Risk-based RBC2 will come into effect from 1 January 2020.
SOUTH KOREA Financial Supervisory
Service (FSS)
Risk-based
(US risk-based)
The FSS has announced its plan to adopt K-ICS, a principle-based
RBC framework, which is similar to ICS. The target effective date is
2022, which is the same as the effective date of IFRS 17.
TAIWAN Financial Supervisory
Commission (FSC)
Risk-based
(US risk-based)
The current RBC approach is based on prescribed risk factors
multiplied by risk exposures. Going forward, Taiwan is expected to
move to an ICS regime, but the exact timing remains uncertain.
THAILAND Office of Insurance
Commission (OIC)
Risk-based RBC 2, using a 95% confidence interval, is due to be introduced in
2H 2019. The OIC plans to spend 2020 and 2021 working with the
industry on the impact study of IFRS9 and IFRS 17 on RBC2. The
99.5% confidence interval RBC 2 draft will take into consideration
these results and industry feedback. It is understood that the OIC
plans to commence the 99.5% RBC 2 implementation two years
after IFRS 17 applies.
A move towards an economic balance sheet framework across the region, but key differences exist
The assessment of required and available capital using an economic balance sheet approach has underpinned
most of the recent changes in Asian capital regulations. A fundamental premise of the economic balance sheet
framework is the endorsement of the concept that assets and liabilities should be valued on a consistent
economic basis, leading to a reduction or elimination, where possible, of accounting mismatches. This economic
MILLIMAN RESEARCH REPORT
Life insurance capital regimes in Asia 4 July 2019
balance sheet approach is also consistent with Solvency II, ICS and IFRS 17 principles. In particular, for
solvency purpose, an increasing number of Asian capital regimes require companies to:
- assess their assets on a market value basis (e.g. Hong Kong (new RBC), Indonesia, Singapore,
Thailand, Malaysia), although some are still measuring their assets using different accounting bases
(e.g. China C-ROSS, Japan regulatory capital);
- value their liabilities using a gross premium valuation (GPV) approach allowing for an additional risk
margin and, potentially, a time value of options and guarantees (TVOG), using a “relatively market
consistent” yield curve to determine discount factors.
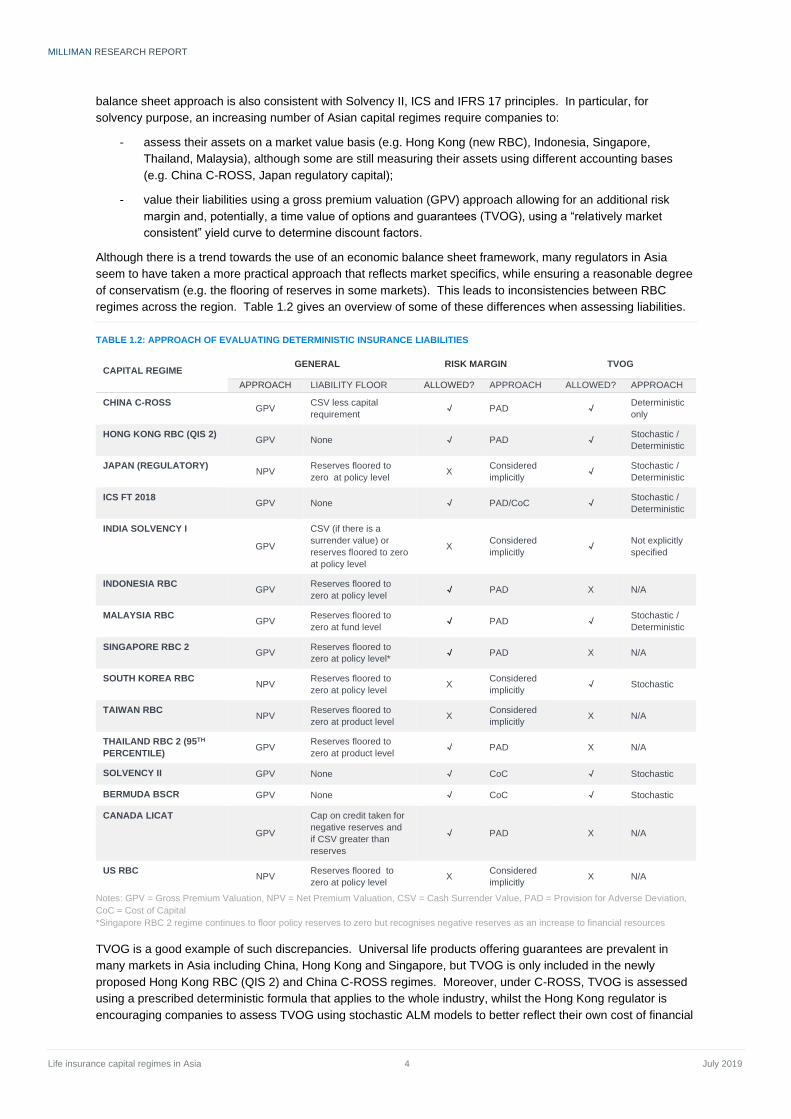
Although there is a trend towards the use of an economic balance sheet framework, many regulators in Asia
seem to have taken a more practical approach that reflects market specifics, while ensuring a reasonable degree
of conservatism (e.g. the flooring of reserves in some markets). This leads to inconsistencies between RBC
regimes across the region. Table 1.2 gives an overview of some of these differences when assessing liabilities.
TABLE 1.2: APPROACH OF EVALUATING DETERMINISTIC INSURANCE LIABILITIES
CAPITAL REGIME GENERAL RISK MARGIN TVOG
APPROACH LIABILITY FLOOR ALLOWED? APPROACH ALLOWED? APPROACH
CHINA C-ROSS GPV
CSV less capital
requirement √ PAD √
Deterministic
only
HONG KONG RBC (QIS 2) GPV None √ PAD √
Stochastic /
Deterministic
JAPAN (REGULATORY) NPV
Reserves floored to
zero at policy level X
Considered
implicitly √
Stochastic /
Deterministic
ICS FT 2018 GPV None √ PAD/CoC √
Stochastic /
Deterministic
INDIA SOLVENCY I
GPV
CSV (if there is a
surrender value) or
reserves floored to zero
at policy level
X Considered
implicitly √
Not explicitly
specified
INDONESIA RBC GPV
Reserves floored to
zero at policy level √ PAD X N/A
MALAYSIA RBC GPV
Reserves floored to
zero at fund level √ PAD √
Stochastic /
Deterministic
SINGAPORE RBC 2 GPV
Reserves floored to
zero at policy level* √ PAD X N/A
SOUTH KOREA RBC NPV
Reserves floored to
zero at policy level X
Considered
implicitly √ Stochastic
TAIWAN RBC NPV
Reserves floored to
zero at product level X
Considered
implicitly X N/A
THAILAND RBC 2 (95TH
PERCENTILE) GPV
Reserves floored to
zero at product level √ PAD X N/A
SOLVENCY II GPV None √ CoC √ Stochastic
BERMUDA BSCR GPV None √ CoC √ Stochastic
CANADA LICAT
GPV
Cap on credit taken for
negative reserves and
if CSV greater than
reserves
√ PAD X N/A
US RBC NPV
Reserves floored to
zero at policy level X
Considered
implicitly X N/A
Notes: GPV = Gross Premium Valuation, NPV = Net Premium Valuation, CSV = Cash Surrender Value, PAD = Provision for Adverse Deviation,
CoC = Cost of Capital
*Singapore RBC 2 regime continues to floor policy reserves to zero but recognises negative reserves as an increase to financial resources
TVOG is a good example of such discrepancies. Universal life products offering guarantees are prevalent in
many markets in Asia including China, Hong Kong and Singapore, but TVOG is only included in the newly
proposed Hong Kong RBC (QIS 2) and China C-ROSS regimes. Moreover, under C-ROSS, TVOG is assessed
using a prescribed deterministic formula that applies to the whole industry, whilst the Hong Kong regulator is
encouraging companies to assess TVOG using stochastic ALM models to better reflect their own cost of financial
MILLIMAN RESEARCH REPORT
Life insurance capital regimes in Asia 5 July 2019
options and guarantees. The same discrepancies in TVOG methodology apply to participating business, which is
material in many markets in Asia (e.g. Hong Kong, Singapore, Malaysia, China).
The risk margin is another example of discrepancies across RBC regimes in Asia. Whilst PADs are adopted in
most of the capital regimes in the region, the approach to derive the PADs – and in particular the underlying risk
charges used to calculate the PADs - differs from one market to another. In addition, the PAD approach (which is
determined by recalculating liabilities by including an additional prudent margin on top of the best estimate
assumptions) is not consistent with the cost of capital (CoC) approach used by Solvency II and Bermuda BSCR.
It may also not be in line with the approach adopted by some Asian life insurance companies under IFRS 17
(although some companies may also decide to use a PAD approach).
Discount rate: market consistency and smoothing
Under RBC regimes, the yield curves used to assess the best estimate of liabilities are typically defined using a
“bottom up” approach, whereby the discount rate reflects a market consistent risk free rate plus an adjustment for
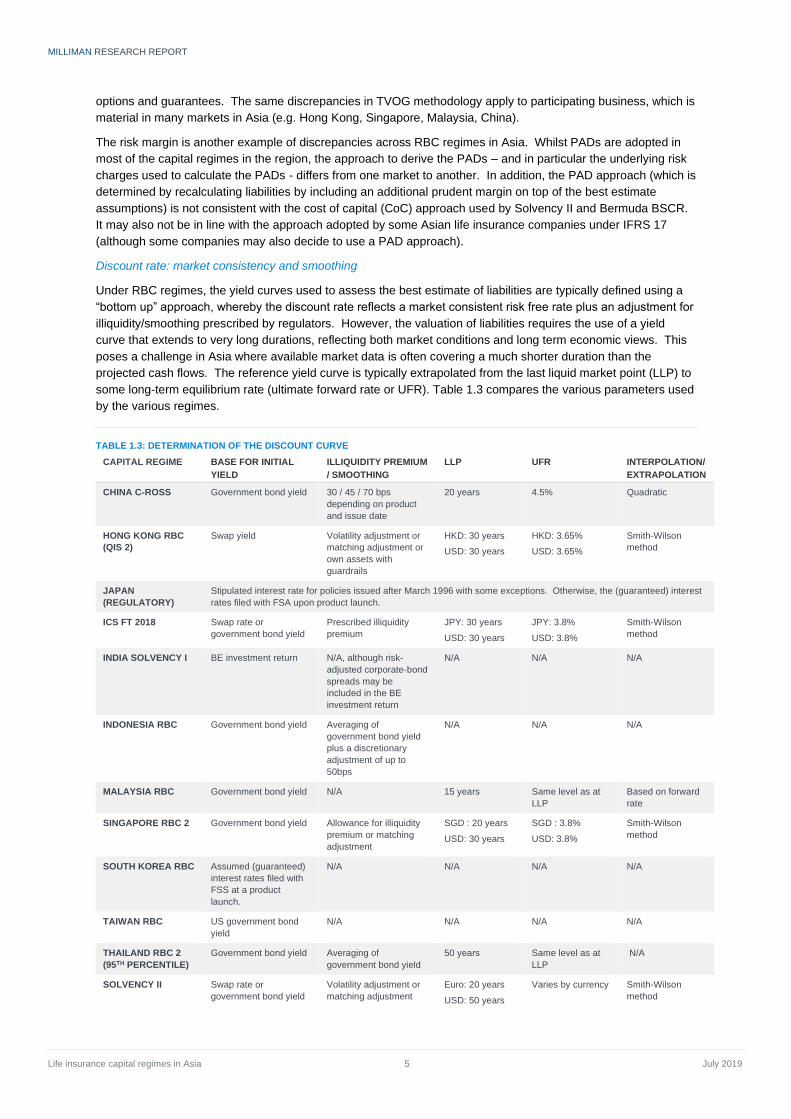
illiquidity/smoothing prescribed by regulators. However, the valuation of liabilities requires the use of a yield
curve that extends to very long durations, reflecting both market conditions and long term economic views. This
poses a challenge in Asia where available market data is often covering a much shorter duration than the
projected cash flows. The reference yield curve is typically extrapolated from the last liquid market point (LLP) to
some long-term equilibrium rate (ultimate forward rate or UFR). Table 1.3 compares the various parameters used
by the various regimes.
TABLE 1.3: DETERMINATION OF THE DISCOUNT CURVE
CAPITAL REGIME BASE FOR INITIAL
YIELD
ILLIQUIDITY PREMIUM
/ SMOOTHING
LLP UFR INTERPOLATION/
EXTRAPOLATION
CHINA C-ROSS Government bond yield 30 / 45 / 70 bps
depending on product
and issue date
20 years 4.5% Quadratic
HONG KONG RBC
(QIS 2)
Swap yield Volatility adjustment or
matching adjustment or
own assets with
guardrails
HKD: 30 years
USD: 30 years
HKD: 3.65%
USD: 3.65%
Smith-Wilson
method
JAPAN
(REGULATORY)
Stipulated interest rate for policies issued after March 1996 with some exceptions. Otherwise, the (guaranteed) interest
rates filed with FSA upon product launch.
ICS FT 2018 Swap rate or
government bond yield
Prescribed illiquidity
premium
JPY: 30 years
USD: 30 years
JPY: 3.8%
USD: 3.8%
Smith-Wilson
method
INDIA SOLVENCY I BE investment return N/A, although risk-
adjusted corporate-bond
spreads may be
included in the BE
investment return
N/A N/A N/A
INDONESIA RBC Government bond yield Averaging of
government bond yield
plus a discretionary
adjustment of up to
50bps
N/A N/A N/A
MALAYSIA RBC Government bond yield N/A 15 years Same level as at
LLP
Based on forward
rate
SINGAPORE RBC 2 Government bond yield Allowance for illiquidity
premium or matching
adjustment
SGD : 20 years
USD: 30 years
SGD : 3.8%
USD: 3.8%
Smith-Wilson
method
SOUTH KOREA RBC Assumed (guaranteed)
interest rates filed with
FSS at a product
launch.
N/A N/A N/A N/A
TAIWAN RBC US government bond
yield
N/A N/A N/A N/A
THAILAND RBC 2
(95TH PERCENTILE)
Government bond yield Averaging of
government bond yield
50 years Same level as at
LLP N/A
SOLVENCY II Swap rate or
government bond yield
Volatility adjustment or
matching adjustment
Euro: 20 years
USD: 50 years
Varies by currency Smith-Wilson
method
MILLIMAN RESEARCH REPORT
Life insurance capital regimes in Asia 6 July 2019
CAPITAL REGIME BASE FOR INITIAL
YIELD
ILLIQUIDITY PREMIUM
/ SMOOTHING
LLP UFR INTERPOLATION/
EXTRAPOLATION
BERMUDA BSCR Swap rate Discretionary 30 Varies by currency Potentially several
methods
CANADA LICAT Canadian statutory rate N/A N/A N/A URR (unexpired
risk reserve)
US RBC Net asset earned rates
with prescribed asset
spreads
N/A N/A N/A N/A
N/A: not appropriate
Using the spot yield curve to set discount rates introduces an asset liability gap in the economic balance sheet of
insurance companies, where the market price of assets captures the illiquid nature of the assets but this is not
recognised within the liability calculations. Illiquidity premium adjustments and smoothing adjustments (e.g.
volatility adjustment, UFR, averaging of spot yield curve) are, therefore, applied to narrow this gap, stabilise the
net asset value (i.e. difference between assets and liabilities) and better reflect the long term nature of insurance
businesses, and in particular the illiquid nature of liabilities. RBC capital adequacy ratios and the different blocks
of the economic balance sheet are usually sensitive to this parameter, which is often a key component in different
phases of quantitative impact studies/testing from regulators.
Capital requirement modules and sub-modules are broadly consistent across RBC regimes in Asia, but
underlying parameters differ
The exhaustive list of risks considered in determining capital requirements varies across different capital regimes.
However, key material risks considered are typically similar, and include insurance risk, market risk, counterparty
default risk and operational risk.
- Life insurance risks include mortality/longevity risk, morbidity risk, lapse risk (long term and mass lapse),
and expense risk. Mortality catastrophe risk is also sometimes explicitly considered.
- Market risks typically consist of equity risk, interest rate risk/ asset liability management (ALM) risk,
credit spread risk, property risk and foreign exchange risk.
- Operational risk is typically quantified by applying risk factors to risk drivers, with premium being one of
the most common risk drivers.
As there are natural hedges between different risks, correlation matrices are usually considered to reflect
diversification benefits across various risk modules and sub-modules. In particular, most of the RBC regimes in
Asia (and in particular all the RBC regimes revised recently) consider diversification benefits when aggregating
the sub-modules under the insurance and market risk modules. Some RBC regimes consider the diversification
between all risk components other than operational risk, while some others only consider the diversification
between asset risk and insurance risk.
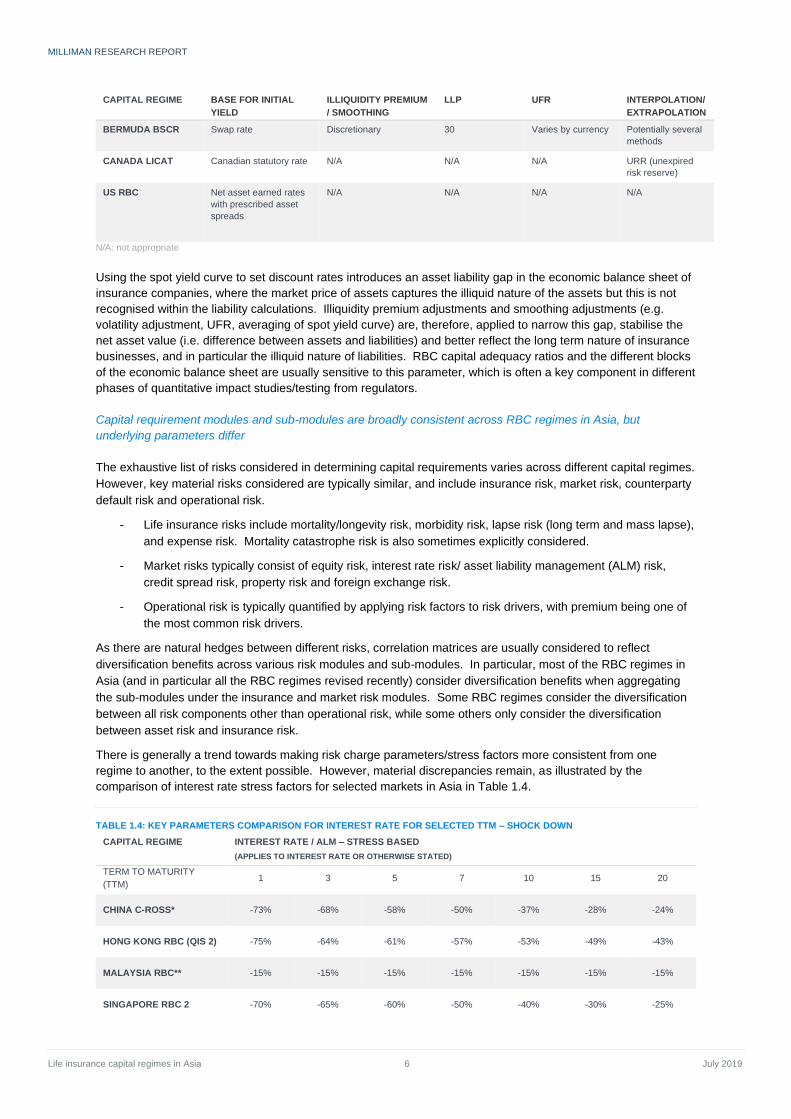
There is generally a trend towards making risk charge parameters/stress factors more consistent from one
regime to another, to the extent possible. However, material discrepancies remain, as illustrated by the
comparison of interest rate stress factors for selected markets in Asia in Table 1.4.
TABLE 1.4: KEY PARAMETERS COMPARISON FOR INTEREST RATE FOR SELECTED TTM – SHOCK DOWN
CAPITAL REGIME INTEREST RATE / ALM – STRESS BASED
(APPLIES TO INTEREST RATE OR OTHERWISE STATED)
TERM TO MATURITY
(TTM) 1 3 5 7 10 15 20
CHINA C-ROSS* -73% -68% -58% -50% -37% -28% -24%
HONG KONG RBC (QIS 2) -75% -64% -61% -57% -53% -49% -43%
MALAYSIA RBC** -15% -15% -15% -15% -15% -15% -15%
SINGAPORE RBC 2 -70% -65% -60% -50% -40% -30% -25%
MILLIMAN RESEARCH REPORT
Life insurance capital regimes in Asia 7 July 2019
CAPITAL REGIME INTEREST RATE / ALM – STRESS BASED
(APPLIES TO INTEREST RATE OR OTHERWISE STATED)
TERM TO MATURITY
(TTM) 1 3 5 7 10 15 20
THAILAND RBC 2
(95TH PERCENTILE) -40% -38% -36% -34% -31% -26% -21%
SOLVENCY II -75% -56% -46% -39% -31% -27% -29%
* China has different shocks for assets and liabilities. The asset shocks are shown above. The liability shocks are generally lower.
** For Malaysia, the stress is formula-based and depends on the Malaysian Government Securities (MGS) yield. The stress shown above for
comparison purposes is applicable as at end of 2017.
Comparative analysis of key capital results across Asia and impact of new RBC regimes on life insurance
companies
Comparative analysis of capital adequacy ratios across Asia
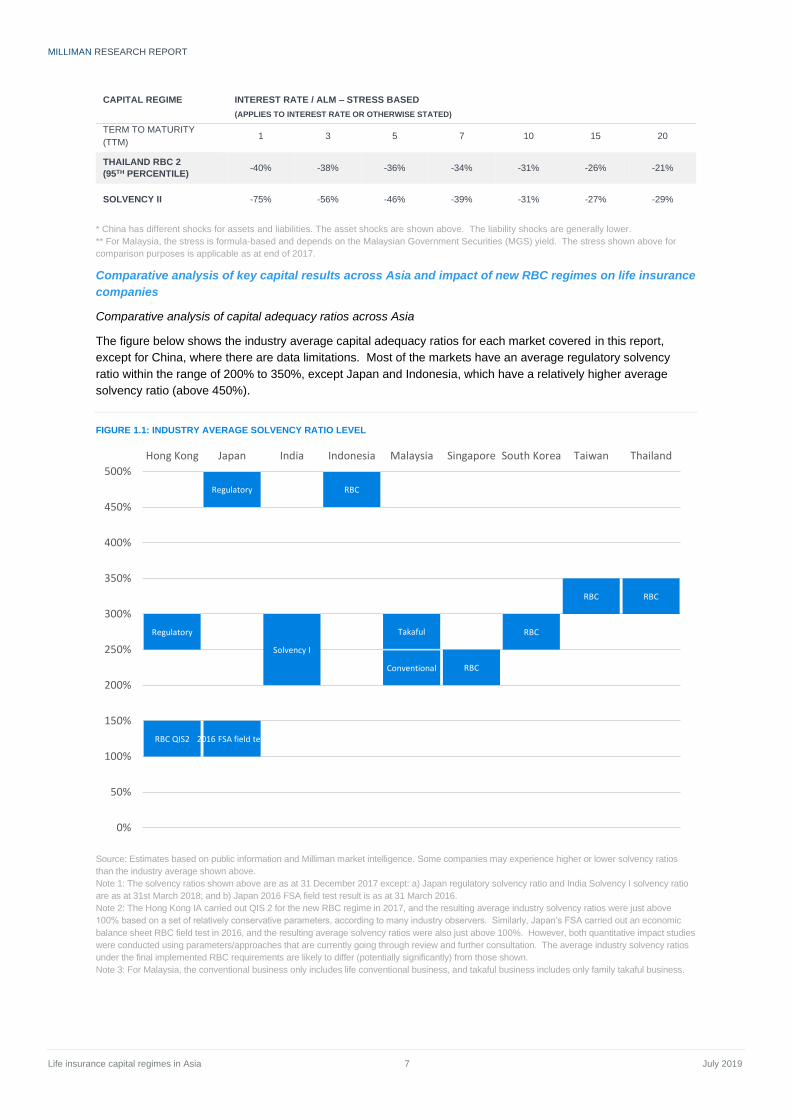
The figure below shows the industry average capital adequacy ratios for each market covered in this report,
except for China, where there are data limitations. Most of the markets have an average regulatory solvency
ratio within the range of 200% to 350%, except Japan and Indonesia, which have a relatively higher average
solvency ratio (above 450%).
FIGURE 1.1: INDUSTRY AVERAGE SOLVENCY RATIO LEVEL
Source: Estimates based on public information and Milliman market intelligence. Some companies may experience higher or lower solvency ratios
than the industry average shown above.
Note 1: The solvency ratios shown above are as at 31 December 2017 except: a) Japan regulatory solvency ratio and India Solvency I solvency ratio
are as at 31st March 2018; and b) Japan 2016 FSA field test result is as at 31 March 2016.
Note 2: The Hong Kong IA carried out QIS 2 for the new RBC regime in 2017, and the resulting average industry solvency ratios were just above
100% based on a set of relatively conservative parameters, according to many industry observers. Similarly, Japan’s FSA carried out an economic
balance sheet RBC field test in 2016, and the resulting average solvency ratios were also just above 100%. However, both quantitative impact studies
were conducted using parameters/approaches that are currently going through review and further consultation. The average industry solvency ratios
under the final implemented RBC requirements are likely to differ (potentially significantly) from those shown.
Note 3: For Malaysia, the conventional business only includes life conventional business, and takaful business includes only family takaful business.
RBC QIS2 2016 FSA field test
Solvency I
RBC
Conventional RBC
RBC
RBC RBC
Regulatory
Regulatory
Takaful
0%
50%
100%
150%
200%
250%
300%
350%
400%
450%
500%
Hong Kong Japan India Indonesia Malaysia Singapore South Korea Taiwan Thailand
MILLIMAN RESEARCH REPORT
Life insurance capital regimes in Asia 8 July 2019
In general, industry level capital ratios in Asia have been relatively stable over the past few years, with small
changes driven primarily by changes in the interest rate environment (government bond yields being typically
used to set up the discount rate as discussed above).
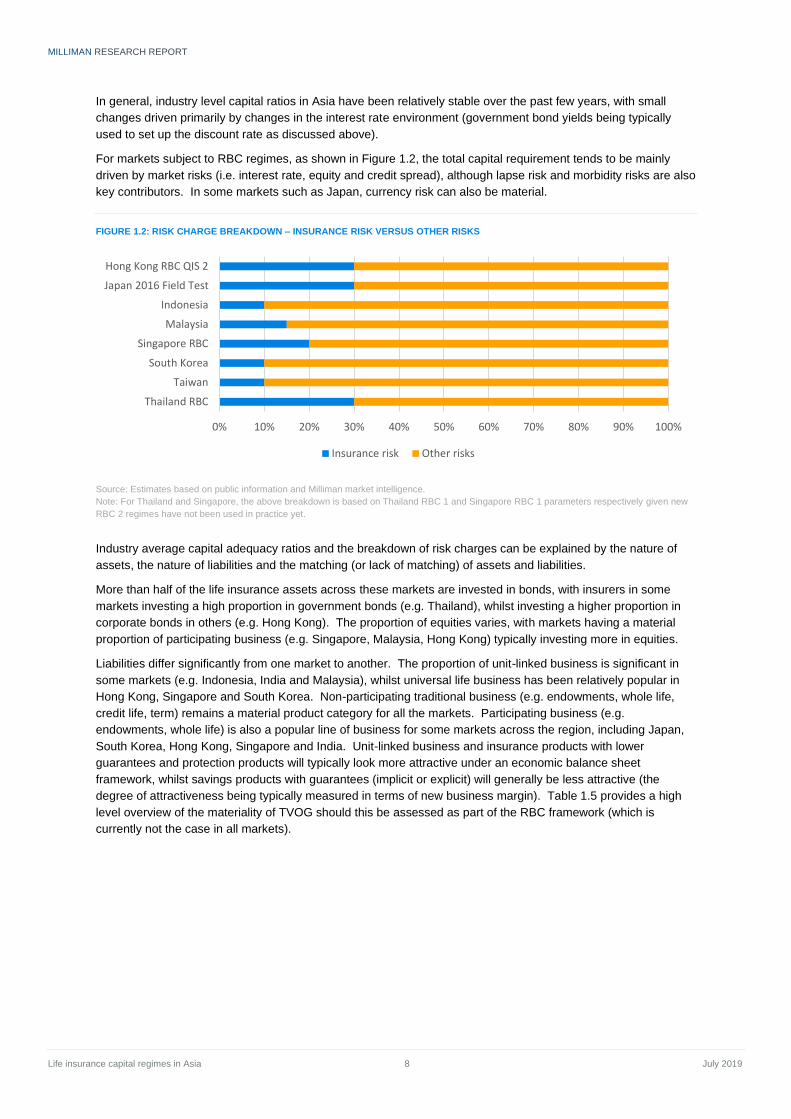
For markets subject to RBC regimes, as shown in Figure 1.2, the total capital requirement tends to be mainly
driven by market risks (i.e. interest rate, equity and credit spread), although lapse risk and morbidity risks are also
key contributors. In some markets such as Japan, currency risk can also be material.
FIGURE 1.2: RISK CHARGE BREAKDOWN – INSURANCE RISK VERSUS OTHER RISKS
Source: Estimates based on public information and Milliman market intelligence.
Note: For Thailand and Singapore, the above breakdown is based on Thailand RBC 1 and Singapore RBC 1 parameters respectively given new
RBC 2 regimes have not been used in practice yet.
Industry average capital adequacy ratios and the breakdown of risk charges can be explained by the nature of
assets, the nature of liabilities and the matching (or lack of matching) of assets and liabilities.
More than half of the life insurance assets across these markets are invested in bonds, with insurers in some
markets investing a high proportion in government bonds (e.g. Thailand), whilst investing a higher proportion in
corporate bonds in others (e.g. Hong Kong). The proportion of equities varies, with markets having a material
proportion of participating business (e.g. Singapore, Malaysia, Hong Kong) typically investing more in equities.
Liabilities differ significantly from one market to another. The proportion of unit-linked business is significant in
some markets (e.g. Indonesia, India and Malaysia), whilst universal life business has been relatively popular in
Hong Kong, Singapore and South Korea. Non-participating traditional business (e.g. endowments, whole life,
credit life, term) remains a material product category for all the markets. Participating business (e.g.
endowments, whole life) is also a popular line of business for some markets across the region, including Japan,
South Korea, Hong Kong, Singapore and India. Unit-linked business and insurance products with lower
guarantees and protection products will typically look more attractive under an economic balance sheet
framework, whilst savings products with guarantees (implicit or explicit) will generally be less attractive (the
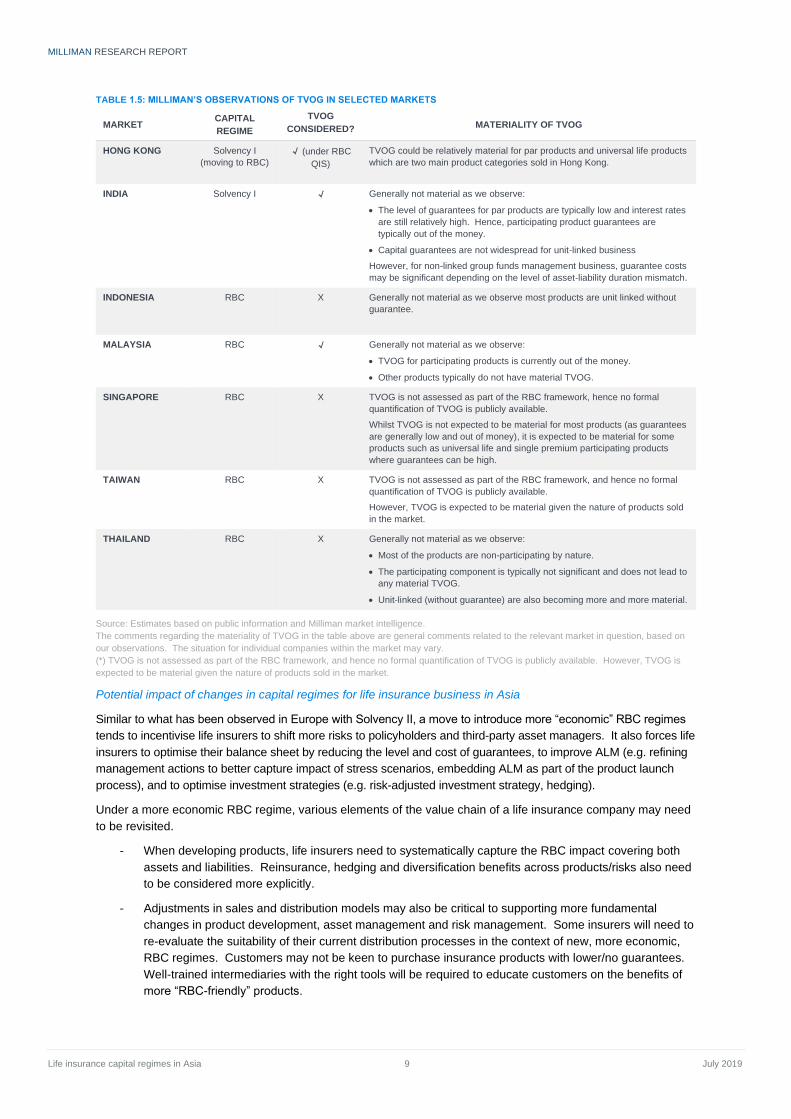
degree of attractiveness being typically measured in terms of new business margin). Table 1.5 provides a high
level overview of the materiality of TVOG should this be assessed as part of the RBC framework (which is
currently not the case in all markets).
0% 10% 20% 30% 40% 50% 60% 70% 80% 90% 100%
Hong Kong RBC QIS 2
Japan 2016 Field Test
Indonesia
Malaysia
Singapore RBC
South Korea
Taiwan
Thailand RBC
Insurance risk Other risks
MILLIMAN RESEARCH REPORT
Life insurance capital regimes in Asia 9 July 2019
TABLE 1.5: MILLIMAN’S OBSERVATIONS OF TVOG IN SELECTED MARKETS
MARKET CAPITAL
REGIME
TVOG
CONSIDERED? MATERIALITY OF TVOG
HONG KONG Solvency I
(moving to RBC)
√ (under RBC
QIS)
TVOG could be relatively material for par products and universal life products
which are two main product categories sold in Hong Kong.
INDIA Solvency I √ Generally not material as we observe:
• The level of guarantees for par products are typically low and interest rates
are still relatively high. Hence, participating product guarantees are
typically out of the money.
• Capital guarantees are not widespread for unit-linked business
However, for non-linked group funds management business, guarantee costs
may be significant depending on the level of asset-liability duration mismatch.
INDONESIA RBC X Generally not material as we observe most products are unit linked without
guarantee.
MALAYSIA RBC √ Generally not material as we observe:
• TVOG for participating products is currently out of the money.
• Other products typically do not have material TVOG.
SINGAPORE RBC X TVOG is not assessed as part of the RBC framework, hence no formal
quantification of TVOG is publicly available.
Whilst TVOG is not expected to be material for most products (as guarantees
are generally low and out of money), it is expected to be material for some
products such as universal life and single premium participating products
where guarantees can be high.
TAIWAN RBC X TVOG is not assessed as part of the RBC framework, and hence no formal
quantification of TVOG is publicly available.
However, TVOG is expected to be material given the nature of products sold
in the market.
THAILAND RBC X Generally not material as we observe:
• Most of the products are non-participating by nature.
• The participating component is typically not significant and does not lead to
any material TVOG.
• Unit-linked (without guarantee) are also becoming more and more material.
Source: Estimates based on public information and Milliman market intelligence.
The comments regarding the materiality of TVOG in the table above are general comments related to the relevant market in question, based on
our observations. The situation for individual companies within the market may vary.
(*) TVOG is not assessed as part of the RBC framework, and hence no formal quantification of TVOG is publicly available. However, TVOG is
expected to be material given the nature of products sold in the market.
Potential impact of changes in capital regimes for life insurance business in Asia
Similar to what has been observed in Europe with Solvency II, a move to introduce more “economic” RBC regimes
tends to incentivise life insurers to shift more risks to policyholders and third-party asset managers. It also forces life
insurers to optimise their balance sheet by reducing the level and cost of guarantees, to improve ALM (e.g. refining
management actions to better capture impact of stress scenarios, embedding ALM as part of the product launch
process), and to optimise investment strategies (e.g. risk-adjusted investment strategy, hedging).
Under a more economic RBC regime, various elements of the value chain of a life insurance company may need
to be revisited.
- When developing products, life insurers need to systematically capture the RBC impact covering both
assets and liabilities. Reinsurance, hedging and diversification benefits across products/risks also need
to be considered more explicitly.
- Adjustments in sales and distribution models may also be critical to supporting more fundamental
changes in product development, asset management and risk management. Some insurers will need to
re-evaluate the suitability of their current distribution processes in the context of new, more economic,
RBC regimes. Customers may not be keen to purchase insurance products with lower/no guarantees.
Well-trained intermediaries with the right tools will be required to educate customers on the benefits of
more “RBC-friendly” products.
MILLIMAN RESEARCH REPORT
Life insurance capital regimes in Asia 10 July 2019
Overall, these new capital regimes will require insurers to use more advanced techniques to set and validate
strategic decisions and manage their business.
- Strategic planning. In line with shareholder expectations, many insurers currently conduct their
strategic planning with a key focus on traditional top line and bottom line growth metrics, e.g. annualised
premium equivalent (APE) growth, (traditional) embedded value (EV) growth, value of one year’s new
business (VONB) margin / growth using one deterministic base case investment return assumption.
Under the new RBC regimes (and IFRS 17), these measures would need to be accompanied by
additional risk-based metrics that clearly identify the trade-off between shareholder value (e.g.
measured in terms of EV or VONB) and risk (e.g. measured in terms of RBC requirements and return on
capital). Strategic planning will not only be a matter of finding the appropriate business strategy to grow
revenue and profitability but also a matter of optimising the allocation of capital and controlling/reducing
risk, via potentially the definition of a “return on capital” type of metric. For new business in particular,
life insurers will need to find the right balance between maximising top line (by selling products with
potentially expensive financial options and guarantees) and optimising capital (by selling products which
may not have been so attractive historically to customers). Ultimately, more emphasis is likely to be
placed on recognising diversification benefits (both product and risk) for a given line of business.
- Capital management, reinsurance and hedging strategy. Changes in capital regulations will likely
prompt insurers to revisit their existing capital management, reinsurance and hedging programs. Two
main factors will drive this change:
o Optimising capital requirement will become an increasingly key priority. Management actions
will need to be tailored to better reflect factors, impacting risks faced by insurance companies
and ultimately making allowance for it in the assessment of RBC capital.
o The financing strategy of insurance companies may also be impacted as a result of the
introduction of new definitions of eligible capital, typically grouped into tiers.
MILLIMAN RESEARCH REPORT
Life insurance capital regimes in Asia 11 July 2019
Comparison of technical specifications In many markets in Asia, regulators are introducing new risk-based capital (RBC) regimes or are in the process of
“upgrading” existing RBC frameworks. In this section, we provide a comparative analysis of the technical
specifications of these frameworks across the region. In addition, we have also compared these frameworks
against those being used in other parts of the world and impacting some of the largest insurers operating in Asia,
e.g. Europe’s Solvency II, Bermuda Solvency Capital Requirements (BSCR), Canada’s Life Insurance Capital
Adequacy Test (LICAT) and US RBC.
Overview
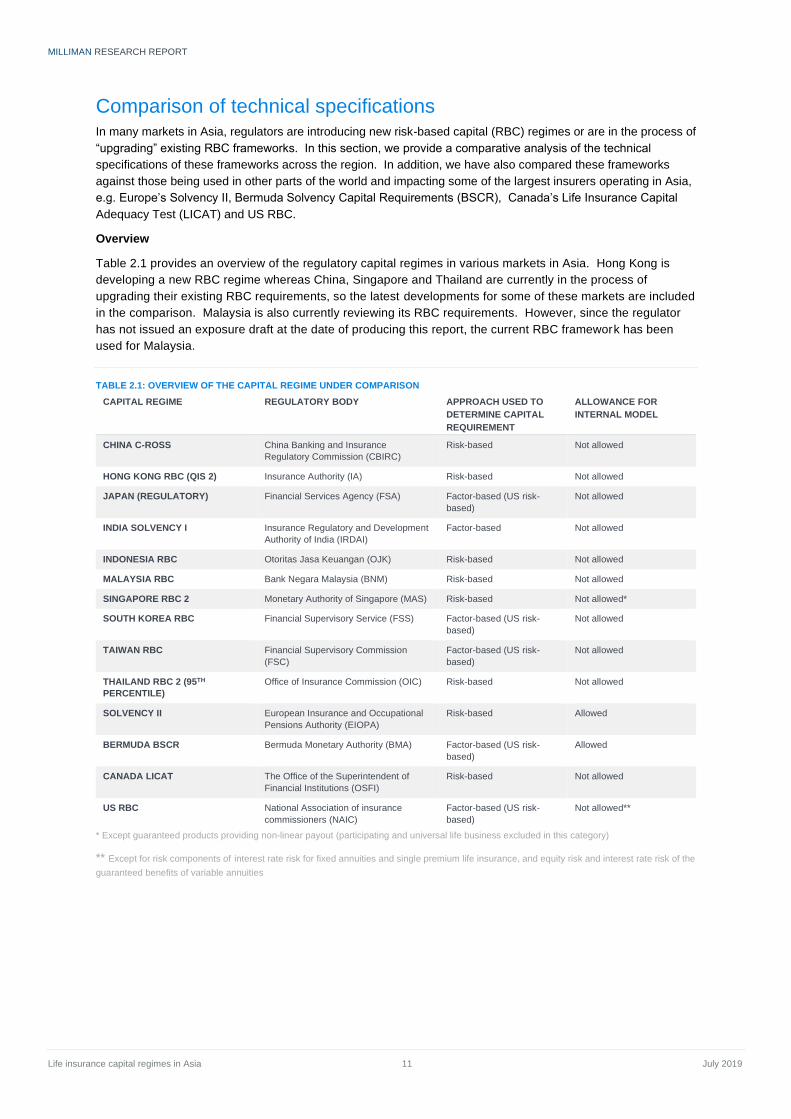
Table 2.1 provides an overview of the regulatory capital regimes in various markets in Asia. Hong Kong is
developing a new RBC regime whereas China, Singapore and Thailand are currently in the process of
upgrading their existing RBC requirements, so the latest developments for some of these markets are included
in the comparison. Malaysia is also currently reviewing its RBC requirements. However, since the regulator
has not issued an exposure draft at the date of producing this report, the current RBC framework has been
used for Malaysia.
TABLE 2.1: OVERVIEW OF THE CAPITAL REGIME UNDER COMPARISON
CAPITAL REGIME REGULATORY BODY APPROACH USED TO
DETERMINE CAPITAL
REQUIREMENT
ALLOWANCE FOR
INTERNAL MODEL
CHINA C-ROSS China Banking and Insurance
Regulatory Commission (CBIRC)
Risk-based Not allowed
HONG KONG RBC (QIS 2) Insurance Authority (IA) Risk-based Not allowed
JAPAN (REGULATORY) Financial Services Agency (FSA) Factor-based (US risk-
based)
Not allowed
INDIA SOLVENCY I Insurance Regulatory and Development
Authority of India (IRDAI)
Factor-based Not allowed
INDONESIA RBC Otoritas Jasa Keuangan (OJK) Risk-based Not allowed
MALAYSIA RBC Bank Negara Malaysia (BNM) Risk-based Not allowed
SINGAPORE RBC 2 Monetary Authority of Singapore (MAS) Risk-based Not allowed*
SOUTH KOREA RBC Financial Supervisory Service (FSS) Factor-based (US risk-
based)
Not allowed
TAIWAN RBC Financial Supervisory Commission
(FSC)
Factor-based (US risk-
based)
Not allowed
THAILAND RBC 2 (95TH
PERCENTILE)
Office of Insurance Commission (OIC) Risk-based Not allowed
SOLVENCY II European Insurance and Occupational
Pensions Authority (EIOPA)
Risk-based Allowed
BERMUDA BSCR Bermuda Monetary Authority (BMA) Factor-based (US risk-
based)
Allowed
CANADA LICAT The Office of the Superintendent of
Financial Institutions (OSFI)
Risk-based Not allowed
US RBC National Association of insurance
commissioners (NAIC)
Factor-based (US risk-
based)
Not allowed**
* Except guaranteed products providing non-linear payout (participating and universal life business excluded in this category)
** Except for risk components of interest rate risk for fixed annuities and single premium life insurance, and equity risk and interest rate risk of the
guaranteed benefits of variable annuities
MILLIMAN RESEARCH REPORT
Life insurance capital regimes in Asia 12 July 2019
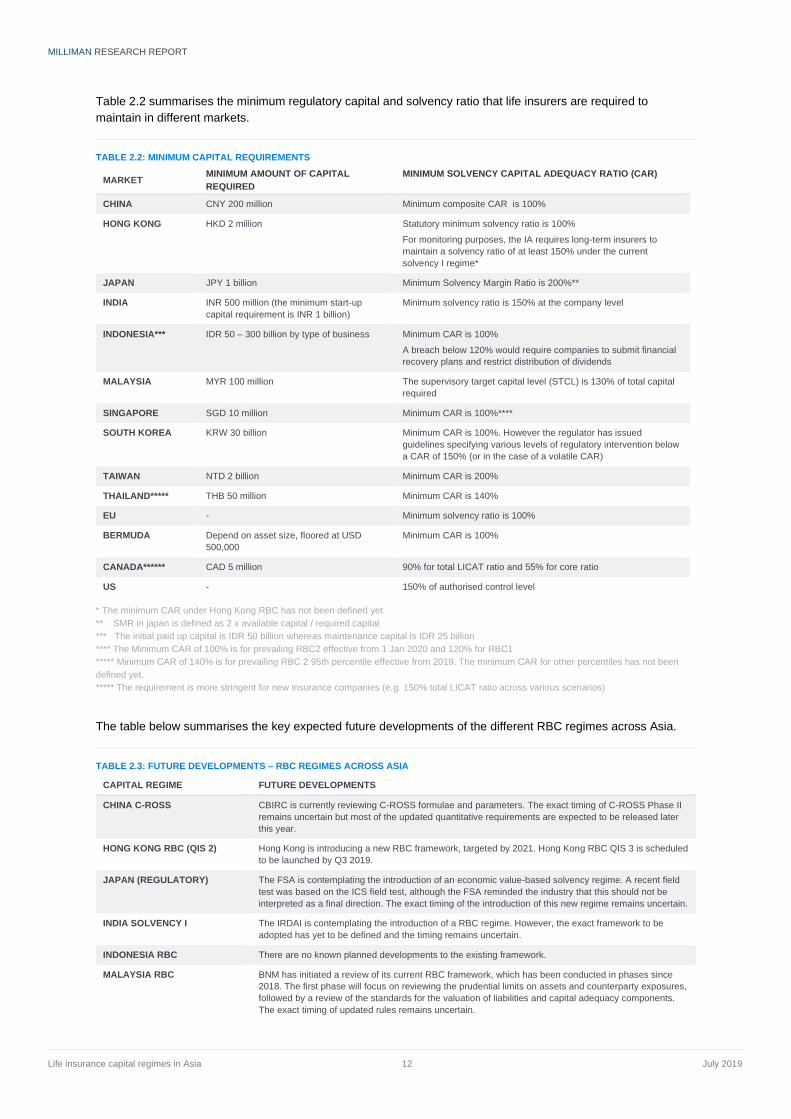
Table 2.2 summarises the minimum regulatory capital and solvency ratio that life insurers are required to
maintain in different markets.
TABLE 2.2: MINIMUM CAPITAL REQUIREMENTS
MARKET MINIMUM AMOUNT OF CAPITAL
REQUIRED
MINIMUM SOLVENCY CAPITAL ADEQUACY RATIO (CAR)
CHINA CNY 200 million Minimum composite CAR is 100%
HONG KONG HKD 2 million Statutory minimum solvency ratio is 100%
For monitoring purposes, the IA requires long-term insurers to
maintain a solvency ratio of at least 150% under the current
solvency I regime*
JAPAN JPY 1 billion Minimum Solvency Margin Ratio is 200%**
INDIA INR 500 million (the minimum start-up
capital requirement is INR 1 billion)
Minimum solvency ratio is 150% at the company level
INDONESIA*** IDR 50 – 300 billion by type of business Minimum CAR is 100%
A breach below 120% would require companies to submit financial
recovery plans and restrict distribution of dividends
MALAYSIA MYR 100 million The supervisory target capital level (STCL) is 130% of total capital
required
SINGAPORE SGD 10 million Minimum CAR is 100%****
SOUTH KOREA KRW 30 billion Minimum CAR is 100%. However the regulator has issued
guidelines specifying various levels of regulatory intervention below
a CAR of 150% (or in the case of a volatile CAR)
TAIWAN NTD 2 billion Minimum CAR is 200%
THAILAND***** THB 50 million Minimum CAR is 140%
EU - Minimum solvency ratio is 100%
BERMUDA Depend on asset size, floored at USD
500,000
Minimum CAR is 100%
CANADA****** CAD 5 million 90% for total LICAT ratio and 55% for core ratio
US - 150% of authorised control level
* The minimum CAR under Hong Kong RBC has not been defined yet.
** SMR in japan is defined as 2 x available capital / required capital
*** The initial paid up capital is IDR 50 billion whereas maintenance capital is IDR 25 billion
**** The Minimum CAR of 100% is for prevailing RBC2 effective from 1 Jan 2020 and 120% for RBC1
***** Minimum CAR of 140% is for prevailing RBC 2 95th percentile effective from 2019. The minimum CAR for other percentiles has not been
defined yet.
***** The requirement is more stringent for new insurance companies (e.g. 150% total LICAT ratio across various scenarios)
The table below summarises the key expected future developments of the different RBC regimes across Asia.
TABLE 2.3: FUTURE DEVELOPMENTS – RBC REGIMES ACROSS ASIA
CAPITAL REGIME FUTURE DEVELOPMENTS
CHINA C-ROSS CBIRC is currently reviewing C-ROSS formulae and parameters. The exact timing of C-ROSS Phase II
remains uncertain but most of the updated quantitative requirements are expected to be released later
this year.
HONG KONG RBC (QIS 2) Hong Kong is introducing a new RBC framework, targeted by 2021. Hong Kong RBC QIS 3 is scheduled
to be launched by Q3 2019.
JAPAN (REGULATORY) The FSA is contemplating the introduction of an economic value-based solvency regime. A recent field
test was based on the ICS field test, although the FSA reminded the industry that this should not be
interpreted as a final direction. The exact timing of the introduction of this new regime remains uncertain.
INDIA SOLVENCY I The IRDAI is contemplating the introduction of a RBC regime. However, the exact framework to be
adopted has yet to be defined and the timing remains uncertain.
INDONESIA RBC There are no known planned developments to the existing framework.
MALAYSIA RBC BNM has initiated a review of its current RBC framework, which has been conducted in phases since
2018. The first phase will focus on reviewing the prudential limits on assets and counterparty exposures,
followed by a review of the standards for the valuation of liabilities and capital adequacy components.
The exact timing of updated rules remains uncertain.
MILLIMAN RESEARCH REPORT
Life insurance capital regimes in Asia 13 July 2019
CAPITAL REGIME FUTURE DEVELOPMENTS
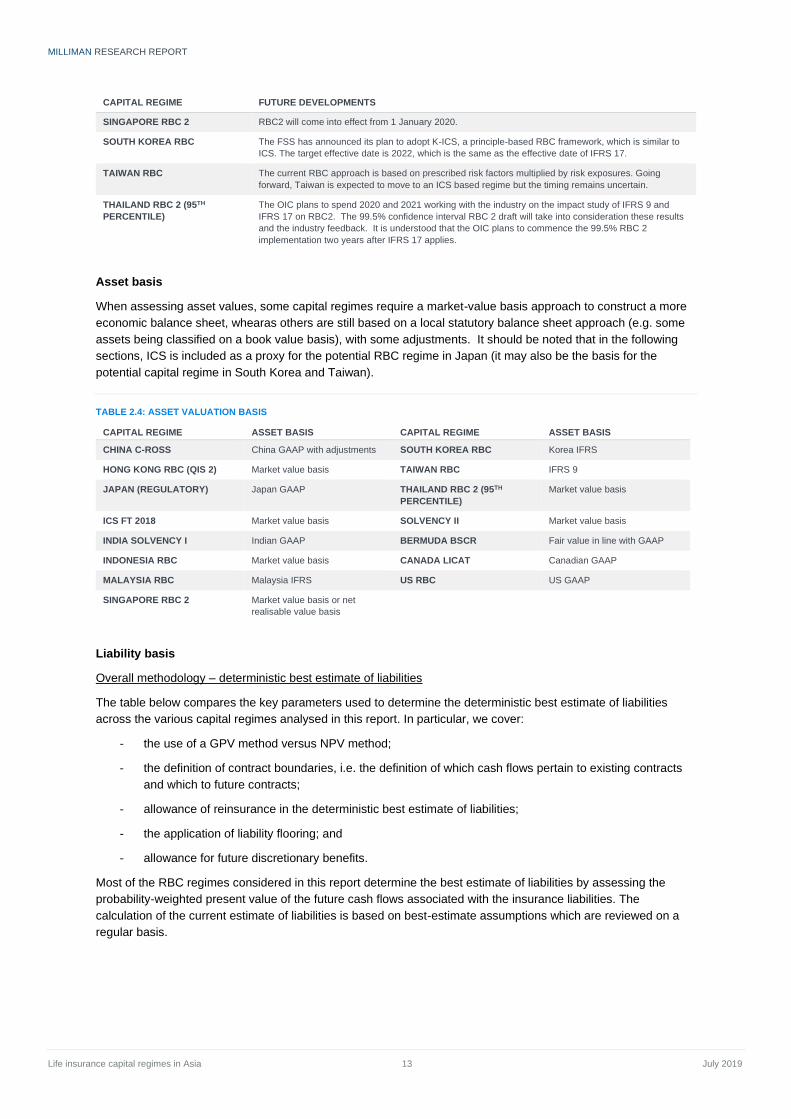
SINGAPORE RBC 2 RBC2 will come into effect from 1 January 2020.
SOUTH KOREA RBC The FSS has announced its plan to adopt K-ICS, a principle-based RBC framework, which is similar to
ICS. The target effective date is 2022, which is the same as the effective date of IFRS 17.
TAIWAN RBC The current RBC approach is based on prescribed risk factors multiplied by risk exposures. Going
forward, Taiwan is expected to move to an ICS based regime but the timing remains uncertain.
THAILAND RBC 2 (95TH
PERCENTILE)
The OIC plans to spend 2020 and 2021 working with the industry on the impact study of IFRS 9 and
IFRS 17 on RBC2. The 99.5% confidence interval RBC 2 draft will take into consideration these results
and the industry feedback. It is understood that the OIC plans to commence the 99.5% RBC 2
implementation two years after IFRS 17 applies.
Asset basis
When assessing asset values, some capital regimes require a market-value basis approach to construct a more
economic balance sheet, whearas others are still based on a local statutory balance sheet approach (e.g. some
assets being classified on a book value basis), with some adjustments. It should be noted that in the following
sections, ICS is included as a proxy for the potential RBC regime in Japan (it may also be the basis for the
potential capital regime in South Korea and Taiwan).
TABLE 2.4: ASSET VALUATION BASIS
CAPITAL REGIME ASSET BASIS CAPITAL REGIME ASSET BASIS
CHINA C-ROSS China GAAP with adjustments SOUTH KOREA RBC Korea IFRS
HONG KONG RBC (QIS 2) Market value basis TAIWAN RBC IFRS 9
JAPAN (REGULATORY) Japan GAAP THAILAND RBC 2 (95TH
PERCENTILE)
Market value basis
ICS FT 2018 Market value basis SOLVENCY II Market value basis
INDIA SOLVENCY I Indian GAAP BERMUDA BSCR Fair value in line with GAAP
INDONESIA RBC Market value basis CANADA LICAT Canadian GAAP
MALAYSIA RBC Malaysia IFRS US RBC US GAAP
SINGAPORE RBC 2 Market value basis or net
realisable value basis
Liability basis
Overall methodology – deterministic best estimate of liabilities
The table below compares the key parameters used to determine the deterministic best estimate of liabilities
across the various capital regimes analysed in this report. In particular, we cover:
- the use of a GPV method versus NPV method;
- the definition of contract boundaries, i.e. the definition of which cash flows pertain to existing contracts
and which to future contracts;
- allowance of reinsurance in the deterministic best estimate of liabilities;
- the application of liability flooring; and
- allowance for future discretionary benefits.
Most of the RBC regimes considered in this report determine the best estimate of liabilities by assessing the
probability-weighted present value of the future cash flows associated with the insurance liabilities. The
calculation of the current estimate of liabilities is based on best-estimate assumptions which are reviewed on a
regular basis.
MILLIMAN RESEARCH REPORT
Life insurance capital regimes in Asia 14 July 2019
TABLE 2.5: APPROACH OF EVALUATION OF DETERMINISTIC INSURANCE LIABILITIES
CAPITAL REGIME GENERAL
APPROACH
CONTRACT BOUNDARY
LIABILITY FLOOR
FUTURE
DISCRETIONARY
BENEFIT
CHINA C-ROSS GPV Whole insurance contract
term
CSV less capital requirement Allowed
HONG KONG RBC (QIS 2) GPV Broadly in line with IFRS
17 except treatment on
Fund-on-deposit
None Allowed
JAPAN (REGULATORY) NPV No future contracts or
renewals
Reserves floored to zero at policy level Not allowed
ICS FT 2018 GPV No future contracts and
limited IF/renewal
None Allowed
INDIA SOLVENCY I GPV Full contract including
renewal
CSV (if there is a surrender value) or
reserves floored to zero at policy level
Allowed
INDONESIA RBC GPV Not explicitly mentioned Reserves floored to zero at policy level Allowed
MALAYSIA RBC GPV Contractual term with
adjustment
Reserves floored to zero at fund level Allowed
SINGAPORE RBC 2 GPV Contractual term with
adjustment
Reserves floored to zero at policy level
**
Allowed*
SOUTH KOREA RBC NPV No future contracts or
renewals
Reserves floored to zero at policy level Not allowed
TAIWAN RBC NPV N/A Reserves floored to zero at product
level
Not allowed
THAILAND RBC 2 (95TH
PERCENTILE)
GPV N/A Reserves floored to zero at product
level
Not explicitly
mentioned
SOLVENCY II GPV In line with IFRS 17 None Allowed
BERMUDA BSCR GPV Till expire / reassessment None Allowed
CANADA LICAT GPV In line with Canadian
GAAP
Cap on credit taken for negative
reserves and if CSV greater than
reserves
Not explicitly
mentioned
US RBC NPV Full contract including
renewal
Reserves floored to zero at policy level Not allowed
* Provision for future discretionary benefits allowed for the purpose of calculating statutory reserves but not for the purpose of calculating capital
requirements
**RBC2 regime continues to floor policy reserves to zero but recognises negative reserves as a reduction to financial resources
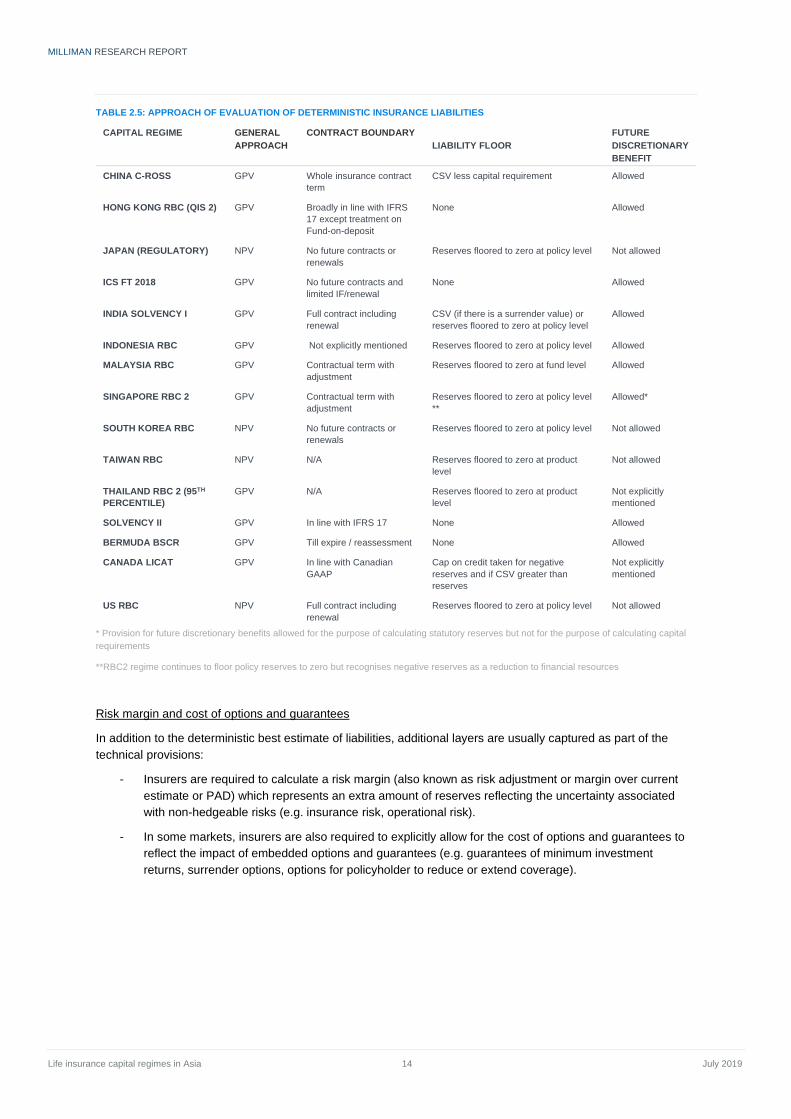
Risk margin and cost of options and guarantees
In addition to the deterministic best estimate of liabilities, additional layers are usually captured as part of the
technical provisions:
- Insurers are required to calculate a risk margin (also known as risk adjustment or margin over current
estimate or PAD) which represents an extra amount of reserves reflecting the uncertainty associated
with non-hedgeable risks (e.g. insurance risk, operational risk).
- In some markets, insurers are also required to explicitly allow for the cost of options and guarantees to
reflect the impact of embedded options and guarantees (e.g. guarantees of minimum investment
returns, surrender options, options for policyholder to reduce or extend coverage).
MILLIMAN RESEARCH REPORT
Life insurance capital regimes in Asia 15 July 2019
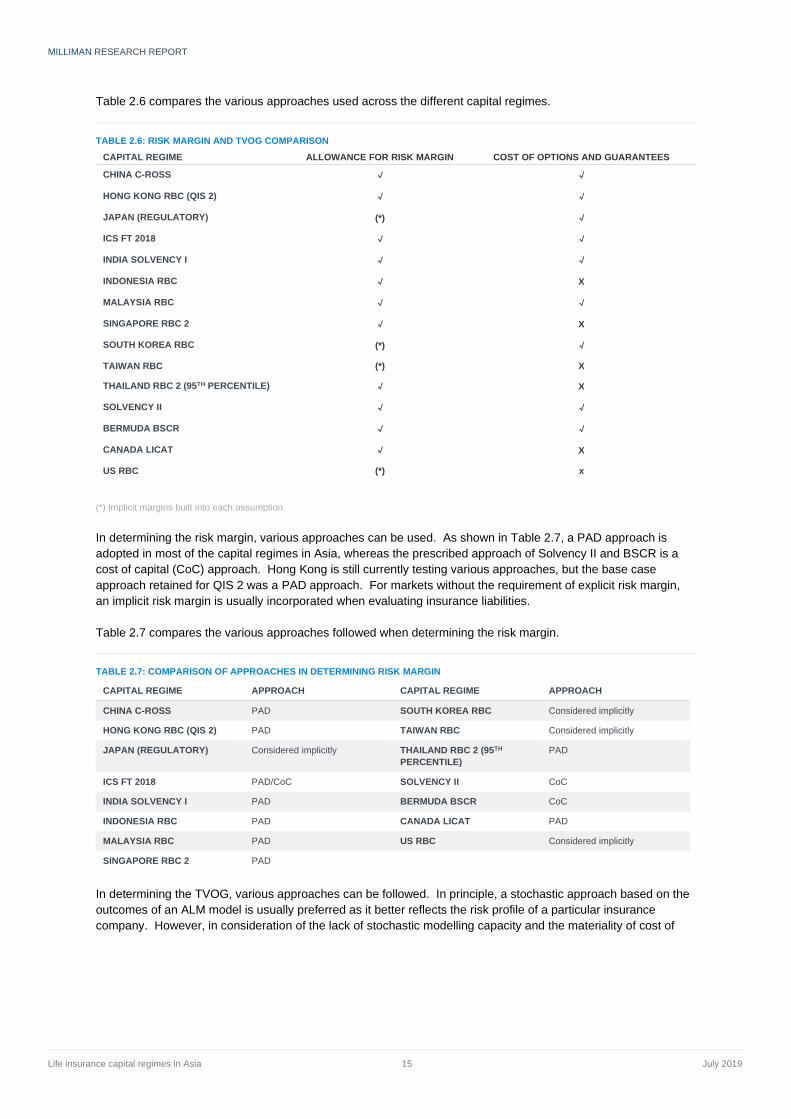
Table 2.6 compares the various approaches used across the different capital regimes.
TABLE 2.6: RISK MARGIN AND TVOG COMPARISON
CAPITAL REGIME ALLOWANCE FOR RISK MARGIN COST OF OPTIONS AND GUARANTEES
CHINA C-ROSS √ √
HONG KONG RBC (QIS 2) √ √
JAPAN (REGULATORY) (*) √
ICS FT 2018 √ √
INDIA SOLVENCY I √ √
INDONESIA RBC √ X
MALAYSIA RBC √ √
SINGAPORE RBC 2 √ X
SOUTH KOREA RBC (*) √
TAIWAN RBC (*) X
THAILAND RBC 2 (95TH PERCENTILE) √ X
SOLVENCY II √ √
BERMUDA BSCR √ √
CANADA LICAT √ X
US RBC (*) x
(*) Implicit margins built into each assumption
In determining the risk margin, various approaches can be used. As shown in Table 2.7, a PAD approach is
adopted in most of the capital regimes in Asia, whereas the prescribed approach of Solvency II and BSCR is a
cost of capital (CoC) approach. Hong Kong is still currently testing various approaches, but the base case
approach retained for QIS 2 was a PAD approach. For markets without the requirement of explicit risk margin,
an implicit risk margin is usually incorporated when evaluating insurance liabilities.
Table 2.7 compares the various approaches followed when determining the risk margin.
TABLE 2.7: COMPARISON OF APPROACHES IN DETERMINING RISK MARGIN
CAPITAL REGIME APPROACH CAPITAL REGIME APPROACH
CHINA C-ROSS PAD SOUTH KOREA RBC Considered implicitly
HONG KONG RBC (QIS 2) PAD TAIWAN RBC Considered implicitly
JAPAN (REGULATORY) Considered implicitly THAILAND RBC 2 (95TH
PERCENTILE)
PAD
ICS FT 2018 PAD/CoC SOLVENCY II CoC
INDIA SOLVENCY I PAD BERMUDA BSCR CoC
INDONESIA RBC PAD CANADA LICAT PAD
MALAYSIA RBC PAD US RBC Considered implicitly
SINGAPORE RBC 2 PAD
In determining the TVOG, various approaches can be followed. In principle, a stochastic approach based on the
outcomes of an ALM model is usually preferred as it better reflects the risk profile of a particular insurance
company. However, in consideration of the lack of stochastic modelling capacity and the materiality of cost of
MILLIMAN RESEARCH REPORT
Life insurance capital regimes in Asia 16 July 2019
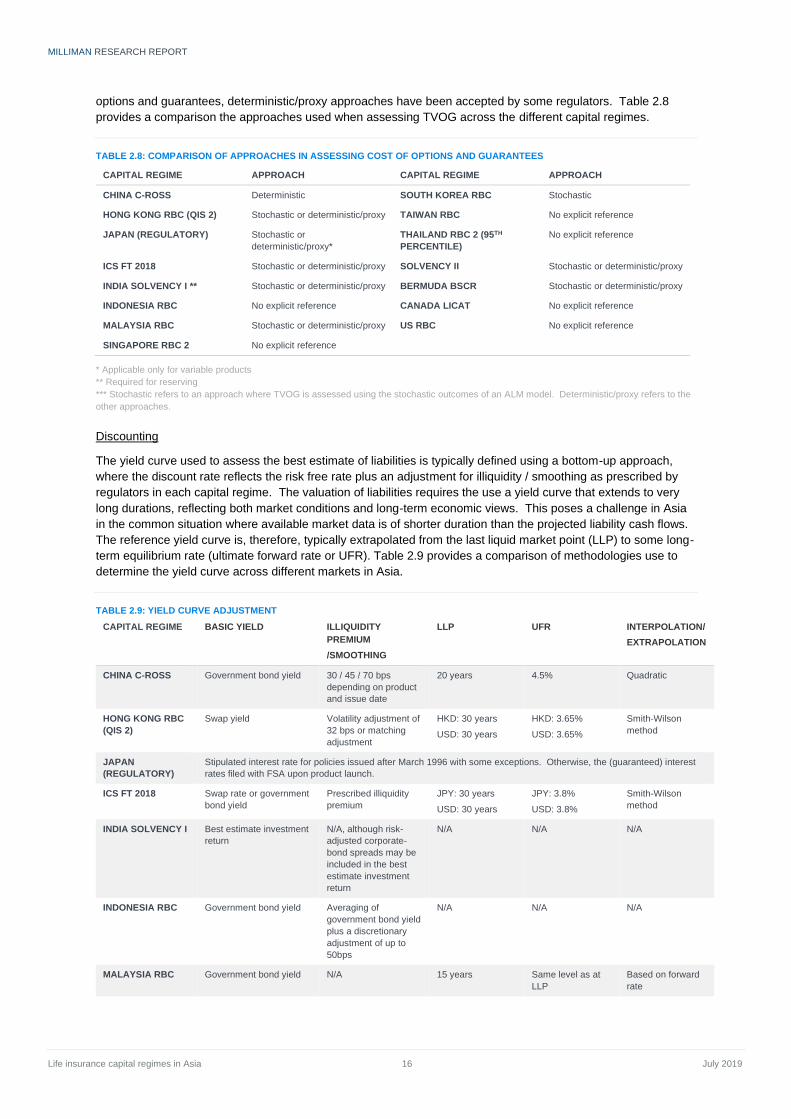
options and guarantees, deterministic/proxy approaches have been accepted by some regulators. Table 2.8
provides a comparison the approaches used when assessing TVOG across the different capital regimes.
TABLE 2.8: COMPARISON OF APPROACHES IN ASSESSING COST OF OPTIONS AND GUARANTEES
CAPITAL REGIME APPROACH CAPITAL REGIME APPROACH
CHINA C-ROSS Deterministic SOUTH KOREA RBC Stochastic
HONG KONG RBC (QIS 2) Stochastic or deterministic/proxy TAIWAN RBC No explicit reference
JAPAN (REGULATORY) Stochastic or
deterministic/proxy*
THAILAND RBC 2 (95TH
PERCENTILE)
No explicit reference
ICS FT 2018 Stochastic or deterministic/proxy SOLVENCY II Stochastic or deterministic/proxy
INDIA SOLVENCY I ** Stochastic or deterministic/proxy BERMUDA BSCR Stochastic or deterministic/proxy
INDONESIA RBC No explicit reference CANADA LICAT No explicit reference
MALAYSIA RBC Stochastic or deterministic/proxy US RBC No explicit reference
SINGAPORE RBC 2 No explicit reference
* Applicable only for variable products
** Required for reserving
*** Stochastic refers to an approach where TVOG is assessed using the stochastic outcomes of an ALM model. Deterministic/proxy refers to the
other approaches.
Discounting
The yield curve used to assess the best estimate of liabilities is typically defined using a bottom-up approach,
where the discount rate reflects the risk free rate plus an adjustment for illiquidity / smoothing as prescribed by
regulators in each capital regime. The valuation of liabilities requires the use a yield curve that extends to very
long durations, reflecting both market conditions and long-term economic views. This poses a challenge in Asia
in the common situation where available market data is of shorter duration than the projected liability cash flows.
The reference yield curve is, therefore, typically extrapolated from the last liquid market point (LLP) to some long-
term equilibrium rate (ultimate forward rate or UFR). Table 2.9 provides a comparison of methodologies use to
determine the yield curve across different markets in Asia.
TABLE 2.9: YIELD CURVE ADJUSTMENT
CAPITAL REGIME BASIC YIELD ILLIQUIDITY
PREMIUM
/SMOOTHING
LLP UFR INTERPOLATION/
EXTRAPOLATION
CHINA C-ROSS Government bond yield 30 / 45 / 70 bps
depending on product
and issue date
20 years 4.5% Quadratic
HONG KONG RBC
(QIS 2)
Swap yield Volatility adjustment of
32 bps or matching
adjustment
HKD: 30 years
USD: 30 years
HKD: 3.65%
USD: 3.65%
Smith-Wilson
method
JAPAN
(REGULATORY)
Stipulated interest rate for policies issued after March 1996 with some exceptions. Otherwise, the (guaranteed) interest
rates filed with FSA upon product launch.
ICS FT 2018 Swap rate or government
bond yield
Prescribed illiquidity
premium
JPY: 30 years
USD: 30 years
JPY: 3.8%
USD: 3.8%
Smith-Wilson
method
INDIA SOLVENCY I Best estimate investment
return
N/A, although risk-
adjusted corporate-
bond spreads may be
included in the best
estimate investment
return
N/A N/A N/A
INDONESIA RBC Government bond yield Averaging of
government bond yield
plus a discretionary
adjustment of up to
50bps
N/A N/A N/A
MALAYSIA RBC Government bond yield N/A 15 years Same level as at
LLP
Based on forward
rate
MILLIMAN RESEARCH REPORT
Life insurance capital regimes in Asia 17 July 2019
CAPITAL REGIME BASIC YIELD ILLIQUIDITY
PREMIUM
/SMOOTHING
LLP UFR INTERPOLATION/
EXTRAPOLATION
SINGAPORE RBC 2 Government bond yield Allowance for illiquidity
premium or matching
adjustment
SGD : 20 years
USD: 30 years
SGD : 3.8%
USD: 3.8%
Smith-Wilson
method
SOUTH KOREA
RBC
Assumed (guaranteed)
interest rates filed with
FSS at a product launch.
N/A N/A N/A N/A
TAIWAN RBC US government bond
yield
N/A N/A N/A N/A
THAILAND RBC 2
(95TH PERCENTILE)
Government bond yield Averaging of
government bond yield
50 years Same level as at
LLP N/A
SOLVENCY II Swap rate or government
bond yield
Volatility adjustment or
matching adjustment
Euro: 20 years
USD: 50 years
4.2% Smith-Wilson
method
BERMUDA BSCR Swap rate Discretionary 30 4.2% Different
approaches
CANADA LICAT Canadian statutory rate N/A N/A N/A URR (unexpired
risk reserve)
US RBC Net asset earned rates
with prescribed asset
spreads
N/A N/A N/A N/A
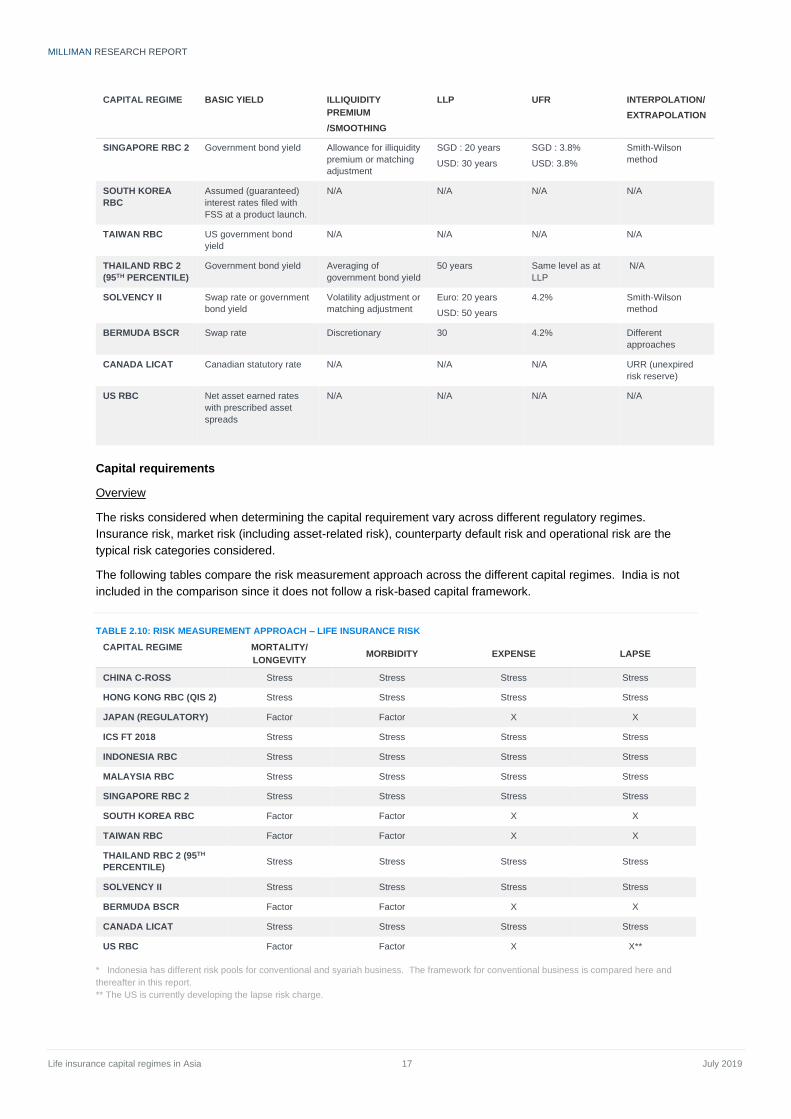
Capital requirements
Overview
The risks considered when determining the capital requirement vary across different regulatory regimes.
Insurance risk, market risk (including asset-related risk), counterparty default risk and operational risk are the
typical risk categories considered.
The following tables compare the risk measurement approach across the different capital regimes. India is not
included in the comparison since it does not follow a risk-based capital framework.
TABLE 2.10: RISK MEASUREMENT APPROACH – LIFE INSURANCE RISK
CAPITAL REGIME MORTALITY/
LONGEVITY MORBIDITY EXPENSE LAPSE
CHINA C-ROSS Stress Stress Stress Stress
HONG KONG RBC (QIS 2) Stress Stress Stress Stress
JAPAN (REGULATORY) Factor Factor X X
ICS FT 2018 Stress Stress Stress Stress
INDONESIA RBC Stress Stress Stress Stress
MALAYSIA RBC Stress Stress Stress Stress
SINGAPORE RBC 2 Stress Stress Stress Stress
SOUTH KOREA RBC Factor Factor X X
TAIWAN RBC Factor Factor X X
THAILAND RBC 2 (95TH
PERCENTILE) Stress Stress Stress Stress
SOLVENCY II Stress Stress Stress Stress
BERMUDA BSCR Factor Factor X X
CANADA LICAT Stress Stress Stress Stress
US RBC Factor Factor X X**
* Indonesia has different risk pools for conventional and syariah business. The framework for conventional business is compared here and
thereafter in this report.
** The US is currently developing the lapse risk charge.
MILLIMAN RESEARCH REPORT
Life insurance capital regimes in Asia 18 July 2019
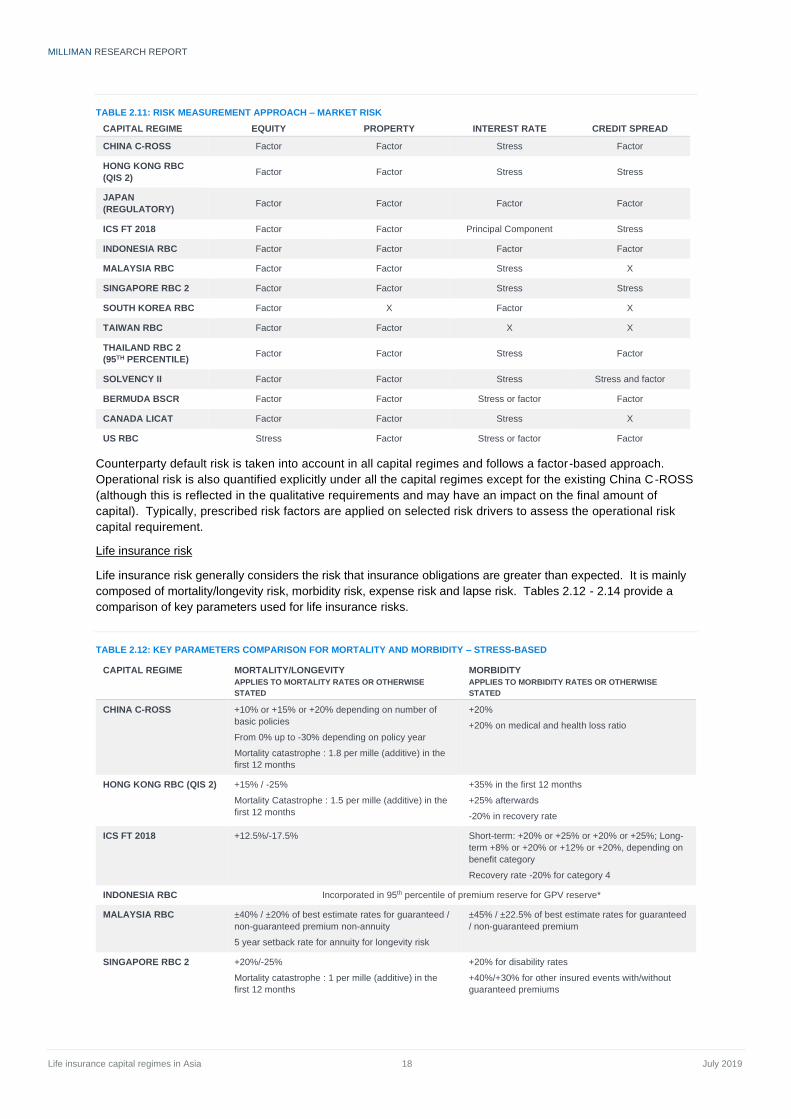
TABLE 2.11: RISK MEASUREMENT APPROACH – MARKET RISK
CAPITAL REGIME EQUITY PROPERTY INTEREST RATE CREDIT SPREAD
CHINA C-ROSS Factor Factor Stress Factor
HONG KONG RBC
(QIS 2) Factor Factor Stress Stress
JAPAN
(REGULATORY) Factor Factor Factor Factor
ICS FT 2018 Factor Factor Principal Component Stress
INDONESIA RBC Factor Factor Factor Factor
MALAYSIA RBC Factor Factor Stress X
SINGAPORE RBC 2 Factor Factor Stress Stress
SOUTH KOREA RBC Factor X Factor X
TAIWAN RBC Factor Factor X X
THAILAND RBC 2
(95TH PERCENTILE) Factor Factor Stress Factor
SOLVENCY II Factor Factor Stress Stress and factor
BERMUDA BSCR Factor Factor Stress or factor Factor
CANADA LICAT Factor Factor Stress X
US RBC Stress Factor Stress or factor Factor
Counterparty default risk is taken into account in all capital regimes and follows a factor-based approach.
Operational risk is also quantified explicitly under all the capital regimes except for the existing China C-ROSS
(although this is reflected in the qualitative requirements and may have an impact on the final amount of
capital). Typically, prescribed risk factors are applied on selected risk drivers to assess the operational risk
capital requirement.
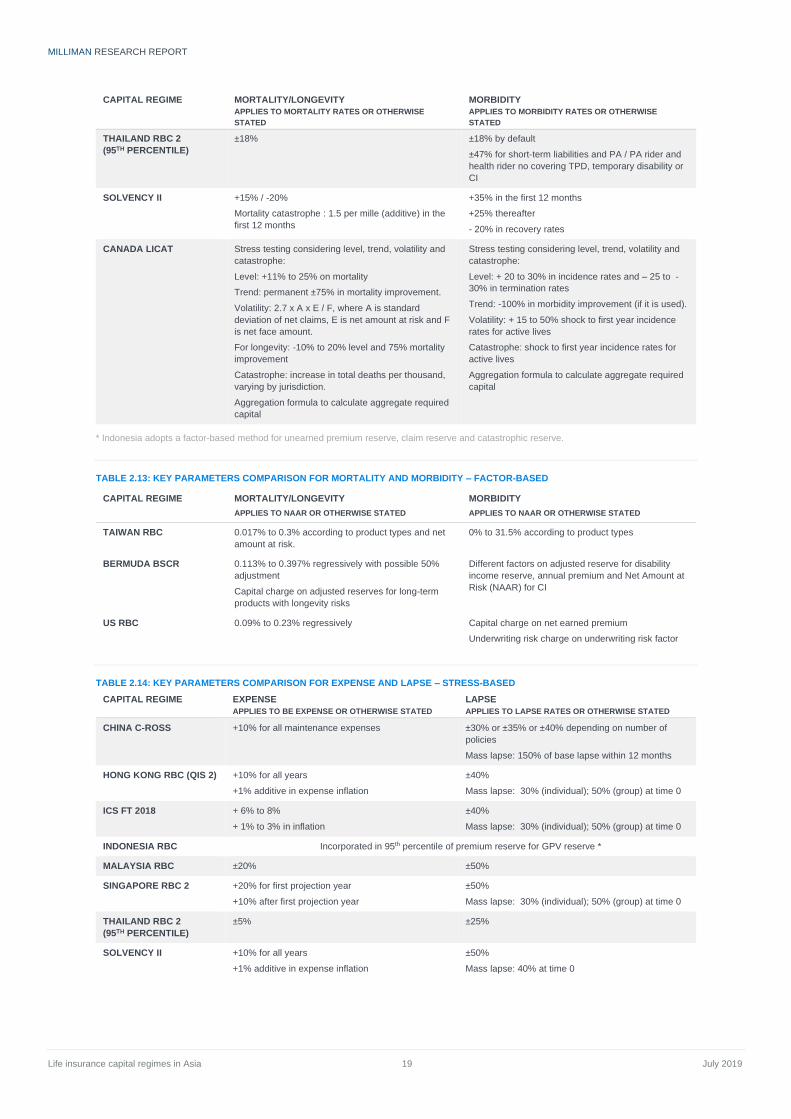
Life insurance risk
Life insurance risk generally considers the risk that insurance obligations are greater than expected. It is mainly
composed of mortality/longevity risk, morbidity risk, expense risk and lapse risk. Tables 2.12 - 2.14 provide a
comparison of key parameters used for life insurance risks.
TABLE 2.12: KEY PARAMETERS COMPARISON FOR MORTALITY AND MORBIDITY – STRESS-BASED
CAPITAL REGIME MORTALITY/LONGEVITY
APPLIES TO MORTALITY RATES OR OTHERWISE
STATED
MORBIDITY
APPLIES TO MORBIDITY RATES OR OTHERWISE
STATED
CHINA C-ROSS +10% or +15% or +20% depending on number of
basic policies
From 0% up to -30% depending on policy year
Mortality catastrophe : 1.8 per mille (additive) in the
first 12 months
+20%
+20% on medical and health loss ratio
HONG KONG RBC (QIS 2) +15% / -25%
Mortality Catastrophe : 1.5 per mille (additive) in the
first 12 months
+35% in the first 12 months
+25% afterwards
-20% in recovery rate
ICS FT 2018 +12.5%/-17.5% Short-term: +20% or +25% or +20% or +25%; Long-
term +8% or +20% or +12% or +20%, depending on
benefit category
Recovery rate -20% for category 4
INDONESIA RBC Incorporated in 95th percentile of premium reserve for GPV reserve*
MALAYSIA RBC ±40% / ±20% of best estimate rates for guaranteed /
non-guaranteed premium non-annuity
5 year setback rate for annuity for longevity risk
±45% / ±22.5% of best estimate rates for guaranteed
/ non-guaranteed premium
SINGAPORE RBC 2 +20%/-25%
Mortality catastrophe : 1 per mille (additive) in the
first 12 months
+20% for disability rates
+40%/+30% for other insured events with/without
guaranteed premiums
MILLIMAN RESEARCH REPORT
Life insurance capital regimes in Asia 19 July 2019
CAPITAL REGIME MORTALITY/LONGEVITY
APPLIES TO MORTALITY RATES OR OTHERWISE
STATED
MORBIDITY
APPLIES TO MORBIDITY RATES OR OTHERWISE
STATED
THAILAND RBC 2
(95TH PERCENTILE)
±18% ±18% by default
±47% for short-term liabilities and PA / PA rider and
health rider no covering TPD, temporary disability or
CI
SOLVENCY II +15% / -20%
Mortality catastrophe : 1.5 per mille (additive) in the
first 12 months
+35% in the first 12 months
+25% thereafter
- 20% in recovery rates
CANADA LICAT Stress testing considering level, trend, volatility and
catastrophe:
Level: +11% to 25% on mortality
Trend: permanent ±75% in mortality improvement.
Volatility: 2.7 x A x E / F, where A is standard
deviation of net claims, E is net amount at risk and F
is net face amount.
For longevity: -10% to 20% level and 75% mortality
improvement
Catastrophe: increase in total deaths per thousand,
varying by jurisdiction.
Aggregation formula to calculate aggregate required
capital
Stress testing considering level, trend, volatility and
catastrophe:
Level: + 20 to 30% in incidence rates and – 25 to -
30% in termination rates
Trend: -100% in morbidity improvement (if it is used).
Volatility: + 15 to 50% shock to first year incidence
rates for active lives
Catastrophe: shock to first year incidence rates for
active lives
Aggregation formula to calculate aggregate required
capital
* Indonesia adopts a factor-based method for unearned premium reserve, claim reserve and catastrophic reserve.
TABLE 2.13: KEY PARAMETERS COMPARISON FOR MORTALITY AND MORBIDITY – FACTOR-BASED
CAPITAL REGIME MORTALITY/LONGEVITY
APPLIES TO NAAR OR OTHERWISE STATED
MORBIDITY
APPLIES TO NAAR OR OTHERWISE STATED
TAIWAN RBC 0.017% to 0.3% according to product types and net
amount at risk.
0% to 31.5% according to product types
BERMUDA BSCR 0.113% to 0.397% regressively with possible 50%
adjustment
Capital charge on adjusted reserves for long-term
products with longevity risks
Different factors on adjusted reserve for disability
income reserve, annual premium and Net Amount at
Risk (NAAR) for CI
US RBC 0.09% to 0.23% regressively Capital charge on net earned premium
Underwriting risk charge on underwriting risk factor
TABLE 2.14: KEY PARAMETERS COMPARISON FOR EXPENSE AND LAPSE – STRESS-BASED
CAPITAL REGIME EXPENSE
APPLIES TO BE EXPENSE OR OTHERWISE STATED
LAPSE
APPLIES TO LAPSE RATES OR OTHERWISE STATED
CHINA C-ROSS +10% for all maintenance expenses
±30% or ±35% or ±40% depending on number of
policies
Mass lapse: 150% of base lapse within 12 months
HONG KONG RBC (QIS 2) +10% for all years
+1% additive in expense inflation
±40%
Mass lapse: 30% (individual); 50% (group) at time 0
ICS FT 2018 + 6% to 8%
+ 1% to 3% in inflation
±40%
Mass lapse: 30% (individual); 50% (group) at time 0
INDONESIA RBC Incorporated in 95th percentile of premium reserve for GPV reserve *
MALAYSIA RBC ±20% ±50%
SINGAPORE RBC 2 +20% for first projection year
+10% after first projection year
±50%
Mass lapse: 30% (individual); 50% (group) at time 0
THAILAND RBC 2
(95TH PERCENTILE)
±5% ±25%
SOLVENCY II +10% for all years
+1% additive in expense inflation
±50%
Mass lapse: 40% at time 0
MILLIMAN RESEARCH REPORT
Life insurance capital regimes in Asia 20 July 2019
CAPITAL REGIME EXPENSE
APPLIES TO BE EXPENSE OR OTHERWISE STATED
LAPSE
APPLIES TO LAPSE RATES OR OTHERWISE STATED
CANADA LICAT +20% for first (projection) year
+10% after first (projection) year
Varies according to whether business is lapse-
sensitive or lapse-supported Stress testing
considering level, trend, volatility and catastrophe:
Level & trend: ± 30%
Volatility: 30% shock in the first year
Catastrophe: +20% for lapse sensitive and -40% for
lapse supported
Aggregation formula to calculate aggregate required
capital
* Indonesia adopts a factor-based method for unearned premium reserve, claim reserve and catastrophic reserve.
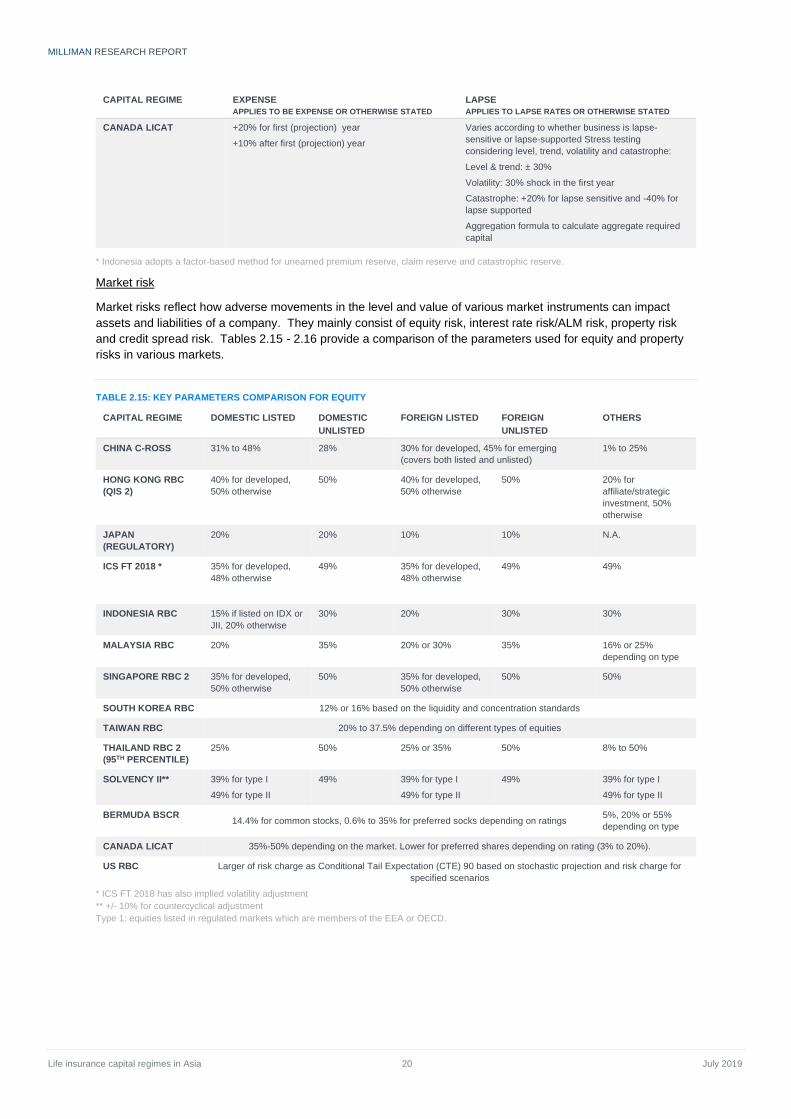
Market risk
Market risks reflect how adverse movements in the level and value of various market instruments can impact
assets and liabilities of a company. They mainly consist of equity risk, interest rate risk/ALM risk, property risk
and credit spread risk. Tables 2.15 - 2.16 provide a comparison of the parameters used for equity and property
risks in various markets.
TABLE 2.15: KEY PARAMETERS COMPARISON FOR EQUITY
CAPITAL REGIME DOMESTIC LISTED DOMESTIC
UNLISTED
FOREIGN LISTED FOREIGN
UNLISTED
OTHERS
CHINA C-ROSS 31% to 48% 28% 30% for developed, 45% for emerging
(covers both listed and unlisted)
1% to 25%
HONG KONG RBC
(QIS 2)
40% for developed,
50% otherwise
50% 40% for developed,
50% otherwise
50% 20% for
affiliate/strategic
investment, 50%
otherwise
JAPAN
(REGULATORY)
20% 20% 10% 10% N.A.
ICS FT 2018 * 35% for developed,
48% otherwise
49% 35% for developed,
48% otherwise
49% 49%
INDONESIA RBC 15% if listed on IDX or
JII, 20% otherwise
30% 20% 30% 30%
MALAYSIA RBC 20% 35% 20% or 30% 35% 16% or 25%
depending on type
SINGAPORE RBC 2 35% for developed,
50% otherwise
50% 35% for developed,
50% otherwise
50% 50%
SOUTH KOREA RBC 12% or 16% based on the liquidity and concentration standards
TAIWAN RBC 20% to 37.5% depending on different types of equities
THAILAND RBC 2
(95TH PERCENTILE)
25% 50% 25% or 35% 50% 8% to 50%
SOLVENCY II** 39% for type I
49% for type II
49% 39% for type I
49% for type II
49% 39% for type I
49% for type II
BERMUDA BSCR 14.4% for common stocks, 0.6% to 35% for preferred socks depending on ratings
5%, 20% or 55%
depending on type
CANADA LICAT 35%-50% depending on the market. Lower for preferred shares depending on rating (3% to 20%).
US RBC Larger of risk charge as Conditional Tail Expectation (CTE) 90 based on stochastic projection and risk charge for
specified scenarios
* ICS FT 2018 has also implied volatility adjustment
** +/- 10% for countercyclical adjustment
Type 1: equities listed in regulated markets which are members of the EEA or OECD.
MILLIMAN RESEARCH REPORT
Life insurance capital regimes in Asia 21 July 2019
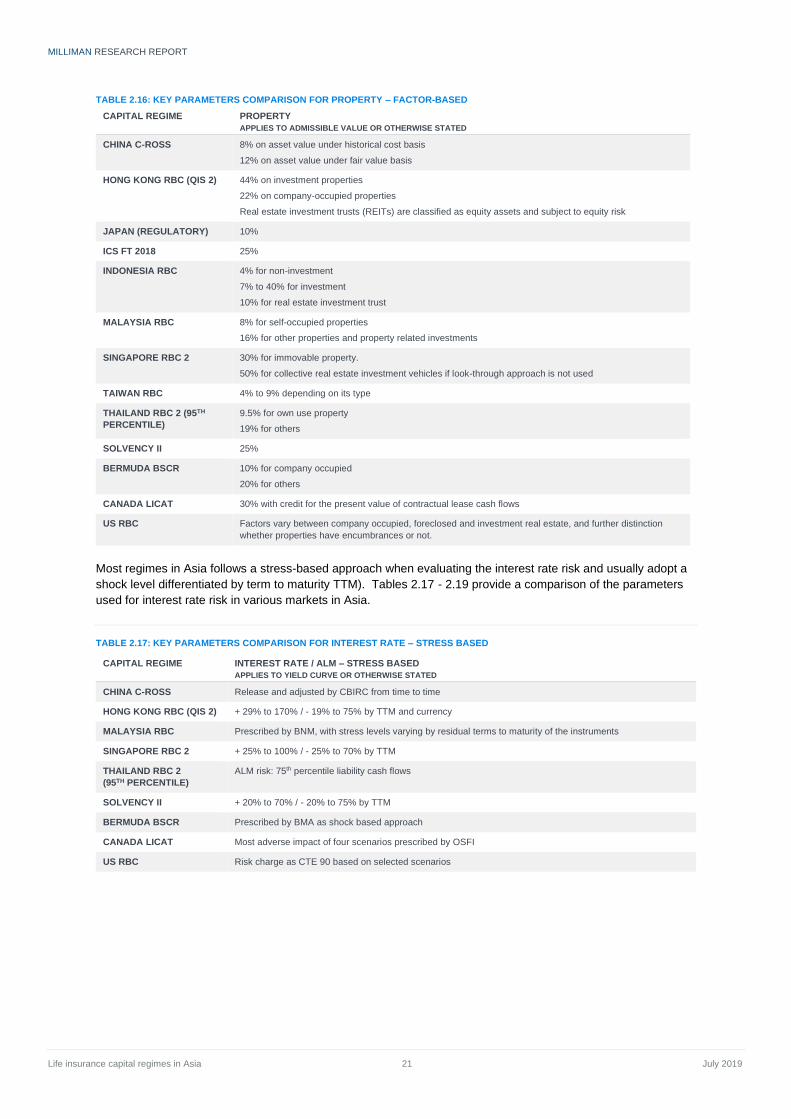
TABLE 2.16: KEY PARAMETERS COMPARISON FOR PROPERTY – FACTOR-BASED
CAPITAL REGIME PROPERTY
APPLIES TO ADMISSIBLE VALUE OR OTHERWISE STATED
CHINA C-ROSS 8% on asset value under historical cost basis
12% on asset value under fair value basis
HONG KONG RBC (QIS 2) 44% on investment properties
22% on company-occupied properties
Real estate investment trusts (REITs) are classified as equity assets and subject to equity risk
JAPAN (REGULATORY) 10%
ICS FT 2018 25%
INDONESIA RBC 4% for non-investment
7% to 40% for investment
10% for real estate investment trust
MALAYSIA RBC 8% for self-occupied properties
16% for other properties and property related investments
SINGAPORE RBC 2 30% for immovable property.
50% for collective real estate investment vehicles if look-through approach is not used
TAIWAN RBC 4% to 9% depending on its type
THAILAND RBC 2 (95TH
PERCENTILE)
9.5% for own use property
19% for others
SOLVENCY II 25%
BERMUDA BSCR 10% for company occupied
20% for others
CANADA LICAT 30% with credit for the present value of contractual lease cash flows
US RBC Factors vary between company occupied, foreclosed and investment real estate, and further distinction
whether properties have encumbrances or not.
Most regimes in Asia follows a stress-based approach when evaluating the interest rate risk and usually adopt a
shock level differentiated by term to maturity TTM). Tables 2.17 - 2.19 provide a comparison of the parameters
used for interest rate risk in various markets in Asia.
TABLE 2.17: KEY PARAMETERS COMPARISON FOR INTEREST RATE – STRESS BASED
CAPITAL REGIME INTEREST RATE / ALM – STRESS BASED
APPLIES TO YIELD CURVE OR OTHERWISE STATED
CHINA C-ROSS Release and adjusted by CBIRC from time to time
HONG KONG RBC (QIS 2) + 29% to 170% / - 19% to 75% by TTM and currency
MALAYSIA RBC Prescribed by BNM, with stress levels varying by residual terms to maturity of the instruments
SINGAPORE RBC 2 + 25% to 100% / - 25% to 70% by TTM
THAILAND RBC 2
(95TH PERCENTILE)
ALM risk: 75th percentile liability cash flows
SOLVENCY II + 20% to 70% / - 20% to 75% by TTM
BERMUDA BSCR Prescribed by BMA as shock based approach
CANADA LICAT Most adverse impact of four scenarios prescribed by OSFI
US RBC Risk charge as CTE 90 based on selected scenarios
MILLIMAN RESEARCH REPORT
Life insurance capital regimes in Asia 22 July 2019
TABLE 2.18: KEY PARAMETERS COMPARISON FOR INTEREST RATE – FACTOR-BASED & PRINCIPAL COMPONENT
CAPITAL REGIME INTEREST RATE / ALM – FACTOR-BASED
JAPAN (REGULATORY) Factors ranging from 0.01 to 1 times interest rate on policy reserve, depending on interest rate
ICS FT 2018 Yield curve risk is split in terms of two main components plus the mean reversion scenario
INDONESIA RBC 15% on the difference between the reported premium reserve and premium reserve assessed using risk free
rate, floored to zero*
SOUTH KOREA RBC ALM risk: consists of mismatch risk, minimum-guaranteed interest rate risk and negative interest-margin risk,
each follows a factor approach
Interest rate risk: factor of 0.9% times duration on balance sheet amount
BERMUDA BSCR 200 bps for duration based approach
US RBC Prescribed by NAIC
*This is a premium deficiency reserve to reflect difference between actual reserves held calculated using Appointed Actuary’s assumptions and
reserves held on risk free yields as prescribed in regulations
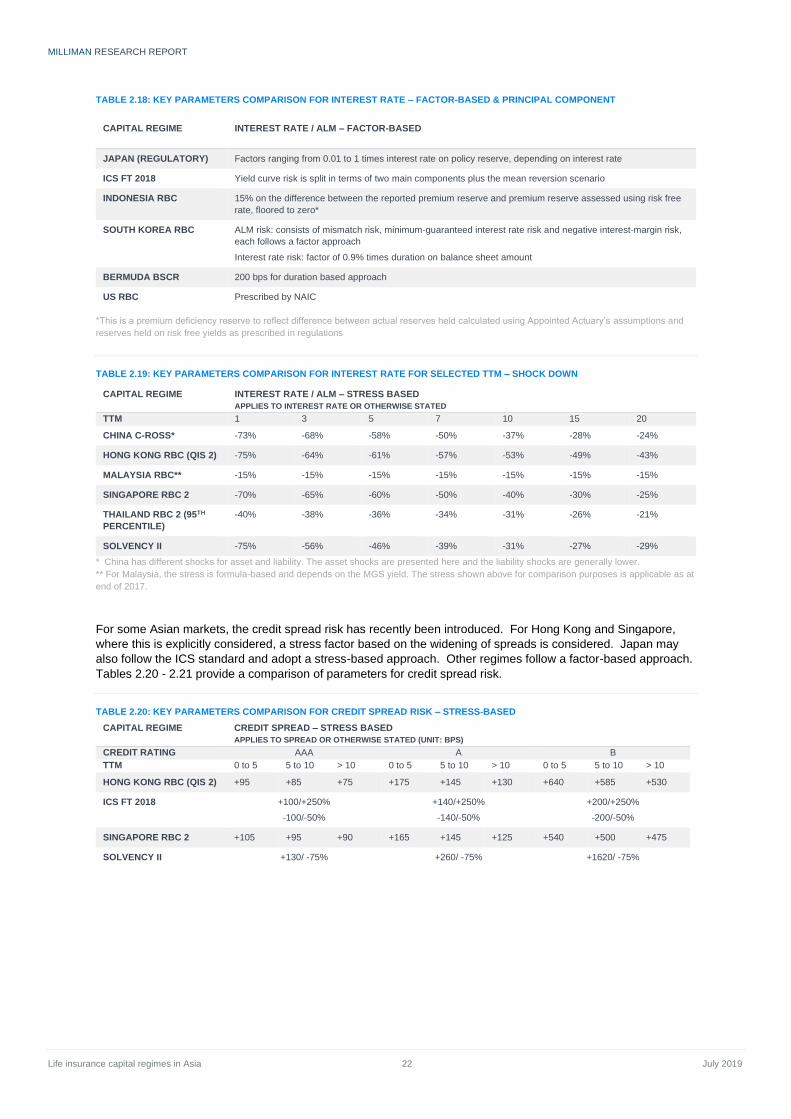
TABLE 2.19: KEY PARAMETERS COMPARISON FOR INTEREST RATE FOR SELECTED TTM – SHOCK DOWN
CAPITAL REGIME INTEREST RATE / ALM – STRESS BASED
APPLIES TO INTEREST RATE OR OTHERWISE STATED
TTM 1 3 5 7 10 15 20
CHINA C-ROSS* -73% -68% -58% -50% -37% -28% -24%
HONG KONG RBC (QIS 2) -75% -64% -61% -57% -53% -49% -43%
MALAYSIA RBC** -15% -15% -15% -15% -15% -15% -15%
SINGAPORE RBC 2 -70% -65% -60% -50% -40% -30% -25%
THAILAND RBC 2 (95TH
PERCENTILE)
-40% -38% -36% -34% -31% -26% -21%
SOLVENCY II -75% -56% -46% -39% -31% -27% -29%
* China has different shocks for asset and liability. The asset shocks are presented here and the liability shocks are generally lower.
** For Malaysia, the stress is formula-based and depends on the MGS yield. The stress shown above for comparison purposes is applicable as at
end of 2017.
For some Asian markets, the credit spread risk has recently been introduced. For Hong Kong and Singapore,
where this is explicitly considered, a stress factor based on the widening of spreads is considered. Japan may
also follow the ICS standard and adopt a stress-based approach. Other regimes follow a factor-based approach.
Tables 2.20 - 2.21 provide a comparison of parameters for credit spread risk.
TABLE 2.20: KEY PARAMETERS COMPARISON FOR CREDIT SPREAD RISK – STRESS-BASED
CAPITAL REGIME CREDIT SPREAD – STRESS BASED
APPLIES TO SPREAD OR OTHERWISE STATED (UNIT: BPS)
CREDIT RATING AAA A B
TTM 0 to 5 5 to 10 > 10 0 to 5 5 to 10 > 10 0 to 5 5 to 10 > 10
HONG KONG RBC (QIS 2) +95 +85 +75 +175 +145 +130 +640 +585 +530
ICS FT 2018 +100/+250%
-100/-50%
+140/+250%
-140/-50%
+200/+250%
-200/-50%
SINGAPORE RBC 2 +105 +95 +90 +165 +145 +125 +540 +500 +475
SOLVENCY II +130/ -75% +260/ -75% +1620/ -75%
MILLIMAN RESEARCH REPORT
Life insurance capital regimes in Asia 23 July 2019
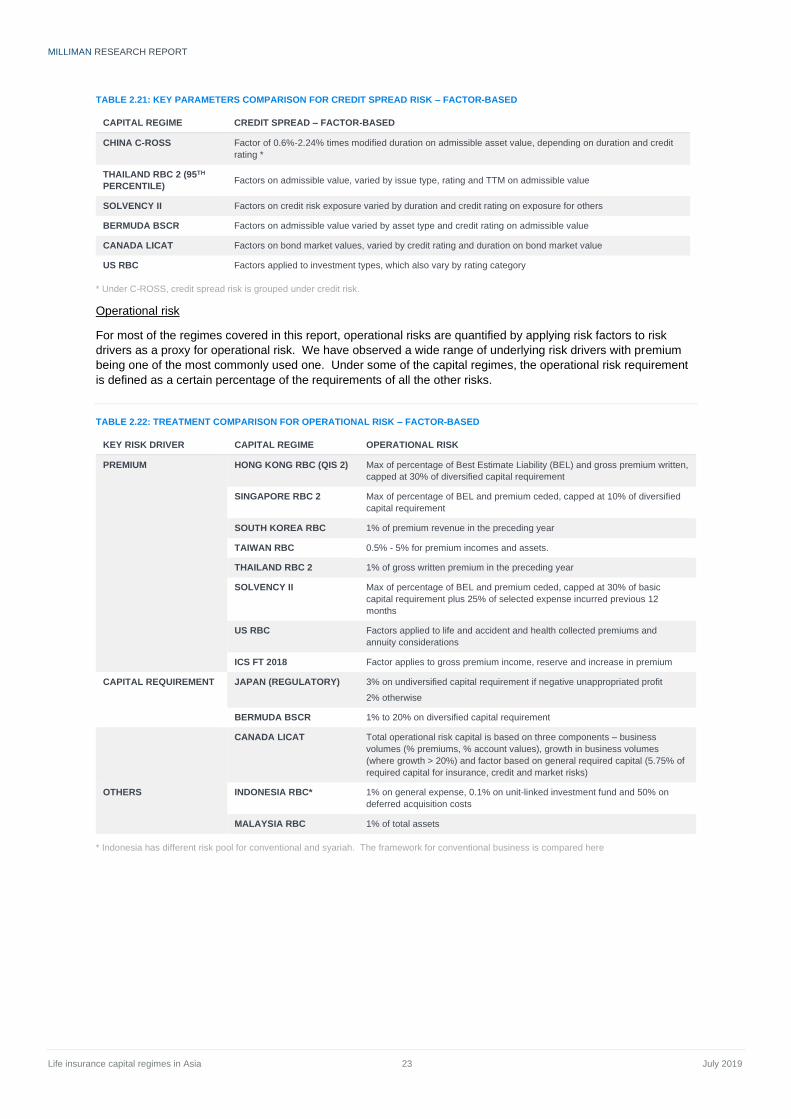
TABLE 2.21: KEY PARAMETERS COMPARISON FOR CREDIT SPREAD RISK – FACTOR-BASED
CAPITAL REGIME CREDIT SPREAD – FACTOR-BASED
CHINA C-ROSS Factor of 0.6%-2.24% times modified duration on admissible asset value, depending on duration and credit
rating *
THAILAND RBC 2 (95TH
PERCENTILE) Factors on admissible value, varied by issue type, rating and TTM on admissible value
SOLVENCY II Factors on credit risk exposure varied by duration and credit rating on exposure for others
BERMUDA BSCR Factors on admissible value varied by asset type and credit rating on admissible value
CANADA LICAT Factors on bond market values, varied by credit rating and duration on bond market value
US RBC Factors applied to investment types, which also vary by rating category
* Under C-ROSS, credit spread risk is grouped under credit risk.
Operational risk
For most of the regimes covered in this report, operational risks are quantified by applying risk factors to risk
drivers as a proxy for operational risk. We have observed a wide range of underlying risk drivers with premium
being one of the most commonly used one. Under some of the capital regimes, the operational risk requirement
is defined as a certain percentage of the requirements of all the other risks.
TABLE 2.22: TREATMENT COMPARISON FOR OPERATIONAL RISK – FACTOR-BASED
KEY RISK DRIVER CAPITAL REGIME OPERATIONAL RISK
PREMIUM HONG KONG RBC (QIS 2) Max of percentage of Best Estimate Liability (BEL) and gross premium written,
capped at 30% of diversified capital requirement
SINGAPORE RBC 2 Max of percentage of BEL and premium ceded, capped at 10% of diversified
capital requirement
SOUTH KOREA RBC 1% of premium revenue in the preceding year
TAIWAN RBC 0.5% - 5% for premium incomes and assets.
THAILAND RBC 2 1% of gross written premium in the preceding year
SOLVENCY II Max of percentage of BEL and premium ceded, capped at 30% of basic
capital requirement plus 25% of selected expense incurred previous 12
months
US RBC Factors applied to life and accident and health collected premiums and
annuity considerations
ICS FT 2018 Factor applies to gross premium income, reserve and increase in premium
CAPITAL REQUIREMENT JAPAN (REGULATORY) 3% on undiversified capital requirement if negative unappropriated profit
2% otherwise
BERMUDA BSCR 1% to 20% on diversified capital requirement
CANADA LICAT Total operational risk capital is based on three components – business
volumes (% premiums, % account values), growth in business volumes
(where growth > 20%) and factor based on general required capital (5.75% of
required capital for insurance, credit and market risks)
OTHERS INDONESIA RBC* 1% on general expense, 0.1% on unit-linked investment fund and 50% on
deferred acquisition costs
MALAYSIA RBC 1% of total assets
* Indonesia has different risk pool for conventional and syariah. The framework for conventional business is compared here
MILLIMAN RESEARCH REPORT
Life insurance capital regimes in Asia 24 July 2019
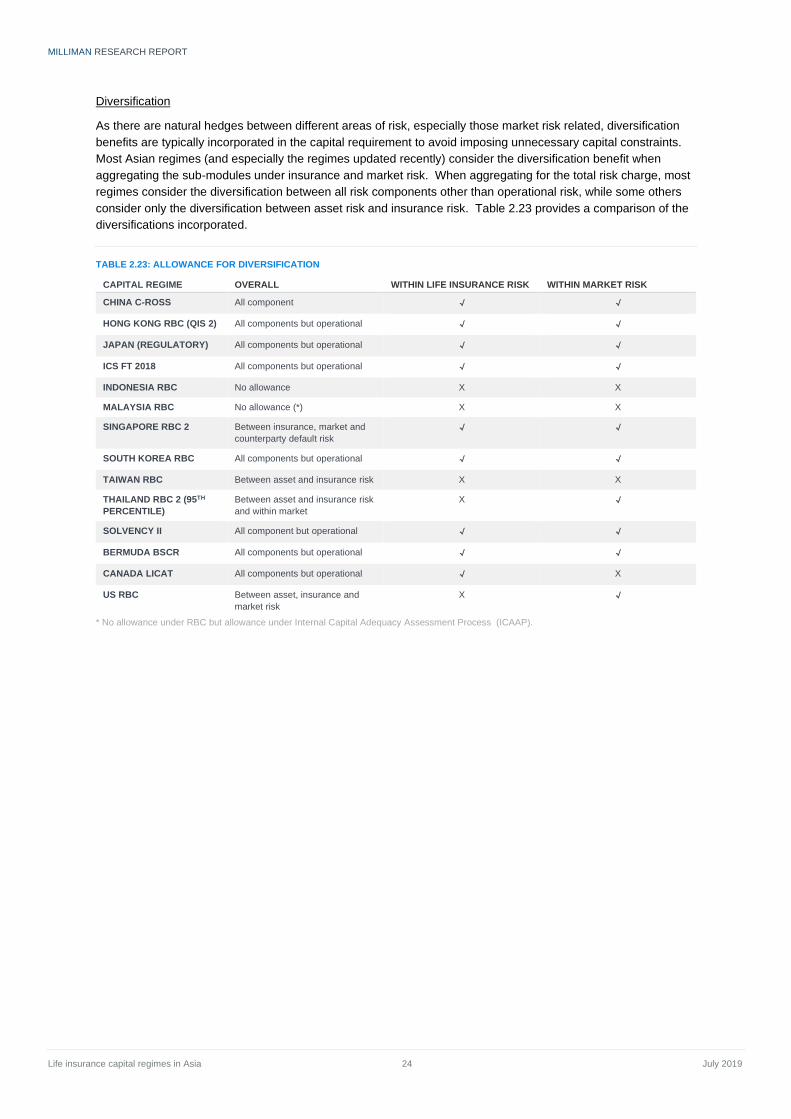
Diversification
As there are natural hedges between different areas of risk, especially those market risk related, diversification
benefits are typically incorporated in the capital requirement to avoid imposing unnecessary capital constraints.
Most Asian regimes (and especially the regimes updated recently) consider the diversification benefit when
aggregating the sub-modules under insurance and market risk. When aggregating for the total risk charge, most
regimes consider the diversification between all risk components other than operational risk, while some others
consider only the diversification between asset risk and insurance risk. Table 2.23 provides a comparison of the
diversifications incorporated.
TABLE 2.23: ALLOWANCE FOR DIVERSIFICATION
CAPITAL REGIME OVERALL WITHIN LIFE INSURANCE RISK WITHIN MARKET RISK
CHINA C-ROSS All component √ √
HONG KONG RBC (QIS 2) All components but operational √ √
JAPAN (REGULATORY) All components but operational √ √
ICS FT 2018 All components but operational √ √
INDONESIA RBC No allowance X X
MALAYSIA RBC No allowance (*) X X
SINGAPORE RBC 2 Between insurance, market and
counterparty default risk
√ √
SOUTH KOREA RBC All components but operational √ √
TAIWAN RBC Between asset and insurance risk X X
THAILAND RBC 2 (95TH
PERCENTILE)
Between asset and insurance risk
and within market
X √
SOLVENCY II All component but operational √ √
BERMUDA BSCR All components but operational √ √
CANADA LICAT All components but operational √ X
US RBC Between asset, insurance and
market risk
X √
* No allowance under RBC but allowance under Internal Capital Adequacy Assessment Process (ICAAP).
MILLIMAN RESEARCH REPORT
Life insurance capital regimes in Asia 25 July 2019
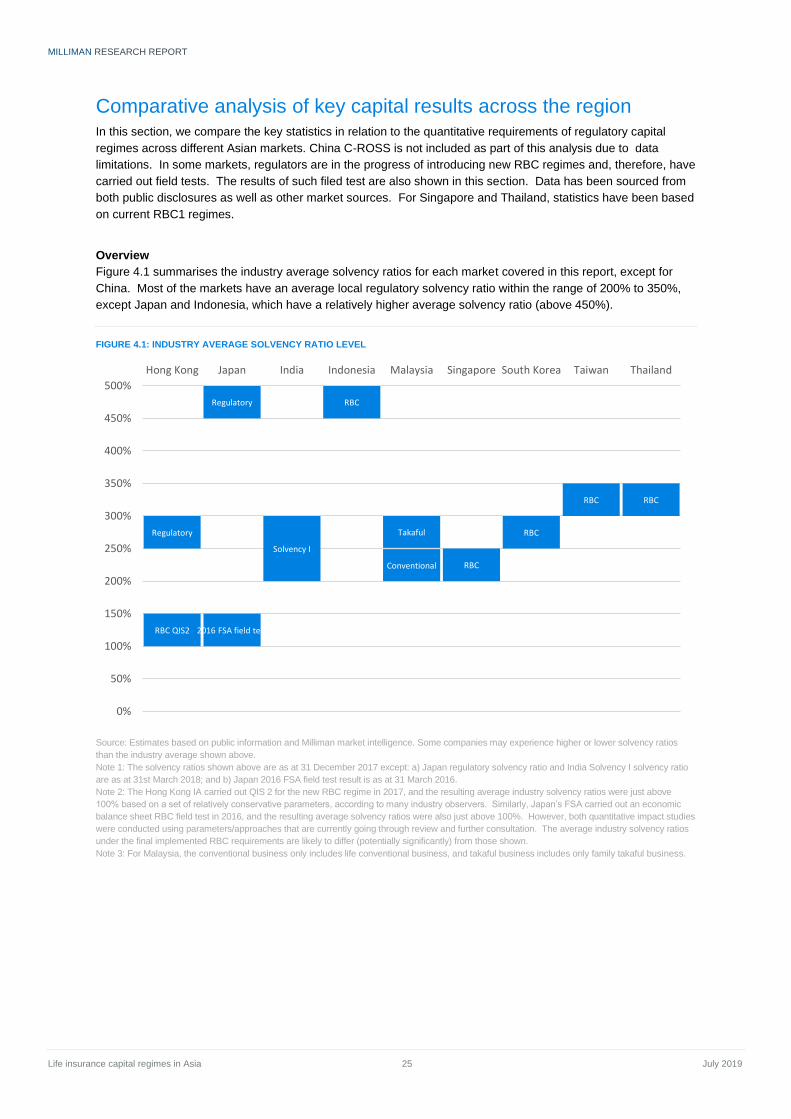
Comparative analysis of key capital results across the region In this section, we compare the key statistics in relation to the quantitative requirements of regulatory capital
regimes across different Asian markets. China C-ROSS is not included as part of this analysis due to data
limitations. In some markets, regulators are in the progress of introducing new RBC regimes and, therefore, have
carried out field tests. The results of such filed test are also shown in this section. Data has been sourced from
both public disclosures as well as other market sources. For Singapore and Thailand, statistics have been based
on current RBC1 regimes.
Overview
Figure 4.1 summarises the industry average solvency ratios for each market covered in this report, except for
China. Most of the markets have an average local regulatory solvency ratio within the range of 200% to 350%,
except Japan and Indonesia, which have a relatively higher average solvency ratio (above 450%).
FIGURE 4.1: INDUSTRY AVERAGE SOLVENCY RATIO LEVEL
Source: Estimates based on public information and Milliman market intelligence. Some companies may experience higher or lower solvency ratios
than the industry average shown above.
Note 1: The solvency ratios shown above are as at 31 December 2017 except: a) Japan regulatory solvency ratio and India Solvency I solvency ratio
are as at 31st March 2018; and b) Japan 2016 FSA field test result is as at 31 March 2016.
Note 2: The Hong Kong IA carried out QIS 2 for the new RBC regime in 2017, and the resulting average industry solvency ratios were just above
100% based on a set of relatively conservative parameters, according to many industry observers. Similarly, Japan’s FSA carried out an economic
balance sheet RBC field test in 2016, and the resulting average solvency ratios were also just above 100%. However, both quantitative impact studies
were conducted using parameters/approaches that are currently going through review and further consultation. The average industry solvency ratios
under the final implemented RBC requirements are likely to differ (potentially significantly) from those shown.
Note 3: For Malaysia, the conventional business only includes life conventional business, and takaful business includes only family takaful business.
RBC QIS2 2016 FSA field test
Solvency I
RBC
Conventional RBC
RBC
RBC RBC
Regulatory
Regulatory
Takaful
0%
50%
100%
150%
200%
250%
300%
350%
400%
450%
500%
Hong Kong Japan India Indonesia Malaysia Singapore South Korea Taiwan Thailand
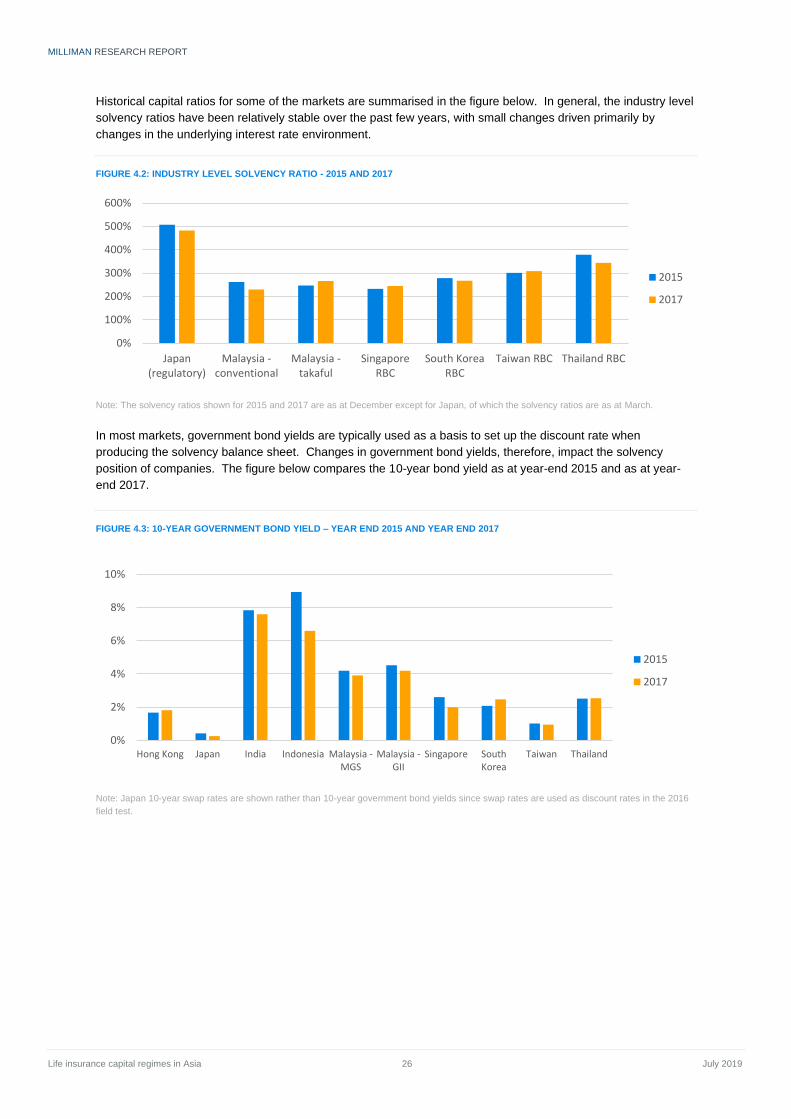
MILLIMAN RESEARCH REPORT
Life insurance capital regimes in Asia 26 July 2019
Historical capital ratios for some of the markets are summarised in the figure below. In general, the industry level
solvency ratios have been relatively stable over the past few years, with small changes driven primarily by
changes in the underlying interest rate environment.
FIGURE 4.2: INDUSTRY LEVEL SOLVENCY RATIO - 2015 AND 2017
Note: The solvency ratios shown for 2015 and 2017 are as at December except for Japan, of which the solvency ratios are as at March.
In most markets, government bond yields are typically used as a basis to set up the discount rate when
producing the solvency balance sheet. Changes in government bond yields, therefore, impact the solvency
position of companies. The figure below compares the 10-year bond yield as at year-end 2015 and as at year-
end 2017.
FIGURE 4.3: 10-YEAR GOVERNMENT BOND YIELD – YEAR END 2015 AND YEAR END 2017
Note: Japan 10-year swap rates are shown rather than 10-year government bond yields since swap rates are used as discount rates in the 2016
field test.
0%
100%
200%
300%
400%
500%
600%
Japan(regulatory)
Malaysia -conventional
Malaysia -takaful
SingaporeRBC
South KoreaRBC
Taiwan RBC Thailand RBC
2015
2017
0%
2%
4%
6%
8%
10%
Hong Kong Japan India Indonesia Malaysia -MGS
Malaysia -GII
Singapore SouthKorea
Taiwan Thailand
2015
2017
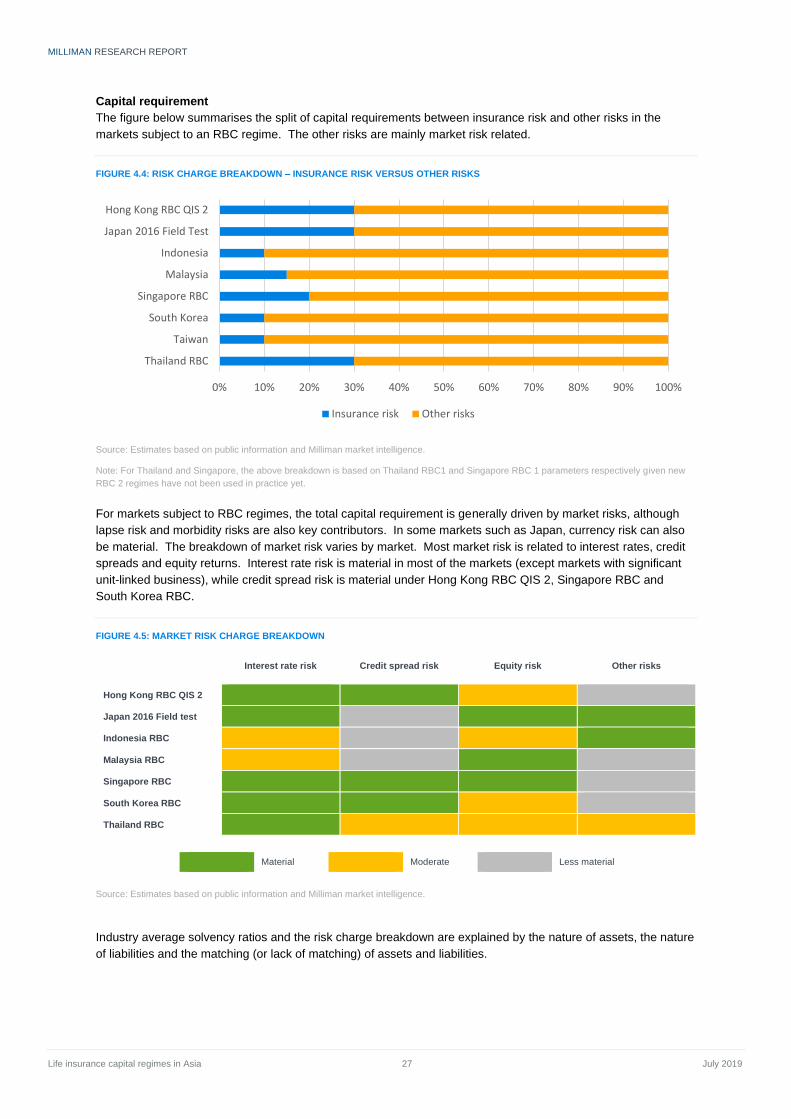
MILLIMAN RESEARCH REPORT
Life insurance capital regimes in Asia 27 July 2019
Capital requirement
The figure below summarises the split of capital requirements between insurance risk and other risks in the
markets subject to an RBC regime. The other risks are mainly market risk related.
FIGURE 4.4: RISK CHARGE BREAKDOWN – INSURANCE RISK VERSUS OTHER RISKS
Source: Estimates based on public information and Milliman market intelligence.
Note: For Thailand and Singapore, the above breakdown is based on Thailand RBC1 and Singapore RBC 1 parameters respectively given new
RBC 2 regimes have not been used in practice yet.
For markets subject to RBC regimes, the total capital requirement is generally driven by market risks, although
lapse risk and morbidity risks are also key contributors. In some markets such as Japan, currency risk can also
be material. The breakdown of market risk varies by market. Most market risk is related to interest rates, credit
spreads and equity returns. Interest rate risk is material in most of the markets (except markets with significant
unit-linked business), while credit spread risk is material under Hong Kong RBC QIS 2, Singapore RBC and
South Korea RBC.
FIGURE 4.5: MARKET RISK CHARGE BREAKDOWN
Interest rate risk Credit spread risk Equity risk Other risks
Hong Kong RBC QIS 2
Japan 2016 Field test
Indonesia RBC
Malaysia RBC
Singapore RBC
South Korea RBC
Thailand RBC
Material Moderate Less material
Source: Estimates based on public information and Milliman market intelligence.
Industry average solvency ratios and the risk charge breakdown are explained by the nature of assets, the nature
of liabilities and the matching (or lack of matching) of assets and liabilities.
0% 10% 20% 30% 40% 50% 60% 70% 80% 90% 100%
Hong Kong RBC QIS 2
Japan 2016 Field Test
Indonesia
Malaysia
Singapore RBC
South Korea
Taiwan
Thailand RBC
Insurance risk Other risks
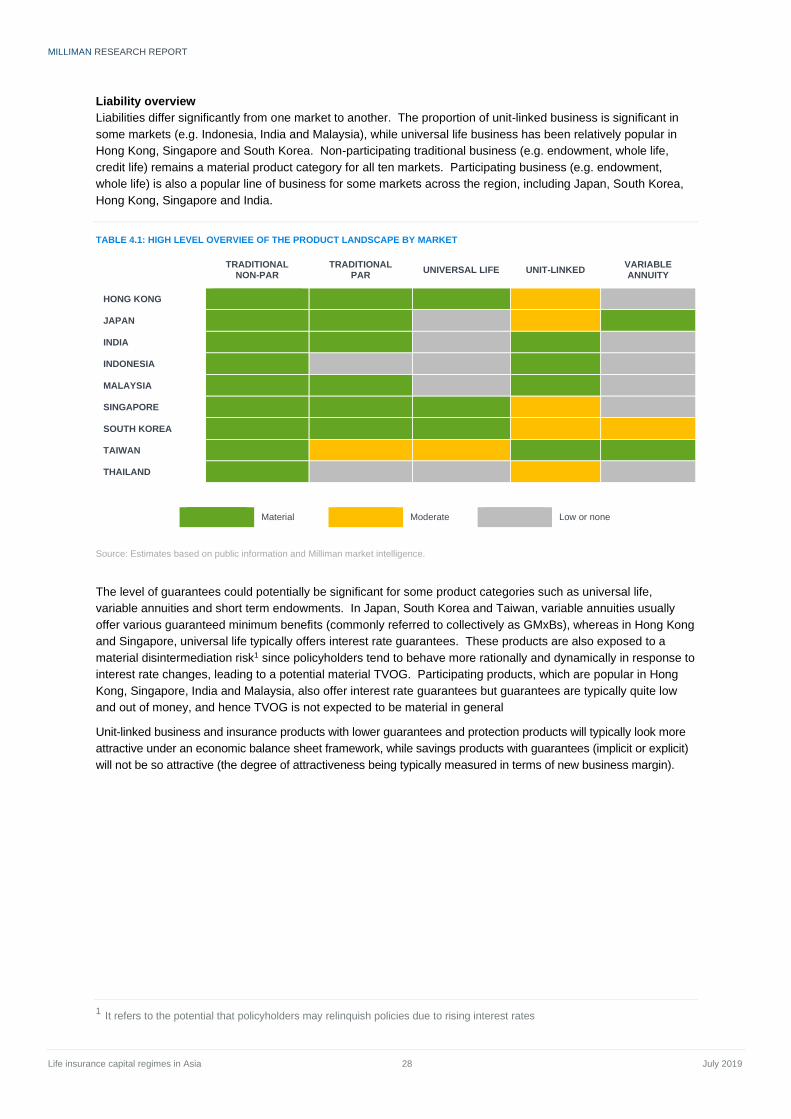
MILLIMAN RESEARCH REPORT
Life insurance capital regimes in Asia 28 July 2019
Liability overview
Liabilities differ significantly from one market to another. The proportion of unit-linked business is significant in
some markets (e.g. Indonesia, India and Malaysia), while universal life business has been relatively popular in
Hong Kong, Singapore and South Korea. Non-participating traditional business (e.g. endowment, whole life,
credit life) remains a material product category for all ten markets. Participating business (e.g. endowment,
whole life) is also a popular line of business for some markets across the region, including Japan, South Korea,
Hong Kong, Singapore and India.
TABLE 4.1: HIGH LEVEL OVERVIEE OF THE PRODUCT LANDSCAPE BY MARKET
TRADITIONAL NON-PAR
TRADITIONAL PAR
UNIVERSAL LIFE UNIT-LINKED VARIABLE ANNUITY
HONG KONG
JAPAN
INDIA
INDONESIA
MALAYSIA
SINGAPORE
SOUTH KOREA
TAIWAN
THAILAND
Material Moderate Low or none
Source: Estimates based on public information and Milliman market intelligence.
The level of guarantees could potentially be significant for some product categories such as universal life,
variable annuities and short term endowments. In Japan, South Korea and Taiwan, variable annuities usually
offer various guaranteed minimum benefits (commonly referred to collectively as GMxBs), whereas in Hong Kong
and Singapore, universal life typically offers interest rate guarantees. These products are also exposed to a
material disintermediation risk1 since policyholders tend to behave more rationally and dynamically in response to
interest rate changes, leading to a potential material TVOG. Participating products, which are popular in Hong
Kong, Singapore, India and Malaysia, also offer interest rate guarantees but guarantees are typically quite low
and out of money, and hence TVOG is not expected to be material in general
Unit-linked business and insurance products with lower guarantees and protection products will typically look more
attractive under an economic balance sheet framework, while savings products with guarantees (implicit or explicit)
will not be so attractive (the degree of attractiveness being typically measured in terms of new business margin).
1 It refers to the potential that policyholders may relinquish policies due to rising interest rates
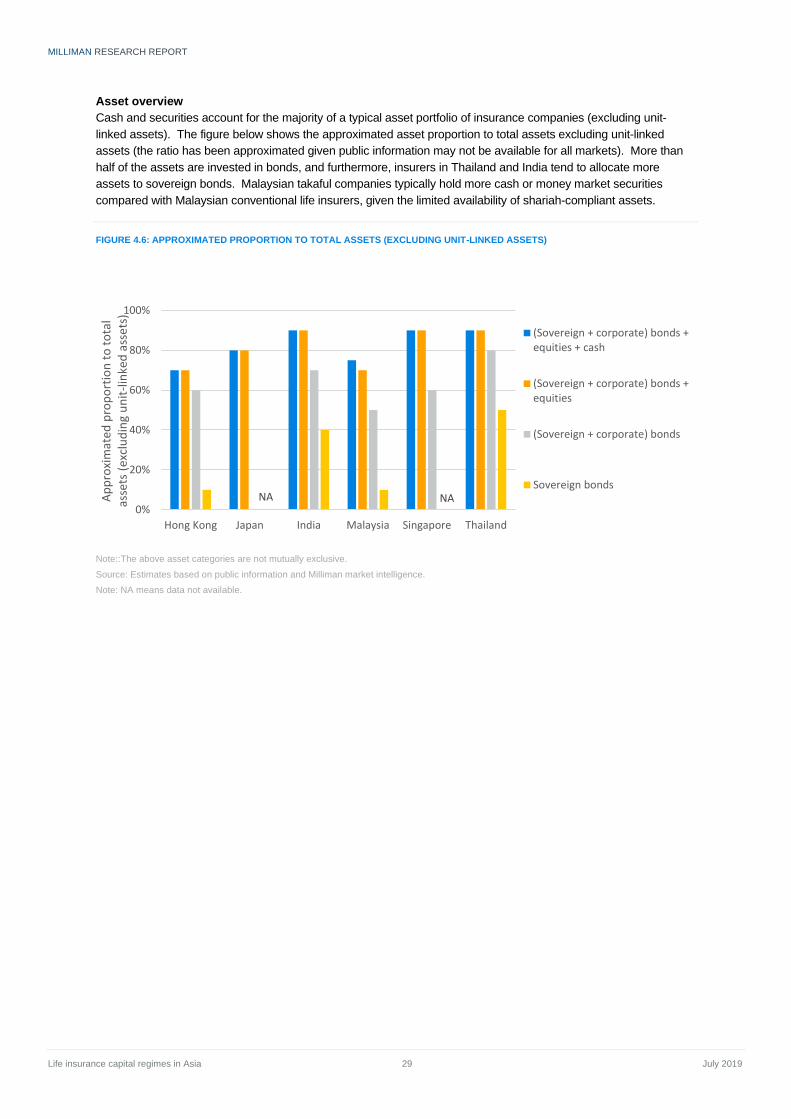
MILLIMAN RESEARCH REPORT
Life insurance capital regimes in Asia 29 July 2019
Asset overview
Cash and securities account for the majority of a typical asset portfolio of insurance companies (excluding unit-
linked assets). The figure below shows the approximated asset proportion to total assets excluding unit-linked
assets (the ratio has been approximated given public information may not be available for all markets). More than
half of the assets are invested in bonds, and furthermore, insurers in Thailand and India tend to allocate more
assets to sovereign bonds. Malaysian takaful companies typically hold more cash or money market securities
compared with Malaysian conventional life insurers, given the limited availability of shariah-compliant assets.
FIGURE 4.6: APPROXIMATED PROPORTION TO TOTAL ASSETS (EXCLUDING UNIT-LINKED ASSETS)
Note::The above asset categories are not mutually exclusive.
Source: Estimates based on public information and Milliman market intelligence.
Note: NA means data not available.
NA NA0%
20%
40%
60%
80%
100%
Hong Kong Japan India Malaysia Singapore Thailand
Ap
pro
xim
ated
pro
po
rtio
n t
o t
ota
l as
sets
(ex
clu
din
g u
nit
-lin
ked
ass
ets)
(Sovereign + corporate) bonds +equities + cash
(Sovereign + corporate) bonds +equities
(Sovereign + corporate) bonds
Sovereign bonds
MILLIMAN RESEARCH REPORT
Life insurance capital regimes in Asia 30 July 2019
Acronyms AFS : Available for Sale
ALM : Asset Liability Management
APNGB : Allowances for Provisions for Non-
Guaranteed Benefits
AT : Additional Tier
AV : Account Value
BE : Best Estimate
BEL : Best Estimate Liability
BMA : Bermuda Monetary Authority
BNM : Bank Negara Malaysia
BSCR : Bermuda Solvency Capital Requirements
CAR : Capital Adequacy Ratio
CBIRC : China Banking and Insurance Regulatory
Commission
CE : Current Estimate
CET : Common Equity Tier
CMP : Capital Management Plan
CoC : Cost of Capital
C-ROSS : China Risk Oriented Solvency System
CSV : Cash Surrender Value
CTE: Confidence Tail Expectation
DAC : Deferred Acquisition Costs
EIOPA : European Insurance and Occupational
Pensions Authority
ERM : Enterprise Risk Management
FSA : Financial Services Agency
FSC : Financial Supervisory Commission
FSR : Fund Solvency Ratio
FSS : Financial Supervisory Service
GMAB : Guaranteed Minimum Accumulation Benefit
GMDB : Guaranteed Minimum Death Benefit
GMxB: Guaranteed Minimum benefits (collectively
term)
GPV : Gross Premium Valuation
IA : Insurance Authority
IBPA : Indonesia Bond Pricing Agency
ICAAP : Internal Capital Adequacy Assessment
Policy
ICS : Insurance Capital Standard
IRDAI : Insurance Regulatory and Development
Authority of India
ITCL: Individual Target Capital Level
LICAT : Life Insurance Capital Adequacy Test
LLP : Last Liquidity Point
MAD : Margin for Adverse Deviation
MAS : Monetary Authority of Singapore
MGIR : Minimum-Guaranteed Interest Rate
MGS : Malaysian Government Securities
MOCE : Margin Over Current Estimate
MTM : Mark to Market
NAAR: Net amount at risk
NAIC : National Association of Insurance
Commissioners
NAV : Net Asset Value
NLP : Net Level Premium
NPV : Net Premium Valuation
OIC : Office of Insurance Commission
OJK : Otoritas Jasa Keuangan
ORSA : Own Risk and Solvency Assessment
OSFI : Office of the Superintendent of Financial
Institutions
PAD : Provision for Adverse Deviation
PCR : Prescribed Capital Requirement
PVFCF : Present Value of Future Cash Flows
QIS : Quantitative Impact Study
RBC : Risk-Based Capital
REITs : Real Estate Investment Trusts
RM: Risk Margin
SARMRA : Solvency - Aligned Risk Management
Requirement and Assessment
SST : Stress and scenario testing
TCR : Total Capital Requirement
TTM : Term To Maturity
TVOG : Time Value of Options and Guarantees
UFR : Ultimate Forward Rate
UPR : Unearned Premium Reserve
MILLIMAN RESEARCH REPORT
Milliman is among the world’s largest providers of actuarial and
related products and services. The firm has consulting practices in
life insurance and financial services, property & casualty insurance,
healthcare, and employee benefits. Founded in 1947, Milliman is an
independent firm with offices in major cities around the globe.
milliman.com
CONTACT
Clement Bonnet
Hong Kong & South East Asia
Brian Colgan
Indonesia
Farzana Ismail
Malaysia
Michael Daly
Hong Kong & South East Asia
Sharon Huang
China
Philip Jackson
India & South East Asia
Joseph Kim
South Korea
Atsushi Okawa
Japan
Wing Wong
Taiwan & China
Wen Yee Lee
Singapore & South East Asia
© 2019 Milliman, Inc. All Rights Reserved. The materials in this document represent the opinion of the authors and are not representative of the views of Milliman,
Inc. Milliman does not certify the information, nor does it guarantee the accuracy and completeness of such information. Use of such information is voluntary and
should not be relied upon unless an independent review of its accuracy and completeness has been performed. Materials may not be reproduced without the
express consent of Milliman.