M. Imad Damaj, Ph.D. Associate Professor Pharmacology and ...

DRUG ACTION & PHARMACODYNAMIC
M. Imad Damaj, Ph.D.Associate Professor
Pharmacology and ToxicologySmith 652B, 828-1676, [email protected]
Life History of A Drug

Non-SpecificMechanims
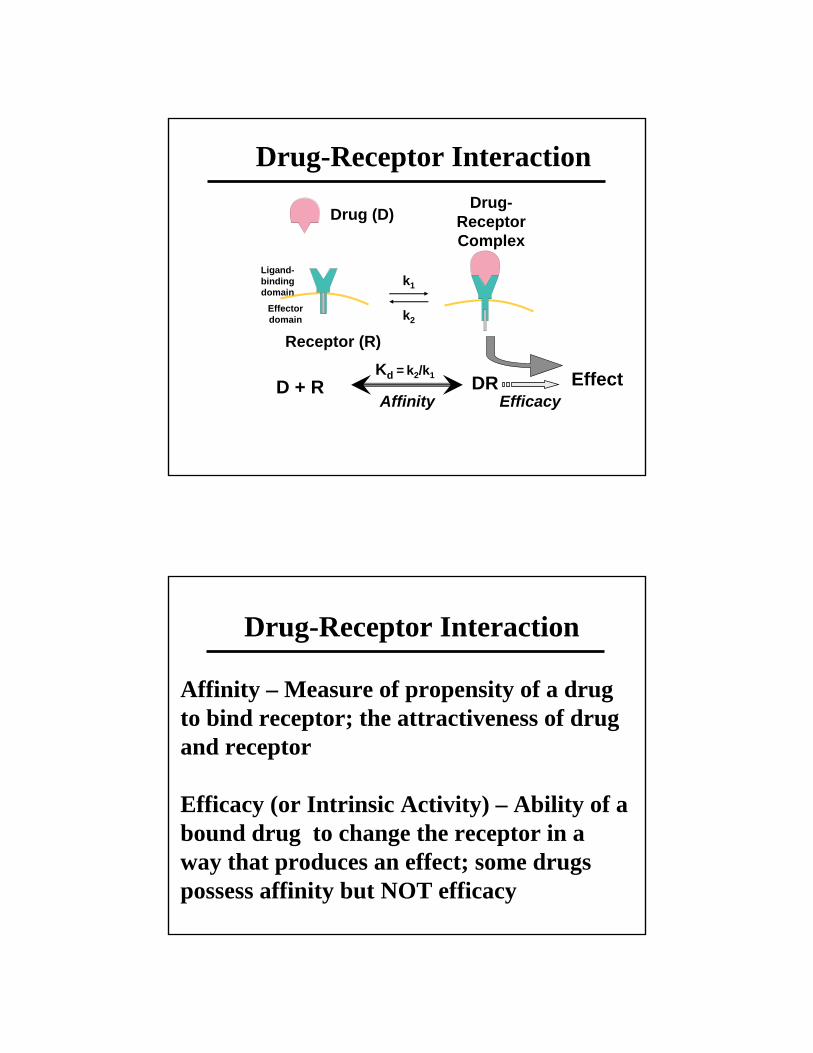
Drug-Receptor Interaction
Drug-Receptor Interaction
kk11
kk22
Drug (D)Drug (D)
Receptor (R)Receptor (R)
EffectEffect
DrugDrug--Receptor Receptor ComplexComplex
LigandLigand--binding binding domain domain
EffectorEffectordomaindomain
D + RD + RKKdd == kk22/k/k11
AffinityAffinityDRDR
EfficacyEfficacy
Drug-Receptor Interaction
Affinity – Measure of propensity of a drug to bind receptor; the attractiveness of drug and receptor
Efficacy (or Intrinsic Activity) – Ability of a bound drug to change the receptor in a way that produces an effect; some drugs possess affinity but NOT efficacy

Simple Occupancy Theory
RECEPTOR THEORY
MASS ACTION LAW
R + D DR effectk1k2
k3
25%
50%
75%
100%
Simple Occupancy Theory
Simple occupancy theorySimple occupancy theory: “ Intensity of response to a drug is proportional to the number of receptors occupied by that drug”
Maximal response occurs when all available receptors have been occupiedThis theory is not able to explain why one drug is more potent than another if they bind to the same receptor and both bind maximally to all receptors? (Example: Demerol vs Talwin)

Drug receptor interactions may involve Drug receptor interactions may involve many different types of chemical many different types of chemical bonds, some irreversible but usually bonds, some irreversible but usually weak nonweak non--covalent interactions that are covalent interactions that are reversible:reversible:
Covalent: almost irreversibleCovalent: almost irreversibleElectrostatic: Van Electrostatic: Van derder WaalsWaals and and
HydrogenHydrogenIonic: opposite chargesIonic: opposite charges
Drug-Receptor Bonds
Structure-Activity RelationshipAffinity & efficacy are determined by Affinity & efficacy are determined by
chemical structurechemical structure
Stringent RelationshipStringent Relationship

Drug-Receptor Interaction: Receptor Specificity
How can a drug interact with one receptor type and not others ?
Selectivity does not guarantee safety!
Structure-Activity RelationshipExploitation of SAR could lead to new Exploitation of SAR could lead to new
drug designdrug designStructural modification of Librium leads to the generation of other tranquilizers
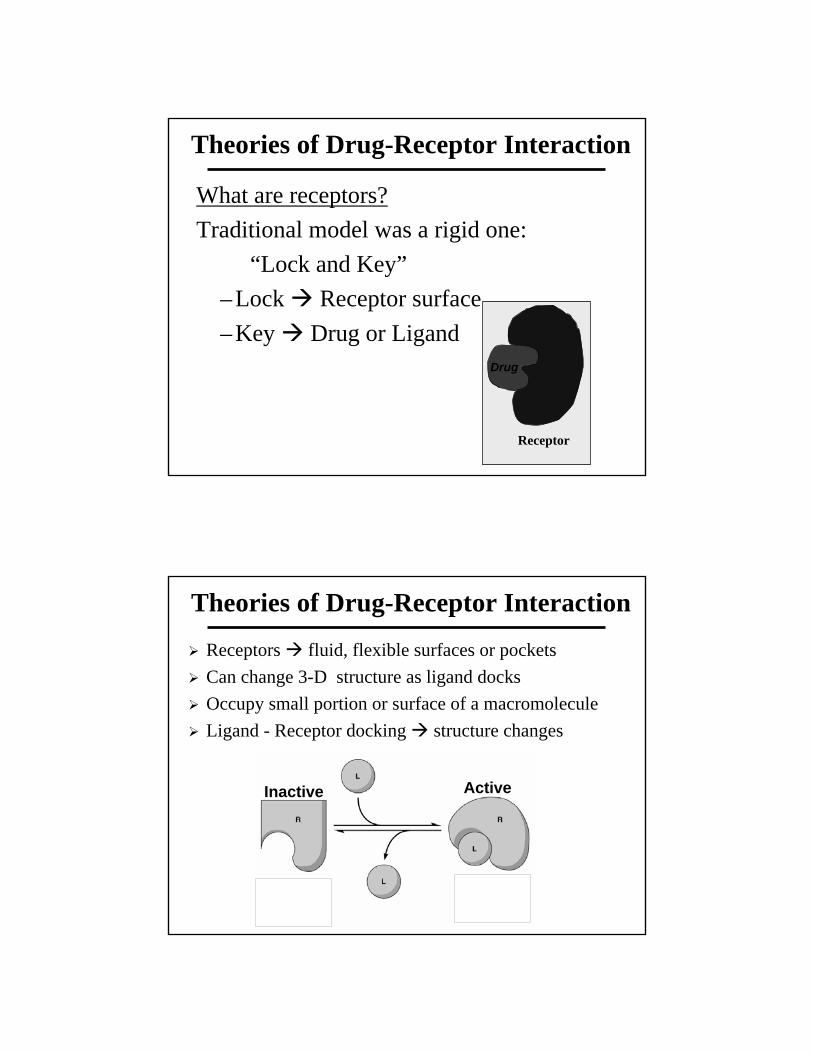
Theories of Drug-Receptor Interaction
What are receptors?Traditional model was a rigid one:
“Lock and Key”– Lock Receptor surface– Key Drug or Ligand
Receptor
Drug
Theories of Drug-Receptor Interaction
Receptors fluid, flexible surfaces or pocketsCan change 3-D structure as ligand docksOccupy small portion or surface of a macromoleculeLigand - Receptor docking structure changes
Inactive Active

Modified Occupancy TheoryModified Occupancy Theorya. Affinity bindinga. Affinity binding- strength of the attraction between drug and receptor. The > affinity the > potency: Drugs with low affinity require higher concentrations to bind to receptorb. Intrinsic activityIntrinsic activity- ability of a drug to activate its receptor. High intrinsic activity relates to high maximal efficacy
Theories of Drug-Receptor Interaction
Receptor Theory: Agonists & AntagonistsAgonist: Molecules that activate receptors - a drug with affinity and efficacyAntagonist: Molecules that prevent receptor activation by endogenous regulatory molecules and drugs - a drug that has affinity but not efficacy
Inactive Active
AgonistAntagonist

Agonist Antagonist
Receptor Receptor
ActivatedReceptor
InactiveReceptor
Drug (D)
Ri
DRi DRa
Ra
CONFORMATIONAL SELECTION
HOW TO EXPLAIN EFFICACY?
The relative affinityOf the drug to either conformation will determine the effect of the drug

SPARE RECEPTORS
The receptor theory assumes that all receptors should be occupied to produce a maximal response. In that case at half maximal effect EC50=Kd. Sometimes, full effect is seen at a fractional receptor occupation Spare receptors
Allow maximal response without total receptor occupancy – increase sensitivity of the system
The number of receptors may exceed the number of effector-molecules available
Receptor remains activated after agonist departs: more than one receptor is activated
Drugs & Signal Transduction Mechanisms
Receptor-effector coupling: Transduction process between receptor occupancy and
drug response

Main Receptor Classes

1. G protein-Coupled Receptors Structure:
Single polypeptide chain threaded back and forth resulting in 7 transmembraneα-helices
There’s a G protein attached to the cytoplasmicside of the membrane (functions as a switch).

2. Ion Channel Receptors
Structure:Protein pores in
the plasma membrane
3. Tyrosine-Kinase Receptors Structure:
Receptors exist as individual polypeptides
Each has an extracellular signal-binding site
An intracellular tail with a number of tyrosines and a single α-helix spanning the membrane

4. Intracellular Receptors
Nuclear proteins
Consist a DNA-binding domain attached to a ligand-binding and transcriptional control domains
Effects are produced as a result of increased protein sysnthesis - slow onset

Second Messengers & Signal Transduction
Second Messengers & Signal Transduction

DOSE-RESPONSE RELATIONSHIPS
To determine the quantitative relation
between drug concentration and
response
DOSE EFFECT RELATIONSHIP

Dose-Response Curve
Type of Dose-Response Curves
GradedGraded
QuantalQuantal
•• Measured in a single biologic unitMeasured in a single biologic unit
•• Continuous scale (Continuous scale (↑↑dose dose →→ ↑↑effect)effect)
•• Relates dose to intensity of effectRelates dose to intensity of effect
•• Population studiesPopulation studies
•• AllAll--oror--none pharmacologic effectnone pharmacologic effect
•• Relates dose to frequency of effectRelates dose to frequency of effect
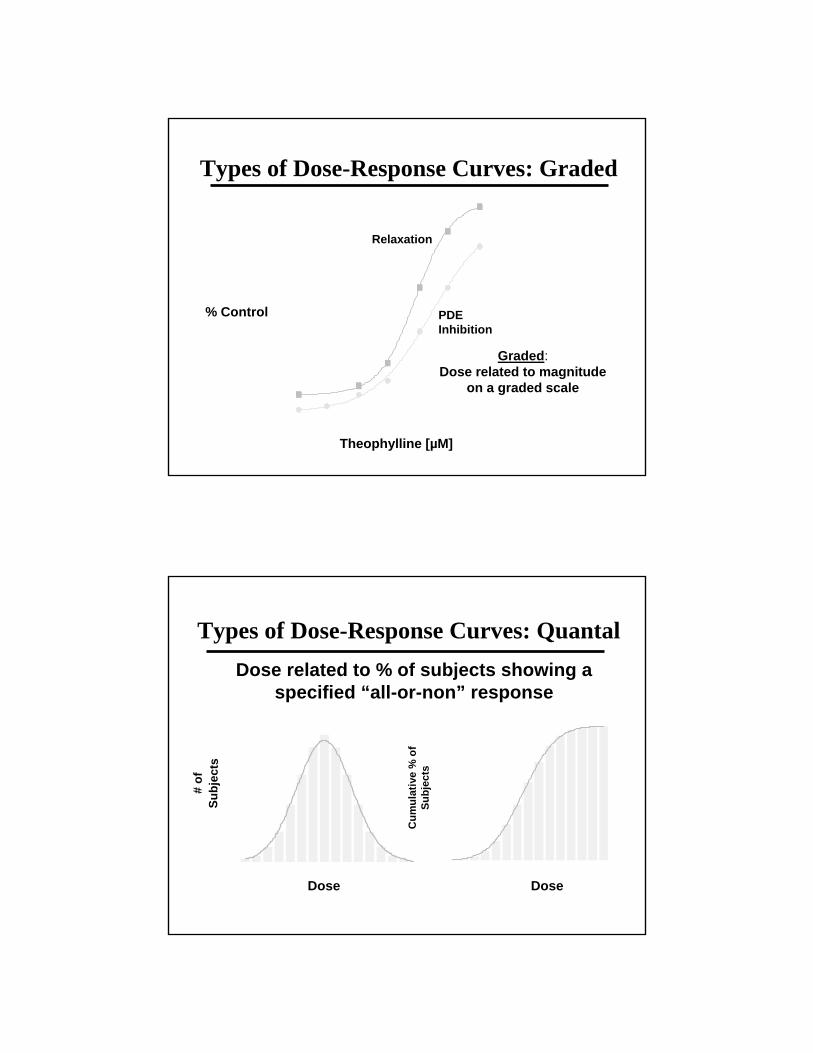
Types of Dose-Response Curves: Graded
Graded:Dose related to magnitude
on a graded scale
0
20
40
60
80
100
1 10 100 10000
20
40
60
80
100
1 10 100 1000
PDE PDE InhibitionInhibition
RelaxationRelaxation
% ControlControl
TheophyllineTheophylline [µM][µM]
Types of Dose-Response Curves: QuantalDose related to % of subjects showing a
specified “all-or-non” response
DoseDose
# of
# of
S ubj
ects
S ubj
ects
0
10
20
30
40
50
1 3 5 7 9 11 13 150
10
20
30
40
50
1 3 5 7 9 11 13 15
DoseDose
Cum
ulat
ive
% o
f C
umul
ativ
e %
of
Subj
ects
Subj
ects
0
20
40
60
80
100
1 3 5 7 9 11 13 150
20
40
60
80
100
1 3 5 7 9 11 13 15

Characteristics of A Dose-Response Curve
Variability
POTENCY• Amount of a drug needed to produce a given effect• Determined mainly by the affinity of the receptor for the drug• Potency affects drug dosage• Relatively unimportant in clinical use of drugs• Are more potent drugs superior therapeutic agents?• Expressed as EC50 (µM) or ED50 (mg/kg)
• Graded= 50% of the maximal effect• Quantal = 50% population studied (LD50, TD50)

Potency: Graded Responses
ED50 or EC50 = Dose needed to produce 50% of the maximal effect.
% of% ofMaximalMaximal
EffectEffect
[Drug][Drug]
ECEC5050
Potency: Quantal Responses
0
20
40
60
80
100
100 10000
20
40
60
80
100
100 1000
% % Achieving Achieving Complete Complete AnalgesiaAnalgesia
Total Total LidocaineLidocaine Dose (mg)Dose (mg)FerranteFerrante et al. et al. AnesthAnesth AnalgAnalg 82:9182:91--7, 19967, 1996
EDED5050 = 400 mg= 400 mg
EDED9090 = 490 mg= 490 mg

Potency: Quantal Responses
EFFICACY
• The maximal effect that can be produced by a drug
• Determined mainly by the properties of the drug and its receptor-effector system
• Important clinical measure
• Partial agonist have lower maximal efficacy than full agonists

Dose-Response Curves and Efficacy
Dose-Response Curves Showing Efficacy & Potency

SLOPE
The shape of the curve describe drug binding to receptors
Indicator of useful dosage range (steepness of the curve)
The slope have more theoretical than practical use
Slopes of Dose-Response Curves
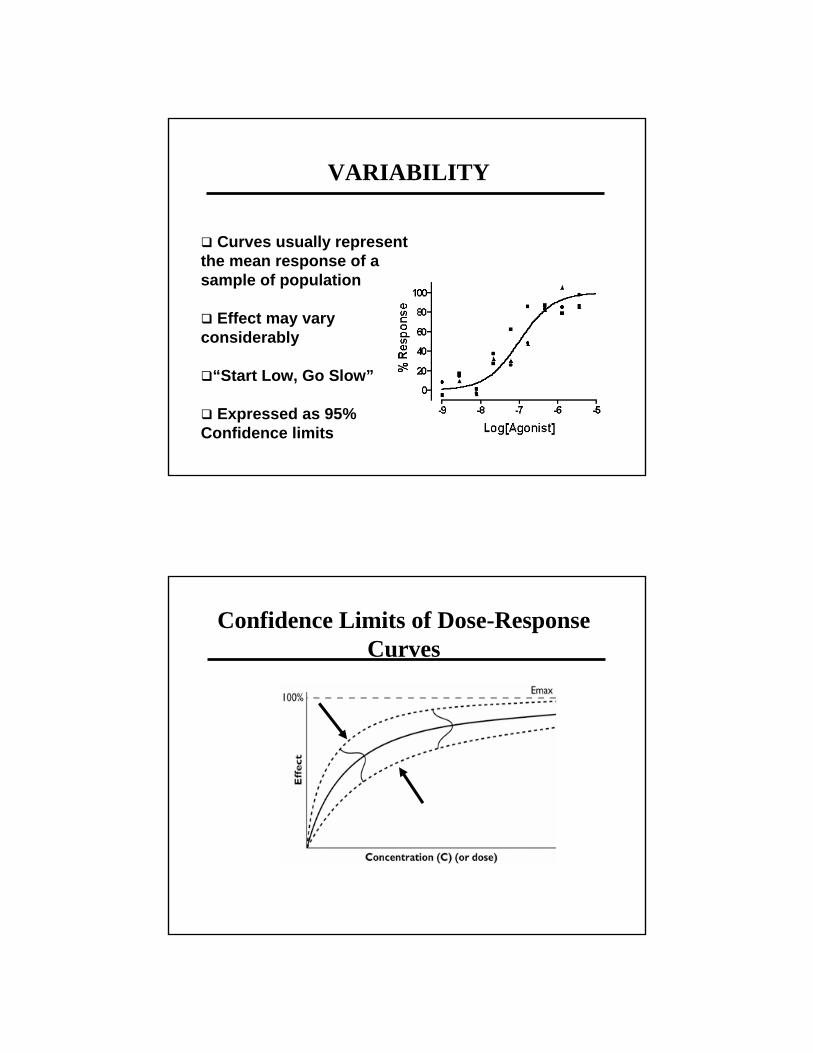
VARIABILITY
Curves usually represent the mean response of a sample of population
Effect may vary considerably
“Start Low, Go Slow”
Expressed as 95% Confidence limits
Confidence Limits of Dose-Response Curves
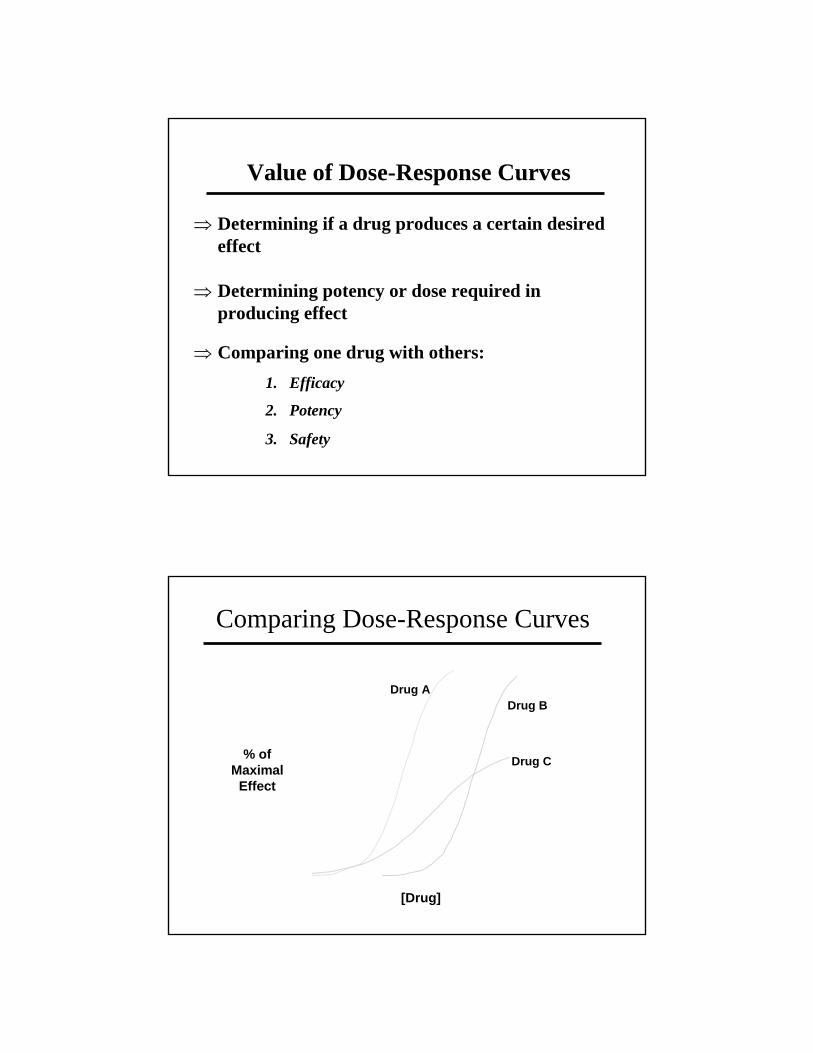
Value of Dose-Response Curves
⇒ Determining if a drug produces a certain desired effect
⇒ Determining potency or dose required in producing effect
⇒ Comparing one drug with others:1. Efficacy
2. Potency
3. Safety
Comparing Dose-Response Curves
0
20
40
60
80
100
1 10 100 10000
20
40
60
80
100
1 10 100 1000
% of % of Maximal Maximal
EffectEffect
[Drug][Drug]
Drug ADrug A
Drug CDrug C
Drug BDrug B

Relative Safety of A Drug
Dose-response curves help estimating the safety of a drug
Therapeutic Index: TI= LD50/ED50 * LD50= the median lethal dose of a drug in animals* Statement on selectivity of desired effects vs toxic
More general concept: The Median Toxic Dose (TD50)
* No drug produce a single effect: example of Codeine* Severity of the disease* Concentration vs dose
Therapeutic Index

Examples of TI
Substance safety margin
Alcohol 1:4 - 1:10
Aspirin 1:50
Caffeine 1:100
Marijuana 1:400-1:1800
Certain Safety FactorProblems with TI: o Comparison of the mid-points of DRCo Overlap of DRC
Determination of Certain Safety Factor:o Compare the extremes of the DRCo Important concept: used to determine a Therapeutic
Windowo 99% and 1% are not absolutes
Certain Safety Factor = LD1ED99

0
20
40
60
80
100
70 80 90100 200 3000
20
40
60
80
100
70 80 90100 200 300
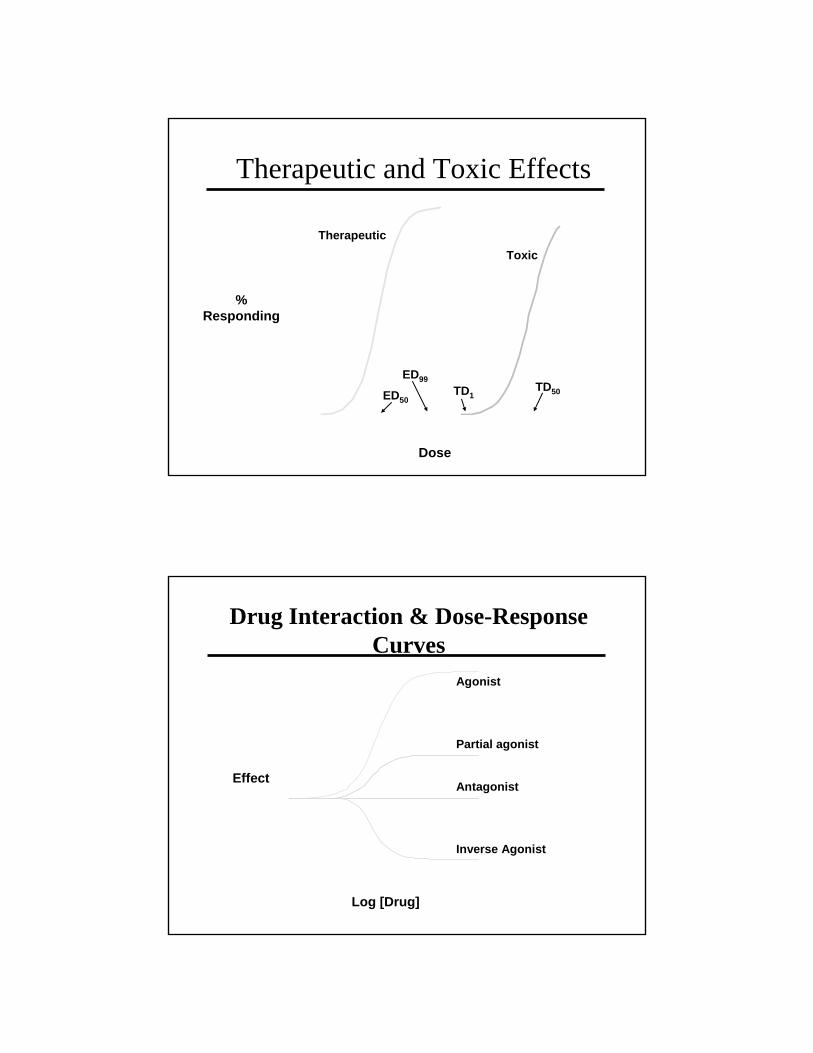
Therapeutic and Toxic Effects
DoseDose
% % RespondingResponding
TherapeuticTherapeuticToxicToxic
EDED9999TDTD11EDED5050
TDTD5050
Drug Interaction & Dose-Response Curves
EffectEffect
Log [Drug]Log [Drug]
AgonistAgonist
Partial agonistPartial agonist
AntagonistAntagonist
Inverse AgonistInverse Agonist

Receptors, Agonists & AntagonistsA) Competitive Antagonists
Receptors, Agonists & Antagonists
A) Non-Competitive Antagonists

Antagonist Effects on Dose-Response Curves
A) Competitive Antagonists
Acetylcholine (µg/ml)
Antagonist Effects on Dose-Response Curves
A) Competitive Antagonists
Antagonist Effects on Dose-Response Curves
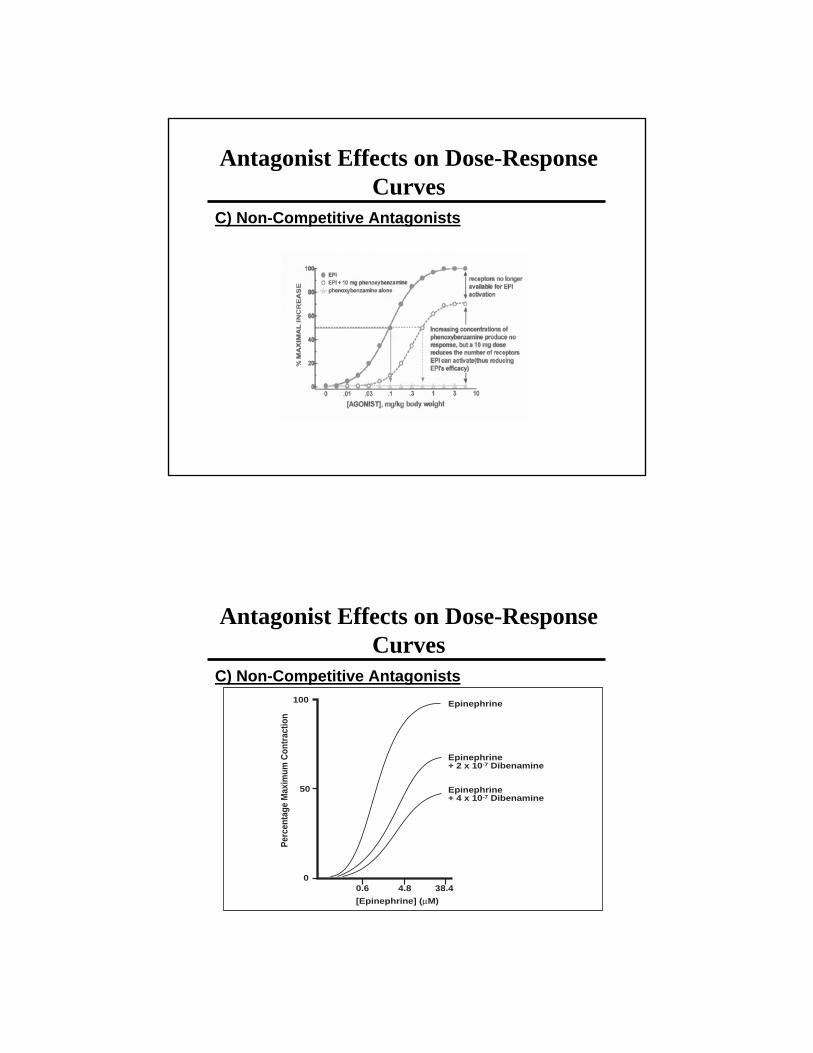
C) Non-Competitive Antagonists
Antagonist Effects on Dose-Response Curves
C) Non-Competitive Antagonists100
50
00.6 4.8 38.4
[Epinephrine] (µM)
Perc
enta
ge M
axim
um C
ontr
actio
n
Epinephrine
Epinephrine+ 2 x 10⁻⁷ Dibenamine
Epinephrine+ 4 x 10⁻⁷ Dibenamine
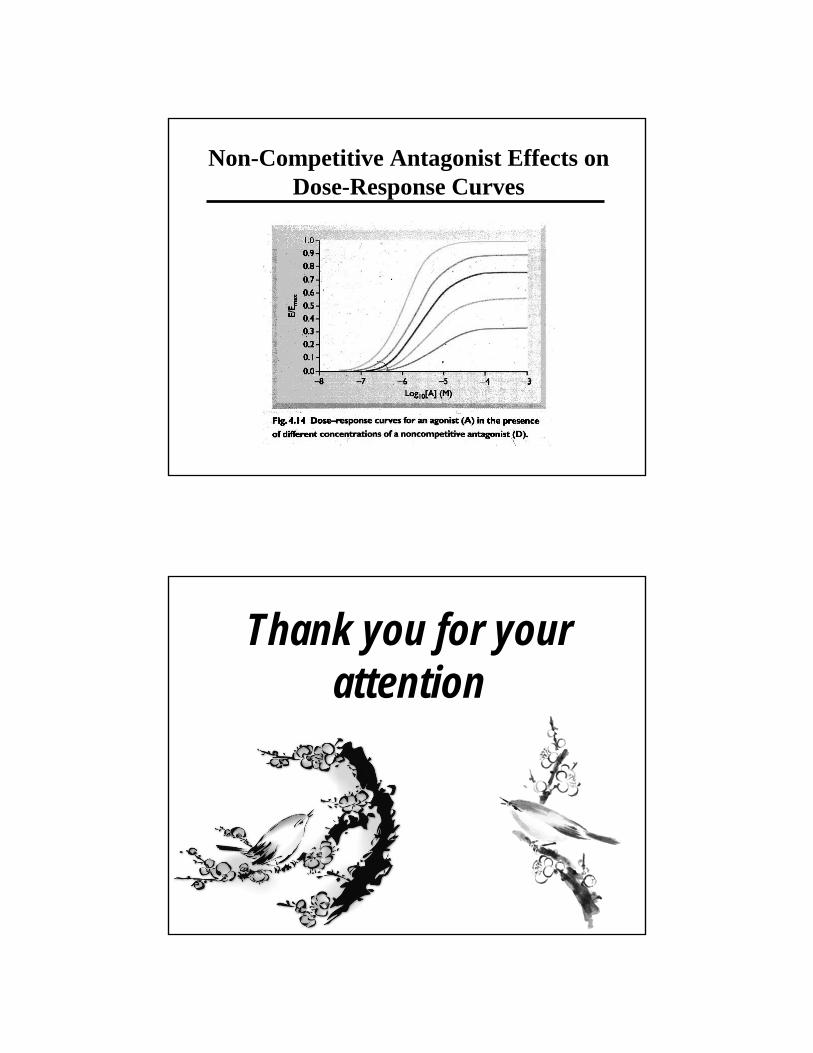
Non-Competitive Antagonist Effects on Dose-Response Curves
Thank you for your attention